Embed Size (px)
Citation preview

1
Developing Invariant, Construct-valid Measurement Scales in Spoken English as a Second Language
Paper presented at AERA April 2000
Diane Strong-Krause
Brigham Young University
Introduction
Design Experiments Require Construct Valid, Invariant Measurement
Design experiments are best accomplished when all members of a research team,
whether instructional scientists, measurement scientists, or teachers have a clear
theoretical understanding of the domain of learning expertise. Such an understanding
may be called a domain theory. A domain theory includes an understanding of the
dimensions of learning or growth that run through the domain. A domain theory also
provides an account, for each of those unidimensional scales, of how the constructs of
growing expertise are ordered along each scale and why higher constructs along the scale
are more difficult than lower ones.
This paper is an instance of the construction of such a domain theory: a set of
construct valid, invariant measurement scales that have the four properties discussed by
Bunderson (2000) in the previous paper. These properties are: (1) interpretive invariance
through the link of each construct along each scale to testlets having construct validity for
their associated construct, (2) invariance to the sample of people in a given cycle of the
design experiment, (3) invariance to the particular subset of tasks each person takes, and
(4) equal intervals along the scale. Item response theory has long claimed invariance to
the set of persons in the sample and to the subset of tasks used to estimate a person’s
score. Proponents of the Rasch model have also claimed that, when the trace lines are

2
parallel because all use the same average ‘a’ parameter, then the units along the scale are
equal interval units (Wright, 1999, Perline, Wright and Wainer, 1979).
In this paper a domain theory with construct-valid testlets and invariant scales is
sought through a design experiment approach. This domain theory embodies a
unidimensional scale through the domain of English speaking expertise, obtained using
the Rasch model on both theoretical and real data. Previous research in language
learning has found that reading, writing, speaking, and listening are learning processes
best measured on separate scales. This domain theory is a work in progress, because
results from only the first two cycles are available. These two include the baseline cycle,
which uses theory to generate a preliminary scaling, and the second cycle, which is the
first data collection cycle using the testlets constructed for each construct along the scale.
This design experiment will continue over subsequent semesters in the classes for foreign
speakers learing English at Brigham Young University. There is a four semester
sequence of classes; English 101, 102, 201, and 202. Data will be collected from all of
these classes. Although there are at least four unidimensional scales in this domain, (for
reading, writing, speaking, and listening), the scale for English speaking was selected for
this stage of a long-term design experiment.
The Problem of Measuring Language Competence
During the last decades of the twentieth century, a call for tests useful to teaching
and learning has been issued. Teachers and administrators tire of scores that don’t really
mean anything in terms of specific feedback to the program. This is true in the field of
language testing. Shohamy (1992) suggests; “the real power [of language tests]… is their
ability to provide meaningful and important information that can be incorporated into the
learning system” (p. 10). She goes on to say that useful information can provide

3
evidence of student progress, teacher performance, curriculum usefulness, and method
and material effectiveness. In order for language tests to be informative, they need to be
sensitive enough to measure progress within a course, not merely to be a summative
score or label. Measuring progress implies at least three things:
1) It implies at least two measurements—the student’s ability level at the beginning and
the student’s ability level at a later point in time.
2) This, in turn, implies an ordered scale among the tasks students perform. That is, a
score is not simply reported, but rather a measure is indicated along this invariant
scale.
3) In order to provide meaningful feedback, it is not enough to say a student was here
and now she is here. Useful feedback includes information about the language skills,
or combination of skills, needed in order to successfully perform tasks at each level
along the ordered scale.
In other words, a theory-anchored, construct valid scale is needed in order to provide
useful information about examinees at different levels of language expertise. Obtaining
evidence that scores along a scale reflect constructs in a theory of growth is construct
validity.
The purpose of this paper is to explore the initial steps in developing an invariant
scale of ordered tasks so that ultimately language performance can be compared over
time. The cyclical nature of a design experiment approach strengthens research of this
type. Once an initial scale is developed, data from subsequent examinees and test tasks
can be used, through a series of iterations, to refine the scale. This scale, in turn, will
form the foundation of what Bunderson(2000) and Bunderson and Newby (2000) have
termed a domain theory.
4
According to Bunderson (2000) in the first paper in this symposium, a domain theory
is defined as
an ordered set of constructs describing the constructs, whether cognitive,
linguistic, conitive, affective, or other aspects of evolving expertise in the domain.
These range from the level of person alpha on task alpha (the easiest task that the
least minimally qualified person can pass), to person omega and task omega (a
task whose difficulty is just beyond what we will expect in the most advanced class
in the domain)… A domain theory begins with a qualitative model describing
persons and tasks in a defined domain. This, in turn, evolves to a qualitative map
of the domain with rough order relations. A qualitative model of the domain can
lead to the development of testlets for each construct along each unidimensional
scale, and these order relations can be converted to measures by the methods of
additive conjoint measurement. (p. 8).
In language testing, such aqualitative model is termed by Bachman and Palmer
(1996) as the “target language use” (TLU) domain. They define it as “a set of specific
language use tasks that the test taker is likely to encounter outside the test itself, and to
which we want our inferences about language to generalize” (p. 44). They go on to say
“that it is neither feasible nor necessary, for the purpose of developing language test tasks
and tests, to provide an exhaustive discourse of language use” but rather to describe
“those features that are critical to the kinds of inferences we want to make and the
specific domains to which we want these inferences to generalize” (p. 46). Therefore, two
important facets need to be described for these domains: first, the critical language
abilities needed, and second, the range of tasks in the domain.
5
The American Council on the Teaching of Foreign Languages (ACTFL) has
developed a domain model describing four hierarchically-ordered levels of language
expertise: novice, intermediate, advanced and superior. Detailed, qualitative descriptions
of tasks and person language abilities are provided at each level of expertise. For
example, the ACTFL speaking guidelines indicate that speakers at the Intermediate level
“produce relatively short, discrete sentences, ask simple questions, and handle
straightforward survival situations” (American Council on the Teaching of Foreign
Languages, 1999, p. 15).
This domain model is used as the basis for creating tests of language proficiency,
specifically the Oral Proficiency Interview (OPI). Test development using this approach,
which Bachman (1990) terms the “real-life” approach, is widely used because it is very
practical and “provides a relatively easy way to develop tests that ‘look good’ and may
have some predictive validity” (Bachman, 1990, p. 330). However, there are two main
criticisms. The first problem deals with evaluating validity. The claim of validity in this
approach is one of content validity. However, Messick (1989) cautions:
In a fundamental sense so-called content validity does not count as validity at all,
although . . . considerations of content relevance and representativeness clearly
do and should influence the nature of score inferences supported by other
evidence…. Some test specialists contend that what a test is measuring is
operationally defined by specifying the universe of item content and the item-
selection process. But . . . determining what a test is measuring always requires
recourse to other forms of evidence. (p. 17)
Messick (1998) goes on to say that content-related evidence for validity is not enough:
6
“Validity is a unitary concept, which means that fundamentally there is only one kind of
validity, namely, construct validity” (p. 1).
A proponent of the ACTFL scale might answer that content validity is not the
only claim. The heirarchical, nested nature of the ACTFL domain model is also an
hypothesis that the intermediate level encompasses the novice, the advanced the
intermediate, and so on. This is an hypothesis of a Guttman scale (Guttman, 1945),
which has highly desirable interpretive properties. If you can perform a task at the
intermediate level, you can probably perform a task below it on the ordered scale.
Another criticism of the ACTFL scales is aimed at the inability to look at
language abilities separately from tasks. That is, the construct of language competence
cannot be defined as a separate facet. Skehan (1998) indicates this real-life approach has
“little underlying theory as to how a structure of abilities might link to different patterns
of language use, and how such underlying abilities might relate to different contexts and
performance conditions” (156-157). NcNamara (1995) concurs and argues “that a model
of underlying capacities in performance … is necessary, if we are to advance our thinking
about performance assessment” (p. 6).
Bachman (1990) proposes an alternative: a unified model of language
performance which distinguishes language abilities from other facets. This model posits
that four categories influence test performance—communicative language ability, test
method facets, personal attributes or test taker characteristics, and random measurement
error. Bachman proposes two principal components of communicative language
competence, organizational competence and pragmatic competence (see Figure 1).
McNamara (1995) suggests that “a model such as Bachman’s helps us to articulate the
‘theoretical rationale’ for such inferences: it permits the necessary clarity, specificity and

7
explicitness in stating the grounds for inferences about candidates’ abilities made on the
basis of test performance, thereby also facilitating the empirical investigation of such
claims” (p. 19).
Developing a Domain Theory
It comes as no surprise that these two means of getting at language performance
are at odds. Certainly both approaches have their own merits, and before we discard one
or the other, perhaps it would be wise to consider how a combination of the two may lead
to more useful tests. The ACTFL Speaking Guidelines (1999) provide hierarchically-
ordered, qualitative descriptions of language expertise based on years of real world
experience. On the other hand, Bachman (1990) offers an in-depth theory of
communicative competence. What we need is an invariant scale of hierachically-ordered
tasks that can be linked to a theory of language competence. Indeed, Bachman (1990)
proposes a possible integration of the two where the test task design “would involve the
analysis of the test tasks developed through the real-life approach” (p. 357) and the use of
the framework of language abilities. This, in turn, would be followed by construct
validation research and would lead to the ability to make predictions about how language
abilities affect test performance. This strategy allows us to begin to move from a domain
model to a domain theory.
Invariant Scales
At the core of a domain theory is the development of invariant interval scales.
However, most performance assessments terminate in a rating or a score. Scores are
ordinal scales and are sample dependent, task dependent, and rater dependent. The
performance on the task depends on the ability of the examinee (a task may be easy for

8
an advanced student while the same task may be difficult for a low proficiency student),
and the score may also vary depending on the severity of the rater.
Interval measures, as opposed to ordinal scores, offer the type of invariance
needed—the unit is the same whether found at the low, middle of high range of a scale.
The development of invariant scales requires conjoint estimation of scale positions for
both task difficulty and person proficiency. The measure associated with each task should
be independent of the ability level of the student, and the measure of examinee
proficiency should not depend on the particular tasks performed or the judge or judges
used.
However, an interaction between task and examinee always exists. How difficult
a task is depends on the abilities of the examinee. Difficulty, then, is not a property of a
task; rather it is the interaction between the task and the ability of the examinee. What is
needed is a measure that provides a way to determine the probability of success on a
particular task given the ability level of the examinee.
The multifaceted Rasch measurement (Linacre, 1989) does just this. The approach
is an extension of the Rasch model, a probabilistic model where two facets—examinees
and items are modeled. The multifaceted model extends to more than two facets. A
three-facet model may include raters along with items and examinees. Using the program
FACETS (Linacre & Wright, 1992) a measure is produced for both tasks and examinees
taking into account the severity of the rater or raters. Because these measures are on the
same scale, they can be used together to predict the probability of a success on a
particular task given the ability measure of the examinee. Therefore, we are able to begin
the development of an invariant scale, which, over time, can be added to and refined.

9
Methodology
This study used speaking data collected from ESL students studying at an intensive
English program. One hundred and sixty-nine students representing a variety of language
backgrounds including Spanish, Portuguese, Korean, and Japanese responded to speaking
tasks. Students were included from xx different classes representing four different
semesters of progress, English 101, 102, 201, and 202.
Instrument
A computer-delivered speaking test was developed by the BYU Humanities
Research Center. The most significant aspect of the development process used was the
use of the ACTFL Speaking Guidelines (American Council on the Teaching of Foreign
Languages, 1999). as a means to generate hypotheses about the ordering of task difficulty
along the speaking scale. Ten groups of task types were developed, and in the process,
further principled design guidance was sought through study of models of communicative
competence, with an emphasis on Bachman’s (1990) model. The goal was to meet
criticisms of ACTFL by linking it to theory, and also to a stable measurement scale. The
result was 40 tasks and associated scoring rubrics, carefully designed and linked by
theory to different hypothesized constructs of growth ordered along the speaking scale.
Ten levels were more than the current ACTFL guidelines discriminates, but experience
and theory indicated that finer gradations might be useful. Four testlets (prompts to
inititiate speaking, and scoring rubrics) were developed for each of the ten ordered
construct levels. This instrument of 40 speaking prompts was used to collect student
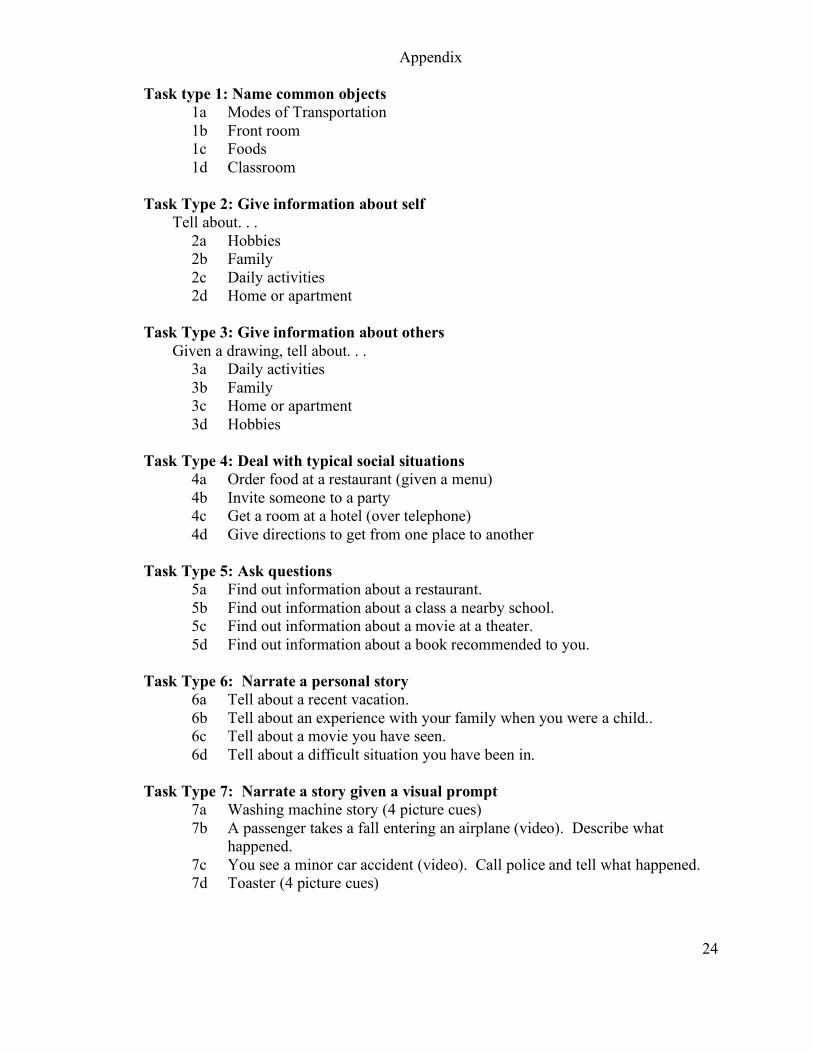
response data. The ten general task types include: naming common objects, giving
personal information, giving information about others, dealing with typical social
situations, asking questions, narrating a personal story, narrating a story given a visual

10
prompt, dealing with a complication in a social setting, telling about the future, and
supporting an opinion (see Appendix for a complete listing of the task types and four
versions within each one).
Data Collection
Following a brief introduction to the exam including written instructions in the
students' first language, students take the computer-delivered speaking exam. The first
three tasks are practice items, which are not rated. Students were randomly assigned to
one of three groups. Each group responded to a total of twenty tasks, two from each task
type. Ten of these tasks were common among the three groups. The other ten tasks were
unique to each group. Therefore, a linking design was used where students were
randomly assigned to one of three groups and the groups were linked by the common set
of ten tasks.
Responses were rated by eighteen judges with experience teaching a second or
foreign language. All judges were trained using the rubric. All responses were at least
double-rated with more than half rated by up to five judges. Responses to each task were
scored holistically using a rubric consisting of a ratings of 20, 40, 60, and 80 (see Table
1). Judges made two decisions in their rating. First, using guidelines provided in the
training material, the judge decided whether or not the task was completed. If the task
was clearly not completed, the judge gave a rating of 20. If a partial response
demonstrated developing, but not sufficient, language abilities to complete the task, the
judge gave a rating of 40. If the judge decided the task was indeed completed, the quality
of the response was rated. If distracting errors were present, the judge gave a rating of
60; otherwise, the judge gave a rating of 80.

11
Data Analysis
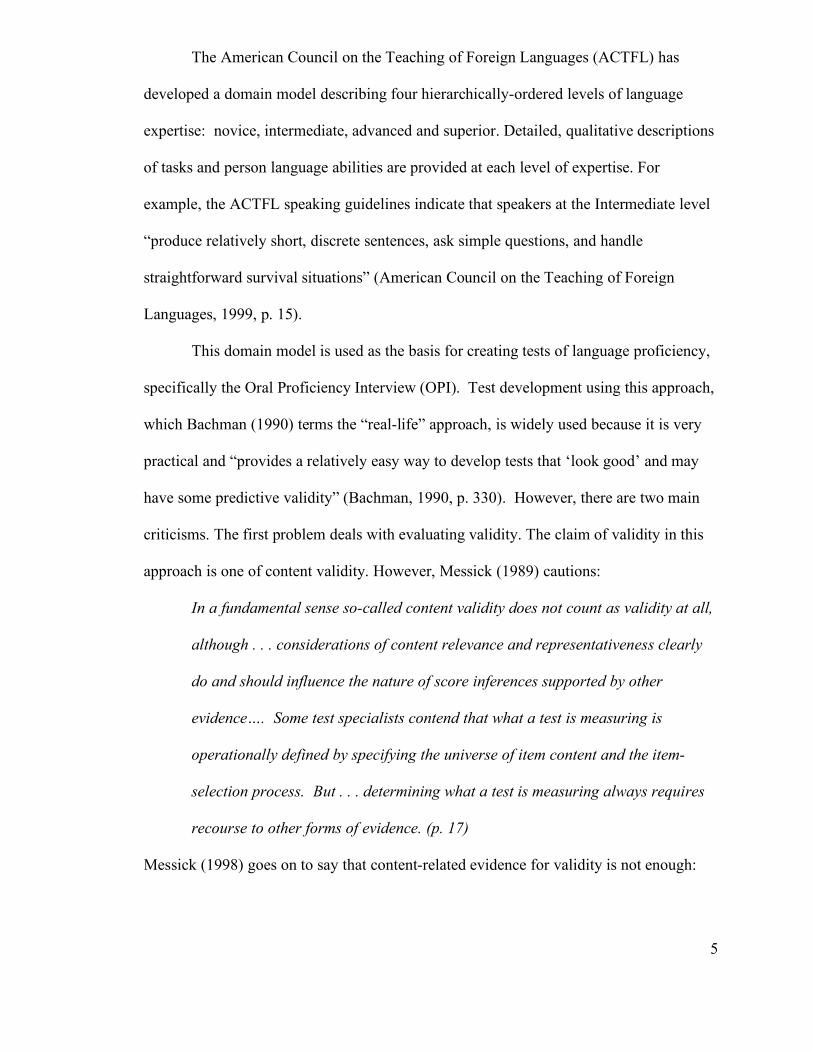
The first step in data analysis was to determine if a theoretical distribution of tasks
could be predicted. Although the ACTFL guidelines (1999) indicate that they are “not
based on a particular linguistic theory or pedagogical method” (p. i), “four major levels
are delineated according to a hierarchy of global tasks. This hierarchy is summarized in a
rating scale spanning a wide range of performance profiles” (p. 8) from Novice to
Superior. Therefore, a certified ACTFL oral interviewer was able to predict what rating
(20, 40, 60, 80) on each of the forty tasks would be received by a prototypical examinee
at each proficiency level ranging from Novice-Mid to Superior. A distribution of 100
prototypical examinees was then created based on an estimation of a typical distribution
of students attending the intensive English program (see Table 2). From this information,
a 100 x 40 matrix was created using the predicted ratings on each task for each
proficiency level. These predicted ratings were then analyzed using the FACETS
program to obtain theoretical predictions of difficulty values for each task. A theoretical
distribution of tasks along an invariant scale was now available for comparison to the
actual data distributions (see Figure 2).
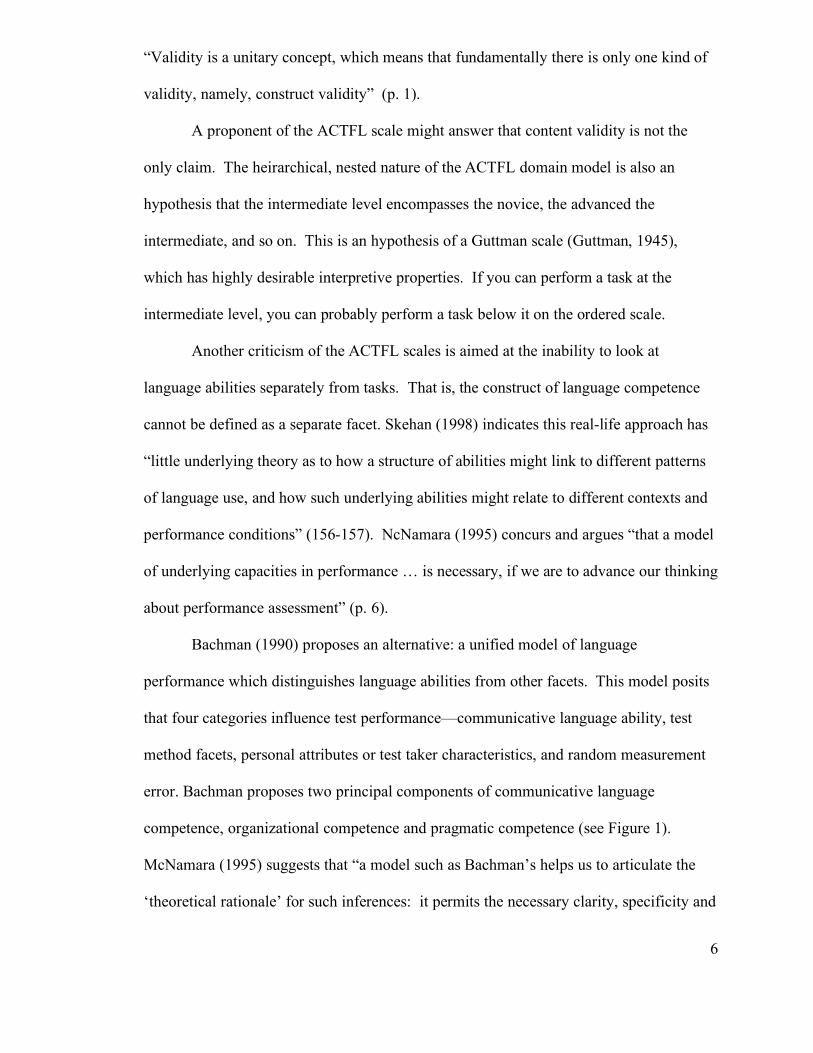
The data collected from students from the intensive English program was then
analyzed, again using the FACETS program. After an analysis of fit statistics, two
students, three raters, and one task were dropped and the data re-analyzed.1 The
difficulty orderingof tasks from this analysis is shown in Table3. Correlation analysis
1 The three raters that were dropped had high outfit statistics, which means they were overusing extreme ratings (not the middle ratings). In addition, these raters were the most lenient of the eighteen judges. Therefore, the analysis suggests that they were giving a large number of ratings of 80. The one task that was dropped was the “Classroom” task where examinees simply named objects in a picture of a classroom. A high outfit statistic suggests that this item was measuring a different ability from the other tasks. The other three “Naming Objects” tasks also tended to have high outfit statistics, which suggests that possibly this task type is on a different dimension from the others.

12
between the real data values and the values obtained with the theoretical ratings was
carried out.
Results and Discussion
Table 3 shows the results of the theoretical and real scaling of tasks. The
correlation between the real data task measures and the theoretical data task measures
produced a .78 correlation coefficient. A comparison between the order based on the
theoretical data and the order based on the actual data is found in Figure 2. In general,
the order of task values was similar, but the values from the real data showed a more
defined distribution. Based on these results, four areas of interest deserve further
comment.
First, the task type “Naming Objects” appears to be quite distinct from the other
tasks. All of these tasks are grouped at the very low end of the scale. These tasks seem
to be measuring some other aspect of the construct of speaking meaningful utterances,
perhaps a knowledge of basic vocabulary. Outfit statistics suggest the same, since these
tasks misfit the scale badly. One task was eliminated and the remaining three had the
highest fit statistics of all the tasks. Missfit of this type is a warning that these tasks may
not be on the same unidimensional scale with the other speaking tasks. Perhaps
meaningful speech is on one scale, and work knowledge demonstrated without the need
for constructing meaningful sentences is on another.
Second, while the ACTFL Guidelines do not distinguish between giving personal
information about self versus giving similar information about others, the results indicate
that these task types tend to be at different places on the scale. Giving personal
information about self seems to be an easier task than giving similar information about
others. The same is true with narrations. No distinction is made within the ACTFL

13
Guidelines, but narrating a personal story is lower on the scale than narrating a story
given some type of visual prompt.
Third, an examination of the data shows that the “Ask Questions” tasks had the
widest variability in values, ranging from 6.5 to 9.7 (on a 10 point scale). These tasks
seemed to cover almost the full range except for the very lowest “naming” tasks. It is not
clear that this cluster forms a unified growth construct, and may need to be replaced with
one that does.
Finally, the tasks requiring examinees to support an opinion, the most difficult
tasks on the theoretical scale, seemed to flip-flop between the future-oriented and
situation-with-a-complication tasks. Upon further investigation of the tasks, the set of
opinion tasks with this test may be described more accurately as giving an opinion than
supporting one. Examinees were limited in the amount of available response time. To
truly support an opinion may require much more time than allotted in this exam.
Conclusions
The design of this study makes it possible to continue to develop a construct-
valid, invariant scale of learning and growth in the domain of speaking competence for
non-English speakers. The 10 groups of four testlets each were developed by reference
both to the ACTFL model and to substantive process constructs in emerging theories of
communicative competence. Order relationships were also hypothesized as part of the
testlet-development process. By developing the testlets in this manner, and refining them
based on the scaling results over the continuing cycles of a design experiment, we hope to
achieve the goal stated above: to develop a measurement instrument with the strengths of

14
the ACTFL scale in linking to ‘real-world’ tasks, but with the theoretical underpinnings
of an evolving theory of competence in speaking.
The results of this study have provided us with the first phase of developing a
useful measurement instrument. Using the qualitative ACTFL domain model of language
proficiency, in combination with previously collected data on the distribution of learners
across the four semesters of English classes, a theoretical scaling of tasks was developed.
Using actual data, this theoretical scale positions of tasks weredefined more precisely. An
initial scale of ordered speaking tasks is now available as a foundation for developing a
domain theory. However, this is just the beginning. Future iterations in scale refinement
must look more closely at particular task types, including “Asking Questions” and
“Opinion” tasks by varying topic and response time allowed. Furthermore, additional
task types must also be added and calibrated onto the scale
Finally, and most importantly, as this ordered scale of speaking tasks continues to
be refined, we can investigate more fully the critical language abilities associated with the
probability of success on particular task types. It is only with invariant scales that this
type of proficiency scaling can link underlying language skills with particular values
along a scale. Perhaps now at the beginning of the 21st century, we are one step closer to
providing meaningful information to programs, teachers, and examinees about progress
in language abilities. And perhaps better science is in the offing. As the domain theory
develops, we can investigate in the design experiment format many research questions
about learning to progress along this increasingly well-defined growth scale. We can
know in conducting this research that the outcome measures taken from semester to
semester will have the same metric; and, as the domain theory develops further beyond
the qualitative ACTFL model, we can come to understand the ordering of tasks within a

15
coherent and testable interpretative framework. This framework offers connections
between data and theory all along the way.

16
References
American Council on the Teaching of Foreign languages. (1999). Oral
proficiency interview tester training manual. Yonkers, NY: American Council on the
Teaching of Foreign Languages.
Bachman, L. F., & Palmer. (1996). Language Testing in Practice. New York:
Oxford University Press.
Bachman, L. F. (1990). Fundamental considerations in language testing. New
York: Oxford University.
Linacre, J. M. (1989). Many-facet Rasch measurement. Chicago: MESA Press.
Linacre, J. M., & Wright, B. D. (1992). FACETS: Many-faceted Rasch analysis.
Chicago: MESA Press.
McNamara, T. F. (1995). Modelling performance: Opening Pandora's box.
Applied Linguistics, 16, 159-79.
Messick, S. (1989). Validity. In R. L. Linn (Ed.), Educational measurement.
Third Edition (pp. 13-104). New York: Macmillan.
Messick, S. (1998). Consequences of test interpretation and use: The fusion of
validity and values in psychological assessment [Research Report 98-4]. Princeton, New
Jersey: Educational Testing Service.
Shohamy, E. (1992). New modes of assessment: The connection between testing
and learning. In E. Shohamy & A. R. Walton (Eds.), Language assessment for feedback:
Testing and other strategies (pp. 7-28). Dubuque, Iowa: Kendall/Hunt.
Skehan, P. (1998). A cognitive approach to language learning. New York:
Oxford University.

17
Table 1
Holistic Rating Scale Rubric
Rating Description
20 Some attempt at the task may take place, but basically it is impossible for someone who doesn’t know the purpose of the task to understand. Some words or sentences may be spoken, but no real communication takes place.
40 The task is attempted and performance shows developing
language abilities to accomplish the task. However, it is clear that the examinee doesn’t have enough language skills to complete the task. Performance shows lack of control or development of essential structures, vocabulary, and/or audience awareness. Little attempt is made to connect ideas to make the response cohesive.
60 Performance shows that the student has sufficient language
ability to complete the task, although quality is not always maintained. Errors in syntax are present and are somewhat distracting, but they don’t interfere with communication. Vocabulary is sufficient for the task, but it is inadequate to provide detail for the task.
80 Performance clearly shows sufficient language ability to
complete the task. Minor errors are present, but don’t interfere with understanding. Performance shows awareness of language needed in different social settings.
________________________________________________________________________

18
Table 2 Estimated Distribution of Proficiency Levels
Proficiency Level Percent of the Distribution
Novice Mid 7
Novice High 20
Intermediate Low 24
Intermediate Mid 23
Intermediate High 21
Advance Low 2
Advanced Mid* 1
Advanced High* 1
Superior* 1
*Students at Advanced Mid, Advanced High, and Superior levels rarely attend the program, so 1 percent in each of these levels was used in the estimation.

19
Table 3 Results of FACETS analysis for theoretical data and actual data
Task Theoretical Data Actual Data Task
1a Transport -18.11 -2.2 1a Transport 1b Frontroom -18.11 -2.05 1b Frontroom 1c Foods -18.11 -1.74 1c Foods 2a HobSelf -6.52 -0.99 2a HobSelf 2b FamSelf -6.52 -0.98 2b FamSelf 2c SkedSelf -6.52 -0.92 4a OrderFood 2d HomeSelf -6.52 -0.74 2c SkedSelf 3a SkedOther -6.52 -0.36 3a SkedOther 3b FamOther -6.52 -0.36 3b FamOther 3c HomeOther -6.52 -0.34 5a AskRest 3d HobOther -6.52 -0.32 4b Invitpar 4a. OrderFood -6.52 -0.27 4c HotelRes 4b Invitpar -6.52 -0.26 2d HomeSelf 4c HotelRes -6.52 -0.24 3c HomeOther 4d GiveDirec -6.52 -0.11 6a Vacation 5a. AskRest -6.52 -0.02 3d HobOther 5b AskClass -6.52 0.06 6b ChildExp 5c AskMovie -6.52 0.06 4d GiveDirec 5d AskBook -6.52 0.09 6c Movie 6a Vacation 3.8 0.13 5b AskClass 6b ChildExp 3.8 0.16 8a Dinner 6c Movie 3.8 0.31 5c AskMovie 6d DifSit 3.8 0.34 10a Pollution 7a WashMachine 3.8 0.37 7a WashMachine 7b Fall 3.8 0.4 10b Zoo 7c Accident 3.8 0.5 6d DifSit 7d Toaster 3.8 0.55 8b Car 8a Dinner 8.99 0.55 7b Fall 8b Car 8.99 0.69 10c ProtectLand 8c Cleaners 8.99 0.7 10d Jobs 8d BossParty 8.99 0.72 9a FutProblem 9a FutProblem 8.99 0.75 7c Accident 9b FutTravl 8.99 0.75 5d AskBook 9c FutTech 8.99 0.76 8c Cleaners 9d Communicate 8.99 0.77 9b FutTravl 10a Pollution 18.61 0.77 7d Toaster 10b Zoo 18.61 0.8 9c FutTech 10c ProtectLand 18.61 0.83 9d Communicate 10d Jobs 18.61 0.84 8d BossParty

20
Figure 1. Bachman’s (1990) components of language competence.
Vocabulary
Styntax
Morphology
Phonemes
Grammatical
Competence
Cohesion
Rhetorical
Organization
Textual
Competence
Organizational
Competence
Ideational
Function
Manipulative
Functions
Heuristic
Functions
Imaginative
Functions
Ilocutionary
Competence
Sensitivity to
Dialogue or
Variety
Sensitivity to
Register
Sensitivity to
Naturalness
Cultural
References, or
Figures of
Speech
Sociolinguistic
Competence
Pragmatic
Competence
Language Competence
21
Figure 2. Theoretical distribution of tasks (on a 1 to 10 scale). Tasks are numbered 1
through 10.
1 6 2 3 4 5 7 8 9 10
6 5
1 2 1
3
4
7
8
9
10

22
Figure 3. Distribution of tasks using actual data (on a 1 to 10 scale). Tasks are
numbered 1 through 10.
Actual Data
1 6 2 3 4 5 7 8 9 10
1 2 1
4
3
5
10
6 5
8
9
23
Figure 4. Comparison of distribution of theoretical values and actual data values (on a 1
to 10 scale). Tasks are numbered 1 through 10.
Actual Data
Theoretical Data
5
7
1 6 2 3 4 5 7 8 9 10
6 5
1 2 1
3
4
7
8
9
10
1 2 1
4
3
5
10
6 5
8
9
24
Appendix
Task type 1: Name common objects 1a Modes of Transportation 1b Front room 1c Foods 1d Classroom
Task Type 2: Give information about self
Tell about. . . 2a Hobbies 2b Family 2c Daily activities 2d Home or apartment
Task Type 3: Give information about others
Given a drawing, tell about. . . 3a Daily activities 3b Family 3c Home or apartment 3d Hobbies
Task Type 4: Deal with typical social situations
4a Order food at a restaurant (given a menu) 4b Invite someone to a party 4c Get a room at a hotel (over telephone) 4d Give directions to get from one place to another
Task Type 5: Ask questions
5a Find out information about a restaurant. 5b Find out information about a class a nearby school. 5c Find out information about a movie at a theater. 5d Find out information about a book recommended to you.
Task Type 6: Narrate a personal story 6a Tell about a recent vacation. 6b Tell about an experience with your family when you were a child.. 6c Tell about a movie you have seen. 6d Tell about a difficult situation you have been in.
Task Type 7: Narrate a story given a visual prompt
7a Washing machine story (4 picture cues) 7b A passenger takes a fall entering an airplane (video). Describe what
happened. 7c You see a minor car accident (video). Call police and tell what happened. 7d Toaster (4 picture cues)

25
Task Type 8: Deal with a complication 8a You take a business associate to dinner. You go to pay, but you don't have
your wallet. 8b You borrow a friend's car and get in a minor accident. Apologize, offer to
pay, and beg the owner of the other car not to report the accident to the police.
8c You need to get a jacket cleaned for an important presentation. Take it to the dry cleaners, explain the situation, and convince him to put your jacket as top priority.
8d Your company is having a party at your boss� home. Your co-worker indicated it would be casual dress, but when you arrive, you discover it is a formal dinner. You can't go home to change because it is too far. Without getting your co-worker into trouble, apologize to your boss and explain your casual dress.
Task Type 9: Tell about the future
9a What major problems do you think we will face over the next 50 years? 9b What do you think travel will be like by the middle of the 21st Century? 9c How do you think information will be stored and accessed in the year 2050? 9d How do you think communication may be different 100 years from now?
Task Type 10: Support an opinion
10a Pollution is becoming a major problem today. Some say we should all use public transportation and not allow the use of privately-owned cars. What is your opinion? Explain.
10b There are many zoos around the world. Some say it is cruel to keep animals in a zoo. What is your opinion? Explain.
10c Some people believe we should use the land to benefit us by building factories and cities. Others say we need to protect the land and not build on it. What is your opinion? Explain.
10d Some argue that the government should give money to businesses to help provide jobs. Others suggest the government should give money to programs that help people gain skills so they can get jobs. What is your opinion? Explain.

![GOOD MODULI SPACES FOR ARTIN STACKS - arXiv1. Introduction 1.1. Background. David Mumford developed geometric invariant theory (GIT) ([GIT]) as a means to construct moduli spaces](https://img.pdfslide.us/doc/110x75/5f43ffea7aa0ec752578b9c6/good-moduli-spaces-for-artin-stacks-arxiv-1-introduction-11-background-david.jpg)


![GOOD MODULI SPACES FOR ARTIN STACKSjarod/papers/gms.pdf1. Introduction 1.1. Background. David Mumford developed geometric invariant theory (GIT) ([GIT]) as a means to construct moduli](https://img.pdfslide.us/doc/110x75/5f43fbc3e53cda44b01ce0b0/good-moduli-spaces-for-artin-stacks-jarodpapersgmspdf-1-introduction-11-background.jpg)


![Flexible Electronics: Imbricate Scales as a Design Construct ...rogersgroup.northwestern.edu/files/2012/smallscales.pdfan advanced form of a transfer printing.[7,8] The experimental](https://img.pdfslide.us/doc/110x75/5faeb29acb4dbd3ec937642f/flexible-electronics-imbricate-scales-as-a-design-construct-an-advanced-form.jpg)