Embed Size (px)
Citation preview

Moving the debate forward The Vodafone Policy Paper Series • Number 10 March 2010•
Developing Government
objectivesfor broadband

I hope you enjoy our tenth Vodafone Policy Paper. Our aim in these papers is to provide a platform for leading experts to write on issues in public policy that are important to us at Vodafone. These are the people that we listen to, even if we do not always agree with them. These are their views, not ours. We think that they have important things to say that should be of interest to anybody concerned with good public policy.
Vittorio Colao, Chief Executive, Vodafone Group
Welcome
ContentsWelcome
Introduction
Optimal Investment in Broadband : The Trade-Off Between Coverage and Network Capability
Demand-side measures to stimulate Internet and broadband take-up
– Vittorio Colao
– Richard Feasey
– Robert Kenny
– David Lewin
Published by Vodafone Group PlcCopyright © 2010 Vodafone Group PlcISBN 978-0-9552578-5-8

IntroductionThe recent global financial crisis has seen an increase in intervention by public authorities in many areas of activity we had previously thought reserved for the private sector. Telecommunications markets have been no exception. The past few years have seen policymakers committing billions of euros (and billions of dollars) of taxpayers' money - if not yet actually spending it – towards the funding of new telecoms infrastructure, particularly high speed broadband networks. These funds are intended not only to deliver short term stimulus and create jobs, but also to lay the foundations for future competitiveness, sustainability and social cohesion. Such aims are shared by most policymakers (and by many in industry). Achieving them has meant that Governments are now more directly engaged in telecommunications markets than at any time since privatisation swept the world almost twenty years ago.
The initiatives taken by Governments around the world have not, however, been informed by a common view about how or where public funds should best be allocated. Policymakers appeared to be setting a range of different targets with very different aspirations in terms of the coverage, speed and timing of the networks they proposed to support. This implied either that each country had very different conditions which justified very different goals or, more plausibly in our view, that there was really no analytical underpinning for the way in which most of these targets were being set. We therefore asked Ingenious Consulting to think about what such an analytical framework might look like, and to assess some of the existing schemes against their benchmarks.
Ingenious find that there is a strong case for using public funds to extend basic broadband infrastructure – ADSL or possibly wireless – to as much of the population as possible. This suggests that there may be a case for a 'Mobility Fund' to extend wireless coverage, as the FCC's much anticipated National Broadband Plan is expected to propose or as the Irish Government have implemented. However, Ingenious find that the case for public funding of higher bandwidth fibre to the home or fibre to the curb is much less clear. Policymakers would need to make implausibly ambitious assumptions about
the public benefits, or externalities, associated with very high speed broadband networks to justify the level of public subsidy which is proposed, for example, by the Australian Government today.
Given the difficulty of making a case for wide public intervention to support fibre if there is already extensive basic broadband deployment, we were also interested in how public resources had been used, or could be used, to boost demand over those networks that already exist. Our hypothesis was that Governments can do a lot to stimulate demand amongst groups who have so far proven immune to the marketing activities of private firms. If demand could be expanded in this way, then the prospects for further investment on the supply side might also improve.
We asked Plum to assess which Europeans used the internet today and what might be done to get more of them using it in future. This kind of work has been done by some agencies – most notably the FCC in their very comprehensive Broadband Plan preparations – but not by others. We also wondered whether previous Government attempts to boost use of the internet could teach us anything about how public funds should be applied – or not - in future. The results here are worrying. A great deal of public money has been spent on what we might loosely call demand side initiatives in Europe but Plum find that much of it appears to have been wasted. Notable exceptions include Portugal's initiative to increase student adoption of the internet in schools and at home.
Plum are optimistic about the prospects for increased internet adoption in Europe as innovation by the private sector continues to break down many of the remaining barriers to adoption. But we should be worried about anyone under 25 in Europe who does not use the internet today. Almost half of these are to be found in Italy. There are also over 30 million adults between 25 and 55 who are more evenly distributed across Europe, some of whom will not use the internet until 2018 without some form of additional assistance. Plum suggest how European Governments might use public funds to bring forward this date.
Richard Feasey
1
The Vodafone Policy Paper Series • Number 10 March 2010• Developing Government objectives for broadband

These papers do not provide country by country recommendations for Governments. But they remind us that having a clear analytical framework and a good understanding of what the existing data tells us is a good basis from which to begin to set ambitious targets or to decide how to allocate large sums of taxpayers' money.
These papers present the key findings arising from the work of Ingenious and Plum but do not include extensive annexes which accompany both documents. These are available at http://www.vodafone.com/start/misc/public_policy.html
2
The Vodafone Policy Paper Series • Number 10 March 2010•Developing Government objectives for broadband

Executive summary
Robert Kenny
Rob has extensive telecoms experience, and is Managing Director of Ingenious Consulting. He previously headed M&A for Level 3. Prior to this, Rob led sales, marketing, strategy and M&A for REACH (the co-investment vehicle for Telstra and Hongkong Telecom’s international businesses) and strategy and M&A for Hongkong Telecom. Rob began his career in consultancy with the LEK partnership, and holds an honours degree in Mathematics and Management Studies from Cambridge University.
Optimal Investment in Broadband : The Trade-OffBetween Coverage and Network Capability
Managing DirectorIngenious Consulting
3
The Vodafone Policy Paper Series • Number 10 March 2010• Developing Government objectives for broadband
Governments around the world are announcing and implementing substantial plans to support high speed broadband roll-out. However, in many countries there is little evidence that these plans are based on a thoughtful consideration of the pros and cons of different potential market interventions, and certainly the plans are widely divergent in their scale and objectives.
Given the multi-billion Euro sums being spent on these projects, we believe an analytical framework to support decision making in this area could be highly valuable. This paper seeks to provide such a framework.
The decisions are undoubtedly complex. While costs can be relatively accurately assessed, consumer demand for higher speed is far less certain, and the associated externalities are even harder to quantify (though many government investment plans are based on the idea that
1they will be significant) . Moreover, given that most countries now have relatively wide availability of standard broadband, any rationale for high speed investment must consider the incremental benefits and costs, not the absolute benefits and costs.
Nonetheless, we believe these decisions can be usefully supported by quantitative analysis. Core to our work is a flexible model allowing for assessment of the incremental benefits of broadband investment, by
2technology, country and region.
Our analysis focuses on three types of broadband 3technology: standard (up to 15 Mbps download) , fast
(up to 50 Mbps download) and superfast (over 50 Mbps download). We consider the incremental costs and benefits of each, acknowledging that the trade-offs are complex. For example, there are a range of local market differences including variations in the 'counterfactual' (the likely broadband infrastructure in a given country absent intervention), uncertainties exist over consumer demand and there are severe difficulties in modelling externalities.
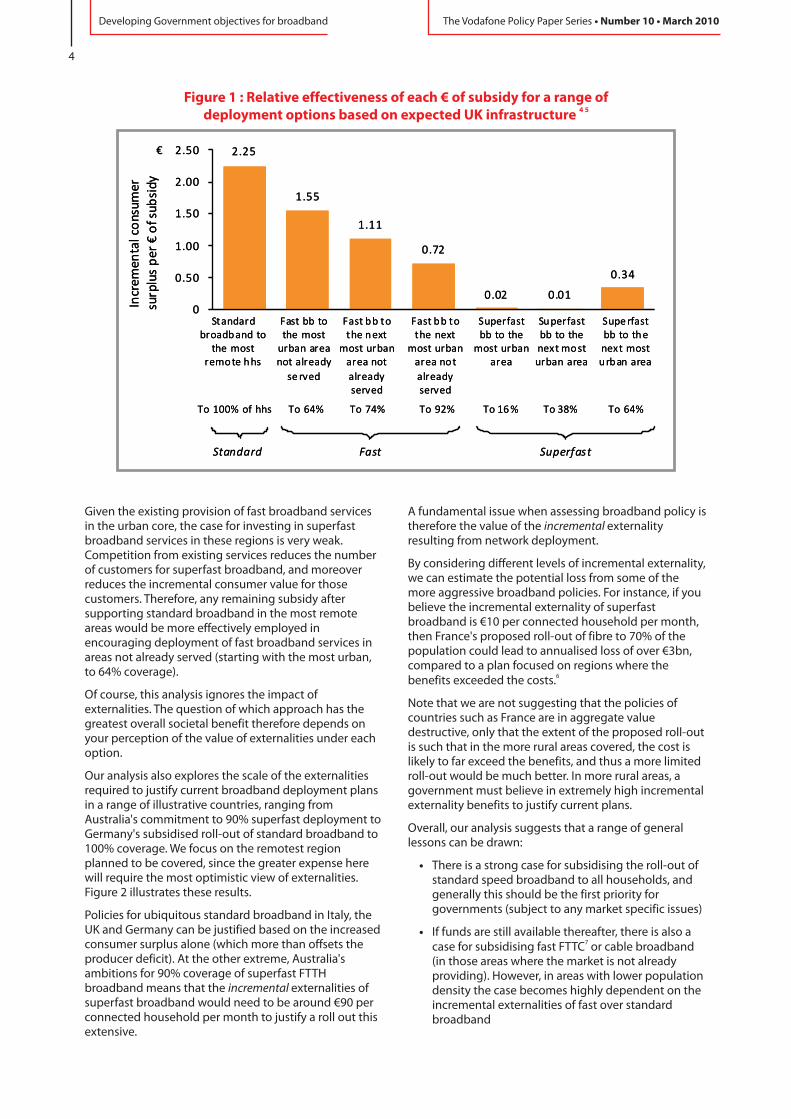
Our analysis allows us to consider the relative merits of a range of deployment strategies. For example, based on assumptions for the UK, we can contrast sudsidising the deployment of standard broadband to the final group of households (and achieving 100% coverage), subsidising fast broadband to areas where BT and Virgin do not already supply, and subsidising superfast broadband to the urban core. Figure 1 below illustrates the relative effectiveness of each approach in terms of the value of consumer benefit realised per € of subsidy.
Based on our assumptions, the most effective approach (before considering externalities) is to extend the coverage of standard broadband to the final 3% of households. For each €1 of subsidy, €2.25 of incremental consumer value is created.
2.25
1.55
1.11
0.72
0.02 0.01
0.34
0
0.50
1.00
1.50
2.00
2.50
Fast bb to the most
urban area not already
se rved
€
Incr
emen
talc
ons
umer
surp
lus
per
€o
fsub
sidy
Fast bb to the next
most urban area not
already served
Superfast bb to the
most urban area
Standard broadband to
the most remote hhs
Standard Fast Superfast
Fast bb to the next
most urban area not
already served
Superfast bb to the next most urban area
Supe rfast bb to the next most urban area
To 100% of hhs To 64% To 74% To 92% To 16 % To 38% To 64%
Figure 1 : Relative effectiveness of each € of subsidy for a range of4 5deployment options based on expected UK infrastructure
4
The Vodafone Policy Paper Series • Number 10 March 2010•Developing Government objectives for broadband
Given the existing provision of fast broadband services in the urban core, the case for investing in superfast broadband services in these regions is very weak. Competition from existing services reduces the number of customers for superfast broadband, and moreover reduces the incremental consumer value for those customers. Therefore, any remaining subsidy after supporting standard broadband in the most remote areas would be more effectively employed in encouraging deployment of fast broadband services in areas not already served (starting with the most urban, to 64% coverage).
Of course, this analysis ignores the impact of externalities. The question of which approach has the greatest overall societal benefit therefore depends on your perception of the value of externalities under each option.
Our analysis also explores the scale of the externalities required to justify current broadband deployment plans in a range of illustrative countries, ranging from Australia's commitment to 90% superfast deployment to Germany's subsidised roll-out of standard broadband to 100% coverage. We focus on the remotest region planned to be covered, since the greater expense here will require the most optimistic view of externalities. Figure 2 illustrates these results.
Policies for ubiquitous standard broadband in Italy, the UK and Germany can be justified based on the increased consumer surplus alone (which more than offsets the producer deficit). At the other extreme, Australia's ambitions for 90% coverage of superfast FTTH broadband means that the incremental externalities of superfast broadband would need to be around €90 per connected household per month to justify a roll out this extensive.
A fundamental issue when assessing broadband policy is therefore the value of the incremental externality resulting from network deployment.
By considering different levels of incremental externality, we can estimate the potential loss from some of the more aggressive broadband policies. For instance, if you believe the incremental externality of superfast broadband is €10 per connected household per month, then France's proposed roll-out of fibre to 70% of the population could lead to annualised loss of over €3bn, compared to a plan focused on regions where the
6benefits exceeded the costs.
Note that we are not suggesting that the policies of countries such as France are in aggregate value destructive, only that the extent of the proposed roll-out is such that in the more rural areas covered, the cost is likely to far exceed the benefits, and thus a more limited roll-out would be much better. In more rural areas, a government must believe in extremely high incremental externality benefits to justify current plans.
Overall, our analysis suggests that a range of general lessons can be drawn:
• There is a strong case for subsidising the roll-out of standard speed broadband to all households, and generally this should be the first priority for governments (subject to any market specific issues)
• If funds are still available thereafter, there is also a 7case for subsidising fast FTTC or cable broadband
(in those areas where the market is not already providing). However, in areas with lower population density the case becomes highly dependent on the incremental externalities of fast over standard broadband

0
20
40
60
80
100
€per month
Australia
superfast
France
superfast
Sweden
superfast
Portugal
superfast
Germany
fast
Italy
standard
UK
standard
Germany
standard
Possible over-investment Possible under-investment
Figure 2 : National broadband plans – incremental externalities per month per connectedhousehold required to justify proposed investment in remotest region covered
5
The Vodafone Policy Paper Series • Number 10 March 2010• Developing Government objectives for broadband
8• The case for subsidising superfast (FTTH or FTTB ) broadband is weaker. To believe it can create greater societal value than fast broadband requires an aggressive assumption about incremental externalities of superfast over fast broadband, but even then the societal benefits will be much less evenly distributed
• Geography is an important consideration in broadband policy. In some regions, the market is likely to deliver without intervention. In other areas, there are clear arguments for government subsidy. In many of the most rural locations, the case for subsidy of superfast broadband deployment is weak
unless aggressive assumptions are made about the value of externalities. Despite this, regional targeting is, at best, peripheral in many centralised broadband policies. We suggest it should play a greater role.
We recognise that this paper is only a small first step towards a more rigorous framework for decision making, and we would welcome your comments.
We would like to thank Vodafone for their funding of this work. However, the views and opinions expressed in this study are solely those of the authors and do not necessarily reflect the views and opinions of Vodafone.
Governments around the world have been announcing ambitious plans to support broadband investment. However, there is no consensus on the focus of these plans. Some governments have emphasised high capacity connectivity. Others are more concerned with assuring the availability of basic broadband to the greatest number. Some countries have announced twin targets of both: increasing network capability and broadband access.
The expenditure involved in deploying broadband networks is significant and therefore even the wealthiest countries must make trade-offs between depth of coverage (the proportion of the population with access) and network capabilities (access speed, technology, latency, etc.). However, to date the process by which governments have made these trade-offs might generously be described as opaque. There is often little or no discussion as to why a particular broadband plan has been chosen over the almost endless range of alternatives. Indeed in some cases policy makers have
9actively rejected applying cost-benefit analyses.
There is no question that the issues involved are complex, and that there are gaps in relevant data (for example, the incremental benefits to society of higher speed broadband). However, the sums being put at risk by broadband are far too large to be spent without rigorous consideration of the alternatives. Therefore the ambition of this report is to provide an analytical
Introductionframework that policy makers can use to inform the debate.
At the heart of our analysis is a quantitative model which estimates the value created for consumers and providers of broadband services in a range of scenarios. We do not aim to provide a definitive answer as to the 'right' form of broadband subsidy and the manner in which infrastructure should be deployed. Rather, we seek to explore the trade-offs between different broadband investment approaches in a quantitative manner.
Specifically, we have sought to develop a framework which will allow us to understand:
• The trade-offs between depth of coverage and network capabilities, including speed;
• How these trade-offs are affected by country-specific variables;
•? The appropriateness of current broadband policy; and
•? The questions that should be asked by governments, regulators and investors when developing a coherent and socially beneficial strategy for broadband deployment.
In the report we note the importance of different geographic regions, and make reference to different
10'geotypes' .
6
The Vodafone Policy Paper Series • Number 10 March 2010•Developing Government objectives for broadband
Many governments have stated their intent to stimulate the provision, or directly provide, fast and superfast broadband networks. However, the details of these plans vary significantly between countries.
One question for governments is which type of broadband technology they wish to support. Governments frequently articulate this in terms of a
11particular speed. However, given significant discrepancies between headline and actual speeds, and differences in upload and download characteristics, reference to speed alone can be ambiguous.
In practical terms, the decision is to invest in a particular technology rather than a specific speed. Therefore, in this report we refer to the type of technology, and the speed and characteristics of that technology, rather than simply the headline download speed. We consider three categories, 'standard', 'fast' and 'superfast' broadband:
? Standard broadband is capable of achieving access speeds of up to 15 Mbps download and 1.5 Mbps upload. It includes both wireless (e.g. 3G, 4G) and wireline technologies, the most notable fixed technology being asymmetric digital subscriber line (ADSL), currently the most widespread form of broadband. Although ADSL connections can theoretically achieve higher download speeds of up to 24Mbps, actual speeds are generally considerably
12lower than this.
? Fast broadband is capable of achieving download speeds of up to 50Mbps and upload speeds of up to 10Mbps. Key technologies includes fibre to the cabinet (FTTC) and cable. FTTC involves laying fibre-optic cables to street cabinets typically located within a few hundred metres of the customer premises. Households are then connected from the cabinet by copper lines. Cable networks often have a similar architecture, with fibre to the cabinet and coax cable from there to the home. FTTC and cable speeds are higher than ADSL, but are often not fully symmetric and are determined, in part, by a household's distance from the cabinet.
? Superfast broadband connections can achieve upload and download speed of over 50Mbps. Main technologies include fibre to the home (FTTH) and fibre to the building (FTTB), which involve laying fibre-optic cables directly to the customer premises, either through a gigabit passive optical network (GPON) or point-to-point fibre (PTP). FTTH and FTTB connections typically allow the highest speeds, lowest latency, greatest reliability and truly symmetric connections when contrasted against FTTC and ADSL.
Types of broadband infrastructure
While our discussions of broadband networks primarily related to wireline networks, wireless technologies (mobile, fixed wireless and satellite) are increasingly
13prevalent means of broadband delivery. For example, the Irish government has awarded a contract to Hutchison 3G to provide broadband to the final 10% of population through a hybrid wireless/satellite
14approach.
Some governments focus on supplying high capacity superfast broadband for a proportion of the population, whereas others stress the importance of ubiquitous broadband at lower speeds. For example, Germany intends to reach its entire territory with a 1Mbps service and 75% coverage of the country with a 50Mbps service. The United Kingdom has set a target of 2Mbps for ubiquitous access and expects a 50Mbps services to be deployed to around 40% of the country. Australia has stated its ambition to provide high speed 100Mbps services to 90% of the country.
As might be expected given the different objectives, the level of planned government spend also varies significantly. At one extreme, the government of Australia has announced plans for a superfast broadband network costing A$43bn/€28bn (with the government to provide at least A$4.7bn), estimated to take more than eight years to build and requiring roughly 25,000 full-time workers. Conversely Germany, with a population roughly four times as large as Australia's, is planning to spend €150m, or roughly 5% of Australia's minimum subsidy.
below illustrates the disparity in policy objectives (and plans of commercial operators). Further detail on broadband policy by country (and sources) is provided in appendix A.
The manner of government intervention also varies. In some countries, governments are providing direct financial assistance. In others, intervention focuses on encouraging consumer demand. Elsewhere, more market led approaches have been adopted, facilitated by a regulatory framework which seeks to develop competition, encourage efficient investment in infrastructure and ultimately let market dynamics decide.
In Europe EU restrictions on state aid (put in place originally to prevent national governments from using their funds to aid local industries in contravention of the single market) has constrained intervention. There has been an emphasis either on underserved populations or on company- and technology-neutral public tenders.
Policy objectives
Manner of intervention
Broadband and government policy7
The Vodafone Policy Paper Series • Number 10 March 2010• Developing Government objectives for broadband

8
The Vodafone Policy Paper Series • Number 10 March 2010•Developing Government objectives for broadband

Pricing regulation is another important aspect of intervention. While examples of geographically de-averaged prices are rare, in Finland regulation around price discrimination has been relaxed as a method of stimulating roll-out.
There are a number of reasons why we would expect government broadband policy to vary: local market
The lack of a clear decision making framework
considerations including the existing fixed infrastructure, the likelihood of commercial provision, consumer demand for fast and superfast broadband technologies, topography, laissez-faire or interventionist government philosophy and so on.
However, the wide variation in policies suggests that there may a further reason: a lack of a structured approach for making policy decisions. In the remainder of this report, we introduce such an approach and assess various national policies through this prism.
9
The Vodafone Policy Paper Series • Number 10 March 2010• Developing Government objectives for broadband

Investment trade-offsBroadband investment covers a number of dimensions and even the most affluent of nations are likely to need to make trade-offs between them. These dimensions include:
? Coverage, with costs per household passed generally increasing with roll-out
? Speed, driven by both the underlying technology (standard, fast, superfast) and network characteristics (network architecture, distance from the exchange, etc.)
? Take-up, often achieved through demand side stimuli (training, awareness, pricing subsidies, etc.)
? Mobility, with wireless networks increasingly viable as a means of broadband delivery
There is little evidence that broadband policy is being based on a thoughtful consideration of the trade-offs between these investment alternatives. Given the multi-billion Euro sums being spent by governments on broadband projects, we believe an analytical framework is needed to support decision making in this area. We have therefore developed a quantitative model which focuses, in particular, on the first two of the above dimensions: coverage and speed (proxied by network type).
A framework for assessing broadband policy
Pri
ce(€
/mo
nth
)
q (% of
households)q1 (broadband take-up)
Broadband market
price assuming no price discrimination
Broadband
demand curve
p1
Consumer value
Producer value
Illustrative value of
externalities
Figure 3 : Illustrative value created by broadband
Overview of the modelling approach To develop a practical framework for assessing broadband trade-offs, we have considered the value of broadband against the classical economic concepts of consumer value, producer value and externalities. These are illustrated below.
Consumer and producer value are the most direct measures of economic benefit from the consumption of broadband. The (limited) set of literature exists which
15measures these types of value forms the basis of our analysis of consumer and producer value.
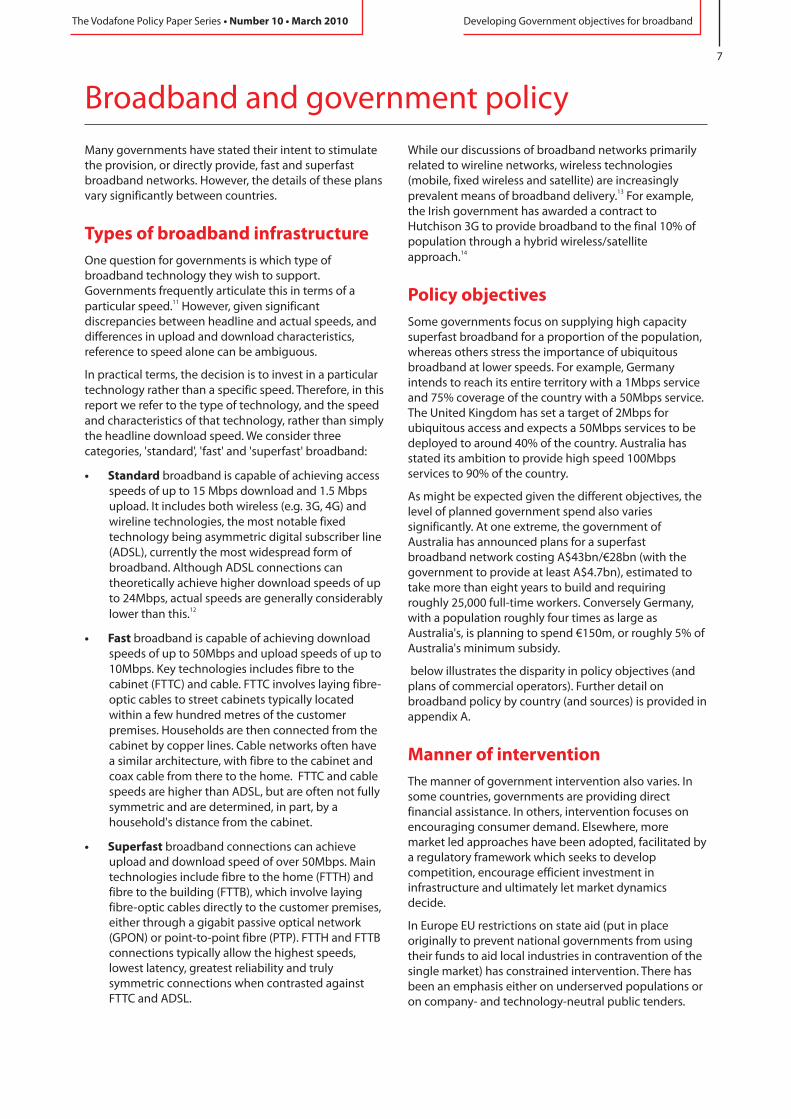
It is generally believed that broadband has significant positive externalities, and indeed this is a critical underpinning assumption for the consensus that government intervention to support broadband may be justified. Positive externalities are represented (illustratively) by the green shaded area above the broadband demand curve. Positive externalities brought about by different types of broadband may include the following:
However, it is worth noting that not all externalities associated with high speed broadband are necessarily positive. Some have pointed to the increased carbon emissions likely to result from deployment, and others have posited that high speed networks will increase digital content piracy. Plum for BSG (2008) also note
10
The Vodafone Policy Paper Series • Number 10 March 2010•Developing Government objectives for broadband
negative externalities associated with intervention itself: “if public funds rather than voluntary user payments are used to fund next generation broadband, then an additional cost is incurred in terms of the economic cost of raising taxes”.
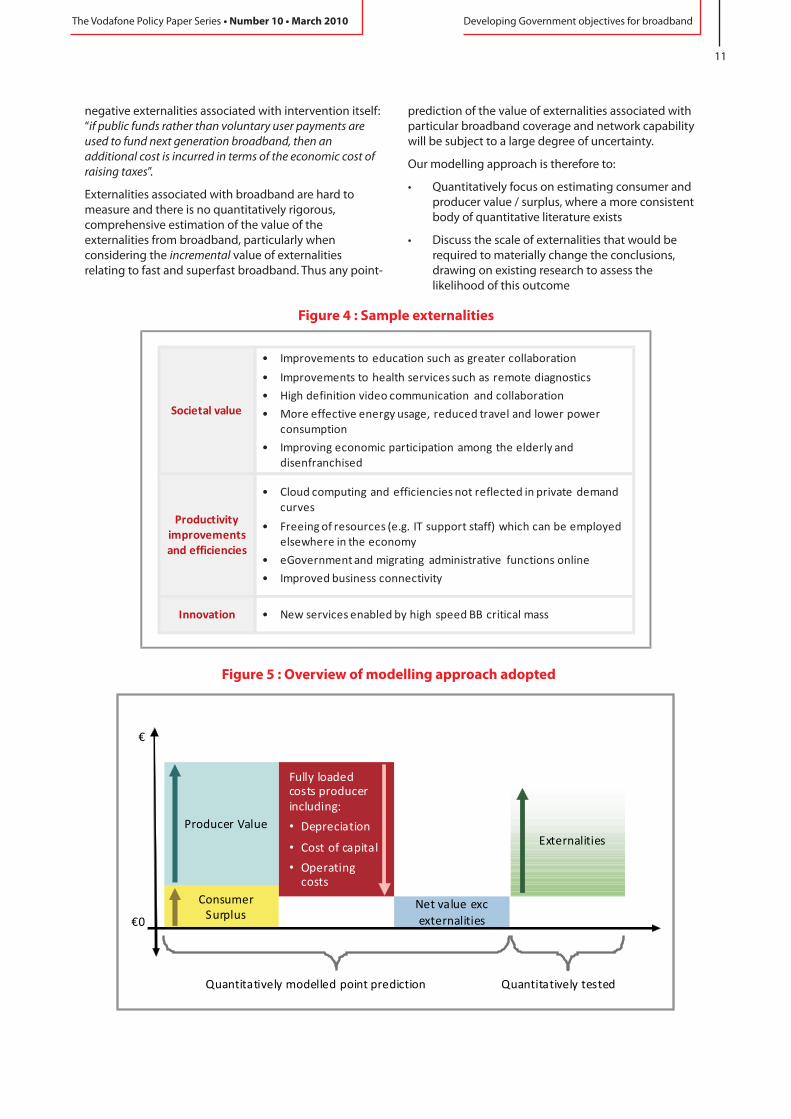
Externalities associated with broadband are hard to measure and there is no quantitatively rigorous, comprehensive estimation of the value of the externalities from broadband, particularly when considering the incremental value of externalities relating to fast and superfast broadband. Thus any point-
prediction of the value of externalities associated with particular broadband coverage and network capability will be subject to a large degree of uncertainty.
Our modelling approach is therefore to:
• Quantitatively focus on estimating consumer and producer value / surplus, where a more consistent body of quantitative literature exists
• Discuss the scale of externalities that would be required to materially change the conclusions, drawing on existing research to assess the likelihood of this outcome
Figure 4 : Sample externalities
Figure 5 : Overview of modelling approach adopted
Quantitatively modelled point prediction
Fully loaded costs producer including:
• Depreciation
• Cost of capital
• Operating costs
Consumer Surplus
Producer Value
Net value exc
externalities
Externalities
€
€0
Quantitatively tested
11
The Vodafone Policy Paper Series • Number 10 March 2010• Developing Government objectives for broadband

This approach is illustrated in below.
The model performs the above calculation for each of 8 geographic regions (geotypes) in the country in question. Broadly speaking, if for a given geotype the producer value is greater than the costs (that is, the producer surplus is positive), then that geotype will be served by commercial players without the need for intervention.
If however the producer surplus is negative (i.e. producer value is less than costs) but the net value is positive, then a subsidy may be needed to support roll-out, but that subsidy can be justified purely on the basis of private value. This is the case illustrated above, where total value is greater than costs, but producer costs are greater than producer value.
Note that we do not imply that as a general rule governments should intervene purely to create consumer surpluses; rather, we believe that the risk of intervention is much less when its cost is exceeded by such surpluses, before bringing into account externalities.
If the net value is negative, a subsidy may still be justified, but a government would need to believe firmly in the value of sufficient externalities to offset the negative net value.
We do not seek to provide a definitive answer to the value of broadband and the manner in which infrastructure should be deployed; rather, we aim to provide a framework to inform policy debate. A full discussion of the approach is provided in the appendices to this report.
The model estimates the incremental value created for consumers and providers of broadband services under a range of scenarios relating to coverage and technology. The model also allows us to explore the relationships between other variables, in particular country-specific factors such as pricing, penetration and geographic profile. The costs and benefits of broadband roll-out in a country will depend on such variables, and our model takes these into account where possible.
Scope of the modelling approach
12
The Vodafone Policy Paper Series • Number 10 March 2010•Developing Government objectives for broadband

In this section we explore the case for any government intervention, how intervention should be targetted (particularly in terms of higher speeds vs wider coverage) and how our analysis compares to actual government plans.
Much of the discussion of the value of higher speed broadband compares total costs and benefits. However, the critical question for a given government intervention is whether the incremental gains from the investment (the value derived from the upgrade to the base case network in the 'counterfactual') exceed the associated incremental costs. Put another way, even if the total benefits (as measured by aggregate consumer and producer value) exceed total costs, this says nothing
The case for government intervention
Analysis and findings
Figure 6 : Market incentives to provide high speed broadband for a 16new monopolist infrastructure provider in Australia (2020)
€m
Positive producer surplus, creating incentives for infrastructure rollout
without intervention
Negative producer surplus which is unlikely to stimulate investment based solely on expected commercial returns
Consumer surplus
Producer surplus
Consumer surplus
Producer surplus
G1 G2 G3 G4 G5 G6 G7 G8-1,000
-800
-600
-400
-200
0
200
400
600
G1 G2 G3 G4 G5 G6 G7 G8-1,000
-800
-600
-400
-200
0
200
400
600
about whether society gains, as the project's incremental benefits (over the counterfactual) might be less than its incremental costs. This therefore requires us to develop a robust understanding of what the market will deliver by itself.
The cost of deploying broadband varies significantly within a country. More remote and less dense areas will be more expensive to serve than urban, highly populated regions. Given that broadband prices are generally flat nationwide, this means that returns for
A new infrastructure provider is unlikely to deliver widespread high speed broadband without intervention
higher speed broadband investment fall rapidly outside urban areas.
For instance, based on an Australian profile of household mix by geography, there is unlikely to be a significant commercial motivation for a new infrastructure provider to invest in widespread roll-out of fast or superfast broadband (note that we discuss the comparative incentive for an incumbent provider in the following section). This is illustrated below.
A positive producer surplus (expected revenue from the sale of broadband access services less costs) exists only in first three geographic areas (or, geotypes 1-3), which represent approximately 30% of households. For the remaining 70% of households (geotypes 4-8), the producer surplus is negative.
In European countries with less population living in dense urban areas, such as Sweden and France, the case
for extended roll-out is similarly weak. In these countries, a direct commercial incentive exists for less than 20% of households.
We note that in Sweden and France the availability of fast and superfast broadband is already higher than that predicted to be delivered by the model in 2020 (currently 21% and 16% respectively). However, this has been driven by a combination of government intervention, historical artifact and non-financial drivers, rather than the existence of direct commercial incentives. In France, for example, superfast (FTTH) roll-out by non-incumbent operators such as Iliad and NeufCegetel has been fuelled by the bundling of higher value IPTV services with broadband access in urban
13
The Vodafone Policy Paper Series • Number 10 March 2010• Developing Government objectives for broadband
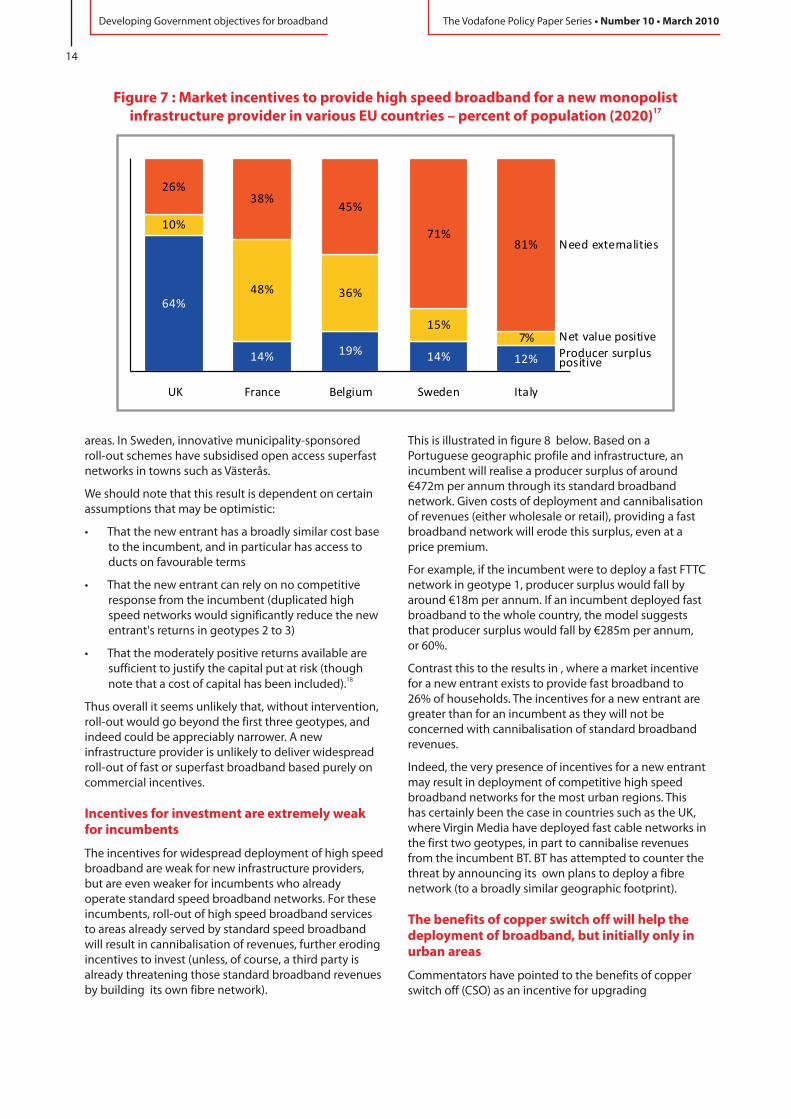
Figure 7 : Market incentives to provide high speed broadband for a new monopolist 17infrastructure provider in various EU countries – percent of population (2020)
64%
14% 19% 14% 12%
10%
48% 36%
15%7%
26%38%
45%
71%81%
UK France Belgium Sweden Italy
Need externalities
Net value positive
Producer surplus positive
areas. In Sweden, innovative municipality-sponsored roll-out schemes have subsidised open access superfast networks in towns such as Västerås.
We should note that this result is dependent on certain assumptions that may be optimistic:
• That the new entrant has a broadly similar cost base to the incumbent, and in particular has access to ducts on favourable terms
• That the new entrant can rely on no competitive response from the incumbent (duplicated high speed networks would significantly reduce the new entrant's returns in geotypes 2 to 3)
• That the moderately positive returns available are sufficient to justify the capital put at risk (though
18note that a cost of capital has been included).
Thus overall it seems unlikely that, without intervention, roll-out would go beyond the first three geotypes, and indeed could be appreciably narrower. A new infrastructure provider is unlikely to deliver widespread roll-out of fast or superfast broadband based purely on commercial incentives.
The incentives for widespread deployment of high speed broadband are weak for new infrastructure providers, but are even weaker for incumbents who already operate standard speed broadband networks. For these incumbents, roll-out of high speed broadband services to areas already served by standard speed broadband will result in cannibalisation of revenues, further eroding incentives to invest (unless, of course, a third party is already threatening those standard broadband revenues by building its own fibre network).
Incentives for investment are extremely weak for incumbents
This is illustrated in figure 8 below. Based on a Portuguese geographic profile and infrastructure, an incumbent will realise a producer surplus of around €472m per annum through its standard broadband network. Given costs of deployment and cannibalisation of revenues (either wholesale or retail), providing a fast broadband network will erode this surplus, even at a price premium.
For example, if the incumbent were to deploy a fast FTTC network in geotype 1, producer surplus would fall by around €18m per annum. If an incumbent deployed fast broadband to the whole country, the model suggests that producer surplus would fall by €285m per annum, or 60%.
Contrast this to the results in , where a market incentive for a new entrant exists to provide fast broadband to 26% of households. The incentives for a new entrant are greater than for an incumbent as they will not be concerned with cannibalisation of standard broadband revenues.
Indeed, the very presence of incentives for a new entrant may result in deployment of competitive high speed broadband networks for the most urban regions. This has certainly been the case in countries such as the UK, where Virgin Media have deployed fast cable networks in the first two geotypes, in part to cannibalise revenues from the incumbent BT. BT has attempted to counter the threat by announcing its own plans to deploy a fibre network (to a broadly similar geographic footprint).
Commentators have pointed to the benefits of copper switch off (CSO) as an incentive for upgrading
The benefits of copper switch off will help the deployment of broadband, but initially only in urban areas
14
The Vodafone Policy Paper Series • Number 10 March 2010•Developing Government objectives for broadband

472454
428 426
380
298
243
192 187
0
100
200
300
400
500
ADSL base case
G1 G1-2 G1-3 G1-4 G1-5 G1-6 G1-7 G1-8
Pro
duce
rsu
rplu
s(€
m)
ADSL plus FTTC in…
Figure 8 : Producer surplus from fast FTTC broadband deployment,19versus base case in Portugal
broadband networks. Migrating all consumers to a high speed (fibre) network and switching off the standard copper network would allow an incumbent to enjoy reduced operating costs and release value from the copper itself, land and buildings.
Based on our analysis, a monopolistic incumbent in a country with, say, a Portuguese topography will have no direct commercial incentives to invest in parallel build of a superfast broadband network. This is illustrated in below, where the incremental producer surplus for parallel build is negative for all geotypes.
If the benefits of CSO are taken into account, and consumers are migrated to the new high speed network on a geotype by geotype basis, the commercial incentives for the incumbent improve. However, the improvement is sufficient to flip the producer surplus positive only for geotype 1 (11% of households in Portugal). In this most dense region an incumbent may be incentivised to roll-out superfast broadband and to transition customers onto a superfast network, but elsewhere the prospect of CSO is insufficient to turn the fibre business case positive.
Multiple providers within a geographic region are likely to erode aggregate producer surplus, since network duplication provides additional cost without direct additional value for the providers. (Note that we have not sought to quantify the impact of competition leading to greater adoption through, for instance,
Competition from multiple networks is likely to adversely impact on total value
greater marketing). This is illustrated in below, based on Germany's geographic profile.
Fast broadband roll-out generates a negative producer surplus for all geotypes even if there is only a single fibre network, but that loss increases significantly if a second network is added. Put another way, the necessary subsidy to incentivise fast broadband roll-out would be much larger.
Of course, in most circumstances it is axiomatic that more competition will ultimately lead to a better outcome for consumers. However, if the effect of competition is to create or increase a negative producer surplus, then in this context it simply increases the subsidy necessary to enable roll-out. Moreover, regulators with an eye to the long term should be seeking to maximise consumer and producer surplus, not just the former.
In different ways, Australia and Singapore's broadband plans recognise the impact of competition on potential fibre roll-out, essentially by creating (to a greater or lesser extent) de-facto monopoly providers of infrastructure, with retail providers riding on top.
Government policies broadly fall into the two main categories: supply side and demand side policies. Our focus in this report is on the supply side - where governments invest in infrastructure or tailor their
22regulatory action so as to improve provision.
Given the lack of clear market incentives, government subsidy may be required to stimulate deployment
15
The Vodafone Policy Paper Series • Number 10 March 2010• Developing Government objectives for broadband

-400
-350
-300
-250
-200
-150
-100
-50
0
50
100
G1 G2 G3 G4 G5 G6 G7 G8
Dif
fere
nce
inPr
od
uce
rSu
rplu
s
vsA
DSL
Bas
eC
ase
(€m
)Parallel Build With CSO
20Figure 9 : Change in producer surplus with and without the benefits of CSO (Portugal)
Given that in most geotypes deployment of higher speed broadband infrastructure results in a producer deficit, particularly for the incumbent, a supply side subsidy may be required to offset the net loss.
In many geotypes, deployment of high speed broadband results in a net producer deficit. To provide a commercial stimulus to infrastructure providers for these regions, a subsidy may be required to offset these deficits. The per-household subsidy requirement will increase for less dense populations.
This is illustrated in Figure 11 below, where the annual subsidy required to offset the producer deficit increases,
The case for subsidy varies by region
Figure 10 : Incremental producer surplus over standard broadband only, one or two 21fast broadband networks, based on German household geotype mix
-
G1 G2 G3 G4 G5 G6 G7 G8-1,800
-1,600
-1,400
-1,200
-1,000
-800
-600
-400
-200
€m
1 network 2 networks
relative to the producer surplus, as coverage of superfast broadband increases.
Given that the case for subsidy varies by region, government intervention through subsidy should therefore, at the very least, be targeted to those regions where the case is strongest:
• In regions where the consumer surplus exceeds the producer deficit, there is a case for subsidy based on consumer surplus alone. In other words, if only private value (consumer and producer surplus) is considered, society would still benefit from government subsidy. In the example above (based on a Belgian geotype profile in 2020) this private value subsidy case applies for the first two geotypes
16
The Vodafone Policy Paper Series • Number 10 March 2010•Developing Government objectives for broadband

0
100
200
300
400
500
G1 G2 G3 G4 G5 G6 G7 G8
€m
Incremental consumer surplus Required subsidy per year
Figure 11 : Consumer surplus and subsidy requirement for23superfast broadband, Belgian geotype profile
only. Thereafter the required subsidy is greater than the consumer value.
•? Beyond this point, consumer surplus alone does not justify the subsidy investment. To justify further subsidy to stimulate wider roll-out, a government must believe there are additional benefits which are not captured in the private transaction – externalities. From an aggregate societal perspective, the wider the deployment is, the greater the externality value that is required to justify the subsidy in each region. In the example above, externalities per connected households in the final, most remote area would have to be €145 per month to justify subsidising roll-out.
Overall, our analysis illustrates the importance of geography in broadband policy. Despite this, regional targeting is, at best, peripheral the broadband policies of most central governments. The European Commission refers to “white”, “black” and “grey” zones based on the number of existing broadband providers, but we believe a more geographically targeted approach should play a much greater role.
Once a decision has been made to roll out to a particular area (either with or without subsidy), societal value will be maximised by signing up all households for whom externalities plus consumer value is greater than the marginal cost to serve. Given the low variable costs of telecoms, this may be virtually all customers. However, to persuade the tail of customers (those with low consumer value) to sign up would require aggressive pricing,
De-averaged prices may provide further investment incentives
which, if applied on a flat rate basis, would likely severely damage the producer surplus. This points to the importance of pricing flexibility or targeted consumer subsidies as tools for maximising societal value.
In our model we assume a flat national price for broadband. This assumption is consistent with actual practice in most countries, with price discrimination very rarely permitted by regulators. However, our analysis implies that in rural areas where the market is unlikely to provide on its own, it may be possible to offset negative producer surplus through higher prices. In other words, allowing higher retail prices in less densely populated areas could act as a partial alternative to government subsidy. This is supported by evidence from Finland, where broadband providers will be expected to fund ubiquitous roll-out without government assistance, but will not be subject to the prohibition of geographic price de-averaging that is prevalent elsewhere.
Whether or not geographic de-averaging is likely to improve market incentives to deploy broadband networks will depend, in part, on the consumer demand curve and whether rural users have higher valuations of broadband. We believe that further research in this area would be beneficial.
Given the costs of deploying broadband infrastructure, trade-offs between breadth of coverage and network capability typically need to be made. From a government's perspective, an important question is therefore what combination of roll-out and network
24capability maximises value.
Trade-offs between coverage and network capability
17
The Vodafone Policy Paper Series • Number 10 March 2010• Developing Government objectives for broadband

There are benefits to ubiquitous rollout of standard broadband, but the case for investment without intervention is unclear
In most EU countries there has been widespread deployment of standard (typically ADSL) broadband. However, there remains a material number of households who do not have broadband coverage of any speed, particularly in rural areas (those above the blue shaded areas) but even in some urban areas (those above the yellow shaded areas).
Policy makers frequently stress the importance of universality of broadband access. Germany intends to reach its entire territory with a 1Mbps service. The United Kingdom has set a target of 2Mbps for ubiquitous access. Last year, Finland passed a law making access to broadband a legal right for its citizens, guaranteeing
26every person access to a 1Mbps broadband connection. The question this raises is what the relative cost and benefits of fulfilling such universal service ambitions are.
Based on a UK infrastructure where broadband is available for 97% of households, we consider the consumer and producer benefits of ubiquitous (100%) deployment of standard broadband. This is illustrated in Figure 13 above.
Our analysis shows that considerable consumer surplus is realised by roll-out to the final 3% of households (before considering externalities). The incremental consumer value also increases over time, driven by falling access prices, crystallisation of demand and increased take-up. Between 2015 and 2020 the total consumer surplus accruing from the final geotype increases from €64m to €70m.
However, whether universal standard speed broadband deployment will be delivered by the market without intervention is less clear.
In 2015, providing standard broadband to the final tranche of the most remote households results in a net loss of €29m per year for a monopolistic supplier. By 2020, producer value increases to a nominal €5m per year thanks to decreased costs and increased demand, but given the certain roll-out costs required (around
28€435m in total capital expenditure to serve the final 3% under a fixed infrastructure) and uncertain demand, it is questionable whether such an approach would be seen as viable by an infrastructure provider.
Given that the producer loss in 2015 is more than offset by the increase in consumer surplus, there is a case for government subsidy in the final 3% based on private value alone. Naturally the case would be even stronger if externalities were factored in, and there may be felt to be particular societal value from enabling universal availability of broadband (e.g. increased social inclusion).
If the combination of consumer benefit and externality value made a compelling case for government intervention to support universality, there remains the question of how it would be most effectively achieved.
Given the significant costs in connecting the most remote households to a fixed broadband infrastructure, alternative wireless technologies may be a more viable mechanism for reaching universality. The Irish
There is a subsidy case for universal roll-out of standard speed broadband, irrespective of the perceived value of externalities
25Figure 12 : Standard broadband coverage in rural areas by European country, 2008
100%
90%
80%
70%
60%50%
40%
30%
20%
10%
0%
Be
lgiu
m
De
nm
ark
Luxe
mb
urg
Net
he
rla
nds
Fran
ceN
orw
ay
Spai
n
UK
Fin
lan
dSl
ove
nia
Swe
de
n
Ge
rman
yP
ort
uga
l
Cze
chR
ep
ub
licH
un
gary
Au
stri
a
DSL coverage in rural areas Gap with DSL national coverage
Est
on
iaIt
aly
Ice
lan
d
Ire
lan
d
Lith
uan
ia
Po
lan
dLa
tvia
Slo
vaki
a
Gre
ece
Cyp
rus
Bu
lga
ria
Ro
man
ia
Mal
ta
n/a
n/a
n/a
18
The Vodafone Policy Paper Series • Number 10 March 2010•Developing Government objectives for broadband

government, for example, has awarded a contract to Hutchison 3G to provide broadband to the final 10% of population. 3 are adopting a hybrid wireless/satellite approach, rolling out HSDPA services to the majority of this 10% and partnering with satellite provider Avanti Communications for the remainder.
Although the benefits of rolling-out standard broadband to the final group of households outweigh the costs, this does not necessarily mean that subsidising basic broadband universality is the value maximizing approach. To test this, it needs to be considered against a range of alternative policies, including further deployment of fast and superfast services.
We compare the required level of subsidy and the corresponding incremental consumer surplus for a range of deployment options, based on a UK infrastructure profile in 2015. We assume the market has already provided fast broadband to the first 38% of households
29(geotypes 1 and 2).
The results are illustrated in Figure 14 below for the following subsidy options :
• Standard broadband to the final 3%
• Fast broadband to the areas where it is not already available, namely geotypes 3, 4 or 5 (where we assume that existing infrastructure providers BT and
Based on the UK infrastructure, providing broadband to the final 3% will yield a higher return than extending fast and superfast broadband coverage
Figure 13 : Producer and consumer surplus per year from deployment of 27standard broadband to the final geotype
€m / yr
Producer surplus Consumer surplus
2015 2020
-29
64
5
70
-40
-20
0
20
40
60
80€m / yr
Producer surplus Consumer surplusProducer surplus Consumer surplus
2015 2020
-29
64
5
70
-40
-20
0
20
40
60
80
Virgin Media will not deploy fast broadband services)
• Superfast broadband to the three most urban geotypes (1, 2 or 3)
Based on the analysis, we find that:
• The most effective approach is to extend the coverage of standard broadband to the final 3% of households. For each €1 of subsidy, €2.25 of incremental consumer value is created.
• Given the existing provision of fast broadband services in the most urban areas (geotypes 1 and 2), the case for investing in superfast broadband services in these regions is very weak. Competition from fast broadband reduces the number of customers for superfast, and moreover reduces the incremental consumer value for those customers (who would otherwise receive the benefits of fast broadband).
• Any remaining subsidy after support for universal standard broadband deployment would be most effectively employed in encouraging deployment of fast broadband services to the most densely populated areas in which it is not already available.
Of course, this analysis ignores the impact of externalities. The question of which approach has the greatest overall societal benefit therefore depends on your perception of the value of externalities under each option. A government would need to believe that the externalities resulting from fast broadband are approximately €5/connected household per month
19
The Vodafone Policy Paper Series • Number 10 March 2010• Developing Government objectives for broadband
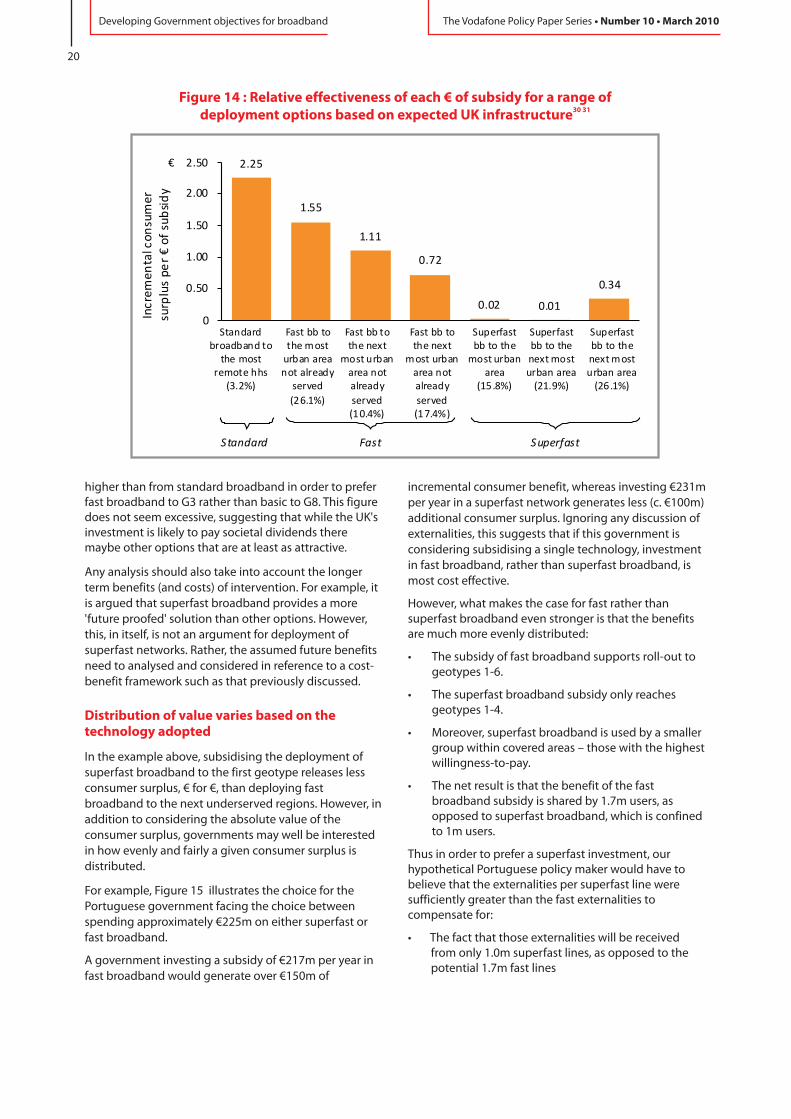
higher than from standard broadband in order to prefer fast broadband to G3 rather than basic to G8. This figure does not seem excessive, suggesting that while the UK's investment is likely to pay societal dividends there maybe other options that are at least as attractive.
Any analysis should also take into account the longer term benefits (and costs) of intervention. For example, it is argued that superfast broadband provides a more 'future proofed' solution than other options. However, this, in itself, is not an argument for deployment of superfast networks. Rather, the assumed future benefits need to analysed and considered in reference to a cost-benefit framework such as that previously discussed.
In the example above, subsidising the deployment of superfast broadband to the first geotype releases less consumer surplus, € for €, than deploying fast broadband to the next underserved regions. However, in addition to considering the absolute value of the consumer surplus, governments may well be interested in how evenly and fairly a given consumer surplus is distributed.
For example, Figure 15 illustrates the choice for the Portuguese government facing the choice between spending approximately €225m on either superfast or fast broadband.
A government investing a subsidy of €217m per year in fast broadband would generate over €150m of
Distribution of value varies based on the technology adopted
incremental consumer benefit, whereas investing €231m per year in a superfast network generates less (c. €100m) additional consumer surplus. Ignoring any discussion of externalities, this suggests that if this government is considering subsidising a single technology, investment in fast broadband, rather than superfast broadband, is most cost effective.
However, what makes the case for fast rather than superfast broadband even stronger is that the benefits are much more evenly distributed:
• The subsidy of fast broadband supports roll-out to geotypes 1-6.
• The superfast broadband subsidy only reaches geotypes 1-4.
• Moreover, superfast broadband is used by a smaller group within covered areas – those with the highest willingness-to-pay.
• The net result is that the benefit of the fast broadband subsidy is shared by 1.7m users, as opposed to superfast broadband, which is confined to 1m users.
Thus in order to prefer a superfast investment, our hypothetical Portuguese policy maker would have to believe that the externalities per superfast line were sufficiently greater than the fast externalities to compensate for:
• The fact that those externalities will be received from only 1.0m superfast lines, as opposed to the potential 1.7m fast lines
2.25
1.55
1.11
0.72
0.02 0.01
0.34
0
0.50
1.00
1.50
2.00
2.50
Fast bb to the most
urban area not already
served
(26.1%)
€
Inc
rem
en
talc
on
sum
er
surp
lus
pe
r€
of
sub
sid
y
Fast bb to the next
most urban area not already
served (10.4%)
Superfast bb to the
most urban area
(15.8%)
Standard broadband to
the most remote hhs
(3.2%)
Standard Fast Superfast
Fast bb to the next
most urban area not already
served (17.4%)
Superfast bb to the next most urban area
(21.9%)
Superfast bb to the next most urban area
(26.1%)
Figure 14 : Relative effectiveness of each € of subsidy for a range of 30 31deployment options based on expected UK infrastructure
20
The Vodafone Policy Paper Series • Number 10 March 2010•Developing Government objectives for broadband

• The €50m greater consumer surplus created by fast broadband
The greater equity in distribution of the fast broadband benefits
In this section of the report, we compare and contrast actual broadband policy from a selected range of countries with outputs (admittedly indicative) from the model, considering countries with ambitions for superfast, fast and standard broadband deployment in turn.
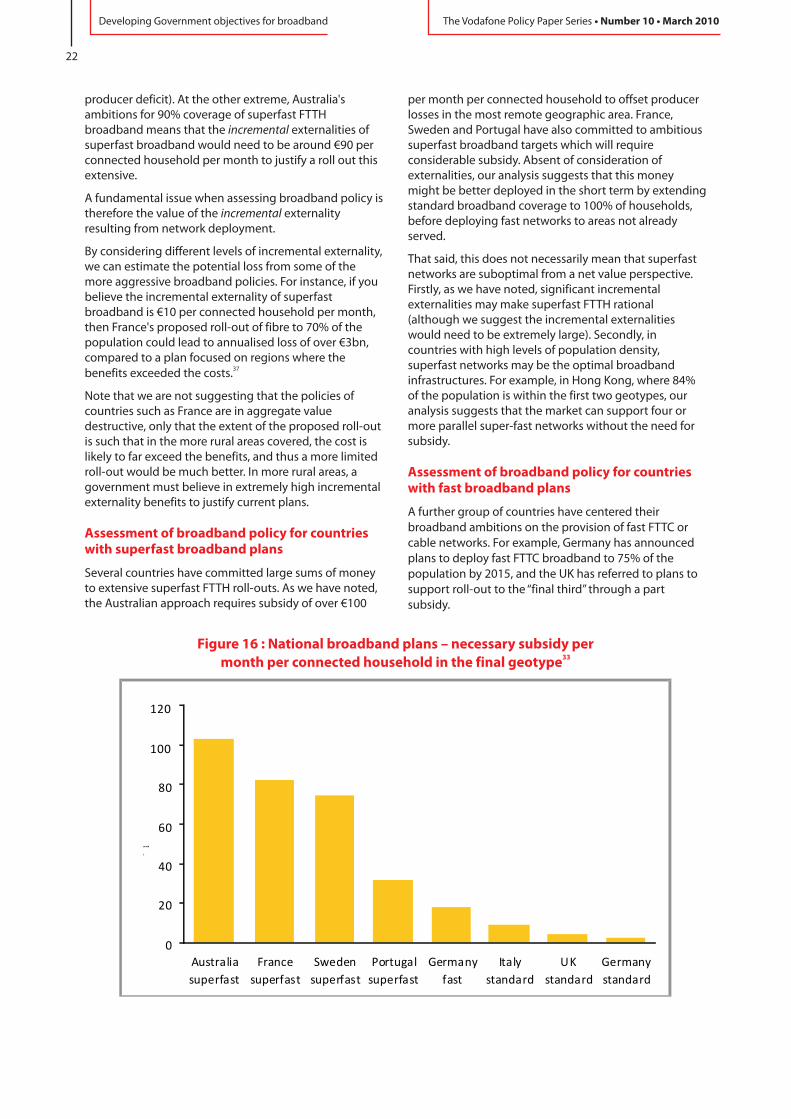
Governments around the world have been addressing the question of broadband roll-out through national broadband policies, which combine coverage targets with regulatory concessions and public subsidy. Based on our model, Figure 16 illustrates the scale of subsidy required to offset the producer deficit created by national broadband plans in the final geographic region served. Countries modelled range from Australia's commitment to 90% super-fast deployment down to Germany's subsidised roll-out of standard broadband to 100% coverage.
In some of the above countries, our model suggests that the incremental consumer surplus created offsets the producer deficit. Therefore, a societally beneficial case for subsidy can be made without recourse to externalities.
For other national broadband plans, consumer surplus alone does not justify the subsidy investment. In such cases, a government must believe there are additional
Assessment of current broadband policy in selected countries
Overview of subsidy requirements, by country
benefits which are not captured in the private transaction – externalities - to justify further subsidy to stimulate wider roll-out.
Through our analysis we have estimated the minimum value of externalities required to justify subsidy investment. This is based on the differential between total value created (producer value plus all consumer value) less all producer costs, as illustrated below.
Figure 18 illustrates the value of externalities required to justify subsidy in the last connected geographic area.
At one extreme, Australia's ambitions for 90% coverage of superfast broadband mean that the incremental externalities of superfast broadband would need to be around €90 per connected household per month to
35justify a roll out this extensive. Given the vast range of capabilities of a standard broadband connection, this seems a very high figure for the further value of superfast broadband.
At the other extreme, the broadband policies for ubiquitous basic broadband roll-out in Italy, the UK and Germany can be justified based on a belief of increased consumer surplus alone (which more than offsets the producer deficit). Indeed, the policies of Italy and the UK, which in the short term focus on the deployment of ubiquitous standard broadband, may be an
36underinvestment . While the externalities are hard to quantify, there is little debate that they exist, and one would expect an optimal level of investment to be associated with an assumption of at least some externalities.
Policies for ubiquitous standard broadband in Italy, the UK and Germany can be justified based on the increased consumer surplus alone (which more than offsets the
Figure 15 : Comparison of consumer surplus generated by government subsidy 32towards fast and superfast broadband infrastructures in Portugal
Fast broadband to geotypes1-6
Superfast broadband to geotypes 1-4
Infrastructure
€217m €231mRequired subsidy per year
4.1m (83%) 2.3m (47%)Coverage
Fast bb: 1.7m (35%) Superfast bb: 1.0m (20%)Estimated take-up of all hhs
20 24
2734
33
3442
41 -
0
40
80
120
160
€m
G6
G5
G4
G3
G2
G1
25
21
The Vodafone Policy Paper Series • Number 10 March 2010• Developing Government objectives for broadband
producer deficit). At the other extreme, Australia's ambitions for 90% coverage of superfast FTTH broadband means that the incremental externalities of superfast broadband would need to be around €90 per connected household per month to justify a roll out this extensive.
A fundamental issue when assessing broadband policy is therefore the value of the incremental externality resulting from network deployment.
By considering different levels of incremental externality, we can estimate the potential loss from some of the more aggressive broadband policies. For instance, if you believe the incremental externality of superfast broadband is €10 per connected household per month, then France's proposed roll-out of fibre to 70% of the population could lead to annualised loss of over €3bn, compared to a plan focused on regions where the
37benefits exceeded the costs.
Note that we are not suggesting that the policies of countries such as France are in aggregate value destructive, only that the extent of the proposed roll-out is such that in the more rural areas covered, the cost is likely to far exceed the benefits, and thus a more limited roll-out would be much better. In more rural areas, a government must believe in extremely high incremental externality benefits to justify current plans.
Several countries have committed large sums of money to extensive superfast FTTH roll-outs. As we have noted, the Australian approach requires subsidy of over €100
Assessment of broadband policy for countries with superfast broadband plans
per month per connected household to offset producer losses in the most remote geographic area. France, Sweden and Portugal have also committed to ambitious superfast broadband targets which will require considerable subsidy. Absent of consideration of externalities, our analysis suggests that this money might be better deployed in the short term by extending standard broadband coverage to 100% of households, before deploying fast networks to areas not already served.
That said, this does not necessarily mean that superfast networks are suboptimal from a net value perspective. Firstly, as we have noted, significant incremental externalities may make superfast FTTH rational (although we suggest the incremental externalities would need to be extremely large). Secondly, in countries with high levels of population density, superfast networks may be the optimal broadband infrastructures. For example, in Hong Kong, where 84% of the population is within the first two geotypes, our analysis suggests that the market can support four or more parallel super-fast networks without the need for subsidy.
A further group of countries have centered their broadband ambitions on the provision of fast FTTC or cable networks. For example, Germany has announced plans to deploy fast FTTC broadband to 75% of the population by 2015, and the UK has referred to plans to support roll-out to the “final third” through a part subsidy.
Assessment of broadband policy for countries with fast broadband plans
Figure 16 : National broadband plans – necessary subsidy per 33month per connected household in the final geotype
120
0
20
40
60
80
100
Australia
superfast
France
superfast
Sweden
superfast
Portugal
superfast
Germany
fast
Italy
standard
UK
standard
Germany
standard
€ per month
22
The Vodafone Policy Paper Series • Number 10 March 2010•Developing Government objectives for broadband

Based on our analysis, this will required subsidy of around €20 per month per connected line in the most remote geographic areas. Given the incremental consumer surplus released, this plan requires policy makers to believe in externalities worth €7 per month per connected household in the final geotype.
Existing research into next generation network externalities seems to suggest that this is not unreasonable. For example, Plum for BSG (2008)
Fully loaded costs
including:
• Depreciation
• Cost of capital
• Operating costs
Consumer
surplus
Producer value
Minimum value
of externalities to justify
deployment
€
€0
34Figure 17 : Overview of approach used to calculate externalities required
0
20
40
60
80
100
€per month
Australia
superfast
France
superfast
Sweden
superfast
Portugal
superfast
Germany
fast
Italy
standard
UK
standard
Germany
standard
Possible over-investment Possible under-investment
estimate £500m/year from spectrum efficiency (though admittedly in the long term), which equates to just over
38 39€4 per connected household per month.
Other countries are relying on the market to deliver fast broadband networks, such as Belgium and, in part, the UK. While, evidently, such an approach does not require public subsidy, it may be overly conservative, constraining the realization of consumer surplus and positive externalities.
Figure 18 : National broadband plans – required externalities per month per connected household
23
The Vodafone Policy Paper Series • Number 10 March 2010• Developing Government objectives for broadband

Assessment of broadband policy for countries with standard broadband plans
Countries aiming to reach standard speed broadband ubiquity include UK, Germany, Italy, Finland, Ireland and many others.
Based on our models, the increase in consumer surplus created by deploying standard broadband to the final
underserved or unserved areas more than offsets the producer deficit. This suggests there is a clear case for subsidy, irrespective of whether policy makers believe in externalities resulting from the deployment.
Furthermore, as our previous analysis based on the UK has illustrated, investment in providing broadband to the final geotypes may actually the most effective approach to deployment.
24
The Vodafone Policy Paper Series • Number 10 March 2010•Developing Government objectives for broadband

We believe there is a strong case for subsidising the roll-out of basic broadband to all households, and generally this should be the first priority for governments (subject to any market specific issues). We note that in many countries policy makers are instead focused on fibre as the prime recipient of government support.
However, if funds are still available after supporting basic broadband, there is also a case for subsidising fast broadband (whether this be FTTC, cable or even mobile) in those areas where the market is not already providing. That said, in areas with lower population density the case becomes highly dependent on the incremental externalities of fast over standard broadband.
While many countries are supporting fast broadband, frequently this does not appear to be targetted to the areas that most need support, and in certain cases the scale of support is such that it is likely pushing into areas with rapidly diminishing returns.
The case for subsidising superfast FTTH or FTTB broadband is weak. To believe it can create greater societal value than fast FTTC broadband requires an aggressive assumption about incremental externalities of superfast over fast broadband, but even then the societal benefits will be much less evenly distributed. Australia is an example of a country that is nonetheless putting massive sums to work to roll FTTH out to 90% of the country.
Based on our analysis, the incremental externalities of superfast over standard broadband in Australia would need to be around €90 per connected household per
40month to justify a roll out this extensive. Given the vast range of capabilities of a standard broadband connection, this seems a very high figure for the further value of superfast broadband.
These are general conclusions that would need to be considered in more detail by individual countries, taking
into account their local circumstances. However, we believe all policy makers should incorporate into their thinking:
• Consideration of the counterfactual. The market is likely to provide improved broadband to at least some parts of the country – these areas should not be the focus of subsidy
•? The time dimension. Both declining costs and maturing consumer demand will expand the number of geotypes for which there is a commercial case to roll out fibre. Immediate subsidy to these areas will accelerate roll-out rather than absolutely enable it, and should be considered in that light
•? The incremental benefits and costs. Basic broadband already provides substantial consumer value and externalities. Investment in overlay fibre networks needs to be justified by the uplift in value and externalities from better speed and performance
• Alternative uses of government funds and potential returns – For instance, even within the broadband arena, demand side stimulus may yield greater value
We recognise that our modelling framework and the analysis provided in this report is only a small first step towards a more rigorous framework for decision making. We believe there are a range of areas where additional analysis could shed further light on broadband policy and the choices faced, some of which are outlined in the appendices to this report.
Overall, we hope that this report has illustrated the value in using a framework for exploring the trade-offs that typically need to be made when formulating broadband policy. We argue that a more structured approach, and greater transparency in setting broadband objectives, will make significant contributions to the debate on optimal broadband deployment.
Conclusions
25
The Vodafone Policy Paper Series • Number 10 March 2010• Developing Government objectives for broadband

Access Economics (2009), Impacts of a national high-speed broadband network, A Report for Telstra Corporation Limited
The Age (2009), Govt rejects cost-benefit analysis in NBN report, see http://www.theage.com.au/technology/technology-news/govt-rejects-costbenefit-analysis-in-nbn-report-20091127-jvm5.html
Allen Consulting Group (2003), True broadband: Exploring the economic impacts
Analysys Mason (2008), The costs of deploying fibre-based next-generation broadband infrastructure, A Report for the Broadband Stakeholder Group
Atkinson, Castro and Ezell (2009), The Digital Road to Recovery: A Stimulus Plan to Create Jobs, Boost Productivity and Revitalize America, Published by The Information Technology and Innovation Foundation
The Berkman Centre (2009), Next Generation Connectivity: A review of broadband Internet transitions and policy from around the world
Commission for Communications Regulation / Comreg (2009), Next Generation Broadband in Ireland: Promoting the Timely and Efficient Deployment of High Speed Broadband Infrastructure and Services
Connected Nation Inc (2008), The Economic Impact of Stimulating Broadband Nationally
Crandall, Robert and Jackson (2001). The $500 Billion Opportunity: The Potential Economic Benefit of Widespread Diffusion of Broadband Internet Access. Criterion Economics LLC.
Crandall R, Lehr W, Litan R (2007), The Effects of Broadband Deployment on Output and Employment: A Cross-Sectional Analysis of US Data
Department for Culture Media and Sport (2009), Digital Britain Final Report, see http://www.culture.gov.uk/images/publications/digitalbritain-finalreport-jun09.pdf
Dutz, Orszag and Willig (2009). The Substantial Consumer Benefits of Broadband Connectivity for US Households. Compass Lexecon for the Internet Innovation Alliance.
Ehrlich (2008), The Reality of Competition in the Broadband Market
Ergas (2009), Cost-Benefit Analysis in Australia: A Threatened Species?
Ergas and Robson (2009), The Social Losses from Inefficient Infrastructure Projects: Recent Australian Experience
Gillett, Lehr, Osorio and Sirbu (2006), Measuring Broadband's Economic Impact, prepared for the US Department of Commerce
Grimes, Ren and Stevens for Motu Economic and Public Policy Research (2009), The Need for Speed: Impacts of Internet Connectivity on Firm Productivity
IDATE (2008), Broadband Coverage in Europe, see http://ec.europa.eu/information_society/eeurope/i2010/docs/benchmarking/broadband_coverage_10_2007.pdf
The Information Technology and Innovation Foundation (2007), The Case for a National Broadband Policy
LECG (2009), Economic Impact of Broadband: An Empirical Study, A Report for Nokia Siemens Networks
Lehr, Osorio, Gillett and Sirbu (2005). Measuring Broadband's Economic Impact, U.S. Department of Commerce, Economic Development Administration (www.eda.gov/ImageCache/EDAPublic/documents/pdfdocs2006/mitcmubbimpactreport_2epdf/v1/mitcmubbimpactreport.pdf)
MICUS Management Consulting Group (2008), The Impact of Broadband on Growth and Productivity, prepared for the European Commission
New Zealand Institute (2007) Defining a broadband aspiration: How much does broadband matter and what does New Zealand need?
Ofcom (2008), What is the value of next generation broadband?
Plum for BSG (2008), A Framework for Evaluating the Value of Next Generation Broadband
Plum (2010), Demand-side measures to stimulate Internet and broadband take-up
Waverman and Dasgupta (2009). Connectivity Scorecard 2009. LECG and Nokia Siemens Networks.
Stiroh (2002), Information Technology and the US Productivity Revival: What Do the Industry Data Say?, American Economic Review Vol 92 No 5, pp. 1559-1576
Varian, Litan, Elder, Shutter (2002), The Net Impact Study: The Projected Economic Benefits of the Internet in the United States, United Kingdom, France and Germany
References
26
The Vodafone Policy Paper Series • Number 10 March 2010•Developing Government objectives for broadband
Notes__________________________________________
1. Julius Genachowski, chairman of the Federal Communications Commission, stated: "broadband is essential to fostering 21st century jobs, investment and economic growth. It's also so important because of the vital role broadband must play in advancing key societal goals in areas like education, health care, energy, public safety, democracy, and small business opportunity." (February 2010)
2. In our model, regions are proxied by 8 different geographic types (“geotypes”), split primarily by population density
3. We note that the majority of analysis to date has been on fixed networks, and do not therefore explicitly consider any incremental benefits of mobile broadband. Given the growing importance of mobile as a complementary means of broadband delivery, we believe this is an important omission in the current body of literature.
4. Geographic areas are referred to in terms of eight 'geotypes', from geotype 1 (the most urban) to geotype 8 (the most rural)
5. Compared to a counterfactual of standard broadband coverage to 97% of households and fast broadband to 38% of household. Assumes that subsidy is equivalent to the producer deficit associated with the infrastructure deployment.
6. The value of annualised loss falls as the assumed externality rises, but does not drop to zero until the externality rises to €70 per connected household per month for France, and around €90 for Australia
7. Fibre to the cabinet
8. FTTH: Fibre to the home. FTTB: Fibre to the building
9. See for instance “Govt rejects cost-benefit analysis in NBN report”, T h e A g e , N o v e m b e r 2 7 , 2 0 0 9 a t http://www.theage.com.au/technology/technology-news/govt-rejects-costbenefit-analysis-in-nbn-report-20091127-jvm5.html
10. Geotypes range from G1: 'major urban' (most dense) through to G8: 'very small exchanges with long lines' (least dense)
11. For example, Australia (100Mbps), Austria (25Mbps), Finland (1 Mbps by 2010, 100 Mbps by 2015), Germany (50 Mbps), Spain (30Mbps), UK (2Mbps, 40-50Mbps).
12. Achieved standard ADSL speed in the UK is typically 45% of the advertised headline speed, which in turn is usually lower than the theoretical maximum; source: Ofcom (2009)
13. The FCC estimates that satellite, mobile and fixed wireless accounted for 36% of “high speed lines” in 2008 and 69% of new lines created between June 2006 and June 2007; source: Ehrlich (2008)
14. Despite this, we note that the majority of analysis of broadband investment has been on wireline rather than wireless networks. We believe this is an important omission in the literature and should be considered a priority for further research, in order to support the investment debate.
15. Discussion of the incremental consumer and producer value associated with fast and superfast broadband is particularly limited, though see Plum for BSG (2008)
16. Assumes aggressive pricing such that the retail price of superfast broadband reflects only a small premium over standard ADSL broadband in 2020. ADSL assumed to be universally available
17. Assumptions as for Figure 6
18. In our model we have assumed a cost of capital of 12% for all broadband deployment. We have not adjusted the cost of capital to reflect higher risk premiums for fast and superfast broadband networks
19. Based on Portuguese geotype profile and infrastructure in 2020. Base case assumes 100% coverage from one standard ADSL broadband network.
20. Based on geotype profile of Portugal and deployment of superfast FTTH in 2020
21. Based on fast broadband retail prices and take-up in 2020, in a country with German geotype profile and deployed alongside one ubiquitous standard ADSL broadband network.
22. We note, however a range of demand side options also exist (for example, improving skills or awareness, subsidising equipment and so on). See Plum (2010) for a more detailed discussion.
23. Based on Belgian geotype profile and infrastructure. Subsidy requirement equivalent to producer deficit for superfast FTTH broadband deployment within each geotype in 2020.
24. There is an argument that broadband can be viewed as a public utility like street lighting, where low variable costs and high externalities argue for it to be funded directly from tax revenues.
25. Source: IDATE, Broadband Coverage in Europe 2008. Note that DSL coverage refers of the percentage of households dependent on an exchange which is equipped with a DSLAM. This figure therefore over-counts broadband availability (some of these homes may be too far from the exchange to obtain a standard ADSL broadband connection)
26. The Finnish example is unusual in that no public funds have been allocated to subsidise the USO roll-out. Instead, Finnish operators are not required to geographically average their retail prices, as is the case in the rest of Europe. As a result, providers such as Sonera, the incumbent, may vary their fees in rural areas in order to charge the value-maximising price that best offsets the costs of roll-out to the final 4% of households
27. Based on a UK geotype profile and infrastructure in 2015 and 2020. Assumes no fast or superfast broadband is available to the final 3% of households.
28. Source: Ingenious Consulting Network estimate based on Analysys Mason (2008) cost forecasts. Our analysis assumes costs that are equivalent to FTTC broadband since these locations are typically too far from exchanges to receive standard ADSL services. The 2009 Digital Britain report states that “to address these remaining homes [those without 2Mbps connections] will require a mix of professionally assisted consumer home solutions, professional home engineered solutions, fixed network engineered solutions, and wireless network engineered solutions (including satellite)” and that approximately 420k UK homes could be connected by “long telephone line resolved by FTTC upgrade”.
29. This broadly represents the expected broadband infrastructure in the UK in 2015 given BT and Virgin Media deployment plans for higher speed broadband services
30. Based on a UK geotype profile in 2015. Compared to a counterfactual of standard broadband coverage to geotype 7 (available to 97% of households) and fast broadband to geotype 2 (available to 38% of households). Assumes that subsidy is equivalent to the producer deficit associated with the infrastructure deployment.
31. For any broadband policy where the incremental consumer surplus per € of subsidy is greater than one, there is a case for subsidy without the need to consider the value of externalities. Where the value is less than one, you need to believe in the presence of externalities to justify the subsidy investment.
32. Based on a Portuguese geotype profile in 2020. Compared to a counterfactual of standard broadband only (i.e. assumes that there is no existing fast or superfast broadband available). Assumes that subsidy is equivalent to the producer deficit associated with infrastructure deployment.
33. Assumed to be equivalent to the value of the producer deficit in the final connected geotype; in other words, the subsidy required to provide a commercial incentive for deployment, absent of additional motivations (competitive advantage) or a “deadweight loss” to intervention.
27
The Vodafone Policy Paper Series • Number 10 March 2010• Developing Government objectives for broadband

34. Note that our analysis does not take into account non-financial consumer costs or any “deadweight” loss resulting from intervention.
35. The deficit includes the loss of contribution from standard broadband subscribers, resulting from their migration to the new superfast broadband network
36. We recognise the UK's longer term policies to support fast broadband to more rural locations (the UK government's Final Third Project).
37. The value of annualised loss falls as the assumed externality rises, but does not drop to zero until the externality rises to €70 per connected household per month for France, and around €90 for Australia
38. Assuming take-up by 40% of household who have access to the superfast network
39. Although we should note that these potential benefits of spectrum release could also be obtained through other means, and not solely broadband deployment (e.g. the growth of satellite broadcasting alongside digital terrestrial)
40. Taking into account the loss of revenue from the migration of standard ADSL broadband households to the new network
28
The Vodafone Policy Paper Series • Number 10 March 2010•Developing Government objectives for broadband


![DEVELOPING SERVICES FOR M GOVERNMENT[1]](https://img.pdfslide.us/doc/110x75/61ae814ae9716e4565758011/developing-services-for-m-government1.jpg)