Embed Size (px)
Citation preview
Developing Future Social Protection SystemsRetirement Income
Sustainability, Risks and Challenges of Current Retirement Income Schemes

© World Economic Forum
2013 - All rights reserved.
No part of this publication may be reproduced or transmitted in any form or by any means,
including photocopying and recording, or by any information storage and retrieval system.
The views expressed are those of certain participants in the discussion and do not necessarily
reflect the views of all participants or of the World Economic Forum.
Developing Future Social Protection Systems Retirement Income | iii
Preface
Social security systems around the world – in developed
countries and emerging markets alike – are facing substantial
challenges as a result of changing demographics, fiscal
constraints, economic instability and volatile financial
markets. There is a need to not only address the long-term
problems associated with these challenges, but also take
short-term action.
Many developing countries are confronted with the
challenge of introducing or expanding social protection
systems and subsequent design options. This has a huge
impact on the financial services industry as its products and
services may help to mitigate these challenges. At the same
time, the financial services industry itself is strongly affected
by this adverse environment. Different strategies and
solutions for social protection systems exist, mostly depending
on historical legacies.
While there is a need for reform in many countries,
there is also a clear opportunity to learn from successful
models. Even though the problems have been known for
a long time, and a variety of reform proposals exist, the
political cycle can be rather short term. Against this backdrop,
reforming social protection systems is a challenging task.
It requires foremost intertemporal consistency based on a
sustainable intergenerational social contract. There also must
be greater clarity and a new social compact about the relative
responsibilities of the state, community, private enterprise
and the individual.
The need for reform goes beyond short-term political
sparring, and there will surely be increased focus on disparities
between different national solutions. Solutions currently
provided by the financial services industry are certainly not
a panacea, but there are potential benefits derived from a
long-term partnership between the financial services industry
and the public sector.
As the entire social security protection system topic
would by far go beyond the scope of one report, this paper
will focus on retirement income and, in particular, on the
sustainability and risks of pension systems. It does not
discuss coverage and income adequacy in retirement, nor
financing of healthcare in old age. Although these are very
important topics, they are much broader than this report
could do justice given the constraints with respect to time,
length and resources.
The World Economic Forum’s Financial Services Team
would like to convey its sincere gratitude to the industry
and international organization experts convened in the
project’s Operational and Steering Committees who contributed
valuable input to this report. We especially wish to thank
Craig Aitchison, Daniel Hofmann and Daniel Ryan who served
on the project’s editorial working group. Special thanks also
go to Richard Jackson for his extensive support of the editorial
working group, and we thank Allianz and Swiss Re for
providing data and insights based on their previous analyses
and publications. We hope that you find this report insightful
and a helpful reference for understanding the current
risks and challenges for various stakeholders in retirement
income schemes.
iv | Developing Future Social Protection Systems Retirement Income
Contributors
Steering Committee memberS
Arup banerji, The World Bank
Joachim Faber, Allianz Global Investors
Linda Fried, Columbia University
rafael gil-tienda, Oliver Wyman
baroness Sally greengross, International Longevity
Center – UK
Kevin Hogan, Zurich Insurance Group
Donald Kanak, Prudential
Andrew Komaroff, Neuberger Berman Group
Hans-Horst Konkolewsky, International Social Security
Association
Alison martin, Swiss Re
ralph mupita, Old Mutual
Vinicius Pinheiro, International Labour Organization
Filippo Sabatini, Citi
nick Sherry, former Australian Minister
Xiulan Zhang, School of Social Development and
Public Policy
obSerVerS
Alan milligan, CalPERS
Frank todisco, US Government Accountability Office
oPerAtionAL Committee
mukul Asher, National University of Singapore
Craig Aitchison, Old Mutual
Solange berstein, Superintendent of Pension Funds Chile
richard blewitt, HelpAge International
Adam bryan, DTCC
miles Celic, Prudential
martha J. Deevy, Stanford Center on Longevity
Volker Deville, Allianz
Daniel Hofmann, Zurich Insurance Group
richard Jackson, CSIS Global Aging Initiative
Scott Kilgallen, Neuberger Berman Group
michael Lake, International Longevity Center – UK
Hanno mijer, Zurich Insurance Group
robert Palacios, World Bank
Daniel ryan, Swiss Re
Jens Schremmer, International Social Security Association
Vanessa Wang, Citi
edward Whitehouse, OECD
ProJeCt teAm
giancarlo bruno, World Economic Forum
michael Koenitzer, World Economic Forum
Abel Lee, World Economic Forum
Daniel gregor, World Economic Forum (from Allianz)
mirko Zeidler, World Economic Forum (from Allianz)
Frank Pfeuffer, World Economic Forum (from Allianz)
DiSCLAimer
The members of the Steering Committee and the Operational
Committee support most of the recommendations and views
expressed in this report. However, they do not all necessarily
agree on every detailed point. The opinions expressed are
personal and do not necessarily reflect the position of their
organizations.
Developing Future Social Protection Systems Retirement Income | 1
1 executive Summary ...................................................... 3
2 retirement income – the global Challenge ................ 5
2.1 Challenges of Diverse Economies ............................. 5
2.2 The Five Pillars of Modern Retirement Systems ........ 5
2.3 Stakeholder Roles and their Expectations ................ 7
2.4 Pillars and Associated Fiscal, Longevity
and Investment Risks ............................................... 9
3 review of Current retirement Funding Pillars .......... 11
3.1 Introducing Indicators for Pillars 1 through 4 ........... 11
3.2 Fiscal Sustainability and Income Adequacy in
the Four Pillars ....................................................... 11
3.3 Interpreting the Traffic Lights .................................. 16
4 risks, Challenges and opportunities of Current
retirement income Systems ...................................... 17
4.1 Demographic Trends and Challenges ..................... 17
4.2 Employment Trends and Challenges ...................... 17
4.3 Economic and Financial Trends and Challenges ..... 19
4.4 Political and Socioeconomic Trends and
Challenges ............................................................. 20
4.5 Behavioural Trends and Challenges ........................ 20
5 Stakeholders’ outcomes ............................................ 23
5.1 Employers .............................................................. 23
5.2 Individuals .............................................................. 23
5.3 Government ........................................................... 23
5.4 Financial Services Industry ..................................... 25
5.5 All Stakeholders Part of Solution ............................ 26
6 Appendix ..................................................................... 27
6.1 Stakeholder Roles .................................................. 27
6.2 Country Clustering Table ........................................ 28
6.3 Pillar Indicators – Colour Coding Rationale ............. 30
Contents

2 | Developing Future Social Protection Systems Retirement Income
Developing Future Social Protection Systems Retirement Income | 3
1 executive Summary
Economic growth is a fundamental basic requirement to
secure sustainable retirement incomes. However, the current
global financial crisis has shown once again that market-
based economies have and will always experience business
cycles and at times severe financial market disruptions.
The past has also shown that in order to secure the
living standard of retirees, the incomes of the retired population
have to draw from diversified sources. This report focuses
on the sustainability of the various sources – or pillars – of
current retirement systems, and it analyses the inherent risks
arising from various challenges, such as demographic changes,
economic business cycles and financial market volatility.
This report builds on an amended four-pillar system
that was first published by the World Bank. In chapter 3,
each pillar is assessed on basic economic indicators chosen
to evaluate the fiscal sustainability of the pillar under
consideration in 36 countries. A simple “traffic light” system
grades the indicators, illustrating the sustainability of each
particular pillar.
based on the pillar analysis, the report offers four
main conclusions:
1. No pillar is free of either fiscal sustainability challenges
or income adequacy deficiencies; all countries will
eventually have to cope with pillar weakness.
2. While demographic challenges and fiscal sustainability
issues are most visible in the typically government-funded
(pay-as-you-go) Pillar 1, Pillar 2 (employer-sponsored
pension funds) and Pillar 3 (individually funded saving
schemes) make individual retirees more vulnerable to
longevity and investment risks. Effective design of
retirement schemes shall combine in a complementary
and consistent way a portfolio of measures in the
different pillars with the aim to minimize risks, expand
coverage where appropriate and necessary, and ensure
benefit adequacy as well as financial sustainability.
3. In Pillars 2 and 3, longevity and investment risks will
increasingly be shifted to individual retirees. However, in
most cases, retirees are ill-prepared to absorb and
manage these risks.
4. Among the many stakeholders, the financial services
industry, and in particular insurers and pension providers,
will have to play a key role in providing solutions that
increase the capacity and manage the risks of Pillars 2 and 3.
The challenges facing retirement systems around the
world may sound insurmountable, but there is no reason
for despair. Time and the marvels of compound interest work
in favour of courageous and prudent policy-makers. Small
and judicious changes implemented today will reap big
dividends in the future. Yet, changes will become reality only
if the stakeholders of current retirement income schemes
change their attitude and commitment. To secure a sustainable
system, improved collaboration of all stakeholders is mandatory.

4 | Developing Future Social Protection Systems Retirement Income
Developing Future Social Protection Systems Retirement Income | 5
2 retirement income – the global Challenge
2.1 Challenges of Diverse economies
Retirement systems around the world are under pressure.
In both advanced market economies (AMEs) and emerging
market economies (EMEs), rising life expectancy and declining
fertility – in short, ageing populations – are throwing into
question the financial sustainability and societal acceptance
of current retirement schemes. With an absence of fundamental
and credible reforms, many countries may sooner than later
reach the limits of providing adequate financial security
for their retired populations without placing an undue and
ultimately inequitable burden on younger generations.
While the looming demographic challenge facing
retirement systems has been known for a long time, the
current financial crisis has exacerbated the problem and
raised the urgency of reform. The prices of financial and real
assets – the backbone of all funded pension schemes – have
sharply declined and are only in a few cases approaching
pre-crisis levels.
Most AMEs suffered severe recessions from which
recoveries have been slow. This in turn has undermined
the tax base that supports pay-as-you-go (PAYG) pension
systems. In light of continued deleveraging, particularly in the
banking sector (but also in countries where the household
sector has been over indebted), real economic growth is likely
to remain subdued for an extended period, stifling the wealth
creation needed to support future retirement payments.
Meanwhile, the run-up in public indebtedness in many AMEs
has further limited the fiscal room that governments have to
adjust to rising retirement costs as populations age.
The challenges are not limited to advanced market
economies. They also include emerging market economies
(EMEs) and developing countries, where retirement systems
are either still in their infancy or have not been developed at
all. While many developed countries “got rich before they
got old”, there is the risk that some emerging countries
are getting old before getting rich. Also, in many emerging
economies, social protection, including retirement support,
is restricted to a small, privileged population.
The challenge these countries face is thus different
than that facing AMEs. They must broaden their social
protection systems to provide inclusiveness while ensuring
that they remain sustainable. This will require putting in place
adequate state-financed social protection floors, while at the
same time gradually implementing higher levels of coverage
based on a balanced portfolio of pillars one through four.
It requires also appropriate market structures and regulatory
frameworks that encourage individual savings and funded
retirement systems provided by the private sector.
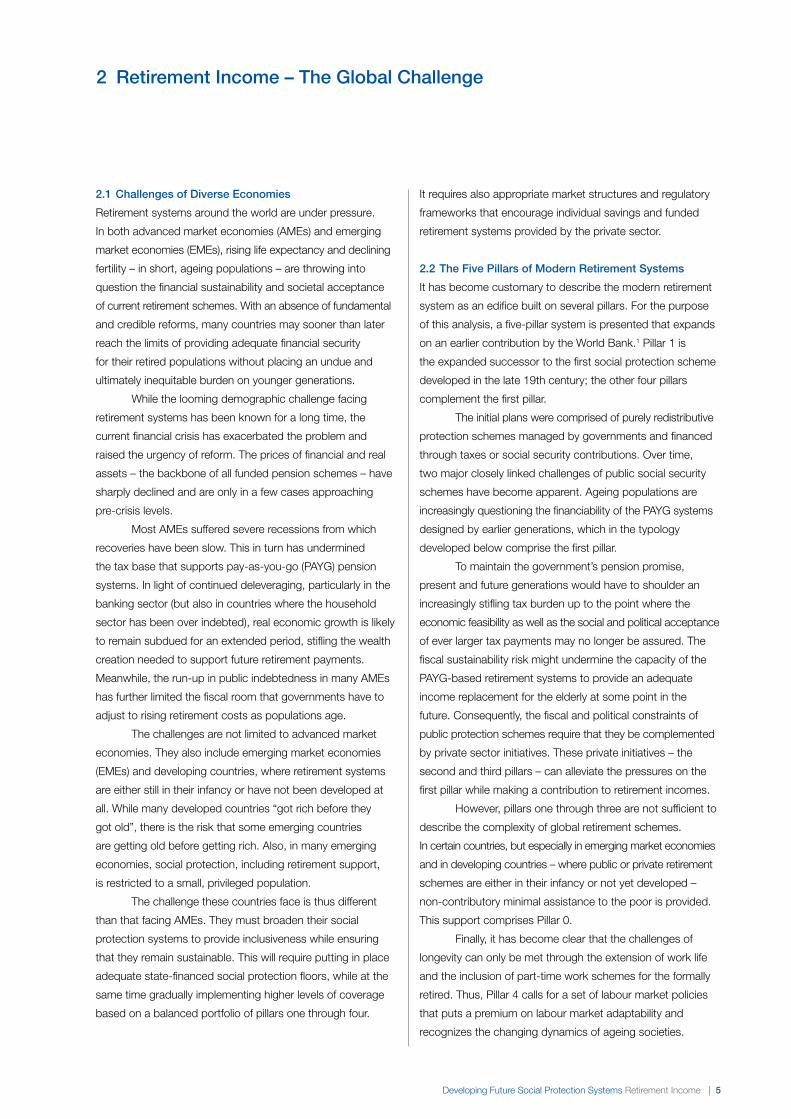
2.2 the Five Pillars of modern retirement Systems
It has become customary to describe the modern retirement
system as an edifice built on several pillars. For the purpose
of this analysis, a five-pillar system is presented that expands
on an earlier contribution by the World Bank.1 Pillar 1 is
the expanded successor to the first social protection scheme
developed in the late 19th century; the other four pillars
complement the first pillar.
The initial plans were comprised of purely redistributive
protection schemes managed by governments and financed
through taxes or social security contributions. Over time,
two major closely linked challenges of public social security
schemes have become apparent. Ageing populations are
increasingly questioning the financiability of the PAYG systems
designed by earlier generations, which in the typology
developed below comprise the first pillar.
To maintain the government’s pension promise,
present and future generations would have to shoulder an
increasingly stifling tax burden up to the point where the
economic feasibility as well as the social and political acceptance
of ever larger tax payments may no longer be assured. The
fiscal sustainability risk might undermine the capacity of the
PAYG-based retirement systems to provide an adequate
income replacement for the elderly at some point in the
future. Consequently, the fiscal and political constraints of
public protection schemes require that they be complemented
by private sector initiatives. These private initiatives – the
second and third pillars – can alleviate the pressures on the
first pillar while making a contribution to retirement incomes.
However, pillars one through three are not sufficient to
describe the complexity of global retirement schemes.
In certain countries, but especially in emerging market economies
and in developing countries – where public or private retirement
schemes are either in their infancy or not yet developed –
non-contributory minimal assistance to the poor is provided.
This support comprises Pillar 0.
Finally, it has become clear that the challenges of
longevity can only be met through the extension of work life
and the inclusion of part-time work schemes for the formally
retired. Thus, Pillar 4 calls for a set of labour market policies
that puts a premium on labour market adaptability and
recognizes the changing dynamics of ageing societies.
6 | Developing Future Social Protection Systems Retirement Income
2 Retirement Income – The Global Challenge
In certain cases, the fourth pillar may include also
support provided by extended families, typically seen in
developing countries with extended informal sectors and
underdeveloped public and private retirement schemes.
However, the dynamics of family support are entirely different
from the set of labour market policies typically discussed
as Pillar 4 contributions. Moreover, family support, similar to
PAYG systems (and different from the funded schemes of
Pillars 2 and 3), puts a burden on the young. This report will
be concerned mainly with labour market policies as
constitutional elements of Pillar 4 and discuss extended family
support only in passing.
The table below provides a synopsis of the five pillars
developed for this analysis. A detailed discussion of pillars
one through four is presented in Chapter 3. Policies related to
the fourth pillar are likely to cut across and have implications
for; all other pillars (the extension of the work life, for example,
will relieve actuarial funding pressures on Pillars 1 and 2).
They will be discussed in more detail in Chapter 5. Although
crucially important, especially in emerging markets economies
and developing countries, Pillar 0 will not be discussed in
more detail in this study.
Certain retirement schemes developed by individual
countries do not always fit neatly into the five pillars as
defined in Table 1. In 1980, for example, Chile’s old-age,
disability and survivor pension system was changed from a
PAYG to a fully funded system run by private sector pension
funds. The funding mechanics make the Chilean solution a
functional equivalent of Pillar 3. However, it was clearly meant
as the equivalent of the Pillar 1 scheme it replaced. In 2008,
Chile’s pensions were reformed again to correct for deficiencies
of the then almost 30-year-old system. One main reform
element comprised the introduction of a tax-funded solidary
pension in the form of a social protection floor to support
elderly citizens who do not have access to a private pension
on a defined minimum level.2
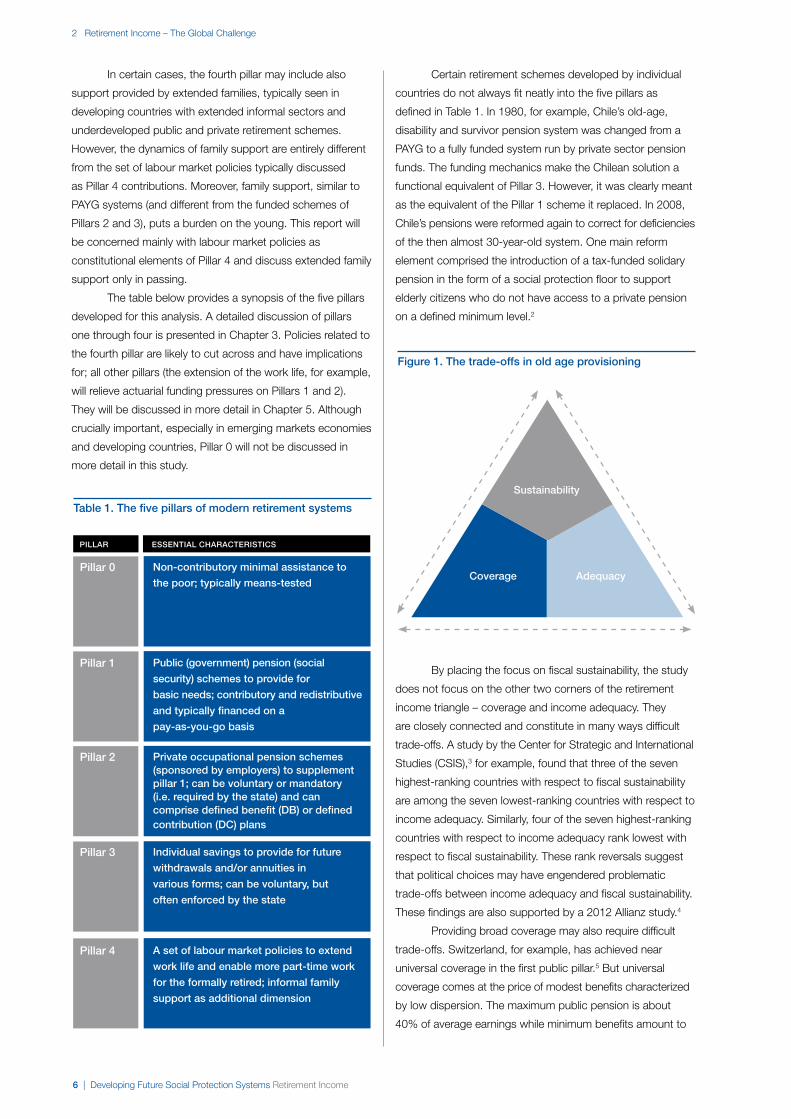
By placing the focus on fiscal sustainability, the study
does not focus on the other two corners of the retirement
income triangle – coverage and income adequacy. They
are closely connected and constitute in many ways difficult
trade-offs. A study by the Center for Strategic and International
Studies (CSIS),3 for example, found that three of the seven
highest-ranking countries with respect to fiscal sustainability
are among the seven lowest-ranking countries with respect to
income adequacy. Similarly, four of the seven highest-ranking
countries with respect to income adequacy rank lowest with
respect to fiscal sustainability. These rank reversals suggest
that political choices may have engendered problematic
trade-offs between income adequacy and fiscal sustainability.
These findings are also supported by a 2012 Allianz study.4
Providing broad coverage may also require difficult
trade-offs. Switzerland, for example, has achieved near
universal coverage in the first public pillar.5 But universal
coverage comes at the price of modest benefits characterized
by low dispersion. The maximum public pension is about
40% of average earnings while minimum benefits amount to
table 1. the five pillars of modern retirement systems
PiLLAr eSSentiAL CHArACteriStiCS
Pillar 0 non-contributory minimal assistance to
the poor; typically means-tested
Pillar 1 Public (government) pension (social
security) schemes to provide for
basic needs; contributory and redistributive
and typically financed on a
pay-as-you-go basis
Pillar 2 Private occupational pension schemes (sponsored by employers) to supplement pillar 1; can be voluntary or mandatory (i.e. required by the state) and can comprise defined benefit (Db) or defined contribution (DC) plans
Pillar 3 individual savings to provide for future
withdrawals and/or annuities in
various forms; can be voluntary, but
often enforced by the state
Pillar 4 A set of labour market policies to extend
work life and enable more part-time work
for the formally retired; informal family
support as additional dimension
Figure 1. the trade-offs in old age provisioning
Sustainability
Coverage Adequacy
Developing Future Social Protection Systems Retirement Income | 7
2 Retirement Income – The Global Challenge
20%. And because minimum public benefits are below the
official poverty line, they are supplemented with means-tested
benefits. However, it is important to recognize that the total
income of Swiss retirees does not depend only on modest
public benefits. In addition to the first pillar, Switzerland has
introduced a compulsory, extensively funded occupational
pillar that aims at achieving a 60% to 70% replacement rate
for most workers.
These examples illustrate that resolving the tensions
inherent in the retirement income triangle require difficult
trade-offs extending over all pillars. It would be naïve to
assume that universal coverage, adequate incomes and
fiscal sustainability could be achieved on the basis of only
one pillar. At the same time, there is no reason for favouring
one pillar over another, and there may be good political
reasons to prefer the bulk of retirement incomes to come
from publicly funded pillars.
This study, however, argues that public PAYG retirement
funding systems may eventually become fiscally unsustainable
for demographic reasons and should consequently be
complemented by additional pillars. The study also recognizes
that ageing-related sustainability issues tend to be more
challenging in advanced market economies than in the
demographically younger emerging markets. For these reasons,
the study focuses on AMEs rather than EMEs, bearing in
mind those EMEs and low-income countries in particular are
still in early stages of building retirement income systems.
2.3 Stakeholder roles and their expectations
To tackle the challenges posed by ageing and the fiscal
limitations of government, future retirement systems will have
to be based on balanced contributions from all five pillars.
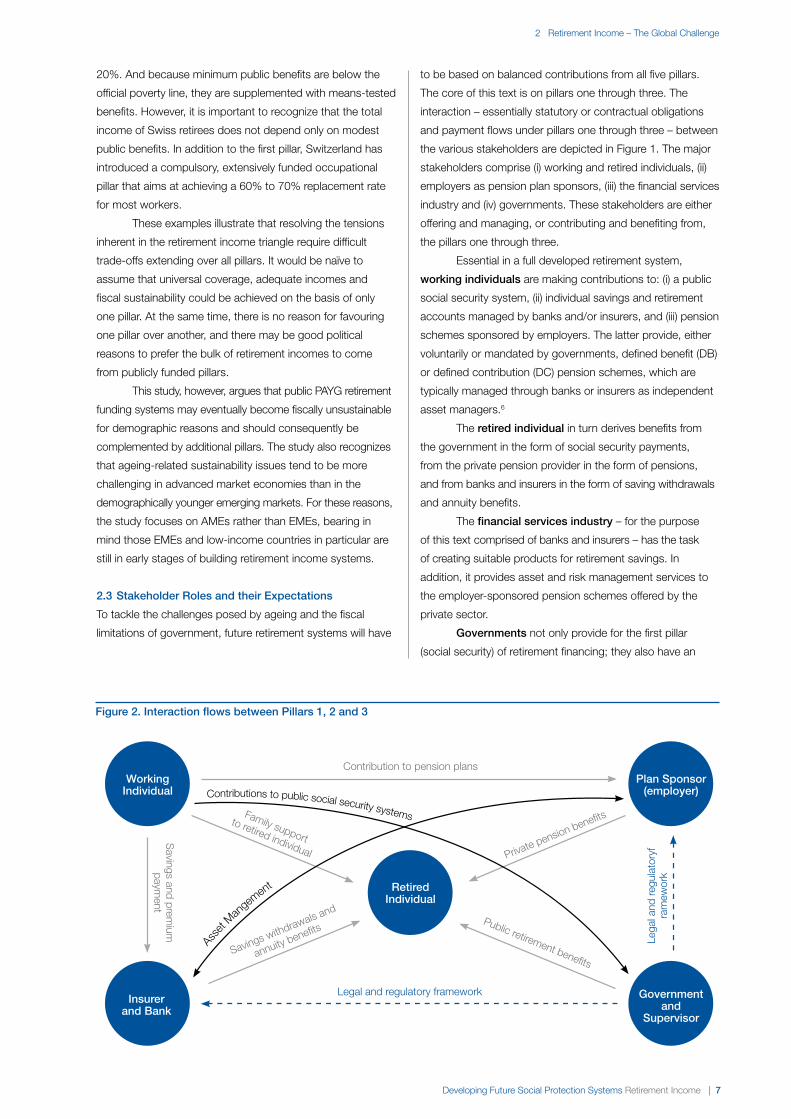
The core of this text is on pillars one through three. The
interaction – essentially statutory or contractual obligations
and payment flows under pillars one through three – between
the various stakeholders are depicted in Figure 1. The major
stakeholders comprise (i) working and retired individuals, (ii)
employers as pension plan sponsors, (iii) the financial services
industry and (iv) governments. These stakeholders are either
offering and managing, or contributing and benefiting from,
the pillars one through three.
Essential in a full developed retirement system,
working individuals are making contributions to: (i) a public
social security system, (ii) individual savings and retirement
accounts managed by banks and/or insurers, and (iii) pension
schemes sponsored by employers. The latter provide, either
voluntarily or mandated by governments, defined benefit (DB)
or defined contribution (DC) pension schemes, which are
typically managed through banks or insurers as independent
asset managers.6
The retired individual in turn derives benefits from
the government in the form of social security payments,
from the private pension provider in the form of pensions,
and from banks and insurers in the form of saving withdrawals
and annuity benefits.
The financial services industry – for the purpose
of this text comprised of banks and insurers – has the task
of creating suitable products for retirement savings. In
addition, it provides asset and risk management services to
the employer-sponsored pension schemes offered by the
private sector.
governments not only provide for the first pillar
(social security) of retirement financing; they also have an
Figure 2. interaction flows between Pillars 1, 2 and 3
Working individual
insurerand bank
Plan Sponsor(employer)
governmentand
Supervisor
Contribution to pension plans
S
avings and premium
paym
ent
Legal and regulatory framework
Lega
l and
regu
lato
ryf
ram
ewor
k
retiredindividual
Savings withdrawals and
annuity benefitsPublic retirement benefits
Private pension benefitsFamily support
to retired individual
Contributions to public social security systems
Ass
et Man
gemen
t
8 | Developing Future Social Protection Systems Retirement Income
2 Retirement Income – The Global Challenge
important role in setting the regulatory framework for sound
and stable financial markets. While supervisors used to
be primarily concerned about policyholder protection (the
micro-prudential dimension of supervision), the current
financial crisis underscored that micro-prudential supervision
should be embedded in a broader systemic context. It must
be complemented by macro-prudential surveillance designed
to identify the build-up of systemic risk and mitigate adverse
consequences.
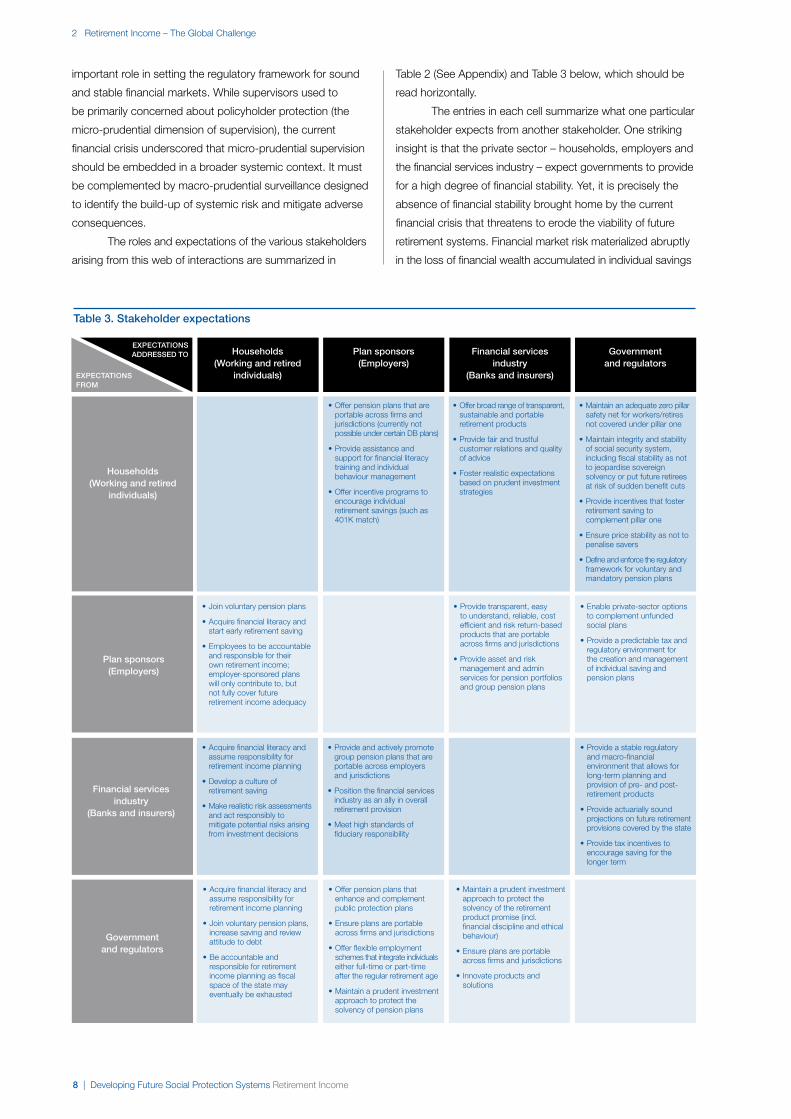
The roles and expectations of the various stakeholders
arising from this web of interactions are summarized in
Table 2 (See Appendix) and Table 3 below, which should be
read horizontally.
The entries in each cell summarize what one particular
stakeholder expects from another stakeholder. One striking
insight is that the private sector – households, employers and
the financial services industry – expect governments to provide
for a high degree of financial stability. Yet, it is precisely the
absence of financial stability brought home by the current
financial crisis that threatens to erode the viability of future
retirement systems. Financial market risk materialized abruptly
in the loss of financial wealth accumulated in individual savings
table 3. Stakeholder expectations
eXPeCtAtionS From
eXPeCtAtionS ADDreSSeD to Households
(Working and retired individuals)
Plan sponsors (employers)
Financial services industry
(banks and insurers)
governmentand regulators
Households (Working and retired
individuals)
Plan sponsors (employers)
Financial services industry
(banks and insurers)
governmentand regulators
• Join voluntary pension plans
• Acquire financial literacy and start early retirement saving
• Employees to be accountable and res pon sible for their own retirement inco me; employer-sponsored plans will only contribute to, but not fully cover future retirement income adequacy
• Offer pension plans that are portable across firms and jurisdictions (currently not possible under certain DB plans)
• Provide assistance and support for financial literacy training and individual behaviour management
• Offer incentive programs to encourage individual retirement savings (such as 401K match)
• Offer broad range of transparent, sustainable and portable retirement products
• Provide fair and trustful customer relations and quality of advice
• Foster realistic expectations based on prudent investment strategies
• Maintain an adequate zero pillar safety net for workers/retires not covered under pillar one
• Maintain integrity and stability of social security system, including fiscal stability as not to jeopar dise sovereign solvency or put future retirees at risk of sudden benefit cuts
• Provide incentives that foster retirement saving to complement pillar one
• Ensure price stability as not to penalise savers
• Define and enforce the regulatory framework for voluntary and mandatory pension plans
• Provide transparent, easy to understand, reliable, cost efficient and risk return-based products that are portable across firms and jurisdictions
• Provide asset and risk management and admin services for pension portfolios and group pension plans
• Enable private-sector options to com ple ment unfunded social plans
• Provide a predictable tax and regulatory environment for the creation and mana ge ment of individual saving and pen si on plans
• Acquire financial literacy and assume responsibility for retirement income plan ning
• Develop a culture of retire ment saving
• Make realistic risk assessments and act res ponsibly to mitigate potential risks arising from investment decisions
• Provide and actively promote group pension plans that are portable across employers and jurisdictions
• Position the financial services industry as an ally in overall retirement provision
• Meet high standards of fiduciary respon si bility
• Provide a stable regulatory and macro-fi nancial environment that allows for long-term planning and provision of pre- and post- retirement products
• Provide actuarially sound projections on future retirement provisions covered by the state
• Provide tax incentives to encourage saving for the longer term
• Acquire financial literacy and assume responsibility for retirement income plan ning
• Join voluntary pension plans, increa se saving and review attitude to debt
• Be accountable and res pon sible for retirement inco me planning as fiscal space of the state may eventually be exhausted
• Offer pension plans that enhance and com ple ment public protection plans
• Ensure plans are portable across firms and jurisdictions
• Offer flexible employment schemes that integrate individuals either full-time or part-time after the regular retirement age
• Maintain a prudent investment approach to protect the solvency of pension plans
• Maintain a prudent investment approach to protect the solvency of the retirement product promise (incl. financial disci pline and ethical behaviour)
• Ensure plans are portable across firms and jurisdictions
• Innovate products and solutions
Developing Future Social Protection Systems Retirement Income | 9
2 Retirement Income – The Global Challenge
and pension funds. These losses are now borne by current
and future retirees.
Moreover, to reduce fiscal deficits and future debt
loads, a number of governments have announced or
implemented plans to adjust replacement rates and reduce
social security benefits. While designed to provide for more
fiscal stability, the measures place the burden of, and the
risks associated with, retirement provisioning on individual
households. The risks associated with Pillars 1-3 are
discussed in the next sub-section.
2.4 Pillars and Associated Fiscal, Longevity and
investment risks
Retirement financing schemes extend over very long time
horizons. Working individuals may make payments into social
security systems, pension schemes and individual retirement
plans for more than 40 years, and they subsequently expect
to receive benefits and draw from the accumulated funds
for an extended period. These long time horizons introduce
a number of risks.
1. Economies are subject to business cycles, which can
make lifetime employment impossible.
2. Financial markets tend to suffer periodic crises. The
investment risk associated with these crises reduces, at
least temporarily, the value of accumulated funds and
jeopardizes the feasibility of the original retirement
financing plan.
3. Rising life expectancy introduces longevity risk, i.e. the
risk that an individual may outlive his or her retirement funds.
4. And there is fiscal risk, i.e. the risk that pose constraints
to the governments’ ability to maintain the social
security promise.
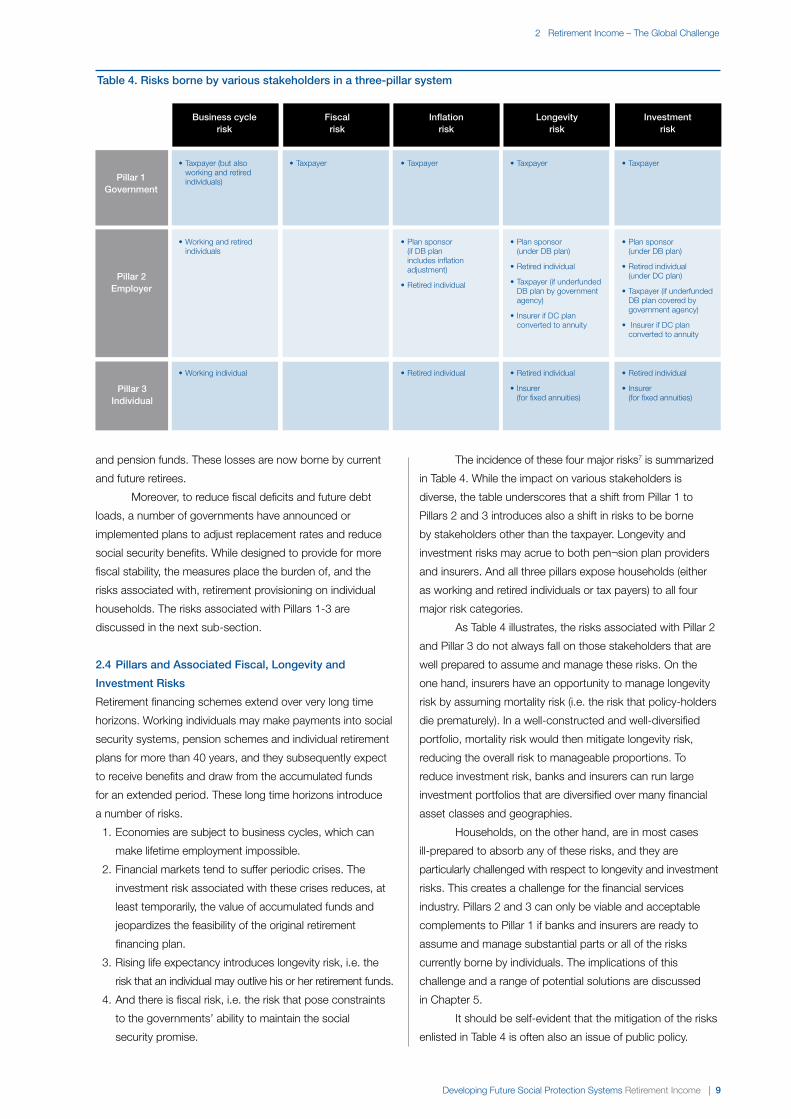
The incidence of these four major risks7 is summarized
in Table 4. While the impact on various stakeholders is
diverse, the table underscores that a shift from Pillar 1 to
Pillars 2 and 3 introduces also a shift in risks to be borne
by stakeholders other than the taxpayer. Longevity and
investment risks may acrue to both pen¬sion plan providers
and insurers. And all three pillars expose households (either
as working and retired individuals or tax payers) to all four
major risk categories.
As Table 4 illustrates, the risks associated with Pillar 2
and Pillar 3 do not always fall on those stakeholders that are
well prepared to assume and manage these risks. On the
one hand, insurers have an opportunity to manage longevity
risk by assuming mortality risk (i.e. the risk that policy-holders
die prematurely). In a well-constructed and well-diversified
portfolio, mortality risk would then mitigate longevity risk,
reducing the overall risk to manageable proportions. To
reduce investment risk, banks and insurers can run large
investment portfolios that are diversified over many financial
asset classes and geographies.
Households, on the other hand, are in most cases
ill-prepared to absorb any of these risks, and they are
particularly challenged with respect to longevity and investment
risks. This creates a challenge for the financial services
industry. Pillars 2 and 3 can only be viable and acceptable
complements to Pillar 1 if banks and insurers are ready to
assume and manage substantial parts or all of the risks
currently borne by individuals. The implications of this
challenge and a range of potential solutions are discussed
in Chapter 5.
It should be self-evident that the mitigation of the risks
enlisted in Table 4 is often also an issue of public policy.
table 4. risks borne by various stakeholders in a three-pillar system
business cycle risk
Pillar 2 employer
Pillar 3 individual
Pillar 1government
Fiscal risk
inflation risk
Longevity risk
investment risk
• Taxpayer (but also working and retired individuals)
• Taxpayer • Taxpayer • Taxpayer • Taxpayer
• Working and retired individuals
• Plan sponsor (if DB plan includes inflation adjustment)
• Retired individual
• Plan sponsor (under DB plan)
• Retired individual
• Taxpayer (if underfunded DB plan by government agency)
• Insurer if DC plan converted to annuity
• Plan sponsor (under DB plan)
• Retired indi vidual (under DC plan)
• Taxpayer (if underfunded DB plan covered by government agency)
• Insurer if DC plan converted to annuity
• Working individual • Retired individual • Retired individual
• Insurer (for fixed annuities)
• Retired individual
• Insurer (for fixed annuities)
10 | Developing Future Social Protection Systems Retirement Income
2 Retirement Income – The Global Challenge
Business cycle, fiscal and inflation risks are best addressed
with a macroeconomic policy mix. The provision of an
environment fostering sustainable growth and stable financial
markets is one of the most important public goods – and
arguably the best risk mitigant – that governments can
provide. A stable economy rooted in price stability, for
example, enhances the efficiency of the price system
because it cuts through the fog of inflation. And low inflation
enhances corporate sector or microeconomic efficiency,
which in turn reduces the political demand for costly
governmental intervention in support of unenviable enterprises.
In that sense, sound macroeconomic policies in support
of price stability and growth will go a long way towards
enhancing the sustainability of retirement income systems.
notes
1 World Bank’s Pension Reform Primer. For more
information, contact the Social Protection Advisory
Service, The World Bank, 1818 H Street, NW, MSN
G7-703, Washington, DC 20433, USA,
http://www.worldbank.org.
2 Chile’s Pension Reform After 20 Years. For more
information, please contact the Social Protection Advisory
Service, The World Bank, 1818 H Street, NW, MSN
G8-802, Washington, DC 20433, USA.
3 Jackson, Richard, Neil Howe and Keisuke Nakashima.
The Global Aging Preparedness Index. 2010. Washington,
DC: Center for Strategic and International Studies.
4 Deville, Volker. Global Demography: Generations and their
Future. July, 2012. Munich: Allianz SE.
5 Queisser, Monika and Dimitri Vittas. The Swiss Pulti-Pillar
pension System: Triumph of Common Sense? August,
2000. Development Research Group, The World Bank:
Washington DC.
6 In a defined benefit (DB) pension plan, the employer-
sponsored pension fund promises a specified monthly
benefit on retirement (amount depends on e.g. salary
income, tenure of service and age). It is “defined” in the
sense that the formula for computing the payments is
known in advance. In contrast, in a defined contribution
(DC) plan, the pension payments are based on
accumulated investments funded by employer and
employee contributions. A crucial difference between
DB and DC plans is the distribution of investment or
financial market risk. Whereas the investment risk of DC
plans reside with the retiree (or an insurer, if the retiree
converts the accumulated funds into an annuity), it is
shouldered by the employer-sponsored pension fund
in the case of funded DB plans.
7 There are, of course, other risks, such as mortality and
regulatory risks.
Developing Future Social Protection Systems Retirement Income | 11
3 review of Current retirement Funding Pillars
The focus of this chapter is on the comparison of retirement
systems in a small number of selected countries. This is
done on the basis of four of the five pillars introduced in the
previous chapter. Pillar 0 is excluded, not because this pillar is
not important, but rather to keep the analysis on those pillars
where demographic and fiscal challenges are most pressing
and where solutions must be developed and implemented.
In the following chapter, a number of indicators are
introduced to evaluate the fiscal sustainability of each of the
four pillars under consideration. The bulk of the indicators
are contemporaneous. But, in a few cases, forward-looking
indicators are tabulated to highlight intertemporal challenges.
What may look sustainable and adequate today may no
longer be sustainable – and therefore provide no guarantee
for future adequacy – if one accounts for straightforward
arithmetic of demographic change.
3.1 introducing indicators for Pillars 1 through 4
Pillars 1 through 4 are represented by a small number of
indicators chosen to reflect fiscal sustainability and income
adequacy associated with each individual pillar. The two
categories – sustainability and adequacy – should always be
analysed jointly, and particularly so in the analysis of Pillar 1.
To be truly adequate, any Pillar 1 system must also be
sustainable. If the fiscal stability of the system is not ensured,
future beneficiaries may find that its adequacy is mere
pretence when rising costs force governments to make
reductions in promised benefits.
The indicator choices were made on the grounds of
two criteria. First, the indicator must have explanatory power.
Second, from the many possible indicators that met the
first criterion, indicators were then chosen that were readily
accessible from publicly available statistics. This ensures
transparency while making the analysis also replicable.
To serve the latter two goals, sophisticated data
transformation was refrained. One exception is an indicator
representing household savings. National income statistics
typically report household savings that are distorted by
income inequality. Lower income households tend to save
less of their disposable income than upper income households,
which implies that the reported mean savings ratio (expressed
in per cent of disposable income, for example) tends to be
much higher than the median savings ratio would be.
Unfortunately, median savings ratios are hard to obtain.
And that is the reason why a Gini index-corrected savings
ratio was introduced to account for possible distortions in the
reported savings ratio due to income inequality.8
While the definition of the four pillars under consideration
may be compelling, the assignment of particular indicators to
certain pillars can be open to judgment. A case in point is the
market capitalization of publicly listed companies in Pillar 2.
This indicator was introduced as proxy for the depth of local
capital markets. The logic behind this indicator is that only
deep, and by extension liquid, capital markets will provide
a sufficiently large menu of financial instruments in which
retirement savings can be invested. Hence, it makes sense to
have this indicator associated with the second pillar because
pension funds must always be invested in a broad array of
liquid assets. But the same logic applies also to the investment
of household savings, and the market capitalization indicator
could equally well be associated with the third pillar.
It would be tempting to aggregate the information
assembled in Table 5 in the appendix or in the pillar tables
below to create overall country scores and rankings.
However, these kinds of exercises are always fraught with
methodological problems, and the authors decided to refrain
from making such a ranking. Thus, the primary goal of this
chapter is to highlight current and, where appropriate, future
deficiencies in each of the four pillars. For this perhaps
somewhat narrow purpose, a simple “traffic light” system is
sufficient, with green, amber and red assigned to the
individual indicators highlighting fiscal sustainability and
income adequacy. Thus, pillar tables per country provide
a comprehensive visual image of the retirement financing
challenges that each country covered by this report is facing.
3.2 Fiscal Sustainability and income Adequacy in
the Four Pillars
The following offers a brief discussion of the rationale behind
each indicator chosen to illustrate the challenges in the
four pillars. The discussion is illustrative only and does not
endeavour to be comprehensive. The full table for all pillars is
provided under Appendix 6.2, whereas the rationale behind
the colour coding is outlined under Appendix 6.3.
12 | Developing Future Social Protection Systems Retirement Income
UN 2010
MEDIUM VARIANT
Pillar 1 (government Social Security)
ADVAnCeD eConomieS
Australia
Austria
belgium
Canada
Czech republic
egypt
France
germany
greece
Hong Kong SAr, China
italy
Japan
netherlands
Portugal
Spain
republic of Korea
Sweden
Switzerland
United Kingdom
United States of America
brazil
Chile
China
Hungary
india
indonesia
mexico
Poland
romania
russian Federation
South Africa
turkey
bangladesh
ethiopia
nigeria
Pakistan
emerging mArKet AnD DeVeLoPing eConomieS
LoW inCome eConomieS
34.3 ●
41.2 ●
43.3 ●
35.0 ●
37.6 ●
15.8 ●
43.6 ●
46.9 ●
43.3 ●
28.6 ●
48.6 ●
59.2 ●
40.1 ●
42.3 ●
38.5 ●
25.9 ●
48.1 ●
40.6 ●
42.2 ●
33.8 ●
55.0 ●
75.0 ●
67.0 ●
62.6 ●
67.1 ●
27.7 ●
64.6 ●
83.7 ●
75.5 ●
76.5 ●
88.8 ●
97.2 ●
71.4 ●
83.8 ●
81.9 ●
80.8 ●
62.9 ●
78.8 ●
58.0 ●
52.9 ●
8.9 ●
N.A.
N.A.
8.3 ●
N.A.
N.A.
16.6 ●
15.8 ●
N.A.
N.A.
18.0 ●
14.1 ●
12.0 ●
N.A.
14.3 ●
3.4 ●
15.7 ●
9.8 ●
12.1 ●
8.9 ●
6.0 ●
N.A.
N.A.
6.4 ●
N.A.
N.A.
6.8 ●
5.9 ●
N.A.
N.A.
6.6 ●
4.3 ●
11.2 ●
N.A.
11.8 ●
10.7 ●
3.5 ●
7.6 ●
6.1 ●
7.4 ●
8.2 ●
52.1 ●
81.4 ●
33.1 ●
*40.5 ●
64.3 ●
78.8 ●
55.3 ●
165.4 ●
*33.8 ●
99.6 ●
126.4 ●
31.7 ●
97.3 ●
57.5 ●
32.9 ●
-18.2 ●
25.9 ●
76.6 ●
80.3 ●
31.8 ●
48.1 ●
48.6 ●
38.4 ●
39.3 ●
25.1 ●
49.5 ●
43.6 ●
39.7 ●
22.5 ●
46.0 ●
29.6 ●
45.5 ●
41.4 ●
36.2 ●
22.7 ●
49.8 ●
32.8 ●
36.4 ●
31.7 ●
18.4 ●
23.5 ●
20.4 ●
39.7 ●
14.5 ●
14.6 ●
17.3 ●
32.4 ●
34.5 ●
29.1 ●
14.0 ●
16.2 ●
43.7 ●
51.3 ●
56.5 ●
62.2 ●
27.4 ●
38.1 ●
40.8 ●
61.7 ●
65.5 ●
51.4 ●
21.3 ●
38.7 ●
8.8 ●
6.0 ●
2.8 ●
N.A.
1.9 ●
N.A.
2.4 ●
10.1 ●
N.A.
5.8 ●
N.A.
N.A.
11.6 ●
1.5 ●
5.2 ●
N.A.
1.6 ●
N.A.
2.7 ●
3.8 ●
N.A.
4.4 ●
N.A.
N.A.
36.4 ●
-8.7 ●
*25.8 ●
78.6 ●
*67.0 ●
*24.5 ●
40.3 ●
25.7 ●
*33.0 ●
*12.0 ●
35.1 ●
31.3 ●
35.4 ●
23.3 ●
21.3 ●
45.2 ●
18.7 ●
17.0 ●
21.7 ●
37.5 ●
32.3 ●
35.5 ●
27.5 ●
33.1 ●
12.9 ●
12.6 ●
12.7 ●
13.6 ●
28.4 ●
15.8 ●
13.6 ●
20.5 ●
N.A.
N.A.
N.A.
N.A.
N.A.
N.A.
N.A.
N.A.
N.A.
20.5 ●
10.4 ●
56.9 ●
11.5 ●
17.3 ●
20.0 ●
14.4 ●
PiLLAr 1
COUNTRY
OLD-AGE DEPENDENCY
RATIO (60+/20-59)
(2010)
OLD-AGE DEPENDENCY
RATIO (60+/20-59)
(2040)
TOTAL PUBLIC BENEFITS TO
ELDERLY (TPBtE); IN % OF GDP (2007)
GROWTH IN TPBtE,
2007-2040 IN % OF GDP
NETDEBT/GDP IN % (2011)
*GROSS AS NET NOT AVAILABLE
REVENUE BURDEN
IN % OF GDP (2010)
● < 33.0
● > 33.0 > 66.0
● > 66.0
SOURCE
UN 2010
MEDIUM VARIANT
● < 33.0
● > 33.0 > 66.0
● > 66.0
CSIS
2010
● < 6.0
● > 6.0 > 12.0
● > 12.0
CSIS
2010
● < 3.0
● > 3.0 > 6.0
● > 6.0
IMF
2011
● < 60.0
● > 60.0 < 90.0
● > 90.0
IMF
2012
● < 40.0
● > 40.0 < 50.0
● > 50.0
3 Review of Current Retirement Funding Pillars
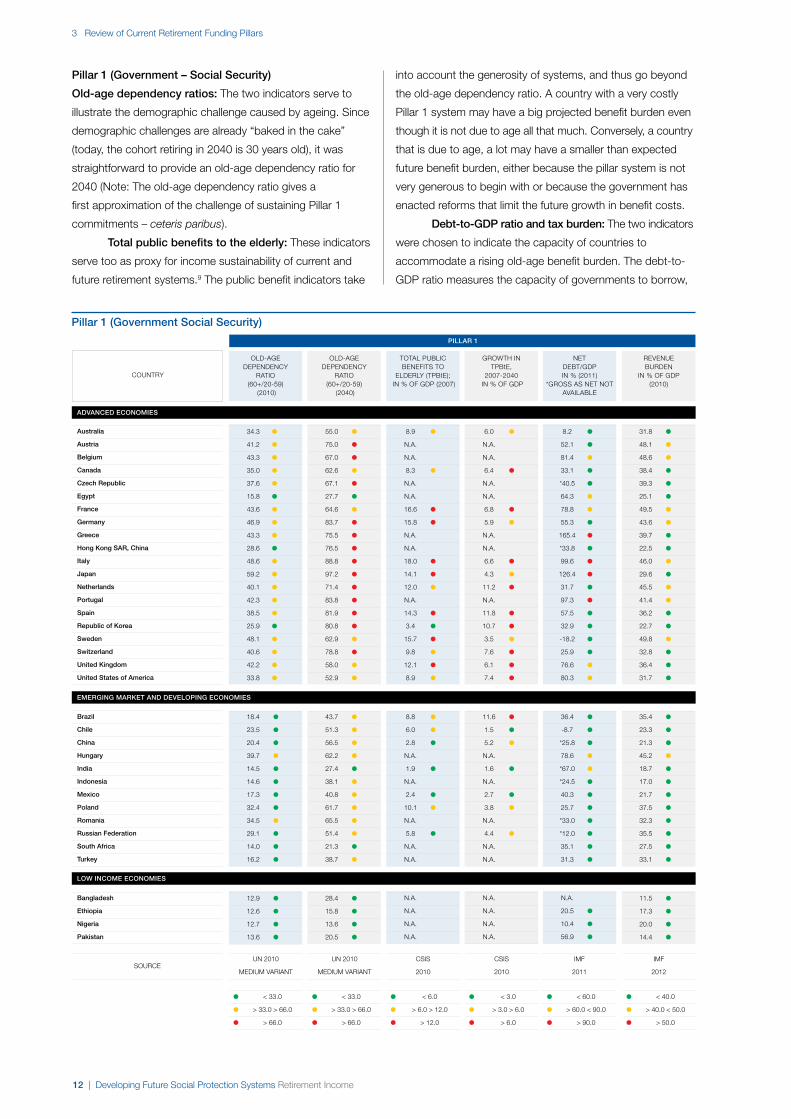
Pillar 1 (government – Social Security)
old-age dependency ratios: The two indicators serve to
illustrate the demographic challenge caused by ageing. Since
demographic challenges are already “baked in the cake”
(today, the cohort retiring in 2040 is 30 years old), it was
straightforward to provide an old-age dependency ratio for
2040 (Note: The old-age dependency ratio gives a
first approximation of the challenge of sustaining Pillar 1
commitments – ceteris paribus).
total public benefits to the elderly: These indicators
serve too as proxy for income sustainability of current and
future retirement systems.9 The public benefit indicators take
into account the generosity of systems, and thus go beyond
the old-age dependency ratio. A country with a very costly
Pillar 1 system may have a big projected benefit burden even
though it is not due to age all that much. Conversely, a country
that is due to age, a lot may have a smaller than expected
future benefit burden, either because the pillar system is not
very generous to begin with or because the government has
enacted reforms that limit the future growth in benefit costs.
Debt-to-gDP ratio and tax burden: The two indicators
were chosen to indicate the capacity of countries to
accommodate a rising old-age benefit burden. The debt-to-
GDP ratio measures the capacity of governments to borrow,
Developing Future Social Protection Systems Retirement Income | 13
OECD
Pillar 2 (Sponsored by employers)
ADVAnCeD eConomieS
Australia
Austria
belgium
Canada
Czech republic
egypt
France
germany
greece
Hong Kong SAr, China
italy
Japan
netherlands
Portugal
Spain
republic of Korea
Sweden
Switzerland
United Kingdom
United States of America
brazil
Chile
China
Hungary
india
indonesia
mexico
Poland
romania
russian Federation
South Africa
turkey
bangladesh
ethiopia
nigeria
Pakistan
emerging mArKet AnD DeVeLoPing eConomieS
89.0 ●
5.4 ●
3.8 ●
64.7 ●
6.3 ●
2.4 ●
0.2 ●
5.4 ●
0.0 ●
34.7 ●
4.6 ●
25.2 ●
128.5 ●
11.4 ●
7.9 ●
4.0 ●
9.6 ●
113.7 ●
88.7 ●
70.5 ●
3.4 ●
N.A.
N.A.
5.1 ●
N.A.
N.A.
0.3 ●
0.7 ●
N.A.
N.A.
0.9 ●
2.0 ●
5.2 ●
N.A.
0.6 ●
0.4 ●
2.7 ●
4.5 ●
4.0 ●
5.6 ●
9.1 ●
N.A.
N.A.
7.8 ●
N.A.
N.A.
0.5 ●
2.7 ●
N.A.
N.A.
2.4 ●
2.7 ●
10.8 ●
N.A.
1.6 ●
1.0 ●
6.3 ●
7.7 ●
5.0 ●
8.0 ●
63.6 ●
17.5 ●
33.0 ●
66.7 ●
21.7 ●
52.7 ●
52.7 ●
30.6 ●
26.5 ●
617.0 ●
22.6 ●
66.4 ●
44.5 ●
27.3 ●
59.4 ●
53.1 ●
51.9 ●
171.4 ●
70.3 ●
82.5 ●
14.5 ●
67.0 ●
0.7 ●
14.6 ●
0.2 ●
1.6 ●
12.7 ●
15.8 ●
0.9 ●
1.9 ●
N.A.
2.3 ●
0.9 ●
1.8 ●
0.0 ●
N.A.
0.2 ●
N.A.
0.3 ●
0.0 ●
N.A.
0.0 ●
N.A.
N.A.
3.0 ●
4.6 ●
1.2 ●
N.A.
1.1 ●
N.A.
1.4 ●
3.1 ●
N.A.
1.4 ●
N.A.
N.A.
35.7 ●
61.8 ●
N.A.
12.0 ●
52.7 ●
19.4 ●
21.3 ●
17.0 ●
10.0 ●
23.9 ●
179.4 ●
16.1 ●
N.A.
N.A.
6.9 ●
0.0 ●
N.A.
N.A.
N.A.
N.A.
N.A.
N.A.
N.A.
N.A.
8.4 ●
N.A.
24.0 ●
14.3 ●
LoW inCome eConomieS
PiLLAr 2
COUNTRY
ASSETS OF PENSION FUNDS
IN % OF GDP (2010)
FUNDED PENSION BENEFITS
IN % OF GDP (2007)
FUNDED PENSION BENEFITS
IN % OF GDP (2040)
MARKET CAPITALISATION OF LISTED COMPANIES
(2008)
● > 50.0
● > 25.0 < 50.0
● < 25.0
SOURCE
CSIS
PROJECTION
● > 4.0
● > 1.0 < 4.0
● < 1.0
CSIS
PROJECTION
● > 4.0
● > 1.0 < 4.0
● < 1.0
WORLD BANK
WDI
● > 50.0
● > 25.0 < 50.0
● < 25.0
ADVAnCeD eConomieS
emerging mArKet AnD DeVeLoPing eConomieS
3 Review of Current Retirement Funding Pillars
whereas the tax burden to GDP ratio measures the ability
of governments to cover rising benefit costs by further
expanding revenues. It would have been comparatively easy
to provide also estimates for future debt-to-GDP ratios.
However, such estimates are always dependent on assumptions
and thus subject to judgmental issues, and this chapter
refrains from including them.10
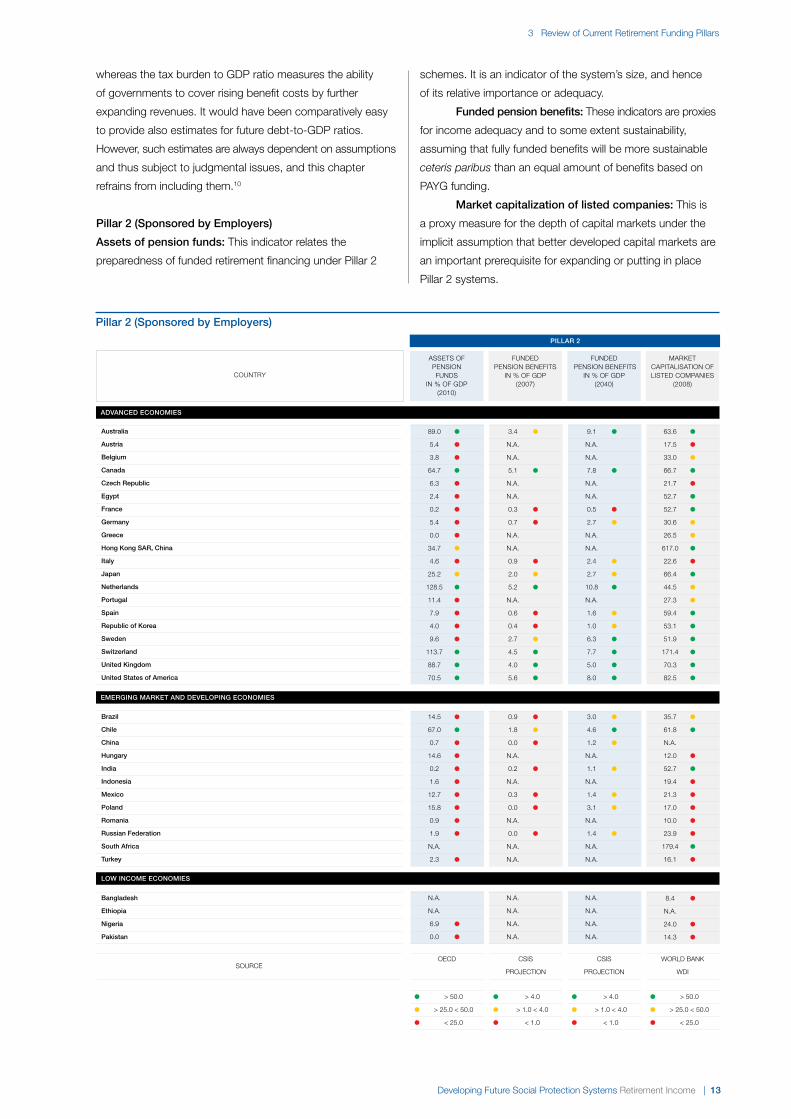
Pillar 2 (Sponsored by employers)
Assets of pension funds: This indicator relates the
preparedness of funded retirement financing under Pillar 2
schemes. It is an indicator of the system’s size, and hence
of its relative importance or adequacy.
Funded pension benefits: These indicators are proxies
for income adequacy and to some extent sustainability,
assuming that fully funded benefits will be more sustainable
ceteris paribus than an equal amount of benefits based on
PAYG funding.
market capitalization of listed companies: This is
a proxy measure for the depth of capital markets under the
implicit assumption that better developed capital markets are
an important prerequisite for expanding or putting in place
Pillar 2 systems.
14 | Developing Future Social Protection Systems Retirement Income
OECD
Pillar 3 (individual Savings)
ADVAnCeD eConomieS
Australia
Austria
belgium
Canada
Czech republic
egypt
France
germany
greece
Hong Kong SAr, China
italy
Japan
netherlands
Portugal
Spain
republic of Korea
Sweden
Switzerland
United Kingdom
United States of America
brazil
Chile
China
Hungary
india
indonesia
mexico
Poland
romania
russian Federation
South Africa
turkey
bangladesh
ethiopia
nigeria
Pakistan
emerging mArKet AnD DeVeLoPing eConomieS
4.5 ●
11.5 ●
11.7 ●
4.0 ●
5.7 ●
N.A.
11.7 ●
11.7 ●
N.A.
N.A.
8.0 ●
2.3 ●
5.9 ●
-0.8 ●
6.6 ●
2.9 ●
11.2 ●
11.7 ●
-2.8 ●
5.5 ●
2.9 ●
8.2 ●
7.9 ●
2.7 ●
4.2 ●
N.A.
7.9 ●
8.4 ●
N.A.
N.A.
5.1 ●
1.7 ●
4.1 ●
-0.5 ●
4.3 ●
2.0 ●
8.4 ●
7.8 ●
-1.8 ●
3.3 ●
3.1 ●
2.2 ●
3.2 ●
2.9 ●
0.7 ●
N.A.
2.5 ●
2.2 ●
1.2 ●
N.A.
2.6 ●
4.8 ●
3.6 ●
2.1 ●
1.6 ●
1.5 ●
2.8 ●
6.1 ●
3.3 ●
3.5 ●
N.A.
7.4 ●
N.A.
2.7 ●
N.A.
N.A.
10.2 ●
0.8 ●
N.A.
N.A.
N.A.
N.A.
N.A.
3.6 ●
N.A.
1.9 ●
N.A.
N.A.
5.3 ●
0.5 ●
N.A.
N.A.
N.A.
N.A.
N.A.
N.A.
N.A.
0.7 ●
0.3 ●
N.A.
0.7 ●
0.5 ●
1.0 ●
0.1 ●
N.A.
0.3 ●
N.A.
N.A.
N.A.
N.A.
N.A.
N.A.
N.A.
N.A.
SMALL ●
N.A.
N.A.
N.A.
LoW inCome eConomieS
PiLLAr 3
COUNTRY
HOUSEHOLD SAVINGS
IN % OF GDP
HOUSEHOLD SAVINGS
IN % OF GDP (GINI CORR)
FINANCIAL ASSETS
IN % OF GDP (USD) 2009
● > 10.0
● > 5.0 < 10.0
● < 5.0
SOURCE
OECD /
WDI / CALC
● > 5.0
● > 3.0 < 5.0
● < 3.0
OECD /
ALLIANZ
● > 3.0
● > 1.0 < 3.0
● < 1.0
ADVAnCeD eConomieS
emerging mArKet AnD DeVeLoPing eConomieS
3 Review of Current Retirement Funding Pillars
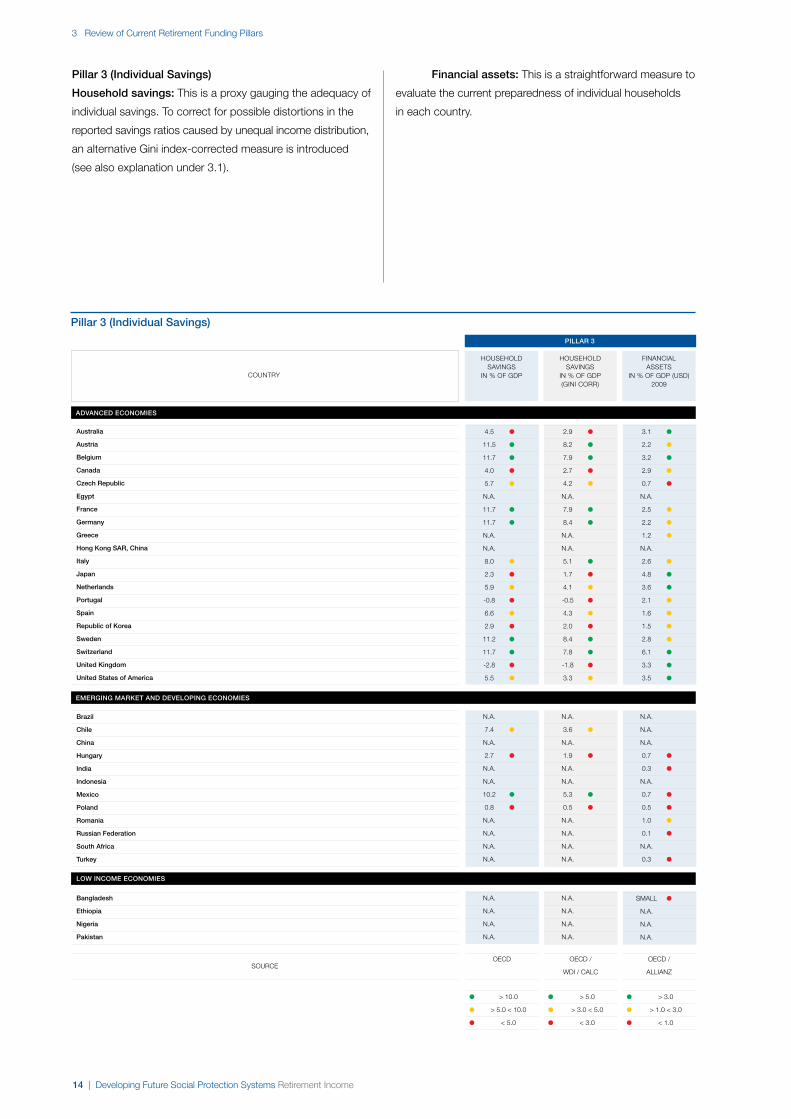
Pillar 3 (individual Savings)
Household savings: This is a proxy gauging the adequacy of
individual savings. To correct for possible distortions in the
reported savings ratios caused by unequal income distribution,
an alternative Gini index-corrected measure is introduced
(see also explanation under 3.1).
Financial assets: This is a straightforward measure to
evaluate the current preparedness of individual households
in each country.
Developing Future Social Protection Systems Retirement Income | 15
OECD
Pillar 4 (Work-Life extension)
ADVAnCeD eConomieS
Australia
Austria
belgium
Canada
Czech republic
egypt
France
germany
greece
Hong Kong SAr, China
italy
Japan
netherlands
Portugal
Spain
republic of Korea
Sweden
Switzerland
United Kingdom
United States of America
brazil
Chile
China
Hungary
india
indonesia
mexico
Poland
romania
russian Federation
South Africa
turkey
bangladesh
ethiopia
nigeria
Pakistan
emerging mArKet AnD DeVeLoPing eConomieS
40.8 ●
12.8 ●
10.6 ●
32.4 ●
15.7 ●
N.A.
10.8 ●
20.9 ●
15.3 ●
N.A.
11.6 ●
42.8 ●
23.0 ●
N.A.
16.8 ●
45.3 ●
33.1 ●
33.2 ●
27.6 ●
38.8 ●
64.8 ●
58.9 ●
59.1 ●
63.4 ●
62.0 ●
N.A.
59.1 ●
61.8 ●
61.9 ●
N.A.
61.1 ●
69.7 ●
62.1 ●
67.0 ●
61.8 ●
70.3 ●
66.0 ●
65.7 ●
64.3 ●
65.5 ●
65.0 ●
65.0 ●
60.0 ●
65.0 ●
61.0 ●
N.A.
60.5 ●
65.0 ●
57.0 ●
N.A.
59.0 ●
65.0 ●
65.0 ●
65.0 ●
65.0 ●
60.0 ●
65.0 ●
65.0 ●
65.0 ●
66.0 ●
40.9 ●
40.8 ●
28.5 ●
8.3 ●
35.8 ●
N.A.
40.2 ●
28.7 ●
N.A.
11.9 ●
19.2 ●
N.A.
N.A.
66.9 ●
N.A.
60.0 ●
N.A.
N.A.
72.2 ●
61.7 ●
N.A.
N.A.
N.A.
62.8 ●
N.A.
65.0 ●
N.A.
60.0 ●
N.A.
N.A.
65.0 ●
65.0 ●
N.A.
N.A.
N.A.
44.9 ●
N.A.
N.A.
N.A.
N.A.
N.A.
N.A.
N.A.
N.A.
N.A.
N.A.
N.A.
N.A.
LoW inCome eConomieS
PiLLAr 4
COUNTRY
LABOR FORCE PARTICIPATION
RATE (AGED 60-74) IN 2011 - ALL
EFFECTIVE RETIREMENT
AGES
FORMAL RETIREMENT
AGES
● > 30.0
● < 30.0 > 20.0
● < 20.0
SOURCE
OECD
Average age at exit (men)
● > 65.0
● > 62.0 < 65.0
● < 62.0
OECD
Formal exit age (men)
● > 65.0
● > 62.0 < 65.0
● < 62.0
ADVAnCeD eConomieS
emerging mArKet AnD DeVeLoPing eConomieS
3 Review of Current Retirement Funding Pillars
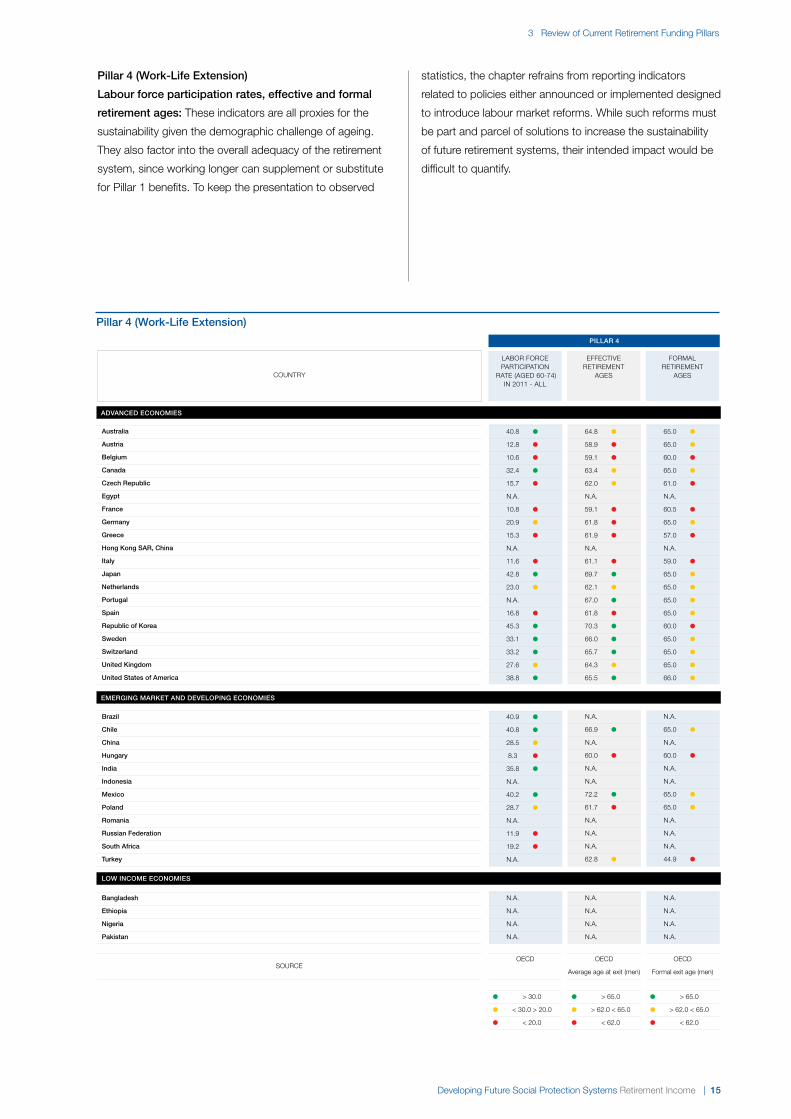
Pillar 4 (Work-Life extension)
Labour force participation rates, effective and formal
retirement ages: These indicators are all proxies for the
sustainability given the demographic challenge of ageing.
They also factor into the overall adequacy of the retirement
system, since working longer can supplement or substitute
for Pillar 1 benefits. To keep the presentation to observed
statistics, the chapter refrains from reporting indicators
related to policies either announced or implemented designed
to introduce labour market reforms. While such reforms must
be part and parcel of solutions to increase the sustainability
of future retirement systems, their intended impact would be
difficult to quantify.
16 | Developing Future Social Protection Systems Retirement Income
3 Review of Current Retirement Funding Pillars
3.3 interpreting the traffic Lights
The remainder of this chapter offers a few conclusions based
on a reading of the traffic lights presented in the tables under
point 3.2. Sample countries are grouped according to the
country classification as developed over the years by the
International Monetary Fund.11 The lack of numerical values
particularly in the low-income country category, but also a
number of emerging market and developing economies,
underscores that retirement systems in these countries are
still in their infancy. Thus, the policy implications developed
below relate predominantly to advanced economies. While
the traffic lights in the tables may be bewildering, two
conclusions are straightforward:
• No pillar is free of either fiscal sustainability challenges or
income adequacy deficiencies
• No country is above the fray; all countries will eventually
have to cope with pillar weakness
One corollary of these two points is the recognition
that there are no silver bullets to secure the financial future of
retirement systems. Promoting one pillar at the expense of
another would most likely produce solutions that are neither
fiscally sustainable nor capable of securing income adequacy.
Consequently, the financial future of retirement systems can
only be secured on the basis of solutions that extend beyond
one pillar. At the same time, there is no compelling reason
that sustainable retirement systems must necessarily be
based on PAYG funding. Indeed, a robust Pillar 0 coupled
with robust Pillars 2 and 3 may provide equally desirable
outcomes with respect to coverage, fiscal sustainability, and
income adequacy.
Similarly, no single country has ready-made solutions
to offer. Aside from the fact that each country is idiosyncratic
in its demographic, political and institutional make-up, each
country has pillar-weaknesses. Solutions must be addressed
in each country’s institutional cultural context and cannot
necessarily be adopted without modification by other countries.
Again, the financial future of retirement systems can be secured
by drawing from the experience of individual countries. But
prudent policy-makers will be well advised by adopting only
elements and not the total of existing country models.
A closer examination of the tables reveals also the
considerable demographic challenges manifest in Pillar 1.
They are present in all AMEs and absent in only a handful of
EMEs. Challenges related to ageing do obviously exist also
in other pillars (most notably in Pillar 4 as mentioned above).
In a number of countries, Pillar 1 is also fraught with fiscal
sustainability challenges (they are even more dramatically
highlighted in studies projecting debt-to-GDP ratios well into
the future12). Sustainable retirement financing solutions should
consider combining Pillars 1, 2 and 3 on complementary and
consistency basis.
However, the Pillar 2 table shows that in most countries
assets of pension funds are severely underdeveloped. A
similar observation holds also for the depth of capital markets,
indicating that many countries are ill prepared to draw on
Pillars 2 and 3 as complement for Pillar 1.
Consequently, fostering a conducive environment for
stable capital market development would appear to be a top
priority of policy-makers. This requires not only the creation
of an institutional framework with appropriate and sufficiently
tough financial market regulation, but also a universe of well
capitalized firms that are capable and willing to offer the
broad range of financial products needed to support the
viability of future retirement solutions.
Finally, the selected Pillar 4 indicators underscore that,
based on current readings, only a few countries are
comparatively free of challenges. For all other countries, there
is plenty of scope for changes in labour market policies to
extend, for example, the work life and enable more part-time
work for the formally retired. A set of possible recommendations
is offered in Chapter 5.
notes
8 The Gini coefficient, or Gini index, is a statistical
dispersion measure that quantifies the inequality of
income distributions. The higher the value of the Gini
coefficient, the more unequal the income distribution.
9 These growth rates are derived on the basis of official
projections published by government agencies. The
data used draws on work done by CSIS in The Global
Aging Preparedness Index. 2010.
10 Jackson, Richard, Neil Howe and Keisuke Nakashima.
The Global Aging Preparedness Index. 2010. Washington,
DC: Center for Strategic and International Studies.
11 See for example the IMF’s 2012 World Economic
Outlook, p. 177-180.
12 Jackson, Richard, Neil Howe and Keisuke Nakashima.
The Global Aging Preparedness Index. 2010.
Washington, DC: Center for Strategic and International
Studies.
Developing Future Social Protection Systems Retirement Income | 17
4 risks, Challenges and opportunities of Current retirement income Systems
The rapid ageing of populations throughout the developed
and developing world presents us with significant challenges
in producing sustainable systems of retirement income
provision during a period of significant uncertainty, not only in
terms of future market returns but also in the extent to which
future life expectancy might increase.
The World Economic Forum’s Global Agenda Council
on Ageing Societies published in January 2012 a report –
Global Ageing Populations: Peril or Promise – that highlights
the challenges associated with retirement and healthcare
provision as well as opportunities for intergenerational solidarity.
Society can benefit from the knowledge, expertise and
capabilities of older generations; working and living
environments can be modified through innovation in technology
and attitude.
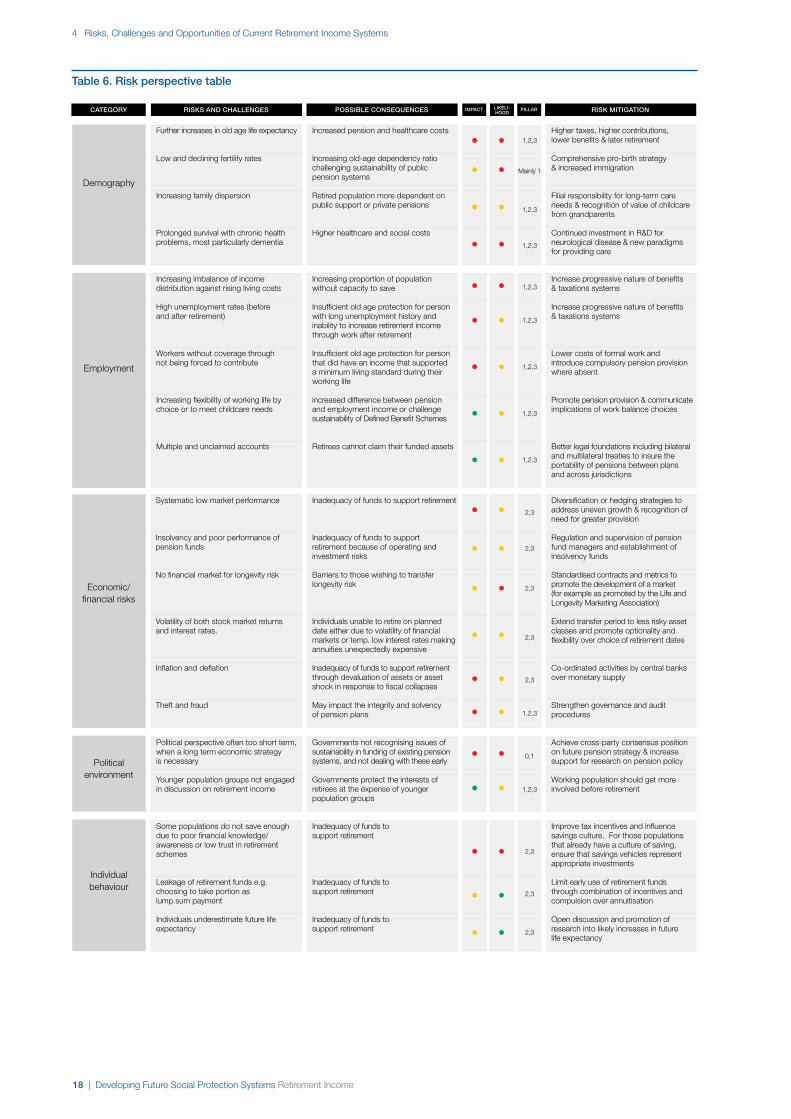
It is, however, important to highlight the multidimensional
nature of the risks that are faced by current retirement income
systems. In this chapter, risks resulting from trends in key
categories is considered. These categories are related to
trends in demography, political environment, employment,
behaviour, economics and finance. The most important risks
in each category in Table 6 have been presented, and each
risk is examined in turn with respect to possible consequences,
likelihood of occurrence, and severity of impact and existence
of potential mitigating factors.
The information in respect of likelihood and impact is
separately colour coded whereby green represents the lowest
likelihood or impact and red the highest. The principal pillars
that would be affected by each of the individual risks is further
highlighted. This continues our prior examination of which key
stakeholders bear the risks in respect of the different pillars.
By looking at Table 6 as a whole, it is clear that the
overwhelming majority of risks discussed in more depth in
the rest of this chapter are not remote possibilities and could
have significant impact on individuals, companies and society
in the developed and developing world.
4.1 Demographic trends and Challenges
The Global Demographic Trends and Social Security Reform13
report notes that demographic trends across regions in the
world are unsynchronized. Most countries in the developed
world face quantitatively similar demographic trends and the
same thorny issue of how to reform a strained PAYG
pension system. The developed world will experience
dramatic demographic changes throughout the 21st century.
The most important projected demographic events are further
increases in old-age life expectancy and low fertility rates
compounded by the imminent retirement of the baby
boom generation.
In contrast, in the developing world, large-scale social
security systems are absent and the demographic trends are
markedly different. In particular, old-age dependency ratios
are less than half than in developed countries: 8% compared
to 18% in 2000, and are projected to converge to 35% only
after 2100. Roughly speaking, the demographic transition in
developing countries lags the one in developed countries
by seven or eight decades. The two key challenges and risks
above are compounded by increasing family dispersion as
generations are less able to support one another.
A risk inherent in all pension systems, regardless
of their nature, is life expectancy. In a defined contribution
system, it is the member who assumes at least part of the
longevity risk. The contribution rate is generally fixed, as is the
legal age at which an individual can retire. If there is a large
increase in the populations’ longevity during a worker’s active
life, it is probable that when one retires, the accumulated
savings will result in a lower pension than the person may
have previously expected.
It is possible for a worker to postpone retirement to
achieve a higher pension. However, in that case the longevity
risk occurs in the form of modifying the retiring age. Whether
through a lower pension or a higher retiring age, the life
expectancy risk is still present. Nonetheless, once retirement
has taken place, the individual may transfer the longevity risk
to an insurer by purchasing a life annuity.
There is still the risk that the insurer will become
insolvent during the future lifetime of the individual, which may
result in non-payment of the pension or reliance on state
or industry guarantees. For individuals in poor health at
retirement, the purchase of a standard product to insure
against the risk of living longer will not be particularly attractive.
In the United Kingdom for instance, one can see increasing
segmentation of the market with products described as
enhanced or impaired annuities that reflect the likely life
expectancy of the individual.
4.2 employment trends and Challenges
The performance of any pension system in terms of final
pensions and sustainability will depend largely on the amount
and frequency of contributions. In a defined contribution
system, pensions depend to a very large extent on the
contributions paid during the worker’s active life. If a worker
18 | Developing Future Social Protection Systems Retirement Income
4 Risks, Challenges and Opportunities of Current Retirement Income Systems
table 6. risk perspective table
CAtegory riSKS AnD CHALLengeS PoSSibLe ConSeqUenCeS riSK mitigAtionimPACt LiKeLi-HooD
Further increases in old age life expectancy
Low and declining fertility rates
Increasing family dispersion
Prolonged survival with chronic health problems, most particularly dementia
Demography
Increased pension and healthcare costs
Increasing old-age dependency ratio challenging sustainability of public pension systems
Retired population more dependent on public support or private pensions
Higher healthcare and social costs
Higher taxes, higher contributions, lower benefits & later retirement
Comprehensive pro-birth strategy & increased immigration
Filial responsibility for long-term care needs & recognition of value of childcare from grandparents
Continued investment in R&D for neurological disease & new paradigms for providing care
●
●
●
●
●
●
●
●
1,2,3
Mainly 1
1,2,3
1,2,3
PiLLAr
Increasing imbalance of income distribution against rising living costs
High unemployment rates (before and after retirement)
Workers without coverage through not being forced to contribute
Increasing flexibility of working life by choice or to meet childcare needs
Multiple and unclaimed accounts
Increasing proportion of population without capacity to save
Insufficient old age protection for person with long unemployment history and inability to increase retirement income through work after retirement
Insufficient old age protection for person that did have an income that supported a minimum living standard during their working life
increased difference between pension and employment income or challenge sustainability of Defined Benefit Schemes
Retirees cannot claim their funded assets
Increase progressive nature of benefits & taxations systems
Increase progressive nature of benefits & taxations systems
Lower costs of formal work and introduce compulsory pension provision where absent
Promote pension provision & communicate implications of work balance choices
Better legal foundations including bilateral and multilateral treaties to insure the portability of pensions between plans and across jurisdictions
●
●
●
●
●
●
●
●
●
●
1,2,3
1,2,3
1,2,3
1,2,3
1,2,3
Employment
Political perspective often too short term, when a long term economic strategy is necessary
Younger population groups not engaged in discussion on retirement income
Political environment
Governments not recognising issues of sustainability in funding of existing pension systems, and not dealing with these early
Governments protect the interests of retirees at the expense of younger population groups
Achieve cross-party consensus position on future pension strategy & increase support for research on pension policy
Working population should get more involved before retirement
●
●
●
●
0,1
1,2,3
Inadequacy of funds to support retirement
Inadequacy of funds to support retirement because of operating and investment risks
Barriers to those wishing to transfer longevity risk
Individuals unable to retire on planned date either due to volatility of financial markets or temp. low interest rates making annuities unexpectedly expensive
Inadequacy of funds to support retirement through devaluation of assets or asset shock in response to fiscal collapses
May impact the integrity and solvency of pension plans
Diversification or hedging strategies to address uneven growth & recognition of need for greater provision
Regulation and supervision of pension fund managers and establishment of insolvency funds
Standardised contracts and metrics to promote the development of a market (for example as promoted by the Life and Longevity Marketing Association)
Extend transfer period to less risky asset classes and promote optionality and flexibility over choice of retirement dates
Co-ordinated activities by central banks over monetary supply
Strengthen governance and audit procedures
●
●
●
●
●
●
●
●
●
●
●
●
2,3
2,3
2,3
2,3
2,3
1,2,3
Economic/financial risks
Systematic low market performance
Insolvency and poor performance of pension funds
No financial market for longevity risk
Volatility of both stock market returns and interest rates.
Inflation and deflation
Theft and fraud
Some populations do not save enough due to poor financial knowledge/ awareness or low trust in retirement schemes
Leakage of retirement funds e.g. choosing to take portion as lump sum payment
Individuals underestimate future life expectancy
Individual behaviour
Inadequacy of funds to support retirement
Inadequacy of funds to support retirement
Inadequacy of funds to support retirement
Improve tax incentives and influence savings culture. For those populations that already have a culture of saving, ensure that savings vehicles represent appropriate investments
Limit early use of retirement funds through combination of incentives and compulsion over annuitisation
Open discussion and promotion of research into likely increases in future life expectancy
●
●
●
●
●
●
2,3
2,3
2,3
Developing Future Social Protection Systems Retirement Income | 19
4 Risks, Challenges and Opportunities of Current Retirement Income Systems
contributes continuously on the basis of his or her real wage,
the possibilities of obtaining an adequate pension increase
vary significantly. Especially in emerging countries, the large
informal sector is exempt from contributions while in developed
countries more and more sectors are not forced to contribute.
But, it is not only the continuity and amount of the
contributions that matter; the time at which these are made is
also important. In a funded defined contribution system, the
contributions made during the early years of the working life
have a significant impact on the final benefit. This is due to
the effect of compound interest on these savings over a long
period of time. In a defined benefit scheme, individuals will
often have to make a minimum number of contributions to
have the right to receive a pension and the benefit depends
on the final salary. The sustainability of a defined benefit is
therefore dependent on whether early funding is consistent
with salary increases and likely future life expectancy.
Pension portability both within a country with multiple
providers and one country’s retirement system to another as
employees are moving from employer to employer or one
country to another is a major and growing issue. In some
countries there is a large proliferation of inactive or dormant
accounts which members are either unable to legally claim
or consolidate and even where allowed, many fail to
initiate due to inertia and lack of awareness or complexity.
This can result in major administrative inefficiency and
individuals not maximizing their pension outcome. Australia
has almost three accounts for each employee with 6 million
lost and unclaimed.
Accordingly, countries need to ensure effective portability
both from fund provider to fund provider within a country as
well as from one country to another. This should include not
just the legal right of a member to exercise portability, but also
establish an “auto” solution or default where they fail to make
a decision. Australia is adopting auto-consolidation of inactive
accounts and regulatory change has recently occurred to
permit two-way movement between Australia and New Zealand.
The United Kingdom is also currently developing policy on
multiple accounts consolidation.14
The issue is also being widely discussed in the
European Union and in developing countries where their
citizens are employed in other countries as temporary labour
entrants. A common European pensions market would be
a benefit for individuals, and bilateral agreements between
countries are important to develop. Ultimately, however,
global protocols will be required.
4.3 economic and Financial trends and Challenges
Another decisive element in the amount of pensions provided
by a funded system are the returns obtained by the investments
made with pension fund resources. Nevertheless, a higher
expected return always has a higher associated investment
risk, so it is important to consider the probability distribution
associated to particular investment strategies over the course
of the worker’s life cycle. In the case of a defined benefit
scheme, reserves to match liabilities are also subject to
investment risk. The risk is largely assumed by the sponsor
of the plan. However, depending on the design of the system
or financial sustainability of the system there could be an
impact on members.
In the case of a defined contribution scheme, the
pension fund administrator should have a long-term objective
to maximize the expected value of the pension subject to an
acceptable dispersion around that expected value. However,
in many cases, there are incentives to achieve a better return
in the short term. This may result in a risk that is greater than
the one considered optimal or could result in taking decisions
that do not necessarily correspond to the final objective.
At the same time, in the management of third-party funds
there is always a potential conflict of interests that has to be
regulated. On the one hand, these are mandatory savings,
part of a country’s social security. On the other hand, most
of those enrolled in the system have too little financial
knowledge to be able to monitor the performance of their
own funds. This is known as fiduciary risk.
Finally, in a funded system, there is always the
possibility or, in some cases, the obligation, to transform the
accumulated savings into a life annuity on retirement. This
involves a considerable reinvestment risk due to the changes
that occur in interest rates. A larger or smaller pension may
be obtained with the same balance in the individual account,
depending on the level of interest rates at the moment when
the person purchases the life annuity.
Whichever pension system is in place, inflation risk is
present and needs to be mitigated. In the case of a defined
contribution scheme, this risk is assumed by the member and
real returns should be considered to assess the performance
of a pension fund. Nevertheless, at retirement, indexed
annuities may be available and the inflation risk can be
transferred to an insurance company. In a defined benefit
scheme, how the inflation risk is shared by the provider,
the member and the government would depend on the
specific design.
In a defined contribution scheme, when the worker
retires, he or she has the possibility of purchasing a life
annuity in an insurance company. In this case, there is also a
direct solvency risk that would affect the payment of benefits.
This is because in the case of bankruptcy of an insurance
company, the pensions would form part of the commitments
to be paid out in the liquidation process, with the possibility
of there being insufficient resources to pay them out.
Wherever there is solvency risk, there may be industry
or state guarantees that could take on all or part of the owed
pension pay-outs. At the same time, in many cases the
20 | Developing Future Social Protection Systems Retirement Income
4 Risks, Challenges and Opportunities of Current Retirement Income Systems
government plays an active role in providing pensions in the
majority of the world’s economies. Therefore, the possible
risk of government insolvency can also be included among
solvency risks, whether concerning the direct provision of
benefits or as guarantor in the case of insolvency of the
private actors.
There is always operating risk in every industry that
has to be taken on board. In the case of the pension system,
these are once again of special importance, not because the
risks are greater than in other industries, but because members
are less alert and less well-prepared to detect possible
operating problems from the moment when the contribution
is paid in until the benefits are calculated and paid out.
4.4 Political and Socioeconomic trends and Challenges
The following passages are based on the International
Monetary Fund’s 2011 report, The Challenge of Public
Pension Reform in Advanced and Emerging Economies:
Public pension reform will be a key policy challenge
in both advanced and emerging economies over the coming
decades. If governments do not recognize issues of
sustainability in funding of existing pension systems and do
not deal early enough with them, many existing systems will
remain unsustainable. Furthermore, there is a risk that they
do not prioritize investment in social protection more
broadly (including pensions) as a way to reduce poverty
and inequality.
Many economies will need to achieve significant fiscal
consolidation over the next two decades. Given high levels
of taxation, particularly in advanced economies, fiscal
consolidation will often need to focus on the expenditure side.
As public pension spending comprises a significant share of
total spending, and is projected to rise further, efforts to
contain these increases will in most cases be a necessary
part of fiscal consolidation packages. Some pension reforms,
such as increases in retirement ages, can raise potential
growth. While the appropriate level of pension spending and
the design of the pension system are ultimately matters
of public preference, there are several potential benefits for
countries that choose to undertake pension reform.
The appropriate reform mix depends on country
circumstances and preferences, although increasing retirement
ages has many advantages. It is important that pension
reforms do not undermine the ability of public pensions to
alleviate poverty among the elderly. Raising retirement ages
avoids the need for further cuts in replacement rates on top
of those already legislated, and in many countries the scope
for raising contributions may be limited in light of high payroll
tax burdens. Longer working lives also raise potential output
over time. In many advanced economies there is room for
more ambitious increases in statutory retirement ages in light
of continued gains in healthy life expectancy, but this should
be accompanied by measures that protect the incomes of
those who cannot continue to work.
Women live longer than men and are expected to
continue to do so, although healthy life expectancy is more
similar between the sexes. The equalization of retirement
ages between the sexes in many countries through greater
increases in women’s retirement age is being observed.
In emerging economies, where pension coverage is low,
expansion of non-contributory “social pensions” in the form
of social protection floors could be considered, combined
with reforms that place pension systems on sound financial
footing, including rising the statutory age of retirement.
Where average pensions are high relative to average wages,
efforts to increase statutory ages could be complemented
by reductions in the generosity of pensions. Where taxes on
labour income are relatively low, increasing revenues could
be considered, and all countries should strive to improve the
efficiency of payroll contribution collections.
4.5 behavioural trends and Challenges
In a defined contribution scheme, individuals often have
the possibility of making choices; they sometimes can even
switch from a defined contribution to a defined benefit and
vice versa. The value of these decisions depends to a large
extent on the ability of these individuals to take informed
decisions with awareness of the consequences. In general,
contribution to at least one of the pillars that fund pensions is
mandatory. In the case of a contributory pillar of mandatory
individual funding, the amount contributed may also be
insufficient for the expectations of those retiring. That is why
there are also voluntary savings instruments to supplement
the pension. However, the decision to use these savings
vehicles, and how much to deposit, is an individual decision.
In general, there is short-sightedness in individual
decisions. In fact, this is the justification for making contribution
mandatory, as one comes up against the risk of savings being
insufficient to fulfil expectations and inertia; failing to make a
decision. Moreover, if the decision is made to save over
and above the mandatory part, or even with regard to the
mandatory savings, people must decide who will administer
those savings. This is also an important decision, which must
be based on the attributes offered by the various administrators.
These attributes include the management of investments,
for which one can evaluate historic yield, the relative risk of
the portfolios and investment policies. The other important
attribute is cost, for which one needs to compare the price
charged by each administrator. Finally, one should consider
the service provided by the different suppliers. All these
characteristics must be evaluated. A poor decision in this
area can result in lower yield, higher risk, higher costs or a
lower quality of service than expected.
Developing Future Social Protection Systems Retirement Income | 21
4 Risks, Challenges and Opportunities of Current Retirement Income Systems
If an administrator is offering different investment
alternatives, deciding to enter a fund with 80% in equities
or one that invests exclusively in fixed income is a decision
of high impact on expected returns and risk. Moreover, it is
possible that a person is changing constantly from one type
of fund to another, depending on the performance of the
markets. This may produce a positive result in terms of
accumulated savings if sensible decisions are taken.
However, it is also likely that these decisions will not be the
most appropriate and will have a negative effect on the funds.
If one bears in mind that it is very difficult to predict market
performance and that there is generally a considerable lack
of financial information among savers, decisions of this type
represent a very important risk.
notes
13 Attanasioy, Orazio, Sagiri Kitaoz and Giovanni L.
Violantex. Global Demographic Trends and Social
Security Reform. April 2006.
14 Department for Work & Pensions (UK). Change your job,
take your pension with you. December 2011.

22 | Developing Future Social Protection Systems Retirement Income
Developing Future Social Protection Systems Retirement Income | 23
5 Stakeholders’ outcomes
The challenges and trends confronting pension systems will
require a response from all stakeholders. There is no
single blueprint for success, but it is becoming clear that all
stakeholders need to take positive action. The challenges
facing pension systems may be daunting; however, all
stakeholders taking incremental steps will enable pension
systems to continue to grow in sustainability and coverage.
This section outlines some potential responses for stakeholders
to consider.
5.1 employers
Employers will continue to play a critical role in facilitating an
individual’s participation in pension systems. The involvement
of employers in sponsoring pension systems also creates the
opportunity for greater efficiency and lower costs.
Given that one way members can improve their
retirement income is through extending their working lifetime,
it is recommended that employers consider more flexible
working arrangement for employees who are past formal
retirement dates. This would include the need to allow
employees past the formal retirement age to continue to
belong to retirement saving arrangements, and possibly
contribute to those arrangements. Employers may require
legislative support to enable continued membership of
retirement plans by employees past retirement age.
It is also expected that employers will have a growing
role in delivering financial awareness and education
programmes to employees. As a key funder of many
supplementary pension systems, there may be a growing
expectation by individuals that employers provide them
with the information and training required to make proper
retirement saving decisions.
5.2 individuals
Individuals will become more involved in managing their
pension and retirement savings schemes. Their level of
involvement would be affected by the design of the pension
systems in place. Where the individual fails to make a
decision, the use of default solutions should be adopted as
part of the solution set. A defined contribution system would
put investment and longevity risks and thus the onus of
ensuring sufficient levels of retirement provision on individuals.
They should be clear on what amount of retirement savings
is required and how invested funds will secure their required
level of income in retirement.
It is also more likely that individuals will need multiple
sources of income in retirement, including a state pension,
private provision and possibly income from work. It is
recommended that financial advice be carefully regulated to
ensure that it is delivered efficiently and free from conflict
of interests, as individuals could require increasing levels of
support. Consideration can also be given to the degree
to which product providers should be giving support and
advice to individuals for retirement savings.
5.3 government
In securing sustainable retirement financing the role of
governments is two-fold. First, they are important providers
of retirement incomes through Pillars 1 and in the
implementation of social protection floors, and they often
provide back-stop guarantees for underfunded pension
schemes offered by the private sector. The second and
equally important role is the provision of a public good by
creating an environment fostering sustainable growth and
stable financial markets. This second role has microeconomic
and macroeconomic as well as domestic and global
dimensions.
Cases in point are macro and microeconomic policies
to raise employment levels and extend the work life of
employees. Improving the level of employment would help
reduce the dependency ratio and ease funding strains,
especially in partially funded pensions and PAYG systems.
Of course, rising levels of unemployment have the reverse
effect and are thus particularly worthy of attention. Further,
measures that stimulate economic growth and broaden the
tax base of the state may also be helpful. Reforming systems
to allow individuals to work beyond traditional retirement
ages and thus supplement their own income can also be
considered. However, the degree to which this is successful
depends on current employment levels and the ability of
employers to accommodate this kind of labour flexibility.
Despite measures mentioned above, it is becoming
evident that the current generation of retirees will probably
enjoy the most generous retirement benefits relative to future
generations. A combination of favourable demographics and
long-term investment returns has led to high levels of pension
being available. As demographic trends continue, and
economic growth falters, it is unlikely that these levels of
benefits can be sustained, and so current state pension systems
will need to review the benefits that can be promised.
24 | Developing Future Social Protection Systems Retirement Income
5 Stakeholders’ Outcomes
It is recommended that governments also encourage
the development and growth of supplementary pension
provision, where individuals are able to provide for their
retirement through alternatives to a state pension. This is
a key area where all stakeholders need to work in concert
to optimize the eventual retirement income that individuals
can enjoy.
Many models exist for a supplementary pension system,
and it is recommended that careful consideration be given to
the design elements of the system in place. For example, the
system could be defined contribution in nature. In a funded
defined contribution system, unlike PAYG or a funded defined
benefit system, the contributions made during the early years
of the working life are decisive with respect to the final benefit.
This is due to the impact on these savings of the compound
interest generated over a long period of time.
While this allows individuals to benefit from good
investment performance, it also transfers investment risks
and the risk of under provision for retirement onto the
individual, and relies on the assumption that an individual is
able to make regular contributions to their retirement savings
throughout a long working lifetime. Groups that are not able
to do this become vulnerable to financial market shocks and
under provision. Further, a defined contribution system can
be seen as penalizing those individuals who were unable to
secure sufficient work, by providing them with inferior protection
in retirement. It would thus seem that care should be taken
with a purely defined contribution system. However, defined
contribution could play a useful role as part of a larger
pension system.
Defined benefit arrangements may be better suited to
providing income protection to lower income individuals and
individuals with broken employment records. Through the
mechanism of cross-subsidization, a defined benefit system
can redistribute provision for retirement, improving the
consistency of benefits and potentially giving broader coverage.
However, current demographic and economic trends mean
that defined benefit systems would offer lower benefits than
in the past. There is also the growing reluctance of state and
employers to accept the risk of underfunding, particularly with
future investment performance becoming uncertain.
In both defined benefit and defined contribution
systems, despite the strongest prudential and supervisory
oversight, occasional theft and fraud of member investments
can occur. Although rare and limited to a very small proportion
of members and investment assets for those affected, it can
have a very serious impact. Further, such events usually
attract significant negative commentary by participants,
media and policy-makers that undermine public confidence in
the system as a whole. An effective and timely compensation
provision should be considered in these circumstances.
In reviewing and promoting a supplementary pension
system, it is recommended that the particular savings culture
be taken into account. In some cultures, retirement provision is
viewed as a personal responsibility for the individual. In these
cases, a pension system can provide the means by which
an individual can provide for their retirement, but the ultimate
success of provision lies with the individual. Other cultures
may view retirement provision as a collective responsibility,
where each individual contributes to and then benefits from
the collective provision. Taking the retirement savings culture
into account also allows a better understanding of the culture
and behaviour changes that may be required to make a
supplementary pension system more effective.
There are also may cases where pension systems are
currently sustainable, but offer low coverage or low benefits
to individuals. An ageing population increases the need to
broaden and deepen pension benefits for individuals.
However, this needs to be done in a way that does not
jeopardize the long-term sustainability of the system, particularly
if coverage is improved by the introduction or improvement of
a state pension.
Government can also review supplementary pension
systems, particularly where provision through employers or
by individuals is on a voluntary basis. Experience has shown
that voluntary participation in pension systems usually fail
to provide adequate coverage. Individuals tend to prioritize
immediate consumption needs over long-term savings (often
despite campaigns to raise awareness of the need to provide
adequately for retirement).
Various forms of intervention are available to promote
higher coverage, ranging from rebalancing and reviewing
tax incentives offered to encourage retirement savings, to
compelling a minimum level of retirement saving for employed
individuals (either directly or via their employers). Another
option is to “nudge” individuals into retirement savings
through auto-enrolment programmes, where individuals are
automatically enrolled in a retirement savings vehicle and have
to actively opt out if they wish to stop saving for retirement.
In determining the appropriate level of intervention,
it is recommended that government is cognizant of current
savings rates of individuals, the degree to which compulsion
is constitutional, the maturity of the financial services industry,
the impact of a compulsory retirement savings contribution
on employers, as well as the expected level of compliance
(and fraud) and government’s ability to manage these.
Further, government has a key role in driving more
efficient delivery of pension systems. Despite years of operation,
productivity and efficiency, gains appear to be low.
Consideration should be given to issuing clear standards of
governance, tightening management, setting cost standards,
improving focus on performance and promoting innovation in
an effort to optimize efficient delivery of pension systems.
Developing Future Social Protection Systems Retirement Income | 25
5 Stakeholders’ Outcomes
5.4 Financial Services industry
The private sector and, in particular, insurance solutions, can
make a major contribution to meeting the challenge of providing
for retirement through the pooling and diversification of risks
across populations and geographies. Such risks include
asset protection, inflation risk and longevity risk. However, the
capacity of traditional insurance will likely not be sufficient to
meet all future needs. Hence, traditional insurance will have to
be complemented by non-traditional, likely capital market-
based solutions, such as the securitization of longevity risks.
Banks can help facilitate the global connectivity among
various pension retirement systems. In developing countries,
such as in Asia where most of the wealth and retirement
products are distributed by banks. Moreover, they can play
an important advisory role to provide retirement planning.
Currently, a range of insurance products exist that
allow households and pension funds to manage various
aspects of risk. A strong annuity market is an important
contributor to retirement security. Annuities allow the investor
to purchase a defined income stream in exchange for an
upfront premium. The annuity allows for the insurance of
longevity risk, and to varying extents, depending on product
design, can also provide protection against inflation and
investment risk.
Fixed annuities provide a payment that either remains
level or increases in a predetermined way. In low inflation
environments, a level annuity may provide reasonable protection,
but they remain susceptible to erosion from inflation. This
is a growing risk in an environment where pensioners are
living longer.
Another popular fixed annuity is one where the
pension payment increases in line with a specified, national
measure of consumer inflation. These annuities provide
pensioners with protection from inflation and longevity and
thus can give a high degree of certainty of retirement income.
However, in environments where real interest rates are low,
this level of protection can prove expensive.
Variable annuities seek to share risks between
policy-holders and the insurer in some way. Both investment
and mortality risks can be shared, which reduces the cost
of the insurance, but also exposes pensioners to some level
of inflation risk.
While defined benefit pension funds create their
own pools for risk diversification, they too can benefit from
annuities and other insurance products. A pension’s buy-out
involves the pension fund transferring all or a portion of
existing pensions and accrued service of active members to
an insurer. The insurer thus takes over the liability towards the
pension fund member or pensioner, relieving the sponsoring
employer of the impact of longevity or investment risks.
A pension’s buy-in leaves the liability to pensioners and
members in the fund, but involves the pension fund re-insuring
these benefits with an insurer. The pension fund holds a
policy which offsets the liabilities toward its members and
pensioners.
Some funds may wish to retain longevity risk, but
mitigate investment risks. Liability-driven investments allow
funds to reduce investment risk through adopting an asset
portfolio that closely matches behaviour of the benefit liability,
particular to movements in interest rates.
There is also growing demand for specific longevity
insurance, where investment risk is retained by the policy-holder,
but they are insured against improvements in mortality of
pensioners. Longevity swaps allow an investor to transfer
the financial impact of pensioners living longer than expected
to an insurer. Ideally, these products require greater support
from the capital markets.
While a range of insurance products are available to
households and pension funds, further innovation is required
to deal with longevity risk. The potential financial impact of
this longevity risk is enormous. Each additional year of life
expectancy raises pension liabilities by about 4-5%.15
To enable the financial services sector to manage
longevity risk more effectively, it is important to encourage
the transfer of longevity risk from the insurers to the capital
markets. By increasing the scope of the capital markets and
allowing securitization of longevity risk, greater diversification
across geography and demography can be achieved. In
addition, more efficient pricing of longevity risk is enabled.
Regulators thus have an important part to play in
ensuring a strong, viable insurance sector, and in eliminating
constraints that may stifle the necessary innovation required
to meet the challenges faced by the industry. Regulators can
encourage adequate capital controls and ensure protections
are in place by insurers, look to minimize regulatory arbitrage
across the insurance and pension industry, and ensure that
accounting and other disclosure requirements foster effective
insurance solutions.
Further, the challenges that pension systems face are
leading to the financial services industry being called upon to
foster and enable better provision by individuals and provide
more efficient delivery. Particularly in geographies where there
is a strong reliance on a defined contribution approach to
retirement provision, industry faces a twin challenge of providing
products that are simpler and cheaper for individuals while
providing customer experiences that are better, more
engaging and supportive. This requires innovation at a
product level (and including protection), as well as at an
operating model level.
Consolidation often results in lower margins. Government
can assist by framing clear governance requirements,
standardizing requirements, and simplifying regulatory and
legislative frameworks. The financial services sector thus
needs to respond innovatively. The development of safe
26 | Developing Future Social Protection Systems Retirement Income
5 Stakeholders’ Outcomes
products and solutions that can support supplementary
pension provision and diversify risks such as investment
volatility and longevity, while providing a customer experience
that is compelling, are required.
The financial services industry will also face greater
responsibility to educate and empower individuals. This can
be done through better disclosure of product information and
costs, using easy to understand communication, improved
customer experiences and engagement, cost-effective
distribution of advice and flexibility around channels of
communication.
5.5 All Stakeholders Part of Solution
The goal of deploying sustainable pension systems that
continue to provide broad coverage and adequate levels of
cover is an increasingly challenging and necessary one.
The impacts of an ageing population, economic and financial
challenges, and rising socioeconomic needs affect all systems.
What is becoming more evident is that the success of future
systems lies in how well all stakeholders work together
to address the challenge, rather than relying on solely on
government.
All stakeholders should work together towards
consensus when deciding which system is optimal for their
country. Each stakeholder has specific expectations. Some
expectations of different stakeholders might coincide, for
example, the demand for public risk coverage both from the
employer and the individual side. However, in most cases
the expectations will differ significantly in nature and extent.
Also, expectations might change during the life cycle of an
individual. People in their early 20s have different experiences
and expectations than people approaching retirement age.
As a result, the investigation of the intergroup relationships
within the pension system in a country is very important in
building an effective retirement environment.
Protection systems will still have to support social
solidarity. There must be a social protection floor, but individual
benefits also will have to be balanced. Therefore, reforms of
protection systems should have broad legislative support and
be backed by all groups represented in a country.
The challenges facing retirement systems in AMEs
and EMEs may sound insurmountable. No single system can
serve as blueprint waiting to be universally adopted. But there
is no reason for despair. Time and the marvels of compound
interest work in favour of courageous and prudent policy-makers.
Small and judicious changes implemented today will reap
big dividends in the future. It is time for all stakeholders of
financial retirement systems to secure this future.
notes
15 A mature market: Building capital market for longevity
risk. September 2012. Swiss Re Europe.
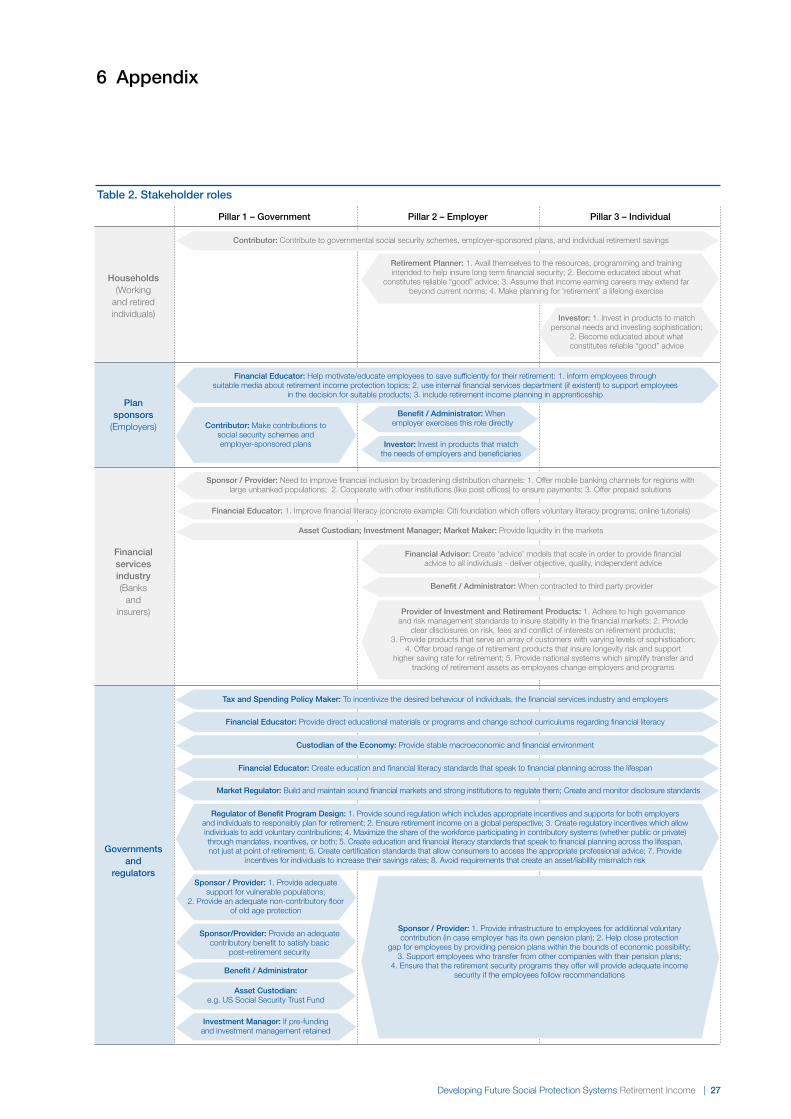
Developing Future Social Protection Systems Retirement Income | 27
6 Appendix
Pillar 1 – government Pillar 2 – employer Pillar 3 – individual
table 2. Stakeholder roles
Households (Working
and retired individuals)
Contributor: Contribute to governmental social security schemes, employer-sponsored plans, and individual retirement savings
retirement Planner: 1. Avail themselves to the resources, programming and training intended to help insure long term financial security; 2. Become educated about what
constitutes reliable “good” advice; 3. Assume that income earning careers may extend far beyond current norms; 4. Make planning for ‘retirement’ a lifelong exercise
investor: 1. Invest in products to match per so nal needs and investing sophistication;
2. Become edu cated about what constitutes reliable “good” advice
Plan sponsors
(Employers)
Financial educator: Help motivate/educate employees to save sufficiently for their retirement: 1. inform employees through suitable media about retirement income protection topics; 2. use internal financial services department (if existent) to support employees
in the decision for suitable products; 3. include retirement income planning in apprenticeship
Contributor: Make contributions to social security schemes and employer-sponsored plans
benefit / Administrator: When employer exercises this role directly
Financial services industry (Banks
and insurers)
Sponsor / Provider: Need to improve financial inclusion by broadening distribution channels: 1. Offer mobile banking channels for regions with large unbanked populations; 2. Cooperate with other institutions (like post offices) to ensure payments; 3. Offer prepaid solutions
Financial educator: 1. Improve financial literacy (concrete example: Citi foundation which offers voluntary literacy programs; online tutorials)
Financial Advisor: Create ‘advice’ models that scale in order to provide financial advice to all individuals - deliver objective, quality, independent advice
Asset Custodian; investment manager; market maker: Provide liquidity in the markets
benefit / Administrator: When contracted to third party provider
Provider of investment and retirement Products: 1. Adhere to high governanceand risk manage ment standards to insure stability in the financial markets; 2. Provide
clear disclosures on risk, fees and conflict of interests on retirement products; 3. Provide products that serve an array of customers with varying levels of sophistication;
4. Offer broad range of retirement products that insure longevity risk and support higher saving rate for retirement; 5. Provide national systems which simplify transfer and
tracking of retirement assets as employees change employers and programs
tax and Spending Policy maker: To incentivize the desired behaviour of individuals, the financial services industry and employers
Financial educator: Provide direct educational materials or programs and change school curriculums regarding financial literacy
Custodian of the economy: Provide stable macro economic and financial environment
Financial educator: Create education and financial literacy standards that speak to financial planning across the lifespan
market regulator: Build and maintain sound financial markets and strong institutions to regulate them; Create and monitor disclosure standards
regulator of benefit Program Design: 1. Provide sound regulation which includes appropriate incentives and supports for both employers and individuals to responsibly plan for retirement; 2. Ensure retirement income on a global perspective; 3. Create regulatory incentives which allow individuals to add voluntary contributions; 4. Maximize the share of the workforce participating in contributory systems (whether public or private) through mandates, incentives, or both; 5. Create education and financial literacy standards that speak to financial planning across the lifespan, not just at point of retirement; 6. Create certification standards that allow consumers to access the appropriate professional advice; 7. Provide
incentives for individuals to increase their savings rates; 8. Avoid requirements that create an asset/liability mismatch risk
Sponsor / Provider: 1. Provide adequate support for vulnerable populations;
2. Provide an adequate non-contri bu tory floor of old age protection
benefit / Administrator
Asset Custodian: e.g. US Social Security Trust Fund
investment manager: If pre-funding and in vest ment management retained
Sponsor / Provider: 1. Provide infrastructure to employees for additional voluntary contribution (in case em ployer has its own pension plan); 2. Help close protection
gap for employees by providing pension plans within the bounds of economic possibility; 3. Support employees who transfer from other com panies with their pension plans;
4. Ensure that the retirement security programs they offer will provide ade quate income security if the employees follow recommendations
governments and
regulators
Sponsor/Provider: Provide an adequate contri bu tory benefit to satisfy basic
post-retirement se curity
investor: Invest in products that match the needs of employers and beneficiaries
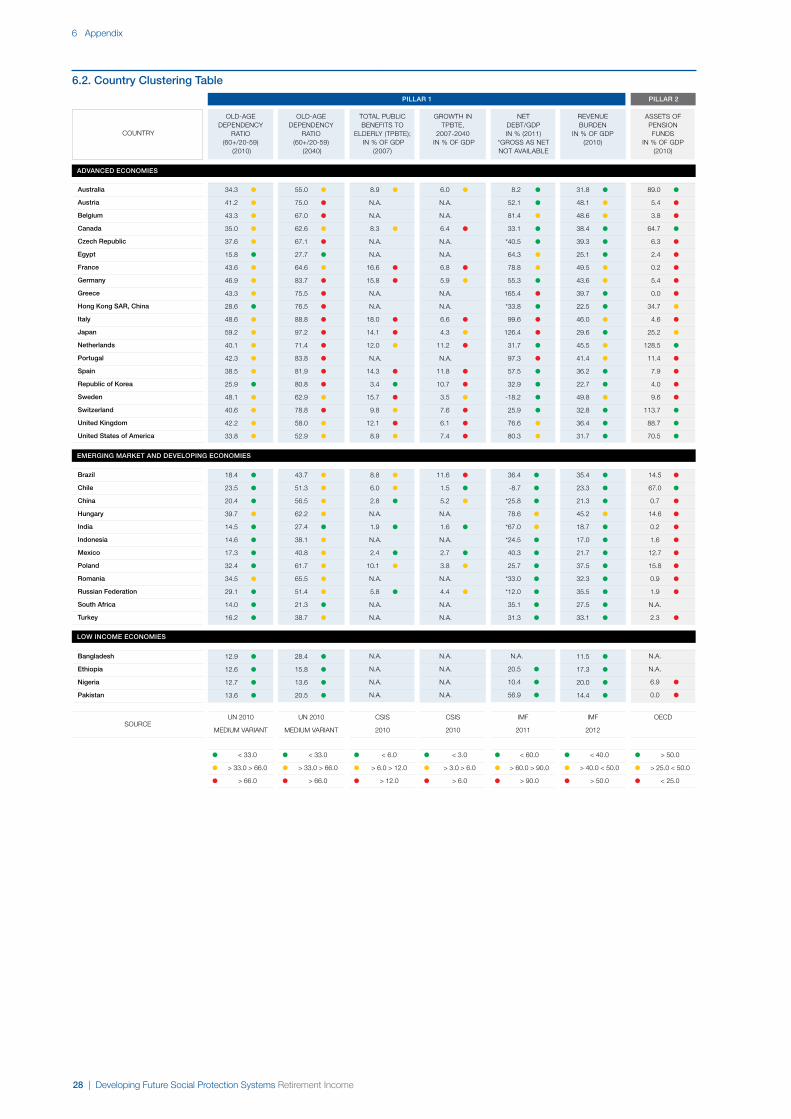
28 | Developing Future Social Protection Systems Retirement Income
6 Appendix
6.2. Country Clustering table
brazil
Chile
China
Hungary
india
indonesia
mexico
Poland
romania
russian Federation
South Africa
turkey
bangladesh
ethiopia
nigeria
Pakistan
Australia
Austria
belgium
Canada
Czech republic
egypt
France
germany
greece
Hong Kong SAr, China
italy
Japan
netherlands
Portugal
Spain
republic of Korea
Sweden
Switzerland
United Kingdom
United States of America
ADVAnCeD eConomieS
emerging mArKet AnD DeVeLoPing eConomieS
LoW inCome eConomieS
PiLLAr 1
COUNTRY
UN 2010
MEDIUM VARIANT
34.3 ●
41.2 ●
43.3 ●
35.0 ●
37.6 ●
15.8 ●
43.6 ●
46.9 ●
43.3 ●
28.6 ●
48.6 ●
59.2 ●
40.1 ●
42.3 ●
38.5 ●
25.9 ●
48.1 ●
40.6 ●
42.2 ●
33.8 ●
18.4 ●
23.5 ●
20.4 ●
39.7 ●
14.5 ●
14.6 ●
17.3 ●
32.4 ●
34.5 ●
29.1 ●
14.0 ●
16.2 ●
12.9 ●
12.6 ●
12.7 ●
13.6 ●
OLD-AGE DEPENDENCY
RATIO (60+/20-59)
(2010)
● < 33.0
● > 33.0 > 66.0
● > 66.0
SOURCE
55.0 ●
75.0 ●
67.0 ●
62.6 ●
67.1 ●
27.7 ●
64.6 ●
83.7 ●
75.5 ●
76.5 ●
88.8 ●
97.2 ●
71.4 ●
83.8 ●
81.9 ●
80.8 ●
62.9 ●
78.8 ●
58.0 ●
52.9 ●
43.7 ●
51.3 ●
56.5 ●
62.2 ●
27.4 ●
38.1 ●
40.8 ●
61.7 ●
65.5 ●
51.4 ●
21.3 ●
38.7 ●
28.4 ●
15.8 ●
13.6 ●
20.5 ●
OLD-AGE DEPENDENCY
RATIO (60+/20-59)
(2040)
UN 2010
MEDIUM VARIANT
● < 33.0
● > 33.0 > 66.0
● > 66.0
8.9 ●
N.A.
N.A.
8.3 ●
N.A.
N.A.
16.6 ●
15.8 ●
N.A.
N.A.
18.0 ●
14.1 ●
12.0 ●
N.A.
14.3 ●
3.4 ●
15.7 ●
9.8 ●
12.1 ●
8.9 ●
8.8 ●
6.0 ●
2.8 ●
N.A.
1.9 ●
N.A.
2.4 ●
10.1 ●
N.A.
5.8 ●
N.A.
N.A.
N.A.
N.A.
N.A.
N.A.
TOTAL PUBLIC BENEFITS TO
ELDERLY (TPBTE); IN % OF GDP
(2007)
CSIS
2010
● < 6.0
● > 6.0 > 12.0
● > 12.0
6.0 ●
N.A.
N.A.
6.4 ●
N.A.
N.A.
6.8 ●
5.9 ●
N.A.
N.A.
6.6 ●
4.3 ●
11.2 ●
N.A.
11.8 ●
10.7 ●
3.5 ●
7.6 ●
6.1 ●
7.4 ●
11.6 ●
1.5 ●
5.2 ●
N.A.
1.6 ●
N.A.
2.7 ●
3.8 ●
N.A.
4.4 ●
N.A.
N.A.
N.A.
N.A.
N.A.
N.A.
GROWTH IN TPBTE,
2007-2040 IN % OF GDP
CSIS
2010
● < 3.0
● > 3.0 > 6.0
● > 6.0
8.2 ●
52.1 ●
81.4 ●
33.1 ●
*40.5 ●
64.3 ●
78.8 ●
55.3 ●
165.4 ●
*33.8 ●
99.6 ●
126.4 ●
31.7 ●
97.3 ●
57.5 ●
32.9 ●
-18.2 ●
25.9 ●
76.6 ●
80.3 ●
36.4 ●
-8.7 ●
*25.8 ●
78.6 ●
*67.0 ●
*24.5 ●
40.3 ●
25.7 ●
*33.0 ●
*12.0 ●
35.1 ●
31.3 ●
N.A.
20.5 ●
10.4 ●
56.9 ●
NETDEBT/GDP IN % (2011)
*GROSS AS NET NOT AVAILABLE
IMF
2011
● < 60.0
● > 60.0 > 90.0
● > 90.0
31.8 ●
48.1 ●
48.6 ●
38.4 ●
39.3 ●
25.1 ●
49.5 ●
43.6 ●
39.7 ●
22.5 ●
46.0 ●
29.6 ●
45.5 ●
41.4 ●
36.2 ●
22.7 ●
49.8 ●
32.8 ●
36.4 ●
31.7 ●
35.4 ●
23.3 ●
21.3 ●
45.2 ●
18.7 ●
17.0 ●
21.7 ●
37.5 ●
32.3 ●
35.5 ●
27.5 ●
33.1 ●
11.5 ●
17.3 ●
20.0 ●
14.4 ●
REVENUE BURDEN
IN % OF GDP (2010)
IMF
2012
● < 40.0
● > 40.0 < 50.0
● > 50.0
PiLLAr 2
OECD
89.0 ●
5.4 ●
3.8 ●
64.7 ●
6.3 ●
2.4 ●
0.2 ●
5.4 ●
0.0 ●
34.7 ●
4.6 ●
25.2 ●
128.5 ●
11.4 ●
7.9 ●
4.0 ●
9.6 ●
113.7 ●
88.7 ●
70.5 ●
14.5 ●
67.0 ●
0.7 ●
14.6 ●
0.2 ●
1.6 ●
12.7 ●
15.8 ●
0.9 ●
1.9 ●
N.A.
2.3 ●
N.A.
N.A.
6.9 ●
0.0 ●
ASSETS OF PENSION FUNDS
IN % OF GDP (2010)
● > 50.0
● > 25.0 < 50.0
● < 25.0
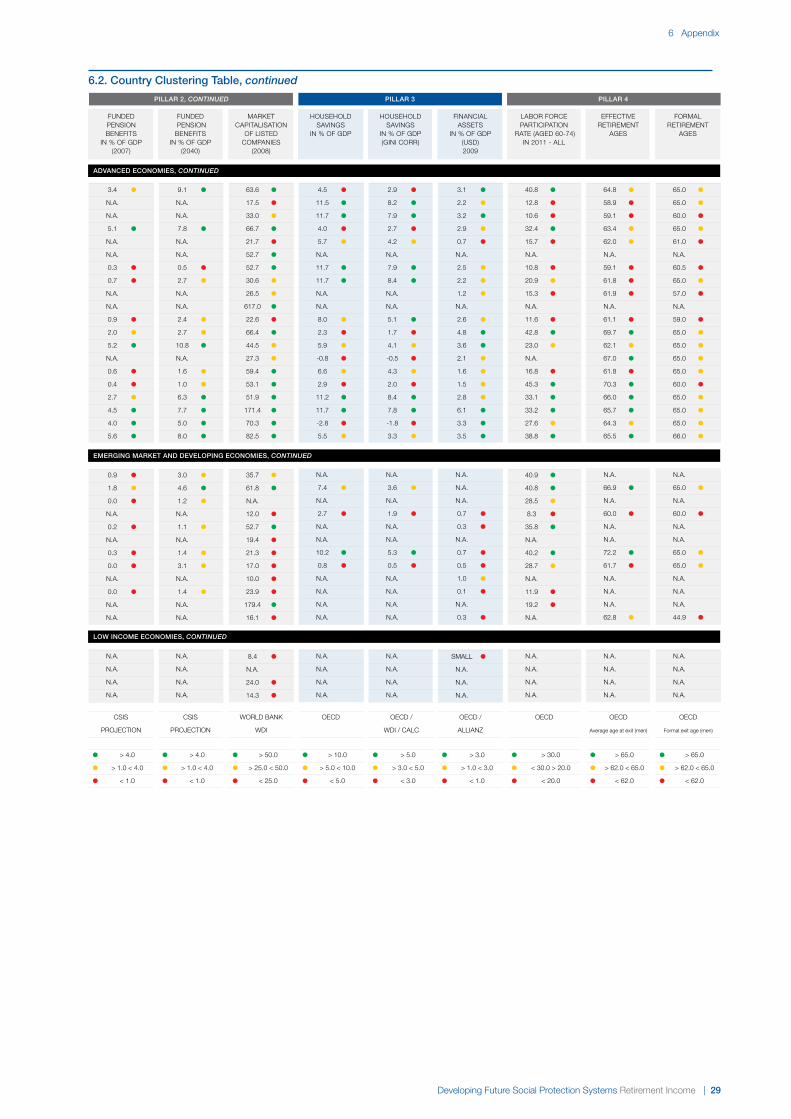
Developing Future Social Protection Systems Retirement Income | 29
6 Appendix
3.4 ●
N.A.
N.A.
5.1 ●
N.A.
N.A.
0.3 ●
0.7 ●
N.A.
N.A.
0.9 ●
2.0 ●
5.2 ●
N.A.
0.6 ●
0.4 ●
2.7 ●
4.5 ●
4.0 ●
5.6 ●
0.9 ●
1.8 ●
0.0 ●
N.A.
0.2 ●
N.A.
0.3 ●
0.0 ●
N.A.
0.0 ●
N.A.
N.A.
N.A.
N.A.
N.A.
N.A.
FUNDED PENSION BENEFITS
IN % OF GDP (2007)
CSIS
PROJECTION
● > 4.0
● > 1.0 < 4.0
● < 1.0
9.1 ●
N.A.
N.A.
7.8 ●
N.A.
N.A.
0.5 ●
2.7 ●
N.A.
N.A.
2.4 ●
2.7 ●
10.8 ●
N.A.
1.6 ●
1.0 ●
6.3 ●
7.7 ●
5.0 ●
8.0 ●
3.0 ●
4.6 ●
1.2 ●
N.A.
1.1 ●
N.A.
1.4 ●
3.1 ●
N.A.
1.4 ●
N.A.
N.A.
N.A.
N.A.
N.A.
N.A.
FUNDED PENSION BENEFITS
IN % OF GDP (2040)
CSIS
PROJECTION
● > 4.0
● > 1.0 < 4.0
● < 1.0
63.6 ●
17.5 ●
33.0 ●
66.7 ●
21.7 ●
52.7 ●
52.7 ●
30.6 ●
26.5 ●
617.0 ●
22.6 ●
66.4 ●
44.5 ●
27.3 ●
59.4 ●
53.1 ●
51.9 ●
171.4 ●
70.3 ●
82.5 ●
35.7 ●
61.8 ●
N.A.
12.0 ●
52.7 ●
19.4 ●
21.3 ●
17.0 ●
10.0 ●
23.9 ●
179.4 ●
16.1 ●
8.4 ●
N.A.
24.0 ●
14.3 ●
MARKET CAPITALISATION
OF LISTED COMPANIES
(2008)
WORLD BANK
WDI
● > 50.0
● > 25.0 < 50.0
● < 25.0
PiLLAr 3
OECD
4.5 ●
11.5 ●
11.7 ●
4.0 ●
5.7 ●
N.A.
11.7 ●
11.7 ●
N.A.
N.A.
8.0 ●
2.3 ●
5.9 ●
-0.8 ●
6.6 ●
2.9 ●
11.2 ●
11.7 ●
-2.8 ●
5.5 ●
N.A.
7.4 ●
N.A.
2.7 ●
N.A.
N.A.
10.2 ●
0.8 ●
N.A.
N.A.
N.A.
N.A.
N.A.
N.A.
N.A.
N.A.
HOUSEHOLD SAVINGS
IN % OF GDP
● > 10.0
● > 5.0 < 10.0
● < 5.0
2.9 ●
8.2 ●
7.9 ●
2.7 ●
4.2 ●
N.A.
7.9 ●
8.4 ●
N.A.
N.A.
5.1 ●
1.7 ●
4.1 ●
-0.5 ●
4.3 ●
2.0 ●
8.4 ●
7.8 ●
-1.8 ●
3.3 ●
N.A.
3.6 ●
N.A.
1.9 ●
N.A.
N.A.
5.3 ●
0.5 ●
N.A.
N.A.
N.A.
N.A.
N.A.
N.A.
N.A.
N.A.
HOUSEHOLD SAVINGS
IN % OF GDP (GINI CORR)
OECD /
WDI / CALC
● > 5.0
● > 3.0 < 5.0
● < 3.0
3.1 ●
2.2 ●
3.2 ●
2.9 ●
0.7 ●
N.A.
2.5 ●
2.2 ●
1.2 ●
N.A.
2.6 ●
4.8 ●
3.6 ●
2.1 ●
1.6 ●
1.5 ●
2.8 ●
6.1 ●
3.3 ●
3.5 ●
N.A.
N.A.
N.A.
0.7 ●
0.3 ●
N.A.
0.7 ●
0.5 ●
1.0 ●
0.1 ●
N.A.
0.3 ●
SMALL ●
N.A.
N.A.
N.A.
FINANCIAL ASSETS
IN % OF GDP (USD) 2009
OECD /
ALLIANZ
● > 3.0
● > 1.0 < 3.0
● < 1.0
65.0 ●
65.0 ●
60.0 ●
65.0 ●
61.0 ●
N.A.
60.5 ●
65.0 ●
57.0 ●
N.A.
59.0 ●
65.0 ●
65.0 ●
65.0 ●
65.0 ●
60.0 ●
65.0 ●
65.0 ●
65.0 ●
66.0 ●
N.A.
65.0 ●
N.A.
60.0 ●
N.A.
N.A.
65.0 ●
65.0 ●
N.A.
N.A.
N.A.
44.9 ●
N.A.
N.A.
N.A.
N.A.
PiLLAr 4
FORMAL RETIREMENT
AGES
OECD
40.8 ●
12.8 ●
10.6 ●
32.4 ●
15.7 ●
N.A.
10.8 ●
20.9 ●
15.3 ●
N.A.
11.6 ●
42.8 ●
23.0 ●
N.A.
16.8 ●
45.3 ●
33.1 ●
33.2 ●
27.6 ●
38.8 ●
40.9 ●
40.8 ●
28.5 ●
8.3 ●
35.8 ●
N.A.
40.2 ●
28.7 ●
N.A.
11.9 ●
19.2 ●
N.A.
N.A.
N.A.
N.A.
N.A.
LABOR FORCE PARTICIPATION
RATE (AGED 60-74) IN 2011 - ALL
● > 30.0
● < 30.0 > 20.0
● < 20.0
64.8 ●
58.9 ●
59.1 ●
63.4 ●
62.0 ●
N.A.
59.1 ●
61.8 ●
61.9 ●
N.A.
61.1 ●
69.7 ●
62.1 ●
67.0 ●
61.8 ●
70.3 ●
66.0 ●
65.7 ●
64.3 ●
65.5 ●
N.A.
66.9 ●
N.A.
60.0 ●
N.A.
N.A.
72.2 ●
61.7 ●
N.A.
N.A.
N.A.
62.8 ●
N.A.
N.A.
N.A.
N.A.
EFFECTIVE RETIREMENT
AGES
OECD
Average age at exit (men)
● > 65.0
● > 62.0 < 65.0
● < 62.0
OECD
Formal exit age (men)
● > 65.0
● > 62.0 < 65.0
● < 62.0
ADVAnCeD eConomieS, continued
emerging mArKet AnD DeVeLoPing eConomieS, continued
LoW inCome eConomieS, continued
PiLLAr 2, continued
6.2. Country Clustering table, continued
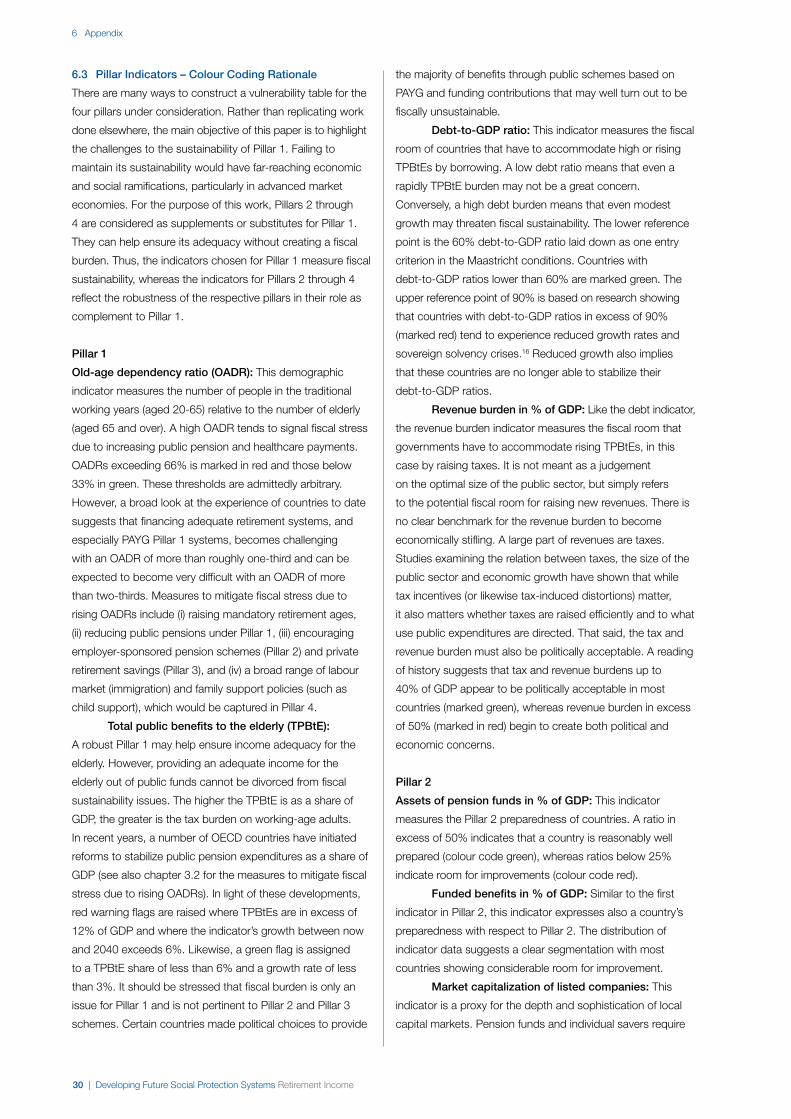
30 | Developing Future Social Protection Systems Retirement Income
6 Appendix
6.3 Pillar indicators – Colour Coding rationale
There are many ways to construct a vulnerability table for the
four pillars under consideration. Rather than replicating work
done elsewhere, the main objective of this paper is to highlight
the challenges to the sustainability of Pillar 1. Failing to
maintain its sustainability would have far-reaching economic
and social ramifications, particularly in advanced market
economies. For the purpose of this work, Pillars 2 through
4 are considered as supplements or substitutes for Pillar 1.
They can help ensure its adequacy without creating a fiscal
burden. Thus, the indicators chosen for Pillar 1 measure fiscal
sustainability, whereas the indicators for Pillars 2 through 4
reflect the robustness of the respective pillars in their role as
complement to Pillar 1.
Pillar 1
old-age dependency ratio (oADr): This demographic
indicator measures the number of people in the traditional
working years (aged 20-65) relative to the number of elderly
(aged 65 and over). A high OADR tends to signal fiscal stress
due to increasing public pension and healthcare payments.
OADRs exceeding 66% is marked in red and those below
33% in green. These thresholds are admittedly arbitrary.
However, a broad look at the experience of countries to date
suggests that financing adequate retirement systems, and
especially PAYG Pillar 1 systems, becomes challenging
with an OADR of more than roughly one-third and can be
expected to become very difficult with an OADR of more
than two-thirds. Measures to mitigate fiscal stress due to
rising OADRs include (i) raising mandatory retirement ages,
(ii) reducing public pensions under Pillar 1, (iii) encouraging
employer-sponsored pension schemes (Pillar 2) and private
retirement savings (Pillar 3), and (iv) a broad range of labour
market (immigration) and family support policies (such as
child support), which would be captured in Pillar 4.
total public benefits to the elderly (tPbte):
A robust Pillar 1 may help ensure income adequacy for the
elderly. However, providing an adequate income for the
elderly out of public funds cannot be divorced from fiscal
sustainability issues. The higher the TPBtE is as a share of
GDP, the greater is the tax burden on working-age adults.
In recent years, a number of OECD countries have initiated
reforms to stabilize public pension expenditures as a share of
GDP (see also chapter 3.2 for the measures to mitigate fiscal
stress due to rising OADRs). In light of these developments,
red warning flags are raised where TPBtEs are in excess of
12% of GDP and where the indicator’s growth between now
and 2040 exceeds 6%. Likewise, a green flag is assigned
to a TPBtE share of less than 6% and a growth rate of less
than 3%. It should be stressed that fiscal burden is only an
issue for Pillar 1 and is not pertinent to Pillar 2 and Pillar 3
schemes. Certain countries made political choices to provide
the majority of benefits through public schemes based on
PAYG and funding contributions that may well turn out to be
fiscally unsustainable.
Debt-to-gDP ratio: This indicator measures the fiscal
room of countries that have to accommodate high or rising
TPBtEs by borrowing. A low debt ratio means that even a
rapidly TPBtE burden may not be a great concern.
Conversely, a high debt burden means that even modest
growth may threaten fiscal sustainability. The lower reference
point is the 60% debt-to-GDP ratio laid down as one entry
criterion in the Maastricht conditions. Countries with
debt-to-GDP ratios lower than 60% are marked green. The
upper reference point of 90% is based on research showing
that countries with debt-to-GDP ratios in excess of 90%
(marked red) tend to experience reduced growth rates and
sovereign solvency crises.16 Reduced growth also implies
that these countries are no longer able to stabilize their
debt-to-GDP ratios.
revenue burden in % of gDP: Like the debt indicator,
the revenue burden indicator measures the fiscal room that
governments have to accommodate rising TPBtEs, in this
case by raising taxes. It is not meant as a judgement
on the optimal size of the public sector, but simply refers
to the potential fiscal room for raising new revenues. There is
no clear benchmark for the revenue burden to become
economically stifling. A large part of revenues are taxes.
Studies examining the relation between taxes, the size of the
public sector and economic growth have shown that while
tax incentives (or likewise tax-induced distortions) matter,
it also matters whether taxes are raised efficiently and to what
use public expenditures are directed. That said, the tax and
revenue burden must also be politically acceptable. A reading
of history suggests that tax and revenue burdens up to
40% of GDP appear to be politically acceptable in most
countries (marked green), whereas revenue burden in excess
of 50% (marked in red) begin to create both political and
economic concerns.
Pillar 2
Assets of pension funds in % of gDP: This indicator
measures the Pillar 2 preparedness of countries. A ratio in
excess of 50% indicates that a country is reasonably well
prepared (colour code green), whereas ratios below 25%
indicate room for improvements (colour code red).
Funded benefits in % of gDP: Similar to the first
indicator in Pillar 2, this indicator expresses also a country’s
preparedness with respect to Pillar 2. The distribution of
indicator data suggests a clear segmentation with most
countries showing considerable room for improvement.
market capitalization of listed companies: This
indicator is a proxy for the depth and sophistication of local
capital markets. Pension funds and individual savers require
Developing Future Social Protection Systems Retirement Income | 31
6 Appendix
a broad range of financial products in which to invest and
that can be traded in liquid markets. A ratio in excess of 50%
indicates that a country is reasonably well prepared (colour
code green), whereas ratios below 25% indicate room for
improvements (colour code red).
Pillar 3
Household savings in % of gDP (uncorrected and
gini-corrected): Saving for retirement is a complex undertaking
with the outcome depending on time (years dedicated to saving),
income growth during working years, investment yields,
desired income replacement level, inflation and the amount
of expected public retirement benefits (just to mention a few
key factors). A recent study on financial planning in the US
shows that a 30-year old individual earning US$ 40,000 with
no previous savings and desiring to save for an 80% income
replacement level would have to save 10% of net income.17
It is difficult to determine how micro-level saving
studies should translate into an optimal aggregate household
savings rate. However, a number of studies suggest that
household tend to save less than what would be required to
maintain the pre-retirement living standard after retirement.
Moreover, economic models of saving suggest that, given the
longevity challenge, aggregate saving should increase in line
with the lengthening of retirement years.
In light of these considerations, and to provide a
conservative estimate, it is suggested that to achieve an
adequate retirement income, the uncorrected household
savings ratio should be higher than 10% (colour code green).
An uncorrected savings ratio of less than 5% would in
contrast place the country in the colour code red.
The reason behind providing a gini-corrected
savings ratio takes as a starting point that high-income
households tend to save a larger share of their disposable
income (i.e. income net of taxes and other contributions) than
low-income households. Thus, national income data give a
distorted picture of savings when income inequality is high.
In those countries, the mean savings ratio is always higher
than the median savings ratio. Unfortunately, median
savings ratios are rarely reported, if they are reported at
all. For these reasons, the paper offers a correction that
accounts for income inequality. The conversion formula is
simple. Let S denote the savings ratio (household savings in
% of GDP) as reported by national income statistics, and
GV be the Gini coefficients as reported by the World Bank,
then the Gini-corrected savings ratio S-corr becomes
S-corr = S(1-GV/100).
Thus, countries with a highly unequal income distribution
will have a lower Gini-corrected savings ratio than countries
with a more equal income distribution, indicating that the
bulk of the population in unequal societies is likely not saving
enough for retirement purposes.
Financial assets in % of gDP: This ratio sets the
financial assets per capita in correlation to the Gross Domestic
Product (GDP) per capita and serves as an indicator for the
wealth of individuals of a country.
Pillar 4
Labour force participation rate (aged 60 to 74): This
indicator is based on the recognition that extending part- and
full-time time employment opportunities for older workers
will make an important contribution toward increasing the
sustainability of financial retirement schemes. This study takes
as benchmark the employment rate (aged 15 to 64), which
for the average of OECD countries is about 65%. Based on
this, one could consider as desirable (colour-code green) an
employment rate in excess of 30% (which is roughly half the
employment rate of the working population), whereas an
employment rate of less than 20% would be colour coded red.
retirement ages (formal and effective): This indicator
takes as starting point that the formal retirement age of 65,
which is the unachieved norm in most advanced market
economies, is no longer in line with the longevity challenges.
Consequently, the bar for a green colour code is set at the
retirement age of 67, whereas retirement ages below 63 will
be colour coded in red.
notes
16 Reinhart, Carmen and Kenneth Rogoff. This Time Is
Different: Eight Centuries of Financial Folly. New Jersey:
Princeton University Press, 2009.
17 Ibbotson, Robert and James Xiong, Robert P. Kreitler,
Charles F. Kreitler, Peng Chen. National Savings Rate
Guidelines for Individuals. In FPA Journal, 2007.
The World Economic Forumis an independent international organization committed toimproving the state of the worldby engaging business, political, academic, and other leaders of society to shape global, regional,and industry agendas.
Incorporated as a not-for-profit foundation in 1971 and headquartered in Geneva, Switzerland, the Forum istied to no political, partisan,or national interests.
World Economic Forum91-93 route de la CapiteCH-1223 Cologny/GenevaSwitzerland
Tel +41 (0) 22 869 1212Fax +41 (0) 22 786 2744