Embed Size (px)
Citation preview

Developing Effective Performance MeasurementsDeveloping Effective Performance Measurements

2
2
Begin to Think Differently About Performance Measurement Using
• Why You Need to Measure
• How You Can Measure with a Purpose
• What Risks You Need to Consider
Introduction- Introduction- The Theme

3
3
The Red Bead Experiment:• Is an interactive exercise to expose everyone to
the advantages of a systems approach to measuring
• It will demonstrate that traditional management practices will not affect or produce the desired outcome
• Emphasize the importance of top management decisions to ensuring safety as an outcome
• Show how statistical analysis can identify inherent variation
Introduction- AgendaIntroduction- Agenda

4
4
• How to link statistical analysis and performance measurement– Overview of sequential steps– Identifying your organizational risks– Recognize Leading and Lagging performance
indicators– Making the links to your management System,
goals and objectives
Introduction- AgendaIntroduction- Agenda

5
5
Introduction- AgendaIntroduction- Agenda
Some Real-Life Examples from our aviation community
• Focussing on examples of analysis (accident rates or hazard frequencies)– Counting and trending-Power of control charting– Using Statistical control to recognize opportunities
for continuous improvement

6
6
Introduction- AgendaIntroduction- Agenda
Interactive Exercise using a Process Example• Aligning your Performance Measures to
Your Risks– How it fits into the mgmt review– When do you measure– What are your risks– How will you change what you do– How do you monitor– How do you feedback

7
7
Summary and Closure
Discuss the Main Take-Aways from the session
Introduction- AgendaIntroduction- Agenda

Deming’s Red Bead Experiment:Deming’s Red Bead Experiment:With a TwistWith a Twist
9
9
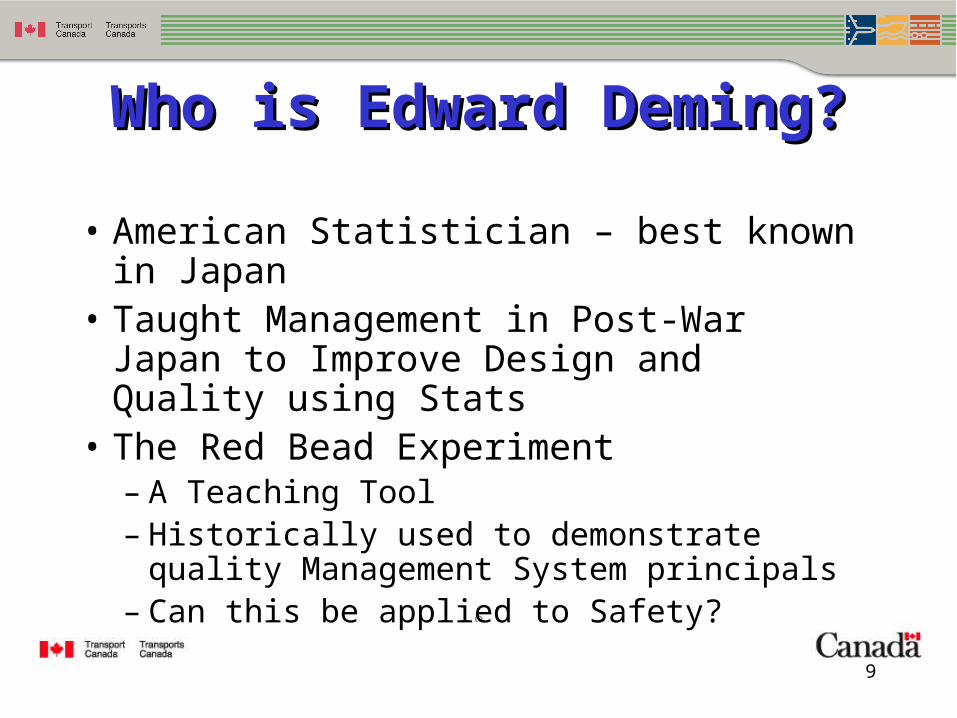
Who is Edward Deming?Who is Edward Deming?
• American Statistician – best known in Japan• Taught Management in Post-War Japan to
Improve Design and Quality using Stats• The Red Bead Experiment
– A Teaching Tool– Historically used to demonstrate quality
Management System principals– Can this be applied to Safety?

10
10
What we Need:What we Need:
• 6 Volunteers!
• 4 “Willing” Workers
• 2 Safety Inspectors
11
11
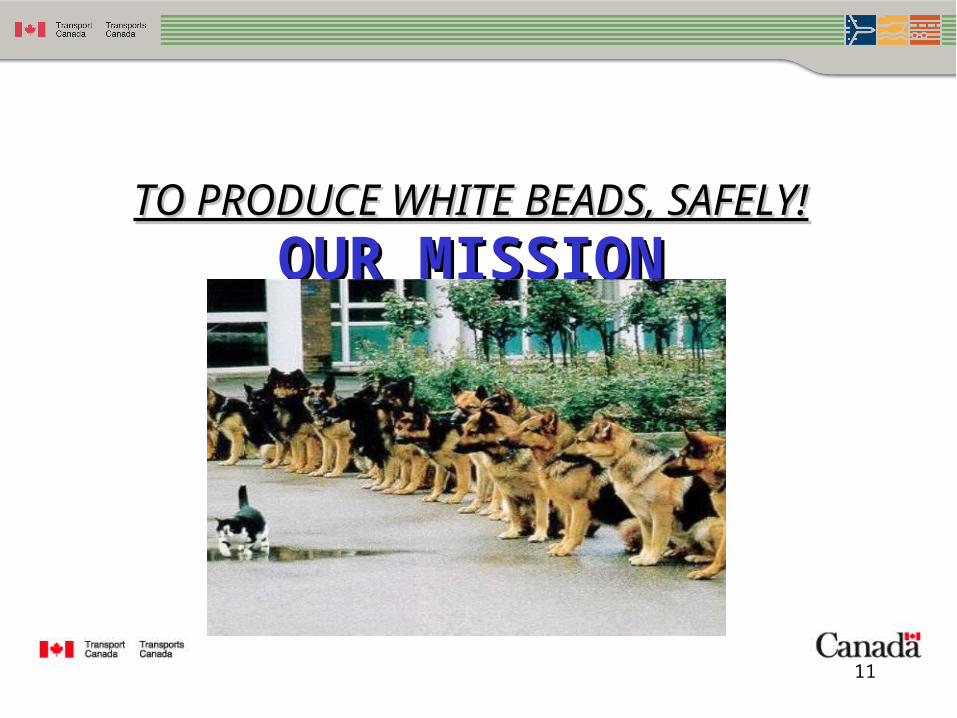
OUR MISSIONOUR MISSIONTO PRODUCE WHITE BEADS, SAFELY!TO PRODUCE WHITE BEADS, SAFELY!

12
12
THE EXPERIMENT:THE EXPERIMENT:
• The “Production” of each White Bead follows a Process
• Processes inherently have “risks” (or Red Beads) that can impact on Safety
• The White Beads can be a metaphor for anything – they are an output (Flight to X, Repair of Y, Painting of Z, Storage of W, etc)

13
13
THE EXPERIMENT:THE EXPERIMENT:
• OBJECTIVE:Produce Something (White Bead),
following a pre-determined Process, safely (ie. Without Red Beads)

14
14
TRAININGTRAINING
1. Each “willing worker,” dips the paddle into the box of beads for his/her first day of production
2. Safety inspectors identify and count the number of risks in “Producing”
3. Chief Safety Inspector of the company announces the result, records and dismisses

15
15
PRODUCTION STAGE 1PRODUCTION STAGE 1

16
16
PRODUCTION STAGE 2PRODUCTION STAGE 2
• Production Standard: No more than 3 Red Beads today per worker!
17
17
AWARDS CEREMONYAWARDS CEREMONY

18
18
PRODUCTION STAGE 3PRODUCTION STAGE 3
• Motivation!

19
19
PRODUCTION STAGE 4PRODUCTION STAGE 4

20
20
THE RESULTSTHE RESULTS
• Chart

21
21
WHAT DOES THIS TELL USWHAT DOES THIS TELL US
• The system is at fault, not the “Workers”
• Management must change the system
• Performance Measures need to look at the system and process, not just at the people
22
22
WHAT MESSAGES ARE IN WHAT MESSAGES ARE IN THIS EXPERIMENT?THIS EXPERIMENT?
It's the system, not the workers. If you
want to improve performance, you
must work on the system.

23
23
WHAT MESSAGES ARE IN WHAT MESSAGES ARE IN THIS EXPERIMENT?THIS EXPERIMENT?
Safety is made at the top. Safety is an
outcome of the system. Top
management owns the system.

24
24
WHAT MESSAGES ARE IN WHAT MESSAGES ARE IN THIS EXPERIMENT?THIS EXPERIMENT?
Numerical goals and production
standards can become meaningless.
The number of red beads produced is
determined by the process, not by the
standard.
25
25
WHAT MESSAGES ARE IN WHAT MESSAGES ARE IN THIS EXPERIMENT?THIS EXPERIMENT?
Rewarding or punishing the Willing
Workers had no effect on the outcome.
Extrinsic motivation is not effective.

26
26
WHAT MESSAGES ARE IN WHAT MESSAGES ARE IN THIS EXPERIMENT?THIS EXPERIMENT?
Rigid and precise procedures are not
sufficient to produce the desired
Safety.

27
27
WHAT MESSAGES ARE IN WHAT MESSAGES ARE IN THIS EXPERIMENT?THIS EXPERIMENT?
People are not always the dominant
source of variability .

28
28
WHAT MESSAGES ARE IN WHAT MESSAGES ARE IN THIS EXPERIMENT?THIS EXPERIMENT?
Slogans, Exhortations and Posters Are
Not Always Useful To The Willing
Worker.

29
29
IN SUMMARYIN SUMMARY
• Be Cautious about misusing performance data > Needs to focus on the process
30
30
NOW WHAT?NOW WHAT?
WHEN YOU NEED A FUNDAMENTAL WHEN YOU NEED A FUNDAMENTAL
CHANGE TO YOUR SYSTEM:CHANGE TO YOUR SYSTEM:
HOW CAN YOU USE
STATISTICAL ANALYSIS TO SHOW IF
YOU ARE ACHIEVING WHAT YOU
WANT?

31
31
BREAK (15 Minutes)BREAK (15 Minutes)

32
32
Linking Performance Measures&Statistical Analysis

33
33
1.0 Safety Management Plan1.1 Safety Policy1.2 Non-punitive Policy1.3 Roles, Responsibilities & Employees1.4 Communication1.5 Safety Planning – Objectives & Goals1.6 Performance Measurement1.7 Management Review
2.0 Document Management2.1 Identification & Maintenance of
Regulations2.2 SMS Documentation2.3 Records Management
3.0 Safety Oversight3.1 Reactive Processes3.2 Proactive Processes3.3 Investigation and Analysis3.4 Risk Management
4.0 Training4.1 Training, Awareness & Competence
5.0 Quality Assurance5.1 Operational Quality Assurance
6.0 Emergency Preparedness6.1 Emergency Preparedness and Response
Appendix A

34
34
1.0 Safety Management Plan1.1 Safety Policy1.5 Safety Planning – Objectives & Goals1.6 Performance Measurement1.7 Management Review
3.0 Safety Oversight3.1 Reactive Processes3.2 Proactive Processes3.3 Investigation and Analysis3.4 Risk Management
5.0 Quality Assurance5.1 Operational Quality Assurance
SMS Operational Measurement Elements

35
35
Essential SMS Measurement Elements
1.0 Safety Management Plan1.1 Safety Policy1.5 Safety Planning – Objectives & Goals1.6 Performance Measurement1.7 Management Review
3.0 Safety Oversight3.1 Reactive Processes3.2 Proactive Processes3.3 Investigation and Analysis3.4 Risk Management

36
36
Where to look to find measurable
•Safety policy objectives•Process purpose statement•Management decision duties•Hazard registry – risks•Control graphs•Aviation publications•Safety case•Industry associations•Intuition•Feedback

37
37
1. Ensure that aviation safety is our number one priority.2. Document, implement and maintain and effective SMS3. Meet or exceed all applicable regulatory requirements.4. Establish and sustain a continual improvement philosophy.5. Encourage employee participation and support their efforts.6. Reduce and eradicate the real and potential causes of incidents or accidents.7. Identify and control all known and potential hazards to aviation safety.8. Implement a non-punitive policy for the security of all employees.
SP Objectives Examples

38
38
1) To define the method and process to be used for the scheduling and implementing of aircraft maintenance services to ensure consistent quality and safety of the service.
Purpose Measurable
•On-time scheduling•Qty of recalls•Qty of emergency repairs•Duration of repairs•Spare parts inventory value•Reported hazards
2) To establish a method that allows for continual improvement, including preventive actions, throughout all aspects of the organization that have an affect on quality, safety, service and price
•Preventive actions•Qty of reported hazards•CADORS reduction•Incidents / accident rate•Positive impacts on processes•Cost reductions•Improved margins•Efficiency

39
39
Purpose Measurable
To review/analyze reports and provide feedback to maintenance managers so that they can make change to procedures/training to reduce damage to aircraft by employees conducting maintenance.
•Qty of reports•Cost of damages•Down time for A/C•Types of damage – how•Types of maintenance•Competency•Procedure impacts
This above example is an actual purpose statement currentlyin use today

40
40
Example of an actual measurement practicedin industry to reduce or eliminate hanger rash
Purpose Statement:
To review/analyze reports and provide feedback
to maintenance managers so that they can make
change to procedures/training to reduce damage to
aircraft by employees conducting maintenance.

41
41
Damage To Aircraft In The Completion Of Tasks
Date Report # Year Month23-Jan-06 1483 6 1 Q1 2006 21-Feb-06 1516 6 2 Q2 2006 0
21-Feb-06 1606 6 2 Q3 2006 116-Feb-06 1584 6 2 Q4 2006 014-Sep-06 2047 6 9 Q1 2007 112-Mar-07 2624 7 3 Q2 2007 14-Feb-07 2705 7 4 Q3 2007 0
15-Nov-07 3393 7 11 Q4 2007 520-Nov-07 3401 7 11 Q1 2008 921-Nov-07 3409 7 11 Q2 2008 326-Nov-07 3431 7 11 Q3 2008 53-Dec-07 3463 7 12 Q4 2008 6
11-Jan-08 3597 8 1 Q1 2009 1125-Jan-08 3643 8 1 Q2 2009 25-Feb-08 3687 8 2 Q3 2009 48-Feb-08 3699 8 2 Q4 2009 7
26-Feb-08 3773 8 2 Q1 2010 429-Feb-08 3771 8 2 Q2 2010 25-Mar-08 3793 8 3 Q3 2010 1
25-Mar-08 3889 8 320-Mar-08 3899 8 3
8-Jul-08 4176 8 7
Portion of the Excel spreadsheet and the capturing of data

42
42
DAMAGE TO AIRCRAFT
0
1
2
3
4
5
6
7
8
9
10
11
12
13
14
15
Q1
20
06
Q2
20
06
Q3
20
06
Q4
20
06
Q1
20
07
Q2
20
07
Q3
20
07
Q4
20
07
Q1
20
08
Q2
20
08
Q3
20
08
Q4
20
08
Q1
20
09
Q2
20
09
Q3
20
09
Q4
20
09
Q1
20
10
Q2
20
10
Q3
20
10
QUARTER
NU
MB
ER
OF
RE
PO
RT
S
DAMAGE REPORTS
Captured data displayed in a bar graph

43
43
DAMAGE TO AIRCRAFT
0
1
2
3
4
5
6
7
8
9
10
11
12
13
14
15
Q1
20
06
Q2
20
06
Q3
20
06
Q4
20
06
Q1
20
07
Q2
20
07
Q3
20
07
Q4
20
07
Q1
20
08
Q2
20
08
Q3
20
08
Q4
20
08
Q1
20
09
Q2
20
09
Q3
20
09
Q4
20
09
Q1
20
10
Q2
20
10
Q3
20
10
QUARTERN
UM
BE
R O
F R
EP
OR
TS
DAMAGE REPORTS
Observations• corrective actions to employee filed reports may not be effective. • potential trend existed
Corrective Actions• mined reports from the previous years and plotted them in the graph • specific training was provided • heightened awareness
1st Qtr -09
Action Taken

44
44
DAMAGE TO AIRCRAFT
0
1
2
3
4
5
6
7
8
9
10
11
12
13
14
15
Q1
20
06
Q2
20
06
Q3
20
06
Q4
20
06
Q1
20
07
Q2
20
07
Q3
20
07
Q4
20
07
Q1
20
08
Q2
20
08
Q3
20
08
Q4
20
08
Q1
20
09
Q2
20
09
Q3
20
09
Q4
20
09
Q1
20
10
Q2
20
10
Q3
20
10
QUARTERN
UM
BE
R O
F R
EP
OR
TS
DAMAGE REPORTS
Observations• Were reports involving damage while transitioning around aircraft on an
elevating device?• Is the use of spotters effective
Actions4) Training department will review the “Working at Height” presentation
4th Qtr -09
Action Taken

45
45
Actions5) The working at height training presentation has been amended to better
focus on clearance and the use of spotters6) Center console covers have been completed for each type of aircraft7) The training department will modify the human factors training program
to more effectively provide a clear and concise message to employees.
Comment; Seven (7) CAPs / changes were discussed, reviewed and implemented to control and reduce damage to aircraft
DAMAGE TO AIRCRAFT
0
1
2
3
4
5
6
7
8
9
10
11
12
13
14
15
Q1
20
06
Q2
20
06
Q3
20
06
Q4
20
06
Q1
20
07
Q2
20
07
Q3
20
07
Q4
20
07
Q1
20
08
Q2
20
08
Q3
20
08
Q4
20
08
Q1
20
09
Q2
20
09
Q3
20
09
Q4
20
09
Q1
20
10
Q2
20
10
Q3
20
10
QUARTERN
UM
BE
R O
F R
EP
OR
TS
DAMAGE REPORTS
Action Taken

46
46
DAMAGE TO AIRCRAFT
0
1
2
3
4
5
6
7
8
9
10
11
12
13
14
15
Q1 2
006
Q2 2
006
Q3 2
006
Q4 2
006
Q1 2
007
Q2 2
007
Q3 2
007
Q4 2
007
Q1 2
008
Q2 2
008
Q3 2
008
Q4 2
008
Q1 2
009
Q2 2
009
Q3 2
009
Q4 2
009
Q1 2
010
Q2 2
010
Q3 2
010
QUARTER
NU
MB
ER
OF
RE
PO
RT
S
DAMAGE REPORTS
Linear (DAMAGE REPORTS)
Trend line beginning in year 2006 – 1st Qtr
Reports Not Usually Submitted

47
47
0
2
4
6
8
10
12
Q12008
Q22008
Q32008
Q42008
Q12009
Q22009
Q32009
Q42009
Q12010
Q22010
Q32010
Trend line beginning in year 2008 – 1st Qtr

48
48
Exercise

49
49
List several safety critical processes
Process Name (Safety Critical Process)
Description of Measurable /
KPI
Unit of Measure (pcs., qty., lbs,
%, etc.)
Target (Increase
/decrease / number)
SP Objective (Link to or draft a SP
objective)
Securing CargoLoading and securing of cargo
Log the qty. of of incidents
Number of events
10% reductionPer quarter
Identify and control all known and potential hazards to aviation safety.

50
50
1) Identify a process(s)Safety critical processes
2) Identify a measureable for each identify KPI
identify continual improvement item and unit of measure
3) Note the unit of measureHow and what will you measure to demonstrate improvement
4) Establish a TargetCan be a percent increase / decrease, Size Nbr of pcs Qty Lbs
5) Link processes to objectivesNote an objective from earlier slide

51
51
1. Ensure that aviation safety is our number one priority.2. Document, implement and maintain and effective SMS3. Meet or exceed all applicable regulatory requirements.4. Establish and sustain a continual improvement philosophy.5. Encourage employee participation and support their efforts.6. Reduce and eradicate the real and potential causes of incidents or accidents.7. Identify and control all known and potential hazards to aviation safety.8. Implement a non-punitive policy for the security of all employees.
SP Objectives Examples

52
52
1) Identify what they want to control (KPI)
2) Choose and establish the unit of measure
3) Identify a goal or target
4) Interpret / study the difference
5) Take action on the difference
When organizations are measuring their SMS,they need to:

53
53
Transport Canada Captured data on aircraft accidents in Ontario Region

54
54
Historical Trend of Accidents in Ontario
8689
6468
128
153
168
149
122
113119
102
74
58
8174
80
63
0
20
40
60
80
100
120
140
160
180
93 94 95 96 97 98 99 00 01 02 03 04 05 06 07 08 09 10
Year
Nu
mb
er o
f A
ccid
ents
YTD
Counting

55
55
Trending
Trending of Ontario Accidents1999 - 2010 (YTD)
168
149
122
113119
102
74
58
81
7480
63
0
20
40
60
80
100
120
140
160
180
1999 2000 2001 2002 2003 2004 2005 2006 2007 2008 2009 YTD 2010
Year
Nu
mb
er o
f A
ccid
ents

56
56
Historical Trend of Accidents in Ontario
8689
6468
128
153
168
149
122
113119
102
74
58
8174
80
63
0
20
40
60
80
100
120
140
160
180
93 94 95 96 97 98 99 00 01 02 03 04 05 06 07 08 09 10
Year
Nu
mb
er o
f A
ccid
ents
YTD
Instead of trending…….Lets put this data through a Control Chart

57
57
Ontario Accidents – 1993 -2010Control Chart
Upper Control Limit
Lower Control Limit
Mean

58
58
-Seven (7) points outside the control limits
-Eight (8) points in a row - same side of mean
Interpretation
CommentProcess unstableProcess out of controlProcess may not be sustainable
Would you be concerned??
Concerns

59
59
Historical Trend of Accidents in Ontario
8689
6468
128
153
168
149
122
113119
102
74
58
8174
80
63
0
20
40
60
80
100
120
140
160
180
93 94 95 96 97 98 99 00 01 02 03 04 05 06 07 08 09 10
Year
Nu
mb
er o
f A
ccid
en
ts
YTD
Hypothetical for next 17 years
0
20
40
60
80
100
120
140
160
180
2011
2012
2013
2014
2015
2016
2017
2018
2019
2020
2021
2022
2023
2024
2025
2026
2027

60
60
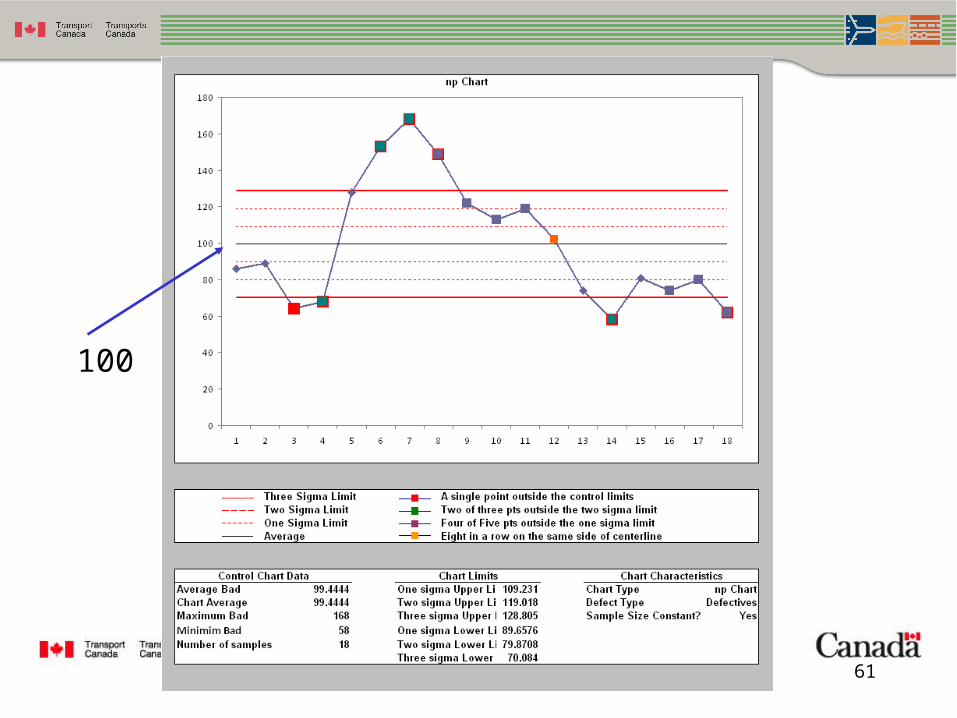
np Chart
0
10
20
30
40
50
60
70
80
90
1 2 3 4 5 6 7 8 9 10 11 12 13 14 15 16 17
Is this a stable process and is it in control?
Is this process sustainable?
60
61
61
100

62
62
Hypothetical Example
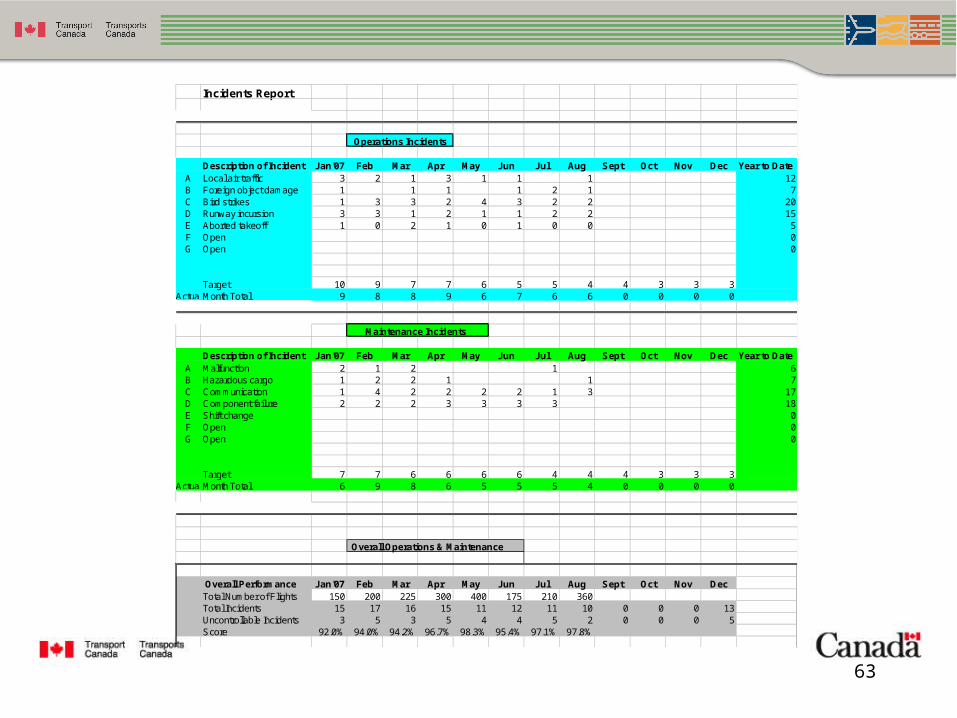
Recording of Data Developing Graphs
63
63
Incidents Report
Operations Incidents
Description of Incident Jan'07 Feb Mar Apr May Jun Jul Aug Sept Oct Nov Dec Year to DateA Local air traffic 3 2 1 3 1 1 1 12B Foreign object damage 1 1 1 1 2 1 7C Bird strikes 1 3 3 2 4 3 2 2 20D Runway incursion 3 3 1 2 1 1 2 2 15E Aborted takeoff 1 0 2 1 0 1 0 0 5F Open 0G Open 0
Target 10 9 7 7 6 5 5 4 4 3 3 3Actual Month Total 9 8 8 9 6 7 6 6 0 0 0 0
Maintenance Incidents
Description of Incident Jan'07 Feb Mar Apr May Jun Jul Aug Sept Oct Nov Dec Year to DateA Malfunction 2 1 2 1 6B Hazardous cargo 1 2 2 1 1 7C Communication 1 4 2 2 2 2 1 3 17D Component failure 2 2 2 3 3 3 3 18E Shift change 0F Open 0G Open 0
Target 7 7 6 6 6 6 4 4 4 3 3 3Actual Month Total 6 9 8 6 5 5 5 4 0 0 0 0
Overall Operations & Maintenance
Overall Performance Jan'07 Feb Mar Apr May Jun Jul Aug Sept Oct Nov DecTotal Number of Flights 150 200 225 300 400 175 210 360Total Incidents 15 17 16 15 11 12 11 10 0 0 0 13Uncontrollable Incidents 3 5 3 5 4 4 5 2 0 0 0 5Score 92.0% 94.0% 94.2% 96.7% 98.3% 95.4% 97.1% 97.8%

64
64
Operations Incidents
Description of Incident Jan'10 Feb Mar Apr May Jun Jul Aug Sept Oct Nov Dec Year to DateA Collision 3 2 1 3 1 1 1 12B Foreign object damage 1 1 1 1 2 1 7C Bird strikes 1 3 3 2 4 3 2 2 20D Runway incursion 3 3 1 2 1 1 2 2 15E Aborted takeoff 1 0 2 1 0 1 0 0 5F Open 0G Open 0HI
Target 10 9 7 7 6 5 5 4 4 3 3 3Actual Month Total 9 8 8 9 6 7 6 6 0 0 0 0

65
65
Maintenance Incidents
Description of Incident Jan'10 Feb Mar Apr May Jun Jul Aug Sept Oct Nov Dec Year to DateA Hydraulic Incident 2 1 2 1 6B Engine Failure 1 2 1 1 1 6C Communication 1 4 2 2 2 2 1 3 17D Component failure 2 2 2 3 3 3 3 18E Electrical Incident 3 0 2 0 1 6F Open 0G Open 0HI
Target 7 7 6 6 6 6 4 4 4 3 3 3Actual Month Total 9 9 9 6 5 5 5 5 0 0 0 0

66
66
Overall Operations & Maintenance
Overall Performance Jan'10 Feb Mar Apr May Jun Jul Aug Sept Oct Nov DecTotal Number of Flights 200 200 225 300 400 300 225 360Total Incidents 18 17 17 15 11 12 11 11 0 0 0 13Uncontrollable Incidents 1 3 3 2 4 3 2 2 0 0 0 5Score 90.5% 90.0% 91.1% 94.3% 96.3% 95.0% 94.2% 96.4%

67
67
Operations Incidents
Description of Incident Jan'10 Feb Mar Apr May Jun Jul Aug Sept Oct Nov Dec Year to DateA Collision 3 2 1 3 1 1 1 12B Foreign object damage 1 1 1 1 2 1 7C Bird strikes 1 3 3 2 4 3 2 2 20D Runway incursion 3 3 1 2 1 1 2 2 15E Aborted takeoff 1 0 2 1 0 1 0 0 5F Open 0G Open 0HI
Target 10 9 7 7 6 5 5 4 4 3 3 3Actual Month Total 9 8 8 9 6 7 6 6 0 0 0 0
Flight Operations Incidents Year to Date
0
5
10
15
20
25
Jan'10 Feb Mar Apr May Jun Jul Aug Sept Oct Nov Dec Year toDate
Month
Qu
an
tity
Collision Foreign object damage Bird strikes
Runway incursion Aborted takeoff Open
Open Target Month Total

68
68
Maintenance Incidents
Description of Incident Jan'10 Feb Mar Apr May Jun Jul Aug Sept Oct Nov Dec Year to DateA Hydraulic Incident 2 1 2 1 6B Engine Failure 1 2 1 1 1 6C Communication 1 4 2 2 2 2 1 3 17D Component failure 2 2 2 3 3 3 3 18E Electrical Incident 3 0 2 0 1 6F Open 0G Open 0HI
Target 7 7 6 6 6 6 4 4 4 3 3 3Actual Month Total 9 9 9 6 5 5 5 5 0 0 0 0
Maintenance Performance Incidents
0
2
4
6
8
10
12
14
16
18
20
Jan'10 Feb Mar Apr May Jun Jul Aug Sept Oct Nov Dec Year toDate
Month
Qu
an
tity
Hydraulic Incident Engine Failure Communication
Component failure Electrical Incident Open
Open Target Month Total

69
69
Overall Operations & Maintenance
Overall Performance Jan'10 Feb Mar Apr May Jun Jul Aug Sept Oct Nov DecTotal Number of Flights 200 200 225 300 400 300 225 360Total Incidents 18 17 17 15 11 12 11 11 0 0 0 13Uncontrollable Incidents 1 3 3 2 4 3 2 2 0 0 0 5Score 90.5% 90.0% 91.1% 94.3% 96.3% 95.0% 94.2% 96.4%
Overall Performance - Hazard Control
90%
91%
92%
93%
94%
95%
96%
97%
Jan'10 Feb Mar Apr May Jun Jul Aug Sept Oct Nov Dec
Month
Perc
en
tag
e

70
70
Bill James
Sabermetrics
Boston Red Sox
60 Seconds

71
71
•Identifying of measureable•Measuring activities that are not out of control•Proactive actions•Performance results•Management commitment•Confidence levels
Watch for signs of the following:

72
72
Thank You
Bill LaPorte