Embed Size (px)
Citation preview
1
© Jens Kaasbøll, 13 Jan 2014
Developing digital competence - learning, teaching and supporting use
of information technology
Jens Kaasbøll, Department of Informatics, University of Oslo
Table of contents
Table of contents .................................................................................................................... 1
Chapter 1. Introduction .......................................................................................................... 6
1.1. Why bother? ................................................................................................................ 6
1.2. Aims and target groups ................................................................................................ 7
1.3. Related areas ................................................................................................................ 9
1.4. Organisation ............................................................................................................... 10
Chapter 2. IT skills ............................................................................................................... 14
2.1. Learning IT skills ....................................................................................................... 14
2.2. Navigation ................................................................................................................. 16
2.3. Instructions sheets – learning material ...................................................................... 17
2.4. Instruction videos – learning material ....................................................................... 23
2.5. Training for skills ...................................................................................................... 25
2.6. Assessing IT skills .................................................................................................... 26
2.7. Summary .................................................................................................................... 27
Chapter 3. Subject matter areas ........................................................................................... 30
3.1. Multipe domains in one application .......................................................................... 35
3.2. Operating on the domain by means of IT .................................................................. 36
Chapter 4. IT concepts ......................................................................................................... 39
4.1. von Neumann architecture ......................................................................................... 39
4.2. Network protocols and connections .......................................................................... 40
4.3. Sequencing ................................................................................................................. 42

2
© Jens Kaasbøll, 13 Jan 2014
4.4. Structures of data units .............................................................................................. 43
4.5. Meta data ................................................................................................................... 44
4.6. Access rights .............................................................................................................. 44
Chapter 5. Learning IT concepts .......................................................................................... 46
5.1. From skills to understanding ..................................................................................... 46
5.2. Functional models – learning material ...................................................................... 49
5.3. Structural models – learning material ........................................................................ 50
5.4. Learning from Functional and Structural models ...................................................... 54
5.5. Defining a concept ..................................................................................................... 56
5.6. Learning relationships between concepts .................................................................. 57
5.7. Age levels of abstraction ........................................................................................... 60
5.8. Discrimination error .................................................................................................. 60
5.9. Summary .................................................................................................................... 62
Chapter 6. Learning solving IT problems ............................................................................ 63
6.1. Exploration – what learning oriented users do .......................................................... 64
6.2. Problem solving ......................................................................................................... 66
6.3. Problem solving competence and fostering it ............................................................ 67
6.4. Summary .................................................................................................................... 74
Chapter 7. Information competence ..................................................................................... 75
7.1. Syntax ........................................................................................................................ 75
7.2. Syntax competence and learning ............................................................................... 78
7.3. Semantics ................................................................................................................... 80
7.4. Semantic competence and learning ........................................................................... 82
7.5. Structural information models – learning material .................................................... 84
7.6. Instructions, functional and structural models – slide design .................................... 89
7.7. Interference ................................................................................................................ 92
7.8. Summary .................................................................................................................... 94

3
© Jens Kaasbøll, 13 Jan 2014
Chapter 8. Learning business fit .......................................................................................... 96
8.1. Levels of mastery of fitting IT to business ................................................................ 96
8.2. Usefulness .................................................................................................................. 99
8.3. Summary .................................................................................................................. 103
Chapter 9. User interface for learning ................................................................................ 105
9.1. Learnability .............................................................................................................. 105
9.2. Design for learnability ............................................................................................. 106
9.3. Inline help ................................................................................................................ 108
9.4. Evaluating learnability ............................................................................................. 114
Chapter 10. Training for transfer ...................................................................................... 116
10.1. Transfer ................................................................................................................ 117
10.2. Motivation and goals ............................................................................................ 118
10.3. Training for skills and understanding .................................................................. 120
10.4. Training for problem solving and for improving self-efficacy ............................ 123
10.5. Realistic training environment ............................................................................. 125
10.6. Summary .............................................................................................................. 126
Chapter 11. Evaluation of training ................................................................................... 129
11.1. Evaluation of reaction to training......................................................................... 130
11.2. Evaluation of learning – assessing competence ................................................... 131
11.3. Evaluation of behavioral change .......................................................................... 134
11.4. Evaluation of result or outcome ........................................................................... 135
Chapter 12. IT user competence standards – Tailor competence to user groups … ........ 138
12.1. Standards and guidelines ...................................................................................... 138
12.2. Tests ..................................................................................................................... 139
12.3. IT competence levels ........................................................................................... 144
Chapter 13. Super-users ................................................................................................... 149
13.1. Roles .................................................................................................................... 149
4
© Jens Kaasbøll, 13 Jan 2014
13.2. Trainers ................................................................................................................ 155
13.3. Organising training .............................................................................................. 156
13.4. Super-users as leaders .......................................................................................... 156
13.5. Summary .............................................................................................................. 157
Chapter 14. IT support ..................................................................................................... 158
14.1. Support as boundary interaction .......................................................................... 158
14.2. IT support versus super-users .............................................................................. 160
14.3. Support quality ..................................................................................................... 160
14.4. IT departments ..................................................................................................... 162
Chapter 15. Mutual learning during business fit .............................................................. 163
15.1. Users and information officers learning about IT ................................................ 165
15.2. IT personnel learning about information and activity fit ..................................... 165
15.3. Joint creation of understanding and skills of new system .................................... 166
15.4. Summary .............................................................................................................. 168
References .............................................................................................................................. 169

5
© Jens Kaasbøll, 13 Jan 2014
Ten golden rules for improving IT users’ competence
1. Provide users with detailed instruction sheets or videos, also during training.
2. Provide a variety of learning material.
3. Make sure users understand the usefulness of the IT.
4. Train users so that they understand IT concepts.
5. Train users so that they can solve problems and learn on their own.
6. Organise training at the same time as the system is installed.
7. Identify, organise, authorise and cultivate superusers.
8. Include IT, information and use competence in support and training.
9. Provide a variety of support channels and frequency.
10. Train local groups of users, not only individuals.

6
© Jens Kaasbøll, 13 Jan 2014
Chapter 1. Introduction
1.1. Why bother?
When kids learn information and communication technologies (IT for short) from the
kindergarten age and grandma is on Facebook, haven’t people become so used to the
technology, such that learning is no longer any issue? And isn’t the user interface of new apps
and gadgets so intuitive that anybody can utilize them without instruction?
Simple applications should be intuitively usable, meaning that no learning is needed, while
due to bad design, this is too often not the case (Norman, 1988). However, applications grow
with advanced functionality which may be far from intuitive. IT systems are embedded in an
interdependent organisational setting, making it difficult for a user to know how others
interpret the data entered. IT is pervasive without necessarily appearing as anything like a
computer. For instance, a toaster that ejects a slice of dark bread is immediately, because it
monitors the colour of the bread, while you thought it had a timer like the old one. Or the
toothbrush which does not work properly because you haven’t set the time zone. People
misunderstand the functioning of gadgets, assuming these work as the user intends, without
realising that initial set-up or selection of function is necessary. Even if children are fluent on
some applications, teenagers in the modern world cannot distinguish the WWW from the
Internet (Papastergiou, 2005), indicating that they have little clue about the structures behind
the user interface. Even if all IT had interfaces for ease of learning, good design can never
compensate totally for a complicated mechanism, such that learning will be needed.
IT is penetrating into most corners of the world. Even if professionals in cities are fluent on
computers, the merchant in the village may have a basic mobile phone as her only IT artefact.
Thus, there are billions worldwide who have not learnt much IT yet.
People learn IT during any activity in life. Learning often comes as a result of struggling with
some task, whether it is entering the cost of the bus ticket in the right place in the corporate
accounting system, placing a picture in a document, setting the timer at the oven or copying a
text message on the phone.
Being able to operate the technology is a necessary but not sufficient competence for IT users.
They also need to understand the purpose of systems to adopt them (Venkatesh, Morris,
Davis, & Davis, 2003), and they need to understand the data. For instance, knowing how to
enter a specific term as the index item and why the business needs it is not enough if the user
mixes up the keyword and the tag. This book therefore considers IT use competence within
the three subject matter areas of data, technology, and business fit, and these subject matter
areas will be presented thoroughly in Chapter 3.
Having a background in computer science, friends and family have often asked me about how
to get the computer to do this or that, or sort out things which have gone wrong. Without
having had a job in the user support department, I have tried helping out on most types of IT
user trouble. I assume that all readers who have come this far in the book share similar

7
© Jens Kaasbøll, 13 Jan 2014
experiences as an informal super-user, and that they also have contacted others for help when
stuck themselves. I have also experimented with the technology and learnt using it in that way
and consulted instruction videos or manuals at times.
My experience is that user learning normally happens informally, and also that teaching
activities in the form of help and support mostly take place outside formal IT trainings in
classrooms. Research in the area of user learning also points in the direction that informal
learning is dominating, such that supporting user learning outside the classroom is essential.
Nevertheless, training of staff in organisations in general improves organisational
performance, as shown by a review of 10 years of research (Aguinis & Kraiger, 2009). A
summary of 165 studies of training in organisations found a medium to large effect both on
individual learning and on organisational performance (Arthur Jr., Bennett Jr., Edens, & Bell,
2003). These effects were larger than many other interventions in organisation, for example,
feedback on performance or management by objectives.
These results include all training of any subject matter, such that we cannot know whether IT
training reaches the same level of positive outcomes. While computer science, pedagogy and
psychology are based on millions of research papers, the number of research contributions on
learning and training of IT use is a few hundred. These results provide nevertheless a
scientific basis for how user learning can be enhanced, and this book aims at organising and
summarising the knowledge in the area.
The first chapters therefore focus on what learning IT use is and the kinds of explanations that
can boost learning, whether given by a support person, supplied on the interface, or written in
user documentation. Lessons on user learning and explanations constitute the background for
chapters on designing classroom training and organising support.
1.2. Aims and target groups
This book is intended for anyone wanting to improve their ability of helping others learn IT
use. Three professional groups are considered in particular; IT specialists, school teachers and
lecturers in higher education.
All IT specialists provide informal help, and many start their career as support personnel.
Software and hardware vendors develop user interfaces and learning material, they may
support their customers, and some also run training courses. Larger organisations may have
their own IT department which take part in developing business systems. Making a large
number of users adapt a new system is often carried out through training of super-users who
are supposed to support colleagues. IT departments also support their users on standard
software and infrastructure. Specialised IT training and support businesses have the topic of
this book as their main activity; developing and running courses for other organisations or
operating support for software vendors. This book addresses the training and support activities
mentioned as well as development of learning material built into software or appearing as
independent documents or videos.
8
© Jens Kaasbøll, 13 Jan 2014
While having learnt programming in college, IT specialists have mainly learnt training,
support and making user documentation through experience and by imitating others. Such
practical experience is valuable, and should be coupled with a systematic overview of relevant
research results for improved performance. This book provides a comprehensive approach to
user learning and can enlighten, challenge or extend the repertoire of practices of self-taught
trainers. Pedagogical principles are introduced, such that no prior knowledge of pedagogical
theories or related areas is necessary.
While IT specialists are educated in the technology but receive little or no training in
educational sciences, school teachers have the opposite background; a solid background in
pedagogy, but often little computer science. General pedagogical and psychological principles
also apply when learning and teaching IT use, and this book will demonstrate how these
principles come into play in IT use learning.
More and more teachers have used IT in their teaching. While this also provides some insights
into IT and how pupils learn the technology, the main purpose of IT supported learning is
learning some other subject matter area, e.g. biology or poetry. Given that teaching depends
heavily on the matter taught (Stodolsky, 1988), experience from classroom activities on
biology by means of IT does not easily transfer to teaching the technology. This book
explains principles of IT which are relevant for user learning and which are independent on
specific software, systems or gadgets. This is neither a textbook for Word, Facebook, iTunes,
Android nor Ubuntu, but a book on how software and IT in general can be taught. While no
formal training in computer science is needed, the reader should have experience with
commonly used IT, such as office software, the file system, the internet and some gadgets, for
example smart phones and cameras. The book explains IT use from the three subject matter
areas of data, technology and business fit, presents learning processes for these areas and
suggests how teachers can guide the learners through these processes.
This book is also written as a textbook for lecturers in higher education institutions who will
teach the didactics of IT use to their students as part of a computer science or information
systems curriculum or in a teacher training college. A typical computer science curriculum
includes programming, human computer interaction, information systems development and
some management and business topics. Chances are, the only place user learning was touched
upon was in a textbook on information systems development, and it would say that “… before
implementing the system, users must be trained.” Thereafter nothing more about user learning
is said, despite the facts that information systems often fail due to poor user understanding
and that user training consumes significant proportions of the project budget. In addition,
fresh graduates take up jobs as support personnel or have to develop user documentation,
since this is considered a simple starting task for new staff by vendors and IT departments.
This book is designed to fill the void in the curriculum, preparing the computer science and
information systems students for an essential part of their job.
Unless having done research in user learning, a computer science lecturer should know the
constructivistic view of learning and one of the related areas of information system

9
© Jens Kaasbøll, 13 Jan 2014
implementation, human computer interaction, or computer science education in order to use
this book in their teaching.
A lecturer in a teacher training college who would like to teach according to this book should
know some computer science, including human computer interaction and information systems
development. The students would need to be reasonably fluent with computers and IT
devices. This book will prepare the students for teaching use of IT to their pupils at any level.
For teaching teachers of programming, a book on computer science education would also be
needed.
1.3. Related areas
Learning and teaching IT use borders several fields of study from different disciplines. From
Computer Science and Information Systems side are human computer interaction, information
systems implementation and social aspects of computing relevant. Information and library
science includes information literacy, which deals with understanding the data. Computer
Science Education includes learning IT, Computer Supported Learning deals with students
using digital technology, Educational Science concern learning and teaching in general, and
Organisational Learning includes how innovations are adapted and how professionals
improve their repertoire of practice.
Human Computer Interaction includes learnability and memorability as qualities of software.
Learnability concerns the ease with which a novice user can carry out an operation in the
software. Memorability correspondingly deals with re-establishing proficiency of software
which is intermittently used. HCI provides guidelines in on how user interfaces can be
designed to support learnability, for instance by making data and operations more visible and
through providing help and guidance in the applications.
Information systems implementation deals with the introduction of new systems in
organisations, including the organisation of training and support. Main lessons are that
systems are not adopted unless the users understand their purpose and experience
improvements in their job performance, and user involvement during system development is
acknowledged as a way of aligning IT to fit the business.
Information literacy concerns retrieval and analysis of data, which includes issues like search
strategies, sources of information, evaluation and use. In addition to such general knowledge,
knowledge of the domain is needed to assess information. Also, syntactical skills come in
handy when evaluating information, for example, grammatical skills are useful for sorting out
hoax e-mails and statistical competence helps identifying outliers when interpreting numeric
data.
Computer Science Education is the study of learning and teaching the technology to IT
professionals. Issues on learning programming and programming languages are essential. IT
use in this book only touches coding briefly, even if some advanced users use HTML or other
languages for extending their control of data. Formulas in spreadsheets resemble
programming in the sense that they control automatic calculations. Learning spreadsheets is

10
© Jens Kaasbøll, 13 Jan 2014
included in the book, since formulas require basic mathematical and not computer science
understanding. However, since both programmers and users have to learn IT concepts,
findings from computer science education on conceptual learning are also relevant for
learning and teaching the technology part of IT use.
Computer Supported Learning is the field of study which concerns using IT for learning
anything else, for example learning language through communicating in social media or
learning physics through virtual experiments in specifically constructed simulator software.
Although IT use is not the subject matter of learning in CSL, findings that students
establishing abstract understanding of phenomena also become better problem solvers are
transferable also to the IT domain.
Educational Science consists of a wealth of topics including theories of learning, effects of
training, and organising for learning activities. This book draws on the constructivistic theory
of learning. Central assumptions are that learning builds on what we already know, that
people are active and communicative learners, and that learning is triggered through
interaction with the environment. Theoretical fundamentalism is discouraged, however.
Insights on effects of teaching from a behaviouristic view are included, and social learning
theory are used for discussing organisation for learning at the workplace.
Organisational Learning is an area of study which provides insight into how people improve
their practices and how skills and knowledge is spread amongst colleagues and how
newcomers are socialised. Social learning theories are used to characterise super-users as
brokers between communities of user practice and communities of IT practice.
Textbooks in pedagogy, psychology and organisational learning will provide the reader of this
book with a deeper understanding of underlying ideas about topics presented here. Such
textbooks will also provide more practical guidance into planning, carrying out and evaluating
teaching, into the art and science of helping others, and into management of support teams
and human resources in the company in general. Higher education lecturers who will use this
book for teaching should gain some of this background. However, this book is self-contained
and will provide the computer scientist with the necessary, but limited insight into the related
sciences.
1.4. Organisation
Part I consists of only one chapter on learning skills for IT use, and constitutes an easy start.
However, those who stop reading after this chapter will miss the points of the book.
Part II “Understanding and Problem Solving” concerns learning within the three subject
matter areas. It builds a model of learning as a process from skill through understanding to
problem solving competence in chapters Chapter 3 to Chapter 8. Problem solving is
particularly important for super-users helping others.
Part III builds on the learning model from Part II when considering learnability of user
interfaces, user training and evaluation and IT use competence standards in Chapter 9 to
Chapter 12.

11
© Jens Kaasbøll, 13 Jan 2014
Part IV brings in organisational learning and discusses super-users, IT support and mutual
learning during development of IT systems in the last three chapters. It identifies
Communities of Users, Communities of IT Specialists and Super-users as brokers between
them. This part is less relevant for school teachers.
12
© Jens Kaasbøll, 13 Jan 2014
Part I. IT skills and learning
Before embarking on how skills can be learnt, this introduction will present a three level
model of learning IT use up to the problem solving competence level, which super-users
should master. The three level model will place skills in a larger perspective of user
competence.
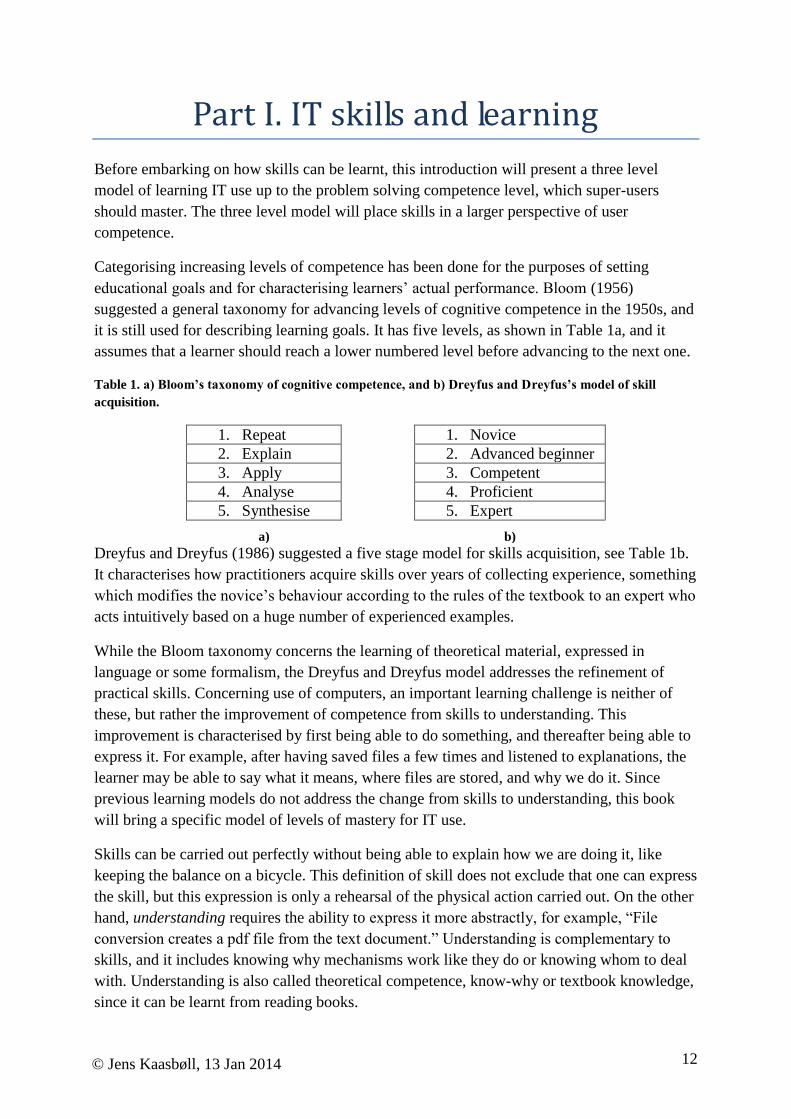
Categorising increasing levels of competence has been done for the purposes of setting
educational goals and for characterising learners’ actual performance. Bloom (1956)
suggested a general taxonomy for advancing levels of cognitive competence in the 1950s, and
it is still used for describing learning goals. It has five levels, as shown in Table 1a, and it
assumes that a learner should reach a lower numbered level before advancing to the next one.
Table 1. a) Bloom’s taxonomy of cognitive competence, and b) Dreyfus and Dreyfus’s model of skill
acquisition.
1. Repeat 1. Novice
2. Explain 2. Advanced beginner
3. Apply 3. Competent
4. Analyse 4. Proficient
5. Synthesise 5. Expert
a) b)
Dreyfus and Dreyfus (1986) suggested a five stage model for skills acquisition, see Table 1b.
It characterises how practitioners acquire skills over years of collecting experience, something
which modifies the novice’s behaviour according to the rules of the textbook to an expert who
acts intuitively based on a huge number of experienced examples.
While the Bloom taxonomy concerns the learning of theoretical material, expressed in
language or some formalism, the Dreyfus and Dreyfus model addresses the refinement of
practical skills. Concerning use of computers, an important learning challenge is neither of
these, but rather the improvement of competence from skills to understanding. This
improvement is characterised by first being able to do something, and thereafter being able to
express it. For example, after having saved files a few times and listened to explanations, the
learner may be able to say what it means, where files are stored, and why we do it. Since
previous learning models do not address the change from skills to understanding, this book
will bring a specific model of levels of mastery for IT use.
Skills can be carried out perfectly without being able to explain how we are doing it, like
keeping the balance on a bicycle. This definition of skill does not exclude that one can express
the skill, but this expression is only a rehearsal of the physical action carried out. On the other
hand, understanding requires the ability to express it more abstractly, for example, “File
conversion creates a pdf file from the text document.” Understanding is complementary to
skills, and it includes knowing why mechanisms work like they do or knowing whom to deal
with. Understanding is also called theoretical competence, know-why or textbook knowledge,
since it can be learnt from reading books.
13
© Jens Kaasbøll, 13 Jan 2014
For carrying out routine work, users only need the skills required for using the technology to
support their business. The reason why users nevertheless may need IT understanding is that
understanding will in general ease transfer of skills to new situations, like the introduction of
new software versions, systems, gadgets and IT services (Bransford 2000).
When changing business applications, training super-users to help others is a common
strategy (Coulson et al. 2003; McNeive
2009). This implies a two tier need of
user competency; ordinary users need the
skills for operating the software, while
super-users need to be able to solve
problems, help others and find out things
which they don’t know. This means that
super-users need competence for problem
solving. We will use the term competence
to denote the ability to do something and
learning for an increase of competence
which lasts at least for a while.
Super-users are expected to fix minor IT problems, find ways of adapting systems to work
tasks, and help other users who are stuck, implying that they need an IT use competence
above most others. We will say that they need problem solving competence. Research has
shown that understanding leads to improved abilities for solving problems (Halasz & Moran,
1983; Kiili & Ketamo, 2007; Novick, Andrade, & Bean, 2009). We therefore state that
learning IT use involves the three steps of (Kaasbøll, 2013):
1. Skill.
2. Understanding.
3. Problem solving competence
Being able to enter numbers and formulas in a spreadsheet is an IT skill, since it involves
doing things on the computer. The ability to tell that a spreadsheet is useful for calculations is
not a skill, since telling does not involve the doing. The ability to tell about something
demonstrates an understanding. Although a user who has spreadsheet skills often also has
spreadsheet understanding, there is no automatic relation between the two. One person can be
very skilled without much ability to tell about it, and another may have a profound
understanding of IT, but being poor at using it.
IT users need IT skills, without which they would not be users. IT skills therefore constitute
the main learning aim of IT training and material for learning use. While skills are
fundamental, more advanced users excel in understanding IT and in problem solving and
being able to help others. These more advanced levels of IT user competence will be
addressed in Part II.
Learning—Roberto.
Roberto used to carry out complex calculations
on his phone, but he often lost track of the
results. After having discovered spreadsheets,
he uses these instead. Since his change of
behaviour is lasting, Roberto has learnt a new
IT skill. Roberto also tried setting up a
relational database for managing is accounts,
but he reverted to spreadsheets. Since he did
not stick to this habit, learning might not have
taken place.
14
© Jens Kaasbøll, 13 Jan 2014
Chapter 2. IT skills
The learning aim of this chapter is to be able to design learning activities and material for IT
users such that they learn IT skills.
Users of technology need skills for applying it to meet their needs. A skill is a practical
competence, indicating that a skilled person knows how to do it. Therefore skills are also
called know-how. IT know-how will normally include some bodily skills like hand-eye
coordination for mouse movement or the ability to push the keys on the phone with the thumb
when writing a text message.
2.1. Learning IT skills
Learning IT skills take place in two different ways; repeating for improving performance and
remembering the skill, and imitation for learning new skills through following instructions.
Repetition
Repetition is a learning process for strengthening an already existing skill. Repeating
behaviour many times normally leads to the learner being able to do it without conscious
awareness. We say that the skill has become automated. Walking, running and biking are
examples of skills which most people would learn so that they are automated. We normally
don’t pay attention to how to move the leg forward when walking. Correspondingly, typing
on a keyboard becomes automated after long practice, so that we can write words without
considering which fingers to move in order to hit particular buttons.
This book will not address practicing the bodily skills like pushing the buttons on a
QWERTY keyboard. The interested reader can find specific textbooks on such skills (Barnes,
1890). Rather, we will concentrate on the cognitive component, the know-how of operating
software and IT gadgets.
Imitation and instructions
While one can become an efficient user of IT by repeating a sequence of operations, repetition
does not necessarily extend our repertoire of skills. A way of learning new skills is imitating1
others’ behaviour.
It has for long been recognised that imitating others is an important way of learning IT use
(Bannon, 1986). In general, similarity between the settings during imitation and repeating
ease learning (Ormrod, 1995). Imitation has therefore a strong advantage as a trigger for
learning, since what the learner observes is exactly the behaviour to be repeated.
1 In a behaviouristic learning literature, this way of learning is called ‘modeling,’ but since the word ‘model’ is
used for other purposes within this book, we use the term ‘imitation’ for this learning process.

15
© Jens Kaasbøll, 13 Jan 2014
Ali was motivated to learn the copy
and past shortcut through observing
that it saved time. Motivation is a
strong factor for learning. If Ali is
happy with his menu choice for copy
and paste and does not see any
advantage in keystrokes, he will not
bother trying, and hence he will not
learn it.
User training is often carried out as
follows. Each student has a computer,
and the teacher uses a video projector.
The teacher instructs which keys to push on the computer by demonstrating it and projecting
the screen. Instructions are guidelines which lead the user step by step through a procedure,
demonstrating how to carry it out, as sketched in Figure 1. The learners try to remember the
keys and repeat the operations being carried out. Due to the low capacity of our short term
memory, the learners often forget the steps.
Psychology – Cognitive load
Human long term memory has an enormous capacity. Operations which we have repeated
a number of times are learnt in the sense that we do not have to pay attention to them again
and these operations are stored in long term memory. This applies to bodily skills like
walking a staircase or swimming as well as cognitive skills like copy-paste and
interpreting an e-mail address. There is in practice no limit to how much we can learn and
store in long term memory.
Our ability to process information is severely limited, however. As a rule of thumb, we can
process 7±2 items which require our attention. For example, most people will remember a
6 digit phone number when reading it in the phone book and typing it on their phone, but
they will have trouble doing the same with an 8 digit number. In that case, they might split
it up into two chunks of 4 digits. Short term memory is limiting our ability to learn in the
sense that we can only pay attention to and learn a small number of things at a time.
Learning more complex matters will therefore have to be broken up into smaller pieces.
After having learnt one operation such that we do not have to pay attention to it any
longer, we can move on to learning the next one. For example, a novice spreadsheet user
can learn to set up a formula which has other cells as arguments. Thereafter, the user can
learn copying and pasting the formula. After having observed and exploited that cell
references are changed when pasting, this phenomenon will most likely be stored in long
term memory. Thereafter, the user can learn the distinction between absolute and relative
referencing.
Imitation—Gabriela and Ali.
Assume that Ali is watching Gabriela while she
is pressing CTRL/C and CTRL/V for copy and
paste. Ali has been doing this operation by means
of menu choices quite often, but he has not seen
the shortcut before. He sees that it is time
efficient and therefore starts using the key
combination thereafter. When Ali continues to
use the key combination instead of the menus, a
relatively stable change of his competence has
taken place, meaning that he has learnt this skill.

16
© Jens Kaasbøll, 13 Jan 2014
A similar situation happens when an IT support person verbally instructs a user about which
buttons to push in order to solve a problem. The next time the problem occurs, the user has
forgotten the steps. Since a colleague or a trainer normally cannot stay around for repeated
demonstrations until every learner has acquired the skill, documents or videos might be
helpful.
2.2. Navigation
Users often believe that
the computer can carry out
a certain operation, but
they do not know where to
locate it in the interface.
This means that they have
an understanding of the
functionality, but lack the
skill to trigger it.
Navigation means finding
out how certain
functionality can be
triggered at the user
interface.
Knowing some facts might ease navigation. For instance, managing a new text processor
would be eased if a user has learnt trivial facts like that Times New Roman and Arial are
fonts. Then it is easier to recognise that where these words appear, the functionality concerns
fonts.
Users navigate through trial and error, or they find directions amongst documentation or from
other users. A direction describes functionality and points to where to trigger it in the user
interface. Functionality would be written in plain language, while user interface could be a
screen image or a menu name.
While navigation brings our competence from understanding to skills, repetition and imitation
improve skills, as illustrated in Figure 2.
Figure 1. Instructions are sequential guides.
Navigation: Defne.
Defne knew that the switch for WiFi reception used to be
located in the top level of the settings menu on her phone.
After installing a new version of the operating system, she
discovers that it is not located there any longer, such that she is
in need of navigation.
Defne was able to navigate to the WiFi switch by searching the
web, where someone had written:
Where is WiFi services?
Settings > Connections > Network Services
... listed here

17
© Jens Kaasbøll, 13 Jan 2014
Figure 2. Learning IT user skills. Learning processes as arrows.
2.3. Instructions sheets – learning material
Instructions and directions can be a document or a video or audio recording, or a combination
thereof. We will call the written documents instruction sheets, bearing in mind that they
normally contain both directions and instructions. These can include graphics, and they can
appear in various media, for example, in-line help in the software, web pages or printed
documents.
Recognizable
For imitating written instructions, users need to recognise the IT application when reading
them, so including screenshots is often necessary. Screenshots are also needed for pointing to
exactly where to push a button or tick a box.
The learner also needs to recognize that the explanatory text and figures are not parts of the
screen. This difference is made in Figure 3 by placing the text outside the screen shot and
drawing arrows at an angle with the screen items. In Figure 4, the difference is achieved by
angles and colours.

18
© Jens Kaasbøll, 13 Jan 2014
Figure 3. An instruction sheet for setting up a link from a document to a table in OpenOffice in Windows.
The functionality for directions is provided in the heading.
Sequential
Operating an IT device is a sequential series of actions, so instructions need to specify the
sequence. Video, audio and text are sequential modes of expression, while illustrations are
not. Illustrations therefore need an added sequencing, for example as in Figure 3.
Completeness and Feedback
Reinforcement from the system that the operation is successful is an important factor for
learning (Ormrod, 2012). Digital devices often provide immediate feedback on the result of
the operation. If the result is what the user wanted, the feedback is a reinforcement of
learning. Sometimes, the system does not provide appropriate feedback, so that learning is not
reinforced. The users should therefore do additional operations to control the output.
Instruction no.3 in Figure 3 is for checking that the operation has yielded the desired result.
Keeping the cognitive load low is also a reason for breaking a long sequence of instructions
into shorter sections with an observable end state. If the computer does not produce an
observable output after a section, checks like instruction no.3 should be enabled at least at the
end of each section. Then the user can concentrate on learning one section at a time. The
longer sequence can thereafter be learnt by joining the sections. Learning absolute references
in the text box on cognitive load was suggested broken into the sections of formulas, copy-
paste of formulas and at the end copy-paste with absolute references.

19
© Jens Kaasbøll, 13 Jan 2014
Short
Few users read manuals (Novick, Elizalde, & Bean, 2007), and long texts are particularly
unlikely to be read by most users, since they are more interested in doing than in reading
(John M. Carroll, 1990). Instructions should therefore be short. The instructions in Figure 3
are as short as possible and still complete. The example in Figure 4 has short and precise
instructions for how to trigger the selection of fields. However, the instructions to the left for
how to fill the fields are too wordy and are not broken up into steps.
Figure 4. Instructions for mail merge (MS Office 2007)
The instructions in Figure 4 also illustrate another common problem with screenshots. We are
often interested in small portions of a large area. If the screenshot includes the whole window,
the details in the area of interest become tiny and difficult to see and mark up with arrows. A
better solution in Figure 4 could be to extract the name and address area of the letter and blow
it up, so that the reader can easily spot the exact position where to type Last_Name.
Choice of example will also influence the complexity of the sheets. The example should
illustrate the normal execution of the operation, without including any other, disturbing data.
Studies of user experience reveal that they are not satisfied with the instructions provided for
the software they use. Typical sources of dissatisfaction are that IT instructions are too basic,
but also too difficult to imitate (Novick & Ward, 2006; Smart, Whiting, & DeTienne, 2001).
The observation that some documentation is too basic may come from the fact that it is
intended at the novice, and then the more proficient user finds it too detailed. The opposite
may be the case when the documentation is too difficult.

20
© Jens Kaasbøll, 13 Jan 2014
The instructions in Figure 3 are intended for users who have some skills in navigating in the
menus. Novice users might have had problems with finding the Insert menu option, since the
instructions do not include a screenshot indicating where this menu is located.
Save and open
1 Saving. Before quitting a program:
1.1 Click the button.
1.2 Click the down-arrow in the “Save in”
box.
1.3 Type the name you will give the file in the
“File name:” box.
1.4 Click the “Save” button
2 Opening. The next time you have opened the
program and want to work on the same file:
2.1 Click the button
2.2 Click the down-arrow in the “Look in”
box.
2.3 Double-click on the file name.
Figure 5. Instruction sheet for novices (MS Word, 2003)
The instructions in Figure 5 are detailed concerning a basic operation, so it fits novices. A
user who has acquired some IT skills would fond these instructions too basic. One might
argue that more advanced users would not look up how to save a file. However, if one wanted
to know how to save with a special file format, searched for this and hit the instructions in
Figure 5, then the instructions would turn out as too basic. On the other side, if the novice
does not know where to find the and buttons, the instructions would be too difficult.
In an experiment with elderly novice users, the learning effects of annotated screen shots,
screen elements embedded in text and text only instructions (similar to those Defne found)
were compared (Kehoe, 2009). The full screen shots eased the imitation, while the text
versions had better effects on the learners’ remembrance of the skill. This may be due to that
following the screenshots require less processing by the learners, while the additional effort
needed to follow the text style instructions had positive impact on remembering. The
intermediate version, screen elements embedded in text, yielded an intermediate result.
Consequently, annotated screen shots are useful for introductory imitation. To support the
learners’ memory, the users should have continuous access to these instruction sheets.
Hence, instructions have no obvious level of detail which fits all users. The computer scientist
may launch the idea that the software should track the users’ skill level and present
instructions accordingly. However, even keeping one version of user documentation correct
and up to date seems to be too demanding for many IT vendors and in-house software
systems, so managing a set of different levels could easily lead to more chaos than
improvement. A more realistic approach is to make some simple assertions about which
21
© Jens Kaasbøll, 13 Jan 2014
functionality that will be used at different skill levels, and adjust the instructions accordingly.
Table 2 provides recommendations for adjusting the instructions to skill levels.
Table 2. Skill levels and corresponding instruction design.
Skill level Operations Presentation
Novice Any basic Screenshot and every detail.
Ordinary
Any basic Brief mention
Menu selection for
new operation
Textual navigation from main window to
location.
E.g., Insert → Object → OLE Object
Unknown window
Several operations
Screenshot for navigation
Sequence
Advanced
Any ordinary or basic Brief mention
Menu selection for
new operation.
Textual navigation from appropriate point
to location.
Unknown window
Several operations
Screenshot for navigation
Sequence
Missing the skill level is not the only trouble that users report concerning instruction sheets.
Another complaint is that user documentation is out of date (Novick & Ward, 2006). Outdated
material was abundant when manuals were printed, and new software versions were
distributed. Publishing instruction sheets on the web ease the updating.
Terminology
When designers invent a term for a functionality, only one or two in ten users would use the
same term (Furnas, Landauer, Gomez, & Dumais, 1987). This causes both problems when
looking for the interface object which will trigger the wanted functionality, and likewise,
messages popping up on the screen may be written with unintelligible terms for most users.
Also, chances of success when searching documentation decreases. This terminology trouble
has been confirmed by research. Many of the participants in a study of problematic use
episodes were not able to find the functionality which they knew existed (Novick & Ward,
2006). When turning to the documentation, they reported additional trouble, since they also
could not find the right place in the documentation. Often, their search terms did not match
the keywords in the documentation. This causes a challenge for writing directions, where the
functionality should be described with the terms that users know.
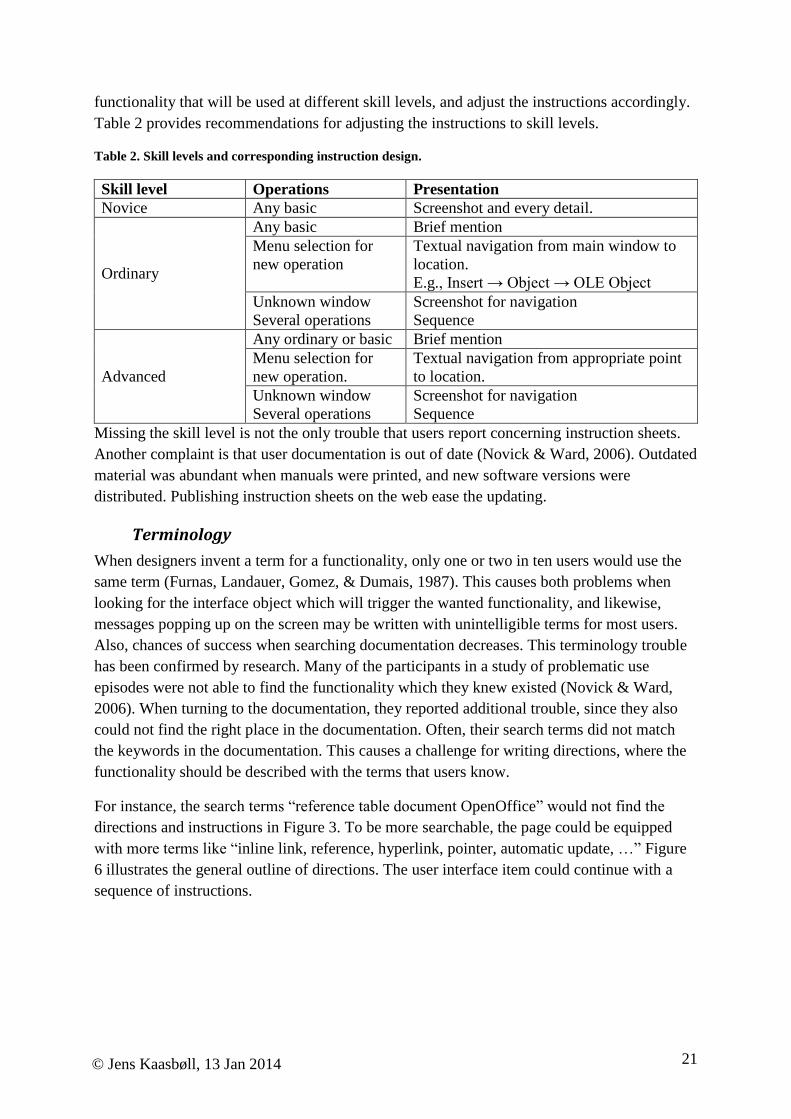
For instance, the search terms “reference table document OpenOffice” would not find the
directions and instructions in Figure 3. To be more searchable, the page could be equipped
with more terms like “inline link, reference, hyperlink, pointer, automatic update, …” Figure
6 illustrates the general outline of directions. The user interface item could continue with a
sequence of instructions.
22
© Jens Kaasbøll, 13 Jan 2014
Figure 6. Directions consist of functionality expressed in many ways plus the place in the user interface to
trigger the functionality.
In order to overcome the terminology problem, directions generated by a community of many
users may increase the likelihood that a user’s search term hits one of the other users’ help.
This is the web solution, which was the most frequently used type of help amongst 107 users
(Martin, Ivory, Megraw, & Slabosky, 2005). Half the users had problems with finding what
they were looking for, and also half of them had trouble interpreting the documentation found.
For business internal systems, the www may have little to offer. Instead, user questions and
responses can be made available for searching also inside the interface of the system, so that
the threshold for use is as low as possible.
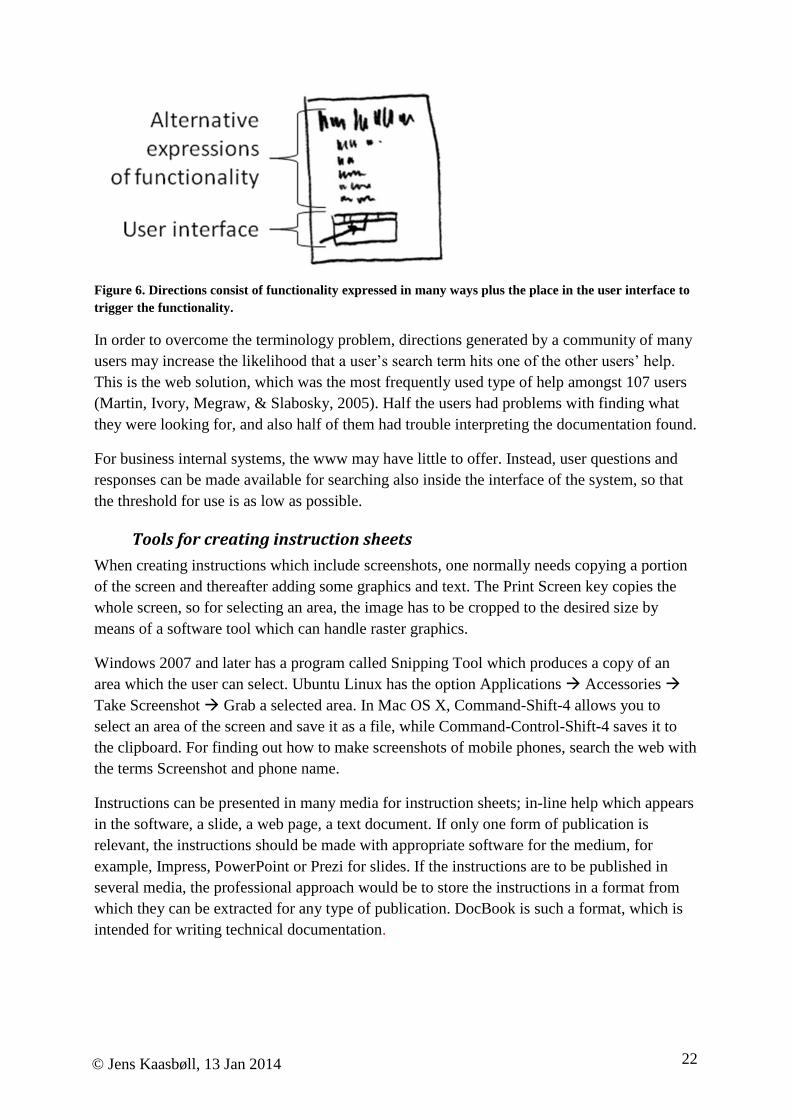
Tools for creating instruction sheets
When creating instructions which include screenshots, one normally needs copying a portion
of the screen and thereafter adding some graphics and text. The Print Screen key copies the
whole screen, so for selecting an area, the image has to be cropped to the desired size by
means of a software tool which can handle raster graphics.
Windows 2007 and later has a program called Snipping Tool which produces a copy of an
area which the user can select. Ubuntu Linux has the option Applications Accessories
Take Screenshot Grab a selected area. In Mac OS X, Command-Shift-4 allows you to
select an area of the screen and save it as a file, while Command-Control-Shift-4 saves it to
the clipboard. For finding out how to make screenshots of mobile phones, search the web with
the terms Screenshot and phone name.
Instructions can be presented in many media for instruction sheets; in-line help which appears
in the software, a slide, a web page, a text document. If only one form of publication is
relevant, the instructions should be made with appropriate software for the medium, for
example, Impress, PowerPoint or Prezi for slides. If the instructions are to be published in
several media, the professional approach would be to store the instructions in a format from
which they can be extracted for any type of publication. DocBook is such a format, which is
intended for writing technical documentation.
23
© Jens Kaasbøll, 13 Jan 2014
2.4. Instruction videos – learning material
The previous section outlined four principles for instructions; sequence, recognisability,
brevity and completeness. These principles hold for any medium. The contents and structure
of an instruction video should therefore be similar to the sheet.
Generally, the written text in instruction sheets would be presented orally in a video, and the
static screenshots would be replaced by a dynamic screen capture, showing mouse movements
and characters being typed. Videos may also need some graphics like arrows or highlighting
for drawing attention to specific parts of a window.
Examples of video instructions are abundant on the web. Two introductions to formulas in
spreadsheets can be found on YouTube:
06 Google Spreadsheets Cell Formula pt 6 of 7 (mrwaynesclass, 2009)
http://www.youtube.com/watch?v=vZvtsNotlEo
Creating formulas using cell ranges in an OpenOffice calc spreadsheet (COL CCNC,
2010) http://www.youtube.com/watch?v=U7QlOpluAF0
The first video has replaced written text with sound, while the second one has kept the written
instructions and has no sound.
Concerning the four principles for instructions, sequence is guaranteed, since the video is the
medium. Second, the use of screenshots enables recognising the software. However, there is a
large number of cells filled with data in the examples, so the learner needs to be able to
disregard the cells which are irrelevant for the insertion of formulas. Excessive amounts of
data or of interface details clutters the picture and makes it unnecessary hard to recognise the
essentials. Third, both of these videos are short; around one minute. Users are more likely to
watch a short video to the end than a long one, and most other instructional videos are longer
than these. Fourth, the videos are complete in the sense that they cover all steps necessary to
insert the formula and they can see the result in the end.
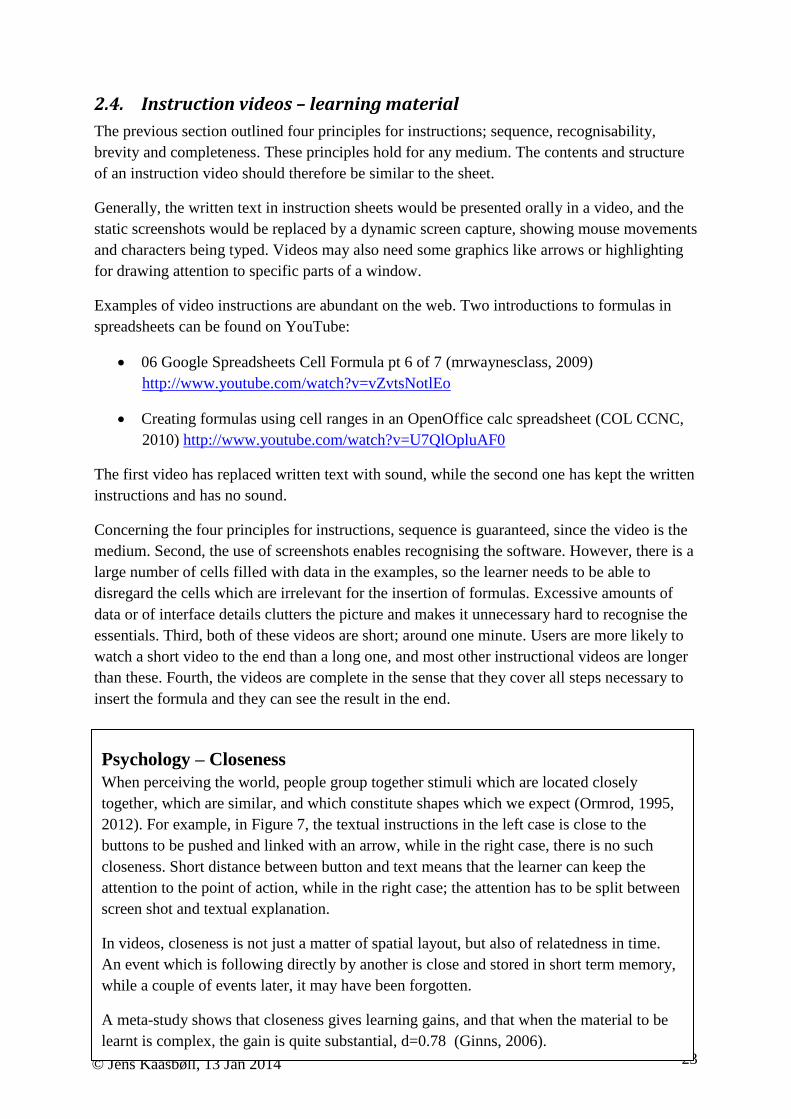
Psychology – Closeness
When perceiving the world, people group together stimuli which are located closely
together, which are similar, and which constitute shapes which we expect (Ormrod, 1995,
2012). For example, in Figure 7, the textual instructions in the left case is close to the
buttons to be pushed and linked with an arrow, while in the right case, there is no such
closeness. Short distance between button and text means that the learner can keep the
attention to the point of action, while in the right case; the attention has to be split between
screen shot and textual explanation.
In videos, closeness is not just a matter of spatial layout, but also of relatedness in time.
An event which is following directly by another is close and stored in short term memory,
while a couple of events later, it may have been forgotten.
A meta-study shows that closeness gives learning gains, and that when the material to be
learnt is complex, the gain is quite substantial, d=0.78 (Ginns, 2006).

24
© Jens Kaasbøll, 13 Jan 2014
Figure 7. Instructions with text close to action objects (left) and coded with sequence numbers (right).
Figure 8. The callout points to the rectangle at left, but not at right (COL CCNC, 2010).
The yellow callout in the silent video (COL CCNC, 2010) points to the rectangle that is
dragged, see Figure 8, left part. Also, the yellow colour appears both in the callout and at the
cursor position. This support the association between the callout and the rectangle in both
location and similarity, so it supports out perception in two ways. The callout in the right part
of Figure 8 is located far from the rectangle, so in this case, the association is only through the
similarity in colour. This example is form a video, but the principles of closeness and
similarity for achieving an association in perception is valid also for static illustrations.
Tools for creating instruction videos
Producing a video can be done in three steps:
1. Recording the screen and voice by means of a screen recording and video production
software. The recording yields a series of frames, as illustrated in Figure 9. The series
of frames is stored in the format of the software package.
Figure 9. A series of frames for video production. Screen capture from Wink (Kumar, 2010).

25
© Jens Kaasbøll, 13 Jan 2014
2. Editing the frames. Frames can be deleted and added from other recordings. Also
graphics can be added in this step.
3. Rendering. The software produces a video file, which could be
a. Animated vector graphics – Flash .swf can be played with Adobe Flash Player.
b. Compressed video – MPEG-4. Can be viewed with video players.
There are several softwares which can do the whole or parts of this process. Three examples
are:
Adobe Captivate is a commercial product with extensive functionality (Adobe, 2012).
It runs on all platforms.
KRUT is freeware and runs an all operating systems (Östby, 2012). However, it skips
the editing step.
Wink is freeware and can do the steps 1-3 above (Kumar, 2010). It runs on Linux and
Windows.
2.5. Training for skills
Training people at work through by making them imitate an instructor has led to substantial
skill learning for a large variety of trades, as seen in a summary of 117 studies (Taylor, Russ-
Eft, & Chan, 2005). Even so, the effects on job behaviour were moderate, but stable over
time. Performance at work was improved when the trainer not only demonstrated how to do
things, but also how not to behave. Making the learners use some of their own cases during
training also helped.
Previously it was noted above that learners quickly forget long series of operations. Having
written or video instructions, users can look them up when necessary back at work. While
users seldom read manuals, they are twice as likely to look up in training material (Novick et
al., 2009). Teachers in training sessions should therefore hand out instruction sheets or videos
to the learners instead of instructing by means of a projector (Herskin, 2006). Then the users
will have training material to look up in when they are back at work. Following an instruction
sheet instead of the teacher at the projector also eases the learners’ practice during the course,
since they can follow their own pace. During teacher instructions, some learners work slower
than the teacher, such that they are left behind. One might object to the video on the same
grounds; that the learner cannot follow its pace. However, videos can be paused and replayed
indefinitely, in contrast to the teacher in front of a class.
Following instruction sheets may be beneficial when introducing a new program or
functionality. However, research indicates that after a short time, users prefer working on
their own and they also seem to learn more quickly in that way (John M. Carroll, Mack,
Lewis, Grischkowsky, & Robertson, 1985).
26
© Jens Kaasbøll, 13 Jan 2014
Training in courses by means of instruction sheets also relieve the teacher from running
around in the computer lab to help out those who forgot the instructions (Herskin, 2006)
Nevertheless, some learners with insufficient digital literacy do not imitate the instruction
sheets but asked their fellow students for help instead (Hadjerrouit, 2008). This might be a
symptom written instructions being more abstract than live ones, such that novices should
also imitate the trainer with projector or possible view a video, which is more concrete than a
written sheet.
Instructions sheets and videos need to be stored where users can find them when needed.
Searching Google with “guide windows” yields more than one billion hits, and there are more
than a million instruction videos for Linux on the web. The users’ challenge is to find the
right one. Research has reported that users have trouble finding instruction sheets and other
documentation when needed (Novick & Ward, 2006). This challenge will be addressed in 0.
When introducing new business specific software in an organisation, people need to learn the
skills for using it. How to organise for user learning will be taken up in Chapter 13 and later.
In any case, instructions need to be produced and distributed. Knowing that users have trouble
searching for and finding relevant instructions, the best option is to place the instructions such
that no search is necessary. The solution is to include instructions in the user interface of the
software, so called context-sensitive or in-line help (Shneiderman & Plaisant, 2010).
2.6. Assessing IT skills
Upon completing user training, the teacher may want to know whether the users have learnt
the skills aimed at. Since skills are demonstrated by doing and not by saying, tests of skills
should be through practical exercises. Exercises like
Summarise both rows and columns in the spreadsheet.
Use styles consistently in the document.
are therefore appropriate for testing IT skills. The trainer needs to observe the performance of
the learners on the IT device to judge whether they are at the wanted skill level. Alternatively,
viewing the result produced by the trainees may be done, but such inspection does not capture
the mistakes which the learners might have done on their way. The following question
How do you summarise both rows and columns in a spreadsheet.
calls for an oral answer and not a demonstration of practical skills. The following question is
even further from testing skills:
What is a style in a text processor?
This question does not concern know-how at all, but rather knowing-that or understanding.
A thorough discussion on testing IT skills and understanding will be provided in Section 12.2.
27
© Jens Kaasbøll, 13 Jan 2014
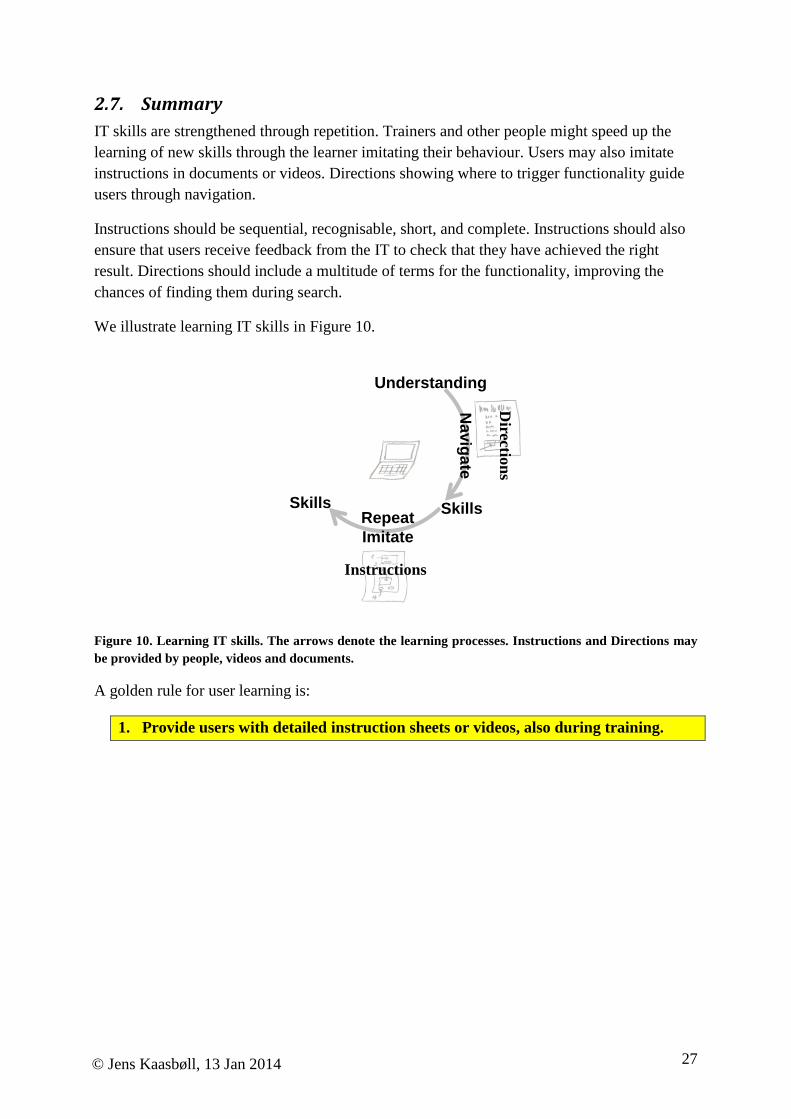
2.7. Summary
IT skills are strengthened through repetition. Trainers and other people might speed up the
learning of new skills through the learner imitating their behaviour. Users may also imitate
instructions in documents or videos. Directions showing where to trigger functionality guide
users through navigation.
Instructions should be sequential, recognisable, short, and complete. Instructions should also
ensure that users receive feedback from the IT to check that they have achieved the right
result. Directions should include a multitude of terms for the functionality, improving the
chances of finding them during search.
We illustrate learning IT skills in Figure 10.
Skills
Understanding
Repeat
Imitate
Na
vig
ate
Skills
Directio
ns
Instructions
Figure 10. Learning IT skills. The arrows denote the learning processes. Instructions and Directions may
be provided by people, videos and documents.
A golden rule for user learning is:
1. Provide users with detailed instruction sheets or videos, also during training.
28
© Jens Kaasbøll, 13 Jan 2014
1. Pedagogical theory – behaviourism
Within a training and transfer view of user competence, the outcome of the learning
process which takes place during training is our focus. This view of learning is in
accordance with the behaviourist approach, where learning is considered a relatively
stable change of the potential for action. That means, after learning, the learners should be
able to do things which they could not do before, and that this ability is not a random
change. Being able to do something does not necessarily imply that it is done, since
required conditions like time and money might not be present. The behaviourists only
consider observable behaviour, meaning that what goes on in people’s head is outside the
area of interest.
The typical way of regarding learning in the behaviourist perspective is that a person is
presented with a stimulus from the environment, for example Arja’s computer displaying a
spreadsheet table and a document. Thereafter Arja responds to the stimulus, for instance
by importing by a link. If this response was different from the previous ones, and also that
Arja continues with this response later when she is presented with the same stimulus, she
has learnt a new behaviour.
After a response, the person can receive a new stimulus, which can reinforce the learning,
for example that the numbers in the document are updated according to changes in the
spreadsheet. If seeing this makes her more inclined to import by link the next time she
sees a spreadsheet table and a document, then the updating constitutes a reinforcement for
her learning.

29
© Jens Kaasbøll, 13 Jan 2014
Part II. Understanding and problem solving
The learning aim of Part II is:
To be able to design learning activities and material for IT users such that their competence is
brought up to the levels of understanding and problem solving.
The difference between skills and understanding, which was introduced in the introduction to
Part I, will be addressed in this part of the book. This will be done for three subject matter
areas: IT, information and business fit.
Part II will take on a learning view of developing IT user competence, considering learning as
processes towards higher levels of mastery in the three subject matter areas. Learning takes
place anywhere and anytime, not only in courses or other activities aimed specifically at
learning. However, a more thorough view of learning will also help refining the training
designs from Part I. Also, the competence areas and levels constitute a background for design
of training and user interfaces; which will be covered in Part III.

30
© Jens Kaasbøll, 13 Jan 2014
Chapter 3. Subject matter areas
The learning aim of this chapter is being able to identify the three subject matter areas in
topics to be taught.
‘Competence’ broadly denotes abilities related to work, while ‘knowledge’ does not signify
any particular aim of application. Since this book is about abilities for using IT, ‘competence’
will be preferred as the basic concept. But keep in mind that computers also are being used
outside of work. Therefore, the interest here is competence for some activity rather than for
participating in working life. We will use the terms ‘IT use competence’ or ‘IT user
competence’ interchangeably, and the IT will also encompass communication technologies
and mean the same as ICT.
During training, the subject matter to be learnt has been found having greater implications
than other factors on teaching practice, including class size and level (Stodolsky, 1988).
Consequently, finding the subject matter areas of IT use competence is necessary, the next
chapters will show us that each of them have individual steps of learning.
Competence for using IT shows us the purpose of the competence, but not it’s content.
Although it is obvious that IT constitute at least some of what the competence is about, we
will also see that there are other subject matter areas of the IT competence.
Concepts like ‘software knowledge,’ ‘computer literacy,’ ‘information literacy,’ and ‘digital
literacy’ have been coined to capture the essence of what IT use competence should
constitute. We do find streams of such work in three different academic areas: computer and
information systems, information and library science, and research on IT in schools.
In the research area of information systems, (Sein, Bostrom, & Olfman, 1998) proposed a six
step model for user competence. The three lower steps of their model concerned learning to
use the functionality of the software. The three upper ones concerned the connection between
technology and the business where the IT was to be used. This way of including the use of IT
in the organisation seems, in addition to the technological, to be a subject matter area.
As a next step, Sein et.al. (1999) also added a learning-to-learn step on the road to learn a
computer system. An experiment showed that learners who received training on explicit
conceptual models of ERP systems became better at articulating ERP concepts (Coulson,
Shayo, Olfman, & Rohm, 2003). Since companies often send someone for training and let
them train others, an improved grasp of the conceptual model of the system could help those
becoming better trainers.
In the information systems literature, another take on IT user competence distinguished
between cognitive, skills, and affective competence for methods of measuring the user
competence (Marcolin, Compeau, Munro, & Huff, 2000). Skills relate to the lower levels of
the model of (Sein et al., 1998), while cognitive competence concerns the higher ones. The
affective competence, which Marcolin et.al. studied, was self-efficacy. This division of
31
© Jens Kaasbøll, 13 Jan 2014
competence into cognitive, skills and affective aspects is a general one in educational science,
and it does not bring us closer to specific subject matter areas of competence for IT use.
‘Knowledge domain areas’ are also brought in by (Marcolin et al., 2000) as a dimension in
their classification of user competence. Word processors and spreadsheets constitute the
knowledge domain areas of their study. These knowledge domain areas only concern the type
of software used. Considering the endless supply of new software, this does not bring us
closer to a general characterisation of user competence.
Moving to the information science, they have used the term ‘information literacy.’ Literacy
came with the transition from oral to written culture, starting up more than 5000 years ago in
the small with the cuneiform in Iraq (Walker, 1987). Thus the political and scientific
discussion about literacy has been around for centuries.
Library scientists have seen the need for defining the competence for users of library
catalogues and classifications. In information and library sciences, we can find almost any
conceivable explanation of what information literacy really is (Buschman, 2009). The web
with its search engines has been a trigger for new discussions about information literacy, and
the Association of College and Research Libraries came up with a competence standard for
higher education (2000):
An information literate individual is able to:
Determine the extent of information needed
Access the needed information effectively and efficiently
Evaluate information and its sources critically
Incorporate selected information into one’s knowledge base
Use information effectively to accomplish a specific purpose
Understand the economic, legal, and social issues surrounding the use of information,
and access and use information ethically and legally
The standard also divides these topics into levels suitable as learning goals for children at
various ages.
In contrast to the IS literature, this definition does not include the information technology, but
it includes the ability to access and evaluate information. Similar to the IS literature, the
ability to use information is included in this standard. A test demonstrated the distinction
between skills in the information technology and information domains (Pask & Saunders,
2004).
Switching to the school context, the first attempt at characterizing IT user competence seems
to be Luehrmann’s speech from 1972, “Should the Computer Teach the Student, or Vice-
Versa?” (Luehrman, 1980). He advocates for pupils learning programming as well as using
computers for analysing social or ecological data, text and music and create graphics. The
issue of students’ computer literacy has been debated, where some have advocated that

32
© Jens Kaasbøll, 13 Jan 2014
students need learning programming, while others have argued that school children only need
to learn a minimum about computers. With the expansion of information technology into
other gadgets, the phrases ‘digital literacy’ and ‘new literacies’ have replaced ‘computer
literacy.’
Leu et.al. (2004) define ‘new literacies’ in this way:
The new literacies of the Internet and other ICTs include the skills, strategies, and
dispositions necessary to successfully use and adapt to the rapidly changing
information and communication technologies and contexts that continuously emerge
in our world and influence all areas of our personal and professional lives. These new
literacies allow us to use the Internet and other ICTs to identify important questions,
locate information, critically evaluate the usefulness of that information, synthesize
information to answer those questions, and then communicate the answers to others.
Leu et.al. (2004, p. 1586) also emphasize that the IT has brought literacy from text
comprehension to understanding an expanding system of all kinds of signs, including
interactive elements, pictures and animation. They also point to that the technology is
changing so rapidly that the changes of literacies are limited by our abilities to adapt (Leu Jr.
et al., 2004, p. 1591), so new technologies frequently redefine what it means to be literate.
Hence, they include competence in using the technology in their conception of ‘new
literacies.’ The multiplicity of the concept refers to that meaning is represented in various
media, and that it is used in different contexts. Lankshear and Knobel (2008) summarised
35 years of discussion about IT in schools, stating that instead of considering digital literacy
as a single skill, there are myriads of practices where IT is involved, and mastering each of
these requires a specific ‘digital literacy.’
Like the IS literature, the educationalists also include the technology and the way it is used in
practices in their conceptions about IT user competence. Also, they share the concern for the
ability to express and evaluate information with the information scientists. The lessons from
these three research areas of information technology competence thus points to that IT users
need competence in three subject matter areas:
Information, also call ‘data.’ Expressions by means of a systems of signs of any type,
including text, numbers, images, videos, etc., and the way a part of the world is
represented by expressions.
Information technology. The functionality and user interface of software and
hardware, including paper, by which the information is stored and processed.
Business fit, for coupling the activities in which the IT is used with the functionality.
‘Business’ here refers to any human activity, including leisure as well as work.
A similar three-partitioning are found in some recent studies of IT user competence.
In a study of a health management information system, the representation of the domain, the
information technology, and the management practice were identified as the three competence
areas for a management information system (J. Kaasbøll, Chawani, Hamre, & Sandvand,
2010). Representation of domain means the information which represents something outside

33
© Jens Kaasbøll, 13 Jan 2014
itself, being health in the case of health management information system. The management
practice is the business in which the system is going to be used.
Puri (2007) studied the sharing of maps between GIS personnel and indigenous inhabitants of
the mapped area in India. He identified three aspects which were crucial for both groups to
achieve a shared understanding of the maps. First, the contents of the map, or ‘the scope of
knowledge embedded in the map,’ which corresponds to the information subject matter area,
as expressed above. The second aspect is the information technology, and the third one is the
practices which go into the utilization of the object (Puri, 2007, p. 362), corresponding to the
business fit. The joint understanding of these three aspects enabled the cooperation.
This three-partitioning also corresponds to modern information systems development
methods. The activities in users' business are modelled by use cases, the information is
structured in a class model, and the technology by a handful of other formal models.
Example 1 – Bank account
Information. The banking information is representing Aziza’s account and the transfers to
and from her account. The representation of a transfer would contain a date, an id, the id of
the sender or receiver, an amount, etc. When paying, she needs to know that the receiver id
corresponds to the intended receiver.
IT. Being a competent user, Aziza knows that there is a computer in the bank, possibly
extended to a web browser, her smartphone, a card payment terminal, an ATM, where she can
withdraw cash.
Business fit. The system supports Aziza’s payment and withdrawal activities, and she needs
to know when to pay someone and how much cash which is appropriate to withdraw.
Example 2 – Health information system
Figure 11. An example of health information.
Information. A health information system contains data about health activities, for instance,
the number of babies immunized last month or the number of malaria cases treated. These
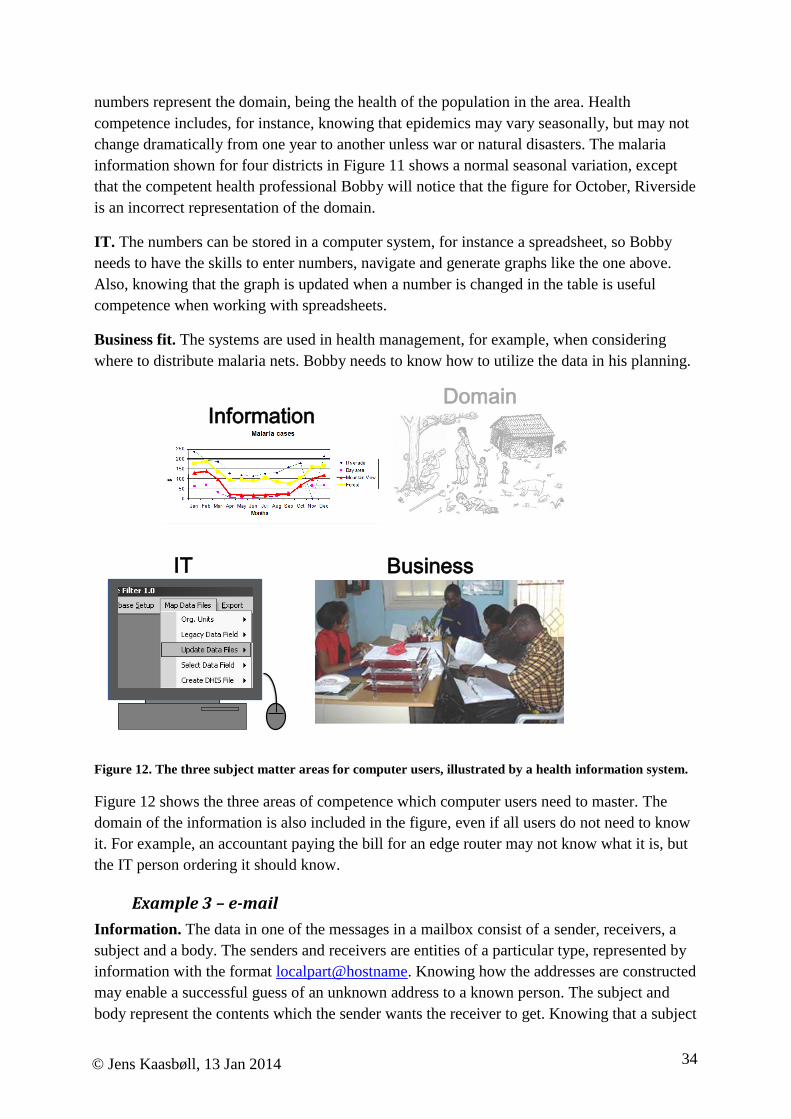
34
© Jens Kaasbøll, 13 Jan 2014
numbers represent the domain, being the health of the population in the area. Health
competence includes, for instance, knowing that epidemics may vary seasonally, but may not
change dramatically from one year to another unless war or natural disasters. The malaria
information shown for four districts in Figure 11 shows a normal seasonal variation, except
that the competent health professional Bobby will notice that the figure for October, Riverside
is an incorrect representation of the domain.
IT. The numbers can be stored in a computer system, for instance a spreadsheet, so Bobby
needs to have the skills to enter numbers, navigate and generate graphs like the one above.
Also, knowing that the graph is updated when a number is changed in the table is useful
competence when working with spreadsheets.
Business fit. The systems are used in health management, for example, when considering
where to distribute malaria nets. Bobby needs to know how to utilize the data in his planning.
InformationDomain
IT Business
Figure 12. The three subject matter areas for computer users, illustrated by a health information system.
Figure 12 shows the three areas of competence which computer users need to master. The
domain of the information is also included in the figure, even if all users do not need to know
it. For example, an accountant paying the bill for an edge router may not know what it is, but
the IT person ordering it should know.
Example 3 – e-mail
Information. The data in one of the messages in a mailbox consist of a sender, receivers, a
subject and a body. The senders and receivers are entities of a particular type, represented by
information with the format localpart@hostname. Knowing how the addresses are constructed
may enable a successful guess of an unknown address to a known person. The subject and
body represent the contents which the sender wants the receiver to get. Knowing that a subject

35
© Jens Kaasbøll, 13 Jan 2014
“Email Award Notification of $ 750,000” means that someone tries to tap into your bank
account is a useful part of e-mail contents competence.
IT. Knowing how to view incoming and compose new messages constitutes a basic
technological competence on e-mailing. More advanced competence involves mailboxes and
their structure, moving messages, filtering, storage of addresses, remote servers and local
mailboxes, etc.
Business fit. Communication is the main activity. Knowing some advantages of e-mail make
people prefer e-mailing when sending the same, large message to many people, and avoid it
when negotiating a delicate matter within a small group. However, e-mail is also exploited for
non-communicative activities like making a backup of your file by e-mailing it to yourself
and leaving the attachment on the mail-server.
3.1. Multiple domains in one application
While the banking system is only about money, other applications embed information about
more than one domain.
Example 4 – Word processor
The file generated by a word processor can be understood in two different ways, ending up in
two different triangles of information-IT-business.
First, consider the writing of a letter about the weather. The written text will represent the
weather, implying that the text is information. The word processor’s functionality for
accepting, storing and displaying a sequence of symbols constitutes the information
technology in use, and the business is letter-writing, see Figure 13, left part.
Second, this software has no operations for processing weather information nor for any other
domains which we could imagine writing about. Rather, its operation concerns the formatting
of any text, regardless of its contents. In order to do this, the text processor stores information
about the text format, like the size of margins and the font chosen, and its functionality deals
with changing the format. The activities for which formatting is used deal with designing the
letter so that it is pleasing for the intended receiver, see Figure 13, right part.

36
© Jens Kaasbøll, 13 Jan 2014
Information Domain
IT Business
It is raining cats and
dogs these days. We
hardly go out of the
house.
Writing and editing
Information Domain
IT Business
Formating
Top margin: 2.5cmLeft margin: 2.5cm
Font: Times Roman
Contents Format
Figure 13. The two types of data in a text file and its corresponding domains, IT and business fit.
The reason for this double characteristic is grounded in the data that the word processor is
storing. First, the written text itself is data, and second, the formatting data is about the visual
design of the text. Being about two different domains, the text and the formatting data
constitute two different subject matter areas of information for the user. Consequently, there
are also two different technology and business areas. The two technology areas are found
amongst the functionality within the text processor, and most of its functionality deals with
formatting, see the comparison in Table 3.
Table 3. The two ways of interpreting a text processor according to the subject matter areas.
Contents Format
Information Text Text formats
IT Functionality for entering,
deleting and moving text
Functionality for layout and
design
Business Writing and editing Formatting
3.2. Operating on the domain by means of IT
When pushing the brake on a car, it slows down. You don’t enter a number representing speed
reduction or read information about braking power. While older cars did not even have the
option of such data to be entered or read, modern brakes have an IT controlling unit which
kicks in when the car is skidding, such that a user interface with numbers is conceivable.
However, to ease driving, the analogue interface of a pedal to push is kept, and no information
concerning braking power is displayed, see Figure 14.

37
© Jens Kaasbøll, 13 Jan 2014
InformationDomain
Technology Business
Figure 14. All information concerning braking is hidden, even if the brakes are controlled by an IT unit.
The use of IT in such devices is hidden for the user, and no digital interface with information
exists. This case is therefore considered being outside the interest of learning and teaching IT
use. However, it might be a task for designers to create a user interface where data is
displayed.
Information Domain
Technology Business
Syntax
•Number after ←
•No argument after RPT
Semantics
←5
↑3Turn left 5 x 6
Move ahead 3 feetmeans
←5
↑3
Program
storage↑
← →
↓
1 2 3
4 5 6
7 8 9
GO
Activation
Figure 15. Competence areas for a programmable toy car. In this case, business is playing.
Operating a toy car by means of a series of instructions constitutes a case where the user has
to enter all the information as symbols and not by pushing pedals. In a study of people
learning operating these cars, their competence was divided into syntactic, semantic and
technology knowledge (Shrager & Klahr, 1986). Syntax is a set of rules defining the way
individual symbols can be composed into sequences of commands, for instance that the
symbol must be followed by a number. Semantics is the effect of symbols on movements of
the car, for instance that 5 means turn left 5 units (of 6° each), i.e., semantics concerns the

38
© Jens Kaasbøll, 13 Jan 2014
relation between information (symbols) and the domain (car movements). Technology
knowledge included that the toy could store a program of instructions, and that some buttons
would be used for storing instructions and others for carrying out the program or single
instructions, see Figure 15.
Since information is expressed in signs from a language, the competence areas of IT use
resembles those of the science of languages, linguisics. Linguistics separates syntax and
semantics in the same way as in the study of programmable toy cars. Linguists call the
appropriate use of language ‘pragmatics,’ and business fit is the pragmatics of IT use. Media
would be the counterpart of IT in linguistics.

39
© Jens Kaasbøll, 13 Jan 2014
Chapter 4. IT concepts
The learning aim of this chapter is to be able to determine the IT concepts in topics to be leant
by users.
Information technology is characterised by a quick turnover of new software versions,
information systems and hardware gadgets. Users therefore need to upgrade their competence
often, so they need to constantly learn about the technology and probably also about the two
other subject matter areas described above. This implies that IT user competence also includes
the competence for learning about IT, which includes learning about information, learning
about IT, and learning about activity fit.
From the educational sciences, we know that understanding ease transfer of skills to new
situations (Bransford, 2000, pp. 9, 16-17, 63, 65). For example, a computer user who has
understood the concept of text flow, and that text flows from one column to another, but not
between cells in a table, would be more likely to choose the right kind of text structuring tool
in a new word processor..
For the novice user, IT may look confusing, and different devices and software packages may
present general principles and concepts in idiosyncratic ways. This chapter will identify some
IT concepts and principles which should be recognisable for users and which appear in all
software. In the next chapters, levels of competence will be explained, and this constitutes the
background for designing how a sequence of concepts to be learnt should be composed.
Computers and other IT technologies are constructed on the basis of a few principles.
Throughout half a century, more principles have been introduced for easing the design of
software, and these principles have also appeared in user applications. Some basic concepts
for user programs will be introduced.
4.1. von Neumann architecture
Information technology processes electrical currents and magnetic charges, but users are not
interested in whether a particular circuit inside the box has a 5V charge or not. User interpret
the physical signals as symbols, pictures or sounds, which can be information representing
something else. Therefore we say that computers are machines manipulating symbols.
A watch is another example of a symbol representing machine. It may be built from some
electro-mechanical parts, but we interpret it as a display of time. While a watch only deals
with time, computers can do any type of symbol processing, and for this reason we call them
universal. The universality is enabled by one of the basic principles of computers, being that
data and programs are stored in the same way. This is called the von Neumann architecture
(von Neumann, 1945), named after a Hungarian being the scientific leader of a group
designing early computers. The von Neumann architecture allows us to insert a new program
into a computer in the same way as we enter data. When installing a new program, the
computer can do other processing than before, and this is how the universality is realized in
40
© Jens Kaasbøll, 13 Jan 2014
practice. Since we can achieve new functionality on smart phones by downloading apps, these
gadgets are also universal symbol processors, hence also computers in the von Neumann
sense.
The von Neumann architecture also enables processing the same data with two different
programs. This opens for structuring data in layers, where different aspects can be processed
in their own ways.
As seen in the previous chapter, the contents of a document constitute one way of regarding
word processors, while the formatting enables another view. This can be expressed by saying
that the document can be separated in one contents layer and one format layer, and that each
of these layers can be changed independently of the other. In web page design, the contents
can be coded with html, while the layout can be set by Cascading Style Sheets.
Users who mix up the two layers are likely to do more work when changes have to be made
than those who keep format separate from contents. For example, users who add a blank line
in order to achieve a format effect, namely larger space between paragraphs with text, will
have to change each paragraph. Paragraph formats, including space above and below, can be
set by the styles, which is a formatting tool. When changing the style, all paragraphs of that
style are updated.
In general, all data can be viewed and manipulated at many layers. For example, if a file is
suspected to contain a virus, it can be opened by a Notepad or similar editor, which treats all
data as characters, thus internal codes and user data are viewed as being of the same type.
While the deeper layers of the computer software is normally left for the programmers to deal
with, having some insight into layers of the internet protocol may, for example, help users
understand where connection problems reside.
The hardware layer has some principles which users need to cope with, since they have to
grasp the difference between input and output. Some may also have understood that for
example, the memory chip in a digital camera is also a general storage for data, so they can
use it as a backup for their files while on vacation.
4.2. Network protocols and connections
The layered architecture of the computer is a key model to understand the network
infrastructure and how the connection between computers is set up. A network protocol is a
program with set of rules for message exchange between digital devices. When the same set
of rules exist in two devices which are connected, these devices can exchange data.
In order to work between diverse devises, there is a layer of protocols. Simple and cheap
devices may only be able to receive a stream of electrical pulses and forward these to all other
of its connections. They operate on the hardware level only and has the hardware protocol.
Everything is electrical pulses for the hardware protocol.
A software protocol recognises internet addresses. When clicking a link in a web page, a
transport protocol in the computer is activated and sends a message to the internet address in

41
© Jens Kaasbøll, 13 Jan 2014
the link. All network devices which are more advanced than those with only a hardware
protocol distinguish between an internet address (IP, for instance www.google.com) and the
contents of the message. These devices have transport protocols which look up in their list of
addresses and forward the message to another network node closer to the destination.
An application protocol will also be able to interpret the contents of a message. For instance, a
web browser has Hypertext Transfer Protocol (HTTP) and can therefore display a web page
with paragraphs, tables, pictures and links. Electronic mail requires another application
protocol.
When requesting a web page through clicking on a link, the request is transported through a
variety of connections between the user’s browser and the web site. Normally, there is a local
area network between the user and an Internet Service Provider (ISP). The local area network
may have wireless as well as cabled hardware. The ISP connects its users to the Internet,
which again has a connection to the remote web host computer, see Figure 16
Applications
Browser withURL, …
Web serverTransport software
IP address, network key, …
User connection
Internet gateway
Hardware
Antenna, signal, cable, …
User’scomputer
LocalArea
Network
Internet Service Provider
InternetRemote
web host
Figure 16. Layered network model for diagnosing web connection problems.
When trying to access a web page, there are many things in different places which can go
wrong.
Virus or software bug in the web browser
Wrong web address
Local antenna or cable from the computer.
Too weak radio signal.
The user connection of the Internet Service Provider (ISP).
The external internet gateway of the Internet Service Provider.
The server from which the web page is transmitted is broken.
A network model like Figure 16 might guide users locating errors.

42
© Jens Kaasbøll, 13 Jan 2014
Browser failures can be checked by switching to another browser. The web address is
normally visible in the browser and can be typed by users, so understanding how addresses
are constructed would be a part of user competence when locating errors.
Antennas, cables, radio signals and transmitters are recognisable hardware devises and
properties, so dividing the user's model into hardware and a software layer would be feasible,
and it would contribute to understanding at least one useful distinction in the communication
infrastructure.
The network further away from the user cannot be seen or experienced directly, so
distinguishing hardware from software there would be meaningless. Another distinction can
be experienced, however. When managing to log in successfully at the ISP, users experience
that the connection with the ISP is established. Nevertheless, the web pages may not appear,
due to a broken gateway between the ISP and the internet. So a user model might distinguish
between the user side of the ISP and its internet side.
The last bullet point in the list above may be experienced due to that most other web pages are
accessible but the one specifically looked for.
4.3. Sequencing
Computers and other digital devices operate through sequences of operations. Seen from the
user point of view, each application running on a computer carries out its own sequence of
operations called a process. Several programs can run their processes at the same time,
without interfering with each other, so their processes run in parallel. For example, we can
write in a word processor and import music from a CD to the computer at the same time.
Correspondingly, a Facebook wall can contain several processes, each having a topic which
people write comments to. In contrast to running a word processor and a CD import at your
own computer simultaneously, Facebook involves several people, each with their own
computer, contributing to a joint communication process.
We achieve a continuous communication process when all participants are present at the same
time, also called synchronous communication. When writing on the Facebook wall, there can
be time delays between the comments, so the communication process is discrete or
asynchronous.
Concerning the number of readers, we distinguish between point to point and mass
communication, the latter is for everyone to be a receiver, or to have read-only rights.
Coupling the two modes with the number of receivers, we get a matrix like Table 4, where
examples of technology are included.
Table 4. Modes of communication and number of receivers with examples of technology.
Point-to-
point
Mass
Synchronous Chat TV

43
© Jens Kaasbøll, 13 Jan 2014
Asynchronous E-mail Web
Third, there is a difference between whether the communication process is initiated by the
sender, a push, or by the receiver, a pull. Sending off an e-mail is a push, while downloading a
web page is a pull operation. In the synchronous point-to-point communication, the initiative
switches and the communication process becomes interactive.
Forth, the type of data transmitted makes us select appropriate software and determines how
we sense the data and express ourselves. Being synchronous, point-to-point and interactive,
the phone requires hearing and speaking, while the textual chat depends on seeing and typing.
Some software, like a learning management system and Facebook, utilize combinations of
communication functions, each according to the four dimensions above.
When booking a ticket at the movies on the web, the user initiates an asynchronous
communication process with the database at the movie theatre’s computer. Simultaneously,
other customers can run similar processes against the same server. In this case, each
communication process has a definite starting point when the user identifies the seats she will
book. Thereafter, only this process can access the data for these seats until the seats are
booked, the user decides not to book them, or the user has spent tool long time, so the process
is ended by the server.
4.4. Structures of data units
Data units of the same or of different types are organised into larger structures, enabling
composite types. There are four basic kinds of structuring:
Sequence. The data units are following each other, and they may be numbered. The letters in
a text document are sequentially ordered. A table in a data base is also a sequence, although
its ordering is irrelevant to the user.
Grid. The units are organised in a grid which can be accessed through coordinates. A raster
graphic image has pixels which can be numbered horizontally and vertically. There can be
more than two dimensions. Grids can be conceived as multi-dimensional sequences.
Hierarchy. The units are organised like containers within larger containers. The files in the
operating system are organised in a hierarchy.
Network. The data is linked in a network without any strict topology as the hierarchy. The
web is a network of pages.
A web page is a sequentially structured data type, which is then a part or a larger network
structure.
Again, there are operations which can manipulate the structures, like inserting a new column
in the spreadsheet or moving a folder from one place in the hierarchy of the operating system
to another.
44
© Jens Kaasbøll, 13 Jan 2014
Computers allow for creating links, references, shortcuts or whatever they are called in order
to achieve two effects:
Functional dependency, meaning that when data is changed where stored, the
changes are also accessible from where the link to the data goes. This principle
ensures that data is stored and hence updated one place, so that inconsistencies are
prevented.
Breaking the structure, in the sense that from one place in a file, there is a reference
which brings the user to anywhere else in the file or to another file, regardless of
hierarchical, grid, sequential or other orders.
Type-instance and generalisation-specialisation relationships may all be considered variants
of the functional dependency principle, where changes at one place cascade to those places
which are linked to it and are supposed to be influenced by it.
4.5. Meta data
The properties of a file, which often can be found by right-clicking on the file symbol in the
operating system, are data about the file, and this aboutness relation is normally called meta.
Some of the meta data are functionally dependent on the contents of the file and its production
process, while other can be set, like the access restrictions.
4.6. Access rights
Access rights can be ordered from very little to the maximum:
Knowing the existence, which can be called Write-only when you enter the data
yourself and Notification of existence when others have stored the data. When writing
your password, you cannot read it, and when sending off an e-mail, you cannot read
the copy which ends up in the receiver's inbox. There is no access after the writing.
When searching for a book or paper on the web, you may come across the title at a
web site, but in order to see the full text, you have to pay a fee. Without paying you
are in the situation that you know the existence of the data, but you have no access to
its contents.
Read only. The huge majority of pages on the web are only for reading, and you
cannot change them. You may download the source code and change your own copy
of the page, but those changes will not be stored at the original web page.
Append. A blog would allow you to add text, but not to change what others have
written.
Change. When buying a book from a web-shop, you write an order, which is stored in
the database of the bookshop, where you are appending data. When you change your
address, you are also deleting the old address and inserting a new one, so you have the
change access to your personal data. When updating an article on Wikipedia, you also
change what others have written, although your change access might have to be
approved by an editor.

45
© Jens Kaasbøll, 13 Jan 2014
Delete means not just changing the contents of a file or deleting all its contents, but
deleting the file itself. Most users have Delete rights to the data files on their own
computer, digital camera, mp3 player or other personal devises. Normally, on shared
data, only the owner can delete.
Access rights are associations between users and data. Often users are divided into groups,
each of which as specific access rights. For example, there are internal users with change
rights, external members who can append, and non-registered users who only can read.
46
© Jens Kaasbøll, 13 Jan 2014
Chapter 5. Learning IT concepts
The learning aim of this chapter is to be able to develop learning material which will help
users understand and achieve problem solving competence in IT.
When using IT, people learn skills, but practice does not necessarily promote understanding.
While skills are associated with doing, understanding requires the ability to express and
communicate in talking or writing about the subject matter areas. Building on understanding,
users can also achieve problem solving competence in IT.
This chapter will first describe the learning trajectory when reaching two levels of IT
understanding. Learning material for supporting understanding will be presented for each of
these levels, and issues of misunderstanding will be discussed. Learning solving IT problems
will be presented in the next chapter.
5.1. From skills to understanding
First people learn doing, and second, they think about what they did. The second step triggers
understanding of ideas, concepts, principles, relations, etc. Further, people learn through
abstract conceptualisation, which includes relating concepts to each other. Studies of learning
of abstract concepts in maths has lead to theories supporting the direction of learning from
concrete experience to abstract concepts (Sfard, 1991). Since IT concepts also are formal and
abstract, like maths, it is reasonable to believe that IT is learnt in a similar way.
Pedagogical theory – Constructivism
The constructivist perspective on learning is based on the assumption that new skills and
understanding is based on what we already know. For example, if we see a button in a new
program which has the same name as in the previous program, we assume that it does the
same operation. This implies that when we are presented with something new, we always
associate it with something familiar. Since new understanding is based on the already
existing one, we construct our own knowledge; we do not copy the teacher’s
understanding.
People are active and communicating learners, and learning takes place in interactions
with the environment, including fellow learners, teachers, computers and books. A culture
which encourages questioning is therefore promoting learning.
In order to accommodate for the learners’ construction, the teacher needs to know the
learners’ starting level, so that teaching can be directed towards what is needed to build
from that level.
This part of the book will identify levels of competence, which the teacher can use for
assessing the learners’ levels. Also, we will see how learning can go wrong when starting
from a basis which is not aligned with the material to be learnt.

47
© Jens Kaasbøll, 13 Jan 2014
From a study of novice users learning searching in a database, the learners became able to
describe their searching in terms of the computer’s operation, but they were unable to state
how the system worked (Borgman, 1986). This means that they could do it, but had not
reached an understanding of searching.
Programmers have to learn IT concepts and principles to a larger extent than users. In a study
on the learning of the array concept, it was found that the learners start by constructing an
array (Aharoni 2000). This means that they carried out an action and gained concrete
experience. After having interpreted their actions, the learners were able to refer to the
starting and outcome of the action without mentioning the steps taken during action. Since
their first understanding was a model consisting of input-process-output, it is called IT
functional understanding. In the third process, the learners reified the action into a concept
and related it to other concepts, e.g., being able to say that that an array consists of indexed
variables. Addressing the structure of the technology, this is called IT structural
understanding, and the learning process of reification and relation for getting there is called
reflection. A study of user learning has confirmed that learning of the concept of master slides
takes place in a similar way (Stamatova and Kaasbøll 2007).
Arriving at the two levels of understanding is summarised:
IT skill. The first step is being able to perform some action, for example, referring to
another cell in a spreadsheet by typing a formula in one cell and clicking in another.
At this initial level of mastery, the user can only carry out the operation and possibly
also express also each push of a button, but without being able to explain anything.
The learning process of interpretation takes the learner to the next step:
IT functional understanding. Step 2 is when the learner can refer to the input and
output of this action without actually carrying it out. In the example, the user would
tell that in order to have one cell referring to another, one has to get the coordinates of
the other cell into the formula.
The learning process of reflection takes the learner to the next step:
IT structural understanding. The final achievement is when the learner can refer to the
concept as an object of its own and use it when talking about other phenomena. The
concept would then have become reified. The spreadsheet user could say that cell-
referencing is an ingredient in formulas.
Learners’ level of mastery can be found by observing what they do and say. Assume that they
are supposed to learn the concept of a master slide and how changes in the master slide can
affect all the slides in a presentation file.
Learners who have completed the sequence
of computer operations that demonstrates
the skill can be asked to express the concept.
George is repeating the steps which she
carried out without expressing the initial
Master slide—George:
I went to view and slide master and then
changed the font size, and went back to the
normal view.

48
© Jens Kaasbøll, 13 Jan 2014
state and the outcome of the operation, so
she has not reached the second level of
functional understanding yet.
Mireille has expressed the starting state of
a font size, which is different from what
he wants. Further, he mentions that the master slide can do all the desirable changes, which is
expressing the function of the operation. Mireille is therefore at the functional understanding
level. By mentioning font size and slides in his explanation, he demonstrates that for these
two concepts, he is at the structural level of understanding.
The learner Domenico demonstrates that
he is at the structural level of master slide.
By comparing master slide with page
layout, Domenico refers to master slides
as an entity of its own. Since Domenico
has grasped the master slide idea and also
seen its resemblance with page layout in a
text processor, he is ready for learning a
more general concept. The ability to compare with other concepts means that Domenico can
build a structure of IT concepts; hence he has reached a structural understanding.
While some users generate adequate understanding on their own, slow learners are
particularly bad at doing this (Furuta, 2000). The result is that they will have serious trouble
understanding the next concept which builds on the one they have not understood, making
them even poorer learners.
Since navigation starts from an understanding, interpretation and reflection close the learning
cycle as illustrated in Figure 17.
Skills
IT
Inte
rpre
t
Repeat
Imitate
Reflect
Structural
Understanding
Navig
ate
Understanding
Skills
Functional
understanding
Skills
Figure 17. The complete cycle of learning IT understanding and skills. Subject matter in the centre.
‘Mental models’ is often used as a common term for functional and structural understanding.
In addition, mental models are normally also considered to include the way the interface is
Master slide—Mireille:
I wanted to change the font size of all the
slides, so I changed it at the master slide.
Then it will change all the slides.
Master slide—Domenico:
Master slides control the appearance of the
normal slides. When you change the master,
all the others will change too. It’s like the
page layout in the text processor, which also
changes every page.
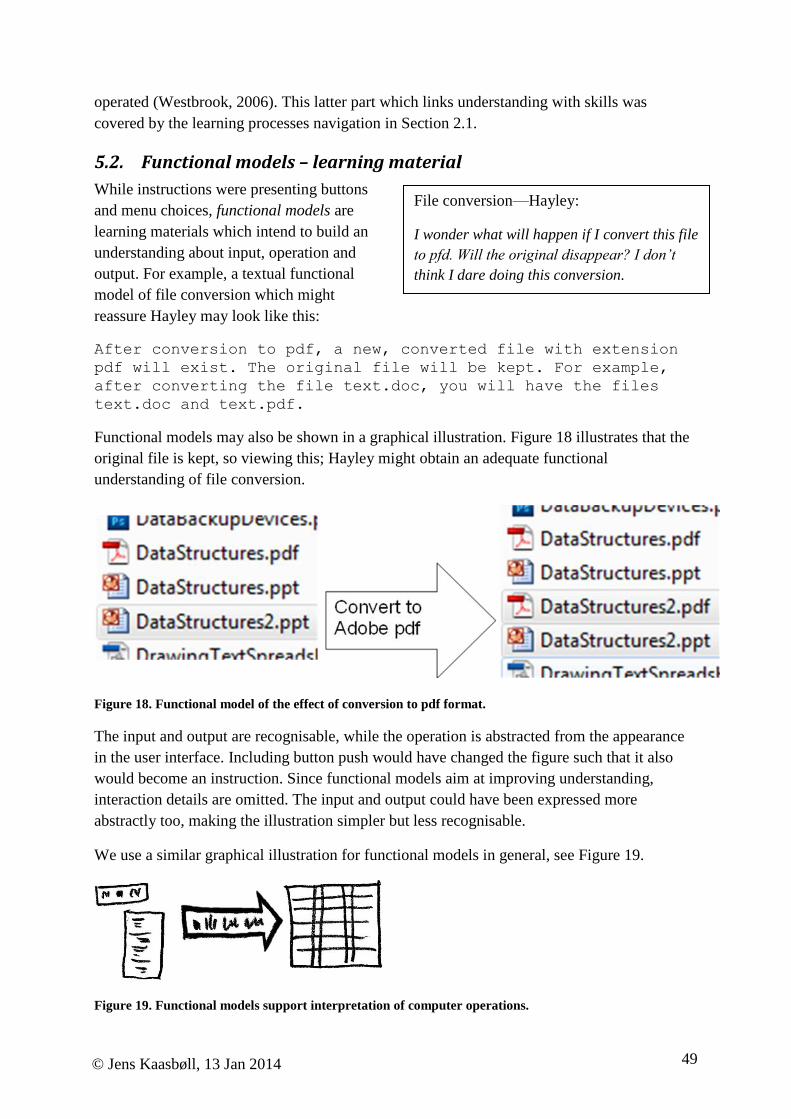
49
© Jens Kaasbøll, 13 Jan 2014
operated (Westbrook, 2006). This latter part which links understanding with skills was
covered by the learning processes navigation in Section 2.1.
5.2. Functional models – learning material
While instructions were presenting buttons
and menu choices, functional models are
learning materials which intend to build an
understanding about input, operation and
output. For example, a textual functional
model of file conversion which might
reassure Hayley may look like this:
After conversion to pdf, a new, converted file with extension
pdf will exist. The original file will be kept. For example,
after converting the file text.doc, you will have the files
text.doc and text.pdf.
Functional models may also be shown in a graphical illustration. Figure 18 illustrates that the
original file is kept, so viewing this; Hayley might obtain an adequate functional
understanding of file conversion.
Figure 18. Functional model of the effect of conversion to pdf format.
The input and output are recognisable, while the operation is abstracted from the appearance
in the user interface. Including button push would have changed the figure such that it also
would become an instruction. Since functional models aim at improving understanding,
interaction details are omitted. The input and output could have been expressed more
abstractly too, making the illustration simpler but less recognisable.
We use a similar graphical illustration for functional models in general, see Figure 19.
Figure 19. Functional models support interpretation of computer operations.
File conversion—Hayley:
I wonder what will happen if I convert this file
to pfd. Will the original disappear? I don’t
think I dare doing this conversion.

50
© Jens Kaasbøll, 13 Jan 2014
Functional models are also needed when the output does not appear as expected. Figure 20
illustrates a functional model of a frequently appearing error. In order to understand this
functional model, the user should already have understood the concepts client and server.
Further, if not knowing what “HTTP standard response code” is, the user should understand
that this can be ignored. There might be other functional models which fits the novice user
better and still others intended for the advanced ones.
Figure 20. A functional model from the Wikipedia.
5.3. Structural models – learning material
In order to improve learners’ reflection such that they can build better mental models, we may
provide structural models in addition to the functional ones. A structural model describes
structures of the IT or structures of IT concepts and their purpose generated by the designer of
a system. Figure 16 is a structural model of network layers and connections.
Structural models in general are illustrated like Figure 21.
Figure 21. Structural models support reflection for improving the learners' understanding.
IT structures — Recognisable elements
When using an application, some features and principles are easily recognisable at the
interface, for example that the cells in a spreadsheet are organised in a grid, and that the text
in a document has a specific layout. The sequence of operations, typically whether to choose
data before operation or vice versa, may not be displayed, but they are experienced through
the users' actions, so we obtain an immediate impression.
Other features are less prominent. Examples of hidden features are that the text in table cells
in a text document does not belong to the main text flow, and that behind a number in a
spreadsheet cell could be a formula which refers to many other cells. In the word processor,
there is no intuitive way to see where one text flow starts and another one ends. It might be

51
© Jens Kaasbøll, 13 Jan 2014
possible to view the non-printing characters, but these do not necessarily tell us about the text
flows or many other properties of the document, like the paragraph and character styles.
When the user interface does not show the hidden features, they should be made explicit
through a structural model. The written text is a one-dimensional sequence, while structures in
the computer often are of other kinds. Since many hidden aspects are structural, a
combination of language and graphics would normally be a better option than just one of
them.
Creating useful graphical models is partly arts & crafts, but there are also principles to
consider. In the following, specific considerations for visualising the interior functioning and
structure of software are presented.
Any presentation of what goes on in the interior of the computer should be based on the
current competence of the users, including the users' understanding of concepts, experience
with operating the software and their background for understanding the notation used.
In order to aid understanding, and not make learning more difficult, graphical representations
need to be
simple, in the sense that they contain few (7±2) elements
recognisable, so that each element provides immediate meaning
A structural model of the internal structure of the file system could be written:
Folders can contain files, links and other folders.
Figure 22 is an illustration of the same. It is simple, but is made with a notation which is not
recognisable by most users. On the other hand, maximum recognisability is sought in Figure
23, and this visualisation of the same data structure also aims at providing a general model of
the structure of the file system. Figure 23 also uses examples instead of the general categories
in Figure 22, bringing it closer to user experience but making the illustration larger and less
simple. There is often a trade-off between simplicity and recognisability.
Figure 22. Abstract model of the file system

52
© Jens Kaasbøll, 13 Jan 2014
Figure 23. Recognisable model of the file system.
Figure 22 is a model of how the file system can be conceived under the surface, while Figure
23 is mainly a surface model with an additional graphical element for showing the under-the-
surface connection. The user interface of the Windows file system provides a reasonably
comprehensive view of the data structure when viewed in the Explore mode shown here.
For applications which aim at the What You See Is What You Get (WYSIWYG) principle,
the data shown at the interface is supposed to mimic the printed copy, and then there is little
room for also displaying the underlying structures. The view of a text file can include a table,
which may be a copy of the spreadsheet or brought into the view because the user has set up a
link to the spreadsheet file. Despite identical visual results, the underlying data structure will
differ. In such situations, the illustration should depict the two data structures in the hard disk
of the computer, and that they appear in the same way at the interface, see Figure 24.
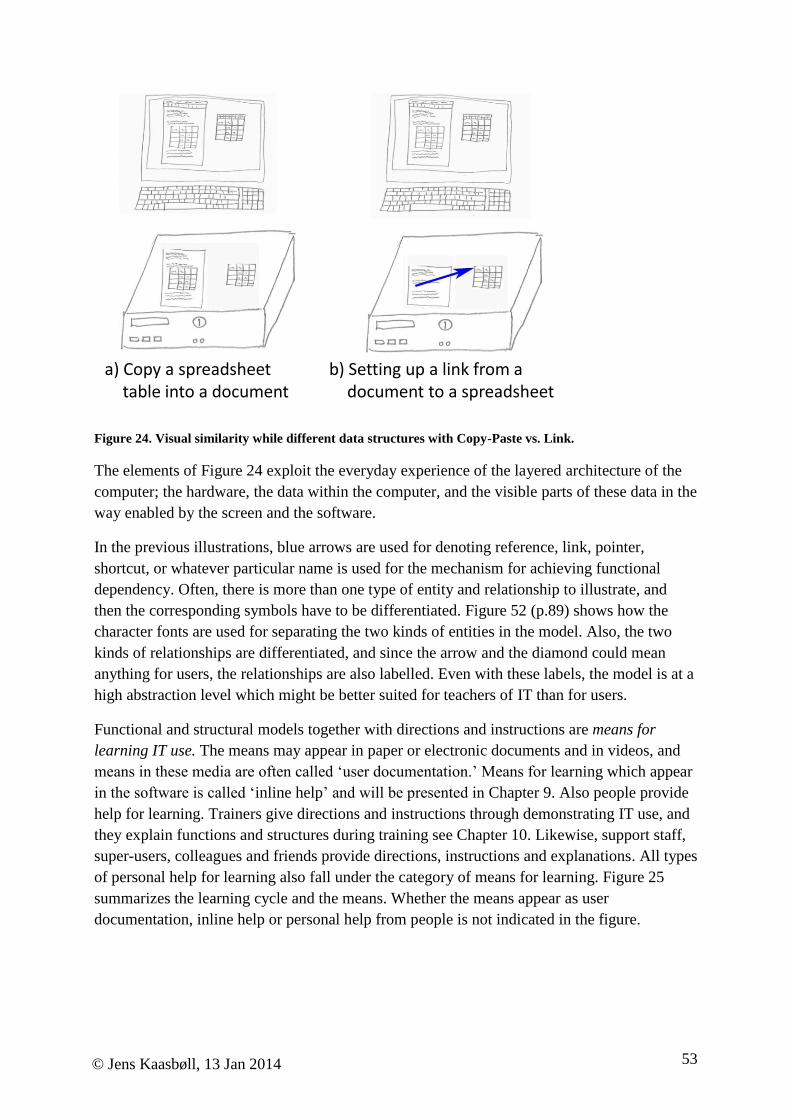
53
© Jens Kaasbøll, 13 Jan 2014
a) Copy a spreadsheet table into a document
b) Setting up a link from a document to a spreadsheet
Figure 24. Visual similarity while different data structures with Copy-Paste vs. Link.
The elements of Figure 24 exploit the everyday experience of the layered architecture of the
computer; the hardware, the data within the computer, and the visible parts of these data in the
way enabled by the screen and the software.
In the previous illustrations, blue arrows are used for denoting reference, link, pointer,
shortcut, or whatever particular name is used for the mechanism for achieving functional
dependency. Often, there is more than one type of entity and relationship to illustrate, and
then the corresponding symbols have to be differentiated. Figure 52 (p.89) shows how the
character fonts are used for separating the two kinds of entities in the model. Also, the two
kinds of relationships are differentiated, and since the arrow and the diamond could mean
anything for users, the relationships are also labelled. Even with these labels, the model is at a
high abstraction level which might be better suited for teachers of IT than for users.
Functional and structural models together with directions and instructions are means for
learning IT use. The means may appear in paper or electronic documents and in videos, and
means in these media are often called ‘user documentation.’ Means for learning which appear
in the software is called ‘inline help’ and will be presented in Chapter 9. Also people provide
help for learning. Trainers give directions and instructions through demonstrating IT use, and
they explain functions and structures during training see Chapter 10. Likewise, support staff,
super-users, colleagues and friends provide directions, instructions and explanations. All types
of personal help for learning also fall under the category of means for learning. Figure 25
summarizes the learning cycle and the means. Whether the means appear as user
documentation, inline help or personal help from people is not indicated in the figure.

54
© Jens Kaasbøll, 13 Jan 2014
Skills
Understanding
Directio
ns
Structural models
Instructions
Fu
nct
ion
al
mod
els
IT
Inte
rpre
tRepeat
ImitateN
avig
ate
Reflect
Figure 25. The processes of learning IT skills and understanding with corresponding means for learning.
5.4. Learning from Functional and Structural models
In a study of instructions versus functional models, ten novice users of a computer program
were given instructions as help while ten others were provided with functional models (Dutke
& Reimer, 2000). They were first given five tasks which corresponded closely to the
instructions and functional models. Thereafter, they completed two more tasks which differed
somewhat from the help provided. While there was no significant difference in the first five
tasks, those who had received help through functional models performed better in the
modified tasks (Dutke & Reimer, 2000). Despite the small number of learners, the study
indicates that the competence acquired through functional models is more robust when
transferred to new settings.
A summary of research on teaching in formal domains shows that textual explanations in
combination with diagrams is the best combination for developing structural understanding
amongst the learners (Wittwer & Renkl, 2010). Our brains have a very limited short term
memory, making it impossible to make sense of many stimuli occurring concurrently, see
Cognitive load in Section 2.1. However, sight and hearing operate in parallel, so we can
combine visual and audio impressions and make sense of the combination. Textual
explanations accompanying a diagram should therefore preferably be oral.
Since slow learners are particularly bad at generating functional and structural understanding
(Furuta, 2000), they will benefit more than fast learners from being explicitly taught by means
of functional of structural models. In a test comparing explanations with and without
diagrams, including diagrams improved learning, in particular for learners with low verbal
abilities (Cuevas, 2002).
An experiment demonstrated that learning can be greatly improved by aligning structural
models with the learners’ visual ability and preferred style of learning. One hundred
undergraduate students were divided into high and low visual ability through a paper folding
test. Half were given an abstract structural hierarchical model of folders and messages of an e-

55
© Jens Kaasbøll, 13 Jan 2014
mail system, while the other half received a model which demonstrated the analogy between
the computer structure and a letters in paper-folders. Those of high visual ability learnt better
from the abstract model, while the low visual ability students learnt more from the analogy
model (Sein & Bostrom, 1989). The students were also grouped into their preferred learning
styles, being abstract reflection versus concrete repetition and imitation. The abstract learners
with abstract structural model outperformed other combinations, while the concrete learners
with the analogy models were second best. Abstract learners with analogy models and
concrete learners with abstract models were the worst combinations (Sein & Bostrom, 1989).
This shows that one type of learning material does not fit all.
Since we normally cannot know in advance what learners prefer, the solution is creating a
variety of models, some abstract like Figure 22 and other mode concrete like Figure 23. While
abstract models would be constructed from boxes and arrows, the concrete model should
depict a phenomenon which the learner is familiar with. The concrete model in the experiment
reflected a domain outside of computers. If the learners have concrete experience with the
computer interface, this could also be used in structural and functional models, like Figure 23.
Videos providing functional and structural models
The contents and illustrations for functional and structural models could be the same in
documents and videos. There are a few guidelines particularly for videos, however.
People’s ability to receive and combine visual and oral stimuli indicates that verbal
explanations should be provided orally. For instance, when presenting a structural model like
Figure 23 in a video, the graphics should constitute the visuals, and a voice should tell about it
(Clark, 2007). There should also be a finger or a colour blob marking the area which is talked
about at the moment.
Adding explanatory text in the picture for presenting the graphics would be a mistake. That
would overload visual capacity while not utilising our hearing.
It has also been found that video presentations are more effective when the viewer feels like
there is a conversation going on. In order to strengthen this impression, there should be a real
voice, and not a computer generated one (Clark, 2007). The feeling of being in a conversation
is also strengthened if a person is visible on the screen for periods, although this could be a
simple, animated figure (Clark, 2007).
Like any external source for learning, videos need to be as short as possible, meaning that also
functional and structural models need to be presented without additional disturbance. An
example is normally needed, and this should therefore also be to the point without additional
features.
A simple sequence for a video providing a functional or structural model could be:
1. Picture of a person presenting the concept briefly.
2. Picture of graphics with a finger or colour spot. The voice of the person.

56
© Jens Kaasbøll, 13 Jan 2014
3. Picture of a person repeating the concept.
5.5. Defining a concept
Functional and structural models point to the need to explain IT concepts to users. When
considering making learning material for a concept, its aspects need to be spelled out.
First of all, a concept has a purpose denoting its usefulness. This aspect will be explained in
more detail in Chapter 8. The previous sections points to its structure as one aspect, but there
may be both an internal and an external structure to consider. Functional models indicate that
some concepts are operations, and we also know that for concepts that are data, there are
operations which can be carried out on it. Finally, concepts can be compared to other
concepts, showing similarities and differences.
Somewhat more detailed, Table 5 describes aspects of a concept which can be included in a
definition. The aspect termed ‘Why’ refers to usefulness and activity fit, the ‘What’ concerns
data and functionality. Skill level aspects are omitted, such that the location of an operation
and the steps to carry it out are excluded from the theoretical definition. Only some of the
What-aspects may be relevant for a particular concept.
Table 5. The aspects of a concept.
Aspect Explanation Example—file system
Purpose - Why The usefulness Provides access to all data in the
computer
Functionality –
What
For an operation: the
transformation which it causes.
For data: the operations which
can be carried out on it.
Files and folders can be created,
deleted, copied and moved between
folders.
Contents (data) -
What
The constituents Folders consist of other folders, files,
and links. Files consist of data.
Internal structure
(data structure) –
What
How the constituents are
organised.
All files and folders are organised in a
hierarchy with the top folder
representing the computer. A file is
located in one and only one folder.
External structure
(data structure) –
What
How the instantiations of it
relates to instantiations of other
concepts
Folders which you have access to on
remote servers may appear as folders
on your computer.
Comparisons
with other
concepts
Similarities and distinctions to
other concepts.
The file system regards a file as a
closed entity. Other programs are
needed to open a file and change its
contents.
The aspects in Table 5 are intended for the person authoring learning material as a preparation
for making functional or structural models for users. A functional model would concentrate
on the functionality, while a structural one could include several of the aspects in the table. A
model should concentrate essentials and not cover all aspects, as illustrated in Figure 22 and
Figure 23.

57
© Jens Kaasbøll, 13 Jan 2014
5.6. Learning relationships between concepts
While data structures can be illustrated by user interface elements, relationships between
abstract concepts like data-types and functional dependency have no obvious visible clues.
Concepts with related meaning
Consider Fadhili, who might have mixed up
two concepts; e-mail address and web page
address. A possible way of clarifying the
distinction between two concepts is
comparing them in a table, for example as in
Table 6.
Table 6. A model for distinguishing two concepts.
Web page address – URL –
Uniform Resource Locator
e-mail address
Example www.google.com [email protected]
Purpose Locate a web page Identify your inbox as the sender or
receiver of an e-mail
Where Address field of browser From field or To field in e-mails
you send
We also might have to explain to Fadhili that his inbox is not a web page, and that he should
rather find out the URL of his e-mail service.
Homonyms
Some terms have two different
meanings, for example, ‘well’ can
mean a water source or being in
good health.
In the case of copying CDs,
Oliver’s trouble is based in that the
word ‘image’ is a homonym in the
digital world. Oliver means a digital
photo while Rose talks about a disk
image. Again, a table could be used
for discriminating between the
concepts.
Specialisations
Many computer concepts are specialisations of other concepts, and in programming, we use
sub-classes to express that one class is a specialisation of a super-class. For instance, a cross-
reference in a document is a specialisation of the more general concept Data link. A structural
model where both Data link and Hyper-links are explained could be:
Email address vs. URL—Fadhili:
I typed my email address there.
Why doesn’t my mail show up?
Copying CDs—Oliver and Rose:
Oliver: Rose, look here on all the photos I have
taken. Now I want to burn a CD and send it to
relatives, but all this copying is awkward. Do you
know any easier way?
Rose: I use Daemon Tool, since it can preserve disk
images. You can also make DVDs with it. Let me
help you installing.
…
Oliver: Rose, that software didn’t open my images. I
had to stick to Photoshop.

58
© Jens Kaasbøll, 13 Jan 2014
A cross reference is a data link between places inside a
document, while a hyperlink is a data link between documents.
We can illustrate how a concept resembles and is distinct from other concepts by a
specialisation diagram as in Figure 26.
Data linkconnection between data
Cross Referenceinside a document
Hyperlinkbetween files
Specialisations
Figure 26. How Cross references and Hyperlinks resemble by being specialisations of Data link
Figure 26 shows that two concepts are similar by being specialisations of a more general
concept and how they differ. For this case, the textual expression above is shorter and may
therefore work better than the graphics. When a larger tree of specialisations is to be
explained, an illustration like Figure 27 may be needed for providing an overview.
Functional dependency
Data link Type-instance General-special type
Cross Reference
Hyperlink
Foreign keys
Style-paragraph
Master-slide
Number format - number
A style is more special than the style it is based on (or ’linked with’)
Figure 27. IT concepts from abstract at the top to closer to user experience at the bottom.
All the specialisations mentioned should be accompanied by an example in order to constitute
a useful structural model for users.
Learning a sequence of concepts
Assume that you are going to learn making table of contents in a text document. Generating
the table presupposes that the items to be included have been styled with the appropriate
heading styles, so you have to learn about styles and heading styles before the table of
contents.
Table of contents creates a list of links to the sections in the document, similar to footnotes.
Assuming now that the learners have understood both table of contents and footnotes, the
teacher seizes the opportunity of also teach the concept of references, which is a more general
category of all links in documents, and thereafter cross-references.. The sequence of learning
is illustrated in Figure 28.

59
© Jens Kaasbøll, 13 Jan 2014
Figure 28. A concept sequence diagram. The arrow means that the concept from where the arrow is
departing is learnt before the concept at the arrow head.
IT structural understanding means that the learner can use the concept while talking about
other concepts. This implies that heading styles should be understood at the structural level
while learning table of concepts.
Victor explains Table of Contents and
Footnotes partly by referring to how
they are created, which points to the
skill level. Also, he mentions the
inputs needed for table of contents,
and he compares footnotes with those
in books, which indicates a functional
understanding. All in all, Victor is
somewhat above the skills level, but not quite at the functional understanding.
At this point in time, the teacher presents the more general idea of references and how
footnotes and table of contents are two
different types of references, and
Victor has to explain again. He no
longer explains the concepts of
footnotes and table of contents with
mentioning how they are made. His
last sentence points to a functional understanding. Also, he uses the two concepts when
explaining the more general one of references, which is a hallmark of IT structural
understanding, but since he does not mention what a reference is, we cannot be sure that he
has reached this level.
Normally, people learn in a process form the concrete to the abstract, corresponding to
interpreting observations to arrive at a functional understanding. For learners to understand
the more general concept of references, most people will need to see a couple of different
examples of references first, like footnotes and table of contents. Then, they can understand
the similarities between these examples and thereafter grasp the more general concept. After
having learnt the more general concept, learning more types of references will be easier.
Therefore, going from references to cross-references is a feasible teaching sequence.
When designing a sequence of teaching for IT concepts, a directed graph of how they relate as
shown in Figure 28 would be needed. It might be appropriate to teach the concepts which
belong to one operation at the same time, for example fields, tags and merge when teaching
mail-merge.
Table of Contents and Footnotes 1—Victor:
We can make a table of contents by first styling the
headlines that we want to include, and then do the
Insert table of contents where we want the table.
Footnotes are like we see them in books. We make
them by Insert footnote.
Table of Contents and Footnotes 2—Victor:
Footnotes and table of contents are references. That
means that they point to where the text is in the
document.

60
© Jens Kaasbøll, 13 Jan 2014
It is obvious that you need to learn about heading styles before table of contents, cells before
formulas in spreadsheets, and fields before mail-merge. However, there is no definite point
where the more general concepts should be introduced, and there is no unique level of
abstraction that is feasible at any point. Figure 27 provides a brief summary of IT concepts
which fall in under the functional dependency category. The example above about references
suggests that the bottom level in the figure might be appropriate as starting points for user
learning.
5.7. Age levels of abstraction
While computer scientists may find Figure 26 intuitive, they may struggle with Figure 27.
Correspondingly, users with less insight into computers and lower abilities for abstraction will
also have trouble understanding the model in Figure 26 and also the idea it presents,
regardless of the way of presentation.
Children become more able to deal with abstraction with age. Teaching the right level of
abstraction is the single most important consideration when trying to make children
understand concepts, principles and general ideas (Hattie, 2009, p. 43).
The thinking of preschool children is strongly influenced by their perception (Ormrod, 2012,
pp. 295-297) and they conceive of objects as belonging to one category only. This might, for
example, imply that the child regards the functionality of an Android device as separate from
that of an iPad, and the idea of a file system is beyond their ability to abstract. Structural
understanding is not achievable unless the structures can be perceived directly.
School age up to age 11-12 is characterised as a “concrete operational stage.” While still
having trouble thinking about hypothetical or counterfactual situations, they can sort objects
according to various aspects as colour and size and deal with subclasses (Ormrod, 2012, pp.
295-297). This implies that at this age, children can understand that cross-references and
hyperlinks have similarities and differences, as Figure 26 illustrates. The figure is not
designed for this age group, however.
Above this age, there is no marked difference between adolescents and adults. However,
children as well as adults vary a lot in their abilities to handle abstract concepts and ideas
(Ormrod, 2012, pp. 295-297). Some may therefore grasp many structural models at an early
school age, while others will have poor structural understanding of IT throughout their lives.
5.8. Discrimination error
Learners often stumble on their paths to understanding, and we often see that the concepts
they develop do not correspond to those of the teacher. That does not necessarily mean that
one is better than another, but some ways of understanding may be inadequate for certain
purposes.
Consider the novice learner Herbert, who has just learnt to open programs by clicking at the
symbol at the bottom of the screen, for example the Explorer symbol in Windows. Then he
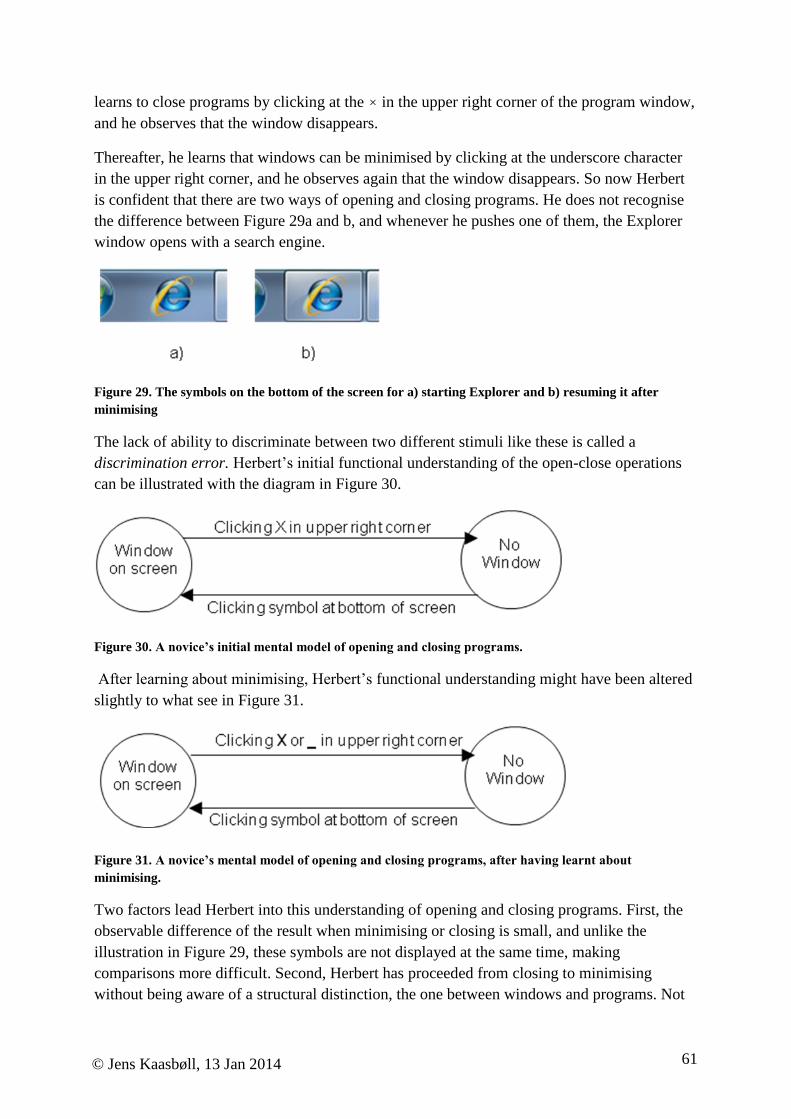
61
© Jens Kaasbøll, 13 Jan 2014
learns to close programs by clicking at the × in the upper right corner of the program window,
and he observes that the window disappears.
Thereafter, he learns that windows can be minimised by clicking at the underscore character
in the upper right corner, and he observes again that the window disappears. So now Herbert
is confident that there are two ways of opening and closing programs. He does not recognise
the difference between Figure 29a and b, and whenever he pushes one of them, the Explorer
window opens with a search engine.
Figure 29. The symbols on the bottom of the screen for a) starting Explorer and b) resuming it after
minimising
The lack of ability to discriminate between two different stimuli like these is called a
discrimination error. Herbert’s initial functional understanding of the open-close operations
can be illustrated with the diagram in Figure 30.
Figure 30. A novice’s initial mental model of opening and closing programs.
After learning about minimising, Herbert’s functional understanding might have been altered
slightly to what see in Figure 31.
Figure 31. A novice’s mental model of opening and closing programs, after having learnt about
minimising.
Two factors lead Herbert into this understanding of opening and closing programs. First, the
observable difference of the result when minimising or closing is small, and unlike the
illustration in Figure 29, these symbols are not displayed at the same time, making
comparisons more difficult. Second, Herbert has proceeded from closing to minimising
without being aware of a structural distinction, the one between windows and programs. Not

62
© Jens Kaasbøll, 13 Jan 2014
knowing that a program can be running even if it has no window open makes it impossible to
grasp the idea of minimising. So Herbert has skipped learning one concept which was
necessary for understanding the following one.
A functional model which includes the distinction between program and window is shown in
Figure 32.
Figure 32. A mental model of opening and minimising which includes the distinction between program
and window.
5.9. Summary
Skills are necessary for using IT, but understanding is the basis for learning new skills.
Functional understanding means being able to explain that an operation transforms an input
state to a result. Structural understanding of what a concept means is necessary for using this
concept as a basis for learning new ones.
The interpretation which leads to functional understanding can be supported by functional
models given by people or in documents or videos. Correspondingly, the reflection which
leads to structural understanding is supported by structural models.
Slow learners are in most need of functional and structural models. Such models should
therefore be presented in training and be available when users need them at work.
Some learners prefer concrete models with examples and screenshots, while others learn more
easily with abstract models. Means for learning should therefore include models with different
types of expression.
2. Provide a variety of learning material.

63
© Jens Kaasbøll, 13 Jan 2014
Chapter 6. Learning solving IT problems
The learning aim of this chapter is to be able to design activities through which people can
become better explorers, problem solvers and learners of IT.
In Chapter 1 the ability to do something was called competence and an increase of
competence which lasted was called learning. It was also noted that problem solving
competence was built on understanding, such that the following steps were identified:
1. Skill.
2. Understanding.
3. Problem solving competence.
In the previous chapter, the learning process for IT use competence was presented as a
movement from skills to understanding. To complete the learning process, this chapter will
present the third level of user competence and the learning involved in reaching it.
When users have IT problems, they are faced with an unknown situation, meaning they have
to learn something new. Hence, the more able they are at learning, the easier they will solve
the problem. Since competence is the ability to do something, the ability to learn is a learning
competence. Getting better at solving IT problems therefore means learning more about how
to learn IT. We will therefore call people with good problem solving competence learning
oriented.
Learning IT use has been described as repetition, imitation, interpretation, reflection and
navigation. In this chapter we will therefore see how users can become better at carrying out
each of these learning processes and also the complete learning cycle.
Psychology – Metacognition
Learning problem solving concerns learning about learning. Since learning is here
regarded as a cognitive process (thinking), we deal with cognition about cognition, which
is also called metacognition (meta = about). Regulating one’s learning is an important
ingredient in metacognition.
Teachers can influence students’ metacognition, for instance by telling students how to
take notes, by demonstrating effective strategies through thinking aloud, and by making
students work collaboratively (Ormrod, 2012, pp. 382-387). It has been noted that good
problem solvers vary their strategies. If one approach doesn’t work, they try another
(Schoenfeld, 1992).
For learners with low verbal abilities, also their metacignitive skill of monitoring their own
learning was shown to increase when they were explained about structures by means of
diagrams (Cuevas, 2002). Thus it seems like structural understanding also affects
metacognition.
64
© Jens Kaasbøll, 13 Jan 2014
6.1. Exploration – what learning oriented users do
To find out what competence for solving IT problems is, we will first look into what good IT
problem solvers do and what people say about them.
Kids have fun when exploring new devices and they play together and discover. Nerds do the
same with IT, developing skills at high level, and they are learning oriented in the IT domain.
Learning oriented users actively explore the technology, trying to find better ways of using a
program for a certain task, and play around with it in order to see what it can do. The active
explorers have a tendency to become local champions, whom others ask for help and who
push for new computer applications.
In a study of user competence,
Youssou tells about his learning
oriented brother, see the text box. The
opposite kind of users was also fond,
called performance oriented. They
stick to one way of using a program
when they have learnt that way, even
though there might be easier ways.
They refrain from pushing a button
which they have not touched before,
due to being anxious for making a
mistake or loosing data. The anxiety
can be regarded as a negative computer
learning competence. Phelps et.al. (2001) provide an example of this type of learner too, we
call her Ofra.
A person may be performance oriented
in one aspect of life, while learning
oriented in another. The stereotypical
image of a computer nerd is that he has
learnt everything about the computer,
but socially, he sticks to what he
knows, which is chatting with other
nerds. Likewise, the elderly social
worker is fabulous in dealing with people, but she has computer paranoia.
The willingness to explore was found to be the most influential characteristic in a study where
people were asked to characterise highly competent information systems users
(Eschenbrenner, 2010). These users
...try to use IS to its fullest potential ... are not afraid to explore new things.
Learning oriented users seem to be exploring the technology and solving problems. The
ability to explore is therefore a characteristic of competence for solving IT problems.
Advanced users who help out others learn from trouble shooting their friends’ computers, and
Learning orientation—Youssou:
My brother is truly amazing. For myself, if
something doesn’t work I might try it again once but
the majority of the time I will just ‘give up’. My
brother sees these ‘failures’ as challenges to be met
and conquered. He delights in the fact that he never
has to stop learning because there will always be a
new challenge to conquer. He loves the fact the
information technology is such a dynamic field that
it is always changing, improving and making new
breakthroughs. (Phelps et al., 2001)
Performance orientation—Ofra:
If something goes wrong when I am using the
computer I freak out and panic, but when I see these
people use the computer they seem to be able to
work it out on their own. It is obvious to me that I
learn differently to them when it comes to
information technology. (Phelps, Ellis, & Hase,
2001)

65
© Jens Kaasbøll, 13 Jan 2014
they get emotional satisfaction from the experience (Poole, Chetty, Morgan, Grinter, &
Edwards, 2009):
I just fixed things and learned at the same time....Actually, I remember feeling excited
when I first helped someone out.
In the study of people learning a programmable car (Figure 15, p.36), most learners generated
the hypothesis that the car had a memory for storing codes, and that the codes could be
activated. To come up with hypotheses, they interpreted the results of actions and gradually
built a structural understanding through completing many learning cycles, testing their
hypotheses with button pushes. Exploration for these learners therefore involved all the
learning processes in the cycle. Learning oriented people like Youssou’s brother probably
searches the web to find answers or send messages to user communities, implying that he
draws on means for learning in his exploration. Figure 33 pinpoints the difference between
learning and performance oriented users.
Skills
Understanding
Dire
ctio
ns
Structural models
Instructions
Fu
nct
ion
al
mod
els
IT
Inte
rpre
t
Repeat
Imitate
Navig
ate
Reflect
Repeat
Learning by the
performance oriented users
Exploration: learning by
the learning oriented users
Figure 33. Learning processes undertaken by learning oriented versus performance oriented users.
In the famous ‘Hole-In-The-Wall’ test of exploration (Sugata Mitra et al., 2005), computers
were set up so that children in poor communities in India could play with the computers
without any instruction, see Figure 34. Observations showed that children in groups explored
the system. Seen from the individual child, the other children were means for learning.
Regarding a group of children as an entity, the group was left on their own without any help.
In competence tests, the children were asked about the meaning of icons, and a steady
progress was demonstrated over nine months. The children had developed IT skills and also
exploration skills. Due to the type of tests carried out, we do not know their understanding of
the technology.
Even if learning oriented users have the ability to explore, they might choose not to. In a field
study of user learning of software, exploring for the sole purpose of learning constituted the
exception (Rieman, 1996). This was the case even if some of these users were computer
scientists. Reasons given were that exploring was unproductive, and that they had too much
else to do (Gravill & Compeau, 2008; Rieman, 1996).

66
© Jens Kaasbøll, 13 Jan 2014
Figure 34. The Hole-In-The-Wall experiment. Computers were installed in poor areas such that kids could
explore (Sugat Mitra).
6.2. Problem solving
Even if only a minority of users explore, they have to solve IT problems, either through
learning our way through it or getting others to solve it. In the latter case, learning has meagre
conditions.
We will distinguish between two kinds of problem solving. Experimentation takes place when
we start wondering whether IT can do something that we would like it to do, while trouble
shooting appears when the technology does not respond as expected. The starting points
differ, but in both cases, we may learn how to solve the problem through learning cycles like
exploration.
Experimentation
Experimentation is a planned action of problem solving, starting at the understanding level
with a hypothesis of the type “It can do this, but I want it to do that. Can it? How? ” Then the
user has to navigate, run the operation, interpret the result and compare with the hypothesis.
The experiment thus includes a learning process cycle from understanding and back again, as
illustrated in Figure 35.
Advanced users experiment a lot. They test the limits of software, for example “This field is
for numbers. Will it take text also?” or “Can the scanner transfer data directly to the phone, or
do I have to use the computer as a receiver?”
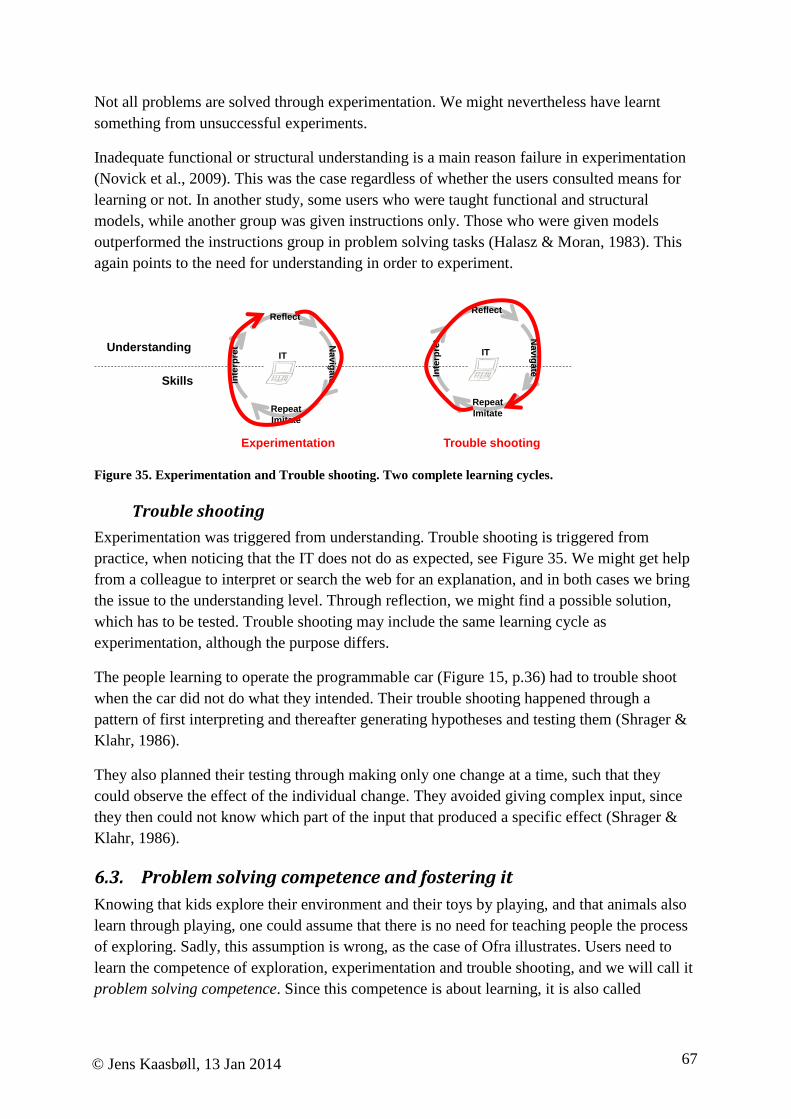
67
© Jens Kaasbøll, 13 Jan 2014
Not all problems are solved through experimentation. We might nevertheless have learnt
something from unsuccessful experiments.
Inadequate functional or structural understanding is a main reason failure in experimentation
(Novick et al., 2009). This was the case regardless of whether the users consulted means for
learning or not. In another study, some users who were taught functional and structural
models, while another group was given instructions only. Those who were given models
outperformed the instructions group in problem solving tasks (Halasz & Moran, 1983). This
again points to the need for understanding in order to experiment.
Inte
rpre
t
Repeat
Imitate
Navig
ate
Reflect
Skills
Understanding
Trouble shootingExperimentation
Inte
rpre
t
Repeat
Imitate
Navig
ate
Reflect
ITIT
Figure 35. Experimentation and Trouble shooting. Two complete learning cycles.
Trouble shooting
Experimentation was triggered from understanding. Trouble shooting is triggered from
practice, when noticing that the IT does not do as expected, see Figure 35. We might get help
from a colleague to interpret or search the web for an explanation, and in both cases we bring
the issue to the understanding level. Through reflection, we might find a possible solution,
which has to be tested. Trouble shooting may include the same learning cycle as
experimentation, although the purpose differs.
The people learning to operate the programmable car (Figure 15, p.36) had to trouble shoot
when the car did not do what they intended. Their trouble shooting happened through a
pattern of first interpreting and thereafter generating hypotheses and testing them (Shrager &
Klahr, 1986).
They also planned their testing through making only one change at a time, such that they
could observe the effect of the individual change. They avoided giving complex input, since
they then could not know which part of the input that produced a specific effect (Shrager &
Klahr, 1986).
6.3. Problem solving competence and fostering it
Knowing that kids explore their environment and their toys by playing, and that animals also
learn through playing, one could assume that there is no need for teaching people the process
of exploring. Sadly, this assumption is wrong, as the case of Ofra illustrates. Users need to
learn the competence of exploration, experimentation and trouble shooting, and we will call it
problem solving competence. Since this competence is about learning, it is also called

68
© Jens Kaasbøll, 13 Jan 2014
‘metacognitive competence.’ We will identify six components of competence for solving IT
problems.
The findings referred in the previous section emphasized understanding IT as an element of
problem solving competence.
Research cycle competence
The people finding out how the car was working had the ability to plan trouble shooting by
controlling one variable at a time. This is part of the general experimental research
competence which we employ in many aspects of life. Ivo demonstrates how kitchen
researchers think:
He remembers his input of
salt last time.
He has taken notice of and
remembers the output.
He makes the hypothesis
that by changing the input,
the output will also change.
He changes the input of salt
the second time.
He makes sure that all other
input which could affect the output is kept equal.
This research competence is also useful for solving IT problems, and it includes the ability to
carry out cycles of IT problem solving phases as in Figure 36, we call it research cycle
competence.
IT
4. M
ak
ing
se
ns
e
of
ou
tpu
t.
3. Entering input.
5. Comparing
output with
expected.
1. Deciding
input to be
changed.
Input to be changed.
Output to be expected
2. D
ec
idin
g
op
era
tion
s
to b
e u
se
d.
Figure 36. Phases of IT use research cycle. Arrows denote actions to be carried out.
Research in the kitchen—Ivo:
Ivo is making his mutton stew for the second time,
talking to himself:
Last time I added two teaspoons of salt in the pot,
and that was obviously too much. Let me reduce to
one. Oh, but I also added a stock cube last time, and
that is pretty salty. Hm, to find out how much salt is
actually needed, I will add the stock cube this time
also while reducing to one spoon. If not, I cannot
find out whether it is the salt spoon or the stock cube
which made the difference.

69
© Jens Kaasbøll, 13 Jan 2014
For carrying out the research cycle, the previously repeated skills and understanding of IT and
the abilities to navigate the interface and interpret results are obviously needed, which is
summarised in the requirement of understanding above.
People learn problem solving in the same general way as learning anything else; through
doing it. Problem solving competence also starts at the skill level, implying that users can start
learning it by imitating others, whether a teacher or a peer user. Like imitation for learning IT
skills can be supported by instruction sheets, a road map such as Figure 36 can work as an
instruction sheet for the research cycle, reminding the user of the steps to be taken. Also, a
laboratory study where learners were given tasks to be done but no instructions of how to do
them, compared individuals and pairs. The results showed that the pairs developed a better
understanding of how the software operated and they performed better in exercises which
introduced some novel elements (Lim, Ward, & Benbasat, 1997).
Some users may try many changes at the same time, not being aware of the principle of only
one change at a time to find out which one is effective. Such an understanding of the research
cycle is necessary to avoid confusion when comparing the output with the expected one.
Another principle to understand is that blind trial-and-error may lead to more errors instead of
rectifying what’s wrong. Therefore, research cycle understanding requires the ability to
generate hypotheses. This includes reflect on input, what the computer is doing, and output is
needed to generate a hypothesis of likely changes to be made. Figure 37 illustrates the
processes of learning research cycle competence.
Creating the hypothesis that if a certain change is done, the output will change in a specific
way requires the ability to think about future situations which are counter to the current
experience. This ability is normally above the “concrete operational stage” of children, see
Section 5.7, p.60. Children below 11-12 years will therefore struggle more with learning the
research competence than teenagers and adults.
IT
4. M
akin
g
sen
se
of
ou
tpu
t.
3. Entering input.
5. Comparing output
with expected.
1. Deciding input to
be changed.
2. D
ec
idin
g
op
era
tion
s
to b
e u
se
d.Research cycle
skills
Understanding
research cycle
Imitate and Repeat the cycle,
preferably through pair working
Reflect on the number of input changes to be made
Generate hypotheses
Figure 37. Learning research cycle competence. The grey arrows demote the learning processes.
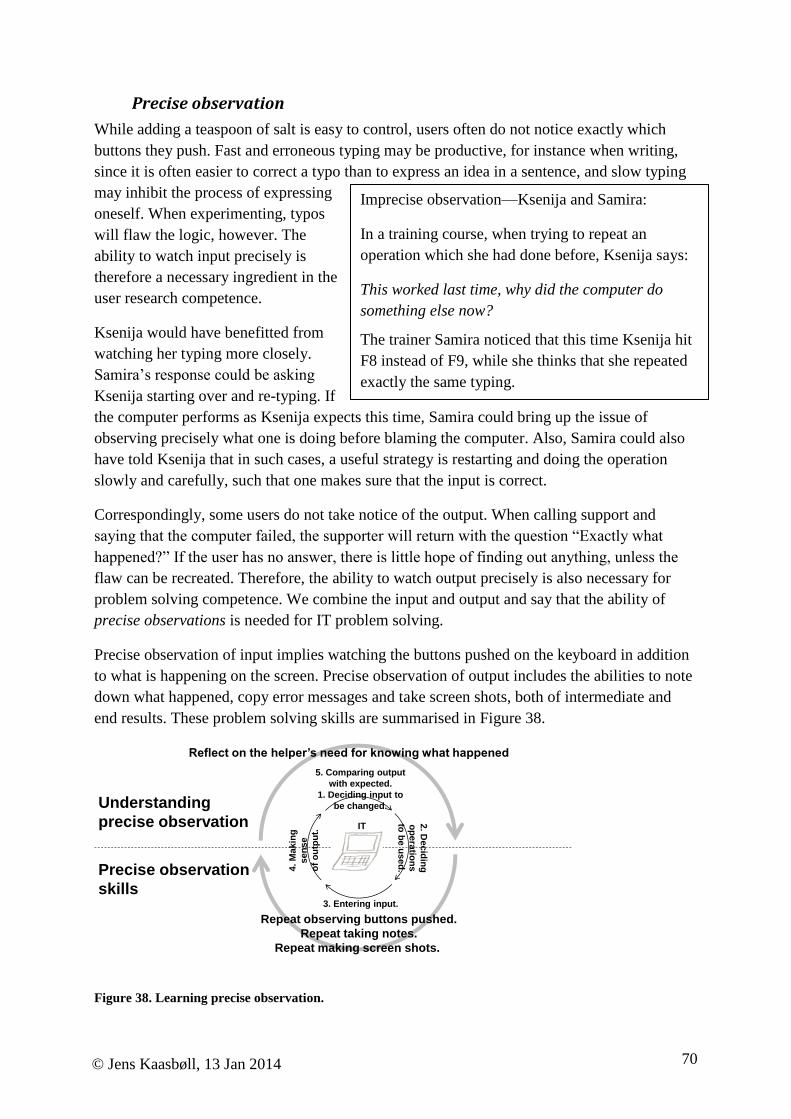
70
© Jens Kaasbøll, 13 Jan 2014
Precise observation
While adding a teaspoon of salt is easy to control, users often do not notice exactly which
buttons they push. Fast and erroneous typing may be productive, for instance when writing,
since it is often easier to correct a typo than to express an idea in a sentence, and slow typing
may inhibit the process of expressing
oneself. When experimenting, typos
will flaw the logic, however. The
ability to watch input precisely is
therefore a necessary ingredient in the
user research competence.
Ksenija would have benefitted from
watching her typing more closely.
Samira’s response could be asking
Ksenija starting over and re-typing. If
the computer performs as Ksenija expects this time, Samira could bring up the issue of
observing precisely what one is doing before blaming the computer. Also, Samira could also
have told Ksenija that in such cases, a useful strategy is restarting and doing the operation
slowly and carefully, such that one makes sure that the input is correct.
Correspondingly, some users do not take notice of the output. When calling support and
saying that the computer failed, the supporter will return with the question “Exactly what
happened?” If the user has no answer, there is little hope of finding out anything, unless the
flaw can be recreated. Therefore, the ability to watch output precisely is also necessary for
problem solving competence. We combine the input and output and say that the ability of
precise observations is needed for IT problem solving.
Precise observation of input implies watching the buttons pushed on the keyboard in addition
to what is happening on the screen. Precise observation of output includes the abilities to note
down what happened, copy error messages and take screen shots, both of intermediate and
end results. These problem solving skills are summarised in Figure 38.
IT
4. M
akin
g
sen
se
of
ou
tpu
t.
3. Entering input.
5. Comparing output
with expected.
1. Deciding input to
be changed.
2. D
ec
idin
g
op
era
tion
s
to b
e u
se
d.Precise observation
skills
Repeat observing buttons pushed.
Repeat taking notes.
Repeat making screen shots.
Reflect on the helper’s need for knowing what happened
Understanding
precise observation
Figure 38. Learning precise observation.
Imprecise observation—Ksenija and Samira:
In a training course, when trying to repeat an
operation which she had done before, Ksenija says:
This worked last time, why did the computer do
something else now?
The trainer Samira noticed that this time Ksenija hit
F8 instead of F9, while she thinks that she repeated
exactly the same typing.

71
© Jens Kaasbøll, 13 Jan 2014
Information search and help seeking
Users’ choices when trying to solve problems have been found to be (Novick et al., 2007):
1. Experimentation or trouble shooting without any means of learning
2. Asking others for personal help
3. Giving up
4. Looking up inline help and searching the web
5. Looking up in printed manuals
This is a ranked list based on several studies, where number 1, problem solving without
means of learning, counted for approximately half of the cases. Printed manuals were hardly
used at all.
A study of effectiveness of problem solving compared three strategies (Andrade, Bean, &
Novick, 2009):
Experimentation without any means of learning.
Only consulting an inline help system.
Switching between experimentation and consulting the inline help.
The latter strategy was the most effective. Comparing with what users do when solving
problems, we see that people in general do not choose the best way of solving problems.
Consulting inline help is one possible way of finding means of learning. This way of finding
means of learning has traditionally been regarded as information search, while help seeking
denotes asking other people. Both the ability to search and to ask have been established as
metacognitive skills which are useful for learning Asking others has the benefit of getting the
response tailored to the needs after a dialogue on what exactly the user wants. However, those
being asked may not know the answer and may have to search the web or look up in the IT
department’s knowledge base of user requests. Asking for help may therefore become a
mediated information search. Due to the massive amount of information on the web,
searching with the text from an error message or a precise description of the problem may
provide the wanted response immediately. Also, searching the web or inline help in the
software may give access to repositories of user support communication or an e-mail
discussion in a user group, both of which could be responses from human helpers to a
previous user having the same problem. While previously regarded as distinct, the two ways
of finding means of learning can therefore be regarded as a continuum from no
(encyclopaedia) to complete (human expert) adaption to the learner (Puustinen & Rouet,
2009).
For help seeking, the user needs to know whom to contact. This could be a friend or
colleague, an appointed super-user in the work place, an IT department or the vendor. Users
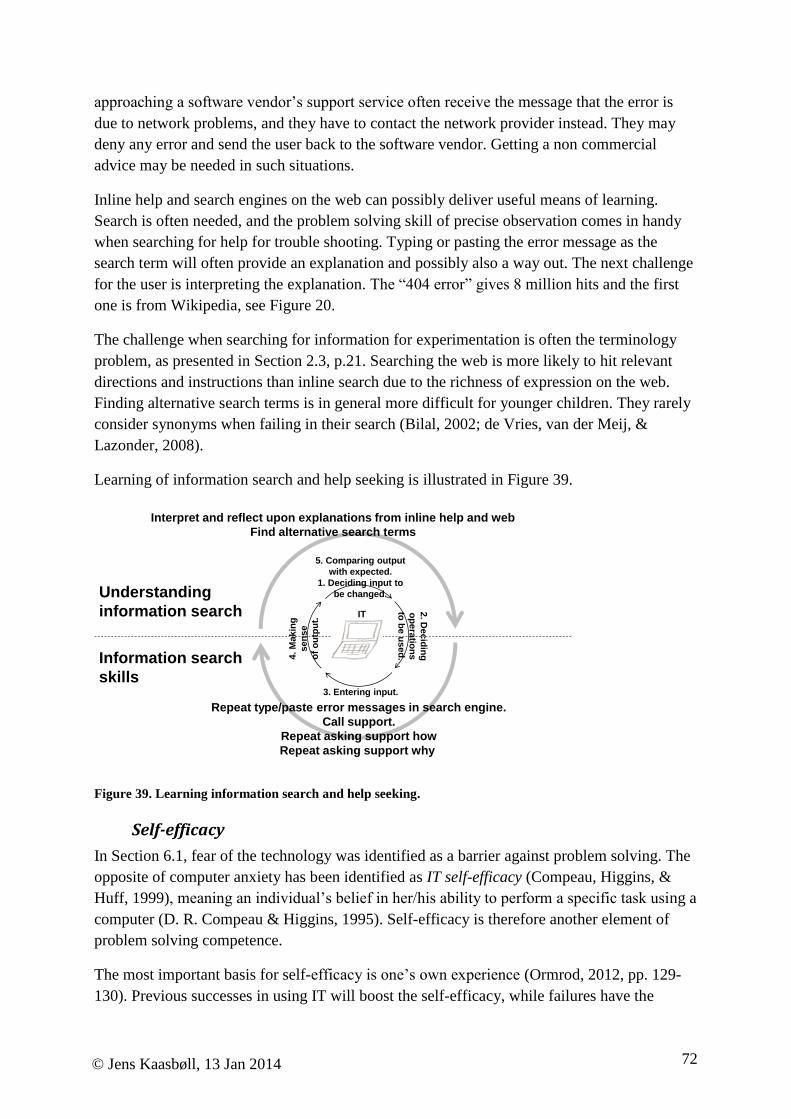
72
© Jens Kaasbøll, 13 Jan 2014
approaching a software vendor’s support service often receive the message that the error is
due to network problems, and they have to contact the network provider instead. They may
deny any error and send the user back to the software vendor. Getting a non commercial
advice may be needed in such situations.
Inline help and search engines on the web can possibly deliver useful means of learning.
Search is often needed, and the problem solving skill of precise observation comes in handy
when searching for help for trouble shooting. Typing or pasting the error message as the
search term will often provide an explanation and possibly also a way out. The next challenge
for the user is interpreting the explanation. The “404 error” gives 8 million hits and the first
one is from Wikipedia, see Figure 20.
The challenge when searching for information for experimentation is often the terminology
problem, as presented in Section 2.3, p.21. Searching the web is more likely to hit relevant
directions and instructions than inline search due to the richness of expression on the web.
Finding alternative search terms is in general more difficult for younger children. They rarely
consider synonyms when failing in their search (Bilal, 2002; de Vries, van der Meij, &
Lazonder, 2008).
Learning of information search and help seeking is illustrated in Figure 39.
IT
4. M
akin
g
sen
se
of
ou
tpu
t.
3. Entering input.
5. Comparing output
with expected.
1. Deciding input to
be changed.
2. D
ec
idin
g
op
era
tion
s
to b
e u
se
d.Information search
skills
Repeat type/paste error messages in search engine.
Call support.
Repeat asking support how
Repeat asking support why
Interpret and reflect upon explanations from inline help and web
Find alternative search terms
Understanding
information search
Figure 39. Learning information search and help seeking.
Self-efficacy
In Section 6.1, fear of the technology was identified as a barrier against problem solving. The
opposite of computer anxiety has been identified as IT self-efficacy (Compeau, Higgins, &
Huff, 1999), meaning an individual’s belief in her/his ability to perform a specific task using a
computer (D. R. Compeau & Higgins, 1995). Self-efficacy is therefore another element of
problem solving competence.
The most important basis for self-efficacy is one’s own experience (Ormrod, 2012, pp. 129-
130). Previous successes in using IT will boost the self-efficacy, while failures have the
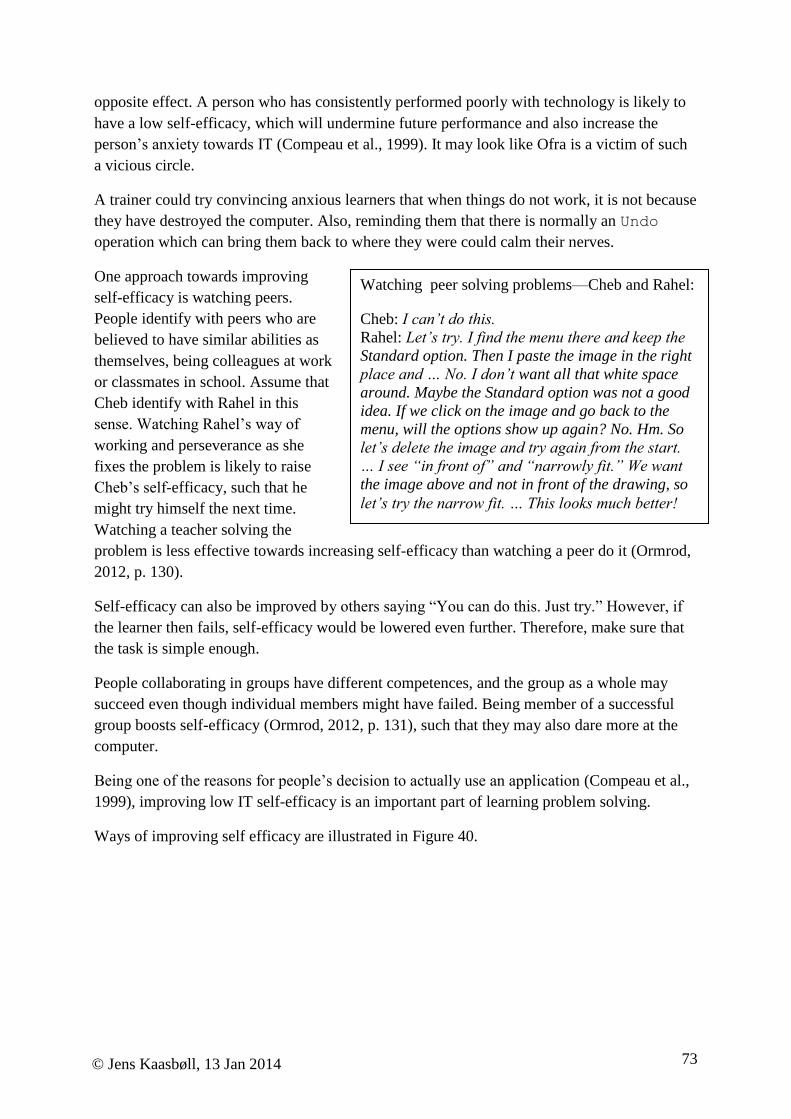
73
© Jens Kaasbøll, 13 Jan 2014
opposite effect. A person who has consistently performed poorly with technology is likely to
have a low self-efficacy, which will undermine future performance and also increase the
person’s anxiety towards IT (Compeau et al., 1999). It may look like Ofra is a victim of such
a vicious circle.
A trainer could try convincing anxious learners that when things do not work, it is not because
they have destroyed the computer. Also, reminding them that there is normally an Undo
operation which can bring them back to where they were could calm their nerves.
One approach towards improving
self-efficacy is watching peers.
People identify with peers who are
believed to have similar abilities as
themselves, being colleagues at work
or classmates in school. Assume that
Cheb identify with Rahel in this
sense. Watching Rahel’s way of
working and perseverance as she
fixes the problem is likely to raise
Cheb’s self-efficacy, such that he
might try himself the next time.
Watching a teacher solving the
problem is less effective towards increasing self-efficacy than watching a peer do it (Ormrod,
2012, p. 130).
Self-efficacy can also be improved by others saying “You can do this. Just try.” However, if
the learner then fails, self-efficacy would be lowered even further. Therefore, make sure that
the task is simple enough.
People collaborating in groups have different competences, and the group as a whole may
succeed even though individual members might have failed. Being member of a successful
group boosts self-efficacy (Ormrod, 2012, p. 131), such that they may also dare more at the
computer.
Being one of the reasons for people’s decision to actually use an application (Compeau et al.,
1999), improving low IT self-efficacy is an important part of learning problem solving.
Ways of improving self efficacy are illustrated in Figure 40.
Watching peer solving problems—Cheb and Rahel:
Cheb: I can’t do this.
Rahel: Let’s try. I find the menu there and keep the
Standard option. Then I paste the image in the right
place and … No. I don’t want all that white space
around. Maybe the Standard option was not a good
idea. If we click on the image and go back to the
menu, will the options show up again? No. Hm. So
let’s delete the image and try again from the start.
… I see “in front of” and “narrowly fit.” We want
the image above and not in front of the drawing, so
let’s try the narrow fit. … This looks much better!
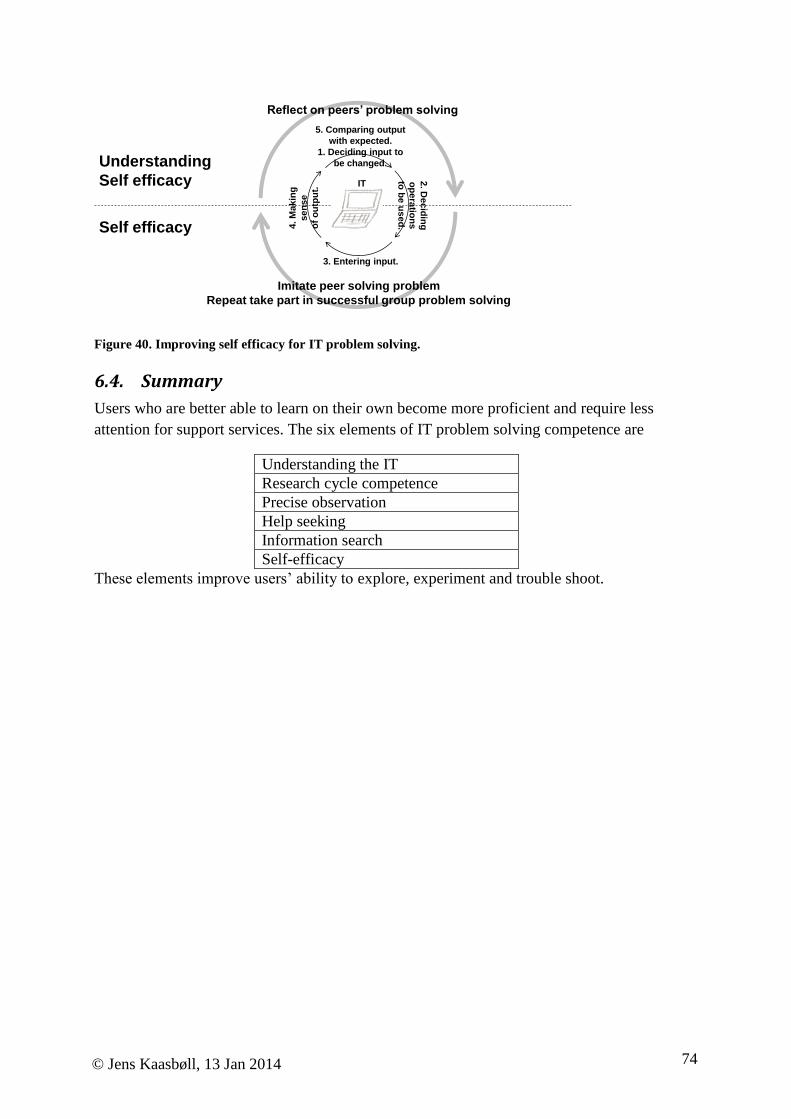
74
© Jens Kaasbøll, 13 Jan 2014
IT
4. M
akin
g
sen
se
of
ou
tpu
t.
3. Entering input.
5. Comparing output
with expected.
1. Deciding input to
be changed.
2. D
ec
idin
g
op
era
tion
s
to b
e u
se
d.Self efficacy
Imitate peer solving problem
Repeat take part in successful group problem solving
Reflect on peers’ problem solving
Understanding
Self efficacy
Figure 40. Improving self efficacy for IT problem solving.
6.4. Summary
Users who are better able to learn on their own become more proficient and require less
attention for support services. The six elements of IT problem solving competence are
Understanding the IT
Research cycle competence
Precise observation
Help seeking
Information search
Self-efficacy
These elements improve users’ ability to explore, experiment and trouble shoot.

75
© Jens Kaasbøll, 13 Jan 2014
Chapter 7. Information competence
The learning aim of this chapter is to be able to determine the representation system in topics
to be taught, and to identify levels of syntax and semantics competence. Also, the chapter
aims at providing skills in the representation system used for slide design.
Referring to the subject matter areas in Chapter 3, information is about a domain, and it is
stored, processed and transferred in information technology. Information has to be expressed
in a way which people can understand, which often include numbers, text in natural language,
and terms having specific meaning, like Yes, No, Free, Occupied, in a hotel reservation
system. The information is linked in specific ways, like Room 102 Occupied. A
collection of the expressions of information for a domain will be called a representation
system. There are a large number of representation systems in daily use. In addition to spoken
and written natural language, there are musical scores, dance notation, chemical formulas,
knitting codes, and programming languages, to mention a few.
Representation systems are characterised by syntax, semantics and pragmatics. Syntax is the
rules which determine how single entities can be expressed and how they can be combined.
Spelling and grammar constitute the syntax of natural language, while maths and stats
determine the syntax of numbers.
Semantics is the relation between a term and it meaning. Dictionaries provide the semantics of
general terms. An ID card shows the relation between a name and a physical person thus
describes the semantics of the name.
Pragmatics is how expressions are used, and it will be considered in the next chapter. This
chapter deals with how the syntax and semantics aspects of systems of representations are
learnt and how this learning can be supported.
7.1. Syntax
When the syntax of information is coded in software, information concepts behave like IT
concepts. The difference is that information concepts are about a domain outside of the
computer, while the IT concepts describe the computer itself.
In user applications, data items are defined and larger structures of data and operations are set
up to match the domain to be represented. When developing data bases, these structures are
described as data-models or class-models.
In a hotel information system, reservations are carried out by means of the window to the left
in Figure 41. Since the customer is recurring, her contact details are not re-registered. In case
of a new customer, the user would have to open another window for entering contact details
first. The operations New Reservation and Customer Registration are parts of the functionality
of the software.

76
© Jens Kaasbøll, 13 Jan 2014
A part of the data model for the system is shown to the right in the figure.
New reservation
Name Fjoralba
# guests 2
From 22 December 2015
# nights 5
Room type Standard double
Customer• Name• Address• Phone• Email
ReservationFrom date# nights# guestsRoom type
Figure 41. Reservation in a hotel information system. Left: user interface. Right: data model.
Data types
A unit of data belongs to a type. “5” is a number, “Fjoralba” is a text, “22 December 2015” is
a date. In programming, we say that “5” instantiates the type Number, and that there is a type-
instance relation between the two. A data type offers operations on the data, and it also
restricts what can be stored in the data unit. Numbers appear in most software and phone
apps, while only spreadsheets offer wide ranges of calculations.
There may be restrictions on data types according to the domain. For example, the number of
nights must be a positive integer, and the date of a reservation must be in the future when
recorded.
The domain to be represented and the tasks to be carried out should determine the type of data
selected. When scanning a document, users may choose whether to create a picture file or a
format that allows also for storing characters which can be optically recognized by the
computer application. The tasks to be carried out later might decide which option to choose;
character recognition allows for searching through the text in the document, while a picture
can be changed in contrast, colour, etc. Further, the picture format tiff is an uncompressed
representation, leaving the picture exactly as scanned, while storing in the jpeg format
compresses the file with some loss of detail, but at 5% of the storage space. This knowledge
about two ways of representing may also be useful for working with scanning.
At the operating system level, the type-instance relation corresponds to that a file (instance) is
of a specific format (type). In a text processor, a paragraph (instance) is of a specific style
(type). While users normally would not change the definition of a particular file format, they
may change the definition of a style in a text processor. When doing so, the paragraphs of that
style will change accordingly, so that the type-instance relation is conserved, and the changes
of the type have a cascading effect.
Files and other data being an instance of one type may be transferred to another type by
export and import functionality. Some properties of data are normally lost during transfers.
Types can be in a generalisation-specialisation relationship, meaning that the specialised type
inherits properties from the general one. For example, the Heading 2 style in a text processor
can be built on the Heading 1 style and inherits the paragraph formatting from the Heading 1.

77
© Jens Kaasbøll, 13 Jan 2014
Whether changes on Heading 1 are propagated to Heading 2 and all its paragraph instances
may depend on the brand of the text processor.
Data structures
While Phone number is a Number, Customer is a composite data type defined especially for
the hotel information system. In Section 4.4, p.43, the four ways of structuring data were
identified as sequence, grid, hierarchy and network. Customer is a container of Name,
Address, Phone and Email, meaning that there is a hierarchy similar to the way a folder
contains files. Customer and Reservations are connected in a network, where Room is a third
entity.
A Style in a text processor is a container of all formatting instructions for a paragraph,
including character level, the whole paragraph layout, borders, numbering, etc. Each of these
again contains data on sizes, spacing, etc., as illustrated in Figure 42. Style is therefore a two
level hierarchy.
Raster graphic images and spreadsheets are grids of items with coordinates like a map.
Style
Paragraph
Character
Border
Numbering
Space before
Space after
Alignment
Font
Size
Line arrangement
Thickness
Design
Outline
Numbering
Bullet
Figure 42. A hierarchical data structure.
Information concepts can be described according to its aspects as shown in Table 7.
Table 7. The aspects of an information concept.
Aspect Example – Name Example – Customer Example – Style
Semantics The identification
of a person visiting
the hotel
A person visiting the
hotel
The format of paragraphs
Syntax – Type Text Composite of name,
address, phone and e-
Composite of paragraph,
character, border and
numbering.
Syntax –
Restrictions
Max 30 letters and
blanks.
Syntax – Internal
structure
Sequence Hierarchy Two level hierarchy

78
© Jens Kaasbøll, 13 Jan 2014
Syntax – External
structure
The identifying
data element of
Customer
Can have 0 or more
Reservations. Must be
created before any
Reservation of this
Customer.
Can be applied to 0 or
more paragraphs.
Comparisons with
other concepts
Identifying a
person in the same
manner as Room
number is
identifying a room.
A collection of data
elements in the same
way as a Room is a
collection of data about
the room.
Style and master slides
determine layout of
portions of a file. Styles
apply to paragraphs,
while master slides apply
to slides.
7.2. Syntax competence and learning
While the IT subject matter area concerns the technology, the information area shares the
formality of the IT, but it differs in the respect that information represents something outside
itself. Therefore, information competence includes both the syntax of the data of an
application and the semantics of linking the information with the domain it represents.
In a study of learning of modelling techniques, novices learnt process modelling more easily
than data and object models (Vessey & Conger, 1994). Process models consist of input-
process-output units, often combined into sequences and networks, while data and object
models capture data structures. This finding supports that people achieve functional before
structural understanding also in the area of information.
The information concepts which
the receptionist Theo needs to be
acquainted with are the data
elements to be filled. Also, Theo
has to know parts of the data
structure, and the quote indicates
that he is fluent with the necessary
parts.
Syntax skills means the ability to enter syntactically correct data, while a functional
understanding of syntax requires that the learner can refer to input and output without actually
doing the transaction. Theo says that he has to create the Customer before the Reservation,
such that he seems to have a functional understanding of this structure. Structural
understanding of syntax requires that the learner can refer to the concept as an object of its
own and refer to it when talking about other things. Saying that “a Reservation requires one
main Customer, and Customer can have several Reservations” demonstrates a structural
syntax understanding. Theo does
not express the structure in this
way.
When requested to explain a word
processor, Astor is talking about
Syntax skills—Astor:
You can write and print in a text processor, and
change and print again. And then you can change
the layout of pages and letters.
Data structure understanding—Theo:
Theo: I work in the reception. When a person calls and
want to make a reception, I have to check whether that
person is already in our system, and if not, I have to
register her personal details first. Thereafter, I open the
New reservation window and enter the dates and room
type. We have five room types which I can select.
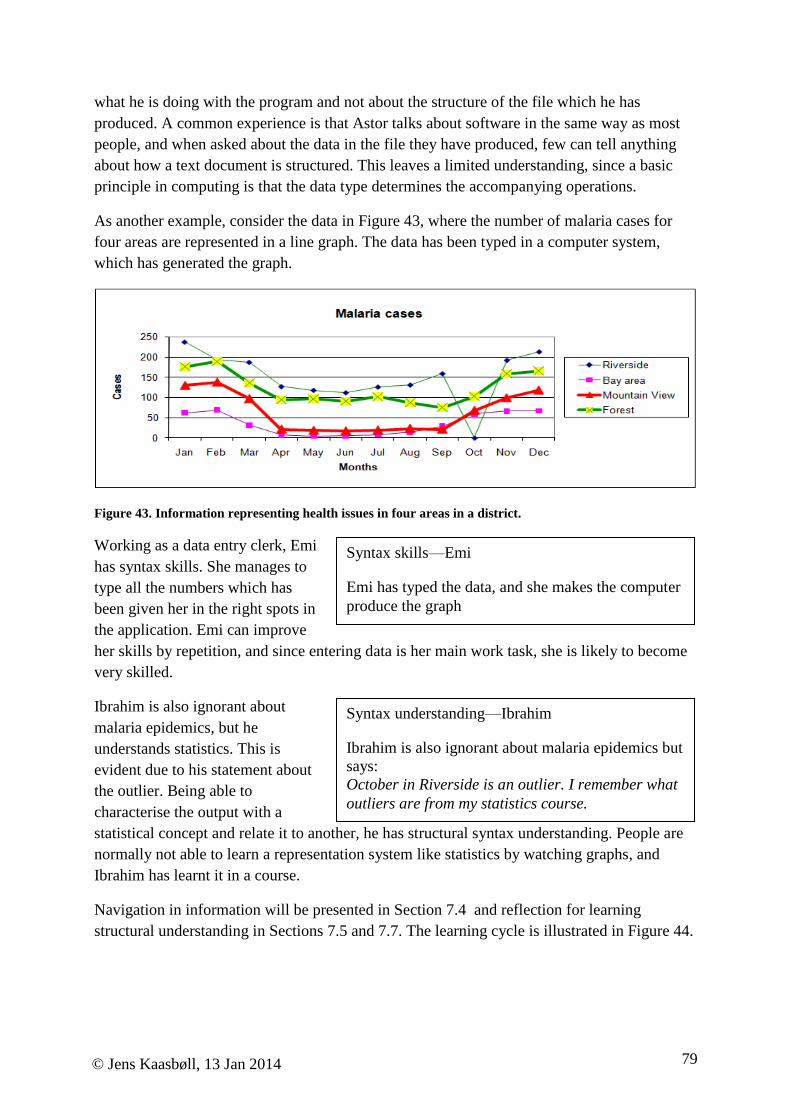
79
© Jens Kaasbøll, 13 Jan 2014
what he is doing with the program and not about the structure of the file which he has
produced. A common experience is that Astor talks about software in the same way as most
people, and when asked about the data in the file they have produced, few can tell anything
about how a text document is structured. This leaves a limited understanding, since a basic
principle in computing is that the data type determines the accompanying operations.
As another example, consider the data in Figure 43, where the number of malaria cases for
four areas are represented in a line graph. The data has been typed in a computer system,
which has generated the graph.
Figure 43. Information representing health issues in four areas in a district.
Working as a data entry clerk, Emi
has syntax skills. She manages to
type all the numbers which has
been given her in the right spots in
the application. Emi can improve
her skills by repetition, and since entering data is her main work task, she is likely to become
very skilled.
Ibrahim is also ignorant about
malaria epidemics, but he
understands statistics. This is
evident due to his statement about
the outlier. Being able to
characterise the output with a
statistical concept and relate it to another, he has structural syntax understanding. People are
normally not able to learn a representation system like statistics by watching graphs, and
Ibrahim has learnt it in a course.
Navigation in information will be presented in Section 7.4 and reflection for learning
structural understanding in Sections 7.5 and 7.7. The learning cycle is illustrated in Figure 44.
Syntax skills—Emi
Emi has typed the data, and she makes the computer
produce the graph
Syntax understanding—Ibrahim
Ibrahim is also ignorant about malaria epidemics but
says:
October in Riverside is an outlier. I remember what
outliers are from my statistics course.
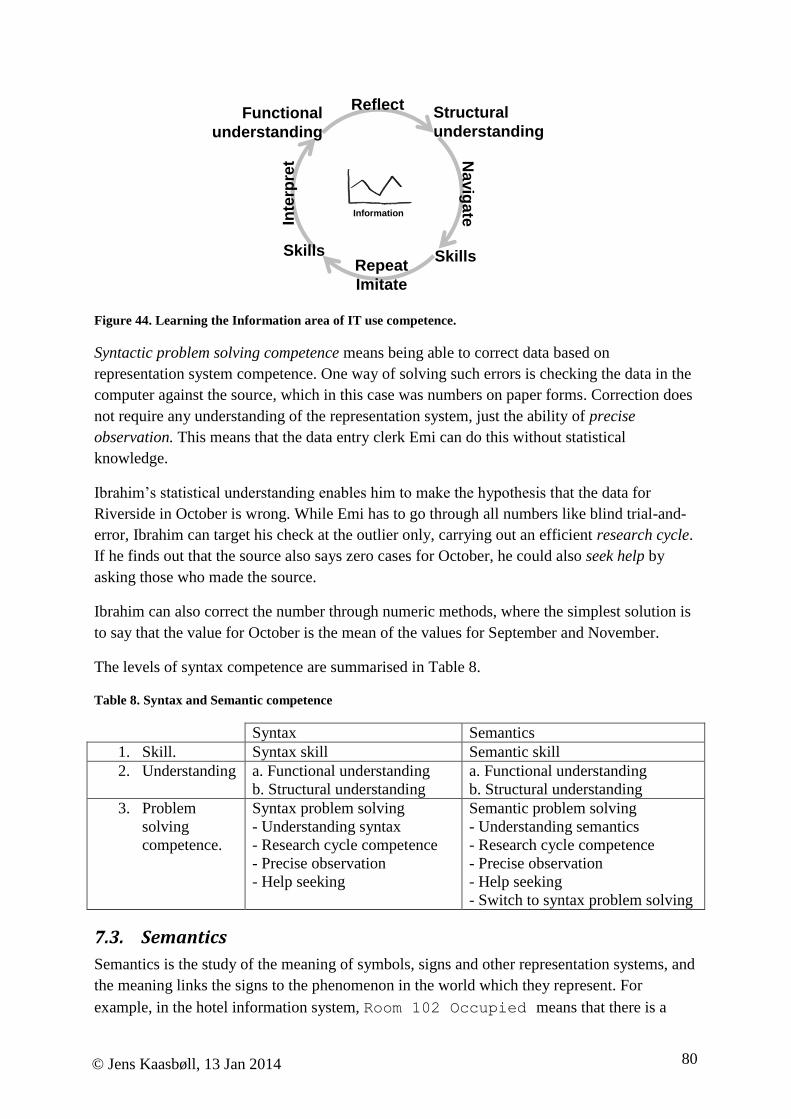
80
© Jens Kaasbøll, 13 Jan 2014
Inte
rpre
t
Repeat
Imitate
Na
vig
ate
Reflect
SkillsSkills
Functional
understanding
Structural
understanding
Information
Figure 44. Learning the Information area of IT use competence.
Syntactic problem solving competence means being able to correct data based on
representation system competence. One way of solving such errors is checking the data in the
computer against the source, which in this case was numbers on paper forms. Correction does
not require any understanding of the representation system, just the ability of precise
observation. This means that the data entry clerk Emi can do this without statistical
knowledge.
Ibrahim’s statistical understanding enables him to make the hypothesis that the data for
Riverside in October is wrong. While Emi has to go through all numbers like blind trial-and-
error, Ibrahim can target his check at the outlier only, carrying out an efficient research cycle.
If he finds out that the source also says zero cases for October, he could also seek help by
asking those who made the source.
Ibrahim can also correct the number through numeric methods, where the simplest solution is
to say that the value for October is the mean of the values for September and November.
The levels of syntax competence are summarised in Table 8.
Table 8. Syntax and Semantic competence
Syntax Semantics
1. Skill. Syntax skill Semantic skill
2. Understanding a. Functional understanding
b. Structural understanding
a. Functional understanding
b. Structural understanding
3. Problem
solving
competence.
Syntax problem solving
- Understanding syntax
- Research cycle competence
- Precise observation
- Help seeking
Semantic problem solving
- Understanding semantics
- Research cycle competence
- Precise observation
- Help seeking
- Switch to syntax problem solving
7.3. Semantics
Semantics is the study of the meaning of symbols, signs and other representation systems, and
the meaning links the signs to the phenomenon in the world which they represent. For
example, in the hotel information system, Room 102 Occupied means that there is a

81
© Jens Kaasbøll, 13 Jan 2014
guest staying in this particular room for the time specified. We would say that if the guest is
staying there, the information is an accurate representation of reality.
There is not always a straightforward connection between information and a phenomenon in
the world which the information represents. Consider the Indian tourist Ravi, who during his
visit to Egypt publishes the picture in Figure 45 with the caption in his Facebook albums, so
his friends at home can watch. Ravi assumes that his friends recognize that the construction in
the picture is actually not Taj Mahal, with which they are familiar, but the pyramids in Egypt.
Further, Ravi wants to say that the pyramids are as magnificent as the Taj, and he hopes that
the caption will communicate this. In general, we use a word which has a conventional
meaning in a different way, and hope that the context will be sufficient for the reader to get
the intended message anyhow. This example is from leisure life, but we find plenty of
examples of metaphors and irony in business also. Metaphors require semantic skills, not for
adjusting the information or the reality, but for adjusting the information into something that
makes sense compared to reality.
When the figure in the accounting system does not match the one on the receipt, it is unlikely
that the accountant intended the reader to interpret anything else than the figures recorded. It
is either an intended or unintended mistake; the former would constitute a lie.
Normally, the author of a novel intends the book to be a complete lie, in the sense that there is
no corresponding reality to the information provided in the book. Since the reader is aware of
this, nobody gets confused. In some cases, readers may start discussing a fictional universe
which a book refers to, in which case we can say that there is a correspondence; not between
information and reality, but between information and an imagined world. Then we can
consider semantic competence in such a setting also.
Figure 45. Today we visited the Taj Mahal here in Egypt.
A painting of a person is a representation of this person, informing the viewer of the person.
Completely abstract, or nonfigurative art does not represent anything, so it is not informative,

82
© Jens Kaasbøll, 13 Jan 2014
hence it is not information. Similarly, absolute music, for instance Beethoven’s 7th
symphony,
is purely sound, without anything intended to be represented by it, not even in the title of the
work or in the individual movements. The title is just informing about the form of music and
how it is to be played, not about anything outside it. However, painting and music could be
used for representing something, so the system of colours and tones could still be found in the
art; hence information competence would be relevant. When The Beatles is performing
“Yesterday,” the lyric is informing us, possibly in the same way as the fiction author does.
7.4. Semantic competence and learning
Semantic competence deals with the ability to make the information match the reality to be
represented.
Semantic skill is the ability to observe the domain and enter appropriate data and to read data
and relate it to the domain.
Functional semantic understanding
requires the ability to express why a
state in the domain is represented by a
particular piece of information, while
structural semantic understanding
concerns the ability to express the rules
and conventions governing the
domain-information relation. Janine
tells about the reasons for the trend of
malaria cases, which is a reason for the information in the figure. She therefore has a
structural semantic understanding. A functional semantic understanding would be saying that
“the total number of malaria cases for Bay Area in January was 60, and that is why the curve
looks like being close to 60 on the Y-axis.”
When learning semantic competence, Janine has to attend to both the information (the
numbers in the graph) and the phenomenon being represented by the information (malaria
cases over time). The split attention contributes to the cognitive load. If she also were to
attend to learning the IT skill of how to correct numbers in a database, the cognitive load
would increase even more. Since high cognitive load inhibits learning, separating learning of
semantic skills from learning the associated technology skills would ease the learning. The
benefits of such a separation is confirmed by research (Chandler & Sweller, 1996). Learners
who studied a detailed manual describing the coordinate system (information subject matter)
of a CAD/CAM application before practicing it on a computer (IT subject matter) performed
better on the computer operations than those who followed the instructions in the manual and
carried out the computer operations simultaneously. The cognitive load effect also kicked in
when learning semantic understanding (Chandler & Sweller, 1996). Those who studied the
documentation prior to practicing on the computer performed better during the written test on
the coordinate system than those who followed the instructions while practicing.
Structural semantic understanding—Janine
Seeing the line graph in Figure 43, she explains:
During the dry season, there are fewer mosquitoes,
hence less malaria. That is why the number of
malaria cases are low during March to October,
and high during the rest of the year.
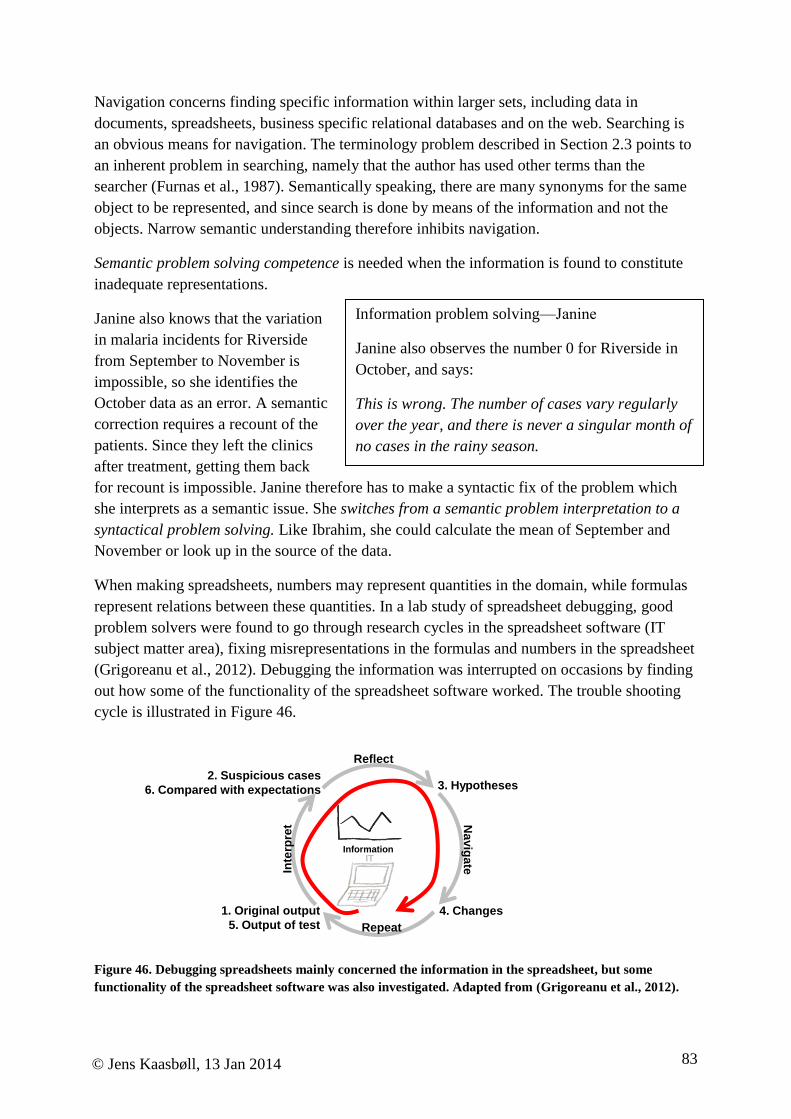
83
© Jens Kaasbøll, 13 Jan 2014
Navigation concerns finding specific information within larger sets, including data in
documents, spreadsheets, business specific relational databases and on the web. Searching is
an obvious means for navigation. The terminology problem described in Section 2.3 points to
an inherent problem in searching, namely that the author has used other terms than the
searcher (Furnas et al., 1987). Semantically speaking, there are many synonyms for the same
object to be represented, and since search is done by means of the information and not the
objects. Narrow semantic understanding therefore inhibits navigation.
Semantic problem solving competence is needed when the information is found to constitute
inadequate representations.
Janine also knows that the variation
in malaria incidents for Riverside
from September to November is
impossible, so she identifies the
October data as an error. A semantic
correction requires a recount of the
patients. Since they left the clinics
after treatment, getting them back
for recount is impossible. Janine therefore has to make a syntactic fix of the problem which
she interprets as a semantic issue. She switches from a semantic problem interpretation to a
syntactical problem solving. Like Ibrahim, she could calculate the mean of September and
November or look up in the source of the data.
When making spreadsheets, numbers may represent quantities in the domain, while formulas
represent relations between these quantities. In a lab study of spreadsheet debugging, good
problem solvers were found to go through research cycles in the spreadsheet software (IT
subject matter area), fixing misrepresentations in the formulas and numbers in the spreadsheet
(Grigoreanu et al., 2012). Debugging the information was interrupted on occasions by finding
out how some of the functionality of the spreadsheet software worked. The trouble shooting
cycle is illustrated in Figure 46.
Information
Inte
rpre
t
Repeat
Na
vig
ate
Reflect
1. Original output
5. Output of test
3. Hypotheses2. Suspicious cases
6. Compared with expectations
4. Changes
IT
Figure 46. Debugging spreadsheets mainly concerned the information in the spreadsheet, but some
functionality of the spreadsheet software was also investigated. Adapted from (Grigoreanu et al., 2012).
Information problem solving—Janine
Janine also observes the number 0 for Riverside in
October, and says:
This is wrong. The number of cases vary regularly
over the year, and there is never a singular month of
no cases in the rainy season.

84
© Jens Kaasbøll, 13 Jan 2014
The research cycles included building up a repertoire of suspicious information, selecting
some of it to follow up, generating hypotheses about possible bugs, changing the value of a
cell, and testing the outcome through manipulating some data (Grigoreanu et al., 2012).
Female participants worked according to a breadth first strategy, finding many suspicious
cases before following them up, while male problem solvers worked depth first, trying to fix
suspect data immediately. These strategy choices did not affect the outcome. Successful
problem solvers stood out from the failing participants by generating hypotheses and testing
them systematically, regardless of breadth or depth first strategies. Users with low success
rate tended to forget about suspicious data, changing formulas without hypotheses, or leaving
the outputs uninterpreted. This corroborated another study, where the necessity to reflect
when troubleshooting errors in spreadsheet formulas was emphasized, while playful
exploration was not productive (Subrahmaniyan et al., 2008). The research cycle therefore
seems to be an important ingredient also for semantic problem solving.
The joy of exploration is a strong motivator for learning, which teachers of all trades have
taken advantage of. Thousands of softwares have been constructed with the aim of getting
children or adults to learn through exploration about specific domains; spanning from
simulation of ecological systems to computer systems for composing and playing music.
When exploring such tools, people may learn about the particular IT as well as about the
domain. The biology teacher may be concerned that the kids pay more attention to the
technology than to the ecology. Research shows that such worries should be put aside, since
students learn both IT and domain competence. An experiment with 11-14 year old children
demonstrated that more of their learning activities concerned the domain to be learnt (Price &
Falcão, 2011). Further, the study showed that exploration of the technology triggered
exploration of the domain and vice versa. Exploration therefore contributed to learning both
the IT and the Information subject matter areas, and this learning was intertwined.
Computer gamers are described as being able to learn the games through exploration. In an
experiment, gamers who kept misconceptions of the domain of the game performed poorly,
while those who improved performance developed more adequate understanding (Kiili and
Ketamo 2007). This supports the sequence of learning from understanding to problem solving
also in the semantic area.
Table 8 summarises syntax and semantics competence levels. Compared to solving IT and
syntax problems, the solving semantic problems has the additional way out of switching to
solving the problem through syntax methods, as illustrated by Janine’s case.
7.5. Structural information models – learning material
While the data structure of the hotel reservation system might be aligned with Theo’s view of
the domain, such a correspondence may not always exist. For instance, for a text processor,
Table 9 summarises the Style concept.
Table 9. Aspects of Style.
Aspect Example – Style
Semantics The format of all paragraphs adhering to the style

85
© Jens Kaasbøll, 13 Jan 2014
Syntax – Internal
structure
A collection of all formatting instructions for a paragraph, including
character level, the whole paragraph layout, and special items like
bullets, etc. A Style also has a name.
Syntax – External
structure
All paragraphs belong to a Style.
Comparisons with
other concepts
Style and master slides determine layout of portions of a file. Styles
apply to paragraphs, while master slides apply to slides.
The semantics and the external structure of Styles are not easily visible at the user interface.
When managing paragraph styles, a data structure like shown in Figure 47 is created. The
graphics can be extended with a text saying:
Every paragraph belongs to one and only one style at a time. A
style can have zero of more paragraphs attached.
Figure 47. Style-paragraph structure.
The failure of text processors to display underlying structure has been identified as an
impediment for problem solving. When entering text in a language written right to left (e.g.
Arabic, Farsi, Hebrew and Urdu), one may now and then write a number or English word left
to right inside the text. When shifting direction of writing in a text processor, it also
rearranged previously written text in the same paragraph, and users were left in the dark as
how to fix the situation. In an experiment, one group of users were given a structural model of
how the text was organised into blocks, each having its direction of writing (Ben-Ari &
Yeshno, 2006). Users having learnt this model thereafter outperformed other users in
controlling the direction of writing and the sequence of text fragments. This result points to
the need for structural understanding also in the information domain in order to solve
problems.
When the data structure is visible at the user interface, additional structural modes might
confuse instead of clarify.
Many applications which are designed according to the What You See Is What You Get
(WYSIWYG) principle, including editors of documents, pictures, graphics and web pages as
well as spreadsheets. Since the design aims at similarity between the screen image and a
printed or published page, structures like the relationships shown in Figure 47 are not visible
at the interface. Such models may therefore trigger reflection and a structural understanding

86
© Jens Kaasbøll, 13 Jan 2014
of syntax. The spreadsheet programs Calc and Excel can display descendants and dependents
of formulas, thereby showing the user generated data structures.
Figure 48. Visualising data structure by tracing descendants in a spreadsheet.
Corresponding to styles in text processors, cells in spreadsheets have number formats, and
again, like the text processor, the relationship between formats and cells are not shown as a
structure.
Documents generated with text processors or web page editors have hierarchical structures.
Entities like paragraphs are composed from smaller entities like characters in a sequence.
Also files generated by presentation programs have a similar structure, as shown in the model
in Figure 52 and Figure 53.
In software for editing graphics, it is often possible for users to structure the data in groups or
layers, which can be manipulated as whole entities. While the software may have ways of
showing the layer structure, this is often not the case for user defined groups of graphical
elements.
Relational databases constitute another type of software. Unlike spreadsheets and graphic
editors, users normally do not have any ways of altering the predefined data structure. The
data model in Figure 41 is a structural model of a small part of the hotel information system.
Instead of the graphics, one can say that
A Customer can have 0 or more Reservations.
Since text has a sequential structure, a data model can be explained with text as long as there
is a sequential path through the structure. If not, graphical models are superior. Figure 49
shows a larger part of the data model, and there is no obvious sequence in this structure.
CustomerNameAddressPhoneEmail
OccupancyFrom date# nights# guests
RoomType# bedsPrice
ReservationFrom date# nights# guestsRoom type
Figure 49. Data model for a larger part of the hotel information system.

87
© Jens Kaasbøll, 13 Jan 2014
Concerning the semantics, the two entities Customer and Room correspond to physical
objects in the domain, Occupancy is a relation between a customer and a room over a period
of time, while Reservation is information about a possible, future occupancy. Although hotel
staff would know what a reservation means, information about tangible objects like customer
and room is more concrete and therefore more intuitive. For information concerning abstract
phenomena like a reservation, it is, for instance, not obvious whether it should include
specific rooms or only room types. Therefore, structural models are more needed for the
information entities which have no tangible counterpart in the domain of the information
system.
A data model of all entities in a corporate information system may include hundreds of
entities spanning many pages, and the structures are often complicated. Hence, users might
need simplified models corresponding to their needs for understanding and navigation.
Figure 50. The Open MRS data model for patients in hospitals.
Figure 50 shows the developer version of a data model for a patient information system. A
visit is split into four entities in this model, see Figure 51.
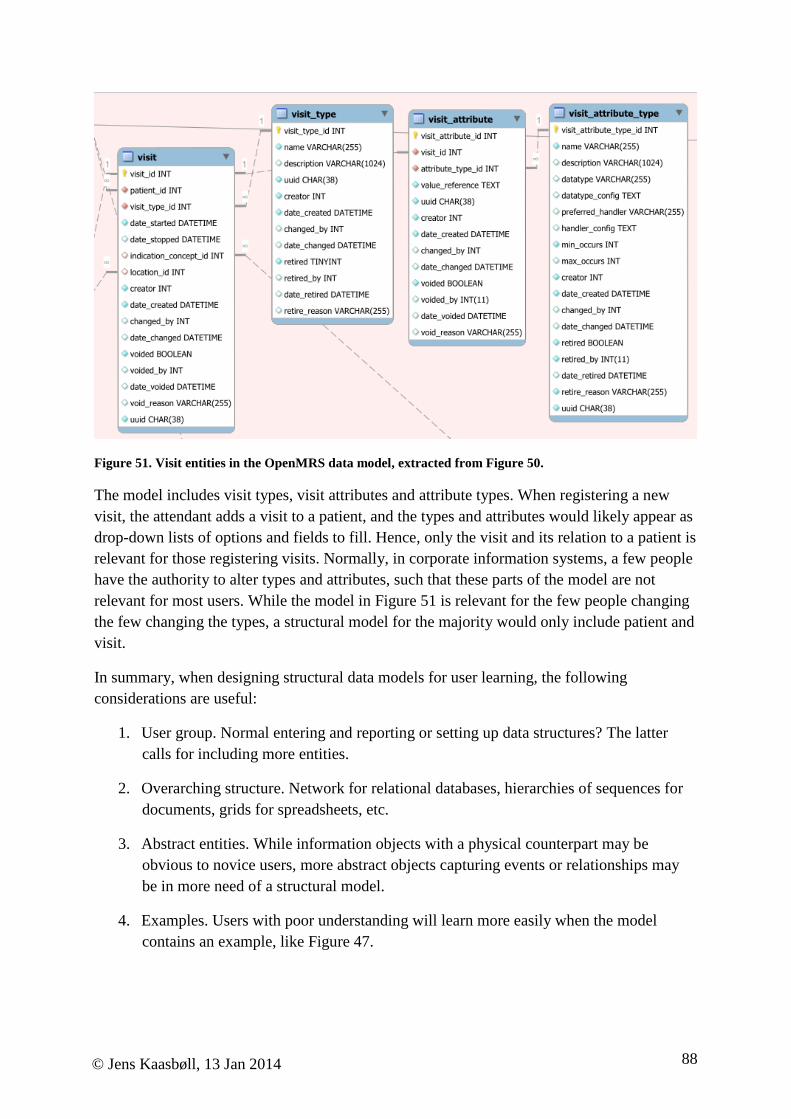
88
© Jens Kaasbøll, 13 Jan 2014
Figure 51. Visit entities in the OpenMRS data model, extracted from Figure 50.
The model includes visit types, visit attributes and attribute types. When registering a new
visit, the attendant adds a visit to a patient, and the types and attributes would likely appear as
drop-down lists of options and fields to fill. Hence, only the visit and its relation to a patient is
relevant for those registering visits. Normally, in corporate information systems, a few people
have the authority to alter types and attributes, such that these parts of the model are not
relevant for most users. While the model in Figure 51 is relevant for the few people changing
the few changing the types, a structural model for the majority would only include patient and
visit.
In summary, when designing structural data models for user learning, the following
considerations are useful:
1. User group. Normal entering and reporting or setting up data structures? The latter
calls for including more entities.
2. Overarching structure. Network for relational databases, hierarchies of sequences for
documents, grids for spreadsheets, etc.
3. Abstract entities. While information objects with a physical counterpart may be
obvious to novice users, more abstract objects capturing events or relationships may
be in more need of a structural model.
4. Examples. Users with poor understanding will learn more easily when the model
contains an example, like Figure 47.

89
© Jens Kaasbøll, 13 Jan 2014
7.6. Instructions, functional and structural models – slide design
Designing functional and structural models of information is covered in the area of
information visualisation. The books by Edward Tufte constitute a comprehensive
introduction to the area (Tufte, 1990, 2011). Marti Hearst (2003) has made a tutorial on
graphical elements and how people experience them, while Rosling (2006) provides a video
of visualisation of numbers and statistics. This section presents some functional and structural
models for a representation system which is also useful in user training, namely slides.
Figure 52 presents the information structure of a file of slides generated with a presentation
program. The model might contain the most frequently used data elements and data structure
for a user. It shows that the file content is broken down into smaller and smaller parts in a
hierarchy. Also, that there are master slides which determine the layout and design of the
slides and their contents, and that the master slides also can be parts of larger structures,
called templates. The model is an example of how type-instance and data structures are mixed
in a file.
6
Presentation program file
Presentation
Slides
Paragraphs
Characters
Types Instances
and Links
Slidemaster
determines
layout of
Graphics
Sequential order
Sequential order
Sequential order
Template
Figure 52. The structure of a file generated by means of a presentation program. The notation is derived
from UML class models.
The model in Figure 52 is presented with a notation taken from computer science. It is
therefore inappropriate as a means of communication with users, since they are not acquainted
with the abstract notation utilized here, even though it is intended to capture the syntax
concepts from a user point of view. Figure 53 shows a smaller part of the data structure of a
presentation file with recognisable screen shots and an example. This structural model may
help users understand relations between master slides and slides.
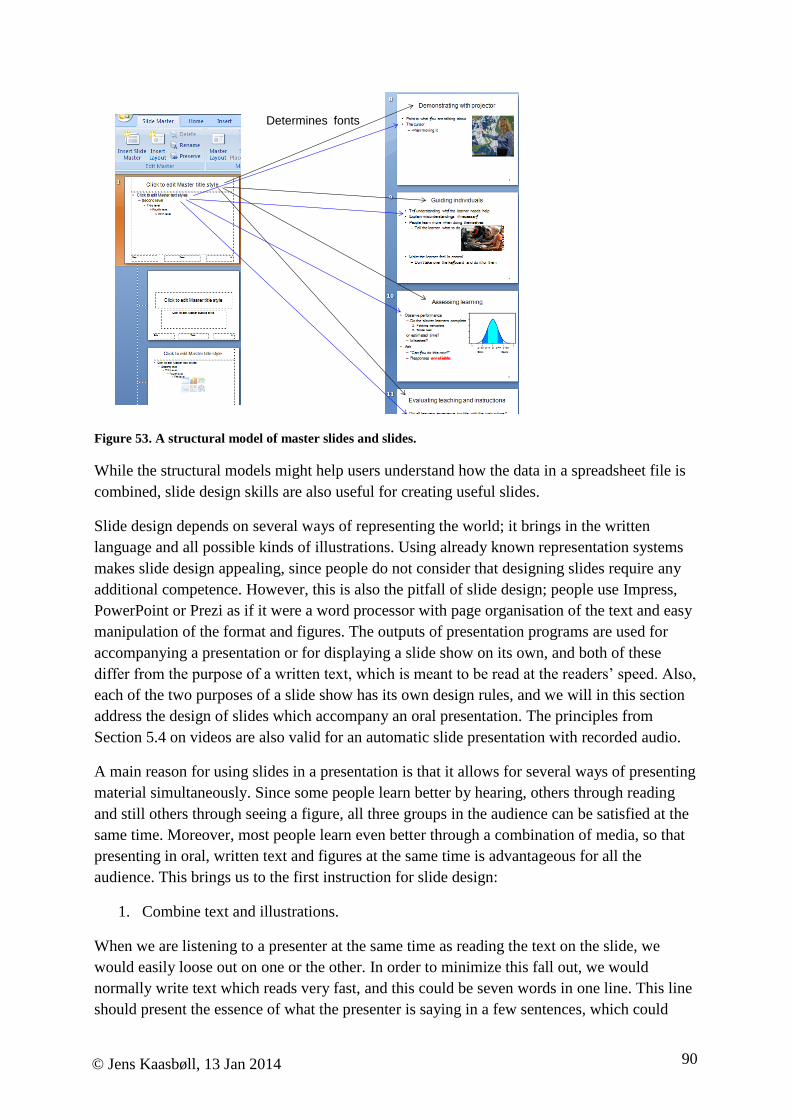
90
© Jens Kaasbøll, 13 Jan 2014
Determines fonts
Figure 53. A structural model of master slides and slides.
While the structural models might help users understand how the data in a spreadsheet file is
combined, slide design skills are also useful for creating useful slides.
Slide design depends on several ways of representing the world; it brings in the written
language and all possible kinds of illustrations. Using already known representation systems
makes slide design appealing, since people do not consider that designing slides require any
additional competence. However, this is also the pitfall of slide design; people use Impress,
PowerPoint or Prezi as if it were a word processor with page organisation of the text and easy
manipulation of the format and figures. The outputs of presentation programs are used for
accompanying a presentation or for displaying a slide show on its own, and both of these
differ from the purpose of a written text, which is meant to be read at the readers’ speed. Also,
each of the two purposes of a slide show has its own design rules, and we will in this section
address the design of slides which accompany an oral presentation. The principles from
Section 5.4 on videos are also valid for an automatic slide presentation with recorded audio.
A main reason for using slides in a presentation is that it allows for several ways of presenting
material simultaneously. Since some people learn better by hearing, others through reading
and still others through seeing a figure, all three groups in the audience can be satisfied at the
same time. Moreover, most people learn even better through a combination of media, so that
presenting in oral, written text and figures at the same time is advantageous for all the
audience. This brings us to the first instruction for slide design:
1. Combine text and illustrations.
When we are listening to a presenter at the same time as reading the text on the slide, we
would easily loose out on one or the other. In order to minimize this fall out, we would
normally write text which reads very fast, and this could be seven words in one line. This line
should present the essence of what the presenter is saying in a few sentences, which could

91
© Jens Kaasbøll, 13 Jan 2014
constitute a paragraph if written. Copying full sentences from a textbook or a web page onto a
slide, which some presenters are doing, is therefore a dysfunctional way of using slides. The
slide in Figure 54 illustrates the result of copying full sentences into a slide. In order for the
audience to grasp the message, the presenter has to read aloud the full text. The main message
of this slide is rewritten in Figure 55. The text on the slide can be read in five seconds, and the
design illustrates the process of producing the letters. After pointing to the four elements in
this slide for explaining the essence of mail merge, the presenter can subsequently tell about
how the list of recipients is stored and other details from the full text.
Mail merge• Mail merge is a software function describing the production
of multiple (and potentially large numbers of) documents from a single template form and a structured data source. This helps to create personalized letters and pre-addressed envelopes or mailing labels for mass mailings from a word processing document which contains fixed text, which will be the same in each output document, and variables, which act as placeholders that are replaced by text from the data source. The data source is typically a spreadsheet or a database which has a field or column matching each variable in the template. When the mail merge is run, the word processing system creates an output document for each row in the database, using the fixed text exactly as it appears in the template, but substituting the data variables in the template with the values from the matching columns
Figure 54. An inappropriate slide design. Text from Babylon Online Dictionary.
Mail mergeOne master letter
A list of recipientsOne letter per recipient
Figure 55. One point per line. A functional model.
In some cases, for instance when presenting a quote of a couple of sentences, we need to
display the full text on the slide. To avoid fall out in such a case, the presenter should read the
quote in full, so that the oral and visual impressions are synchronised. In general the
instruction is:
2. Write each point on one line.
Simplicity is also an advantage concerning illustrations. They should display the essence of
the point and avoid disturbing details. If the point of the illustration is to show the reality, a

92
© Jens Kaasbøll, 13 Jan 2014
photo is appropriate, but unnecessary surroundings should be cut to avoid distracting details.
If the point is of a more abstract character, a drawing is better suited for communicating the
essentials and avoiding the disturbances. In summary:
3. Keep illustrations as simple as possible
Text and figures displayed on a screen may look large for the presenter, but the audience in
the back of the class room may have trouble reading the text. To ensure legibility, use
minimum 18 points font size and sans-serif typeface (Figure 56), since these are clearer when
displayed on projectors than the serif fonts.
Use legible fonts
5
TSerifs tie letters together into words
– High resolution display or print
Low resolution screens and projectors:
Fonts without (sans) serifs are clearer T
Figure 56. Typefaces with and without serifs. A structural model.
Slides are also often printed as handouts and reduced in size to accommodate more slides on
one page. Font size 14 on the original will then become tiny and difficult to read for the long-
sighted, while the near sighted have trouble reading 14 point size on the screen. The
conclusion is:
4. Minimum 18 point font size with a sans serif font.
The other factor which affects legibility is the contrast between the text and the background.
Black on white or white on black are safe, but nearly all other combinations are reducing
legibility. Also backgrounds which can be chosen in a commercial presentation program may
hamper legibility. The yellow marker colour is the only background colour which actually
improves legibility, and therefore it should be used for emphasizing. Black letters on a light
blue background may help dyslectics, and this combination is also fine in general. Visibility
of figures also require sufficient contrast, and even if the contrast looks good on a computer
screen, a projector might require a larger difference between light and dark in order to deliver
easy to see pictures. So,
5. Keep contrast between text/graphics and background close to black versus white.
More thorough introductions to slide design can be found in (Duarte, 2008) and (Reynolds,
2010). Many instructions can also be found on the web, for example at SlideShare.
7.7. Interference
While the previous sections have considered ways of learning of information and ways of
supporting learning, there are also well known ways of failing to learn. Awareness of these
might help the teacher guiding learners back on track.
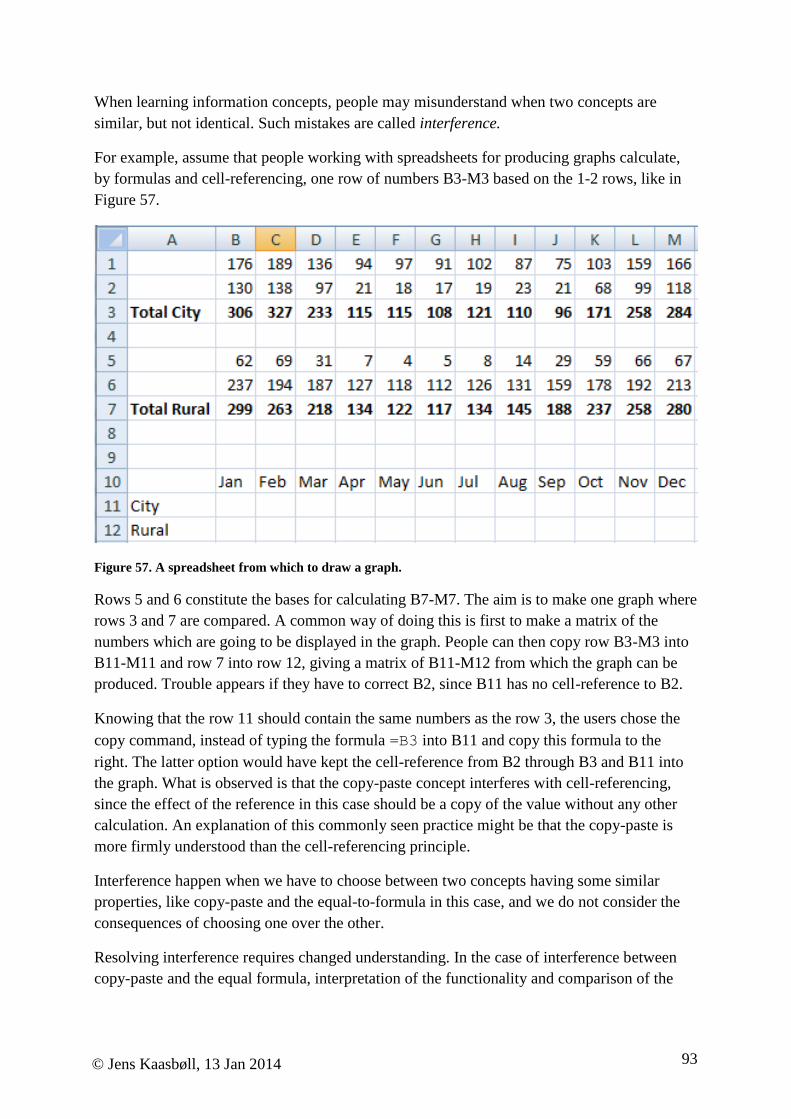
93
© Jens Kaasbøll, 13 Jan 2014
When learning information concepts, people may misunderstand when two concepts are
similar, but not identical. Such mistakes are called interference.
For example, assume that people working with spreadsheets for producing graphs calculate,
by formulas and cell-referencing, one row of numbers B3-M3 based on the 1-2 rows, like in
Figure 57.
Figure 57. A spreadsheet from which to draw a graph.
Rows 5 and 6 constitute the bases for calculating B7-M7. The aim is to make one graph where
rows 3 and 7 are compared. A common way of doing this is first to make a matrix of the
numbers which are going to be displayed in the graph. People can then copy row B3-M3 into
B11-M11 and row 7 into row 12, giving a matrix of B11-M12 from which the graph can be
produced. Trouble appears if they have to correct B2, since B11 has no cell-reference to B2.
Knowing that the row 11 should contain the same numbers as the row 3, the users chose the
copy command, instead of typing the formula =B3 into B11 and copy this formula to the
right. The latter option would have kept the cell-reference from B2 through B3 and B11 into
the graph. What is observed is that the copy-paste concept interferes with cell-referencing,
since the effect of the reference in this case should be a copy of the value without any other
calculation. An explanation of this commonly seen practice might be that the copy-paste is
more firmly understood than the cell-referencing principle.
Interference happen when we have to choose between two concepts having some similar
properties, like copy-paste and the equal-to-formula in this case, and we do not consider the
consequences of choosing one over the other.
Resolving interference requires changed understanding. In the case of interference between
copy-paste and the equal formula, interpretation of the functionality and comparison of the

94
© Jens Kaasbøll, 13 Jan 2014
two reveals the difference. Due to the difference in functionality, the interference and its
resolution concern the functional understanding.
Interference between Information concepts and other concepts
When learning word processors, the
learners are taught that styles apply to
paragraphs. When being asked about
what a paragraph is, people seem to
respond like Lura does. She is
completely right when it comes to the grammatical rules, but her language understanding may
unfortunately interfere with her ability to pick up computer principles. Consider the example
in Figure 58. Seen from Lura’s perspective, the text in the middle has one headline and one
paragraph, so that styles apply only to the paragraph, which corresponds to a paragraph in the
grammar world view. Seen from the word processor’s side, all text is paragraphs, and the
separation between one paragraph and the next one is marked by pushing the Enter button.
Grammar Word processors
• A paragraph is a sequence of sentences dealing with one point
• A paragraph is a sequence of characters ending with Enter
Learning failures
Learner’s often stumble on their paths to
understanding, and we often see that the
concepts they develop do not correspond to
those of the teacher. That does not necessarily
mean that one is better than another, but some
ways of understanding may be inadequate for
certain purposes.
Headline. No paragraph
Paragraph
Paragraphs
Figure 58. Two different meanings of the term ’paragraph.’
Without clarifying the distinction between the two senses of paragraph, Lura would believe
that styles will not apply to headlines. The interference in this case concerns the structure of
texts. Resolving it therefore requires reflection to acquire a new structural understanding. A
structural model like Figure 58 can contribute to the reflection.
7.8. Summary
Syntax competence is skill and understanding of the representation system used to express the
information. Semantic competence is the competence of the correspondence between
information and the domain represented.
Syntax and semantic competence may also be divided into skills and understanding. Learning
of syntax may be supported by the same kinds of models, directions and instructions as IT
learning.
Paragraph—Lura:
A paragraph is a sequence of sentences dealing with
one idea.

95
© Jens Kaasbøll, 13 Jan 2014

96
© Jens Kaasbøll, 13 Jan 2014
Chapter 8. Learning business fit
The learning aim of this chapter is to be able to determine the business for which the IT taught
will be used, and to identify levels of competence of the fit of IT to business.
While syntax concerned the representation system and semantics the correspondence between
the information and the domain, pragmatics is about how to use a representation system in
activities. This chapter concerns the pragmatics of information and IT, and how skills and
understanding of pragmatics is learnt.
8.1. Levels of mastery of fitting IT to business
Sein et. al. (1998) and Coulson et. al. (2003) have proposed levels of knowledge of software
use, where an important distinction is drawn between competence of the software and of its
use. Their distinction is similar to the distinction in this book between competence on IT and
on the fit of IT to business. As mentioned in Chapter 3, Sein et. al. (1998) and Coulson et. al.
(2003) do not consider the competence in the information area.
The previous literature considers that a basic competence of fitting IT to business is knowing
how to use IT in one’s work, and a more advanced competence is to see what IT does for the
organisation (Coulson et al., 2003; M. K. Sein, R. P. Bostrom, & L. Olfman, 1999). The
Committee on Information Technology Literacy (1999) also considers the societal impact as
part of IT competence. One dimension of competence on IT use is therefore its scope,
extending from the individual through the organisation and into the societal level.
Corresponding to the general competence levels, we separate skills, understanding and
problem solving abilities.
Skills for use in business. The ability of using IT for business purposes, both individual
action and social interaction.
Kirsten is telling about which IT
tools she is using for two activities.
She is not showing any motivation
for using the IT tools in the sense
that she can point explicitly to their
usefulness, for example by
comparing these tools with other
solutions. She is not telling
anything about other consequences
of IT for her work or the organisation. Although she is able to tell a little bit about how IT fits
her activities, she seems to have skills for using IT in her work without being at the
Understanding level.
Skills for use in business—Kirsten:
When asked about the impact of IT in her workplace,
Kirsten replies:
When I inform customers about new services and
remind them about appointments, I find the
customer’s details in our computer system and then
write them letters in Word. Thereafter I send the
letters off in Thunderbird.
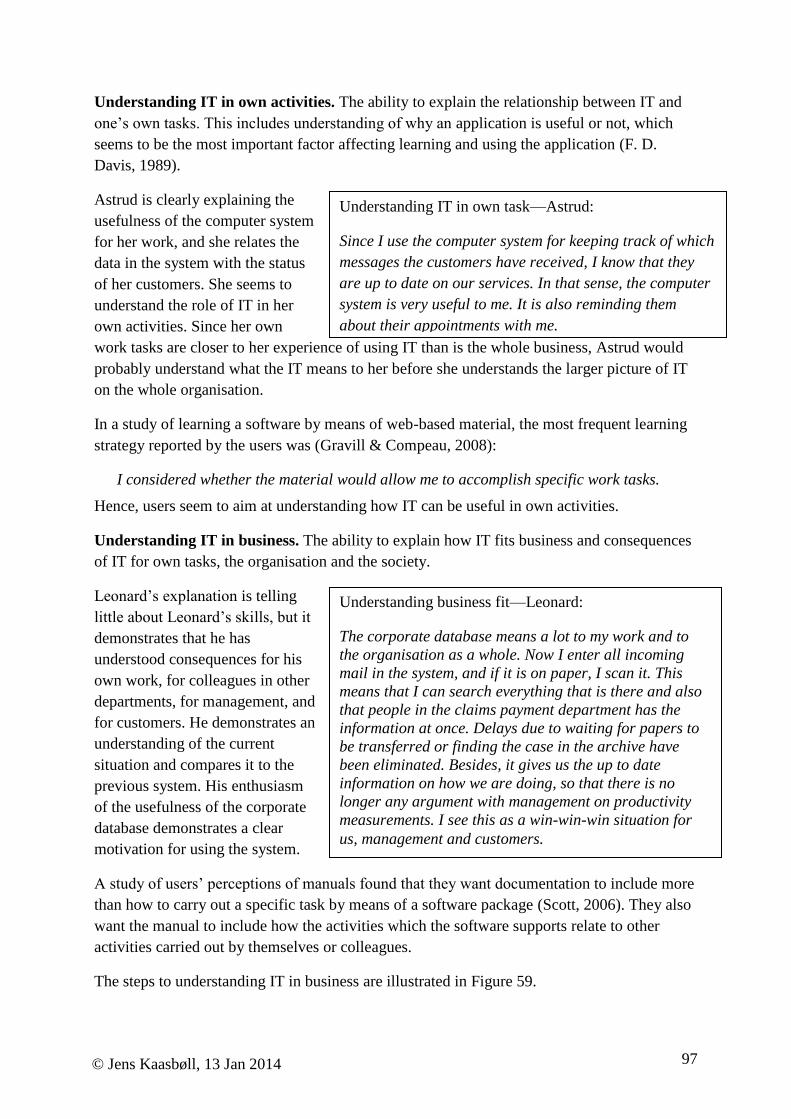
97
© Jens Kaasbøll, 13 Jan 2014
Understanding IT in own activities. The ability to explain the relationship between IT and
one’s own tasks. This includes understanding of why an application is useful or not, which
seems to be the most important factor affecting learning and using the application (F. D.
Davis, 1989).
Astrud is clearly explaining the
usefulness of the computer system
for her work, and she relates the
data in the system with the status
of her customers. She seems to
understand the role of IT in her
own activities. Since her own
work tasks are closer to her experience of using IT than is the whole business, Astrud would
probably understand what the IT means to her before she understands the larger picture of IT
on the whole organisation.
In a study of learning a software by means of web-based material, the most frequent learning
strategy reported by the users was (Gravill & Compeau, 2008):
I considered whether the material would allow me to accomplish specific work tasks.
Hence, users seem to aim at understanding how IT can be useful in own activities.
Understanding IT in business. The ability to explain how IT fits business and consequences
of IT for own tasks, the organisation and the society.
Leonard’s explanation is telling
little about Leonard’s skills, but it
demonstrates that he has
understood consequences for his
own work, for colleagues in other
departments, for management, and
for customers. He demonstrates an
understanding of the current
situation and compares it to the
previous system. His enthusiasm
of the usefulness of the corporate
database demonstrates a clear
motivation for using the system.
A study of users’ perceptions of manuals found that they want documentation to include more
than how to carry out a specific task by means of a software package (Scott, 2006). They also
want the manual to include how the activities which the software supports relate to other
activities carried out by themselves or colleagues.
The steps to understanding IT in business are illustrated in Figure 59.
Understanding business fit—Leonard:
The corporate database means a lot to my work and to
the organisation as a whole. Now I enter all incoming
mail in the system, and if it is on paper, I scan it. This
means that I can search everything that is there and also
that people in the claims payment department has the
information at once. Delays due to waiting for papers to
be transferred or finding the case in the archive have
been eliminated. Besides, it gives us the up to date
information on how we are doing, so that there is no
longer any argument with management on productivity
measurements. I see this as a win-win-win situation for
us, management and customers.
Understanding IT in own task—Astrud:
Since I use the computer system for keeping track of which
messages the customers have received, I know that they
are up to date on our services. In that sense, the computer
system is very useful to me. It is also reminding them
about their appointments with me.

98
© Jens Kaasbøll, 13 Jan 2014
Inte
rpre
t
Repeat
Imitate
Navig
ate
Reflect
SkillsSkills
Understanding
IT in own tasks
Understanding
IT in business
Business fit
Figure 59. Learning Business fit.
Sein et al (1998) distinguished between the ability to apply an IT system and to see what else
the system can do. This will be expanded here to include the ability to suggest changes of the
IT to fit work, organisation and society.
Solving problems of IT fit in business. Mismatch between what the IT is doing and business
needs means that there is a problem that can be solved. The ability to spot mismatches and
take action is the competence for solving problems of IT fit in business.
Mismatch between the domain and
the data fields often occurs in
information systems. Angelique’s
experience is common, since
domestic conventions are not
necessarily valid elsewhere.
Angelique has a semantic problem
of filling a State field when there is
no such thing as a state in her country. She is in the business of buying something on-line.
The task which the information is used for, distribution by mail, determines her choice of data
to be entered. She is using her understanding of the postal services to fit the information in the
system to the business. Such problem solving is called “work around” (Gasser, 1986). The
semantic mismatch between the data “Cotonou” which is a name of a city and that it is stored
in a field called “State” is accepted by Angelique as well as by the information system.
Solving a misfit with a work around requires two steps.
1. Based on the business need, can the IT produce an acceptable result? The city name
repeated on the package label would constitute an acceptable output according to
Angelique’s judgement.
2. Second, how can we make the IT produce this result, possibly by using the technology
in ways which were not intended? Entering the name of a city in the field for State
made the trick for Angelique.
Solving problem of IT fit in business—Angelique:
That web-shop requires me to fill a fields called State,
but Benin is not divided into states. Since this address
data is probably going to be glued to the package, I’d
better not mislead the post office. Just let me repeat
the city name Cotonou.

99
© Jens Kaasbøll, 13 Jan 2014
Step 1 requires an understanding of the fit between the output of the IT and the task
requirements. In Angelique’s case, understanding IT in her own task was sufficient.
Step 2 requires a functional understanding of the input and output of the computer system.
While Angelique
was dealing with a
misfit on her own,
work arounds in
organisation often
requires cooperation.
Melly demonstrates
understanding of
how IT systems
affect her and the
organisation, how
the systems can and
should be changed,
and. She is also
arguing about a
societal issue like the
access to data versus
privacy. Through
understanding IT in
business, she
develops Step 1 of
the work around for
the organisation.
Even though Melly’s solution was a work around, she tried changing the IT system first. This
would require cooperation with IT people on redesign of the security function. This type of
solution to misfit between business and IT requires the IT people to learn from the users and
vice versa, and such mutual learning will be presented in Error! Reference source not
found., after organisational learning is introduced.
8.2. Usefulness
One of the few, well documented connections within use of IT in organisations is the
Technology Acceptance Model (TAM). In its original form, it says that the usefulness of a
technology is the strongest factor concerning whether the technology will be used, while its
ease of use and learning is of less importance (F. D. Davis, 1989). TAM predicts that if
computer software is experienced as useful by the users, they will use it, even if they have to
put effort into learning it. On the opposite side, a system which is easy to learn and use will
not be used if the users do not experience that it is useful for their tasks.
Solving problem of IT fit in business—Melly:
After we got the basic patient information in the computer system, I
don’t have to waste my time waiting for the patient record any longer. I
look forward to the time when the record in the computer is complete
with x-rays and attached documents, but we can do most of what we
need by the diagnoses and lab info which is there now. Also, when we
receive a patient from Jakarta Central, they also send us the patient
info, so that before the patient is here, we know what to do.
The main trouble with this system has been the security. You have to log
in here and there, and after 20 minutes of idle time, you are logged off.
If a nurse has logged on in the meantime, we were stuck, and had to find
her to log off before we could access the data. We discussed this with the
IT guys several times, but they said it was a policy decision such that
medical data should not be spread to those who have no rights to see it.
However, in my opinion, it is more important that the medical staff that
needs the information gets it than that others are denied access. That
means that we give priority to providing the right medical treatment
rather than protecting the patient’s privacy. The latter will never cure
their illnesses. So since the IT people did not help us out, we found out
that all staff in the department should have the same password.
Thereafter we have had no trouble opening the system when needed.

100
© Jens Kaasbøll, 13 Jan 2014
The model is illustrated in Figure 60, where the bold arrow indicates a connection that is
stronger than the other one.
Figure 60. The Technology Acceptance Model, original version, adapted from (F. D. Davis, 1989).
An example: At a time when computers were not everywhere, a hospital installed a
computerised encyclopaedia for nurses in one ward, where they could find information on
care procedures, medical explanations, guidelines, etc. The nurses had previously experienced
that their questions were not always answered in a polite way, and that looking ignorant in
front of superiors was a bad experience. Therefore, they quickly adopted the system to avoid
having to ask doctors or administrators for help. The system only had one terminal, and after a
while, this terminal was moved to another ward 5 minutes walk away. Despite this extra time,
they continued using it. In order to reduce disturbances, they organised a buddy system, so
that one nurse collected the questions and walked over to the other ward, while the others took
over her tasks during the half hour needed. Thus, they added lots of additional effort in order
to achieve the usefulness which they had experienced.
Measuring the result of use of IT systems in organisations in general has shown impossible.
Normally, you cannot isolate the costs of technology implementation, and you cannot isolate
their effects. Expenses are interwoven with the costs of learning and changing work
processes, and correspondingly, the products and services produced by an organisation
depends on a package of factors, including competence, infrastructure, and the market. TAM
therefore measures the degree of success in the time the technology is used, and this kind of
measurement has over the years become a standard for measuring technology acceptance and
success.
Later on, TAM has been refined with more factors, and a combined model looks like Figure
61.

101
© Jens Kaasbøll, 13 Jan 2014
Figure 61. The revised Technology Acceptance Model, adapted from (Venkatesh et al., 2003).
When colleagues use the system or your boss tells you to use it, the social influence is
increased. Facilitating conditions concern accessibility, including network connection,
electricity, printers, etc.
When evaluating proposed IT systems, the model tells us about four factors to consider.
Beware that it is the prospective users’ opinions which matter. If outside consultants do not
see the point in a software package, while the users do so, the system will probably persist.
On the other hand, if the consultant thinks that some information produced by the system will
be very valuable for the organisation, while those working there do not share that opinion, we
cannot expect that they will take the effort of learning and using a new system.
In addition to the four factors, which seem to be relatively stable, other factors will moderate
the picture. For a young man, the usefulness will be more important than for others, while for
an elderly lady with little IT experience, ease of learning will count more than for others.
Such moderating factors may depend on the local culture, and the studies behind TAM are
mainly carried out in North America.
Based on TAM, learners who have not understood the usefulness of a specific IT will be less
likely to learn its operation. Teaching usefulness should therefore precede teaching skills.

102
© Jens Kaasbøll, 13 Jan 2014
Nusrat is working on
designing dams by
means of a geographical
information system. He
has understood how he
can design a dam by
means of his GIS, and
the six months waiting
for data indicates that
his motivation to use the
system is high. He sees
possible outcomes of
what he is doing, and he
has plans for improving the system. In this way Nusrat is at the level of Understanding IT in
own tasks, and he also seems capable of solving the misfit between the information system
and his own work. However, his attitude towards the surveyors also points to some lack of
understanding IT in the business. Nusrat is the one benefitting from the data entered, while
others are doing the data entry job. He has seen the usefulness of the system, while the
surveyors have not, so they are less likely to make the extra effort. Also Nusrat’s conviction
that once he has designed the dam, it will be built, points in the direction that his competence
of IT for his own job is at the level of Understanding, while when it comes to organisational
issues, his understanding is limited.
Since application of IT in work practices, for leisure, education or any other activity is a
multifaceted endeavour, most of us might be like Nusrat; we might understand some issues
very well while being ignorant of other. The three level learning model of skills,
understanding and problem solving to fit IT into business might therefore have an
organisational stream separate from the individual learning, see Table 10.
Table 10. Learning business fit
1. Skill. Skills for use in business
2. Understanding Understanding IT in own
activities
Understanding IT in business
3. Problem
solving
competence.
Solving problems of IT fit in
own tasks - understanding of the fit
between the output of the IT
and the task requirements
Solving problems of IT fit in
business - understanding of the fit between
the output of the IT and the
business requirements
While Nusrat’s individual understanding did not spill over to the organisation, the vice versa
might also take place. During an implementation of an enterprise resource planning system,
most users avoided learning it in the beginning and left the data entry to a few super-users
(Boudreau & Robey, 2005). The majority did not see the usefulness for their job, and they
were not convinced that it was an advantage for the company. Learning it became a burden
which added to their normal, busy day. Usefulness according to the Technology Acceptance
Solving problem of IT fit in business—Nusrat:
When I get the right data from the surveyors, I can plan exactly where to
place the dam and how to construct it, so that we can control the river.
However, the data is often inconsistent. They are making too many
mistakes out there. With correct data, we can get the dam built straight
away. But now I have waited for six months to get this right, and I have
called them several times lately to remind them to send me accurate data. I
clearly see the need for automatic transmission of data from their
instruments through wireless modems to my computer, so that we can
avoid all these errors, so I proposed this equipment for the next year’s
budget.

103
© Jens Kaasbøll, 13 Jan 2014
Model is an individual experience, so usefulness for the organisation does not imply
immediate individual learning.
Research points to that when we work together with tasks which depend on each other,
training is more important for our adoption of IT and information systems than when adopting
a single user application (Reynolds, 2010; Sharma & Yetton, 2007). So, for people to use an
enterprise wide information system appropriately, training is more essential than when
downloading an app to a phone, even when the technical challenge is at the same level.
8.3. Summary
Competence for using IT in activities can be considered at the levels
Skills for using IT in activities
Understanding the current situation
Understanding possible changes
Competence for the fit between IT and activities may also be regarded in three areas:
Individual
Organisation
Societal
People become motivated to learn new IT when they understand its usefulness for the
activities they are carrying out. Also understanding how the technology and the information
are embedded in the organisation is advantageous for user learning.
3. Make sure users understand the usefulness of the IT.

104
© Jens Kaasbøll, 13 Jan 2014
Part III User Interface and Training
The previous part of the book has discussed learning of IT use and presented learning material
for particular learning processes:
Instructions for imitation
Directions for navigation
Functional models for interpretation
Structural models for reflection
A three level model of competence building was also presented.
Based on these learning processes and associated material, this part will consider user training
and design of user interface for ease of learning.

105
© Jens Kaasbøll, 13 Jan 2014
Chapter 9. User interface for learning
The learning aim of this chapter is to be able to design and evaluate software for learnability,
and in particular design in-line help.
9.1. Learnability
Seen from a user point of view, IT applications can be considered having the qualities of
learnability, usability and usefulness.
Usefulness concerns effectiveness, meaning the quality of the result of the IT operations
compared to the business needs. Low effectiveness means that there is a misfit between the IT
and the business. Usefulness can also be evaluated by asking users about their satisfaction
with the results that the IT is producing. When alternative IT systems are considered for a part
of the business, users can be asked to rank the systems on different outputs. This chapter will
focus on learnability.
Perceived ease of use, as described in the technology acceptance model in the previous
chapter, will be divided into usability and learnability. Usability concerns the efficiency with
which skilled users are able to use the IT for tasks in their business. Efficiency can be
measured in time to carry out a set of operations, in the number of mouse clicks and keys to
be pushed, the number of screens to be opened, etc. Another way of evaluating usability is
asking users about how satisfied or comfortable they are with the IT.
Learnability concerns the ease people develop user competence. This has traditionally been
regarded as bringing the novice up to having the skills for using a system (Nielsen, 1993).
Later, also more advanced learning has been taken into the learnability concept, and the
ability to improve competence) has also been included (T. Grossman, Fitzmaurice, & Attar,
2009). The latter is what was called metacognition or problem solving competence in Chapter
6. As seen in Part II, user competence can be at the skill, understanding and problem solving
levels and within three subject matter areas; IT, information and business fit. The learnability
of IT is therefore considered as the ease of climbing up one competence step within each of
the three subject matter areas. A large software package can have many modules and
functionalities, some which are easy and other which are difficult to learn. Learnability might
therefore address only parts of an application and some business tasks.
Users also differ concerning their ability to learn. First, some learn IT use quicker than others.
Second, some users know, for instance, more about the information in the system than others,
such that they learn the data structure earlier than others. The learnability of an IT component
may be measured by the average time to learn for a group of users.
Deciding what to be learnt is also necessary. In case of a mobile phone app, the majority of
users probably only need the skills of using it. For a business information system, some need
to develop problem solving competence, but the majority may also here be satisfied with a

106
© Jens Kaasbøll, 13 Jan 2014
skill level. Therefore, measuring time from first encounter to skilled use may be a relevant
measure of learnability for many systems.
For network components and printers, which seem to break down more often than other IT,
learning trouble shooting may be the learnability aimed at.
If introducing a general communication system for cooperative work, there is a risk that users
do not understand the purpose of the system for their work. Without understanding the
usefulness, people are less willing to learn, as seen in the technology acceptance model. The
effort needed to understanding usefulness is therefore an important aspect of learnability.
One might want to before users understand which business tasks the application can be used
for. For systems which are used intermittently, maybe once or twice a year, users tend to
forget how to operate them. A relevant evaluation of learnability for such systems is time
required for recalling the skills.
9.2. Design for learnability
This section introduces user learning issues to consider when developing IT. As previously
stated, usefulness is in general a more important quality to consider in order to get acceptance
for new systems, and designing for usefulness is described in textbooks on information IT
design and system development. There are also textbooks on design of human computer
interaction, which covers usability. When designing data structures, functionality and
interface, learnability needs to be considered alongside usefulness and usability.
Reinforcement
The behaviouristic learning theory states that feedback from the IT on user action constitutes
a reinforcement of user learning. Positive reinforcement like appraisals and negative
reinforcements like the disappearance of an error message will both strengthen learning.
Immediate reinforcements are better than delayed ones. Long response time when using a web
system may create doubt in the user whether the input was correct or the connection is poor.
ILLEGAL USER ACTION!
PRINTER DAMAGED!
The file cannot be printed
because the printer is
currently out of order.
b)
Informative reinforcement
c)
Punishment
> cd MyFiles>
a) Extinction
Figure 62. The effect of feedback on learning.
Informative reinforcements are better than uninformative ones, also called extinctions. For
example, changing directory in the command style user interface might produce a feedback
like Figure 62 a. It does not inform the user whether the operation has been successful or not.
Consistently repeated extinctions will in general wipe out the learning. Users of command
interfaces may avoid this by watching the effect of the following command.
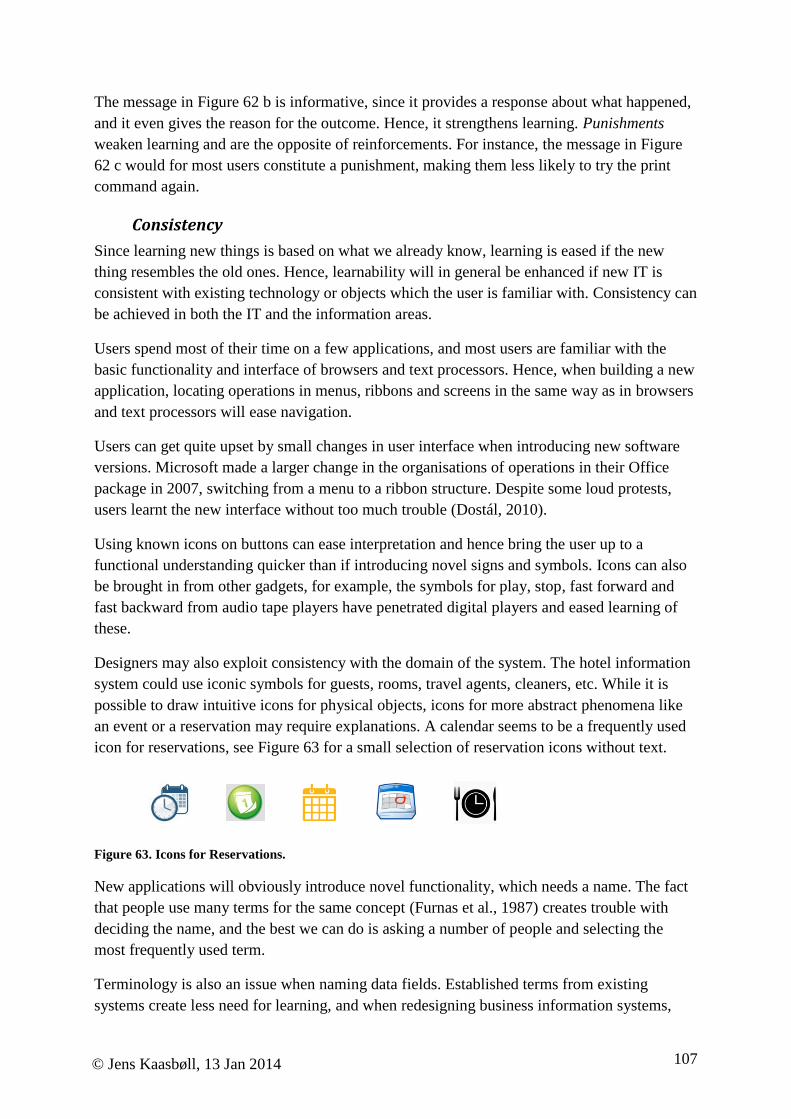
107
© Jens Kaasbøll, 13 Jan 2014
The message in Figure 62 b is informative, since it provides a response about what happened,
and it even gives the reason for the outcome. Hence, it strengthens learning. Punishments
weaken learning and are the opposite of reinforcements. For instance, the message in Figure
62 c would for most users constitute a punishment, making them less likely to try the print
command again.
Consistency
Since learning new things is based on what we already know, learning is eased if the new
thing resembles the old ones. Hence, learnability will in general be enhanced if new IT is
consistent with existing technology or objects which the user is familiar with. Consistency can
be achieved in both the IT and the information areas.
Users spend most of their time on a few applications, and most users are familiar with the
basic functionality and interface of browsers and text processors. Hence, when building a new
application, locating operations in menus, ribbons and screens in the same way as in browsers
and text processors will ease navigation.
Users can get quite upset by small changes in user interface when introducing new software
versions. Microsoft made a larger change in the organisations of operations in their Office
package in 2007, switching from a menu to a ribbon structure. Despite some loud protests,
users learnt the new interface without too much trouble (Dostál, 2010).
Using known icons on buttons can ease interpretation and hence bring the user up to a
functional understanding quicker than if introducing novel signs and symbols. Icons can also
be brought in from other gadgets, for example, the symbols for play, stop, fast forward and
fast backward from audio tape players have penetrated digital players and eased learning of
these.
Designers may also exploit consistency with the domain of the system. The hotel information
system could use iconic symbols for guests, rooms, travel agents, cleaners, etc. While it is
possible to draw intuitive icons for physical objects, icons for more abstract phenomena like
an event or a reservation may require explanations. A calendar seems to be a frequently used
icon for reservations, see Figure 63 for a small selection of reservation icons without text.
Figure 63. Icons for Reservations.
New applications will obviously introduce novel functionality, which needs a name. The fact
that people use many terms for the same concept (Furnas et al., 1987) creates trouble with
deciding the name, and the best we can do is asking a number of people and selecting the
most frequently used term.
Terminology is also an issue when naming data fields. Established terms from existing
systems create less need for learning, and when redesigning business information systems,

108
© Jens Kaasbøll, 13 Jan 2014
keeping the terminology is essential, regardless of whether a new system is replacing paper
forms or digital databases.
Structures of data entry forms and reports can also be used as templates for new interfaces,
reducing the learning of new patterns of data and sequences of operation.
Information may change meaning when introducing digital technology. As seen in
Section 7.7, the meaning of Paragraph changed from paper to a text processor. The inventors
of text processors might have introduced another term to avoid the interference, but that
seems too late now. The term Paragraph in text processors ease learning of many features, but
it can also create confusion. If we were to introduce new terms when old ones changed
meanings slightly by being digitized, we would have to have a completely new vocabulary for
information in the IT, and that would definitely make learning very difficult.
9.3. Inline help
When simple things need instruction, it is a certain sign of poor design (Norman, 1988).
When users do not learn skills easily, improving the functionality and user interface is
normally a better option than providing additional functionality for helping out. This certainly
applies to simple apps, social media, web shops and gadgets, as the quotation from a usability
expert says. However, many systems have complex data or a multitude of functions, and
everything cannot be depicted in one screen. For example, an amateur video camera may have
tens of options, and the cinematographer need a functional understanding of them before
shooting. And a business system with a database as complex as the medical record system in
Figure 50 would need a structural understanding which is difficult to get when only accessing
a small part of it at a time. While the video amateur cannot split her attention by looking for
help with camera settings while shooting, users in less intensive activities will have the
opportunity to do so.
We saw in Section 6.3 that looking up inline help and searching the web was the fourth most
common choice of users when trying to solve a problem (Novick et al., 2007). Here, we will
present ways of providing inline help.
Tooltips
My first personal experience with accessing help in an interactive program happened in the
days of alphanumeric displays where one application filled the whole screen. I used an editor
where help would appear by pushing Ctrl/H. One day when looking for some options, I
pushed the key combination and quite right, help appeared. The annoying thing was that the
help filled the whole screen, such that I could not see the file I was working on. What was
even worse was that the help screen lacked instructions on how to get back to the file. With
nobody around to ask, I had to kill the editor process and lost the work since last saving. It is
probably unnecessary to say that I never accessed the help again.
Help windows covering the programs was one shortcoming of early attempts at inline help,
and another was the excessive length of explanations presented (John M. Carroll, 1990).

109
© Jens Kaasbøll, 13 Jan 2014
Balloon help is a small box with explanation which pops up when holding the cursor over an
interface item, being a button, menu item, data field or other specific places in a window. It
was introduced in Apple computers in 1991, and the help appeared immediately when the
cursor was located over the item. Most users found it annoying, since it cluttered the screen.
Later, Microsoft created a version with a time delay of about one second between when the
cursor is placed over an item and when the help pops up. This delay gives the user the
opportunity to push a button before the help appears, and it prevents balloons from popping
up all over when moving the cursor. This version was called tooltip or screentip and is now
favoured.
Tooltips avoid distraction. When busy working with the spreadsheet, users prefers keeping
attention to their tasks, not having to divert into a separate help system. The other way
distraction is avoided is through providing help about what users are attending to. No search
or lookup is needed.
The example in Figure 64 shows a tooltip from MS Excel. In response to users’ negative
reactions to long explanations, it consists of only 13 words. The first sentence gives a short
functional model of this button. The second sentence explains the purpose of line charts,
“display trends over time,” thereby also showing which business task this function fits into.
This is a quality which has been emphasized in particular in previous research on learnability
(John M. Carroll, 1990; T. Grossman et al., 2009)
Figure 64. Tooltip help from Microsoft Excel.
The example demonstrates that even short help messages can show the user both a functional
model and the business fit. A relevant question is can tooltips convey instructions, directions
or structural models also?
Instructions include a list of steps to be undertaken, often including several buttons to be
pushed and choices to be made. Since tooltips are attached to individual buttons and disappear
once the cursor is removed or the button is pushed, they do not provide a list of steps which
keeps stable on the screen for several buttons to be pushed.
Directions tell where to find an interface item. Since tooltips tell about the specific item it is
attached to, it does not provide guidance for navigation. However, users might browse tabs

110
© Jens Kaasbøll, 13 Jan 2014
and buttons in search of a specific function, without knowing its name in the particular
application. Tooltips may help present alternative terms for the name on the button or data
field, thereby possibly solving the terminology problem. For example, a user looking for the
“time trend function” might find it by reading the tooltip in Figure 64.
Structural models display relations between several elements, something which requires space
and possible graphics. Again, the tie between the tooltip and one particular interface item
leaves little opportunity for relating the item to the rest of the system.
Wizards
A wizard is sequence of smaller windows forcing uses through a predefined sequence of
steps. In each step, the user may have to choose an option and can go back or forward. Figure
65 shows a window from a wizard for creating a line chart.
Wizards are semi-automatic instructions preventing users from doing operations in a wrong
sequence. They are the number one choice amongst software producers for installing
software. Wizards provide users with low IT self-efficacy with the security of reaching an
acceptable result by clicking Next repeatedly. At the same time, advanced users can pick and
choose some options along the way.
Figure 65. One window from a wizard from OpenOffice Calc.
Successful completion might boost users’ self-efficacy. The individual windows have some
space for explanations, which can help understanding. However, users might run through a
wizard without learning anything.
Users are more likely to learn through repeated runs through the one wizard, in the same way
as people learn from repeatedly following instructions. Creating graphs with a spread sheet, as
illustrated in Figure 65, creates an opportunity for repeated use.
Context-sensitive document help
Some applications have help buttons which display a help window related to the place where
the button is located. The help window, which is smaller than the application window, pops
up at a location where it hides as little as possible. As an example, Figure 66 shows a help
window which appears in a data entry screen of a business information system.

111
© Jens Kaasbøll, 13 Jan 2014
Data is registered for an organisation unit, a period, and a set of data elements (data set) at a time. A data set often corresponds to a paper-based data collection tool.
Figure 66. A context-sensitive help window from DHIS2.
This explanation provides the part of the structural information model which is relevant for
the data entry screen.
Section 7.5 on structural information models provides some ways of visualising hidden
structures. Showing the relations between master slides and slides in the presentation program
(Figure 53) might for instance be an option similar to the visualisation of dependants in
spreadsheets (Figure 48).
Business information systems like the hotel and the medical record systems in Section 7.5
may have used interfaces where hundreds of operations are organised in menus in tabs in a
ribbon. The data visible in a screen may be one record or a table shown in isolation from
related data, while the data structure may be at least as complicated as shown in Figure 67.
Customer
Occupancy Room
Reservation
Event Travel Agent
CleanerRestuarant
expense
Restuarant
Figure 67. Data model of a larger part of the hotel information system.
Such a model might also be displayed by a context-sensitive help button.
Having such a small model visible in a corner of the screen with a colour indicating which
table is active at the moment may provide the user with a continuous map both reinforcing a
structural understanding and easing navigation in the data.
Context-sensitive video help
As explained in Section 2.4, videos are a good substitute for a live teacher and can provide
more effective instructions for novices than can documents. Videos triggered from a button in
the interface can therefore provide valuable help, for example when opening a screen in a
business information system and being told how to operate the functions therein.
Context-free help
Help windows with a complete manual for a system is often what pops up when selecting a
general help function in a program. The use is then to search or browse to find the topic of
interest. Figure 68 is an example which can be searched and browsed.
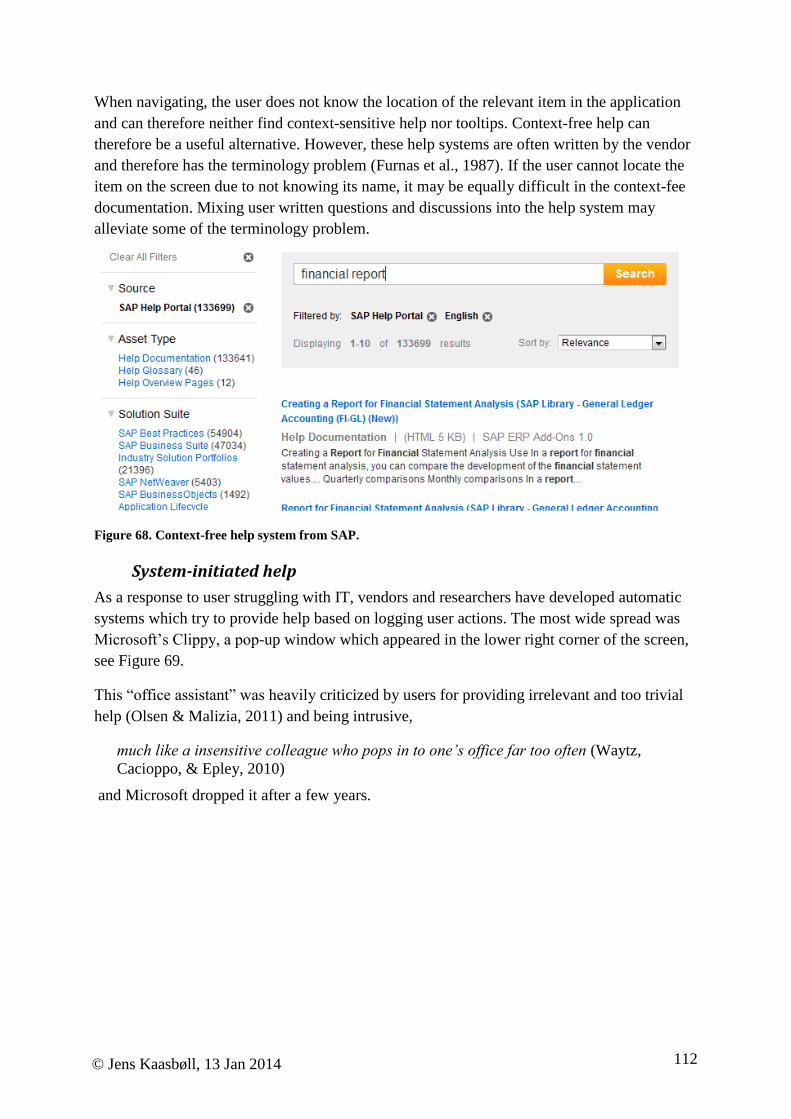
112
© Jens Kaasbøll, 13 Jan 2014
When navigating, the user does not know the location of the relevant item in the application
and can therefore neither find context-sensitive help nor tooltips. Context-free help can
therefore be a useful alternative. However, these help systems are often written by the vendor
and therefore has the terminology problem (Furnas et al., 1987). If the user cannot locate the
item on the screen due to not knowing its name, it may be equally difficult in the context-fee
documentation. Mixing user written questions and discussions into the help system may
alleviate some of the terminology problem.
Figure 68. Context-free help system from SAP.
System-initiated help
As a response to user struggling with IT, vendors and researchers have developed automatic
systems which try to provide help based on logging user actions. The most wide spread was
Microsoft’s Clippy, a pop-up window which appeared in the lower right corner of the screen,
see Figure 69.
This “office assistant” was heavily criticized by users for providing irrelevant and too trivial
help (Olsen & Malizia, 2011) and being intrusive,
much like a insensitive colleague who pops in to one’s office far too often (Waytz,
Cacioppo, & Epley, 2010)
and Microsoft dropped it after a few years.

113
© Jens Kaasbøll, 13 Jan 2014
Figure 69. Clippy, a system initiated help from Microsoft.
Research has continued, and it has been found that system-initiated instructions were
effective for novice users, while expert users benefitted from functional models (Babin,
Tricot, & Mariné, 2009). To be effective, system initiated help thus need to target the users’
level of competence, and the learning cycle may be a basis for characterizing competence
levels for such systems.
Summary
The various forms of inline help seem to be fitted to different learning processes, as illustrated
in Figure 70.
Directio
ns in
Search
able co
ntex
t-free help
Tooltip
Structural model in
Context-sensitive document help
Instructions in
Wizard
Context-sensitive video
Fu
nct
ion
al
mod
el i
n
Toolt
ip Information
IT Activity fit
Inte
rpre
t
Repeat
Imitate
Na
vig
ate
Reflect
Figure 70. The roles of inline help for supporting learning.
114
© Jens Kaasbøll, 13 Jan 2014
9.4. Evaluating learnability
During design, the learnability of user interfaces and help systems can be evaluated in several
ways. Three ways of increasing validity and costs are heuristic evaluation, question-
suggestion and measuring learning.
Heuristic evaluation
Heuristic evaluation is carried out by 2-3 experts on IT usability. They inspect every detail of
the application and compare it to known guidelines and principles. The sections 9.1 to 9.3
provide several guidelines to which interface and help system can be compared. Concerning
inline help, three issues to consider in particular are
Do tooltips provide both functional model and business fit?
Are structural models included in any help?
Does the help include terminology from common users in addition to the vendor’s
terms?
Heuristic evaluators should note down each time a guideline is broken and note this as a
possible learning issue. Even if the design does not match a guideline, this may not pose any
learning problem for users. For finding out, real users need to test the system.
Despite this insufficiency, heuristic evaluation is suggested as a first test by human computer
interaction specialists due to that it is cheap and can reveal issues to be solved before more
costly user evaluations are carried out.
Question-suggestion
Thinking aloud has become an established method for evaluating ease of use. A think aloud
session consist of a user given some tasks to be carried out on an IT component and asked to
say what she thinks when trying to carry out the task. Thinking aloud unveils many usability
issues.
A related procedure has been demonstrated to yield more results when assessing the
learnability of software. In the Question-Suggestion procedure, an expert user with many
years of varied experience with the software sits besides the learner. The learner can ask
specific questions to the expert, who answers the questions, and this provides for a more
natural dialogue than the artificial thinking aloud (Kato, 1986). The expert can also, when
judged appropriate, suggest alternative and better ways of working to the learner. In a
comparison with 10 learners on an architectural design system, the Question-Suggestion
procedure unveiled 2-3 times as many learnability issues as thinking aloud (T. Grossman et
al., 2009).
Both thinking aloud and Question-Suggestion requires an experimenter who takes notes about
the learnability issues. Also, through video recording of the screen and audio recording of the
learner, one can gain more insight into the learning processes.

115
© Jens Kaasbøll, 13 Jan 2014
Bringing in a number of users and experts add to the cost compared to heuristic evaluation.
Although no exact estimate exists, rough measures has shown that 5-10 users find the large
majority of usability problems in thinking aloud (Nielsen, 1994). This number cannot be
automatically transferred to learnability, but the similarity in concepts and procedures suggest
that the number is close to 10 than to 100 for finding the majority of learnability issues.
One hour of video recording may require 10 hours for analysis, also adding to the effort of
Question-suggestion evaluation. For systems where learnability is critical, like a web shop, a
variety of evaluation methods is needed.
Measuring learning
A simple way of comparing learnability of two systems or two versions of the same system is
measuring how long time it takes to learn specific tasks. A group of around 10 people are
given a set of tasks they have never done before and told to fulfil these tasks with the IT. The
time they spend is measured and errors can be counted.
Such measurements may show which system is more learnable, and thereby tell us whether a
new software version has improved. Learning measures can also be used for deciding on
purchasing one or the other software package.
These pure measurements are less useful for pointing to specific design problems or locate
concepts in the software which are difficult to learn and therefore need inline help or training.

116
© Jens Kaasbøll, 13 Jan 2014
Chapter 10. Training for transfer
The learning aim of this chapter is to be able to design a training session which maximises the
possibility for using learnt competence in business tasks after the training.
Training is the organised activity where one or more trainers teach a group of trainees. The
aims, contents, time schedule and classroom are determined in advance, normally by the
teachers with little influence from the learners.
The need for training when implementing information systems was emphasized in Chapter 8.
Likewise, training seems to be essential for developing adequate mental models. For instance,
80% of Greek high school students equals Internet and www (Papastergiou, 2005). The
students’ models are simplistic and utilitarian, rather than structural. Those students who had
been presented structural models in school held a more sophisticated understanding.
When trying to manipulate a system with unknown behaviour patterns and no external help
sources, the good learners generated mental models of its operation, often close to a
functional understanding (Furuta, 2000). The few accounts which the poor learners came up
with indicated skill level rather than understanding, e.g.
I am turning the left knob to the right (clockwise).
A control group, who were provided with the theory of the system, carried out the task in a
significantly shorter time than those who had no external help (Furuta, 2000). This implicates
that poor learners are more in need of theory than those who generate mental models more
easily. Another study also concluded that training is more efficient than self exploration
(Simon & Werner, 1996). Also when exploring IT systems, teacher intervention through
asking questions relevant to the domain to be learnt triggered a similar number of learning
events as the students generated on their own (Price & Falcão, 2011). However, training is
normally not available when wanted, so users need to learn without a teacher in most cases.

117
© Jens Kaasbøll, 13 Jan 2014
10.1. Transfer
Seen from the training perspective, learners have some competence when starting up, and
hopefully a bit more when completing. This new competence is what the learners will bring
back to the tasks, and the effect of the training on the changes in business tasks is called
transfer. We can illustrate the process as in Figure 71.
TrainingLearners doing business tasks
IT competence when training
starts
IT competence at the end of
training
Transfer
Learners doing business tasks in new ways
Figure 71. A transfer model of training. Competence is learnt in a course and transferred to work or other
settings.
Some project managers may believe that after users are trained, they will master the
application and use it. This assumption is in general false, and the problems of transfer of
competence from courses to the activity where the competence is to be used have long been
acknowledged. Factors influencing transfer can be divided into training design and the
business where the transfer is to take place. Training design will be covered in the next
section.
Business factors which are important after training include the opportunity to perform, social
influence and support (R. Grossman & Salas, 2011). The two first ones will be considered
here, while support will be considered in Chapter 13 and Chapter 14. Chapter 14
The opportunities to perform include the obvious condition that the IT system is up and
running when the trainees return to work. If training is provided weeks before the IT system
is put into operation, the users will forget much of their new competence, so the possibility for
transfer has decreased seriously. (Finnegan, 1996; Karuppan & Karuppan, 2008). On the other
hand, if training is provided long after a new system is installed, the users may react like
Edita. When coming to training, she brings a negative
attitude and may blame the trainer for the delay. In a
Dutch study, a positive attitude towards the
information system was found to have a greater impact
on use than satisfaction with the training had (De Waal,
2012).
The golden rule for timing user training is therefore:
6. Organise training at the same time as the system is installed.
Timing—Edita:
Why training this late? The
system has been up for ages, but
nobody knows how to use it.
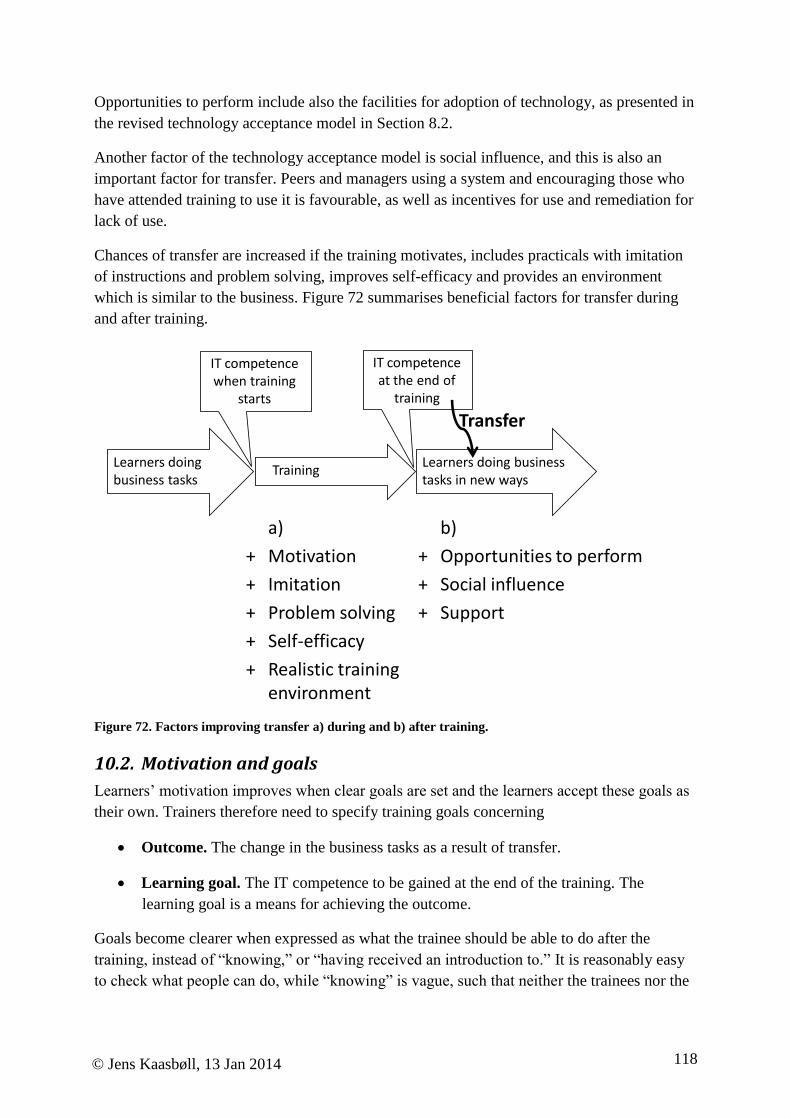
118
© Jens Kaasbøll, 13 Jan 2014
Opportunities to perform include also the facilities for adoption of technology, as presented in
the revised technology acceptance model in Section 8.2.
Another factor of the technology acceptance model is social influence, and this is also an
important factor for transfer. Peers and managers using a system and encouraging those who
have attended training to use it is favourable, as well as incentives for use and remediation for
lack of use.
Chances of transfer are increased if the training motivates, includes practicals with imitation
of instructions and problem solving, improves self-efficacy and provides an environment
which is similar to the business. Figure 72 summarises beneficial factors for transfer during
and after training.
TrainingLearners doing business tasks
IT competence when training
starts
IT competence at the end of
training
Transfer
a)
+ Motivation
+ Imitation
+ Problem solving
+ Self-efficacy
+ Realistic training environment
b)
+ Opportunities to perform
+ Social influence
+ Support
Learners doing business tasks in new ways
Figure 72. Factors improving transfer a) during and b) after training.
10.2. Motivation and goals
Learners’ motivation improves when clear goals are set and the learners accept these goals as
their own. Trainers therefore need to specify training goals concerning
Outcome. The change in the business tasks as a result of transfer.
Learning goal. The IT competence to be gained at the end of the training. The
learning goal is a means for achieving the outcome.
Goals become clearer when expressed as what the trainee should be able to do after the
training, instead of “knowing,” or “having received an introduction to.” It is reasonably easy
to check what people can do, while “knowing” is vague, such that neither the trainees nor the

119
© Jens Kaasbøll, 13 Jan 2014
trainer could be sure as to who knows what. In order for the trainees to understand and accept
the outcome, it needs to be presented, given reasons, and discussed with the trainees.
Both the outcome and
the learning goals for
the training in Shipping
International are
expressed in behavioural
terms. During training,
the trainees should reach
the learning goals, while
reaching the outcome
describes the transfer,
which is beyond the
trainer’s control.
The learning goals for
the 8th
graders are more
general, since school
children are supposed to
learn skills that are
applicable also outside
of school. The outcome
is nevertheless made
specific for two areas of
application within the
school. Such short term
outcomes may be more
motivating for the
pupils. The outcomes
also enable checking
whether the kids are
actually able to apply
their spreadsheet skills
outside the IT class.
The last learning goal
for the 8th
graders says “being able to explain …” This is a way of expressing understanding
in behavioural terms. A student who can explain formulas to others has understood it, while
those who can only select a formula in the spreadsheet only have skills. Since understanding
improves retention, pupils who have understood formulas are more likely to transfer their
skills to biology and grammar.
Training goals—Shipping International:
The company has bought a new intranet communication system
to replace e-mail and Skype.
Outcome: After training, trainees stop using e-mail and Skype,
convert files to the new medium and start using it.
Learning goal:
Being able to use the system for
o asynchronous messaging with specified people
(e-mail)
o synchrouons video communication with
specified people
o publishing documents and videos to all
employees
Being able to convert from e-mail to the new system by
importing message threads
Training goals—8th
grade:
In the IT training, there is one month for spreadsheets.
Outcome: After training, the students are able to use
spreadsheets in biology and the grammar project.
Learning goal:
Being able to use spreadsheets for
o structuring data in columns
o calculating totals and average
o calculating percentages
o drawing bar charts
Being able to explain
o Cell-referencing and formulas

120
© Jens Kaasbøll, 13 Jan 2014
10.3. Training for skills and understanding
Learning skills through imitating a teacher, a video or instruction sheets was described in
Chapter 2. The previous section has introduced the outcome of training, the business fit, as a
topic to be understood, in order to transfer skills to business tasks. The business fit should be
presented before the practicals in order to motivate the learning. Then it should be repeated
after the learners have experienced the IT to motivate the transfer. While the learners imitate
and repeat, the trainer should also monitor them to see whether they reach the learning goal.
The teacher’s activities in one session for skill training can thus be the following sequence:
1. Introduction where the teacher presents the outcome and learning goal and discusses
these with the trainees.
2. Practicals where the teacher provides directions and instructions to the trainees and
observes the trainees’ performance and compare. with learning goal.
3. Summary, where the teacher discusses the fit of the IT in the business tasks.
IT user training rarely concerns skills only. The 8th
graders had an explicit goal of
understanding, and the learners at Shipping International must probably have to understand
how messages and documents are organised in their new system. Understanding is in general
known to enhance transfer of competence from courses to work (Bransford, 2000, p. 9).
Improved understanding also helps users remember longer during periods of not applying a
software (Karuppan & Karuppan, 2008).
Studies of training for understanding have shown that presentation of the concepts to be learn
prior to practice improves learning (Mayer, 1989), and that discussing them with the learners
after practice also helps understanding. This sequence is also in accordance with a general
sequence of teaching for skills and understanding (Gagné & Briggs, 1974). Concerning IT
user training, the same sequence of teaching is found in (Herskin, 2006), whose approach was
tested and the learners responded that it helped understanding (Hadjerrouit, 2008).
Similar approaches aiming at teaching skills and understanding of IT have also been found
effective. (Bhavnani, Peck, & Reif, 2008). In addition to teaching in the US, training for skills
and understanding was also carried out by another researcher in a disadvantaged community
in South Africa, where few learners were familiar with computers (Marsh, 2007). These
learners also benefitted from the teaching method. For example 39% of the students who were
taught about split window in Word for viewing several relevant parts of a document at the
same time also applied the same strategy in Excel, without this being mentioned in the Excel
teaching. The students transferred the competence nevertheless.
Similar advantages have been found in the area of learning business fit. In an experiment, two
out of 16 hours of skill training was substituted with a session aimed at understanding the
organisational level for half of the participants (Coulson et al., 2003). Those who received the
training for understanding developed better mental models than those who only had skills
training.
In addition to motivating the learners, presenting concepts and usefulness prior to practice
also helps trainees combining the new material with what they already know. For instance, if
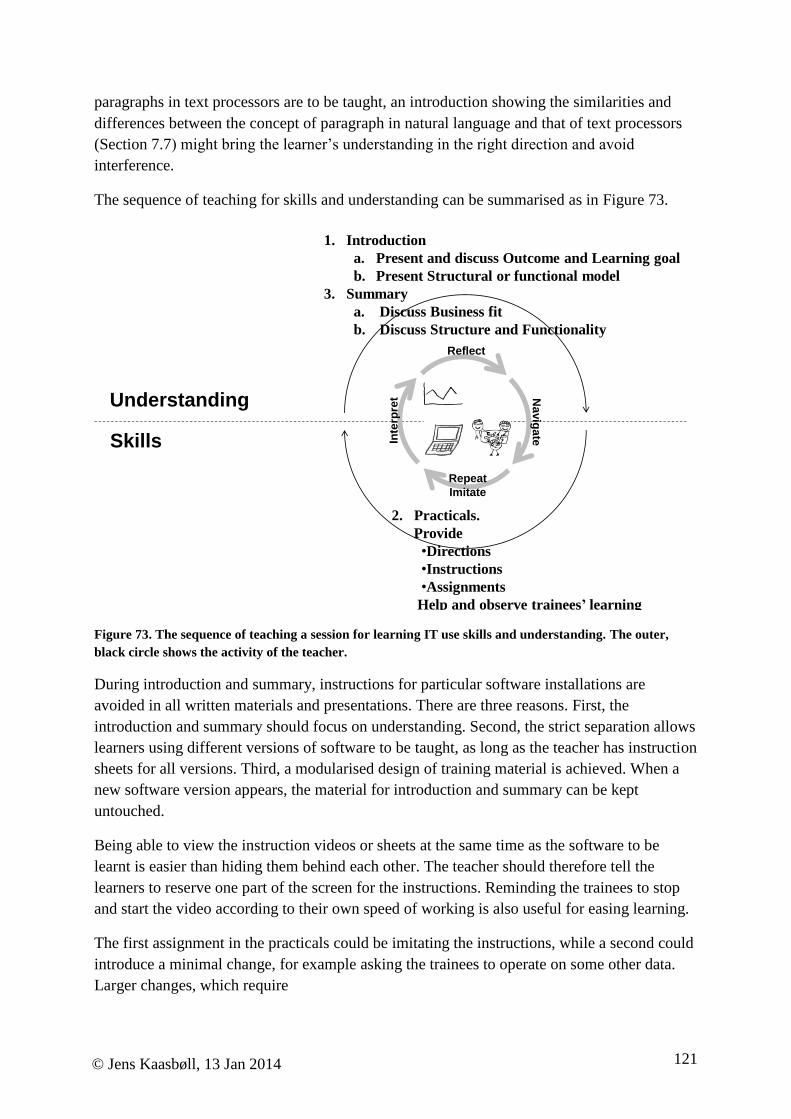
121
© Jens Kaasbøll, 13 Jan 2014
paragraphs in text processors are to be taught, an introduction showing the similarities and
differences between the concept of paragraph in natural language and that of text processors
(Section 7.7) might bring the learner’s understanding in the right direction and avoid
interference.
The sequence of teaching for skills and understanding can be summarised as in Figure 73.
Understanding
Skills
2. Practicals.
Provide
•Directions
•Instructions
•Assignments
Help and observe trainees’ learning
1. Introduction
a. Present and discuss Outcome and Learning goal
b. Present Structural or functional model
3. Summary
a. Discuss Business fit
b. Discuss Structure and Functionality
Inte
rpre
t
Repeat
Imitate
Na
vig
ate
Reflect
Figure 73. The sequence of teaching a session for learning IT use skills and understanding. The outer,
black circle shows the activity of the teacher.
During introduction and summary, instructions for particular software installations are
avoided in all written materials and presentations. There are three reasons. First, the
introduction and summary should focus on understanding. Second, the strict separation allows
learners using different versions of software to be taught, as long as the teacher has instruction
sheets for all versions. Third, a modularised design of training material is achieved. When a
new software version appears, the material for introduction and summary can be kept
untouched.
Being able to view the instruction videos or sheets at the same time as the software to be
learnt is easier than hiding them behind each other. The teacher should therefore tell the
learners to reserve one part of the screen for the instructions. Reminding the trainees to stop
and start the video according to their own speed of working is also useful for easing learning.
The first assignment in the practicals could be imitating the instructions, while a second could
introduce a minimal change, for example asking the trainees to operate on some other data.
Larger changes, which require

122
© Jens Kaasbøll, 13 Jan 2014
One session should cover one structural or one functional model, such that the trainees
understand it before progressing to the next session. In order to develop skills, the time for
practicals should cover the majority of the session length. For instance, a 30 minutes session
might be planned for 10 minutes for presentations and discussions and 20 minutes practical
assignments.
When learners work on their own, the teacher can move around freely in the classroom to help
out when needed. Instructing by means of the projector means that the teacher has to rush in
between the screen and the learners to help out those who are stuck. Experience shows that
working with instruction sheets or videos relieves the teacher from most of the requests, since
the learners have material to look at (Herskin, 2006). The teacher is gaining time to respond to
the questions from the learners.
Being able to view the instruction videos or sheets at the same time as the software to be
learnt is easier than hiding them behind each other. The teacher should therefore tell the
learners to reserve one part of the screen for the instructions. Reminding the trainees to stop
and start the video according to their own speed of working is also useful for easing learning.
During the practical, obviously the learners are busy on their computers. This is necessary for
developing the initial skill. Since talking while doing contributes to understanding, it might be
better if the learners were discussing while running the computer. This can be achieved
through having two learners at each computer. One is operating the keyboard and mouse,
while the other is making comments, asking questions, checking the documentation etc. Then
the pair swaps roles, so that both do the hands-on exercise. A laboratory study showed that
learners operating in pairs outperformed individuals on understanding. The pairs could
explain more about how the software operated and they performed better in exercises which
introduced some novel elements (Lim et al., 1997).
Operation in pairs is known from computer science education as ‘pair programming.’ Several
studies have been carried out, and pair programming has been proved more effective for
bringing more students through exams than the individual programming (McDowell, Werner,
Bullock, & Fernald, 2006). The lesson from learning of programming addresses learning
goals of understanding and problem solving.
Motor skills were not considered, neither in the user learning nor the computer science cases.
It would be reasonable to
believe that learners, still
struggling with the mouse and
keyboard, should be practicing
this as much as possible, while
pair learning fits better for
those above this level.
Even if the teacher observes
that the learners carry out the
operations in a satisfying way,
Assessing understanding during summary—Trainer
Kylie and two learners Dmitri and Julia.
Kylie: Can you tell us what a style is?
Dmitri: It is formating.
Kylie: Yes, and what does it format?
Dmitri: The document.
Kylie: Does one style format the whole document?
Julia: No, each paragraph has a style.
Kylie: Yes. Can two paragraphs have the same style?
Julia: I am not sure, but I think so.
Kylie: OK, look here at the document. Now, I change …
123
© Jens Kaasbøll, 13 Jan 2014
this does not mean that they have understood usefulness and concepts. The summary should
therefore continue the assessment, by asking the students to express the concept they have
been working with. Kylie has been teaching styles and has observed that all participants were
able to change and apply styles in their documents. Nevertheless, their understanding is poor.
Dmitri does not seem to be aware of that styles apply to units called paragraphs. Even if Julia
knows this, her last statement indicates a poor understanding of the usefulness of styles,
namely that one can keep and change formatting in a consistent way throughout a document
by applying the same style to paragraphs that should have the same format. Based on her
assessment of the trainees’ understanding, she decides repeating the whole explanation by
means of demonstrating the function and usefulness of styles. Thereafter, she will check the
trainees’ understanding again.
When having heard that the large majority of the learners can explain styles, Kylie would
continue with a new session on table of contents. Since table of contents is a concept that
builds on styles (Section 5.6, Figure 28), she ensures the trainees’ understanding of one
concept before progressing to the next one.
Developing functional and structural models plus instruction sheets consumes time, which
may be one of the reasons why user trainers often skip all this and rather present interaction
with a projector for the users to imitate. Users who were asked to rank the quality of different
aspects of IT support gave the lowest score to documentation in training (Shaw, DeLone, &
Niederman, 2002). Knowing that reviewing material from training is twice as successful as
searching for help other places (Novick et al., 2009), putting more effort into training material
could make users into better problem solvers and save the IT supporters from many
encounters.
10.4. Training for problem solving and for improving self-efficacy
When using IT in the business, conditions will always vary, so the benefit of problem solving
competence should not be surprising. Transfer requires the ability to learn constructively and
independently in post-training situations (Van der Sanden & Teurlings, 2003).
In a study of adult computer novices, half were trained through a series of tasks for the whole
duration of the experiment. The other half was given a short series followed by a prompt to
experiment with the operations (S. A. Davis & Bostrom, 1993). There was no difference in
the learning outcome. This may indicate that the ability to learn a lot of IT from
experimentation is an ability of a minor portion of adults, while the majority does equally well
with pre-programmed teaching.
Encouraging users to make errors during training by emphasizing that errors constitute good
opportunities for learning has shown promising effects both for performance and learning
oriented users (Keith & Frese, 2008). By coupling error encouragement with emphasizing that
the learning goal is computer mastery and improved competence and not achieving a high
performance, also performance oriented users above 40 years dared to explore and learnt
more than those only receiving instructions (Chillarege, Nordstrom, & Williams, 2003).

124
© Jens Kaasbøll, 13 Jan 2014
Since problem solving competence builds on understanding, trainees should be prepared for
learning problem solving after having completed a session on training for skills and
understanding. Teaching one of the problem solving approaches presented in Chapter 6, 7.2,
7.4 and 8.1 requires a similar sequence as teaching any concept, idea, theory or other abstract
thought:
1. Introduction where the teacher presents the problem solving approach.
2. Practicals where the teacher provides non-trivial assignments and observes the
trainees’ performance and compares with learning goal.
3. Summary, where the teacher discusses the trainees’ experience with the problem
solving approach.
This sequence can be illustrated in our usual way, see Figure 74, where generation of
hypothesis is chosen as an example of a problem solving approach.
Research cycle
skills
Understanding
research cycle
4. M
ak
ing
se
ns
e
of
ou
tpu
t.
3. Entering input.
2. D
ec
idin
g
op
era
tion
s
to b
e u
se
d.
Imitate and Repeat the cycle
Generate hypotheses
5. Comparing output
with expected.
1. Deciding input to be
changed.
2. Practicals
a. Provide problem assignments
b. Monitor and guide trainees’ learning
1. Introduction
a. Discuss needs for problem solving
b. Present and discuss a problem solving approach
3. Discuss the problem solving approach
Figure 74. The sequence of teaching a session for learning problem solving. The outer, black circle shows
the activity of the teacher.
When the assignment is difficult, the learners might have to go through many cycles of
experimentation. For efficient learning, the trainer needs to provide lots of support during
such exercises (Hmelo-Silver, Duncan, & Chinn, 2007).
Training problem solving is especially important when training super-users; since they are
supposed to help others solve their problems. In the case of introducing an information system
in an organisation through training super-users who thereafter support the other users, the
super-users should also understand the structures and functions of the system, such that they
can explain these to the other users.
If the learners have been taught the problem solving approaches earlier, there is no need for
specific sessions presenting the approaches again. The non-trivial assignments which require
problem solving can then be added to the assignments in a skills and understanding session,
125
© Jens Kaasbøll, 13 Jan 2014
and the trainer can spark a discussion the problem solving approaches chosen by the trainees
during the summary.
As mentioned in Section 6.3, self-efficacy can be improved by watching a peer, who is
considered at the same level of IT competence, solving a problem. This is an additional
argument for the pair working mentioned under training for skills and understanding. Another
option is to let a peer take the place of the trainer and demonstrate at the projector.
People’s general cognitive ability is another trainee characteristics that influence transfer (R.
Grossman & Salas, 2011). Assuming that course participants cannot be selected according to
their intelligence, trainers have to deal with the trainees attending a course, being an in-
service course in an organisation or a class in school. Trying to improve problem-solving
skills and understanding can contribute to improvements of general cognitive abilities.
10.5. Realistic training environment
The last factor to consider during training for improving transfer is to make the training as
equal to the business as possible. When back in business after training, there is no teacher
who demonstrate on a projector or walk around helping out. Hardware, software, data,
assignments, documentation and peer trainees can be made similar, however.
Even if training is carried out on one hardware brand and the trainees use another at work, the
computers may be similar enough. Response time and connectivity might be issues, though, if
training concerns using databases on servers, possibly through internet connections.
Classroom computers are often set up with a separate server to avoid interference with
production systems. Therefore, trainees have little opportunities to experience slow responses
during training. If there is connectivity trouble in the business, the trainees have not leant how
to work in such circumstances and might give up the whole system for such reasons.
Practicing with slow connections during the last part of training and discuss what to do might
be a way to prepare the trainees for the not so ideal set up at home.
It may be obvious that the software used in training should be equal to the version at work,
but this is not always the case. First, there may be several versions of a package in use, and if
the training is centralised, the classroom might have only one of these versions. Second, for a
web based system, the browser and operating system may influence the user experience, and
these components differ from computer to computer.
If spreadsheet training only uses accounting data as examples, while the participants are not
familiar with accounting, they may not understand the meaning of formulas or columns.
Making the trainees bring their own data to the training can resolve this issue, making sure
that the trainees don’t misunderstand the technology because they don’t have the information
area of competence of the trainer.
Also, courses go wrong due to the trainer not being familiar with the business of the learners.
If the participants will use spreadsheets for statistical analysis of the local flora and the trainer
gives assignments on analysing a budget, transfer is severely hampered.

126
© Jens Kaasbøll, 13 Jan 2014
Instruction sheets, models and other documentation provided during training can be brought
back to the business. If training is taking place on specific classroom computers with soft
copies of the documentation, the learners need to get an electronic copy in their hand or sent
to their e-mail. Trainers who say that “you can find it on our server” are not aware of the poor
impact of context-free user documentation. As also mentioned under the skill training
section 2.5, trainees are twice as likely to look up in documentation used during training
compared to other material (Novick et al., 2009).
Last, but not least, there are co-learners in courses. If more people who collaborate in business
participate in the same course, they can also collaborate on learning the IT after courses.
Therefore, sending only one individual to a course means that there is nobody else around to
ask when stuck. The result might be that the IT is abandoned and the expenses and time of
training are lost.
10.6. Summary
When competence learnt during training leads to changes in the way the trainees carry out
their business tasks, we say that there has been a transfer from training to business. Transfer
can be improved during training by motivating the trainees, by letting them imitate and learn
problem solving and by strengthening their self-efficacy. Transfer is also eased by making the
training environment similar to the business. For transfer to happen, the trainees need to be
able to use the system after the training. These conditions constitute the background for the
Golden Rules 4-6:
4. Train users so that they understand IT use.
5. Train users so that they can solve problems and learn on their own.
6. Organise training at the same time as the system is installed.

169
© Jens Kaasbøll, 13 Jan 2014
References
Adobe. (2012). Adobe Captivate 5.5 - Elearning authoring software. from
http://www.adobe.com/products/captivate.html
Aguinis, H., & Kraiger, K. (2009). Benefits of Training and Development for Individuals and
Teams, Organizations, and Society. Annual Review of Psychology, 60, 451-474.
Almnes, T. C. C. (2001). Superbruker. Hvordan forbedre brukerstøtte of informasjonsflyt.
(MSc), University of Oslo.
American Library Association and Association of College and Research Libraries. (2000).
Information Literacy Competency Standards for Higher Education. Chicago: Association
of College and Research Libraries.
Andrade, O. D., Bean, N., & Novick, D. G. (2009). The macro-structure of use of help
SIGDOC '09 (pp. 143-150). New York: ACM.
Arthur Jr., W., Bennett Jr., W., Edens, P. S., & Bell, S. T. (2003). Effectiveness of Training in
Organizations: A Meta-Analysis of Design and Evaluation Features. Journal of Applied
Psychology, 88(2), 234–245.
Babin, L.-M., Tricot, A., & Mariné, C. (2009). Seeking and providing assistance while
learning to use information systems. Computers & Education, 53, 1029–1039.
Ballantine, J. A., Larres, P. M., & Oyelere, P. (2007). Computer usage and the validity of self-
assessed computer competence among first-year business students. Computers &
Education, 49(4), 976–990.
Bannon, L. J. (1986). Helping users help each other. In D. A. Norman & S. W. Draper (Eds.),
User centered system design : new perspectives on human-computer interaction (pp. 399-
410). Hillsdale, NJ: Lawrence Erlbaum.
Bano, M., & Zowghi, D. (2013). User involvement in software development and system
success: a systematic literature review Proceedings of the 17th International Conference
on Evaluation and Assessment in Software Engineering (pp. 125-130). New York: ACM.
Barnes, L. E. (1890). How to Become Expert in Typewriting: A Complete Instructor Designed
Especially for the Remington typewriter: A.J. Barnes.
Ben-Ari, M., & Yeshno, T. (2006). Conceptual models of software artifacts. Interacting with
Computers, 18(6), 1336–1350.
Bhavnani, S. K., Peck, F. A., & Reif, F. (2008). Strategy-Based Instruction: Lessons Learned
in Teaching the Effective and Efficient Use of Computer Applications. ACM Transactions
on Computer-Human Interaction, 15(1), 1-47.
Bilal, D. (2002). Children's use of the Yahooligans! Web search engine. III. Cognitive and
physical behaviors on fully self-generated search tasks. Journal of the American Society
for Information Science and Technology, 53(13), 1170-1183.
Bjerknes, G., & Bratteteig, T. (1987). Florence in wonderland. In G. Bjerknes, P. Ehn & M.
Kyng (Eds.), Computers and Democracy—A Scandinavian Challenge (pp. 279-295).
Aldershot: Avebury.
Blomberg, J., Suchman, L., & Trigg, R. H. (1996). Reflections on a Work-Oriented Design
Project. Human-Computer Interaction, 11, 237-265.
Bloom, B., Englehart, M. D., Furst, E. J., Hill, W. H., & Krathwohl, D. (1956). The Taxonomy
of Educational Objectives, The Classification of Educational Goals, Handbook I:
Cognitive Domain. New York: David McKay.
Boffa, D. P., & Pawola, L. M. (2006). Identification and conceptualization of nurse super
users. Journal of Healthcare Information Management, 20(4), 60-68.

170
© Jens Kaasbøll, 13 Jan 2014
Borgman, C. L. (1986). The user's mental model of an information retrieval system: an
experiment on a prototype online catalog. International Journal of Man-Machine Studies,
24(1), 47–64.
Boudreau, M.-C., & Robey, D. (2005). Enacting Integrated Information Technology: A
Human Agency Perspective. Organization Science, 16(1), 3-18.
Braa, J., & Sahay, S. (2012). Integrated Health Information Architecture: Power To The
Users - Design, Development And Use. New Delhi: Matrix Publishers.
Bransford, J. (2000). How people learn: brain, mind, experience, and school. Washington,
D.C.: National Academy Press.
Bratteteig, T., Bødker, K., Dittrich, Y., Mogensen, P., & Simonsen, J. (2013). Participatory IT
Design: Designing for Business and Workplace Realities. In T. Robertson & J. Simonsen
(Eds.), Routledge International Handbook of Participatory Design. New York: Routledge.
Bruton, N. (2002). How to Manage the IT Help Desk: A Guide for User Support and Call
Center (2 ed.). Oxford: Butterworth Heinemann.
Buschman, J. (2009). Information literacy, "new" literacies, and literacy. Library Quarterly,
79(1), 95-118.
Bødker, K., Kensing, F., & Simonsen, J. (2004). Participatory IT Design: Designing for
Business and Workplace Realities. Cambridge, Mass.: MIT Press.
Calvani, A., Fini, A., Ranieri, M., & Picci, P. (2012). Are young generations in secondary
school digitally competent? A study on Italian teenagers. Computers & Education, 58,
797–807.
Carroll, J. M. (1990). The Nurnberg Funnel: Designing Minimalist Instruction for Practical
Computer Skill. Cambridge, Mass. : MIT Press.
Carroll, J. M., Mack, R. L., Lewis, C. H., Grischkowsky, N. L., & Robertson, S. R. (1985).
Exploring Exploring a Word Processor. Human-Computer Interaction, 1(283-307).
Certiport Inc. (2011). Certiport. from http://www.certiport.com/
Chandler, P., & Sweller, J. (1996). Cognitive Load While Learning to Use a Computer
Program. Applied Cognitive Psychology, 10(2), 151-170.
Chi, L., & Deng, X. N. (2011). Knowledge Transfer in Information Systems Support
Community: Network Effects of Bridging and Reaching. Paper presented at the Thirty
Second International Conference on Information Systems, Shanghai.
Chillarege, K. A., Nordstrom, C. R., & Williams, K. B. (2003). Learning from Our Mistakes:
Error Management Training for Mature Learners. Journal of Business and Psychology,
17(3), 369-385.
Clark, R. (2007). Leveraging multimedia for learning.
http://www.clarix.com/whitepapers/captivate_leveraging_multimedia.pdf
COL CCNC (Writer) & C. C. C. Videos (Director). (2010). Creating formulas using cell
ranges in an Openoffice calc spreadsheet COL CCNC Course Videos: YouTube.
Committee on Information Technology Literacy. (1999). Being Fluent with Information
Technology. Washington, D.C.: National Academy Press.
Compeau, Higgins, C. A., & Huff, S. (1999). Social Cognitive Theory and Individual
Reactions to Computing Technology: A Longitudinal Study. MIS Quarterly, 23(2), 145-
158.
Compeau, D. R., & Higgins, C. A. (1995). Application of Social Cognitive Theory to
Training for Computer Skills. Information Systems Research, 6(2), 118-143.
Cooper, J. (2006). The digital divide: the special case of gender. Journal of Computer
Assisted Learning, 22(5), 320–334.
Coulson, T., Shayo, C., Olfman, L., & Rohm, C. E. T. (2003). ERP training strategies:
conceptual training and the formation of accurate mental models SIGMIS '03 (pp. 87-97).
Philadelphia, Pennsylvania: ACM.

171
© Jens Kaasbøll, 13 Jan 2014
Covello, S. (2010). A Review of Digital Literacy Assessment Instruments (S. o. Education,
Trans.): Syracuse University.
Crabtree, A., O'Neill, J., Tolmie, P., Castellani, S., Colombino, T., & Grasso, A. (2006). The
practical indispensability of articulation work to immediate and remote help-giving. Paper
presented at the CSCW'06, Banff, Alberta.
Cuevas, H. M. F., Stephen M. Oser, Randall L. (2002). Scaffolding cognitive and
metacognitive processes in low verbal ability learners: Use of diagrams in computer-
based training environments. Instructional Science, 30(6), 433-464.
Davis, F. D. (1989). Perceived usefulness, perceived ease of use, and user acceptance of
information technology. MIS Quarterly, 13(3), 319-340.
Davis, S. A., & Bostrom, R. P. (1993). Training End Users: An Experimental Investigation of
the Roles of the Computer Interface and Training Methods. MIS Quarterly, 17(1), 61-85.
de Vries, B., van der Meij, H., & Lazonder, A. W. (2008). Supporting reflective web
searching in elementary schools. Computers in Human Behavior, 24, 649–665.
De Waal, B. M. E. (2012). What makes end-user training successful? A mixed method study
of a business process management system implementation. International Journal of
Knowledge and Learning, 8(1-2), 166-183.
Dostál, M. (2010). User Acceptance of the Microsoft Ribbon User Interface. In N. E.
Mastorakis & V. Mladenov (Eds.), Advances in Data Networks, Communications,
Computers (pp. 143-149). Faro, Portugal: WSEAS Press.
Dreyfus, H. L., & Dreyfus, S. E. (1986). Mind over Machine: The Power of Human Intuition
and Expertise in the Era of the Computer. New York: The Free Press.
Duarte, N. (2008). slide:ology: The Art and Science of Creating Great Presentations. Beijing:
O'Reilly.
Dutke, S., & Reimer, T. (2000). Evaluation of two types of online help for application
software. Journal of Computer Assisted Learning, 16(4), 307-315.
ECDL / ICDL. (2009). ECDL / ICDL Sample Part-Tests. Syllabus Version 5.0.
MSXPOpenOffice3.1 ECDL / ICDL Sample Part-Tests: ECDL Foundation.
ECDL Foundation. (2011). European Computer Driving Licence Foundation. from
http://www.ecdl.org/
Educational Testing Service. (2011). ETS. from http://www.ets.org/
Eschenbrenner, B. (2010). Towards a Model of Information Systems User Competency.
(PhD), University of Nebraska - Lincoln, Lincoln, Nebraska. Retrieved from
http://digitalcommons.unl.edu/businessdiss/12
Finnegan, L. (1996). GCN training survey finds what works, what doesn't and why.
Government Computer News, 43-44.
Forsythe, D. E. (1999). “It’s Just a Matter of Common Sense”: Ethnography as Invisible
Work. Computer Supported Cooperative Work, 8, 127–145.
Furnas, G. W., Landauer, T. K., Gomez, L. M., & Dumais, S. T. (1987). The vocabulary
problem in human-system communication. Communications of the ACM, 30(11), 964-971.
Furuta, T. (2000). The Impact of Generating Spontaneous Descriptions on Mental Model
Development. Journal of Science Education and Technology, 9(3), 247-256.
Gagné, R. M., & Briggs, L. J. (1974). Principles of Instructional Design. New York: Holt,
Rinehart and Winston.
Gallivan, M., Spitler, V., & Koufaris. (2005). Does Information Technology Training Really
Matter? A Social Information Processing Analysis of Coworkers' Influence on IT Usage in
the Workplace. Journal of Management Information Systems, 22(1), 153-192.
Gasser, L. (1986). The Integration of Computing and Routine Work. ACM Transactions on
Office Information Systems, 4(3), 205-225.
172
© Jens Kaasbøll, 13 Jan 2014
Ginns, P. (2006). Integrating information: A meta-analysis of the spatial contiguity and
temporal contiguity effects. Learning and Instruction, 16, 511-525.
Govindarajulu, C., Reithel, B. J., & Sethi, V. (2000). A model of end user attitudes and
intentions toward alternative sources of support. Information & Management, 37, 77-86.
Grant, D. M., Malloy, A. D., & Murphy, M. C. (2008). A Comparison of Student Perceptions
of their Computer Skills to their Actual Abilities. Journal of Information Technology
Education, 8, 141-160.
Gravill, J., & Compeau, D. (2008). Self-regulated learning strategies and software training.
Information & Management, 45(5), 288–296.
Greenbaum, J., & Kyng, M. (1991). Design at Work: Cooperative Design of Computer
Systems. Hillsdale, New Jersey: Lawrence Erlbaum.
Grigoreanu, V., Burnett, M., Wiedenbeck, S., Cao, J., Rector, K., & Kwan, I. (2012). End-
user debugging strategies: A sensemaking perspective. ACM Trans. Comput.-Hum.
Interact., 19(1), 1-28. doi: 10.1145/2147783.2147788
Grossman, R., & Salas, E. (2011). The transfer of training: what really matters. International
Journal of Training and Development, 15(2), 103-120.
Grossman, T., Fitzmaurice, G., & Attar, R. (2009). A survey of software learnability: metrics,
methodologies and guidelines CHI '09: Proceedings of the 27th international conference
on Human factors in computing systems (pp. 649-658). New York: ACM.
Hadjerrouit, S. (2008). Using a Learner-Centered Approach to Teach ICT in Secondary
Schools: An Exploratory Study. Issues in Informing Science and Information Technology,
5, 233-259.
Hakkarainen, K., Ilomäki, L., Lipponen, L., Muukkonen, H., Rahikainen, M., Tuominen, T., .
. . Lehtinen, E. (2000). Students' skills and practices of using ICT: results of a national
assessment in Finland. Computers & Education, 34, 103-117.
Halasz, F. G., & Moran, T. P. (1983). Mental models and problem solving in using a
calculator CHI '83 Proceedings of the SIGCHI Conference on Human Factors in
Computing Systems (pp. 212-216). New York: ACM.
Halbesleben, J. R. B., Wakefield, D. S., Ward, M. M., Brokel, J., & Crandall, D. (2009). The
Relationship Between Super Users’ Attitudes and Employee Experiences With Clinical
Information Systems. Medical Care Research and Review, 66(1), 82-96.
Hartwick, J., & Barki, H. (1994). Explaining the role of user participation in information
system use. Management Science, 40(4), 440-465.
Hattie, J. (2009). Visible Learning: A Synthesis of Over 800 Meta-Analyses Relating to
Achievement. Oxon, UK: Routledge.
Hearst, M. (2003). Information Visualization: Principles, Promise, and Pragmatics. CHI 2003
tutorial.
Herskin, B. (2006). Brugeruddannelse i praksis. Copenhagen: Nyt Teknisk Forlag.
Hignite, M., Margavio, T. M., & Margavio, G. W. (2009). Information literacy assessment:
Moving beyond computer literacy. College Student Journal, 43(3), 812-821.
Hmelo-Silver, C. E., Duncan, R. G., & Chinn, C. A. (2007). Scaffolding and Achievement in
Problem-Based and Inquiry Learning: A Response to Kirschner, Sweller, and Clark
(2006). Educational Psychologist, 42(2), 99-107.
Holton III, E. F. (1996). The Flawed Four-Level Evaluation Model. Human Resource
Development Quarterly, 7(1), 5-21.
Kaasbøll. (2013). A Three-level Content Model of Learning IT Use. In T. Fallmyr (Ed.),
Norsk konferanse for organisasjoners bruk av informasjonsteknologi - NOKOBIT 2013
(pp. 173-188). Trondheim: NOKOBIT-stiftelsen og Akademika forlag.

173
© Jens Kaasbøll, 13 Jan 2014
Kaasbøll, J., Chawani, M. S., Hamre, G. A., & Sandvand, J. (2010). Competencies and
Learning for Management Information Systems. Journal of Information, Information
Technology, and Organizations, 5, 85-100.
Kanstrup, A. M., & Bertelsen, P. (2006). Participatory IT-support. Paper presented at the
PDC 2006 - Proceedings of the ninth Participatory Design Conference, Trento, Italy.
Karuppan, C., & Karuppan, M. (2008). Resilience of super users' mental models of enterprise-
wide systems. European Journal of Information Systems, 17(1), 29-46.
Kato, T. (1986). What “question-asking protocols” can say about the user interface.
International Journal of Man-Machine Studies, 25(6), 659–673.
Kehoe, E. J. B., Timothy C. Yin, Leon Olsen, Kirk N. Pitts, Claudia Henry, Julie D. Bailey,
Phoebe E. (2009). Training adult novices to use computers: Effects of different types of
illustrations. Computers in Human Behavior, 25(2), 275–283.
Keith, N., & Frese, M. (2008). Effectiveness of error management training: A meta-analysis.
Journal of Applied Psychology, 93(1), 59-69.
Kensing, F., & Munk-Madsen, A. (1993). PD: structure in the toolbox. Communications of
the ACM, 36(6), 78-78.
Kiili, K., & Ketamo, H. (2007). Exploring the Learning Mechanism in Educational Games.
Journal of Computing and Information Technology, 4, 319–324.
Kirkpatrick, D. L. (1959). Techniques for evaluating training programs. Journal of American
Society of Training Directors, 13(3), 21-26.
Kirkpatrick, D. L. (1975). Evaluating Training Programs. San Francisco: Berrett-Koehler.
Kirkpatrick, D. L., & Kirkpatrick, J. D. (2006). Evaluating Training Programs: The Four
Levels San Francisco: Berrett-Koehler.
Korpelainen, E., & Kira, M. (2010). Employees' choices in learning how to use information
and communication technology systems at work: strategies and approaches. International
Journal of Training and Development, 14(1), 32–53.
Kumar, S. (2010). DebugMode Wink. DebugMode. Retrieved 5 Jan, 2012, from
http://www.debugmode.com/wink/
Lankshear, C., & Knobel, M. (2008). Digital Literacies: Concepts, Policies and Practices.
New York: Peter Lang Publishing.
Larres, P. M., Ballantine, J., & Whittington, M. (2003). Evaluating the validity of self-
assessment: measuring computer literacy among entry-level undergraduates within
accounting degree programmes at two UK universities. Accounting Education: An
International Journal, 12(2), 97-112.
Leu Jr., D. J., Kinzer, C. K., Coiro, J. L., & Cammack, D. W. (2004). Toward a Theory of
New Literacies Emerging From the Internet and Other Information and Communication
Technologies. In R. B. Ruddell & N. J. Unrau (Eds.), Theoretical Models and Processes of
Reading. Fifth Edition (pp. 1570-1613). Newark: International Reading Association.
Li, Y., & Ranieri, M. (2010). Are ‘digital natives’ really digitally competent?—A study on
Chinese teenagers. British Journal of Educational Technology, 41(6), 1029–1042.
Lim, K. H., Ward, L. M., & Benbasat, I. (1997). An Empirical Study of Computer System
Learning: Comparison of Co-Discovery and Self-Discovery Methods. Information
Systems Research, 8(3), 254-272.
Luehrman, A. (1980). Should the Computer Teach the Student, or Vice-Versa? . In R. Taylor
(Ed.), The Computer in School: Tutor, Tool, Tutee New York: Teachers College Press.
Marcolin, B. L., Compeau, D. R., Munro, M. C., & Huff, S. L. (2000). Assessing User
Competence: Conceptualiation and Measurement. Information Systems Research, 11(1),
37-60.

174
© Jens Kaasbøll, 13 Jan 2014
Markus, M. L., & Mao, J.-Y. (2004). Participation in Development and Implementation -
Updating An Old, Tired Concept for Today's IS Contexts. Journal of the Association for
Information Systems, 5(11-12), 514-544.
Marsh, C. (2007). Strategic Knowledge of Computer Applications: The Key to Efficient
Computer Use. Issues in Informing Science and Information Technology, 4, 269-276.
Martin, A. P., Ivory, M. Y., Megraw, R., & Slabosky, B. (2005). Exploring the Persistent
Problem of User Assistance ResearchWorks (pp. 1-5). Seattle, WA, USA: University of
Washington.
Mayer, R. E. (1989). Models for Understanding. Review of Educational Research, 59(1), 43-
64.
McDowell, C., Werner, L., Bullock, H., & Fernald, J. (2006). Pair programming improves
student retention, confidence, and program quality. Communications of the ACM, 49(8),
90-95.
MCEECDYA. (2010). National Assessment Program - ICT Literacy Years 6 & 10 Report
2008. Carlton South, Victoria, Australia: Ministerial Council for Education, Early
Childhood Development and Youth Affairs.
McIntire, S., & Clark, T. (2009). Essential Steps in Super User Education for Ambulatory
Clinic Nurses. Urologic Nursing, 29(5), 337-342.
McNeive, J. E. (2009). Super Users Have Great Value in Your Organization. Computers,
Informatics, Nursing(May/June), 136-139.
Merritt, K., Smith, K. D., & Di Renzo Jr., J. C. (2005). An investigation of self-reported
computer literacy: Is it reliable? Issues in Information Systems, VI(1), 289-295.
Mitra, S. Kalkaji. Retrieved 6 Nov, 2013, from
http://www.flickr.com/photos/tedconference/8493285132/
Mitra, S., Dangwal, R., Chatterjee, S., Jha, S., Bisht, R. S., & Kapur, P. (2005). Acquisition of
computing literacy on shared public computers: children and the “hole in the wall.”
Australasian Journal of Educational Technology 21(3), 407-426.
mrwaynesclass (Writer) & mrwaynesclass (Director). (2009). 06 Google Spreadsheets Cell
Formula pt 6 of 7 mrwaynesclass's channel: YouTube.
Munkvold, R. (2003). End User Support Usage. In S. R. Gordon (Ed.), Computing
information technology: the human side (pp. 146-160). Hershey, PA, USA: Idea Group
Inc.
Nielsen, J. (1993). Usability Engineering. Boston: AP Professional.
Nielsen, J. (1994). Estimating the number of subjects needed for a thinking aloud test.
International Journal of Human-Computer Studies, 41(3), 385–397.
Nilsen, H., & Sein, M. (2004). What is really important in supporting end-users? Paper
presented at the Proceedings of the 2004 SIGMIS conference on Computer personnel
research: Careers, culture, and ethics in a networked environment.
Norman, D. (1988). The Psychology Of Everyday Things. New York: Basic Books.
Novick, D. G., Andrade, O. D., & Bean, N. (2009). The micro-structure of use of help
SIGDOC '09 (pp. 97-104). New York: ACM.
Novick, D. G., Elizalde, E., & Bean, N. (2007). Toward a more accurate view of when and
how people seek help with computer applications SIGDOC '07. New York: ACM.
Novick, D. G., & Ward, K. (2006). Why don't people read the manual? SIGDOC '06 (pp. 11-
18). New York: ACM.
OECD. (2011). PISA 2009 Results: Students on Line: Digital Technologies and Performance
(Volume VI).
Olsen, K. A., & Malizia, A. (2011). Automated Personal Assistants. Computer, 44, 110-112.
Ormrod, J. E. (1995). Human Learning. Englewood Cliffs, New Jersey: Merrill.
Ormrod, J. E. (2012). Human Learning (6 ed.). Englewood Cliffs, New Jersey: Merrill.

175
© Jens Kaasbøll, 13 Jan 2014
Papastergiou, M. (2005). Students’ Mental Models of the Internet and Their Didactical
Exploitation in Informatics Education. Education and Information Technologies, 10(4),
341-360.
Pask, J. M., & Saunders, E. S. (2004). Differentiating Information Skills and Computer Skills:
A Factor Analytic Approach. Libraries and the Academy, 4(1), 61-73.
Phelps, R., Ellis, A., & Hase, S. (2001). The role of metacognitive and reflective learning
processes in developing capable computer users. Meeting at the crossroads: proceedings
of the 18th Annual Conference of ASCILITE. Melbourne: Southern Cross University.
Poe, S. S., Abbott, P., & Pronovost, P. (2011). Building Nursing Intellectual Capital for Safe
Use of Information Technology: A Before-After Study to Test an Evidence-Based Peer
Coach Intervention (Vol. 26, pp. 110-119). J Nurs Care Qual.
Poole, E. S., Chetty, M., Morgan, T., Grinter, R. E., & Edwards, W. K. (2009). Computer help
at home: methods and motivations for informal technical support CHI '09 (pp. 1-10). New
York: ACM.
Price, S., & Falcão, T. P. (2011). Where the attention is: Discovery learning in novel tangible
environments. Interacting with Computers, 23, 499–512.
Puri, S. (2007). Integrating Scientific With Indigenous Knowledge: Constructing Knowledge
Alliances For Land Management In India. MIS Quarterly, 31(2), 25.
Puustinen, M., & Rouet, J.-F. (2009). Learning with new technologies: Help seeking and
information searching revisited. Computers & Education, 53, 1014–1019.
Reynolds, G. (2010). Presentation zen design : simple design principles and techniques to
enhance your presentations. Berkeley: New Riders.
Rieman, J. (1996). A field study of exploratory learning strategies. Transactions on
Computer-Human Interaction, 3(3), 189-218.
Rosling, H. (2006). Hans Rosling shows the best stats you've ever seen. New York City and
Vancouver: TED Ideas worth spreading.
Santhanam, R., Seligman, L., & Kang, D. (2007). Postimplementation Knowledge Transfers
to Users and Information Technology Professionals. Journal of Management Information
Systems, 24(1), 171-199.
Schoenfeld, A. H. (1992). Learning to think mathematically: Problem solving, metacognition,
and sense-making in mathematics. In D. A. Grouws (Ed.), Handbook for Research on
Mathematics Teaching and Learning (pp. 334-370). New York: Macmillan.
Scott, J. E. (2006). Post-Implementation Usability of Erp Training Manuals:The User's
Perspective. Information Systems Management, 22(2), 67-77.
Sein, M., Bostrom, R. P., & Olfman, L. (1999). Rethinking End-User Training Strategy:
Applying a Hierarchical Knowledge-Level Model. Journal of End User Computing, 11(1),
32-39.
Sein, M. K., & Bostrom, R. P. (1989). Individual differences and conceptual models in
training novice users. Human–Computer Interaction, 4, 197-229.
Sein, M. K., Bostrom, R. P., & Olfman, L. (1998). Conceptualizing IT training for the
workforce of the future. SIGCPR, 30(1), 223-241.
Sein, M. K., Bostrom, R. P., & Olfman, L. (1999). Rethinking End-User Training Strategy:
Applying a Hierarchical Knowledge-Level Model. Journal of End User Computing, 11(1),
32-39.
Sfard, A. (1991). On the Dual Nature of Mathematical Conception: Reflections on Processes
and Objects as Different sides of the Same Coin. Educational Studies in Mathematics, 22,
1-36.
Sharma, R., & Yetton, P. (2007). The contingent effects of training, technical complexity, and
task interdependence on successful information systems implementation. MIS Quarterly,
31(2), 219-238.
176
© Jens Kaasbøll, 13 Jan 2014
Shaw, N. C., DeLone, W. H., & Niederman, F. (2002). Sources of dissatisfaction in end-user
support: an empirical study. ACM SIGMIS Database, 33(2), 41-55.
Shneiderman, B., & Plaisant, C. (2010). Designing the User Interface: Strategies for Effective
Human-Computer Interaction (5 ed.). Boston: Pearson.
Shrager, J., & Klahr, D. (1986). Instructionless learning about a complex device: the paradigm
and observations. International Journal of Man-Machine Studies, 25(2), 153-189.
Sieber, V. (2009). Diagnostic online assessment of basic IT skills in 1st-year undergraduates
in the Medical Sciences Division, University of Oxford. British Journal of Educational
Technology, 40(2), 215-226.
Simon, S. J., & Werner, J. M. (1996). Computer training through behavior modeling, self-
paced, and instructional approaches: A field experiment. Journal of applied psychology,
81(6), 648-659.
Simonsen, J., & Robertson, T. (2013). Routledge International Handbook of Participatory
Design. New York: Routledge.
Sink, C., Sink, M., Stob, J., & Taniguchi, K. (2008). Further evidence of gender differences in
high school-level computer literacy. Chance, 21(1), 49-53.
Smart, K. L., Whiting, M. E., & DeTienne, K. B. (2001). Assessing the Need for Printed and
Online Documentation: A Study of Customer Preference and Use. Journal of Business
Communication, 38(3), 285-314.
Speier, C., & Brown, C. V. (1997). Differences in end-user computing support and control
across user departments. Information & Management, 32(2), 85–99.
Stodolsky, S. (1988). The subject matters : classroom activity in math and social studies.
Chicago: University of Chicago Press.
Subrahmaniyan, N., Beckwith, L., Grigoreanu, V., Burnett, M., Wiedenbeck, S., Narayanan,
V., . . . Fern, X. (2008). Testing vs. Code Inspection vs. ... What Else? Male and Female
End Users’ Debugging Strategies. In M. Burnett (Ed.), Proceeding of the twenty-sixth
annual SIGCHI conference on Human factors in computing systems (pp. 617-626). New
York: ACM.
Sykes, T. A., Venkatesh, V., & Gosain, S. (2009). Model of Acceptance with Peer Support: A
Social Network Perspective to Understand Employees’ System Use. MIS Quarterly, 33(2),
371-393.
Taylor, P. J., Russ-Eft, D. F., & Chan, D. W. L. (2005). A Meta-Analytic Review of Behavior
Modeling Training. Journal of Applied Psychology, 90(4), 692-709.
Tufte, E. (1990). Envisioning information. Cheshire, Conn: Graphics Press.
Tufte, E. (2011). The work of Edward Tufte and Graphics Press. from
http://www.edwardtufte.com/tufte/index
Van der Sanden, J. M. M., & Teurlings, C. C. J. (2003). Developing competence during
practice periods: The learner’s perspective. In T. Tuomi-Grohn & Y. Engestrom (Eds.),
Between school and work: New perspectives on transfer and boundary crossing (pp. 119-
136). Oxford, UK: Elsevier Science.
van Velsen, L. S., Steehouder, M. F., & de Jong, M. D. T. (2007). Evaluation of User
Support: Factors That Affect User Satisfaction With Helpdesks and Helplines. IEEE
Transactions on Professional Communication, 50(3), 219-231.
van Vliet, P. J. A., & Kletke, M. G. (1994). The measurement of computer literacy: a
comparison of self-appraisal and objective tests. International Journal of Human-
Computer Studies, 40(5), 835–857.
Venkatesh, V., Morris, M. G., Davis, G. B., & Davis, F. D. (2003). User acceptance of
information technology: Toward a unified view. MIS Quarterly, 27(3), 425-478.
Vessey, I., & Conger, S. A. (1994). Requirement Specification: Learning Object, Process, and
Data Methodologies. Communications of the ACM, 37(5), 102-113.
177
© Jens Kaasbøll, 13 Jan 2014
von Neumann, J. (1945). First Draft of a Report on the EDVAC (M. S. o. E. Engineering,
Trans.). Philadelphia: University of Pennsylvania.
Wagner, E. L., & Piccoli, G. (2007). Moving beyond user participation to achieve successful
IS design. Communications of the ACM, 50(12), 51-55.
Walker, C. B. F. (1987). Cuneiform. London: British Museum Press.
Waytz, A., Cacioppo, J., & Epley, N. (2010). Who Sees Human?: The Stability and
Importance of Individual Differences in Anthropomorphism. Perspectives on
Psychological Science, 5(19), 219–232.
Wenger, E. (1998). Communities of practice : learning, meaning, and identity. Cambridge:
Cambridge University Press.
Westbrook, L. (2006). Mental models: a theoretical overview and preliminary study. Journal
of Information Science, 32(6), 563–579.
Wittwer, J., & Renkl, A. (2010). How Effective are Instructional Explanations in Example-
Based Learning? A Meta-Analytic Review. Educational Psychology Review, 22, 393-409.
Åsand, H.-R. H., & Mørch, A. (2006). Super Users and Local Developers: The Organization
of End User Development in an Accounting Company. Journal of Organizational and End
User Computing, 18(4), 1-21.
Östby, J. (2012). KRUT. Retrieved 5 Jan, 2012, from http://krut.sourceforge.net/