Embed Size (px)
Citation preview
RESEARCH SEMINAR IN INTERNATIONAL ECONOMICS
Gerald R. Ford School of Public Policy The University of Michigan
Ann Arbor, Michigan 48109-1220
Discussion Paper No. 495
Developing Countries’ Stake in the Doha Round
Drusilla K. Brown Tufts University
Alan V. Deardorff and Robert M. Stern
University of Michigan
June 11, 2003
Recent RSIE Discussion Papers are available on the World Wide Web at: http://www.spp.umich.edu/rsie/workingpapers/wp.html
2
Bern Conference 6/11/03
Developing Countries’ Stake in the Doha Round
Drusilla K. Brown, Tufts University Alan V. Deardorff, University of Michigan Robert M. Stern, University of Michigan
Abstract
In this paper we discuss the various aspects of the Doha Round of Multilateral Trade Negotiations in the WTO that offer potential benefits for developing countries. We then use the Michigan Model of World Production and Trade to simulate the economic effects on the major trading countries/regions of the reductions in tariffs, subsidies in agriculture, and barriers in services that may be negotiated in the Doha Round, as well as a variety of regional free trade agreements (FTAs). We estimate that an assumed reduction of post-Uruguay Round tariffs and other barriers on agricultural and industrial products and services by 33 percent in the Doha Round would increase world welfare by $686.4 billion, with significant gains for all industrialized and developing countries/regions. Regional agreements such as an APEC FTA, an ASEAN Plus 3 FTA, and a Western Hemisphere FTA would increase global and member country welfare, but by much less than the Doha multilateral trade round. There would also be trade diversion and detrimental welfare effects on some nonmember countries for the FTAs analyzed. The welfare gains from multilateral trade liberalization are therefore considerably greater than the gains from preferential trading arrangements and more uniformly positive for all countries.
Keywords: WTO; Trade Liberalization JEL: F10; F13; F15 June 11, 2003 Address correspondence to: Alan V. Deardorff Department of Economics University of Michigan Ann Arbor, MI 48109-1220 Tel. 734-764-6817 E-mail: [email protected]
Developing Countries’ Stake in the Doha Round*
Drusilla K. Brown, Tufts University Alan V. Deardorff, University of Michigan Robert M. Stern, University of Michigan
I. Introduction
The Doha Round of multilateral trade negotiations in the World Trade Organization (WTO) has been
billed from the start as the “Doha Development Agenda,” with the promise in the Doha Ministerial
Declaration to “place their [developing countries’] needs and interests at the heart of the Work
Programme adopted in this Declaration.”1 The reason for this emphasis was in part the perception that
previous rounds had neglected the interests of developing countries or, in the case of the Uruguay Round,
had brought them on board with promises that were misleading or not likely to be kept. After the Seattle
Ministerial Meeting in which negotiations foundered on the conflicting objectives of developed and
developing countries, those who sought agreement to initiate a round at Doha were determined not to
repeat that mistake. To this end, the Ministerial Declaration includes the words “development” and
“developing” a total of 63 times
in its ten pages and 52 paragraphs.2 There is attention in virtually every section of the document to the
special needs of developing countries, and especially to their problems of implementation of any
agreement that might be reached.
In this paper we take a rather broad look at what the Doha Round may in fact offer to developing
countries. In Section II we outline the major aspects of the negotiations in which developing countries
have an obvious stake. In many of these, we would not be equipped to quantify the possible results of the
negotiations, even if we knew what they were, and we therefore must content ourselves with merely
* This paper draws upon research done for Brown et al. (2003). The research in this paper has been funded by a grant to the Gerald R. Ford School of Public Policy of the University of Michigan from the Japan Foundation, Center for Global Partnership, in support of a program of research on analytical and negotiating issues in U.S.-Japan international economic relations. 1 WTO (2001b, para. 2). 2 For those interested, “development” appears 39 times and “developing” 24. For comparison, “WTO” appears 38 and “trade” 65. The Doha Declaration certainly pays lip service, at least, to economic development.

2
reporting their existence. But for some, including of course the issue from which the GATT and WTO
got their start, liberalization of tariffs, quantification is feasible. We therefore proceed in Section III to
an analysis using our Michigan Model of World Production and Trade of several scenarios that might
emerge from the negotiations. These include liberalization in agriculture and services as well as in
manufactured goods, and we present several alternative scenarios in order to suggest what may be the
relative importance of these different aspects of liberalization to the participating developing countries.
As has often been the case during the conduct of trade negotiations, progress in the current round
has been difficult, and some worry that it may fail. A partial reason for that may be the proliferation of
bilateral and regional trading arrangements that have been discussed and negotiated in recent years, and
the possibility that many countries may choose to substitute such preferential trading arrangements
(PTAs) for the multilateral liberalization that is the purpose of the WTO. There are many reasons to
question the desirability of such an outcome, analysis of many of which would extend beyond the
capabilities of our modeling capacity. But to illuminate the issue partially, in section IV we report results
from the model for a selection of such PTAs, and we compare them to the results of the Doha Round
scenarios.
II. Issues in the Doha Round
The Doha Round promises to address a great many issues, and virtually all of them are of some interest
to developing countries. Here we will just discuss those issues which seem to be of greatest importance
to them.
Agriculture
The issue here includes both the high levels of protection that many developed countries have on
particular agricultural products, as well as the subsidies that they provide their farmers both for domestic
production and for export. The import barriers should in principle be most easily addressed, since they
consist primarily of the same sorts of tariffs that a half century of GATT negotiations has so successfully
reduced on manufactured goods. That agricultural tariffs were not included in these negotiations all

3
along was due to a historical anomaly, in that the United States took them off the table, in spite of what
has turned out to be its considerable comparative advantage and export prowess in many agricultural
products. On the other hand, it is true that agricultural producers, with their ties to the land and their
dispersal around the countryside, constitute a more distinctive group, especially politically, than do the
producers in most manufacturing industries. It may be this distinctiveness that has largely blocked
agricultural liberalization for all of these years.
It is also this distinctiveness that seems to have permitted agriculture to obtain other forms of
assistance, in addition to import barriers. The subsidies that industrialized countries routinely provide to
their farmers, to farm products, and to farm exports would be anathema in most manufacturing sectors,
but they are accepted with equanimity by the public when they benefit those who work the land.
Whatever the reason, and despite their considerable budgetary cost, agricultural subsidies have remained
among the most seriously trade-distorting policies throughout the developed world.
The interest of developing countries in reducing agricultural import barriers is obvious, to the
extent that these countries may export the products to which the barriers apply, as they often do. Their
interest in reducing export subsidies, however, is less obvious, since their consumers might benefit from
the subsidized goods. One might think that, especially in the least developed countries where hunger is
pervasive, cheap subsidized food would be exactly what they need. In fact, that may be the case for some
countries. However, in many countries it seems that the subsidized exports compete directly with the
products of their own farmers, and these farmers are often the poorest in these societies. Thus, while the
urban populations, including the elites, may benefit from cheap subsidized food from, say, the European
Union (EU), the rural poor are made poorer. One could perhaps argue that if the subsidies were to
continue indefinitely, these rural poor would be better off relocating to the cities and changing
occupations. But it is neither practical nor equitable to impose such adjustment costs on the poor when
farmers in the rich world are unwilling to bear the same costs.
In any case, it is clear that reduction of agricultural protection, and especially agricultural
subsidies, is paramount on the list of developing country objectives from the Doha Round. It is widely
accepted that if the EU does not make major changes in its Common Agricultural Policy, then developing
4
countries will refuse to deal. Our analysis below will provide some indication of what the welfare effects
of agricultural liberalization might be, but it should be noted that our model is able to capture at best only
the aggregate effect, not the sort of redistribution between rural and urban that we have just mentioned.
Also, the data on agricultural protection and subsidies that we have used do not adequately capture the
nuances and detail that in fact characterize the agricultural sector in the countries included in our model.
Intellectual Property
One of the most remarkable achievements of the Uruguay Round was its inclusion of the Agreement on
Trade Related Intellectual Property Rights (TRIPS). It was remarkable in part because, in spite of its
name, it extended far beyond issues of international trade to enforce policies that were far removed from
the previous purview of the GATT. And it was remarkable too because, in spite of its well-understood
detrimental effects on well being in developing countries, it was ultimately accepted by them as one of
the components of the new WTO. Their acceptance was due to several factors, including the argument
that they stood to gain from the TRIPS Agreement as it would foster innovation within and for their
domestic markets, and also due to the pressure put upon them by developed countries. But mostly they
appear to have accepted TRIPS in exchange for the gains they expected from trade liberalization in
textiles and apparel.
Afterwards, many developing countries came to regret the deal that they had made and sought to
renegotiate it. The gains in textiles and apparel were slow in arriving – indeed, most significant
liberalization there has yet to occur. And at the same time they found that TRIPS would interfere rather
drastically with their efforts to provide treatment for various diseases of the poor, including especially
AIDS. As a result they sought to revise the TRIPS agreement and, to the surprise of many, left Doha
with a separate “Declaration on the TRIPS Agreement and Public Health.” This Declaration, although it
reaffirmed “the right of WTO members to use, to the full, the provisions in the TRIPS agreement,” also
spelled out “interpretations” that would “provide flexibility for this purpose.”3 This included rights to
3 WTO (2002a, para. 4).

5
grant compulsory licenses and other conditions that would facilitate the provision of treatments for
diseases, especially HIV/AIDS, tuberculosis, and malaria.
Having produced this separate Declaration, which also instructs the Council for TRIPS to
address the special problems of least developed countries and those without the capacity to produce
pharmaceuticals themselves, the Doha Round does not include any explicit provision for other major
renegotiation of the TRIPS Agreement. The Ministerial Declaration mentions only two rather narrow
TRIPS issues to be dealt with, also by the Council for TRIPS: geographical indications and biological
diversity. The second of these could lead to improved “protection of traditional knowledge and
folklore,”4 an issue of great interest in some developing countries and one with the potential, depending
on how it goes, to help or harm them considerably.
Services
The General Agreement on Trade in Services (GATS) of the Uruguay Round introduced services to the
system of multilateral trade discipline, but it accomplished little liberalization of its own. In the years
since the WTO began, separate agreements on several service categories have been negotiated, but all of
these have been stimulated by, and reflected, the exporting interests of developed countries. As
negotiations under the GATS continue during the Doha Round, we can expect this trend to continue, with
additional service sectors being opened up. Service providers within developing countries will usually
find themselves subject to increased competition, and many will not survive. However, the increased
availability of high quality and low cost services will otherwise be very beneficial to developing
countries, including by improving their ability to exploit their comparative advantages in other sectors.
By and large, even though developing countries may see themselves as unable to compete in the service
sectors that are most likely to be liberalized, they nonetheless stand to gain, even or especially as
exporters, from the ongoing GATS negotiations.
The service category in which many developing countries, particularly in Asia, do have a
plausible export interest is movement of natural persons. Whether they will be allowed to pursue this 4 WTO (2002b, para. 19).

6
interest depends on how the negotiations proceed. If liberalization is limited to movement of only highly
skilled and highly trained persons, then developing countries may have little to gain. But if it is extended
to short term movement of less skilled workers, then the GATS could become a vehicle for significant
benefits to developing country populations. This is unlikely to be accomplished, however, if the
developing countries must negotiate for it alone. What is needed is for those industries within the
developed world that stand to benefit from the services that these temporary workers may provide, to join
the push for extension of the GATS to include them.
Market Access
With the conclusion of the Uruguay Round, average tariffs in industrialized countries are quite low, and
nontariff barriers were largely removed outside of agriculture, so that market access is no longer as large
an issue in the Doha Round as it was in previous rounds. However, the tariffs that remain are quite
uneven, and the highest tariffs systematically confront the sectors in which developing countries export.
This includes textiles and apparel, where even after the quotas of the Multifibre Arrangement are
scheduled to be eliminated in 2005, high tariffs will remain. Therefore, market access remains an issue
of crucial importance for developing countries, even while developed countries may have lost interest in
it. Here the hope may be that the reduced interest of the latter can be harnessed to produce a willingness
to reduce significantly or eliminate their remaining tariffs, since the resulting reduction in average tariffs
will not be large.
Just as important as tariffs in limiting market access, however, are the uses of administered
protection by increasing numbers of countries, both developed and developing. More important than the
actual duties levied under anti-dumping, countervailing-duty, and safeguards laws is the chilling effect on
exports that is caused by the potential for these actions, and also the negotiated settlements that result
when these actions are threatened. Unfortunately but understandably, instead of seeking the elimination
of these forms of protection, many developing countries have moved in recent years to enact comparable
statutes of their own and to use them, often as aggressively as the developed countries. Thus these
practices interfere with access into an increasing number of markets.

7
Renegotiation of these rules is on the Doha agenda, but the extreme sensitivity of the issue is
indicated by its appearance under the heading “WTO Rules” in the Ministerial Declaration, rather than
under “Market Access” or any more explicit category.5 Indeed, even under WTO Rules, “anti-dumping”
is not mentioned by name, but only referred to as Article VI of the GATT. This does not augur well for
achieving any significant reduction in the trade restrictiveness of anti-dumping law and other forms of
administered protection.
Technical Assistance
The Doha Agenda includes numerous mentions of the need to assist developing countries in their efforts
to trade and to comply with their WTO obligations. Many of the issue areas include acknowledgement
that developing countries find such compliance more difficult than do developed countries, and that they
require special assistance. The final sentence of the Government Procurement paragraph of the
Declaration is typical: “We commit ourselves to ensuring adequate technical assistance and support for
capacity building both during the negotiations and after their conclusion.”6 In addition, separate items
address Trade Facilitation and Technical Cooperation and Capacity Building, both of which are
specifically directed toward assisting developing countries to integrate themselves into the world trading
system. Clearly the negotiators at Doha recognized as never before the need to give developing countries
a leg up. It would seem that if this promise is fulfilled, it could provide a huge payoff from the Doha
Round for developing countries.7
However, it is not clear that anyone knows how such a promise is to be implemented in practice.
The WTO itself is a small organization and ill equipped to provide the level of assistance required. If the
assistance is left to individual countries to provide, it will confront the same provision-of-public-good
problem that development aid currently suffers under, in addition to difficulties of coordinating
assistance so that it will not run at cross purposes. Whether the negotiators in the Doha Round are
5 WTO (2002b, para. 28). 6 WTO (2002b, para. 26). 7 See Wilson et al. (2002).
8
prepared to create and somehow fund the institutional facility that would be required for all of this
assistance is currently unclear.
Special Treatment for Developing Countries
The phrase “special and differential treatment” in the GATT too often meant exempting developing
countries from liberalizing their own trade. The phrase appears again in the Doha Declaration, though
without specifying what it will mean in this case.8 It is to be hoped that, this time around, it will not
mean continued protection but rather acknowledgement of the adjustment costs of liberalization and
assistance with bearing those costs, not avoiding the liberalization altogether. Such assistance is likely to
include longer periods of time to comply with WTO rules, but it should also include financial and
technical assistance.
In addition, the Doha Declaration includes a substantial section dealing with Least Developed
Countries (LDCs). This calls, once again, for technical assistance for such countries and, most notably,
for “duty-free, quota-free market access for products originating from LDCs.”9 The group of LDCs
included here is not just those who are currently members of the WTO, but others as well, since the
Declaration calls for work to facilitate and accelerate the accession of LDCs to WTO membership.
Since, unlike many of the other objectives of the negotiations, these seem both straightforward and
possibly of relatively low cost to developed countries, this is one area where progress should be easily
achieved.
III. Analysis of Doha Round Scenarios
The built-in agenda of the Uruguay Round mandated that multilateral negotiations under WTO
auspices would commence for agriculture and services in 2000. Subsequently, in November 2001, at the
WTO Ministerial Meeting held in Doha, Qatar, agreement was reached on the negotiating agenda for a
new round to commence in 2002. To provide some perspective on the economic effects that might result
8 WTO (2002b, para. 44). 9 WTO (2002b, para. 42).

9
from the Doha Round, including the built-in agenda from the Uruguay Round, we thought it would be
instructive to use the Michigan Model of World Production and Trade to assess the potential magnitudes
involved. The Michigan Model is a multi-country, multi-sector computational general equilibrium model
that we have used now for more than 25 years to analyze changes in trade policies.
Overview of the Michigan Model
The version of the Michigan Model that we will use in this paper covers 18 economic sectors,
including agriculture, manufactures, and services in each of 20 countries/regions. A distinguishing
feature of the Michigan Model is that it incorporates some aspects of the New Trade Theory, including
increasing returns to scale, monopolistic competition, and product variety. A complete description of the
formal structure and equations of the model can be found on line at www.Fordschool.umich.edu/rsie/
model. The model is implemented using GEMPACK software, as described in Harrison and Pearson
(1996).
To help the reader interpret the results to follow, it is useful first to review the features of the
model that serve to identify the various economic effects that are being captured in the different
scenarios. Although the model includes the aforementioned features of the New Trade Theory, it
remains the case that markets respond to trade liberalization in much the same way that they would with
perfect competition. That is, when tariffs or other trade barriers are reduced in a sector, domestic buyers
(both final and intermediate) substitute toward imports and the domestic competing industry contracts
production while foreign exporters expand. With multilateral liberalization reducing tariffs and other
trade barriers simultaneously in most sectors and countries, each country’s industries share in both of
these effects, expanding or contracting depending primarily on whether their protection is reduced more
or less than in other sectors and countries. At the same time, countries with larger average tariff
reductions than their trading partners tend to experience a real exchange-rate depreciation of their
currencies in order to maintain a constant trade balance, so that all countries therefore experience
mixtures of both expanding and contracting sectors.
10
Worldwide, these changes cause increased international demand for all sectors. World prices
rise most for those sectors where trade barriers fall the most.10 This in turn causes changes in countries’
terms of trade that can be positive or negative. Those countries that are net exporters of goods with the
greatest degree of liberalization will experience increases in their terms of trade, as the world prices of
their exports rise relative to their imports. The reverse occurs for net exporters in industries where
liberalization is slight – perhaps because it already happened in previous trade rounds.
The effects on the welfare of countries arise from a mixture of these terms-of-trade effects,
together with the standard efficiency gains from trade and also from additional benefits due to elements
of the New Trade Theory. Thus, we expect on average that the world will gain from multilateral
liberalization, as resources are reallocated to those sectors in each country where there is a comparative
advantage. In the absence of terms-of-trade effects, these efficiency gains should raise national welfare
measured by the equivalent variation for every country, although some factor owners within a country
may lose, as will be noted below. However, it is possible for a particular country whose net imports are
concentrated in sectors with the greatest liberalization to lose overall, if the worsening of its terms of
trade swamps these efficiency gains.
On the other hand, although the New Trade Theory is perhaps best known for introducing new
reasons why countries may lose from trade, in fact its greatest contribution is to expand the list of reasons
for gains from trade. It is these that are the dominant contribution of the New Trade Theory in our
model. That is, trade liberalization permits all countries to expand their export sectors at the same time
that all sectors compete more closely with a larger number of competing varieties from abroad. As a
result, countries as a whole gain from lower costs due to increasing returns to scale, lower monopoly
distortions due to greater competition, and reduced costs and/or increased utility due to greater product
variety. All of these effects make it more likely that countries will gain from liberalization in ways that
are shared across the entire population.
In perfectly competitive trade models such as the Heckscher-Ohlin Model, one expects countries
as a whole to gain from trade, but the owners of one factor – the “scarce factor” – to lose through the 10 The U.S. dollar is the numeraire in the model, and there is a rest-of-world against which all other prices can rise.
11
mechanism first explored by Stolper and Samuelson (1941). The additional sources of gain from trade
due to increasing returns to scale, competition, and product variety, however, are shared across factors,
and we routinely find in our CGE modeling that both labor and capital gain from liberalization. That is
often the case here.
In the real world, all of these effects occur over time, some of them more quickly than others.
Our model is however static, based upon a single set of equilibrium conditions rather than relationships
that vary over time. Our results therefore refer to a time horizon that is somewhat uncertain, depending
on the assumptions that have been made about which variables do and do not adjust to changing market
conditions, and on the short- or long-run nature of these adjustments. Because our elasticities of supply
and demand reflect relatively long-run adjustments and because we assume that markets for both labor
and capital clear within countries, our results are appropriate for a relatively long time horizon of several
years – perhaps two or three at a minimum. On the other hand, our model does not allow for the very
long-run adjustments that could occur through capital accumulation, population growth, and
technological change. Our results should therefore be thought of as being superimposed upon longer-run
growth paths of the economies involved. To the extent that these growth paths themselves may be
influenced by trade liberalization, therefore, our model does not capture that.
Benchmark Data
The main data source used in the model is “The GTAP-4 Database” of the Purdue University
Center for Global Trade Analysis Project (McDougall et al., 1998). The reference year for this GTAP
database is 1995.11 The monopolistically competitive market structure in the nonagricultural sectors of
the model imposes an additional data requirement of the numbers of firms at the sectoral level, and there
is need also for estimates of sectoral employment. These data have been adapted from a variety of
published sources and are available on request. We have projected the GTAP-4 1995 database to the
year 2005, which is when the Uruguay Round liberalization will have been fully implemented. In this
connection, we extrapolated the labor availability in different countries/regions by an average weighted
11 We are currently updating to the GTAP-5 Database, which has a 1997 base year and includes better coverage of agricultural protection and subsidies.
12
population growth rate of 1.2 percent per annum. All other major variables have been projected, using an
average weighted growth rate of GDP of 2.5 percent.12
The projected database provides us with an approximate picture of what the world could be
expected to look like in 2005 if the Uruguay Round (UR) negotiations had not occurred. In Brown,
Deardorff, and Stern (2002a), we have analyzed the impact of the UR-induced changes expected to occur
over the course of the 10-year implementation period as a consequence of the negotiated reductions in
tariffs and non-tariff barriers. We then readjusted the scaled-up database for 2005 to mimic the world as
it might look in the post-UR implementation. In what follows, we use these re-adjusted data as the
starting point to carry out our liberalization scenarios for the Doha Round.13
Computational Scenarios
To assess the potential economic effects of the Doha Round, we assume 33 percent reductions in
post-Uruguay Round agricultural barriers, manufactures tariffs, and services barriers. The scenarios that
we have run are as follows: DR-1 Agricultural liberalization is modeled as a 33 percent reduction in post-Uruguay Round
agricultural import tariffs, export subsidies, and production subsidies. DR-2 Liberalization of industrial products is modeled as a 33 percent reduction in post-Uruguay
Round tariffs on manufactures. DR-3 Services liberalization is modeled as a 33 percent reduction in estimated post-Uruguay Round
services barriers. DR-4 This combines DR-1, DR-2, and DR-3.
In addition to the foregoing scenarios, we thought it would be of interest to run a scenario of
global free trade, as follows: DR-5 Global free trade is modeled as complete removal of all post-Uruguay Round barriers on
agricultural products, industrial products, and services.
12 The underlying data are drawn from World Bank sources and are available on request. For a more elaborate and detailed procedure for calculating year 2005 projections, see Hertel and Martin (1999) and Hertel (2000). 13 We have not made any allowance for China’s accession to the WTO in 2001, but we will do so in our future modeling research.

13
As already mentioned, while services were addressed in the Uruguay Round, the main
accomplishment was creation of the GATS, which is an umbrella agreement setting out the rules
governing the four modes of providing services transactions. These modes are: (1) cross-border
services (e.g., telecommunications); (2) services provided in the country of consumption (e.g.,
tourism); (3) services requiring a domestic presence in the form of foreign direct investment
(FDI); and (4) movement of natural persons. Brown and Stern (2001) have developed a new
version of the Michigan Model for the purpose of analyzing the behavior of multinational firms,
which are major providers of services, both intra-firm as well as in the production and sales of
foreign affiliates located in host countries.14 To approximate existing services barriers, Brown
and Stern used estimates of barriers to FDI provided by Hoekman (2000), based on the gross
operating margins of services firms listed on national stock exchanges for the period, 1994-96.15
These estimates are available on request.
Aggregate Results
The welfare effects, as measured by the equivalent variation, for the DR-1 to DR-4 scenarios are
indicated in columns (1)-(4) of table 1.16 As shown in column (1), the DR-1 33 percent reduction in post-
Uruguay Round agricultural-import tariffs, export subsidies, and production subsidies reduces global
welfare by $8.1 billion. Japan experiences a welfare increase of $0.7 billion. The United States records
a welfare decline of $7.2 billion, which reflects the drawing of resources away from the monopolistically
14 Because of computer-capacity constraints, Brown and Stern used a 3-sector aggregation consisting of agriculture, manufactures, and services and the same 20-country/region breakdown as is being used here. They also made allowance for international flows of FDI and increases in capital stocks in response to the multilateral trade liberalization that they analyzed. 15 The gross operating margins are calculated as the differences between total revenues and total operating costs. Some of these differences are presumably attributable to fixed costs. Given that the gross operating margins vary across countries, a portion of the margin can also be attributed to barriers to FDI. For this purpose, we have selected as a benchmark for each sector the country with the smallest gross operating margin, on the assumption that operations in that country can be considered to be freely open to foreign firms. The excess in any other country above this lowest benchmark is then taken to be due to barriers to establishment by foreign firms. That is, the barrier is modeled as the cost-increase attributable to an increase in fixed cost borne by multinational corporations attempting to establish an enterprise locally in a host country. This abstracts from the possibility that fixed costs may differ among firms because of variations in market size, distance from headquarters, and other factors. We further assume that we can interpret this cost increase as an ad valorem equivalent tariff on services transactions generally. 16 The effects on imports, exports, terms of trade, real wages, and the return to capital are given in Brown, Deardorff, and Stern (2002).

14
competitive, nonagricultural sectors, thereby producing negative scale effects in these sectors. The
effects of agricultural liberalization according to our model thus appear fairly small and reflect a complex
of differential and offsetting changes because both tariffs and subsidies are being reduced.17 Similar
negative welfare effects are also noted for Australia and New Zealand, both of which are net exporters of
agricultural products.
The results of the DR-2 33 percent reduction of post-Uruguay Round manufactures tariffs are
indicated in column (2) of table 1 and show an increase in global welfare of $267.3 billion. It is evident
that welfare increases in all of the countries/regions listed. The largest welfare gain is $81.2 billion for
EU/EFTA, while Japan’s gain is $65.0 billion and the U.S. gain is $36.5 billion. The welfare gains for
the developing countries/regions are much smaller in absolute terms, but, as a percentage of GNP, range
from 0.33 percent for the aggregate of Central America, Caribbean, and South America to 4.40 percent
for the Philippines.
As noted above, the Uruguay Round negotiations on services resulted in creation of the GATS,
but no significant liberalization of services barriers occurred. Following the conclusion of the Uruguay
Round, there have been successful multilateral negotiations to liberalize telecommunications and
financial services. While it would be desirable to assess the economic effects of these sectoral
agreements, we cannot do so here because of lack of data. What we have done then is to use the
estimates of services barriers mentioned above and assumed that these barriers are reduced by 33
percent.18 In column (3) of table 1, it can be seen that global welfare rises by $427.2 billion, which
exceeds the $267.3 billion welfare increase for manufactures liberalization. All of the countries/regions
listed experience positive welfare gains. The United States has a welfare gain of $134.8 billion,
17 In the model, the reductions in agricultural import tariffs will have the effects of tariff reductions already described. In the case of export subsidies, their effects will be to reduce world prices and raise domestic prices. When export subsidies are reduced, world prices would then rise and domestic prices in the subsidizing countries would fall, with the possible consequences that economic welfare may rise in the countries that reduce their export subsidies and fall in net-importing countries now facing higher world prices. Similarly, production subsidies will have the effect of reducing prices domestically and abroad. We should also note that we are treating agriculture as a single, aggregated sector in our model. Further, the GTAP-4 data on agricultural protection and subsidies may not capture fully the magnitudes of the different measures in actual use across products and countries. 18 It is important to emphasize that these estimates of services barriers are intended to be indirect approximations of what the actual barriers may be and thus should not be taken literally.
15
compared to $142.5 billion for EU/EFTA and $66.9 billion for Japan. There are sizable percentage
increases in welfare for the smaller industrialized and developing countries.
The results for the DR-4 scenario are a linear combination of the other three scenarios. Overall,
in column (4) of table 1, global welfare rises by $686.4 billion. The United States has a welfare gain of
$164.0 billion, EU/EFTA a gain of $227.0 billion, and Japan a gain of $132.6 billion. As already noted,
most of the smaller industrialized countries and the developing countries show sizable percentage
increases in welfare.19 Finally, DR-5 involves the removal of all barriers and corresponds to what we
consider as global free trade. Again, since our model is linear, the results for DR-5 are some three times
larger than for DR-4. The welfare gains for the United States are $497.0 billion (5.48 percent of GNP),
EU/EFTA, $688.0 billion (6.27 percent of GNP), and Japan, $401.9 billion (6.19 percent of GNP). The
percentage welfare increases for the other countries shown range from 2.56 percent of GNP for Indonesia
to 21.95 percent for Singapore.
III. Analysis of Regional Negotiating Options
The European Union, the United States, and Japan are all engaged in a number of negotiations
involving bilateral and regional trade arrangements. The European Union already has such a web of
preferential trade arrangements, with more scheduled and still more being negotiated, that to analyze
them here would be unduly cumbersome. Instead we focus on the smaller number of new arrangements
that have been proposed for the United States and Japan. For the United States, these include expansion
of the North American Free Trade Agreement (NAFTA) to include Chile and ongoing discussions and
negotiations for a Free Trade Area for the Americas (FTAA). Both the United States and Japan are
members of the Asia Pacific Economic (APEC) forum. There has also been some discussion of a so-
called ASEAN Plus 3 arrangement in which Japan, China/Hong Kong, and Korea would join together 19 It should be noted that our results differ from those obtained by Hertel, Hoekman, and Martin (2002, p. 121), who conclude that: “� the bulk of the gains go to developing countries, which are estimated to receive three quarters of the total gains from liberalizing manufacturing trade.” The differences in our results compared to Hertel et al. most likely stem from the assumptions made in projecting the database for the model to 2005. That is, Hertel et al. project significantly greater expansions of the output and trade of the developing countries than in our simpler extrapolations noted above. Other differences may reflect the imperfectly competitive structure of the Michigan model and the use of cost-price measures of services barriers.

16
with the members of the Association of South East Nations (ASEAN) in an FTA. In this section, we
report the results of regional scenarios that involve both the United States and Japan in the case of APEC,
an ASEAN Plus 3 FTA that involves Japan, an expansion of NAFTA to include Chile, and an
approximation to the FTAA that we refer to as a Western Hemisphere FTA (WHFTA) that involves the
United States.20 These scenarios are: RA-1: APEC trade liberalization – elimination of all bilateral post-Uruguay Round agricultural and
manufactures tariffs and services barriers among APEC countries.21 RA-2: ASEAN Plus 3 FTA – elimination of all bilateral post-Uruguay Round agricultural and
manufactures tariffs and services barriers among the ASEAN countries22 plus China/Hong Kong, Japan, and Korea.
RA-3: NAFTA-Chile FTA – elimination of all bilateral post-Uruguay Round agricultural and
manufactures tariffs and services barriers between the NAFTA members and Chile. RA-4: Western Hemisphere FTA (WHFTA) – elimination of all bilateral post-Uruguay Round
agricultural and manufactures tariffs and services barriers among the NAFTA members and Chile and an aggregate of countries comprising Central America and Caribbean and Other South America (CCS).23
Results
In each of these cases, our reference point is the post-Uruguay Round, 2005 database described
above together with the post-Uruguay Round tariff rates on agricultural products and manufactures and
the specially constructed measures of services barriers used in the Doha Round scenarios in Section II
preceding. Four scenarios have been carried out for each of the four arrangements noted: (A) removal of
agricultural tariffs24; (M) removal of manufactures tariffs; (S) removal of services barriers; and (C)
combined removal of agricultural and manufactures tariffs and services barriers. Because of space
20 In an Op Ed article in the Wall Street Journal, November 4, 2002, p. A14, USTR Robert B. Zoellick has reported that the United States plans to begin negotiations with five nations in Central America, five nations in Southern Africa, and ASEAN members to establish regional trading arrangements. 21 The membership of APEC is taken here to include: Australia; Canada; Chile; China; Hong Kong; Indonesia; Japan; Korea; Malaysia; Mexico; New Zealand; Philippines; Singapore; Taiwan; Thailand; and United States. 22 Taken here to include Indonesia, Malaysia, Philippines, Singapore, and Thailand. 23 The CCS aggregate comprises: Central America and Caribbean; Venezuela; Colombia; Rest of Andean Pact; Argentina; Brazil; Uruguay; and Rest of South America. 24 These regional scenarios make no allowance for reductions in agricultural export subsidies and agricultural production subsidies as was done in the multilateral scenario in the preceding section.

17
constraints, we report only the latter combined results, denoted RA-1C, �, RA-4C. The results of the
other scenarios are available on request.
RA-1C: APEC Trade Liberalization – This scenario treats APEC as a FTA and does not
make allowance for the “open regionalism” that APEC purportedly offers to non-members. If open
regionalism were to be pursued, it would mean in effect that APEC liberalization would be extended to
non-members who wished to become associated with or to join APEC. But presumably these non-
members would then themselves be required to eliminate their own trade barriers vis-à-vis the APEC
members. Since we cannot determine a priori how non-members of APEC would respond, we take the
closest approximation to open regionalism to correspond with our global free-trade scenario DR-5 in
table 1 above.
In table 2, the complete elimination of (post-Uruguay Round) APEC bilateral tariffs and services
barriers increases global welfare by $824.2 billion. Japan’s welfare increases by $318.1 billion (4.90
percent of GNP) and U.S. welfare increases by $244.2 billion (2.69 percent of GNP). There is little
evidence of trade diversion. It is interesting then to compare the bilateral removal of APEC trade barriers
with the removal of all global trade barriers in Scenario DR-5 noted above. The welfare gain from global
free trade, indicated earlier in table 1, is $2.19 trillion, which compares to a gain of $824.2 billion if all
tariffs and services barriers were removed bilaterally among the APEC member countries. The gains for
Japan and the United States from global free trade are $401.9 and $497.0 billion, respectively, compared
to $318.1 and $244.2 billion for complete APEC bilateral liberalization.
RA-2C: ASEAN Plus 3 – Table 2, column (2), contains the results of a FTA involving the
members of ASEAN together with China/Hong Kong, Japan, and South Korea.25 Complete removal of all
bilateral tariffs on agriculture and manufactures and services barriers increases global welfare by $282.6
25 For some background information on discussions relating to an ASEAN Plus 3 FTA, see Barry (2001). As reported by Amy Kazmin in the Financial Times, November 5, 2002, p. 6, the ASEAN members have signed a framework agreement with China to establish a comprehensive free trade area by 2010. The ASEAN members are also discussing a similar framework with Japan. However, according to a news report by Tom Wright in Wall Street Journal, December 2, 2002, p. 16, there is already mounting opposition in Southeast Asia to a FTA with China because of fears of import competition from Chinese goods..

18
billion. Japan’s welfare rises by $170.4 billion, and there are welfare increases for the ASEAN members
as well as for China/Hong Kong and South Korea. There is little evidence of trade diversion.
RA-3C: NAFTA-Chile FTA – Table 2, column (3), indicates the results of a FTA involving the
NAFTA member countries and Chile.26 The complete removal of all post-Uruguay Round bilateral tariffs
on agriculture and manufactures and services barriers vis-à-vis Chile increases global welfare by $5.8
billion. The welfare of the NAFTA members rises, with the largest absolute gain of $4.4 billion for the
United States. Chile’s welfare increases by $840 million, which is 1.05 percent of its GNP. There is
some evidence of trade diversion for a number of countries/regions.
RA-4C: Western Hemisphere Trade Agreement (WHFTA) – Discussions have been ongoing
for several years to create a Free Trade Area for the Americas (FTAA).27 The most recent efforts to move
forward in achieving a FTAA were held at the 2002 Ministerial meeting in Quito, Ecuador, in November
2002. Since the country detail in our model does not include the individual members of the FTAA, we
have chosen to approximate it by combining the United States, Canada, Mexico, and Chile with an
aggregate of the Central American and Caribbean and Other South American (CCS) nations into what we
refer to as a Western Hemisphere Free Trade Agreement (WHFTA). The effects of complete removal of
all bilateral tariffs on agriculture and manufactures and services barriers can be seen in table 2, column
(4), to increase global welfare by $83.5 billion. The welfare of the NAFTA members rises by $55.8
billion for the United States, $3.1 billion for Canada, and $3.1 billion for Mexico. The welfare of Chile
rises by $2.3 billion and the CCS aggregate by $19.2 billion. There is small evidence of trade diversion.
V. Conclusions and Implications for Policy
The Doha Development Round offers a wide variety of benefits for developing countries,
contingent on these being negotiated successfully. They include: world-wide liberalization in
agriculture permitting poor country farmers, especially, to compete in both domestic and world markets; 26 For a more comprehensive analysis of the accession of Chile to the NAFTA, see Brown, Deardorff, and Stern (2000). 27 See Office of the United States Trade Representative (20001a).
19
elaboration of the flexibility in the TRIPs Agreement that was promised in the Doha Declaration;
liberalization in services that may provide developing countries better and cheaper access to needed
services as well as scope for trade through the movement of natural persons; improved market access in
manufactured goods through reduced tariffs and (perhaps) rationalization of laws regarding administered
protection; technical assistance and capacity building supported by the WTO and its richer members; and
special treatment including free market access for the least developed countries. This is a long list of
opportunities, but it remains to be seen in every case whether the promised benefits will be achieved in
the negotiations.
In addition to discussing these potential benefits in qualitative terms, in this paper we have used
the Michigan Model of World Production and Trade to simulate those aspects of the Doha Round that we
are able to quantify. In particular, we have calculated the economic effects of the multilateral
liberalization of tariffs, agricultural subsidies, and barriers to trade in services that may be negotiated in
the Doha Round, as well as a variety of regional preferential trading arrangements. The overriding
conclusion that emerges from our model simulations of the Doha Round is that multilateral trade
liberalization has positive and often sizable impacts on economic welfare in all of the industrialized and
developing countries/regions covered in the Michigan Model.
A second conclusion is that while regional FTAs may be welfare enhancing for the member
countries directly involved, these welfare gains are considerably smaller than those resulting from
multilateral trade liberalization, and, in any case, the gains accrue in absolute terms primarily to the large
industrialized countries. Thus, the benefits of FTAs to the developing country partners appear somewhat
limited. It is also the case that the regional FTAs involve elements of trade diversion and are therefore
detrimental to some non-member countries.
While our research is by no means the last word on the subject, our computational results
nonetheless strongly suggest that the interests of developing countries may not be well served by the
negotiation of regional preferential trading arrangements. There is some danger accordingly that the
realization of the very significant benefits of multilateral liberalization may be jeopardized by pursuing

20
these arrangements.28 It is imperative therefore for the WTO member countries to move ahead
expeditiously in concluding the Doha Development Round.
28 In this connection, see de Jonquières (2002) for comment and analysis and a chart entitled, “Free trade the hard way,” which depicts the global maze and pathways of the numerous bilateral and regional agreements concluded, under way or planned, and being proposed as of November 2002.

21
References
Barry, Michael. 2001. “ASEAN Free-Trade Area Discussions on Including China, Japan, and South
Korea,” International Economic Review, United States International Trade Commission, USITC Publication 3402, January/February.
Brown, Drusilla K. and Robert M. Stern. 2001. “Measurement and Modeling of the Economic Effects of Trade and Investment Barriers in Services,” Review of International Economics 9:262-86.
Brown, Drusilla K., Alan V. Deardorff, and Robert M. Stern. 2000. “Computational Analysis of the Accession of Chile to the NAFTA and Western Hemisphere Integration,” The World Economy 23:145-74.
Brown, Drusilla K., Alan V. Deardorff, and Robert M. Stern. 2002a. “CGE Modeling and Analysis of Multilateral and Regional Negotiating Options,” in Robert M. Stern (ed.), Issues and Options for U.S.-Japan Trade Policies, University of Michigan Press.
Brown, Drusilla K., Alan V. Deardorff, and Robert M. Stern. 2003. “Multilateral, Regional, and Bilateral Negotiating Options for the United States and Japan,” World Economy, forthcoming.
de Jonquières, Guy. 2002. “The Challenges for the Multilateral Trade System,” Financial Times, November 19.
Harrison, W. J. and Ken Pearson. 1996. “Computing Solutions for Large General Equilibrium Models using GEMPACK” Computational Economics 9:83-127.
Hertel, Thomas W. 2000. “Potential Gains from Reducing Trade Barriers in Manufacturing, Services and Agriculture,” Federal Reserve Bank of St. Louis Review 82:77-99.
Hertel, Thomas W., Bernard M. Hoekman, and Will Martin. 2002. “Developing Countries and a New Round of WTO Negotiations,” The World Bank Research Observer 17:113-40.
Hertel, Thomas W. and Will Martin. 1999. “Would Developing Countries Gain from Inclusion of Manufactures in the WTO Negotiations?” Presented at the Conference on the “WTO and the Millennium Round,” Geneva, September 20-21.
Hoekman, Bernard. 2000. “The Next Round of Services Negotiations: Identifying Priorities and Options,” Federal Reserve Bank of St. Louis Review 82:31-47.
Kazmin, Amy. 2002. “ASEAN leaders and China sign deal for free trade area,” Financial Times, November 5, p. 6.
McDougall, Robert et al. 1998. Global Trade: Assistance and Protection: GTAP-4 Database, Purdue University, W. Lafayette, IN.
Stolper, Wolfgang and Paul A. Samuelson. 1941. "Protection and Real Wages," Review of Economic Studies 9:58-73.
22
Wilson, John S., Catherine Mann, Yuen Pau Woo, Nizar Assanie, and Inbom Choi, 2002. Trade Facilitation: A Development Perspective in the Asia Pacific Region, Asia Pacific Economic Cooperation, (October).
World Trade Organization. 2002a. “Declaration on the TRIPS Agreement and Public Health,” adopted 14 November, WT/MIN(01)/DEC/2.
World Trade Organization. 2002b. “Ministerial Declaration,” adopted 14 November, WT/MIN(01)/DEC/1.
Wright, Tom. 2002. “Southeast Asia Starts to Flinch at Trade with China,” Wall Street Journal, December 2, p. 16.
Zoellick, Robert B. 2002. “Free Trade, Free People,” Wall Street Journal, November 14, p. A-14.
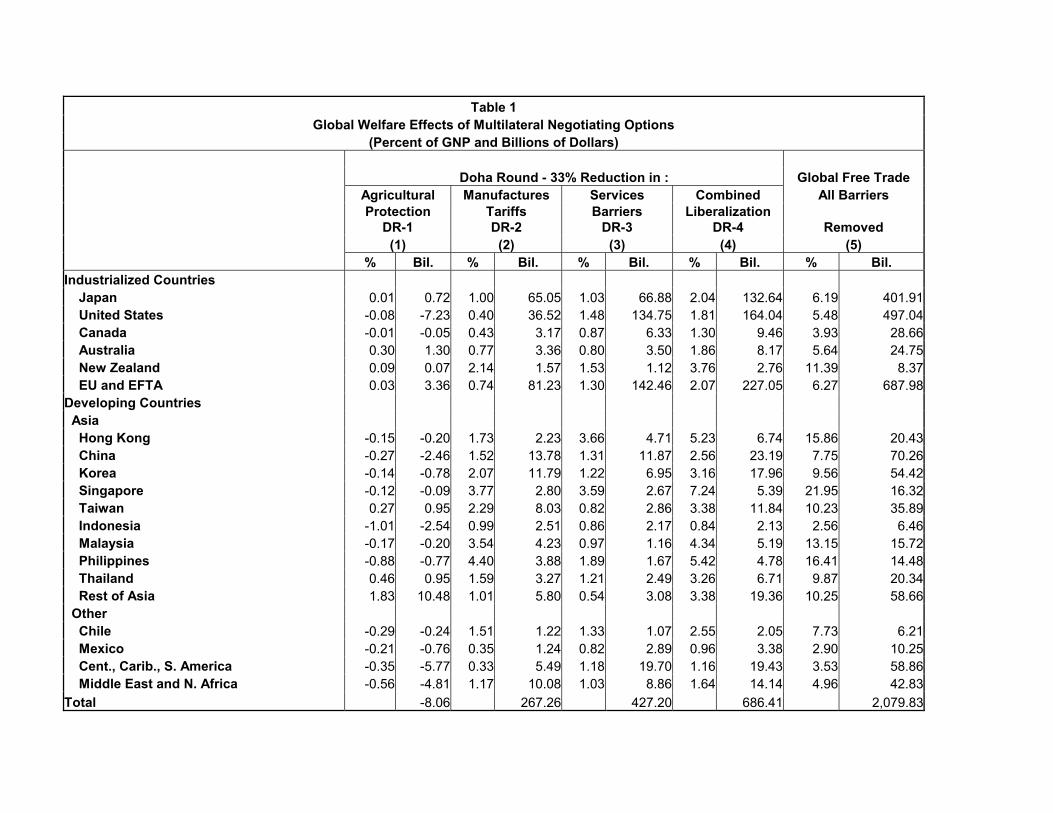
Table 1 Global Welfare Effects of Multilateral Negotiating Options
(Percent of GNP and Billions of Dollars) Doha Round - 33% Reduction in : Global Free Trade
Agricultural Manufactures Services Combined All Barriers
Protection
DR-1 Tariffs DR-2
Barriers DR-3
Liberalization DR-4 Removed
(1) (2) (3) (4) (5) % Bil. % Bil. % Bil. % Bil. % Bil. Industrialized Countries Japan 0.01 0.72 1.00 65.05 1.03 66.88 2.04 132.64 6.19 401.91 United States -0.08 -7.23 0.40 36.52 1.48 134.75 1.81 164.04 5.48 497.04 Canada -0.01 -0.05 0.43 3.17 0.87 6.33 1.30 9.46 3.93 28.66 Australia 0.30 1.30 0.77 3.36 0.80 3.50 1.86 8.17 5.64 24.75 New Zealand 0.09 0.07 2.14 1.57 1.53 1.12 3.76 2.76 11.39 8.37 EU and EFTA 0.03 3.36 0.74 81.23 1.30 142.46 2.07 227.05 6.27 687.98Developing Countries Asia Hong Kong -0.15 -0.20 1.73 2.23 3.66 4.71 5.23 6.74 15.86 20.43 China -0.27 -2.46 1.52 13.78 1.31 11.87 2.56 23.19 7.75 70.26 Korea -0.14 -0.78 2.07 11.79 1.22 6.95 3.16 17.96 9.56 54.42 Singapore -0.12 -0.09 3.77 2.80 3.59 2.67 7.24 5.39 21.95 16.32 Taiwan 0.27 0.95 2.29 8.03 0.82 2.86 3.38 11.84 10.23 35.89 Indonesia -1.01 -2.54 0.99 2.51 0.86 2.17 0.84 2.13 2.56 6.46 Malaysia -0.17 -0.20 3.54 4.23 0.97 1.16 4.34 5.19 13.15 15.72 Philippines -0.88 -0.77 4.40 3.88 1.89 1.67 5.42 4.78 16.41 14.48 Thailand 0.46 0.95 1.59 3.27 1.21 2.49 3.26 6.71 9.87 20.34 Rest of Asia 1.83 10.48 1.01 5.80 0.54 3.08 3.38 19.36 10.25 58.66 Other Chile -0.29 -0.24 1.51 1.22 1.33 1.07 2.55 2.05 7.73 6.21 Mexico -0.21 -0.76 0.35 1.24 0.82 2.89 0.96 3.38 2.90 10.25 Cent., Carib., S. America -0.35 -5.77 0.33 5.49 1.18 19.70 1.16 19.43 3.53 58.86 Middle East and N. Africa -0.56 -4.81 1.17 10.08 1.03 8.86 1.64 14.14 4.96 42.83Total -8.06 267.26 427.20 686.41 2,079.83

Table 2 Global Welfare Effects of Regional Negotiating Options
(Percent of GNP and Billions of Dollars) APEC FTA ASEAN+3 FTA NAFTA-Chile WHFTA (1) (2) (3) (4) % Bil. % Bil. % Bil. % Bil. Industrialized Countries Japan 4.90 318.09 2.62 170.39 0.00 0.14 0.01 0.55 United States 2.69 244.25 0.14 12.98 0.05 4.41 0.62 55.85 Canada 2.26 16.44 0.12 0.87 0.04 0.31 0.42 3.08 Australia 3.72 16.33 0.40 1.77 0.00 -0.01 -0.01 -0.04 New Zealand 7.36 5.40 0.42 0.31 0.00 0.00 0.00 0.00 EU and EFTA 0.04 4.11 0.04 4.29 0.00 -0.03 0.00 -0.40 Developing Countries Asia Hong Kong 13.62 17.54 0.16 0.21 0.00 0.01 -0.01 -0.02 China 5.48 49.63 1.95 17.66 0.00 -0.03 0.00 -0.04 Korea 7.45 42.38 4.21 23.94 0.00 -0.03 -0.03 -0.19 Singapore 16.34 12.15 10.66 7.93 0.01 0.00 0.05 0.04 Taiwan 9.41 32.98 3.08 10.80 0.00 0.02 0.03 0.09 Indonesia 4.15 10.49 2.29 5.80 0.00 0.00 0.00 -0.01 Malaysia 10.18 12.17 6.44 7.70 0.01 0.01 0.09 0.11 Philippines 14.41 12.72 7.28 6.42 0.01 0.01 0.02 0.01 Thailand 5.69 11.71 2.60 5.36 0.00 0.00 0.00 0.00 Rest of Asia -0.10 -0.58 -0.04 -0.22 0.00 0.00 0.00 -0.01 Other Chile 4.47 3.59 0.57 0.46 1.05 0.84 2.84 2.28 Mexico 1.83 6.44 0.00 0.00 0.12 0.43 0.87 3.07 Cent., Carib., S. America 0.08 1.41 0.10 1.66 -0.01 -0.20 1.15 19.24 Middle East and N. Africa 0.80 6.88 0.50 4.29 0.00 -0.03 -0.02 -0.15 Total 824.15 282.61 5.85 83.47