Embed Size (px)
Citation preview

PN 1350
DEVELOPING BIOCRITERIA AS A WATER QUALITY ASSESSMENT TOOL IN
CANADA: SCOPING ASSESSMENT
DISCLAIMER This report was prepared by Golder Associates Limited. This report is a working paper only. It contains information which has been prepared for, but not approved by, the Canadian Council of Ministers of the Environment (CCME). CCME is committed to reflect the highest standards of research and analysis in its publications. Since CCME itself does not conduct research or author reports, it is not responsible for the accuracy of the data contained in this report and does not warrant, or necessarily share or affirm, in any way, any opinions expressed therein. PN 1350 © Canadian Council of Ministers of the Environment 2006
Initial Report Prepared by:
Paul McElligott
Golder Associates Limited 195 Pemberton Avenue
North Vancouver BC V7P 2R4
ACKNOWLEDGEMENTS
This project was undertaken under the guidance of the Biocriteria Sub-Group (Sushil Dixit - Chair, Tim Fletcher, Don Fox, Isabelle Guay, Narender Nagpal, and Paul Jiapizian) of the CCME Water Quality Task Group (WQTG). The initial report prepared by Paul McElligott (Golder Associates Ltd.), under contract with CCME, was finalized by Sushil Dixit (National Guidelines and Standards Office, Environment Canada) on behalf of the WQTG. Many thanks to WQTG members and their biocriteria experts for reviewing the report and/or providing support throughout this initiative (Haseen Khan, Joanne Sweeney - Newfoundland-Labrador; Don Fox - New Brunswick; Bruce Raymond, Cindy Crane - Prince Edward Island; Darrell Taylor - Nova Scotia; Isabelle Guay, Lyne Pelletier – Québec; Tim Fletcher, Chris Jones, Keith Somers – Ontario); Nicole Armstrong – Manitoba; Sam Ferris – Saskatchewan; Richard Casey – Alberta; Narender Nagpal, Ian Sharp, Julia Beatty - British Columbia; Bob Truelson - Yukon; Francis Jackson - Northwest Territories).
For the preparation of this report it was critical to collect and incorporate biocriteria and bioassessment activities carried out by various jurisdictions. For this purpose various experts were contacted in Canada and overseas. Sincere thanks to the following experts who provided valuable information: Donald Baird (Environment Canada), Patricia Chambers (Environment Canada), Don Charles (Academy of Natural Sciences of Philadelphia), Bruce Chessman (NSW Department of Infrastructure, Planning and Natural Resources, Australia), Nelda Craig (New Brunswick Department of Environment and Local Government), Cindy Crane (Prince Edward Island Department of Environment, Energy and Forestry), John Davy-Bowker (Centre for Ecology and Hydrology, Dorset, UK), Monique Dubé (Environment Canada), Benoit Godin (Environment Canada), Lee Grapentine (Environment Canada), Gretchen Hayslip (US EPA), Murray Hilderman (Saskatchewan Environment and Resource Management), Francis Jackson (Department of Indian and Northern Affairs), Chris Jones (Ontario Ministry of the Environment), Jim Kurtenbach (US EPA), Isabelle Lavoie (Trent University), Shalom Mandaville (Soil and Water Conservation Society of Metro Halifax), Leigh Noton (Alberta Environment), Renee Paterson (Newfoundland and Labrador Department of Environment and Conservation), Lyne Pelletier (Ministère de Développement durable, de l'Environnement et des Parcs du Québec), Ian Sharpe (BC Ministry of Water, Land and Air Protection); Bill Simmons (MCHD, New Jersey), Ron Small (City of Greensboro Stormwater Management Division, North Carolina), Jan Stevenson (Michigan State University), and Jennifer Winter (Ontario Ministry of Environment). They are in no way responsible for the accuracy of the information presented in this report, nor do they necessarily share any conclusions drawn or opinions made in this report.
- i -
EXECUTIVE SUMMARY
The Canadian Council of Ministers of the Environment (CCME) recognizes the advantages of establishing biological criteria (biocriteria) to complement chemical and toxicological criteria for assessing environmental quality and ecosystem integrity. This report was commissioned by CCME to provide a review of the available information regarding biocriteria currently used in Canadian and international jurisdictions, and to evaluate the potential of using biocriteria as a line of evidence − in addition to water and sediment chemistry and toxicology − for assessing the ecological integrity of Canadian surface waters.
In Canada and Australia, the federal governments do not exercise coordination or enforcement over provincial and local bioassessment initiatives, nor is there any legislated requirement for bioassessments to use nation-wide biocriteria, as is the case with criteria for sediment or soil quality, for example. The impetus for biomonitoring is regional, and national-level coordination among jurisdictions is therefore limited. In most cases biomonitoring programs are undertaken without legislated biocriteria targets.
In the United States (US), the Clean Water Act (CWA) requires that states undertake bioassessments, and that attainment of water quality objectives be assessed using biocriteria. Although the US Environmental Protection Agency (EPA) provides national guidance on bioassessments and biocriteria, it does not define regulations – which are under the jurisdiction of individual states or other agencies − nor does it assign interpretations to biocriteria. Consequently, different states use a range of different bioassessment methods to assess biological assemblages and biocriteria to evaluate the status of water quality.
The United Kingdom (UK), as part of the European Union (EU), must comply with the EU’s recently developed Water Framework Directive (WFD). The WFD requires that member countries define the ecological status of their surface waters relative to a near-natural “reference” condition. Under the WFD, there is a mandate to attain “good” water quality status in all streams by 2015, and in order to have all individual measurement and bioassessment tools intercalibrated (i.e., so that “good” measured by one country is equivalent to “good” measured in another), converters or other methods for integrating these assessment tools are under development.
Worldwide, multimetric and multivariate approaches are used for defining biocriteria, and benthic macroinvertebrates are the most commonly-used organisms, followed by fish and aquatic plants (e.g., algae, macrophytes).
Multimetric bioassessments describe water quality and the health of the aquatic ecosystem using a series of “metrics”, numerical values which represent different aspects (e.g., taxonomic richness, taxonomic composition, pollution tolerance) of the biological
- ii -
indicator communities. Values obtained for the various metrics are combined to generate a single index value, which can then be compared to values obtained from sites with known levels of biological degradation (e.g., Benthic Index of Biotic Integrity used in the US).
In contrast to multimetric approaches, multivariate bioassessment approaches typically rely on multivariate statistics to model the relationship between environmental variables and biological communities at unimpacted (reference) sites. The expected community structure of a test site under the reference condition is predicted based on its habitat characteristics, and the structure of the observed community is compared with that of the expected community. Three of the main multivariate bioassessment programs currently in use worldwide are the UK’s River Invertebrate Prediction and Classification System (RIVPACS), Environment Canada’s Reference Condition Approach (RCA), and the Australian River Assessment Scheme (AUSRIVAS).
After examining the relative merits of multimetric and multivariate approaches to defining biocriteria, it is concluded that the multivariate RCA that incorporates multiple biological indicators, supplemented by metrics and indices, can be adapted for use in a nation-wide Canadian biocriteria program.
The RCA approach has already been developed and piloted in two areas of Canada. Appropriate reference sites can be chosen based on advice from local experts, or based on ground and air reconnaissance. The RCA approach does not require a priori identification of specific anthropogenic impacts and the effects of these impacts on biological communities, although researchers may qualitatively or quantitatively assess sites to ensure they are subject to little or no anthropogenic stress. The approach is therefore useful as an investigative tool to identify potentially impacted sites that require further study to identify stressors.
Challenges in developing a national biocriteria employing the RCA include the high initial cost of collecting sufficient samples to define reference conditions across the numerous regions of Canada, and the need for a significant nation-wide commitment to implement a standardized sampling and analysis protocol, and to create numeric or descriptive standards of the desired state of biological assemblages (i.e., the biocriteria). In addition, any nation-wide biocriteria program should ideally be able to incorporate the results of existing and historic data-collection efforts − including data for which multimetric indices have been calculated − so as not to lose historical data.
- iii -
TABLE OF CONTENTS
SECTION PAGE
1.0 Introduction............................................................................................................. 2 2.0 Methods................................................................................................................... 4 3.0 Results..................................................................................................................... 6
3.1 Impetus for Biocriteria................................................................................ 6 3.1.1 Canada..............................................................................................6 3.1.2 Australia...........................................................................................7 3.1.2 United States of America .................................................................7 3.1.3 United Kingdom...............................................................................8 3.1.4 European Community ......................................................................8
3.2 Development and Use of Biocriteria......................................................... 10 3.2.1 Multimetric Approaches ................................................................10 3.2.2 Washington State Puget Sound Lowlands B-IBI System..............12 3.2.3 Ohio Environmental Protection Agency Watershed Classification
System............................................................................................14 3.3 Multivariate Approaches........................................................................... 16
3.3.1 River Invertebrate Prediction and Classification System (RIVPACS) ....................................................................................16
3.3.2 Reference Condition Approach (RCA)...........................................17 3.3.3 Australian River Assessment Scheme (AUSRIVAS)....................19 3.3.4 State of Maine Water Classification Program ...............................21
3.4 Indicator Organisms used for Bioassessment and Biocriteria .................. 22 3.5 Bioassessment Activities and Biocriteria Use .......................................... 25
3.5.1 Canada............................................................................................25 3.5.2 United States of America ...............................................................28 3.5.3 United Kingdom.............................................................................30 3.5.4 Australia.........................................................................................31
4.0 Conclusions and Recommendations ..................................................................... 32 4.1 Selection of Indicator Organisms.............................................................. 32 4.2 Development of National Standards for Data Collection and Storage ..... 34 4.3 Multivariate vs. Multimetric-Based Biocriteria........................................ 35 4.4 Setting Biocriteria Values ......................................................................... 38
5.0 References............................................................................................................. 40 6.0 Personal Communications .................................................................................... 46
- iv -
List of Tables Table 1. Potential metrics for benthic macroinvertebrates, fish, and periphyton (from
Barbour et al. 1999).
Table 2. Interpretation of the Puget Sound’s five and ten-metric B-IBI’s (from Kleindl 1995; http://www.cbr.washington.edu/salmonweb/bibi/biomonitor.html#inscore).
Table 3. The State of Ohio aquatic life use designations (from Yoder and Rankin 1998).
Table 4. State of Ohio biocriteria values for fish and benthic macroinvertebrates (from USEPA 2002a).
Table 5. AUSRIVAS banding schemes (from Simpson and Norris 2000).
Table 6. State of Maine narrative aquatic life and habitat standards for rivers, streams, and impoundments, from highest to lowest quality (from Davies et al 1999).
Table 7. Data analysis tools used in State monitoring programs in the USA (EPA 2002).
Table 8. Comparison of the multivariate and multimetric approaches to bioassessment. List of Figures Figure 1. Schematic representation of the relationship between ecological integrity and
physical, chemical, and biological integrity (from Barbour et al. 2000).
Figure 2. Example of a taxa ordination plot from RCA-BEAST (ordination ellipses); reference sites are shown as black dots and theoretical test sites are shown as red dots. The 90% ellipse indicates potentially stressed sites, the 99% ellipse indicates stressed sites and the 99.9% ellipse indicates severely stressed benthic macroinvertebrate communities from Environment Canada 2003).
List of Appendices Appendix 1. Field Datasheet Form
Appendix 2. List of Documents Reviewed
- 1 -
LIST OF ACRONYMS
AUSRIVAS AUStralian RIVer Assessment System BEAST BEnthic Assessment of SedimenT B-IBI Benthic Index of Biotic Integrity BIRC Benthic Information system for Reference Conditions BMWP Biological Monitoring Working Party CABIN Canadian Aquatic BIomonitoring Network CCME Canadian Council of Ministers of the Environment CEAA Canadian Environmental Assessment Agency CEH Centre for Ecology and Hydrology CWA Clean Water Act DEH Department of the Environment and Heritage ECBP Eastern Corn Belt Plains EEM Environmental Effects Monitoring EOLP Eastern-Ontario Lake Plain EMAP Environmental Monitoring and Assessment Program EPA Environmental Protection Agency EPT Ephemeroptera, Plecoptera, Trichoptera EQG Environmental Quality Guidelines EU European Union EWH Exceptional Warmwater Habitat FAME Fish-based Assessment Method for the ecological status of European rivers HADD Harmful Alteration, Disruption or Destruction HBI Hilsenhoff Biotic Index HELP Huron Erie Lake Plain IBI Index of Biotic Integrity ICI Invertebrate Community Index IP Interior Plateau LRW Limited Resource Water MDA Multiple Discriminant Analysis MDFA Multiple Discriminant Function Analysis MIwb Modified Index of Well-Being MMER Metal Mining Effluent Regulations MWH Modified Warmwater Habitat NAWQA National Water Quality Assessment NWRI National Water Research Institute OBBN Ontario Benthos Biomonitoring Network RCA Reference Condition Approach RIVPACS River Invertebrate Prediction and Classification System RPBs Rapid Bioassessment Protocols SEPA Scottish Environmental Protection Agency SMWCP State of Maine Water Classification Program STAR STAndardisation of River Classifications STORET data STOrage and RETrieval system TIA Total Impervious Area UK United Kingdom UPGMA Unweighted Pair-Group Mean arithmetic Averaging US United States US EPA United States Environmental Protection Agency WAP Western Allegheny Plateau WFD Water Framework Directive WPCA Water Pollution Control Act WQS Water Quality Standards WQTG Water Quality Task Group WWH Warm Water Habitat
- 2 -
1.0 INTRODUCTION
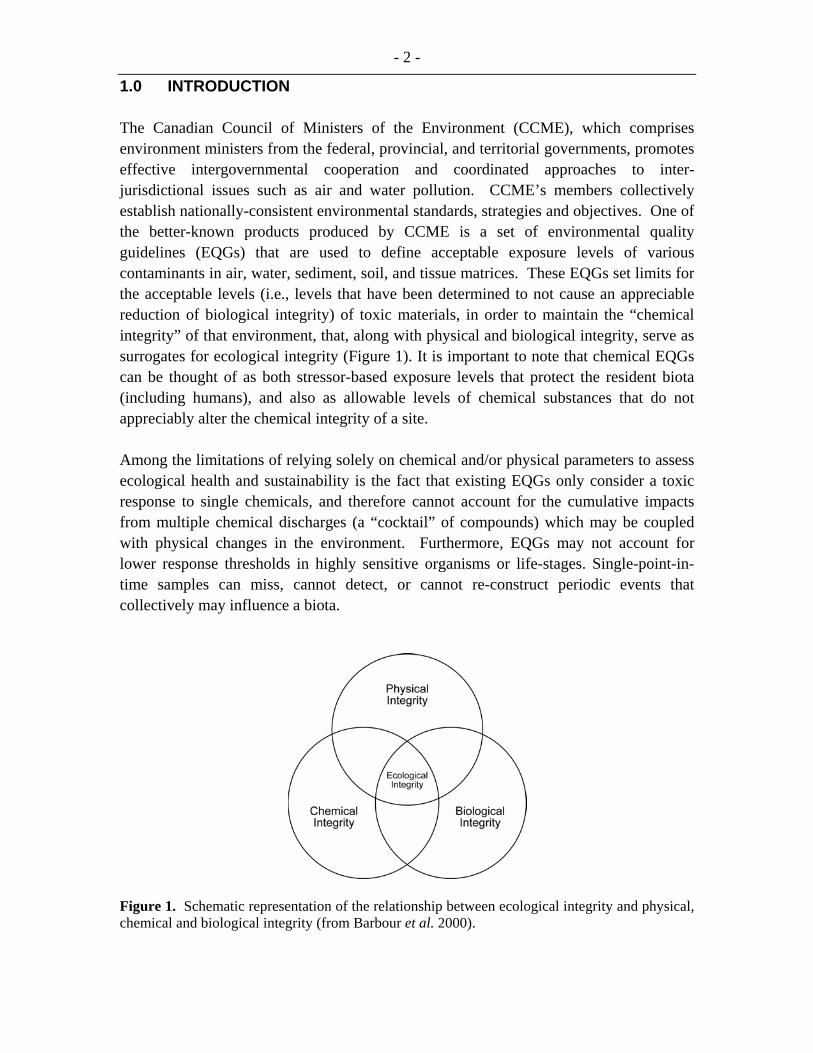
The Canadian Council of Ministers of the Environment (CCME), which comprises environment ministers from the federal, provincial, and territorial governments, promotes effective intergovernmental cooperation and coordinated approaches to inter-jurisdictional issues such as air and water pollution. CCME’s members collectively establish nationally-consistent environmental standards, strategies and objectives. One of the better-known products produced by CCME is a set of environmental quality guidelines (EQGs) that are used to define acceptable exposure levels of various contaminants in air, water, sediment, soil, and tissue matrices. These EQGs set limits for the acceptable levels (i.e., levels that have been determined to not cause an appreciable reduction of biological integrity) of toxic materials, in order to maintain the “chemical integrity” of that environment, that, along with physical and biological integrity, serve as surrogates for ecological integrity (Figure 1). It is important to note that chemical EQGs can be thought of as both stressor-based exposure levels that protect the resident biota (including humans), and also as allowable levels of chemical substances that do not appreciably alter the chemical integrity of a site.
Among the limitations of relying solely on chemical and/or physical parameters to assess ecological health and sustainability is the fact that existing EQGs only consider a toxic response to single chemicals, and therefore cannot account for the cumulative impacts from multiple chemical discharges (a “cocktail” of compounds) which may be coupled with physical changes in the environment. Furthermore, EQGs may not account for lower response thresholds in highly sensitive organisms or life-stages. Single-point-in-time samples can miss, cannot detect, or cannot re-construct periodic events that collectively may influence a biota.
Figure 1. Schematic representation of the relationship between ecological integrity and physical, chemical and biological integrity (from Barbour et al. 2000).
- 3 -
Biological integrity is defined by Karr and Dudley (1981) as “the ability to support and maintain a balanced, integrated adaptive assemblage of organisms having species composition, diversity, and functional organization comparable to that of natural habitat of the region”. It is measured using the results of biological assessments (bioassessments), and the attainment of biological integrity, or divergence from it, is measured using biological criteria (or biocriteria). Biological integrity is monitored using effect-based techniques (i.e., bioassessment), where the status or health of resident biological communities are evaluated using biocriteria to assess the effects of various physical and chemical stressors. For the purposes of this report, biocriteria are defined as “narrative or numeric expressions that describe the desirable structure and function of aquatic communities, and therefore serve as standards against which bioassessment results can be compared”.
CCME recognizes the advantages of including biocriteria with chemical, physical, and toxicological criteria in a broad-based approach to assessing ecosystem integrity. Although it will always be necessary to assess levels of chemicals in the environment (e.g., to establish cause-effect relationships between chemical contaminants and observed changes in biological community structure, to predict risks to human health and wildlife, and to diagnose, model and regulate water quality), using biological tools to evaluate environmental health offers additional information over physico-chemical approaches, in that the “health” of a water body’s resident biological community reflects the combined effects of water chemistry, sediment chemistry, physical habitat characteristics, hydrology, nutrient levels, and food availability. Bioassessment therefore provides an integrated assessment of the receiving environment’s long-term assimilation of disturbances.
A key deficiency in biological versus physico-chemical assessments lies in the high natural variability characteristic of biotic communities, and the challenges of capturing this variability during data collection and interpretation. For example, the behaviour and phenology of a species or individual makes it difficult to assess whether an organism which is not collected is not actually present in a stream, or whether it merely appears to be absent because it is in a dormant or hidden stage at the time of sampling
In the context of environmental assessment, then, biocriteria should be considered to supplement, rather than replace, chemical, physical, or toxicological criteria. Even if effective biocriteria are established, it will remain necessary to monitor levels of chemicals in the environment, the physical integrity of the habitat, and the effects of chemicals on living organisms. In the context of environmental assessment, the number and type of tools required to identify impacts is proportional to the complexity of the land and water uses, the degree of perceived hazard, and the potential cost of remediation. This can be defined as a “weight of evidence approach to adaptive management” – the greater the complexity and potential hazard, the greater is the need for the use of a range of tools.
- 4 -
The objective of this report was to collect the information regarding bioassessment activities and their related biocriteria (if present) in use in Canadian and selected international jurisdictions, and to evaluate the potential of these biocriteria for assessing environmental quality in Canadian surface waters. The main focus of information collection was from federal, provincial, and municipal jurisdictions within Canada, with additional information from the US, UK, EU, and Australia.
2.0 METHODS
The information used to compile this report was obtained primarily from individuals who had developed or used the biocriteria, as well as from the published literature. A standard “field guide” form (Appendix 1) was developed to guide our interviews and data collection. Key types of information requested by the questionnaire included:
• The types of biomonitoring and bioassessment activities being undertaken;
• The narrative and/or numeric biocriteria used (if any);
• Spatial and temporal scopes of bioassessment and/or biocriteria initiatives; and
• The validity, strengths and relative weaknesses of the biocriteria tools used.
Contact information for individuals familiar with biocriteria and bioassessment programs in various Canadian federal, provincial, and territorial jurisdictions was provided by members of CCME’s Water Quality Task Group (WQTG). The WQTG representative from the Northwest Territories was able to provide us with details of the biocriteria/biomonitoring program himself for his jurisdiction.
A total of 16 individuals from Canada were interviewed, four from the federal government (Environment Canada), and 11 from provincial or territorial governments. An individual from the Soil and Water Conservation Society of Metro Halifax was able to provide the information on Nova Scotia’s bioassessment initiatives.
The scope of our review did not permit us to conduct an extensive program of international interviews, but we were able to contact individuals from three countries (US, UK, and Australia) that are known to have well-developed, bioassessment and biocriteria programs. Interviewees from the US included representatives of the US Environmental Protection Agency (US EPA) Regions II and X, the US Academy of Natural Sciences, Michigan State University, and two regional government representatives (Greensboro, NC and Monmouth County, NJ). Individuals from the Australian federal Department of Environment and Heritage, and the Centre for Natural Resources, and from the UK’s Environment Agency and Centre for Ecology and Hydrology (CEH) were also contacted.
- 5 -
Once suitable contact individuals were identified, interviews were conducted primarily over the telephone, although some contacts preferred to fill out an electronic version of the field-guide questionnaire, and return it via email.
A total of 36 publications were examined during our literature review. These documents had either identified by interviewees as being relevant to the review, or through an on-line literature review using the following resources:
• Aquatic Sciences and Fisheries Abstracts (ASFA) (2002 onward);
• AGRICOLA (AGRICultural OnLine Access);
• BIOSIS Previews (1969 onward);
• Environment Abstracts (1975 onward);
• Web of Science Version 7.1;
• Northwest Fisheries Science Center (USNOAA) publications;
• Langhei Ecology Biocriteria Bibliography;
• Library Catalogues:
o WAVES from the Department of Fisheries and Oceans Canada,
o the BC Ministry of Forests / Ministry of Sustainable Resource Management (including the Ecosystems Report Catalogue [EcoCat]),
o Simon Fraser University,
o University of British Columbia,
o US EPA Online Library System,
o Alaska Resources Library and Information Services (ARLIS). A full list of reviewed documents is provided in Appendix 2.
At the conclusion of interviews and literature review, the collected data were collated to identify key biomonitoring and biocriteria initiatives being undertaken in the various jurisdictions. Answers to sub-questions on the field guide questionnaire were entered into a data matrix spreadsheet in order to assess general trends. The information provided by the interview process formed the basis of findings and recommendations, including best practices for collection and assessment of biological data which can be adopted in national biomonitoring initiatives and establishment of biocriteria guidelines.
- 6 -
3.0 RESULTS
3.1 Impetus for Biocriteria
3.1.1 Canada
At the present time, the main impetus for the creation of nationally applicable biocriteria for surface waters in Canada is the federal Fisheries Act. This is the main piece of federal legislation that affords protection to aquatic organisms and habitats. Although the Fisheries Act is primarily concerned with the protection of commercially-utilized fish species, it extends protection to the waters that provide habitat for these fish, or which contribute flow and nutrients to fish-bearing waters. Two of the key environmental protection provisions of the Fisheries Act are section 35(1):
“No person shall carry on any work or undertaking that results in the harmful alteration, disruption or destruction [HADD] of fish habitat”
and section 36:
“No person shall deposit or permit the deposit of a deleterious substance of any type in water frequented by fish”.
Through these two sections, the Fisheries Act provides the basis for regulating the release or creation of anthropogenic stressors to the aquatic environment, for example through chemical discharges or physical impacts. However, the Fisheries Act does not specifically identify the need for aquatic biomonitoring per se, except in the context of nation-wide environmental effects monitoring (EEM) programs for metal mines and pulp and paper mills conducted under specific regulations under the Fisheries Act. Canada’s federal government does not coordinate or enforce provincial or local aquatic biomonitoring programs, nor does it define nationally applicable numeric or narrative aquatic biocriteria values.
Because most of the impetus for aquatic biomonitoring occurs at the municipal or provincial level in Canada, and since coordination among provincial and territorial jurisdictions is generally lacking, regional biomonitoring programs vary widely across the country in terms of their sampling and analysis methods. In most cases, regional biomonitoring programs are undertaken without defined biocriteria values that explicitly describe the desired state of the biota they are monitoring. In cases where biocriteria are being used, they are usually employed as a tool for interpreting bioassessment results, and not as an endpoint used in a regulatory sense to determine the level of impairment of biological integrity, and if specific mitigative actions must be undertaken to address the impairment.
- 7 -
3.1.2 Australia
The momentum for biological monitoring in Australia began in earnest in 1994, when all eight Australian state governments met through the Council of Australian Governments and agreed to establish a Water Reform Framework (DEH 2004). This framework was created to encourage major reforms and reverse degradation of the national water resource system. The environmental components of the Water Reform Framework are supported by the National River Health Program, which has produced a national assessment of the health of the nation's inland waters using the AUSRIVAS assessment scheme (CRC for Freshwater Ecology 2004).
Although bioassessment occurs in Australia, like Canada, it has not adopted national-level legally-defined biocriteria. Bruce Chessman with the Centre for Natural Resources, State of New South Wales Department of Infrastructure, Planning and Natural Resources stated there is not a lot of use of biological criteria in regulation in Australia; although the Victorian State Environment Protection Policy incorporates some biological objectives, he was not aware of anything comparable in other states (B. Chessman, pers. comm.). In the state of Western Australia, the adoption of the AUSRIVAS approach at a State level is slow; within the state there is no legislation that explicitly requires biomonitoring, and budgetary cutbacks within the State government agencies make it difficult to fund the widespread use of AUSRIVAS. Despite these setbacks, agencies are already using data from AUSRIVAS for management purposes and recognize that AUSRIVAS is a useful tool for state of the environment reporting and compliance monitoring (Halse et al. 2002).
3.1.2 United States of America
The federal United States Environmental Protection Agency (US EPA) explicitly defines biocriteria as “numerical measures or narrative descriptions of biological integrity” and “designated aquatic life use classifications which can also function as narrative biological criteria” (EPA 1991). The development of biocriteria in the US began with the 1972 federal Clean Water Act (CWA) (EPA 2002a). Sections 303 and 304 of the CWA, as well as its amendments, provide the legal impetus for the use of bioassessments and biocriteria in state and tribal water quality programs (US EPA 2002a). The CWA requires that all states submit a section 303(d) list of impaired waters (e.g., stream segments, lakes, estuaries) for review by the US EPA every two years (Volstad et al. 2004). By law, each state is required to assess the extent to which its waters provide for the protection and propagation of balanced indigenous populations of shellfish, fish, and wildlife, in addition to assessing the impacts of chemical pollutants. In 1999, the US EPA Office of Water stated the goal that “all states/tribes will use bioassessments/biocriteria to evaluate the health of aquatic life in all waterbodies, and that numeric biocriteria will be adopted in all state/tribal water quality standards” (US EPA 2002a).
- 8 -
After the CWA was promulgated, it became evident that the tools for measuring attainment of its objectives were not organized at a national level or, in some cases, not yet available (R.J. Stevenson, pers. comm.). In the mid-1980’s the US EPA convened a national workgroup to provide technical guidance for the biological assessments required to meet the objectives of the CWA and, in 1989, published their national approach to bioassessment, the Rapid Bioassessment Protocols (RBPs). A document entitled Biological Criteria: National Program Guidance for Surface Waters was published in 1990, and procedures for initiating narrative biological criteria were released in 1992. Both of these documents provide guidance to states and tribes for meeting their responsibilities under the CWA. In 1999, updated versions of the RBPs were produced.
Although the US EPA provides national guidance concerning biocriteria and bioassessments, it does not define regulations – which are under the jurisdiction of individual states, tribes, territories, and interstate agencies – nor does it assign interpretations to biocriteria (R.J. Stevenson, pers. comm.). The US EPA has no authority with respect to the bioassessment methods used; therefore there remains considerable variation among states in terms of their state-specific biomonitoring methods and biocriteria values.
3.1.3 United Kingdom
Prior to the creation of the European Union (EU), a variety of biomonitoring and bioassessment methods were used to monitor and assess watercourses in the UK, with limited integration among the different regional initiatives. One popular bioassessment method was that of the Biological Monitoring Working Party (BMWP), which was developed in the early 1980s to use benthic macroinvertebrates as environmental health indicators. The UK’s aquatic biomonitoring efforts were advanced considerably by the development of River Invertebrate Prediction and Classification System (RIVPACS) software, which was developed from an extensive set of benthic invertebrate and instream morphological, and hydrological data from rivers throughout Britain (Harper et al. 2000). The UK’s Environment Agency currently uses the RIVPACS model in conjunction with BMWP-related metrics for their routine monitoring programs. In addition to delivering the typical output (described in more detail below), the RIVPACS model also calculates the number of BMWP-scoring taxa and the average BMWP score per taxon (J. Davy-Bowker, pers. comm.).
3.1.4 European Community
The UK joined the European Community in 1973 and, with the 1993 ratification of the Maastricht Treaty (also known as the Treaty on European Union) formally became part of the European Union (EU). As part of the EU’s ongoing unification process, considerable effort has been made to integrate the bioassessment activities of the various member countries. This has resulted in the development in 2000 of the EU’s Water
- 9 -
Framework Directive (WFD), which defines a framework for assessing surface waterbodies using three indicator assemblages (referred to as “biological quality elements” in the WFD): benthic macroinvertebrates, fish, and aquatic vegetation (which includes macrophytes, phytobenthos, macroalgae, and angiosperms) (Hering et al. 2004; WFD 2003). The WFD requires that EU member countries define the ecological status of their surface waters relative to a near-natural “reference” condition, using an Ecological Quality Ratio (EQR); the ratio between reference conditions and current status of the biological quality elements (Heiskanen et al. 2004). This EQR value is related to numerical biocriteria, although in addition to the biological aspect of the EQR, there are also hydromorphological, chemical, and physico-chemical elements which serve to support the biological elements. These include water quantity and flow, substrate, depth, riparian zone structure, and various water quality measurements including temperature, dissolved oxygen, salinity, nutrients, and site-specific priority pollutants (WFD 2003).
A key EU objective is to ensure comparability of stream assessment results among the various EU member countries (J. Davy-Bowker, pers. comm.). Compliance with the WFD will require intercalibration of the more advanced bioassessment methodologies currently in use in individual countries, as well as adoption of new or improved bioassessment procedures in many EU countries which currently have less-developed or nonexistent bioassessment systems (Hering et al. 2004; Sandin and Hering 2004). In the case of the UK, the RIVPACS approach will be adapted for addressing the benthic macroinvertebrate component of biological quality elements, and new approaches for aquatic vegetation and fish will be developed. In Europe, many countries have benthic macroinvertebrate assessment systems in place that can be adapted for use under the WFD, but relatively few have systems for fish and aquatic vegetation assessment (STAR 2004).
At the time of this writing, the EU had not established international standards for interpreting bioassessment results or using biocriteria, apart from providing basic guidance on interpretation (e.g., ISO 8689) (STAR 2004). Regional bioassessment methods currently in use within the EU include:
• For benthic macroinvertebrates, existing bioassessment systems (which provide methodologies for assessing data, and could be used to define numeric biocriteria) include (apart from the UK’s RIVPACS): the French Global Normalized Biological Index (IBGN), Austrian and German Saprobic Systems, Dutch Ecological Assessment of Running Waters (EBEOSWA), and Italian Enhanced Biological Index (IBE) (STAR 2004).
• Diatom communities in EU countries are currently used as indicator organisms in bioassessment programs – and can be evaluated with biocriteria developed from these assessment methods – using the French Specific Polluosensitivity Index
- 10 -
(IPS) and Diatom Biological Index (IBD), the English Trophic Diatom Index (TDI), and Hungarian Sladecek Index (SLA) (Lavoie et al. 2005).
• Because fish are not used as commonly in biomonitoring as benthic macroinvertebrates or diatoms in European countries, a project to develop a standardised Europe–wide multi-metric fish-based bioassessment method for monitoring the ecological status of European rivers was undertaken, and resulted in the development of a European Fish Index (EFI) in November 2004 (FAME 2004).
An important characteristic of the WFD policy is that the EU is making an effort to use the tools that are already available, and recognizes the necessity of intercalibrating environmental quality to fall within one of five class boundaries (i.e., ‘high’, ‘good’, ‘moderate’, ‘poor’ and ‘bad’) across all methods. As part of the EU’s standardization process, the STAndardisation of River Classifications (STAR) program has been initiated to develop a framework for calibrating and interpreting bioassessment results. However, this program is still at a developmental stage. The intercalibration of ecological status designations among the member states is to be complete by 2006 (Environment Agency 2004; Heiskanen et al. 2004). The European experience with intercalibration will supply useful information that can provide input on how best to approach Canadian intercalibration efforts.
3.2 Development and Use of Biocriteria
Worldwide, two divergent bioassessment approaches have been taken to develop numeric biocriteria values: multimetric1 and multivariate (Karr and Chu 2000).
3.2.1 Multimetric Approaches
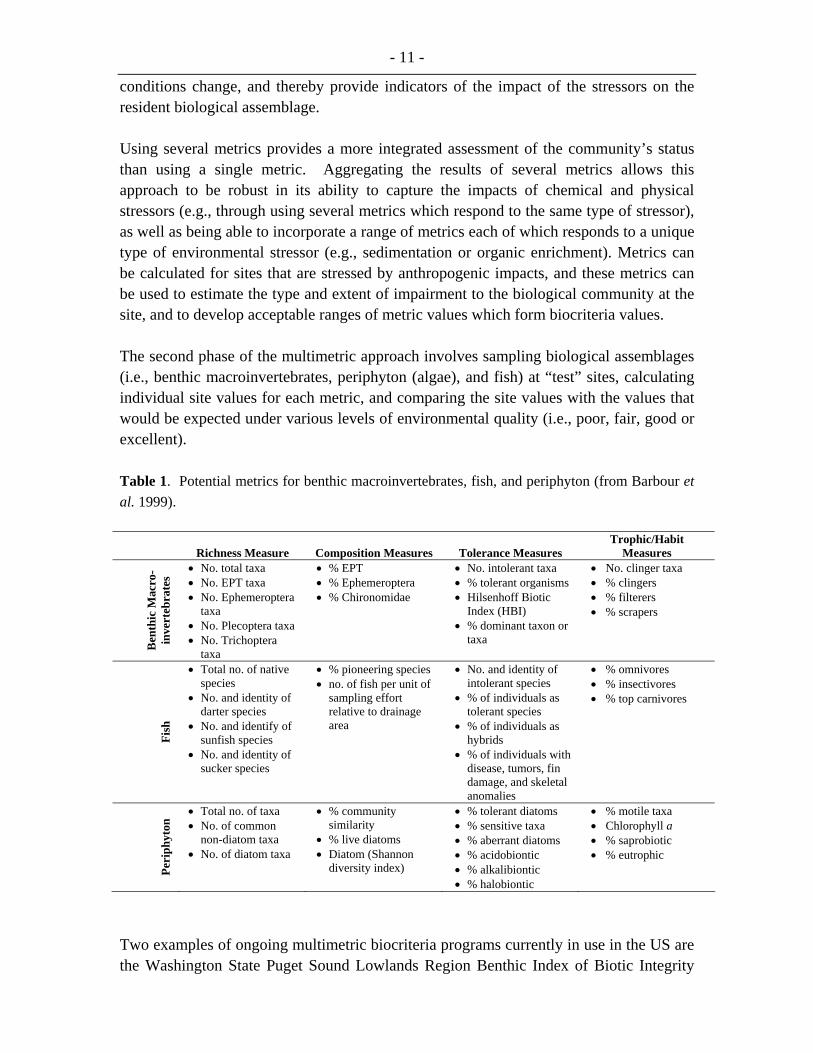
First developed in the late 1980s, multimetric approaches use a suite of biological attributes or “metrics” which change in a predictable fashion with increased human disturbance. Typical metrics describe the taxonomic richness, taxonomic composition, or proportion of pollution-tolerant individuals in a community, or the proportion of taxa in a particular trophic group. Examples of metrics for benthic macroinvertebrates, fish and algae which can be used to develop biocriteria values are provided in Table 1.
The multimetric approach has two distinct phases. First, various metrics are calculated for samples taken from similar habitats across a range of anthropogenic stressor conditions. The general idea is that some of the metrics will change as stressor
1Although single-metric approaches are also used, their results are most commonly incorporated into multimetric biocriteria.
- 11 -
conditions change, and thereby provide indicators of the impact of the stressors on the resident biological assemblage.
Using several metrics provides a more integrated assessment of the community’s status than using a single metric. Aggregating the results of several metrics allows this approach to be robust in its ability to capture the impacts of chemical and physical stressors (e.g., through using several metrics which respond to the same type of stressor), as well as being able to incorporate a range of metrics each of which responds to a unique type of environmental stressor (e.g., sedimentation or organic enrichment). Metrics can be calculated for sites that are stressed by anthropogenic impacts, and these metrics can be used to estimate the type and extent of impairment to the biological community at the site, and to develop acceptable ranges of metric values which form biocriteria values.
The second phase of the multimetric approach involves sampling biological assemblages (i.e., benthic macroinvertebrates, periphyton (algae), and fish) at “test” sites, calculating individual site values for each metric, and comparing the site values with the values that would be expected under various levels of environmental quality (i.e., poor, fair, good or excellent).
Table 1. Potential metrics for benthic macroinvertebrates, fish, and periphyton (from Barbour et al. 1999).
Richness Measure Composition Measures Tolerance Measures Trophic/Habit
Measures
Ben
thic
Mac
ro-
inve
rteb
rate
s
• No. total taxa • No. EPT taxa • No. Ephemeroptera
taxa • No. Plecoptera taxa • No. Trichoptera
taxa
• % EPT • % Ephemeroptera • % Chironomidae
• No. intolerant taxa • % tolerant organisms • Hilsenhoff Biotic
Index (HBI) • % dominant taxon or
taxa
• No. clinger taxa • % clingers • % filterers • % scrapers
Fish
• Total no. of native species
• No. and identity of darter species
• No. and identify of sunfish species
• No. and identity of sucker species
• % pioneering species • no. of fish per unit of
sampling effort relative to drainage area
• No. and identity of intolerant species
• % of individuals as tolerant species
• % of individuals as hybrids
• % of individuals with disease, tumors, fin damage, and skeletal anomalies
• % omnivores • % insectivores • % top carnivores
Peri
phyt
on • Total no. of taxa
• No. of common non-diatom taxa
• No. of diatom taxa
• % community similarity
• % live diatoms • Diatom (Shannon
diversity index)
• % tolerant diatoms • % sensitive taxa • % aberrant diatoms • % acidobiontic • % alkalibiontic • % halobiontic
• % motile taxa • Chlorophyll a • % saprobiotic • % eutrophic
Two examples of ongoing multimetric biocriteria programs currently in use in the US are the Washington State Puget Sound Lowlands Region Benthic Index of Biotic Integrity
- 12 -
(B-IBI) system, and the Ohio Environmental Protection Agency Watershed Classification System.
3.2.2 Washington State Puget Sound Lowlands B-IBI System
The B-IBI system uses benthic macroinvertebrate community attributes to assess the biological integrity of stream ecosystems. The B-IBI was developed from the Index of Biotic Integrity (IBI), which was originally developed using fish community data (Karr 1981; Fausch et al. 1984). There are numerous versions of the B-IBI being used in the US and Canada, all of which use regionally-defined types and numbers of metrics.
For the purposes of this report we present an example of one version of the B-IBI system that has been in use in Washington State since the mid-1990s, and in the Lower Mainland region of British Columbia (BC) since the early 2000s. The Puget Sound lowlands B-IBI can be calculated using either a five-metric approach (where organisms are identified only to the family/order level), or a more detailed ten-metric approach (in which organisms are identified to the genus or species/family-level). In general, the ten-metric B-IBI provides a more accurate reflection of impact levels than the five-metric B-IBI (Karr and Dudley 1981).
The Puget Sound Lowlands’ B-IBI uses the following metrics: total taxonomic richness; Ephemeroptera Plecoptera and Trichoptera taxonomic richness2; percent pollution-tolerant individuals; number of clinger taxa; percent predator individuals; percent dominance number of long-lived taxa number, and of pollution intolerant taxa. The five-metric B-IBI considers total taxonomic richness, Ephemeroptera, Plecoptera and Trichoptera taxonomic richnesses, and percent dominant taxa.
The Puget Sound B-IBI methodology involves sampling riffle habitats using a Surber sampler (other methods sample riffle and pool habitats), taking three replicate samples within each test site. Values for each metric are averaged or summed for the site and metric scores of 1, 3 or 5 are assigned. A score of 5 is given if the value obtained for the metric is similar to values obtained from relatively unimpacted streams, 3 if the value is similar to values obtained from moderately impacted streams and 1 if the value is similar to values obtained from heavily impacted streams (Kerans and Karr 1994). The scores from the 10 or 5 metrics are then added to obtain a total site B-IBI score.
Interpretation of B-IBI scores requires previous development of a set of regionally-defined ranges of B-IBI scores that identify five levels of stream condition (i.e., excellent, good, fair, poor, very poor). Development of a set of score ranges for a new region requires sampling a series of sites that represent the range of perturbation conditions occurring in the region, based on information concerning land use, physical habitat
2The combined richness of these three taxa is referred to as “EPT” taxonomic richness.
- 13 -
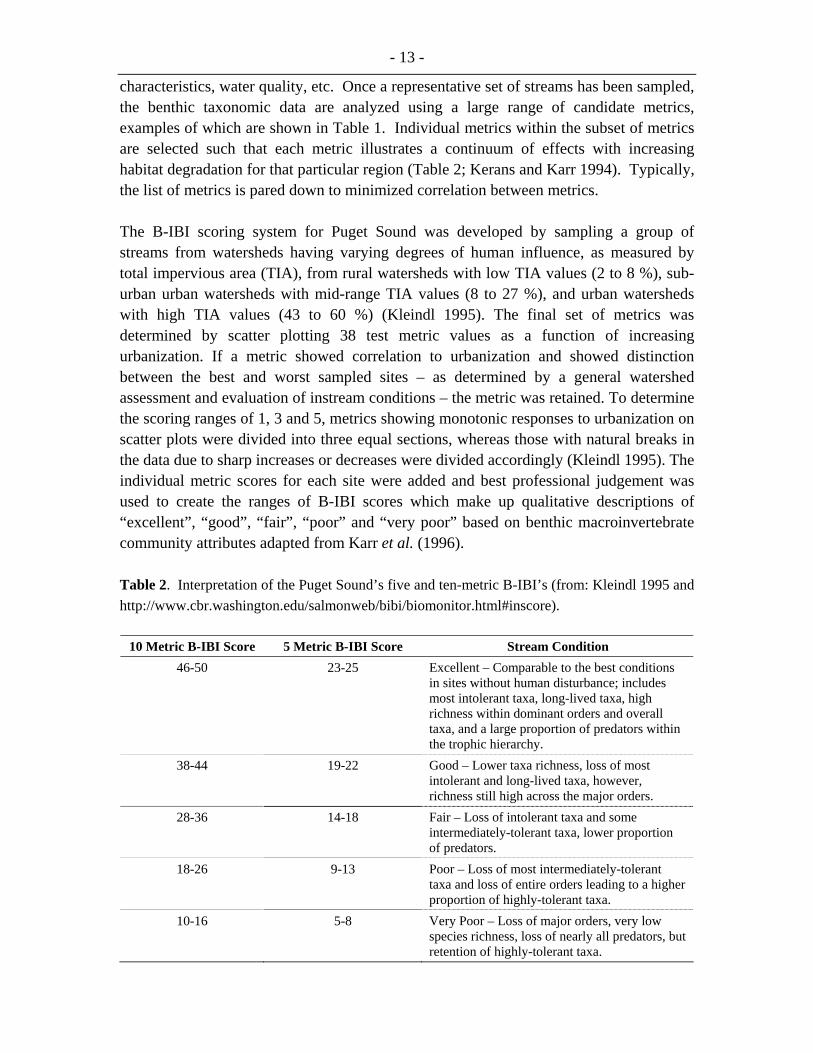
characteristics, water quality, etc. Once a representative set of streams has been sampled, the benthic taxonomic data are analyzed using a large range of candidate metrics, examples of which are shown in Table 1. Individual metrics within the subset of metrics are selected such that each metric illustrates a continuum of effects with increasing habitat degradation for that particular region (Table 2; Kerans and Karr 1994). Typically, the list of metrics is pared down to minimized correlation between metrics.
The B-IBI scoring system for Puget Sound was developed by sampling a group of streams from watersheds having varying degrees of human influence, as measured by total impervious area (TIA), from rural watersheds with low TIA values (2 to 8 %), sub-urban urban watersheds with mid-range TIA values (8 to 27 %), and urban watersheds with high TIA values (43 to 60 %) (Kleindl 1995). The final set of metrics was determined by scatter plotting 38 test metric values as a function of increasing urbanization. If a metric showed correlation to urbanization and showed distinction between the best and worst sampled sites – as determined by a general watershed assessment and evaluation of instream conditions – the metric was retained. To determine the scoring ranges of 1, 3 and 5, metrics showing monotonic responses to urbanization on scatter plots were divided into three equal sections, whereas those with natural breaks in the data due to sharp increases or decreases were divided accordingly (Kleindl 1995). The individual metric scores for each site were added and best professional judgement was used to create the ranges of B-IBI scores which make up qualitative descriptions of “excellent”, “good”, “fair”, “poor” and “very poor” based on benthic macroinvertebrate community attributes adapted from Karr et al. (1996).
Table 2. Interpretation of the Puget Sound’s five and ten-metric B-IBI’s (from: Kleindl 1995 and http://www.cbr.washington.edu/salmonweb/bibi/biomonitor.html#inscore).
10 Metric B-IBI Score 5 Metric B-IBI Score Stream Condition 46-50 23-25 Excellent – Comparable to the best conditions
in sites without human disturbance; includes most intolerant taxa, long-lived taxa, high richness within dominant orders and overall taxa, and a large proportion of predators within the trophic hierarchy.
38-44 19-22 Good – Lower taxa richness, loss of most intolerant and long-lived taxa, however, richness still high across the major orders.
28-36 14-18 Fair – Loss of intolerant taxa and some intermediately-tolerant taxa, lower proportion of predators.
18-26 9-13 Poor – Loss of most intermediately-tolerant taxa and loss of entire orders leading to a higher proportion of highly-tolerant taxa.
10-16 5-8 Very Poor – Loss of major orders, very low species richness, loss of nearly all predators, but retention of highly-tolerant taxa.
- 14 - 3.2.3 Ohio Environmental Protection Agency Watershed Classification System
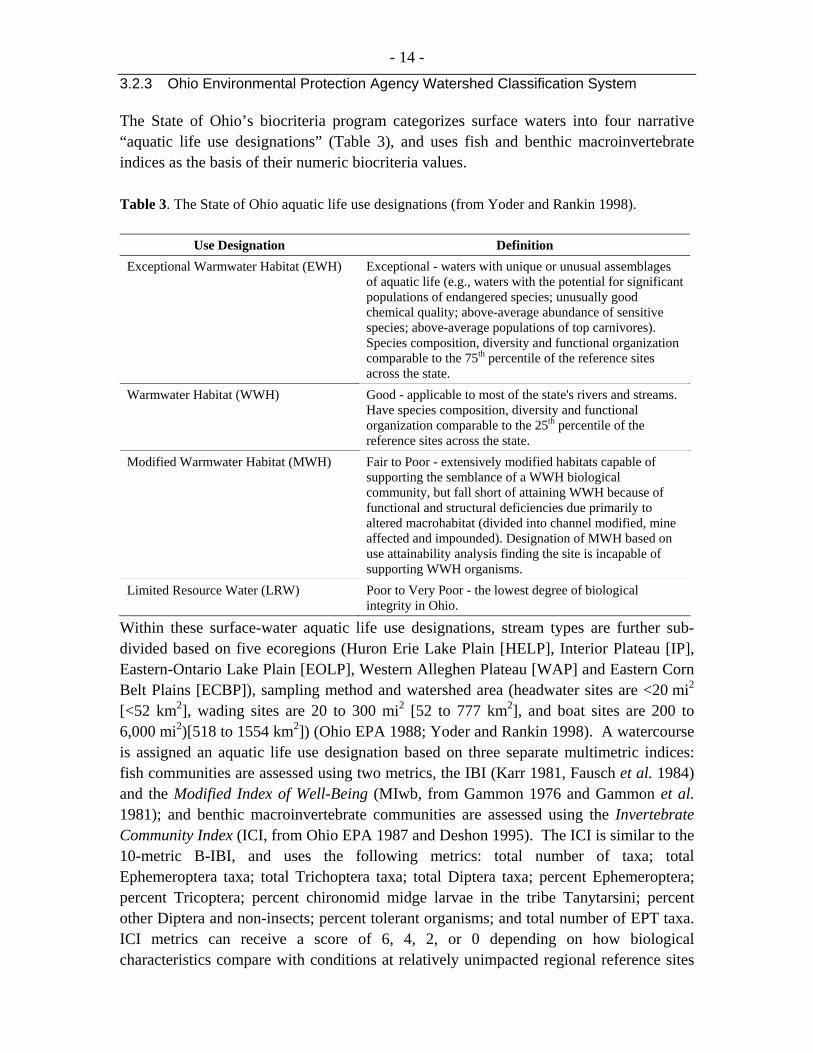
The State of Ohio’s biocriteria program categorizes surface waters into four narrative “aquatic life use designations” (Table 3), and uses fish and benthic macroinvertebrate indices as the basis of their numeric biocriteria values.
Table 3. The State of Ohio aquatic life use designations (from Yoder and Rankin 1998).
Use Designation Definition Exceptional Warmwater Habitat (EWH) Exceptional - waters with unique or unusual assemblages
of aquatic life (e.g., waters with the potential for significant populations of endangered species; unusually good chemical quality; above-average abundance of sensitive species; above-average populations of top carnivores). Species composition, diversity and functional organization comparable to the 75th percentile of the reference sites across the state.
Warmwater Habitat (WWH) Good - applicable to most of the state's rivers and streams. Have species composition, diversity and functional organization comparable to the 25th percentile of the reference sites across the state.
Modified Warmwater Habitat (MWH) Fair to Poor - extensively modified habitats capable of supporting the semblance of a WWH biological community, but fall short of attaining WWH because of functional and structural deficiencies due primarily to altered macrohabitat (divided into channel modified, mine affected and impounded). Designation of MWH based on use attainability analysis finding the site is incapable of supporting WWH organisms.
Limited Resource Water (LRW) Poor to Very Poor - the lowest degree of biological integrity in Ohio.
Within these surface-water aquatic life use designations, stream types are further sub-divided based on five ecoregions (Huron Erie Lake Plain [HELP], Interior Plateau [IP], Eastern-Ontario Lake Plain [EOLP], Western Alleghen Plateau [WAP] and Eastern Corn Belt Plains [ECBP]), sampling method and watershed area (headwater sites are <20 mi2
[<52 km2], wading sites are 20 to 300 mi2 [52 to 777 km2], and boat sites are 200 to 6,000 mi2)[518 to 1554 km2]) (Ohio EPA 1988; Yoder and Rankin 1998). A watercourse is assigned an aquatic life use designation based on three separate multimetric indices: fish communities are assessed using two metrics, the IBI (Karr 1981, Fausch et al. 1984) and the Modified Index of Well-Being (MIwb, from Gammon 1976 and Gammon et al. 1981); and benthic macroinvertebrate communities are assessed using the Invertebrate Community Index (ICI, from Ohio EPA 1987 and Deshon 1995). The ICI is similar to the 10-metric B-IBI, and uses the following metrics: total number of taxa; total Ephemeroptera taxa; total Trichoptera taxa; total Diptera taxa; percent Ephemeroptera; percent Tricoptera; percent chironomid midge larvae in the tribe Tanytarsini; percent other Diptera and non-insects; percent tolerant organisms; and total number of EPT taxa. ICI metrics can receive a score of 6, 4, 2, or 0 depending on how biological characteristics compare with conditions at relatively unimpacted regional reference sites
- 15 -
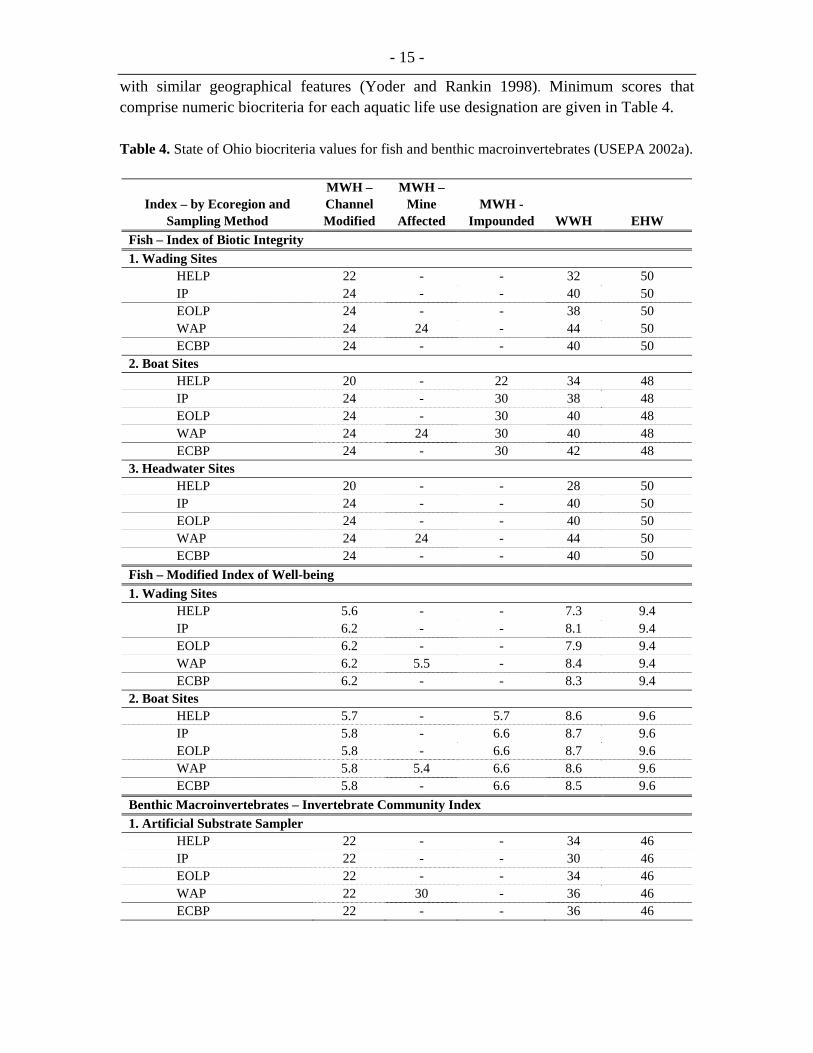
with similar geographical features (Yoder and Rankin 1998). Minimum scores that comprise numeric biocriteria for each aquatic life use designation are given in Table 4.
Table 4. State of Ohio biocriteria values for fish and benthic macroinvertebrates (USEPA 2002a).
Index – by Ecoregion and Sampling Method
MWH – Channel Modified
MWH – Mine
Affected MWH -
Impounded WWH EHW Fish – Index of Biotic Integrity 1. Wading Sites HELP 22 - - 32 50 IP 24 - - 40 50 EOLP 24 - - 38 50 WAP 24 24 - 44 50 ECBP 24 - - 40 50 2. Boat Sites HELP 20 - 22 34 48 IP 24 - 30 38 48 EOLP 24 - 30 40 48 WAP 24 24 30 40 48 ECBP 24 - 30 42 48 3. Headwater Sites HELP 20 - - 28 50 IP 24 - - 40 50 EOLP 24 - - 40 50 WAP 24 24 - 44 50 ECBP 24 - - 40 50 Fish – Modified Index of Well-being 1. Wading Sites HELP 5.6 - - 7.3 9.4 IP 6.2 - - 8.1 9.4 EOLP 6.2 - - 7.9 9.4 WAP 6.2 5.5 - 8.4 9.4 ECBP 6.2 - - 8.3 9.4 2. Boat Sites HELP 5.7 - 5.7 8.6 9.6 IP 5.8 - 6.6 8.7 9.6 EOLP 5.8 - 6.6 8.7 9.6 WAP 5.8 5.4 6.6 8.6 9.6 ECBP 5.8 - 6.6 8.5 9.6 Benthic Macroinvertebrates – Invertebrate Community Index 1. Artificial Substrate Sampler HELP 22 - - 34 46 IP 22 - - 30 46 EOLP 22 - - 34 46 WAP 22 30 - 36 46 ECBP 22 - - 36 46
- 16 -
Determining if a site is in full, partial or non-attainment of life-use status is based on the following selection criteria (US EPA 2004):
• Full attainment – All biological indices meet biocriteria values for the applicable use designation, ecoregion, and site type (see Table 4). Values within the pre-determined “non-significant” departure range (4 IBI or ICI units; 0.5 MIwb units) are considered to meet the biocriteria.
• Partial attainment – One or two biological indices indicate attainment, but others
do not; for the EWH and WWH use designations the biological indices that fail to meet the applicable biocriteria must at least be within the “fair” range of performance.
• Non-attainment – All biological indices fail to meet biocriteria, or either organism
group reflects poor or very poor performance, even if the other organism group meets the biocriteria.
If non-attainment of any biocriteria occurs without measured exceedances of chemical and whole-effluent criteria, the state director must still seek and establish (if possible) the cause of non-attainment (US EPA 2002a). If attainment of the current designated use is not possible, the designated use may be lowered, but if attainment is deemed possible, regulatory controls or water resource management tools are implemented to restore the designated use. In the state of Ohio, attainment of biocriteria can take precedence over attainment of chemical or whole-effluent criteria in cases where chemical and whole-effluent criteria are deemed inappropriate (US EPA 2002a).
3.3 Multivariate Approaches
In contrast to multimetric approaches, multivariate bioassessment methods rely on multivariate statistical modeling, rather than on metrics, to assess the degree to which a community is biologically impaired Four examples of major multivariate bioassessment programs for benthic macroinvertebrates are described below; of these bioassessment program examples, only the State of Maine’s bioassessment program contains legislated biocriteria.
3.3.1 River Invertebrate Prediction and Classification System (RIVPACS)
The UK’s River InVertebrate Prediction and Classification System (RIVPACS) applies discriminant analysis to group together reference sites based on key environmental variables. The RIVPACS model models the impacts of anthropogenic stressors on benthic macroinvertebrate communities by predicting which group of reference sites a test site should belong to, based on similarities in environmental variables.
The RIVPACS model is developed by sampling the benthic macroinvertebrate communities at a series of minimally-impacted “reference sites” within the region of
- 17 -
interest. At each reference site, macroinvertebrates and environmental data are collected using standard protocols, and the fauna is identified to the lowest practical taxonomic level (e.g., species or genus). A statistical model is then developed to summarize the correlation between the observed macroinvertebrate fauna of the reference sites and the environmental characteristics of the sites. The reference sites are arranged into a series of groups, based only on their macroinvertebrate faunas. The relationships between the environmental features and the benthic macroinvertebrate community characteristics of the reference site groups are then defined and used to develop a predictive model, which is then validated and the quality of the reference sites assessed. The final validated predictive model enables estimation of the macroinvertebrate community to be expected at reference sites based on information on their environmental features. By measuring these environmental features for a new test site, one can use the model to predict the macroinvertebrate fauna expected to occur at the site if it was of high quality, or within the range of conditions which make up the reference condition, which can also be considered a biocriterion (i.e., the desired state). The expected fauna for a site is referred to as its biological “reference condition” within the EU’s WFD. The degree of biological impairment at the test site is evaluated as the deviation between the observed and expected macroinvertebrate communities.
In the UK, the RIVPACS model is also used to calculate two metrics which are based on the Biological Monitoring Working Party (BMWP) bioassessment method: the number of BMWP scoring taxa, and the average BMWP score per taxon (J. Davy-Bowker, pers. comm.). The BMWP score is a measure of the response of macroinvertebrate communities to organic pollution. Additional RIVPACS-based metrics which are also being considered include the Acid Waters Indicator Community (AWIC), and the Lotic-invertebrate Index for Flow Evaluation (LIFE). The AWIC metric identifies sites with benthic macroinvertebrate communities that are tolerant of acidic conditions, whereas the LIFE metric identifies sites with persistent low-flow conditions (CEH Dorset 2003a). These metrics will be used to enhance the RIVPACS output, and could be used to develop biocriteria values.
3.3.2 Reference Condition Approach (RCA)
The Reference Condition Approach currently used by Environment Canada and others in Canada is a modified version of the UK’s RIVPACS model. This model is included on the Canadian Aquatic Biomonitoring Network (CABIN) website. Canadian RCA modelling uses a software package called BEAST (BEnthic Assessment of SedimenT). Like the RIVPACS approach, the RCA approach measures the degree of similarity between the benthic macroinvertebrate fauna in minimally impacted “reference condition” sites and potentially stressed sites in a region of interest.
Like the RIVPACS approach, the RCA approach uses empirical modeling to explain as much as possible of the variability in the benthic macroinvertebrate communities of the
- 18 -
reference sites, based solely on the environmental characteristics of the sites. Reference sites are grouped based on benthic macroinvertebrate taxonomic composition, and a model is developed to predict which reference site group a site belongs to based on habitat attributes. The optimal set of predictor variables in the model is determined using multiple discriminant analysis (MDA). The discriminant model is then used to compare habitat data from test sites to the entire set of reference conditions and determine which reference group the test site most closely matches. The RCA approach differs from the RIVPACS approach primarily in that it does not specifically predict the taxa richness expected to occur at the sampled site (i.e., taxa presence/absence), but rather measures the distance of the taxa abundance of the observed test site community assemblage from the assemblages found in the group of reference sites in ordination space (Rosenberg et al. 1999).
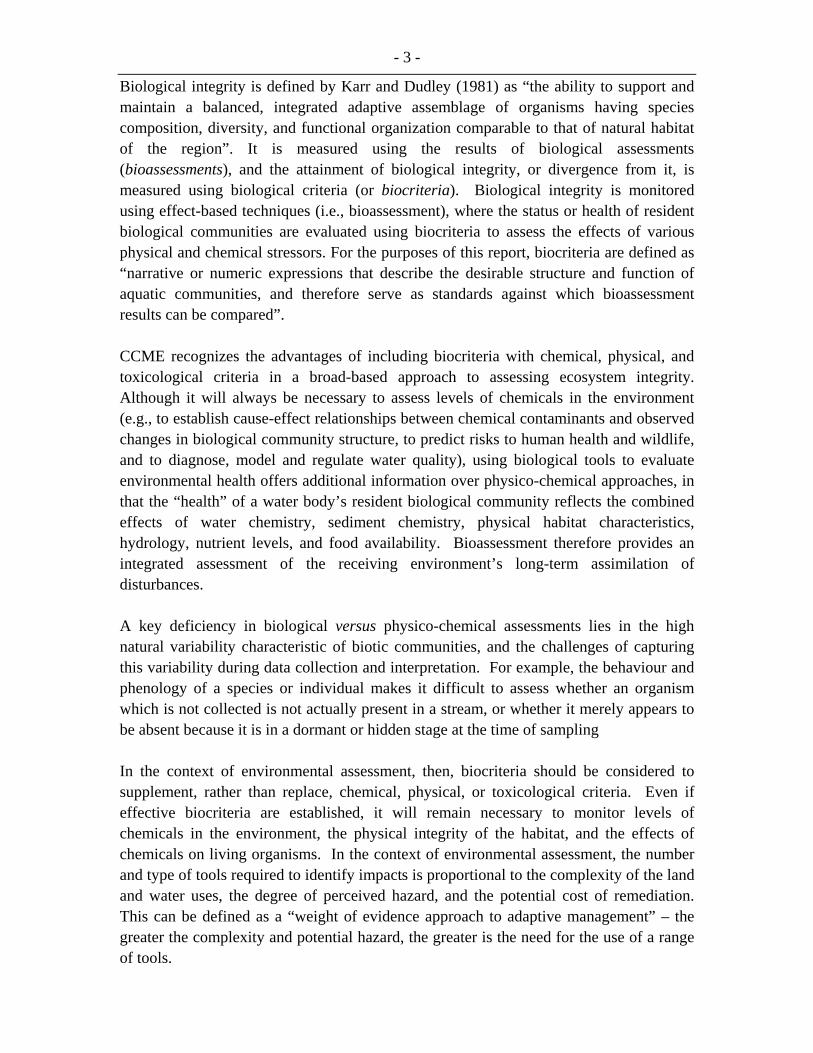
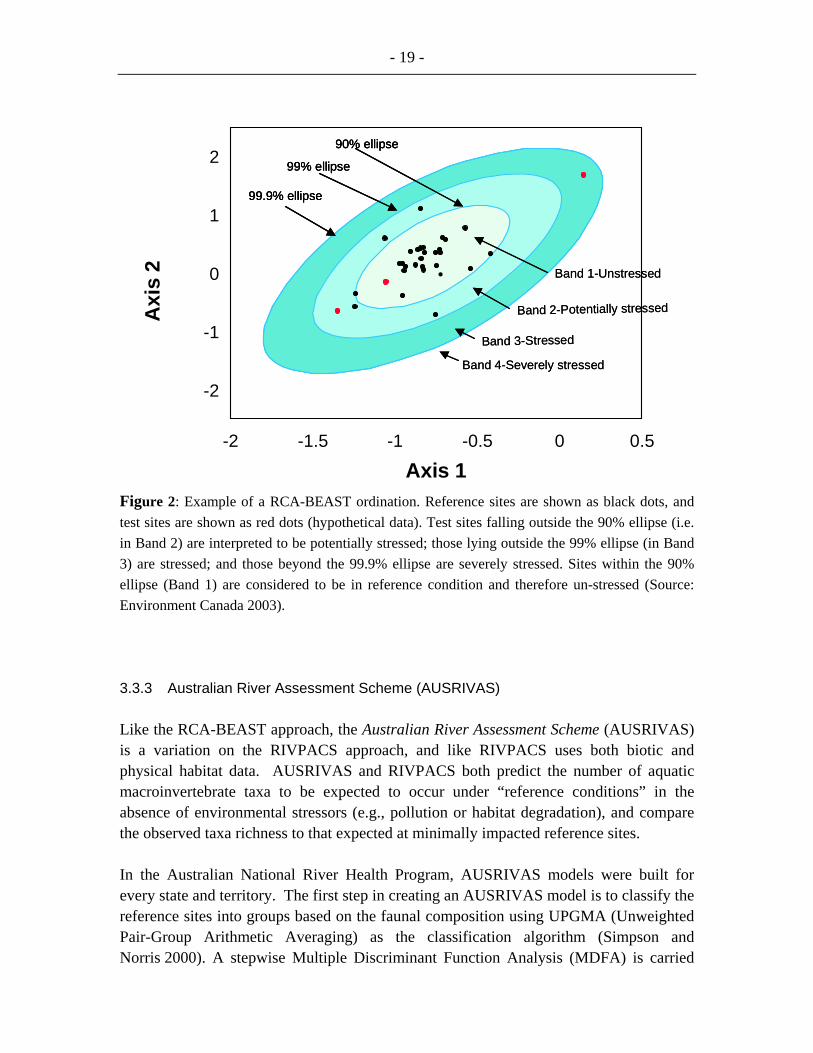
The RCA model output is a non-metric multi-dimensional scaling ordination plot of the site by taxa matrix for reference sites and the test site (Rosenberg et al. 1999, Sylvestre et al. 2005). The reference sites are enclosed in confidence ellipses (i.e., 90, 99, and 99.9%) such that the position of the test site in relation to the reference condition is evident graphically. The plot is a graphical representation of the similarity between the benthic macroinvertebrate taxa found in the group of reference sites and the taxa found at the monitoring test site; sites closer together in the plot are more similar in composition than sites that are farther apart (Figure 2). The extent of environmental stress at a test site is represented by its relative position in ordination space, with sites closest to the reference condition (i.e., within the 90% ellipse) being within the acceptable range of community composition as the reference group of sites (thus each of the ellipses is a biocriterion). Sites further from the reference condition are considered stressed (i.e., those sites falling outside the 90% ellipse) (Reynoldson et al. 2003). In addition to the ordination output, it is possible for the BEAST program to calculate other metrics (D Baird, pers. comm.), much like the UK RIVPACS model. For the Georgia Basin expansion of the RCA database (i.e., for the Fraser River basin), the following metrics were calculated which could be used to define biocriteria values: abundance, total richness, EPT richness, % EPT taxa, % dominance (top three taxa), % Chironomidae, number of Ephemeroptera taxa, number of Plecoptera taxa, number of Trichoptera taxa, diversity, evenness and Bray-Curtis index (Sylvestre et al. 2005).
- 19 -
90% ellipse
99% ellipse
99.9% ellipse
90% ellipse
99% ellipse
99.9% ellipse
90% ellipse
99% ellipse
99.9% ellipse
-2 -1.5 -1 -0.5 0 0.5
Axis 1
-2
-1
0
1
2A
xis
2 Band 1-Unstressed
Band 3-Stressed
Band 2-Potentially stressed
Band 4-Severely stressed
Band 1-Unstressed
Band 3-Stressed
Band 2-Potentially stressed
Band 4-Severely stressed
Figure 2: Example of a RCA-BEAST ordination. Reference sites are shown as black dots, and test sites are shown as red dots (hypothetical data). Test sites falling outside the 90% ellipse (i.e. in Band 2) are interpreted to be potentially stressed; those lying outside the 99% ellipse (in Band 3) are stressed; and those beyond the 99.9% ellipse are severely stressed. Sites within the 90% ellipse (Band 1) are considered to be in reference condition and therefore un-stressed (Source: Environment Canada 2003).
3.3.3 Australian River Assessment Scheme (AUSRIVAS)
Like the RCA-BEAST approach, the Australian River Assessment Scheme (AUSRIVAS) is a variation on the RIVPACS approach, and like RIVPACS uses both biotic and physical habitat data. AUSRIVAS and RIVPACS both predict the number of aquatic macroinvertebrate taxa to be expected to occur under “reference conditions” in the absence of environmental stressors (e.g., pollution or habitat degradation), and compare the observed taxa richness to that expected at minimally impacted reference sites.
In the Australian National River Health Program, AUSRIVAS models were built for every state and territory. The first step in creating an AUSRIVAS model is to classify the reference sites into groups based on the faunal composition using UPGMA (Unweighted Pair-Group Arithmetic Averaging) as the classification algorithm (Simpson and Norris 2000). A stepwise Multiple Discriminant Function Analysis (MDFA) is carried
- 20 -
out to determine which environmental variables discriminate best between the groups are most closely related to the structure of the faunal data. To predict the expected community from a certain combination of environmental variables at a test site, the discriminant functions are used to determine the standardized, multivariate distance of the site from the groups. Based on this distance, a weighted average of the probability of the taxon occurring at the test site is calculated as described in Clarke et al. (1996) and Moss et al. (1987).
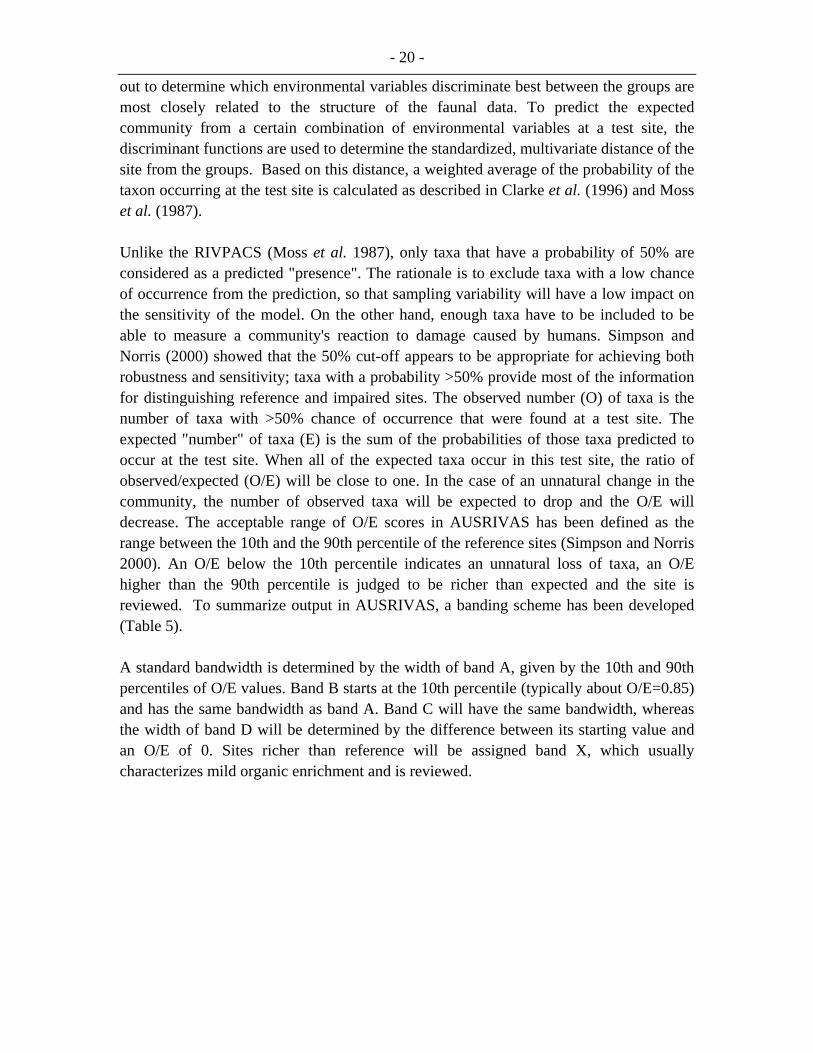
Unlike the RIVPACS (Moss et al. 1987), only taxa that have a probability of 50% are considered as a predicted "presence". The rationale is to exclude taxa with a low chance of occurrence from the prediction, so that sampling variability will have a low impact on the sensitivity of the model. On the other hand, enough taxa have to be included to be able to measure a community's reaction to damage caused by humans. Simpson and Norris (2000) showed that the 50% cut-off appears to be appropriate for achieving both robustness and sensitivity; taxa with a probability >50% provide most of the information for distinguishing reference and impaired sites. The observed number (O) of taxa is the number of taxa with >50% chance of occurrence that were found at a test site. The expected "number" of taxa (E) is the sum of the probabilities of those taxa predicted to occur at the test site. When all of the expected taxa occur in this test site, the ratio of observed/expected (O/E) will be close to one. In the case of an unnatural change in the community, the number of observed taxa will be expected to drop and the O/E will decrease. The acceptable range of O/E scores in AUSRIVAS has been defined as the range between the 10th and the 90th percentile of the reference sites (Simpson and Norris 2000). An O/E below the 10th percentile indicates an unnatural loss of taxa, an O/E higher than the 90th percentile is judged to be richer than expected and the site is reviewed. To summarize output in AUSRIVAS, a banding scheme has been developed (Table 5).
A standard bandwidth is determined by the width of band A, given by the 10th and 90th percentiles of O/E values. Band B starts at the 10th percentile (typically about O/E=0.85) and has the same bandwidth as band A. Band C will have the same bandwidth, whereas the width of band D will be determined by the difference between its starting value and an O/E of 0. Sites richer than reference will be assigned band X, which usually characterizes mild organic enrichment and is reviewed.
- 21 -
Table 5. AUSRIVAS banding schemes (from Simpson and Norris 2000).
Band Label Band Name Comments X Richer than reference More taxa found than expected.
Potential biodiversity "hot-spot" Mild organic enrichment Continuous irrigation flow in a normally
intermittent stream A Reference Index value within range of central 80% of
reference sites B Below reference Fewer taxa than expected
Potential impact either on water quality or habitat quality or both resulting in a loss of taxa
C Well below reference Many fewer taxa than expected Loss of taxa due to substantial impacts on water
and/or habitat quality D Impoverished Few of the expected taxa remain
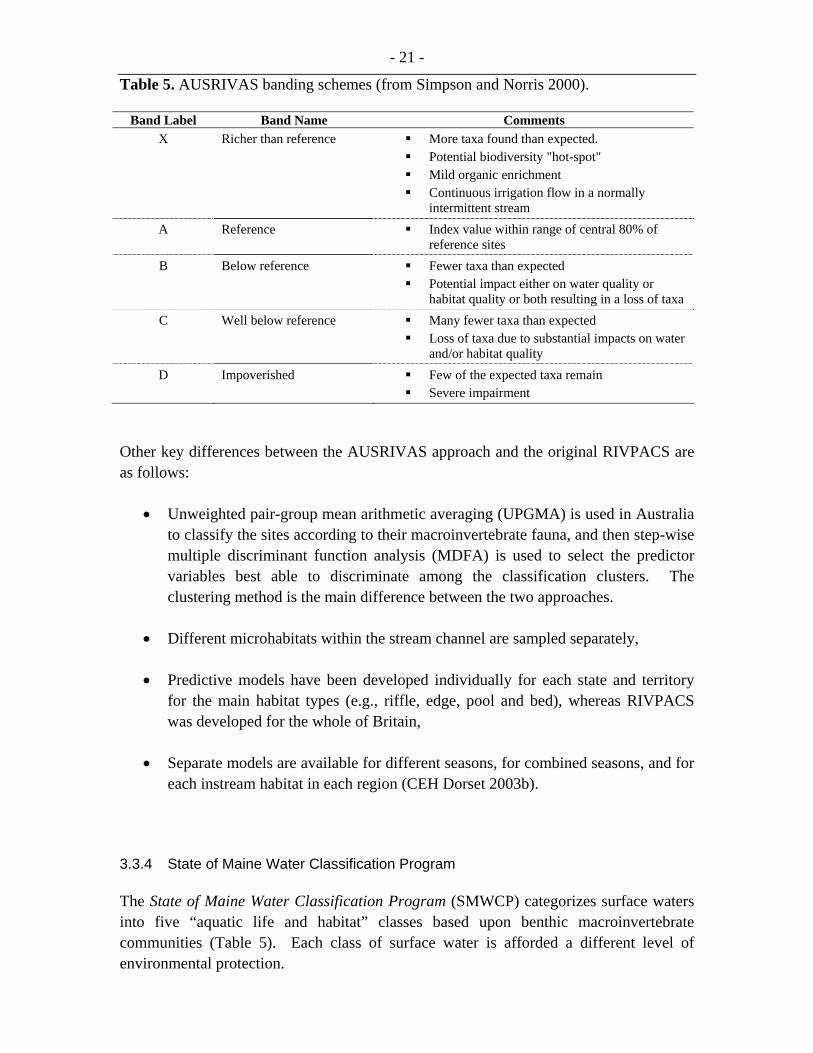
Severe impairment Other key differences between the AUSRIVAS approach and the original RIVPACS are as follows:
• Unweighted pair-group mean arithmetic averaging (UPGMA) is used in Australia to classify the sites according to their macroinvertebrate fauna, and then step-wise multiple discriminant function analysis (MDFA) is used to select the predictor variables best able to discriminate among the classification clusters. The clustering method is the main difference between the two approaches.
• Different microhabitats within the stream channel are sampled separately,
• Predictive models have been developed individually for each state and territory for the main habitat types (e.g., riffle, edge, pool and bed), whereas RIVPACS was developed for the whole of Britain,
• Separate models are available for different seasons, for combined seasons, and for each instream habitat in each region (CEH Dorset 2003b).
3.3.4 State of Maine Water Classification Program
The State of Maine Water Classification Program (SMWCP) categorizes surface waters into five “aquatic life and habitat” classes based upon benthic macroinvertebrate communities (Table 5). Each class of surface water is afforded a different level of environmental protection.
- 22 -
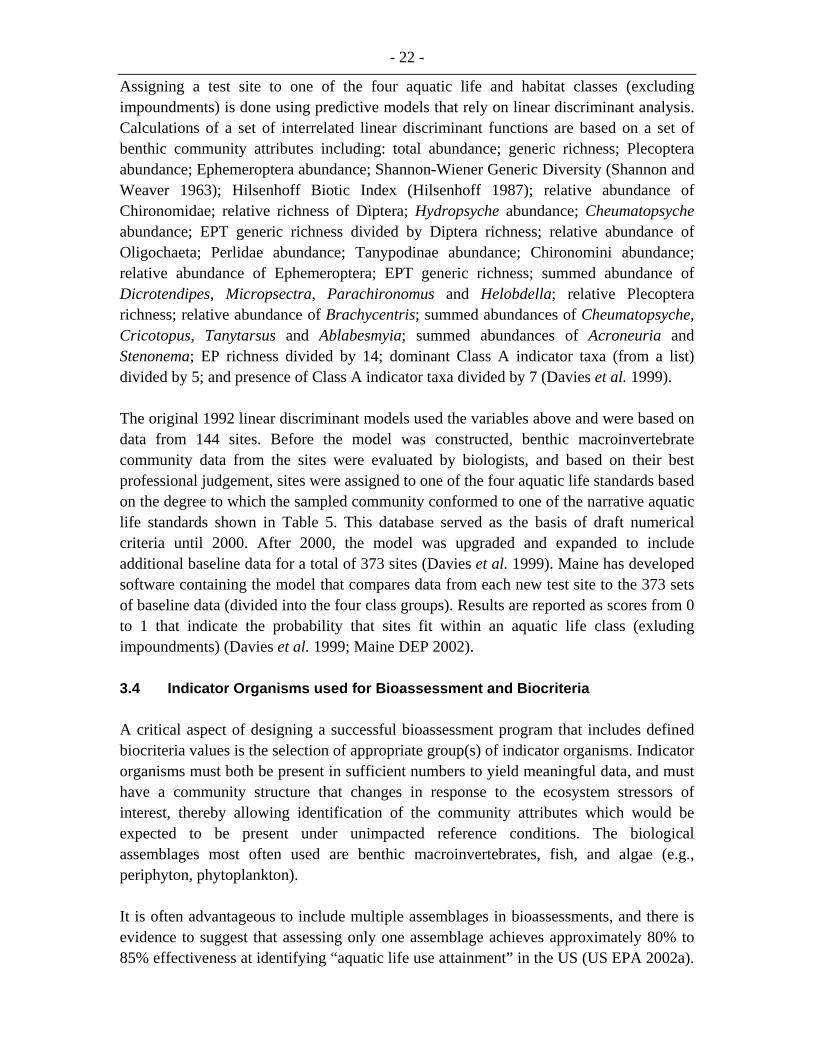
Assigning a test site to one of the four aquatic life and habitat classes (excluding impoundments) is done using predictive models that rely on linear discriminant analysis. Calculations of a set of interrelated linear discriminant functions are based on a set of benthic community attributes including: total abundance; generic richness; Plecoptera abundance; Ephemeroptera abundance; Shannon-Wiener Generic Diversity (Shannon and Weaver 1963); Hilsenhoff Biotic Index (Hilsenhoff 1987); relative abundance of Chironomidae; relative richness of Diptera; Hydropsyche abundance; Cheumatopsyche abundance; EPT generic richness divided by Diptera richness; relative abundance of Oligochaeta; Perlidae abundance; Tanypodinae abundance; Chironomini abundance; relative abundance of Ephemeroptera; EPT generic richness; summed abundance of Dicrotendipes, Micropsectra, Parachironomus and Helobdella; relative Plecoptera richness; relative abundance of Brachycentris; summed abundances of Cheumatopsyche, Cricotopus, Tanytarsus and Ablabesmyia; summed abundances of Acroneuria and Stenonema; EP richness divided by 14; dominant Class A indicator taxa (from a list) divided by 5; and presence of Class A indicator taxa divided by 7 (Davies et al. 1999).
The original 1992 linear discriminant models used the variables above and were based on data from 144 sites. Before the model was constructed, benthic macroinvertebrate community data from the sites were evaluated by biologists, and based on their best professional judgement, sites were assigned to one of the four aquatic life standards based on the degree to which the sampled community conformed to one of the narrative aquatic life standards shown in Table 5. This database served as the basis of draft numerical criteria until 2000. After 2000, the model was upgraded and expanded to include additional baseline data for a total of 373 sites (Davies et al. 1999). Maine has developed software containing the model that compares data from each new test site to the 373 sets of baseline data (divided into the four class groups). Results are reported as scores from 0 to 1 that indicate the probability that sites fit within an aquatic life class (exluding impoundments) (Davies et al. 1999; Maine DEP 2002).
3.4 Indicator Organisms used for Bioassessment and Biocriteria
A critical aspect of designing a successful bioassessment program that includes defined biocriteria values is the selection of appropriate group(s) of indicator organisms. Indicator organisms must both be present in sufficient numbers to yield meaningful data, and must have a community structure that changes in response to the ecosystem stressors of interest, thereby allowing identification of the community attributes which would be expected to be present under unimpacted reference conditions. The biological assemblages most often used are benthic macroinvertebrates, fish, and algae (e.g., periphyton, phytoplankton).
It is often advantageous to include multiple assemblages in bioassessments, and there is evidence to suggest that assessing only one assemblage achieves approximately 80% to 85% effectiveness at identifying “aquatic life use attainment” in the US (US EPA 2002a).
- 23 -
This has prompted the US EPA to recommend the use of multiple assemblages in state and tribal bioassessment programs (US EPA 2002a). However, the decision regarding whether to use one or multiple assemblages should be made carefully, keeping in mind that using single assemblage that is abundant and responsive to a particular disturbance is better than using several assemblages which are not.
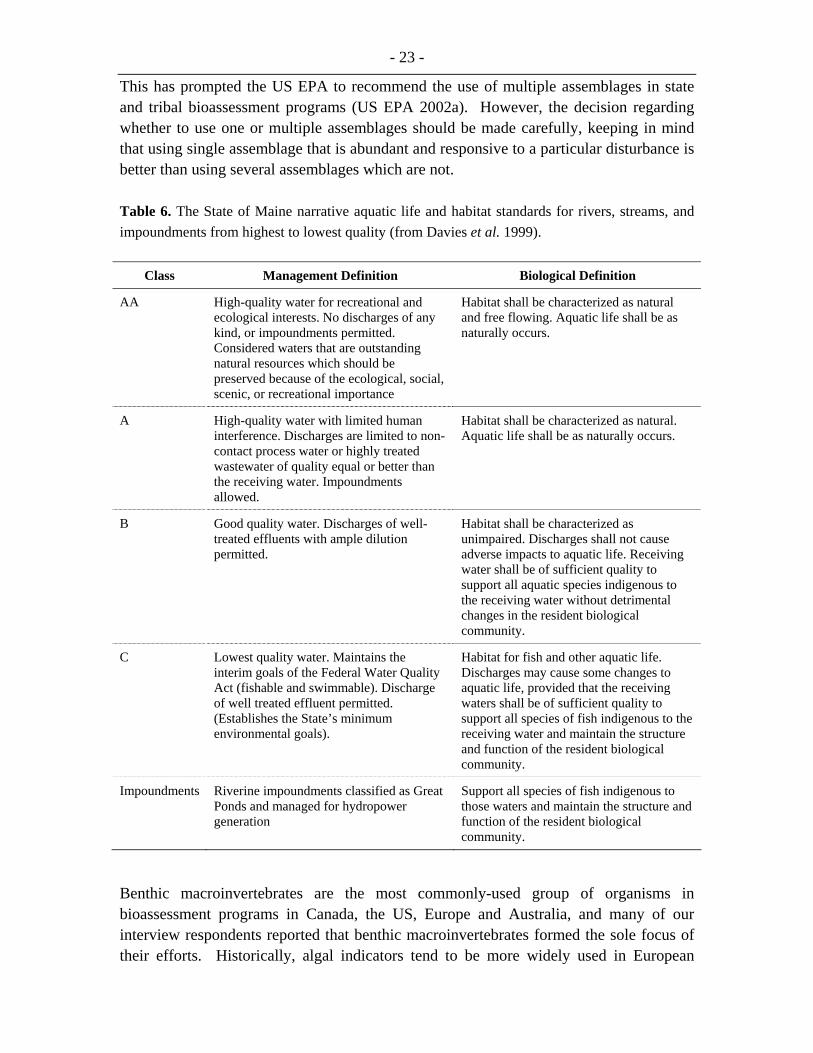
Table 6. The State of Maine narrative aquatic life and habitat standards for rivers, streams, and impoundments from highest to lowest quality (from Davies et al. 1999).
Class Management Definition Biological Definition
AA High-quality water for recreational and ecological interests. No discharges of any kind, or impoundments permitted. Considered waters that are outstanding natural resources which should be preserved because of the ecological, social, scenic, or recreational importance
Habitat shall be characterized as natural and free flowing. Aquatic life shall be as naturally occurs.
A High-quality water with limited human interference. Discharges are limited to non-contact process water or highly treated wastewater of quality equal or better than the receiving water. Impoundments allowed.
Habitat shall be characterized as natural. Aquatic life shall be as naturally occurs.
B Good quality water. Discharges of well-treated effluents with ample dilution permitted.
Habitat shall be characterized as unimpaired. Discharges shall not cause adverse impacts to aquatic life. Receiving water shall be of sufficient quality to support all aquatic species indigenous to the receiving water without detrimental changes in the resident biological community.
C Lowest quality water. Maintains the interim goals of the Federal Water Quality Act (fishable and swimmable). Discharge of well treated effluent permitted. (Establishes the State’s minimum environmental goals).
Habitat for fish and other aquatic life. Discharges may cause some changes to aquatic life, provided that the receiving waters shall be of sufficient quality to support all species of fish indigenous to the receiving water and maintain the structure and function of the resident biological community.
Impoundments Riverine impoundments classified as Great Ponds and managed for hydropower generation
Support all species of fish indigenous to those waters and maintain the structure and function of the resident biological community.
Benthic macroinvertebrates are the most commonly-used group of organisms in bioassessment programs in Canada, the US, Europe and Australia, and many of our interview respondents reported that benthic macroinvertebrates formed the sole focus of their efforts. Historically, algal indicators tend to be more widely used in European
- 24 -
countries than in North America. However, since 1990s algal indicators have been increasingly incorporated in national biomonitoring and bioassessment programs (e.g., US Geological Survey’s National Water Quality Assessment (NAWQA) program - http://water.usgs.gov/nawqa/; US EPA’s Environmental Monitoring and Assessment Program (EMAP) - http://www.epa.gov/emap).
In the US, all 50 states monitor benthic macroinvertebrates as part of their bioassessment programs for streams and wadeable rivers (Bailey et al. 2004, EPA 2002a). Fish and/or aquatic vegetation are used less frequently (e.g., in the US, 36 states monitor fish and 24 either currently monitor periphyton or have periphyton programs under development; EPA 2002a). Of all the bioassessment programs carried out in the US (including state, tribal, territorial, and interstate commissions), 51 jurisdictions currently use benthic macroinvertebrates as indicator organisms, 37 use fish, and 19 use algae (periphyton or diatoms); 41 jurisdictions use more than one indicator organism group (EPA 2002a).
In Canada, benthic macroinvertebrates are most commonly used indicator, followed by fish and algae. Several Canadian jurisdictions monitor more than one type of indicator organism. For example, Newfoundland uses fish and benthic macroinvertebrates, BC monitors periphyton in conjunction with benthic macroinvertebrates, and Ontario monitors both benthic macroinvertebrates and algae, although in separate programs.
Recently, a project was undertaken by researchers in Ontario and Quebec to create a diatom-based environmental quality index for eastern Canadian rivers (Lavoie et al. 2005) using samples collected from Ontario, Quebec, New Brunswick, Prince Edward Island, and Nova Scotia. Relative abundance was determined to be the most appropriate metric for assessing the composite impacts of anthropogenic phosphorus, nitrogen, mineral pollution, and organic pollution into lotic environments. The sampling program took into account eco-regional considerations such as latitude, longitude, altitude, geology, distance to source, slope, catchment area, river morphology, land-use, stream width, current velocity, riparian zone characteristics, and substrate.
The NWRI has three tiers of effort and complexity in benthic algae assessment, from least to most complex (P. Chambers, pers. comm.). Analysis can consist of an evaluation of total abundance to function as a simple tool to evaluate enrichment. More complex evaluations involve grab samples and a more in-depth focus on taxonomy and use of various composition and diversity metrics. The most complex level of assessment involves a site-level evaluation of a single point source using bioassays to determine the level of impairment and a determination of the extent of impairment.
- 25 -
3.5 Bioassessment Activities and Biocriteria Use
3.5.1 Canada
Although the majority of Canadian biomonitoring/bioassessment programs do not employ legislated biocriteria target values, both multimetric and multivariate bioassessment tools are being used. The CABIN, which is currently used in the Great Lakes region of Ontario and in BC’s Fraser Basin, is a nationally standardized system of benthic macroinvertebrate sampling and analysis which uses the RCA model. In developing CABIN, the main goal has been to establish a national standard of sampling and analysis protocols for ecological assessments using benthic macroinvertebrates (Reynoldson et al. 2003). A CABIN field and laboratory manual has been developed, training programs for field methodology are offered, and a web-based portal houses a database (Benthic Information System for Reference Conditions [BIRC]) which allows users to upload and analyze their own data.
In part, the EEM programs conducted pursuant to the Fisheries Act’s Metal Mining Effluent Regulation and Pulp Mill Effluent Regulations can be considered to make use of “biocriteria”, insofar as they determine whether statistically significant differences exist between fish and benthic invertebrate populations at sites exposed to effects of effluent constituents (i.e., test sites) and those at unimpacted “reference” sites. Population attributes considered in EEM programs include (for fish) reproduction, body condition, growth, and survival; and (for benthic macroinvertebrates communities) density, taxa richness, Simpson's evenness index, and Bray-Curtis dissimilarity index of the resident invertebrate communities. EEM studies generate biocriteria specific to a given program, in that the desired state is represented by the reference condition, and if the fish and invertebrate communities of the monitored area differ from those of the reference area, environmental degradation may be present.
Regionally within Canada, other examples of bioassessment activities (and the status of biocriteria initiatives, if present) include:
• In the territories, the Yukon is currently building their benthic macroinvertebrate database – a government program has been collecting samples at former mine sites since 1995, but no analysis has been completed on the data at this time. A combination of B-IBI and RCA methodology is being considered, although the RCA approach will most likely be the main assessment technique. The Yukon and British Columbia governments have also begun to look at collaboration of benthic macroinvertebrate assessment activities. The Northwest Territories also uses benthic macroinvertebrates as indicator species in their EEM programs for mines.
• In BC, benthic macroinvertebrates are most commonly used as bioassessment indicator species; some areas use the B-IBI (e.g., Skeena and Okanagan regions, Greater Vancouver Regional District) as a bioassessment tool for forestry or
- 26 -
municipal stormwater management, while others have incorporated RCA approaches as part of Environment Canada-funded research (e.g., Fraser River and Georgia basins).
A three-year study funded by a Forest Stewardship Program (FSP) grant was begun by the provincial government in 2003 to more fully develop a biomonitoring and assessment system for the forest harvesting sector. One component of this work is to compare B-IBI with RCA sampling and analysis methodologies. Triplicate Surber sampling (following B-IBI protocol) and single kick-net sampling (following the RCA protocol) was conducted at 50 sites. Slight differences were found, but for the main part, data were comparable. Data for 212 sites collected using B-IBI protocol are also undergoing post-hoc analysis using the CABIN / RCA assessment tools, to determine if is practical to analyses historic data collected using the B-IBI methodology using the RCA / BEAST approach. The project is intended to further develop multivariate assessment methodologies to form the foundation of the monitoring and assessment system, and will use multimetric techniques (e.g., B-IBI) to supplement RCA interpretations, and thereby improve stressor gradient and biological effect resolution.
BC has a three-year plan to expand their research from the Skeena Region to the Omineca Peace Region, then south to the areas already covered by the RCA bioassessment projects in the Fraser and Georgia Basins. Some regions also use periphyton as indicators in lake studies.
The BC Environmental Management Act (EMA) regulates discharges from certain sewage treatment facilities (e.g., GVRD), mines, pulp mills, smelting and other major industries. Permits issued under the EMA contain biological monitoring and assessment requirements. Permittees are required to conduct multi-element impact assessment work, including water and sediment physical/chemical and biological components. Results of this work inform regulatory and voluntary decisions regarding discharge limits in permits, but are not compared to biocriteria per se.
• Alberta has used a range of aquatic bioassessment approaches over the years, involving zoobenthos, epilithic and planktonic chlorophyll a, phyto- and zooplankton, and lentic and lotic macrophytes. For zoobenthos, various techniques and metrics used include abundance, composition (genus usually), EPT taxa, and sensitive species. Multivariate analysis is used, with the main assessment design being before-after, control-impact (BACI), rather than RCA. RCA has been evaluated but so far not employed, due to the large effort necessary to adequately document references areas, and the scarcity of appropriate reference areas for the large rivers of interest. Zoobenthos have been sampled at Long Term River Network sites through the province, and for shorter term, site-specific assessments. Methods are documented by Alberta Environment (1990).
- 27 -
Epilithic chlorophyll a, and to a lesser extent macrophyte biomass, are used as indicators of enrichment in rivers (e.g. Sosiak 2002; Carr et al. 2005). Planktonic chlorophyll a is used as the main indicator of trophic status of lakes, and numeric ranges of chlorophyll a are used to delineate the categories from oligotrophic through hypereutrophic. In some cases, lake-specific remediation targets for chlorophyll (and phosphorus) have been set, which are a form of biocriteria. Phyto- and zooplankton communities, and occasionally macrophytes, are also sampled to assess potential trends in density and composition. Site and basin specific IBI calculations for fish are also being investigated. These data are used to detect trends in sensitive or important fish populations and aid in attaining fisheries management objectives. Some regional monitoring partnerships, such as the Regional Aquatic Monitoring Program (RAMP) in the oil sands, also employ a variety of biomonitoring techniques.
Although numeric biocriteria are not widely used, aquatic biomonitoring and health assessment techniques are currently being evaluated under Alberta’s “Water for Life Strategy”. These techniques will likely address community-based metrics of benthic invertebrates and fish in combination with metrics describing the physical and chemical environment. In addition, indicators of sub-lethal stress (e.g., endocrine disruption) will be investigated. An initial provincial-scale assessment of aquatic ecosystem health is being planned, and will be followed by the development of a provincial aquatic ecosystem monitoring program.
• Manitoba incorporated benthic invertebrate monitoring into their long-term water quality monitoring program in 1995. The intent of the program is to provide a biological assessment tool (multimetric – IBI) to supplement assessments of water quality based on water chemistry alone.
• Ontario has the Ontario Benthos Biomonitoring Network (OBBN) program, which uses multiple indicators in a multivariate RCA assessment approach. The program is in its early stages, focusing on reference site sampling, evaluation of methods, and building automated analytical software (the database is integrated with the CABIN / BEAST database). Researchers at the National Water Research Institute (Environment Canada) and the Dorset Environmental Science Centre ( Ontario Ministry of Environment) both use algae as an indicator species in bioassessment studies, and a multi-province study is underway to develop an algal indicator system.
• From 1989 to 2001, the Quebec government used single-metric and multimetric analyses for benthic macroinvertebrate data (i.e., French IBGN index) and for fish (regional IBI). They are currently developing a new method for interpreting benthic macroinvertebrate data based on the RCA approach. The methodology will be based on the RBPs for single and multiple habitats, and will use multimetric and multivariate methods for data analysis. Since 2001, fish
- 28 -
monitoring has been used for special surveys only. Researchers involved in a multi-province study are evaluating algae as potential indicators as well.
• Newfoundland has reduced their level of benthic macroinvertebrate assessment from previous levels due to recent funding cutbacks, and now focuses mostly on water chemistry. They plan to reintroduce bioassessments into their intensive surveys in the future, and to also expand these surveys to include fish.
• New Brunswick uses the SMWCP, but is looking at simpler methodology for benthic macroinvertebrate sampling and analysis. It was noted that Maine’s protocol for assessing benthic macroinvertebrates is costly and very labour intensive, as it uses artificial substrate sampling methodology (requiring multiple site visits per year) and taxonomic identification to lowest possible level. The province is currently in talks with the Canadian Rivers Institute to determine if more simplistic evaluation techniques are available, and in 2004 ran parallel sampling of U-nets with taxonomic identification to family. A report was to be generated over the winter of 2004.
• Prince Edward Island has a long-term water quality monitoring program in place, and over the last three years has begun to include benthic macroinvertebrate monitoring. Benthic macroinvertebrate data are collected at the same sites as water quality data. No specific biocriteria are in place.
• Nova Scotia (specifically the Soil and Water Conservation Society of Metro Halifax) has researchers conducting lake benthic macroinvertebrate studies.
3.5.2 United States of America
A summary of the use of biocriteria in US bioassessment programs in streams and wadeable rivers was compiled by the US EPA in 2001. As of 2001, 37 jurisdictions (i.e., states, tribes, territories and interstate commissions) had bioassessment programs in place for streams and wadeable rivers using fish, 51 had benthic macroinvertebrate programs, and 19 had algae (periphyton and diatoms) programs. A total of 41 programs used more than one assemblage, and the US EPA has made it a priority to promote the use of multiple types of indicator organisms in bioassessment. A total of 31 jurisdictions had narrative statements or numeric biocriteria values in place as part of their Water Quality Standards (WQS) (US EPA 2002a).
US bioassessment programs are split between using multimetric and multivariate methods for data analysis; some states use a combination of both, or include tables and graphs, parametric ANOVAs, disturbance gradients or other assessment techniques. Approximately 96% of states use some kind of biological metric approach, whereas approximately 40% use some kind of multivariate approach (US EPA 2002a). The B-IBI approach is the most widespread multimetric program in the US (Table 7).
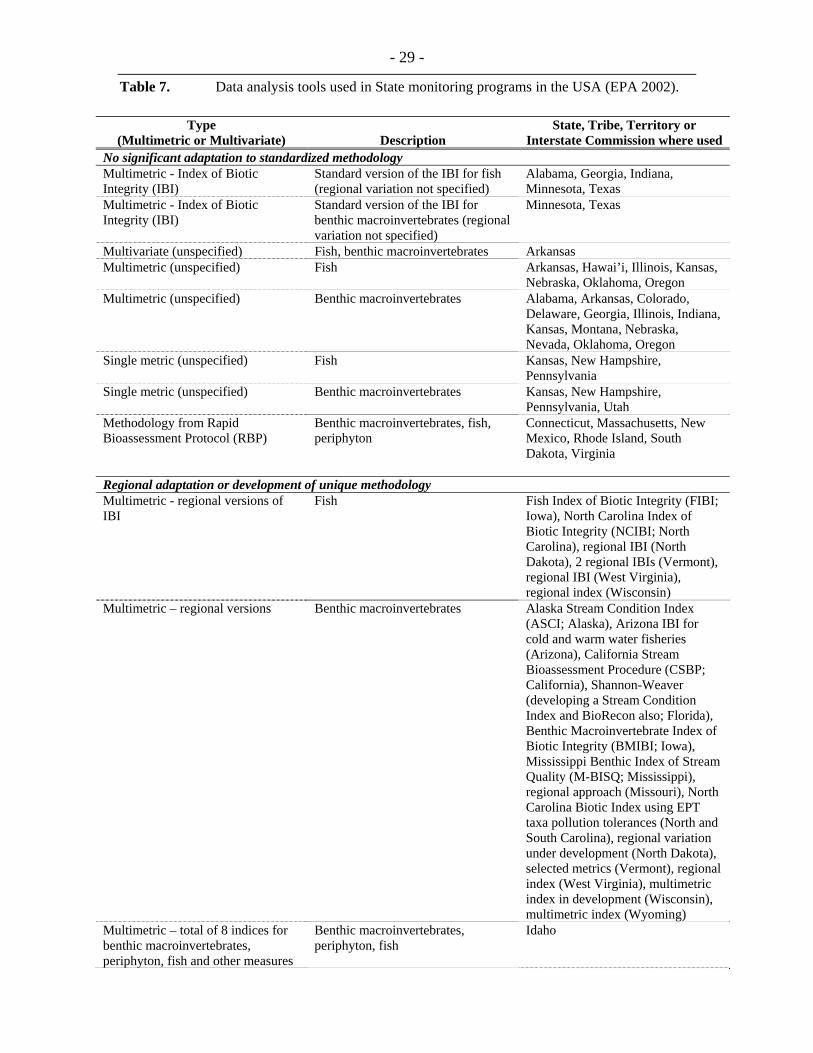
- 29 -
Table 7. Data analysis tools used in State monitoring programs in the USA (EPA 2002).
Type (Multimetric or Multivariate) Description
State, Tribe, Territory or Interstate Commission where used
No significant adaptation to standardized methodology Multimetric - Index of Biotic Integrity (IBI)
Standard version of the IBI for fish (regional variation not specified)
Alabama, Georgia, Indiana, Minnesota, Texas
Multimetric - Index of Biotic Integrity (IBI)
Standard version of the IBI for benthic macroinvertebrates (regional variation not specified)
Minnesota, Texas
Multivariate (unspecified) Fish, benthic macroinvertebrates Arkansas Multimetric (unspecified) Fish Arkansas, Hawai’i, Illinois, Kansas,
Nebraska, Oklahoma, Oregon Multimetric (unspecified) Benthic macroinvertebrates Alabama, Arkansas, Colorado,
Delaware, Georgia, Illinois, Indiana, Kansas, Montana, Nebraska, Nevada, Oklahoma, Oregon
Single metric (unspecified) Fish Kansas, New Hampshire, Pennsylvania
Single metric (unspecified) Benthic macroinvertebrates Kansas, New Hampshire, Pennsylvania, Utah
Methodology from Rapid Bioassessment Protocol (RBP)
Benthic macroinvertebrates, fish, periphyton
Connecticut, Massachusetts, New Mexico, Rhode Island, South Dakota, Virginia
Regional adaptation or development of unique methodology Multimetric - regional versions of IBI
Fish Fish Index of Biotic Integrity (FIBI; Iowa), North Carolina Index of Biotic Integrity (NCIBI; North Carolina), regional IBI (North Dakota), 2 regional IBIs (Vermont), regional IBI (West Virginia), regional index (Wisconsin)
Multimetric – regional versions Benthic macroinvertebrates Alaska Stream Condition Index (ASCI; Alaska), Arizona IBI for cold and warm water fisheries (Arizona), California Stream Bioassessment Procedure (CSBP; California), Shannon-Weaver (developing a Stream Condition Index and BioRecon also; Florida), Benthic Macroinvertebrate Index of Biotic Integrity (BMIBI; Iowa), Mississippi Benthic Index of Stream Quality (M-BISQ; Mississippi), regional approach (Missouri), North Carolina Biotic Index using EPT taxa pollution tolerances (North and South Carolina), regional variation under development (North Dakota), selected metrics (Vermont), regional index (West Virginia), multimetric index in development (Wisconsin), multimetric index (Wyoming)
Multimetric – total of 8 indices for benthic macroinvertebrates, periphyton, fish and other measures
Benthic macroinvertebrates, periphyton, fish
Idaho
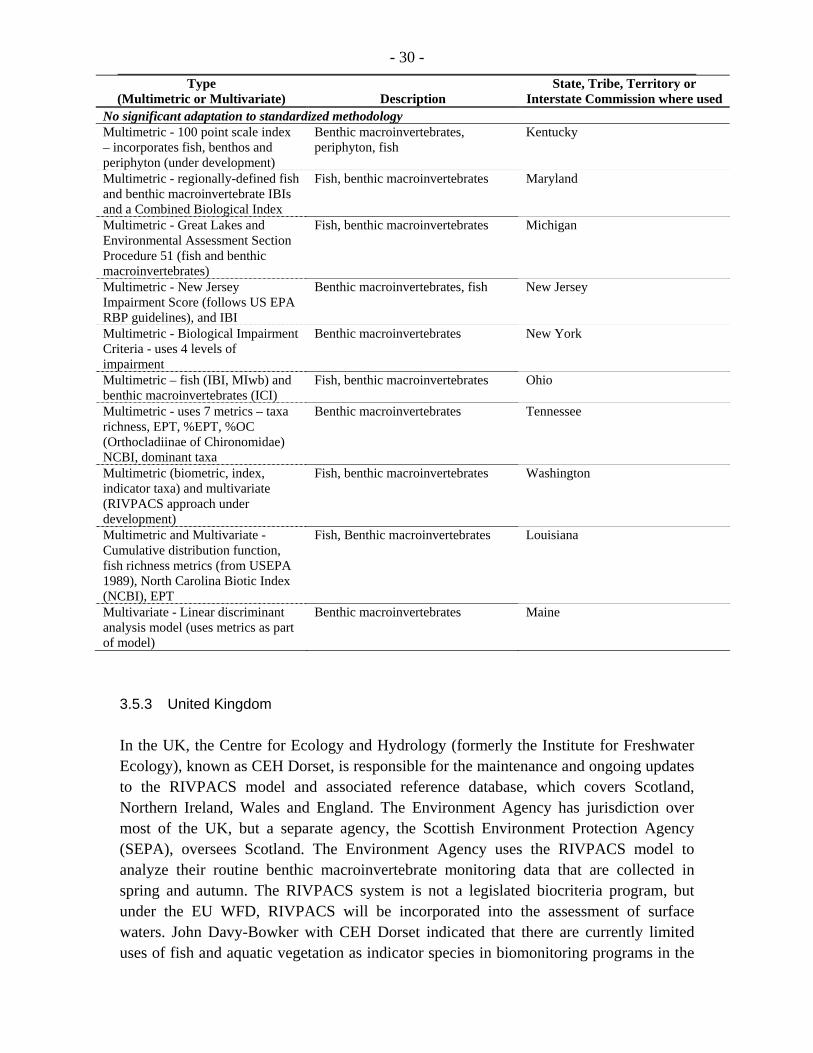
- 30 - Type
(Multimetric or Multivariate) Description State, Tribe, Territory or
Interstate Commission where used No significant adaptation to standardized methodology Multimetric - 100 point scale index – incorporates fish, benthos and periphyton (under development)
Benthic macroinvertebrates, periphyton, fish
Kentucky
Multimetric - regionally-defined fish and benthic macroinvertebrate IBIs and a Combined Biological Index
Fish, benthic macroinvertebrates Maryland
Multimetric - Great Lakes and Environmental Assessment Section Procedure 51 (fish and benthic macroinvertebrates)
Fish, benthic macroinvertebrates Michigan
Multimetric - New Jersey Impairment Score (follows US EPA RBP guidelines), and IBI
Benthic macroinvertebrates, fish New Jersey
Multimetric - Biological Impairment Criteria - uses 4 levels of impairment
Benthic macroinvertebrates New York
Multimetric – fish (IBI, MIwb) and benthic macroinvertebrates (ICI)
Fish, benthic macroinvertebrates Ohio
Multimetric - uses 7 metrics – taxa richness, EPT, %EPT, %OC (Orthocladiinae of Chironomidae) NCBI, dominant taxa
Benthic macroinvertebrates Tennessee
Multimetric (biometric, index, indicator taxa) and multivariate (RIVPACS approach under development)
Fish, benthic macroinvertebrates Washington
Multimetric and Multivariate - Cumulative distribution function, fish richness metrics (from USEPA 1989), North Carolina Biotic Index (NCBI), EPT
Fish, Benthic macroinvertebrates Louisiana
Multivariate - Linear discriminant analysis model (uses metrics as part of model)
Benthic macroinvertebrates Maine
3.5.3 United Kingdom
In the UK, the Centre for Ecology and Hydrology (formerly the Institute for Freshwater Ecology), known as CEH Dorset, is responsible for the maintenance and ongoing updates to the RIVPACS model and associated reference database, which covers Scotland, Northern Ireland, Wales and England. The Environment Agency has jurisdiction over most of the UK, but a separate agency, the Scottish Environment Protection Agency (SEPA), oversees Scotland. The Environment Agency uses the RIVPACS model to analyze their routine benthic macroinvertebrate monitoring data that are collected in spring and autumn. The RIVPACS system is not a legislated biocriteria program, but under the EU WFD, RIVPACS will be incorporated into the assessment of surface waters. John Davy-Bowker with CEH Dorset indicated that there are currently limited uses of fish and aquatic vegetation as indicator species in biomonitoring programs in the
- 31 -
UK, and that under the WFD, new biomonitoring and bioassessment systems will need to be adopted.
3.5.4 Australia
Responses from Australian contacts were limited and, as a result, we were able to collect little information regarding the overall use of biocriteria in Australia. According to the official AUSRIVAS website (CRC for Freshwater Ecology 2004), each state and territory currently has models constructed from single- and multi-seasonal data. Wright et al. (2000) and Bailey et al. (2004) provide a discussions of the development of biocriteria in the form of confidence bands for observed to expected (O/E) ratios. The model outputs from AUSRIVAS have been tailored for a range of users including community groups, managers and ecologists. Although there are numerous bioassessment “streams” or assemblages listed on the site (including benthic macroinvertebrates, fish, diatoms, macrophytes and riparian vegetation), it appears that the macroinvertebrate component is the most developed at present. According to a 2002 report from Environment Australia’s Department of Conservation and Land Management, the potential applications of the AUSRIVAS bioassessment system at the state level include:
• Mandatory State of the Rivers and State of the Environment Reporting;
• As an evaluation of the effects of land and water management programs (e.g., the State Salinity Strategy, Forest Management Plan, activities of the major catchments authorities/natural resource management groups);
• As an evaluation of specific sections of river in response to concerns about river conditions, or as part of environmental impact assessments; and
• For monitoring conditions at high-value sites (Halse et al. 2002).
- 32 -
4.0 CONCLUSIONS AND RECOMMENDATIONS
Since the 1970’s, the concept of using bioassessment to measure the health of aquatic ecosystems has been gaining momentum, leading to the successful incorporation of biomonitoring components which include numeric or narrative biocriteria into surface water monitoring programs in the US, UK, and EU, and to a lesser degree, Canada and Australia. Although this scoping assessment has confirmed that the bioassessment approaches used to define biocriteria vary among jurisdictions, the value of having explicitly defined biocriteria values in national bioassessment programs is clearly apparent, in that they provide agencies with ‘yardsticks’ through which they can measure the impact of human activities on complex biological systems.
There would be considerable utility in adopting nation-wide biocriteria values to assess the environmental quality and ecological integrity of surface waters. This would provide national consistency under federal and provincial environmental assessment programs. A combined, integrated approach to developing and maintaining nation-wide biocriteria values would also provide a useful framework for monitoring and reporting the health of aquatic ecosystems on a national level. However, the planned biocriteria initiative needs to be flexible so that it incorporates features of existing provincial or research-based programs. CCME offers a mechanism to develop biocriteria as a tool to complement chemical-based guidelines and standards.
4.1 Selection of Indicator Organisms
Each type of indicator organism has its own advantages and disadvantages, and consequently situations exist where one assemblage is better suited than others. Each assemblage has unique properties and unique responses to different types of stress, which is a key reason to create assessment programs which incorporate multiple lines of evidence to measure impairments which may be masked by the temporal or spatial habits and/or lack of sensitivity of an individual assemblage.
A large body of knowledge and expertise has developed regarding the use of benthic macroinvertebrates in bioassessment programs worldwide (summarized in Rosenberg and Resh 1993), and much of this information is directly related to the establishment of appropriate biocriteria values. The main advantages to using these organisms include their widespread distribution, the diversity of taxa with similar ranges of responses to environmental stressors, their immobility and ability to convey information regarding localized impacts, inexpensive and rapid sampling, and their relatively well-known taxonomy. Issues with benthic macroinvertebrates include their lack of sensitivity to some stressors, the time and associated cost required for identification, especially to the lower taxonomic levels, seasonal variations in abundance − which affects interpretation if multiple sampling events at different times of the year are evaluated − and the effects of natural conditions such as current or substrate size on distribution and abundance
- 33 -
(Rosenberg and Resh 1993). Given that considerable progress is being made on differentiating the effects of natural variability and land and water uses stressors, and that means to seasonally standardize sampling, benthic macroinvertebrates will continue to attain the main focus in bioassessment programs in Canada. They would serve as an initial assemblage for developing biocriteria values with successive inclusion of algal and fish assemblages. As discussed earlier, the use of multiple indicator assemblages is preferable to using a single indicator, as their inclusion potentially expands the flexibility and sensitivity of the program.
Incorporation of algal assemblages (i.e., diatoms, periphyton) into a bioassessment program offers several advantages. Algal species occur in a wider variety of waters than invertebrates or fish, and are particularly useful as early warning indicators. They are also suited for monitoring very heavily impacted systems where other types of organisms are absent. Algae are at the bottom of the food chain, and therefore have short life cycles relative to organisms such as fish; they respond rapidly to shifts in nutrient concentrations and pollution, and recuperate quickly once the perturbation is removed (Lavoie et al. 2005). In addition, algal assemblages (e.g., diatoms) are relatively easy to sample (US EPA 2002b). They offer considerable potential for development of biocriteria values in North America biomonitoring programs (Stevenson and Pan 1999; Hill et al. 2000; Winter and Duthie 2000), although algal indices and metrics (which would form the basis for biocriteria) are currently much less developed for North American systems than for European ones.
Fish are higher on the food chain than plants and have larger home ranges than invertebrates or plants, which makes them useful for assessing large-scale regional and macrohabitat differences. Most fish species live from 2 to 10 years, and can therefore be used to detect long-term trends in water quality conditions. The taxonomy, distribution, life histories, and environmental stress tolerances of many North American fish species are well known and documented in the literature, and many metric systems exist (e.g., those used in Ohio) which could be expanded and developed into biocriteria values. Fish are highly visible and recognizable components of the aquatic community which increases public interest.
Deficiencies that must be considered when considering the use of fish as indicator organisms are: (i) the limited diversity of a region’s fish fauna compared to its benthic macroinvertebrate fauna and algal flora, particularly in mountain streams where only often one or two fish species occur; (ii) fish sampling is sometimes difficult and labour intensive; (iii) some species (e.g., salmonids) can migrate long distances, and therefore changes in a site’s fish fauna may reflect disturbances many kilometres from the sampled sites; and (iv) they may be subject to selective harvest through commercial, sport, and subsistence fisheries, augmentation through enhancement programs, their distribution may be limited by natural and man-made barriers, and they may be in competition with introduced fish species (including exotic species) and non-fish competitors (e.g., Mysis
- 34 -
relicta). Based on these factors it is possible to identify that while fish may be suitable indicators for localized or regional bioassessments, they are not particularly well-suited for a nation-wide biocriteria initiative at present.
4.2 Development of National Standards for Data Collection and Storage
A first step to implementing a nationally consistent bioassessment program – which includes nationally-applied biocriteria values – should be the creation and implementation of a suite of nation-wide standards for the collection of aquatic community and habitat data. Alternatively or in parallel, a framework could be created to “standardize” interpretation of results obtained from the main bioassessment programs currently in use.
One aspect that is needed is a national dialogue on appropriate thresholds for impairment or a procedure for developing assessment bands. There is also a significant research component to this question, related to reference site definition, classification of reference sites, predictive model building, hypothesis testing procedures and decision thresholds.
Regardless of how the data will ultimately be analysed (e.g., multimetric, multivariate), ensuring that biological data are collected in a consistent or at least comparable manner will make comparisons among studies and regions much easier than they are at present. Even if very different sampling and sample processing methods are used, as long as the different methods, when applied at the same site, give comparable results, the information from different jurisdictions can be synthesized into a national report (Diamond et al. 1996). Ensuring that standard data collection practices are compatible with the methods used by existing biocriteria programs is critical to ensuring their acceptance by the various user groups.
One way of facilitating the acceptance of national data collection standards might be to have an on-line national database to provide a central repository for aquatic monitoring data collected according to the standard methods. The basis for such a storage system is already in place for benthic macroinvertebrates under the national CABIN program. However, building a single database with sufficient flexibility to enable sharing of data from different jurisdictions (which will undoubtedly be collected using different methods) is very complicated and time-consuming, and may not be the most efficient system possible. It may, for example, be better for jurisdictions to manage their own data and agree on a national standard. Standards for data collection could be in the form of the number of replicates taken, the type of sampling equipment used, types of habitat sampled, sampling season, sorting methods, and taxonomic identification keys.
- 35 -
4.3 Multivariate vs. Multimetric-Based Biocriteria
Worldwide, different jurisdictions have followed either the multivariate or the multimetric path to developing bioassessment and biocriteria tools for assessing the state of water quality and ecosystem health. The relative merits of the two approaches, as well as the merits of the different multivariate and multimetric approaches available, have been debated at length (e.g., Barbour et al. 1999), and summarized by Bailey et al. (2004) who contend that the debate regarding various ecosystem assessment methods is focused on details of field and laboratory procedures or data analysis, but actually reflects deeper divisions in perceptions of and philosophical approaches to bioassessment as a whole. A summary of the key characteristics of multivariate and multimetric approaches is provided in Table 8.
Overall, multimetric approaches to developing biocriteria offer the benefit of being intuitively simpler than multivariate methods for end-users to understand, distilling complex taxonomic data sets into single values which can be readily interpreted, in contrast to multivariate approaches, whose complex statistical procedures are often difficult for end-users to comprehend (e.g., the univariate case of comparing a single index against a numeric threshold, versus the multivariate case of measuring multidimensional distance from a test site to a set of reference sites).
As a consequence of the popularity of multimetric-based biocriteria across the USA, they are applicable to (i.e., pre-calibrated for) adjacent regions of Canada, although the multivariate RCA approach is being used in several areas of the country as well. Disadvantages of the multimetric approach are that not all information collected is used, metrics may be redundant in a combination index, and errors can be compounded.
In the context of a Canada-wide program for developing biocriteria target values, both multimetric and multivariate assessment approaches have desirable attributes:
• The multivariate RCA bioassessment tool has already been developed and “piloted” for macroinvertebrates in two diverse areas of Canada (i.e., the Fraser and Georgia basins and Skeena Region in BC, and the Great Lakes area in Ontario). However, the approach needs to incorporate other biological assemblages (e.g., periphyton, diatoms). This should be given high priority to fully utilize the RCA.
• Environment Canada’s CABIN program has already developed a data input/analysis/output interface for the RCA approach, which minimizes model’s apparent complexity for the end-user (in that the end user does not have to do any of the complex calculations), and also enables data storage. This database management system is currently being improved to make it efficient as an archiving, retrieval and analysis tool. The CABIN program has also developed web-based interface, and a training program for end-users.
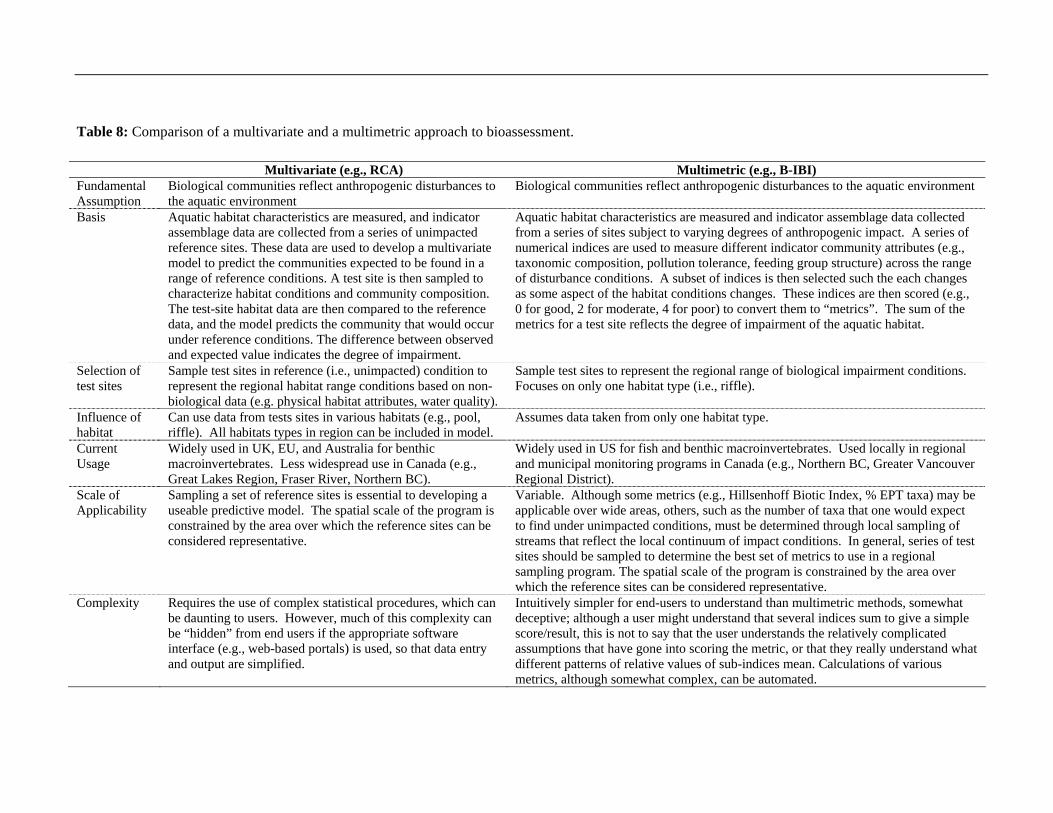
Table 8: Comparison of a multivariate and a multimetric approach to bioassessment.
Multivariate (e.g., RCA) Multimetric (e.g., B-IBI) Fundamental Assumption
Biological communities reflect anthropogenic disturbances to the aquatic environment
Biological communities reflect anthropogenic disturbances to the aquatic environment
Basis Aquatic habitat characteristics are measured, and indicator assemblage data are collected from a series of unimpacted reference sites. These data are used to develop a multivariate model to predict the communities expected to be found in a range of reference conditions. A test site is then sampled to characterize habitat conditions and community composition. The test-site habitat data are then compared to the reference data, and the model predicts the community that would occur under reference conditions. The difference between observed and expected value indicates the degree of impairment.
Aquatic habitat characteristics are measured and indicator assemblage data collected from a series of sites subject to varying degrees of anthropogenic impact. A series of numerical indices are used to measure different indicator community attributes (e.g., taxonomic composition, pollution tolerance, feeding group structure) across the range of disturbance conditions. A subset of indices is then selected such the each changes as some aspect of the habitat conditions changes. These indices are then scored (e.g., 0 for good, 2 for moderate, 4 for poor) to convert them to “metrics”. The sum of the metrics for a test site reflects the degree of impairment of the aquatic habitat.
Selection of test sites
Sample test sites in reference (i.e., unimpacted) condition to represent the regional habitat range conditions based on non-biological data (e.g. physical habitat attributes, water quality).
Sample test sites to represent the regional range of biological impairment conditions. Focuses on only one habitat type (i.e., riffle).
Influence of habitat
Can use data from tests sites in various habitats (e.g., pool, riffle). All habitats types in region can be included in model.
Assumes data taken from only one habitat type.
Current Usage
Widely used in UK, EU, and Australia for benthic macroinvertebrates. Less widespread use in Canada (e.g., Great Lakes Region, Fraser River, Northern BC).
Widely used in US for fish and benthic macroinvertebrates. Used locally in regional and municipal monitoring programs in Canada (e.g., Northern BC, Greater Vancouver Regional District).
Scale of Applicability
Sampling a set of reference sites is essential to developing a useable predictive model. The spatial scale of the program is constrained by the area over which the reference sites can be considered representative.
Variable. Although some metrics (e.g., Hillsenhoff Biotic Index, % EPT taxa) may be applicable over wide areas, others, such as the number of taxa that one would expect to find under unimpacted conditions, must be determined through local sampling of streams that reflect the local continuum of impact conditions. In general, series of test sites should be sampled to determine the best set of metrics to use in a regional sampling program. The spatial scale of the program is constrained by the area over which the reference sites can be considered representative.
Complexity Requires the use of complex statistical procedures, which can be daunting to users. However, much of this complexity can be “hidden” from end users if the appropriate software interface (e.g., web-based portals) is used, so that data entry and output are simplified.
Intuitively simpler for end-users to understand than multimetric methods, somewhat deceptive; although a user might understand that several indices sum to give a simple score/result, this is not to say that the user understands the relatively complicated assumptions that have gone into scoring the metric, or that they really understand what different patterns of relative values of sub-indices mean. Calculations of various metrics, although somewhat complex, can be automated.
• Aquatic habitat conditions vary widely among Canadian regions, but the RCA is able to account for much of this variability, provided a suitable range of sites are sampled to define the reference condition.
• Unlike multimetric approaches, the RCA approach does not require prior identification of specific anthropogenic stressors and their effects on benthic communities. However, there is no reason why multimetric indices cannot be used within an RCA classification scheme (e.g., the RIVPACS and BEAST models are capable of calculating additional metrics or indices). Various multivariate and multimetric approaches can therefore be combined within a more generalized biocriteria framework.
• The RCA assessment methodology is more consistent among different regions. Once the RCA model contains sufficient reference sites in its database to cover the range of habitats present across Canada, the results from one region should be comparable to all regions provided the same sampling and analytical methods are applied. This contrasts with the B-IBI multimetric approach, where the use of different or modified metrics in different regions makes inter-regional comparisons difficult, unless, as in the case of Ohio, overarching aquatic life use designations are applied across all regions.
On the other hand, the RCA model itself does not indicate causes of stress, whereas metrics focused on specific perturbation (e.g., sedimentation, acidification, organic pollution) and multimetric approaches that look at numerous attributes of an assemblage (e.g., the pollution tolerance, life span and life history of individual species) will provide a more detailed linkage between the causes of perturbation with effects on the local biota.
Upon examining the relative merits of the two approaches, and after seeing how both can be combined (as by the UK and Canada), the use of multivariate approach that accommodates multiple biological assemblages as a base is recommended, with the option of calculating additional metrics from the baseline data sets. This approach would offer the greatest flexibility and benefit for use in a nation-wide Canadian bioassessment/ biocriteria program.
A number of important issues that will need to be considered in establishing a national biocriteria program include:
• High initial cost of collecting sufficient samples to define reference conditions in various regions of Canada. The need for this should be assessed by canvassing the various jurisdictions and agencies and by evaluating the flexibility of incorporating their ongoing biological monitoring activities.
• Nationally consistent guidelines/guidance are needed to identify the number of reference sites to be sampled in a given region, the allowable amount of variability among reference sites, the sampling methods, indicator assemblages, and the appropriate level of taxonomic resolution.
• Any nation-wide program should ideally incorporate the results of existing and historic data-collection efforts (e.g., EEM, long-term biomonitoring programs, follow-up monitoring done under CEAA). The program should be as inclusive as possible, so as not to lose historical data. In cases where substantial long-term databases exist, an effort should be made to “translate” previous data into a format that can be used, or compared with, the RCA approach (as being undertaken in the Skeena Region of British Columbia). From this inclusive approach, further standardizing of data collection and assessment methods can proceed over time, without sacrificing previous investments.
Ultimately, the incorporation of biocriteria into Canadian environmental quality assessment tools (e.g., environmental quality guidelines and standards) for determining impairment of designated aquatic life uses will require considerable time, effort, and commitment. Given the proven utility of biocriteria as evaluation tools for environmental assessment elsewhere in the world, this effort is likely to prove worthwhile. A national biocriteria system will provide regulatory agencies with an enhanced ability to identify and respond to anthropogenic disturbances to surface waters, and will also serve as a yardstick for assessing the success of environmental improvement programs.
4.4 Setting Biocriteria Values
The key challenge in developing a national system of biocriteria values is reaching a national consensus on what constitutes “impairment” in indicator assemblages, be they benthic macroinvertebrates, algae, or fish. The level of conservatism is also important; if the biocriterion value errs on the side of conservatism, there is the potential to create huge costs for implementing expensive pollution abatement technologies and best management practices when they may not be warranted. Alternatively, if biocriteria values are too lenient, damage to indicator species communities will occur, and if the incremental impacts are too small to be captured, larger cumulative effects will eventually occur, and may be irreparable by the time they are measured.
At this point, best professional judgement is relied on heavily for assessment of biological data, and one of our interviewees commented that, although national water and sediment quality guidelines exist as single values applicable across the country, biological data may be too complex to develop single values because they require incorporation of other measurements, statistical methods and study designs to have scientific validity. The issue of determining appropriate levels of allowable impairment, or conversely, defining the desired biological state or biocriterion, has already been faced
in Canada with the federal EEM program (does a less than 25% decrease in fish fecundity indicate no impairment to the community as a whole?) and the existing RCA / BEAST system (is a site falling within the 90% confidence ellipse surrounding a group of reference sites good enough to be called normal or un-stressed?).
Valuable information on setting appropriate biocriteria values can be obtained from evaluating the success of large-scale bioassessment intercalibration efforts in Europe, and examining how individual states develop and define biocriteria in the US. Considerable discussion must occur among Canadian provincial and territorial representatives to first determine an appropriate level of effort in developing a national bioassessment/biocriteria (i.e., use of a single assemblage, or multiple assemblages) and appropriate values for biocriteria (i.e., what level of protection is needed to protect the integrity of indicator assemblages). The CCME WQI process provided a forum for significant input and consensus building around that index and could be used as a model for developing national biocriteria through CCME.
5.0 REFERENCES
Anderson, A.M. 1990. Selected methods for the monitoring of benthic invertebrates in Alberta rivers. Surface Water Assessment Branch, Alberta Environmental Protection, Edmonton.
Bailey, R.C., R.H. Norris, and T.B. Reynoldson. 2004. Bioassessment of Freshwater Ecosystems Using the Reference Condition Approach. Kluwer Academic Publishers, Boston, MA, USA. 167 pp.
Barbour, M.T., J. Garritsen, B.D. Snyder, and J.B. Stribling. 1999. Rapid Bioassessment Protocols for Use in Streams and Wadeable Rivers: Periphyton, Benthic Macroinvertebrates and Fish, Second Edition. EPA 841-B-99-002. US Environmental Protection Agency, Office of Water, Washington, DC. 339 pp.
Barbour, M.T., W.F. Swietlik, S.K. Jackson, D.L. Courtemanch, S.P. Davies, and C.O. Yoder. 2000. Measuring the attainment of biological integrity in the USA: A critical element of ecological integrity. Hydrobiologia 422/423: 453-464.
Carr, G.M., P.A. Chambers, and A. Morin. 2005. Periphyton, water quality, and land use at multiple spatial scales in Alberta rivers. Can. J. Fish. Aquat. Sci. 62: 1309-1319.
CEH Dorset. 2003a. The RIVPACS Type Approach to Bioassessment of Rivers: Calculating Biotic Indices. Centre for Ecology and Hydrology. Dorchester, Dorset, UK <www.dorset.ceh.ac.uk/River_Ecology/River_Communities/Rivpacs_2003/ rivpacs_biotic_indices.htm> Last Updated December 13, 2003.
CEH Dorset. 2003b. The RIVPACS Type Approach to Bioassessment of Rivers: Australia. Centre for Ecology and Hydrology. Dorchester, Dorset, UK <www.dorset.ceh.ac.uk/ River_Ecology /River_Communities/ Rivpacs_2003/ rivpacs_australia.htm> Last Updated December 13, 2003.
Clarke, R.T., M.T. Furse, J.F. Wright, and D. Moss. 1996 Derivation of a biological quality index for river sites: comparison of the observed with the expected fauna. Journal of Applied Statistics 23: 311-322.
CRC for Freshwater Ecology. 2004. AUSRIVAS: Australian Rivers Assessment System. Cooperative Research Centre for Freshwater Ecology, University of Canberra, Canberra, ACT, Australia. < http://ausrivas.canberra.edu.au>. Last Updated: November 18, 2004.
Davies, S.P., L. Tsomides, J.L. DiFranco, and D.L. Courtemanch. 1999. Biomonitoring retrospective: fifteen years summary for Maine rivers and streams. DEPLW1999-26. State of Maine Department of Environmental Protection, Division of Environmental Assessment, Bureau of Land and Water Quality, Augusta, Maine. 178 pp.
Department of the Environment and Heritage (DEH). 2004. The National River Health Program. Department of the Environment and Heritage, Canberra ACT, Australia. < http://www.deh.gov.au/water/rivers/nrhp/about>. Last Updated: November 26, 2004.
DeShon, J.D. 1995. Development and application of the invertebrate community index (ICI). pp. 217-243. In: Biological Assessment and Criteria: Tools for Risk-based Planning and Decision Making. W.S. Davis and T. Simon (eds.). Lewis Publishers, Boca Raton, FL.
Diamond, J.M., M.T. Barbour, and J.B. Stribling. 1996. Characterizing and comparing bioassessment methods and their results: a perspective. J. N. Am. Benthol. Soc. 15: 713-727.
Environment Agency. 2004. Briefing Note: River Basin Characterisation and the Water Framework Directive. Environment Agency, Bristol, UK.
Environment Canada. 2003. Benthic Assessment of Sediment (BEAST). National Water Research Institute. <www.nwri.ca/cgi-bin/mfs/01/nwri/issues/cabin/beast-e.html> Last Updated January 3, 2003.
European Commission Representation in the United Kingdom. 2004. History of UK membership in the EU. < www.cec.org.uk/about/history.htm> Last Updated October 13, 2004.
FAME. 2005. Development, Evaluation and Implementation of a Standardised Fishbased Assessment Method for the Ecological Status of European Rivers. A Contribution to the Water Framework Directive. Contract No: EVK1 -CT-2001-00094. < http://fame.boku.ac.at/>
Fausch, K.D., J.R. Karr, and P.R. Yant. 1984. Regional application of an index of biotic integrity based on stream fish communities. Trans. Am. Fish. Soc. 113: 39-55.
Gammon, J.R. 1976. The fish populations of the middle 340 km of the Wabash River. Tech. Rep. 86. Purdue Univ. Water Resour. Res. Center, West Lafayette, IN.
Gammon, J.R., A. Spacie, J.L. Hamelink, and R.L. Kaesler. 1981. Role of electrofishing in assessing environmental quality of the Wabash River. pp. 307-24. In: Ecological Assessments of Effluents Impacts on Communities of Indigenous Aquatic Organisms. J.M. Bates and C.I. Weber (eds.). STP 703. American Society for Testing and Materials. 307 pp.
Halse, S.A., M.D. Scanlon, and J.S. Cocking. 2002. Australia-wide Assessment of River Health – Western Australian Bioassessment Report (Milestone Report 5 and Final Report). Monitoring River Health Initiative Technical Report, Report Number 7. Commonwealth of Australia and Department of Conservation and Land Management, Canberra and Wanneroo, Canberra, ACT, Australia. 96 pp.
Harper, D.M., J.L. Kemp, B. Vogel, and M. D. Newson. 2000. Towards the assessment of ‘ecological integrity’ in running waters of the United Kingdom. Hydrobiologia 422/423: 133-142.
Heiskanen, A.S., W. v.d. Bund, A.C. Cardoso, and P. Noges. 2004. Ecological quality assessment in the EU Water Framework Directive -- a new approach for protection of aquatic ecosystem, Chapter 16. In: Drainage Basin Nutrient Inputs and Eutrophication: an Integrated Approach. P. Wassmann and K. Olli (Eds.). Norwegian College of Fishery Science, University of Tromso, Tromso, Norway and Institute of Botany and Ecology, Tartu University, Tartu, Estonia. <http://lepo.it.da.ut.ee/~olli/eutr/html/htmlBook_0.html> Last Updated September 2, 2004.
Hering, D., O. Moog, L. Sandin, and P.F.M Verdonschot. 2004. Overview and application of the AQEM assessment system. Hydrobiologia 516: 1-20.
Hill, B.H., A.T. Herlihy, P.R. Kaufmann, R.J. Stevenson, F.H. McCormick and C. Burch Johnson. 2000. Use of periphyton assemblage data as an index of biotic integrity. J. N. Am. Benthol. Soc. 19(1): 50-67.
Karr, J. R. and D. R. Dudley. 1981. Ecological perspective on water quality goals. Environmental Management 5: 55-68.
Kerans, B.L. and J.R. Karr. 1994. A benthic index of biotic integrity (B-IBI) for rivers of the Tennessee Valley. Ecological Applications 4(4):768-785.
Kleindl, W.J. 1995. A benthic index of biotic integrity for Puget Sound Lowland streams, Washington, USA. Masters Thesis University of Washington, College of Forest Resources. 59 pp. + appendices.
Lavoie, I., S. Campeau, P. Dillon, P. Hamilton, K. Somers, A. Paterson, J. Winter, M.A. Fallu, and M. Grenier. 2005. Diatom-based indices for water quality assessment in eastern Canada. Unpublished manuscript.
Moss, D., M.T. Furse, J.F. Wright, and P.D. Armitage. 1987 The prediction of the macro-invertebrate fauna of unpolluted running-water sites in Great Britain using environmental data. Freshwater Biology 17: 41-52.
Ohio Environmental Protection Agency. 1987. Biological criteria for the protection of aquatic life, Volume II: Users manual for biological field assessment of Ohio surface waters. Division of Water Quality Monitoring and Assessment, Surface Water Section, Columbus, OH.
Reynoldson, T.B., C. Logan, T. Pascoe, and S.P. Thompson. 2003. CABIN (Canadian Aquatic Biomonitoring Network) Invertebrate Biomonitoring Field and Laboratory Manual. Environment Canada National Water Research Institute, Burlington, ON. 47 pp.
Rosenberg, D.M., and V.H. Resh. 1993. Introduction to Freshwater Biomonitoring and Benthic Macroinvertebrates. pp. 1-9 In: Freshwater Biomonitoring and Benthic Macroinvertebrates. Rosenberg, D.M., and V.H. Resh (eds.). Chapman and Hall, New York, NY.
Rosenberg, D.M., T.B. Reynoldson, and V.H. Resh. 1999. Establishing reference conditions for benthic invertebrate monitoring in the Fraser River catchment, British Columbia, Canada. DOE-FRAP 1998-32. Environment Canada, Aquatic and Atmospheric Sciences Division, Environmental Conservation Branch, Vancouver, BC. 149 pp.
Sandin, L., and D. Hering. 2004. Comparing macroinvertebrate indices to detect organic pollution across Europe: a contribution to the EC Water Framework Directive Intercalibration. Hydrobiologia 516: 55-68.
Sosiak, A. 2002. Long-term response of periphyton and macrophytes to reduced municipal nutrient loading to the Bow River (Alberta, Canada). Can. J. Fish. Aquat. Sci. 59: 987–1001.
Simpson, J., and R.H. Norris. 2000. Biological assessment of water quality: development of AUSRIVAS models and outputs. In RIVPACS and similar techniques for assessing the biological quality of fresh waters (eds. J.F. Wright, D.W. Sutcliffe, and M.T. Furse), pp. 125-142. Freshwater Biological Association and Environment Agency, Ableside, Cumbria, U.K.
STAR. 2004. Background of the project, scientific/technical objectives and innovation. A research project supported by the European Commission under the Fifth Framework Programme, Contract No. EVK1-CT 2001-00089. <www.eu-star.at/mains/text_background.htm> Last Updated: August 12, 2004.
State of Maine Department of Environmental Protection (DEP). 2002. River and stream biological monitoring program frequently asked questions. DEP LW0561. Maine DEP, Augusta, Maine. 8 pp.
State of Ohio Environmental Protection Agency (EPA). 1988. Part C: Biological criteria development. In: Biological Criteria for the Protection of Aquatic Life: Volume I: The Role of Biological Data in Water Quality Assessment. Doc. 0055e/0015e. Ohio EPA Ecological Assessment Section, Division of Water Quality, Planning and Assessment, Columbus, OH.
Stevenson, R.J., and Y. Pan. 1999. Assessing environmental conditions in rivers and streams with diatoms. pp. 11-40. In: The Diatoms: Applications for the Environmental and Earth Sciences. E.F. Stoermer and J.P. Smol (eds.). Cambridge University Press, Cambridge, UK.
Sylvestre, S. M. Fluegel, and T. Tuominen. 2005. Benthic invertebrate assessment of streams in the Georgia Basin using the Reference Condition Approach: Expansion of the Fraser River invertebrate monitoring program 1998-2002. EC/GB/04/81. Environment Canada Environmental Conservation Branch, Aquatic and Atmospheric Sciences Division, Vancouver, BC. 194 pp.
US EPA. 1991. Policy on the use of biological assessments and criteria in the water quality program. U.S. Environmental Protection Agency, Office of Science and Technology, Washington, DC.
US EPA. 2002a. Summary of biological assessment programs and biocriteria development for states, tribes, territories, and interstate commissions: Streams and wadeable rivers/ EPA-822-R-02-048. U.S. Environmental Protection Agency, Office of Environmental Information and Office of Water, Washington, DC.
US EPA. 2002b. Biological indicators of watershed health: periphyton as indicators. US EPA, Washington, DC. <http://www.epa.gov/bioindicators/html/periphyton. html>. Last Updated: August 2, 2002.
US EPA. 2002c. Biological indicators of watershed health: fish as indicators. From: Simon and Lyons, Table 1, Application of the Index of Biotic Integrity to Evaluate Water Resource Integrity in Freshwater Ecosystems, Chapter 16, in Davis and Simon (eds.) 1995. Biological Assessment and Criteria – Tools for Water Resource Planning and Decision Making. US EPA, Washington, DC. <http://www.epa.gov/bioindicators/html/fish.html>. Last Updated: August 2, 2002.
US EPA. 2004. Case Studies: Setting Ecologically-Based Water Quality Goals, Ohio's Tiered Aquatic Life Use Designations Turn 20 Years Old. US EPA, Washington, DC. <http://www.epa.gov/waterscience/biocriteria/casestudies/aquaticlifeohio. html> Last Updated: Wednesday, October 6, 2004.
Volstad, J.H., N.E. Roth, G. Mercurio, M.T. Southerland, and D.E. Strebel. 2003. Using environmental stressor information to predict the ecological status of Maryland non-tidal streams as measured by biological indicators. Environmental Monitoring and Assessment 84: 219-242.
Water Framework Directive. 2003. Overall Approach to the Classification of Ecological Status and Ecological Potential. Water Framework Directive Common Implementation Strategy Working Group 2 A Ecological Status (ECOSTAT).
Winter, J.G., and H.C. Duthie. 2000. Epilithic diatoms as indicators of stream total N and total P concentration. J. N. Am. Benthol. Soc. 19(1):32-49.
Wright, J.F., D.W. Sutcliffe, and M.T. Furse. 2000. Assessing the biological quality of fresh waters – RIVPACS and other techniques. The Freshwater Biological Association, Ambleside, UK. 400 pp.
Yoder, C.O., and E.T. Rankin. 1998. The role of biological indicators in a state water quality management process. Environmental Monitoring and Assessment 51: 61-88.
6.0 PERSONAL COMMUNICATIONS
Baird, D. 2004. Personal communication (telephone conversation with L. Holt, EVS-Golder Associates Ltd., North Vancouver, BC). Researcher, Head of CABIN, National Water Research Institute, Environment Canada and University of New Brunswick, Fredericton, NB. 9 December.
Charles, D. 2004. Personal communication (telephone conversation with L. Holt, EVS-Golder Associates Ltd., North Vancouver, BC). Phycology Section Leader, Patrick Center for Environmental Research, Academy of Natural Sciences, Philadelphia, PA, USA. 2 December.
Chessman, B. 2004. Personal communication (email correspondence with L. Holt, EVS-Golder Associates Ltd., North Vancouver, BC). Principal Aquatic Ecologist, Centre for Natural Resources, NSW Department of Infrastructure, Planning and Natural Resources, Parramatta, NSW, Australia. 5 December.
Davy-Bowker, J. 2005. Personal communication (telephone conversation with L. Holt, EVS-Golder Associates Ltd., North Vancouver, BC). Researcher, Centre for Ecology and Hydrology Dorset, Dorchester, Dorset, UK. 25 January.
Grapentine, L. 2004. Personal communication (telephone conversation with L. Holt, EVS-Golder Associates Ltd., North Vancouver, BC). Researcher, National Water Research Institute, Environment Canada, Burlington, ON. 24 November.
Stevenson, R.J. 2004. Personal communication (telephone conversation with L. Holt, EVS-Golder Associates Ltd., North Vancouver, BC). Professor, Department of Zoology, Michigan State University, East Lansing, MI, USA. 29 November.
APPENDIX 1
FIELD DATASHEET FORM

Agency: Contact:
Project Ref. No.: Date:
Area: 1. DATA SOURCE a) Source of data used to complete this form i) What was the information source reviewed concerning
this biocriteria initiative? Interview Data Report Methodology description Other document _________________________________
2. BIOCRITERIA a) What type of biocriteria were employed by this initiative? i) What type(s) of receiving environments are assessed? Streams/creeks
Rivers Lakes Ocean Wetland Other _____________________________________
ii) What type(s) of are used? Benthic macroinvertebrates (to what taxonomic level?) Fish Vegetation Combination _______________________________ Other _____________________________________
iii) Numeric or narrative biocriteria? Numeric – single metric Numeric – multimetric Numeric – multivariate Narrative Other _____________________________________
iv) Absolute or relative biocriteria? Absolute measure of environmental quality/health Relative measure (e.g., reference condition approach) Other _____________________________________
v) What is the focus of the evaluation (Is there a specific pollutant of interest)?
General ecosystem health Industry-specific (e.g., metal mines, pulp mills) Pollutant-specific (e.g., stormwater, WWTP effluent) Unspecified Other______________________________________
b) What is the scope of this biocriteria initiative? i) Spatial scale? Municipal/Regional
Province or State-Wide National Unspecified Other _______________________________________
ii) Location? iii) What is the cost of running this initiative?
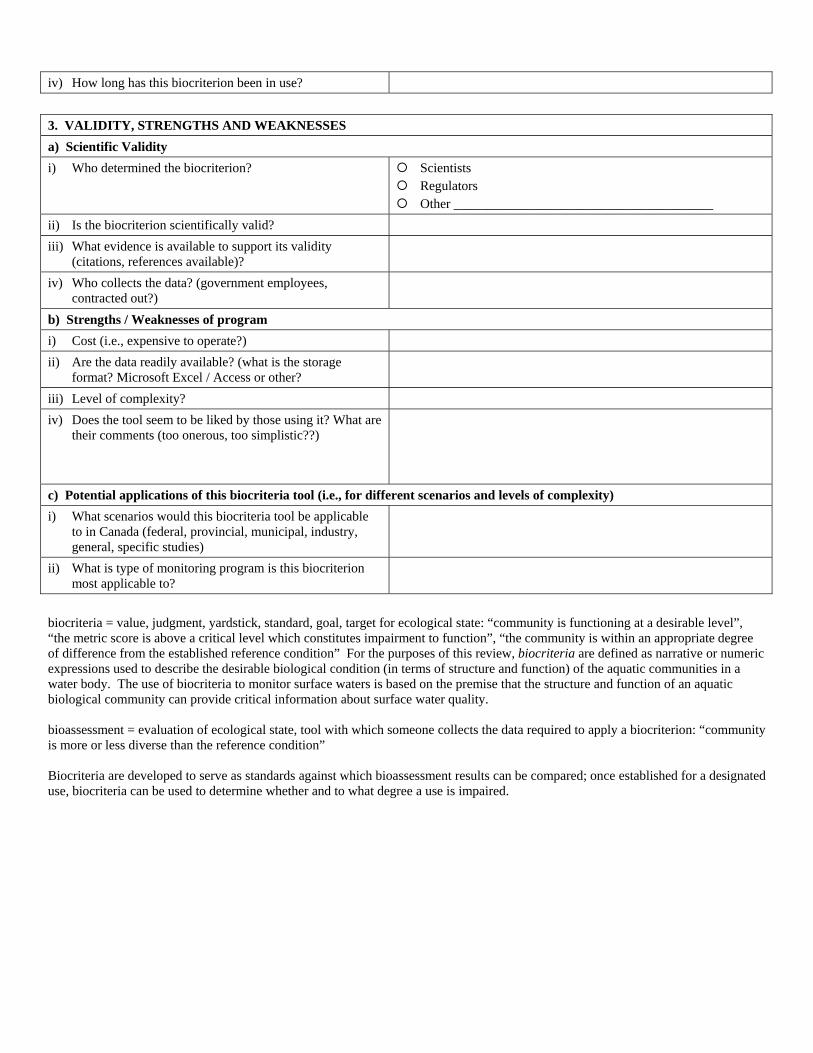
iv) How long has this biocriterion been in use? 3. VALIDITY, STRENGTHS AND WEAKNESSES a) Scientific Validity i) Who determined the biocriterion? Scientists
Regulators Other _______________________________________
ii) Is the biocriterion scientifically valid? iii) What evidence is available to support its validity
(citations, references available)?
iv) Who collects the data? (government employees, contracted out?)
b) Strengths / Weaknesses of program i) Cost (i.e., expensive to operate?) ii) Are the data readily available? (what is the storage
format? Microsoft Excel / Access or other?
iii) Level of complexity? iv) Does the tool seem to be liked by those using it? What are
their comments (too onerous, too simplistic??)
c) Potential applications of this biocriteria tool (i.e., for different scenarios and levels of complexity) i) What scenarios would this biocriteria tool be applicable
to in Canada (federal, provincial, municipal, industry, general, specific studies)
ii) What is type of monitoring program is this biocriterion most applicable to?
biocriteria = value, judgment, yardstick, standard, goal, target for ecological state: “community is functioning at a desirable level”, “the metric score is above a critical level which constitutes impairment to function”, “the community is within an appropriate degree of difference from the established reference condition” For the purposes of this review, biocriteria are defined as narrative or numeric expressions used to describe the desirable biological condition (in terms of structure and function) of the aquatic communities in a water body. The use of biocriteria to monitor surface waters is based on the premise that the structure and function of an aquatic biological community can provide critical information about surface water quality. bioassessment = evaluation of ecological state, tool with which someone collects the data required to apply a biocriterion: “community is more or less diverse than the reference condition” Biocriteria are developed to serve as standards against which bioassessment results can be compared; once established for a designated use, biocriteria can be used to determine whether and to what degree a use is impaired.

APPENDIX 2
LIST OF DOCUMENTS REVIEWED
List of Documents Reviewed
Bailey, R.C., R.H. Norris, and T.B. Reynoldson. 2004. Bioassessment of Freshwater Ecosystems Using the Reference Condition Approach. Kluwer Academic Publishers, Boston, MA, USA. 167 pp.
Barbour, M.T., J. Garritsen, B.D. Snyder, and J.B. Stribling. 1999. Rapid Bioassessment Protocols for Use in Streams and Wadeable Rivers: Periphyton, Benthic Macroinvertebrates and Fish, Second Edition. EPA 841-B-99-002. US Environmental Protection Agency, Office of water, Washington, DC. 339 pp.
Barbour, M.T., S.B. Norton, H.R. Preston, and K.W. Thornton (eds.). 2000. Ecological Assessment of Aquatic Resources: Linking Science to Decision Making. Proceedings from the Workshop on Ecological Assessment of Aquatic Resources: Application, Implementation and Communication, Pellston, MI, USA September 16-21 2000. SEATAC, Raleigh, NC, USA.
Barbour, M.T., W.F. Swietlik, S.K. Jackson, D.L. Courtemanch, S.P. Davies, and C.O. Yoder. 2000. Measuring the attainment of biological integrity in the USA: a critical element of ecological integrity. Hydrobiologia 422/423: 453-464.
Bennett, S. 2004. Benthic invertebrate index of biological integrity: 2003 field season results for streams in the Skeena Stikine Forest District. Prepared for Community Futures Development Corporation of Nadina, Pacific Inland Resources, BC Ministry of Water, Land and Air Protection and Kispiox BC Timber Sales. Bio-Logic Consulting, Terrace, BC. 47 pp. + appendices.
Bennett, S. and K. Rysavy. 2003. A benthic invertebrate index of biological integrity for streams in the Bulkley TSA, Field season 2002. Prepared for Pacific Inland Resources and BC Ministry of Water, Land and Air Protection, Smithers, BC. Bio-Logic Consulting, Terrace, BC. 47 pp. + appendices.
Chessman, B.C., and M.J. Royal. 2004. Bioassessment without reference sites: use of environmental filters to predict natural assemblages of river macroinvertebrates. J.N. Am. Benthol. Soc. 23(3): 599-615.
Davies, S.P., L. Tsomides, J.L. DiFranco, and D.L. Courtemanch. 1999. Biomonitoring retrospective: fifteen years summary for Maine rivers and streams. DEPLW1999-26. State of Maine Department of Environmental Protection, Division of Environmental Assessment, Bureau of Land and Water Quality, Augusta, Maine. 178 pp.
Engel, S.R., and J.R. Voshell Jr. 2002. Volunteer biological monitoring: can it accurately assess the ecological condition of streams? American Entomologist. Fall 2002: 164-177.
Environment Canada. 2003. Benthic Assessment of Sediment (BEAST). National Water Research Institute. <www.nwri.ca/cgi-bin/mfs/01/nwri/issues/cabin/beast-e.html> Last Updated January 3, 2003.
Environment Canada. 2004. Pulp and Paper EEM Technical Guidance Document. National Water Research Institute. <www.ec.gc.ca/eem/English/PulpPaper/ Guidance/default.cfm>. Last Updated August 12, 2004.
Fore, L.S., K. Paulsen, and K. O’Laughlin. 2001. Assessing the performance of volunteers in monitoring streams. Freshwater Biology 46: 109-123.
Harper, D.M., J.L. Kemp, B. Vogel, and M. D. Newson. 2000. Towards the assessment of ‘ecological integrity’ in running waters of the United Kingdom. Hydrobiologia 422/423: 133-142.
Hering, D., O. Moog, L. Sandin, and P.F.M Verdonschot. 2004. Overview and application of the AQEM
assessment system. Hydrobiologia 516: 1-20.
Hill, B.H., A.T. Herlihy, P.R. Kaufmann, R.J. Stevenson, F.H. McCormick, and C. Burch Johnson. 2000. Use of periphyton assemblage data as an index of biotic integrity. J. N. Am. Benthol. Soc. 19(1): 50-67.
Karr, J.R., and D.R. Dudley. 1981. Ecological perspective on water quality goals. Environmental Management 5: 55-68.
Karr, J.R. 1998. Rivers as sentinels: using the biology of rivers to guide landscape management. In: R.J. Naiman and R.E. Bilby (Eds.). River ecology and management: lessons from the Pacific coastal ecosystem. Springer, New York. pp 502-528.
Karr, J.R., and E.W. Chu. 2000. Sustaining living rivers. Hydrobiologia. 422/423: 1-14.
Kerans, B.L., and J.R. Karr. 1994. A benthic index of biotic integrity (B-IBI) for rivers of the Tennessee Valley. Ecological Applications 4(4):768-785.
Reynoldson, T.B. 2002. RCA short course introduction. From the 29th Annual Aquatic Toxicity Workshop in Whistler, British Columbia, October 20–23, 2002. Environment Canada, National Water Research Institute, Wolfville, NS.
Reynoldson, T.B., and D.M. Rosenberg. 1999. Benthic invertebrate community structure. pp. 109-122. In: Health of the Fraser River Aquatic System: A Synthesis of Research Conducted under the Fraser River Action Plan, Volume II. DOE FRAP 1998-11. C. Gray and T. Tuominen (eds.). Aquatic and Atmospheric Sciences Division, Environment Canada, Vancouver, BC.
Reynoldson, T.B., C. Logan, T. Pascoe, and S.P. Thompson. 2003. CABIN (Canadian Aquatic Biomonitoring Network) Invertebrate Biomonitoring Field and Laboratory Manual. Environment Canada, National Water Research Institute, Burlington, ON. 47 pp.
Rosenberg, D.M., and V.H. Resh (eds.). 1993. Freshwater Biomonitoring and Benthic Macroinvertebrates. Chapman and Hall, New York, NY. 488 pp.
Rosenberg, D.M., T.B. Reynoldson, and V.H. Resh. 1999. Establishing reference conditions for benthic invertebrate monitoring in the Fraser River catchment, British Columbia, Canada. DOE-FRAP 1998-32. Environment Canada, Aquatic and Atmospheric Sciences Division, Environmental Conservation Branch, Vancouver, BC. 149 pp.
Sandin, L., and D. Hering. 2004. Comparing macroinvertebrate indices to detect organic pollution across Europe: a contribution to the EC Water Framework Directive intercalibration. Hydrobiologia 516: 55-68.
STAR. 2004. Background of the project, scientific/technical objectives and innovation. A research project supported by the European Commission under the Fifth Framework Programme, Contract No. EVK1-CT 2001-00089. <www.eu-star.at/mains/text_background.htm> Last Updated 08/12/04.
State of Maine Department of Environmental Protection (DEP). 2002. River and stream biological monitoring program frequently asked questions. DEP LW0561. Maine DEP, Augusta, Maine. 8 pp.
State of Ohio Environmental Protection Agency (EPA). 1988. Part C: Biological criteria development. In:
Biological Criteria for the Protection of Aquatic Life: Volume I: The Role of Biological Data in Water Quality Assessment. Doc. 0055e/0015e. Ohio EPA Ecological Assessment Section, Division of Water Quality, Planning and Assessment, Columbus, OH.
Stevenson, R.J., and Y. Pan. 1999. Assessing environmental conditions in rivers and streams with diatoms. pp. 11-40. In: The Diatoms: Applications for the Environmental and Earth Sciences. E.F. Stoermer and J.P. Smol (eds.). Cambridge University Press, Cambridge, UK.
Sylvestre, S. M. Fluegel, and T. Tuominen. 2005. Benthic invertebrate assessment of streams in the Georgia Basin using the Reference Condition Approach: Expansion of the Fraser River invertebrate monitoring program 1998-2002. EC/GB/04/81. Environment Canada Environmental Conservation Branch, Aquatic and Atmospheric Sciences Division, Vancouver, BC. 194 pp.
US EPA. 1991. Policy on the use of biological assessments and criteria in the water quality program. U.S. Environmental Protection Agency, Office of Science and Technology, Washington, DC.
US EPA. 2002. Summary of biological assessment programs and biocriteria development for states, tribes, territories, and interstate commissions: Streams and wadeable rivers/ EPA-822-R-02-048. U.S. Environmental Protection Agency, Office of Environmental Information and Office of Water, Washington, DC.
Volstad, J.H., N.E. Roth, G. Mercurio, M.T. Southerland, and D.E. Strebel. 2003. Using environmental stressor information to predict the ecological status of Maryland non-tidal streams as measured by biological indicators. Environmental Monitoring and Assessment 84: 219-242.
Water Framework Directive. 2003. Overall Approach to the Classification of Ecological Status and Ecological Potential. Water Framework Directive Common Implementation Strategy Working Group 2 A Ecological Status (ECOSTAT).
Winter, J.G., and H.C. Duthie. 2000. Epilithic diatoms as indicators of stream total N and total P concentration. J. N. Am. Benthol. Soc. 19(1):32-49.
Yoder, C.O., and E.T. Rankin. 1998. The role of biological indicators in a state water quality management process. Environmental Monitoring and Assessment 51: 61-88.