Embed Size (px)
Citation preview
Developing & Financing Renewable Energy Projects
in Indian Country
Presenter: Robert Springer, National Renewable Energy Laboratory (NREL)
RES2012 CONFERENCE
LAS VEGAS, NEVADA
MARCH 1, 2012
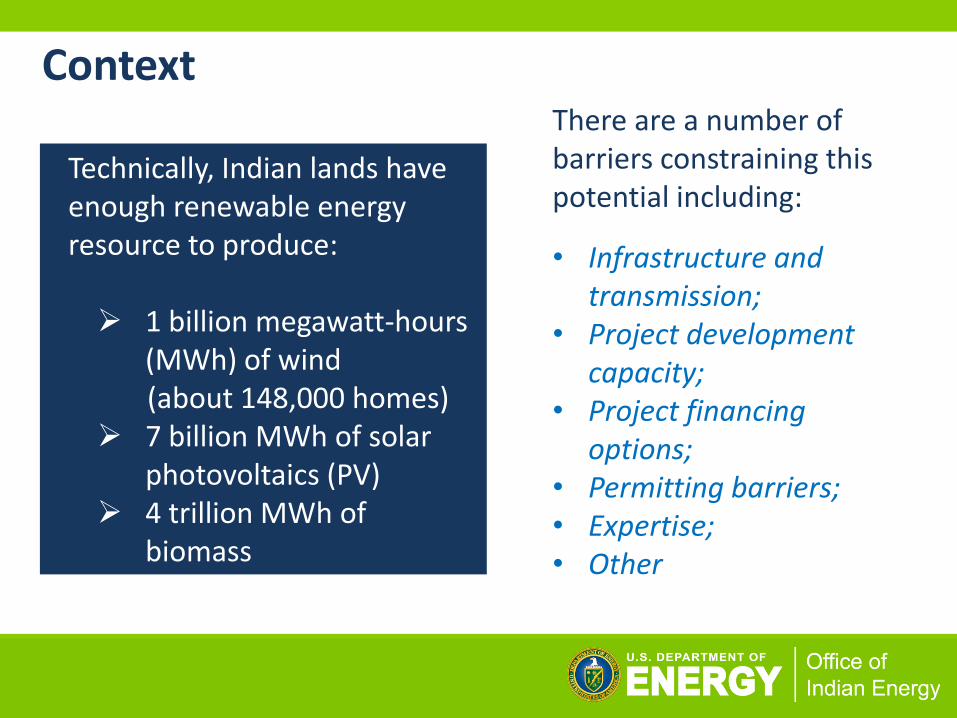
Context
Technically, Indian lands have enough renewable energy resource to produce:
1 billion megawatt-hours
(MWh) of wind (about 148,000 homes) 7 billion MWh of solar
photovoltaics (PV) 4 trillion MWh of
biomass
There are a number of barriers constraining this potential including:
• Infrastructure and transmission;
• Project development capacity;
• Project financing options;
• Permitting barriers; • Expertise; • Other
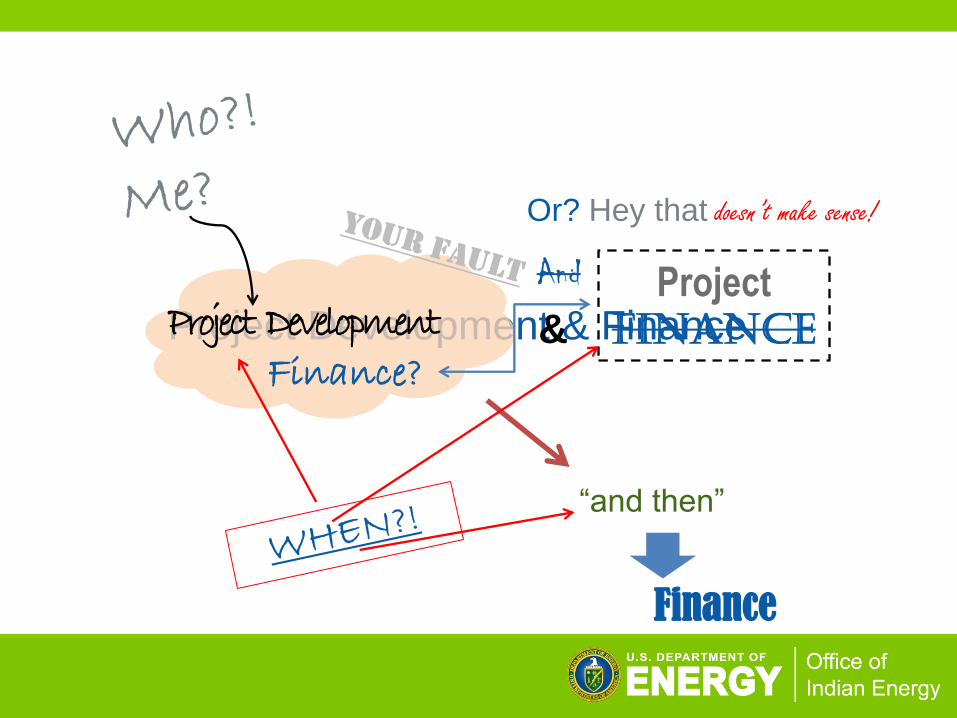
Project Development & Finance Project Development & Project
Finance
Finance?
“and then”
Finance
Or? Hey that doesn’t make sense!
And
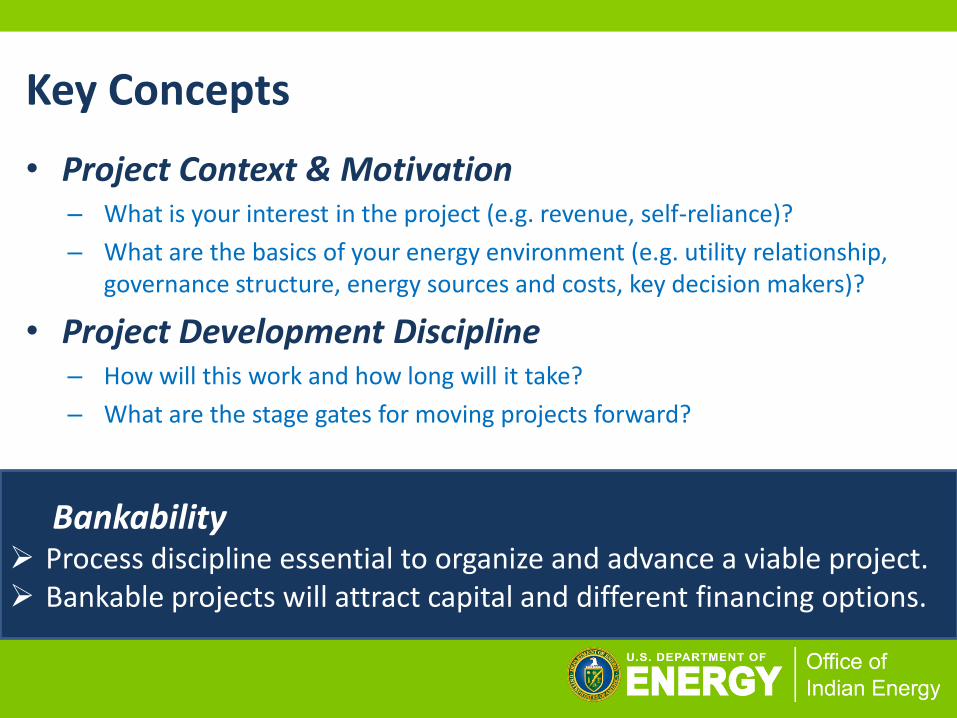
• Project Context & Motivation – What is your interest in the project (e.g. revenue, self-reliance)?
– What are the basics of your energy environment (e.g. utility relationship, governance structure, energy sources and costs, key decision makers)?
• Project Development Discipline – How will this work and how long will it take?
– What are the stage gates for moving projects forward?
Key Concepts
Bankability Process discipline essential to organize and advance a viable project. Bankable projects will attract capital and different financing options.
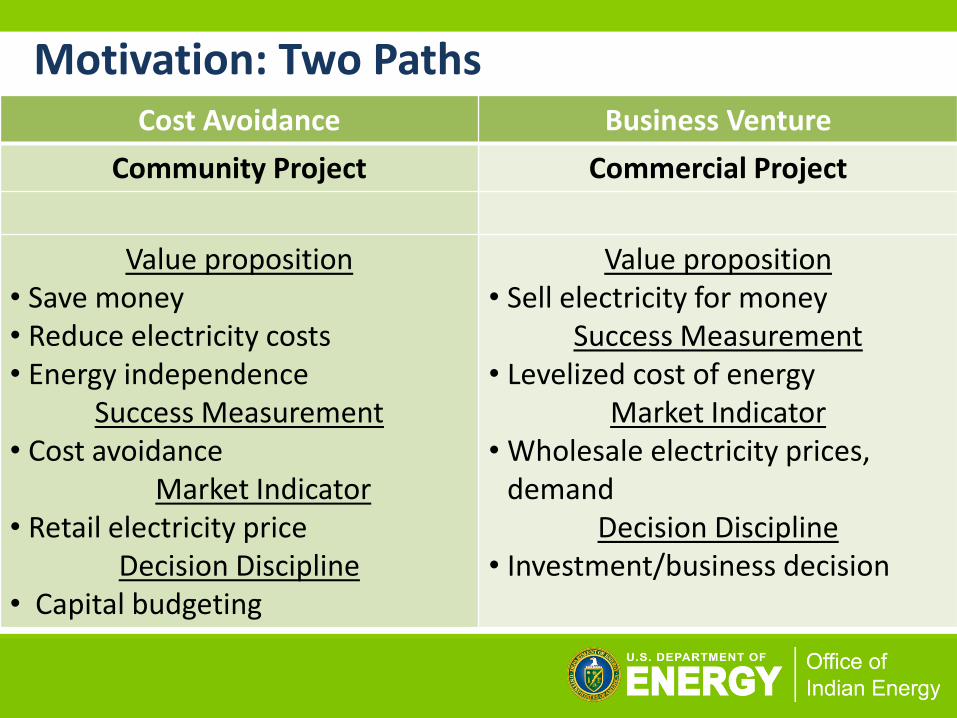
Motivation: Two Paths Cost Avoidance Business Venture
Community Project Commercial Project
Value proposition • Save money • Reduce electricity costs • Energy independence
Success Measurement • Cost avoidance
Market Indicator • Retail electricity price
Decision Discipline • Capital budgeting
Value proposition • Sell electricity for money
Success Measurement • Levelized cost of energy
Market Indicator • Wholesale electricity prices,
demand Decision Discipline
• Investment/business decision
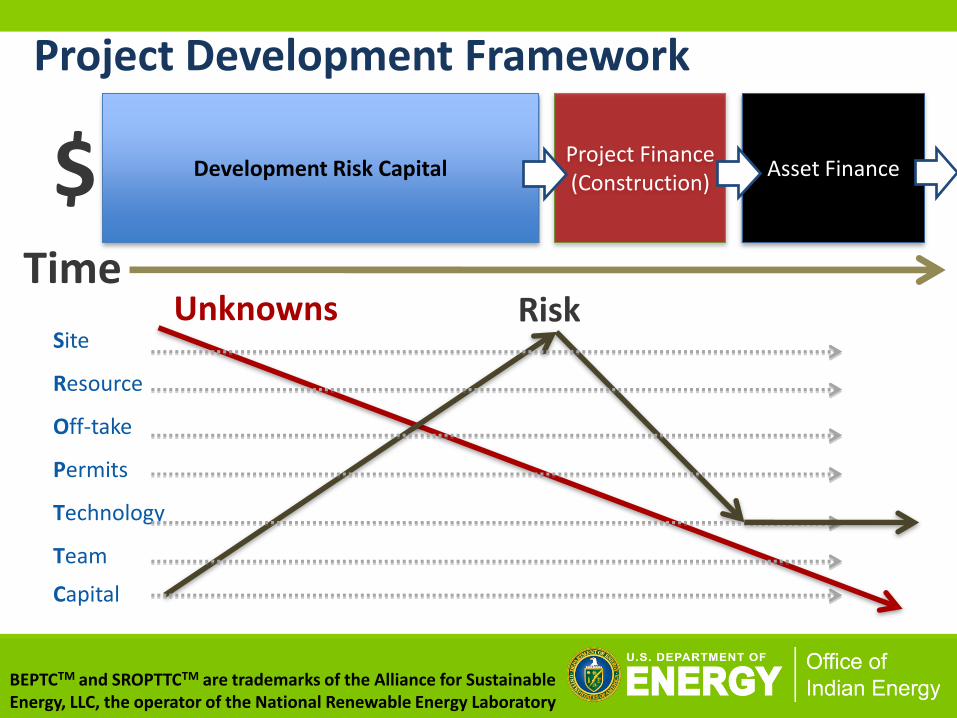
Development Risk Capital Project Finance (Construction)
Asset Finance
Site
Resource
Off-take
Permits
Technology
Team
Capital
Unknowns Risk
$ Time
BEPTCTM and SROPTTCTM are trademarks of the Alliance for Sustainable Energy, LLC, the operator of the National Renewable Energy Laboratory
Project Development Framework
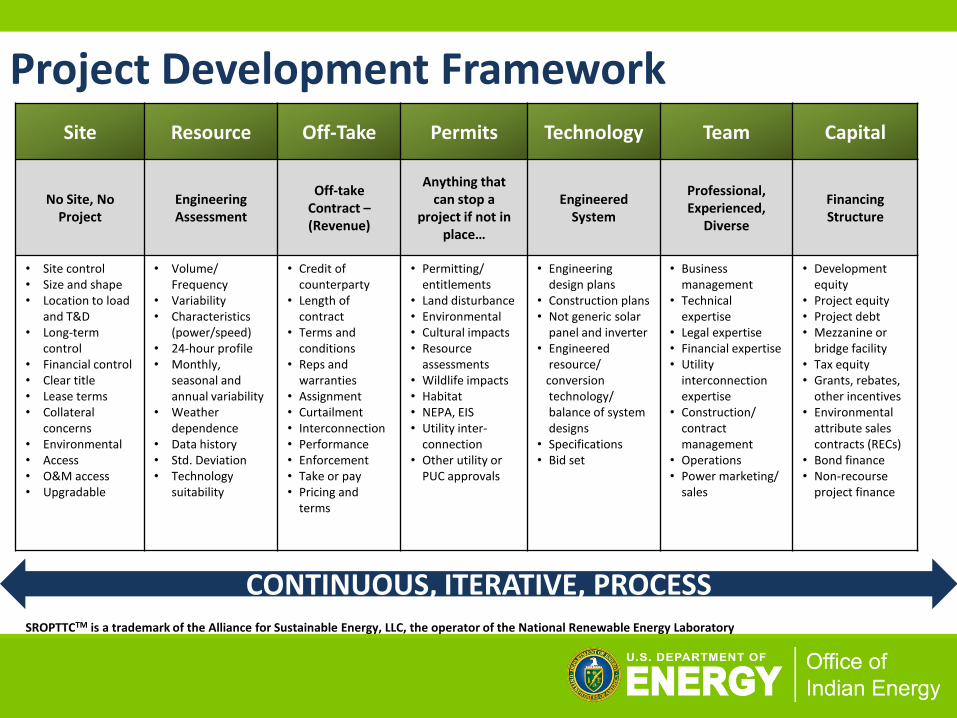
Project Development Framework Site Resource Off-Take Permits Technology Team Capital
No Site, No Project
Engineering Assessment
Off-take Contract – (Revenue)
Anything that can stop a
project if not in place…
Engineered System
Professional, Experienced,
Diverse
Financing Structure
• Site control • Size and shape • Location to load
and T&D • Long-term
control • Financial control • Clear title • Lease terms • Collateral
concerns • Environmental • Access • O&M access • Upgradable
• Volume/ Frequency
• Variability • Characteristics
(power/speed) • 24-hour profile • Monthly,
seasonal and annual variability
• Weather dependence
• Data history • Std. Deviation • Technology
suitability
• Credit of counterparty
• Length of contract
• Terms and conditions
• Reps and warranties
• Assignment • Curtailment • Interconnection • Performance • Enforcement • Take or pay • Pricing and
terms
• Permitting/ entitlements
• Land disturbance • Environmental • Cultural impacts • Resource
assessments • Wildlife impacts • Habitat • NEPA, EIS • Utility inter-
connection • Other utility or
PUC approvals
• Engineering design plans
• Construction plans • Not generic solar
panel and inverter • Engineered
resource/ conversion
technology/ balance of system designs
• Specifications • Bid set
• Business management
• Technical expertise
• Legal expertise • Financial expertise • Utility
interconnection expertise
• Construction/ contract management
• Operations • Power marketing/
sales
• Development equity
• Project equity • Project debt • Mezzanine or
bridge facility • Tax equity • Grants, rebates,
other incentives • Environmental
attribute sales contracts (RECs)
• Bond finance • Non-recourse
project finance
SROPTTCTM is a trademark of the Alliance for Sustainable Energy, LLC, the operator of the National Renewable Energy Laboratory
CONTINUOUS, ITERATIVE, PROCESS
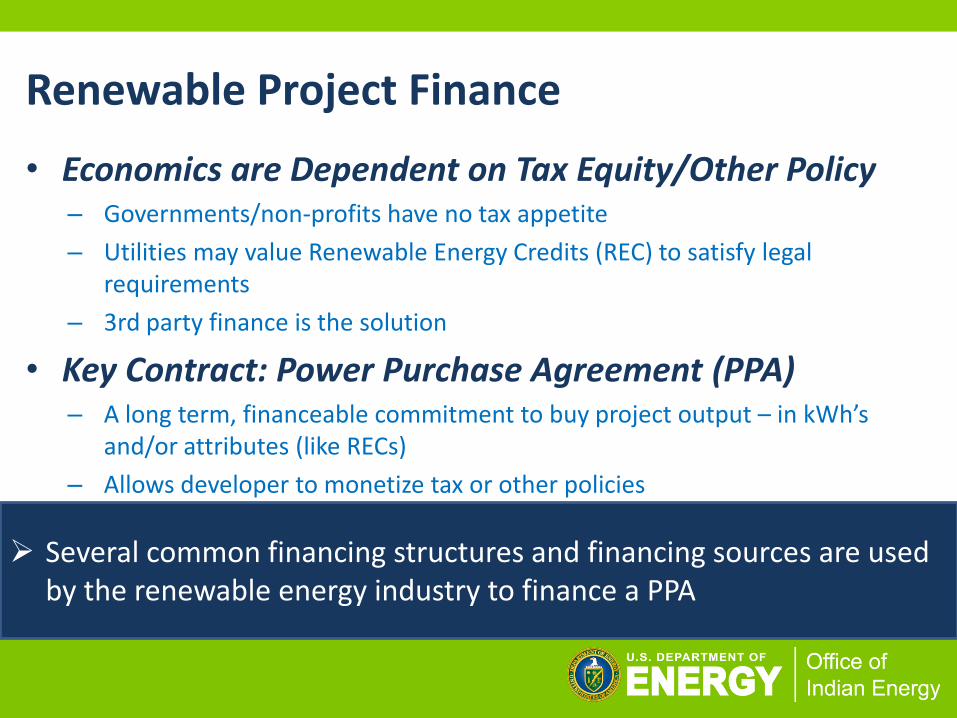
• Economics are Dependent on Tax Equity/Other Policy – Governments/non-profits have no tax appetite
– Utilities may value Renewable Energy Credits (REC) to satisfy legal requirements
– 3rd party finance is the solution
• Key Contract: Power Purchase Agreement (PPA) – A long term, financeable commitment to buy project output – in kWh’s
and/or attributes (like RECs)
– Allows developer to monetize tax or other policies
Renewable Project Finance
Several common financing structures and financing sources are used by the renewable energy industry to finance a PPA
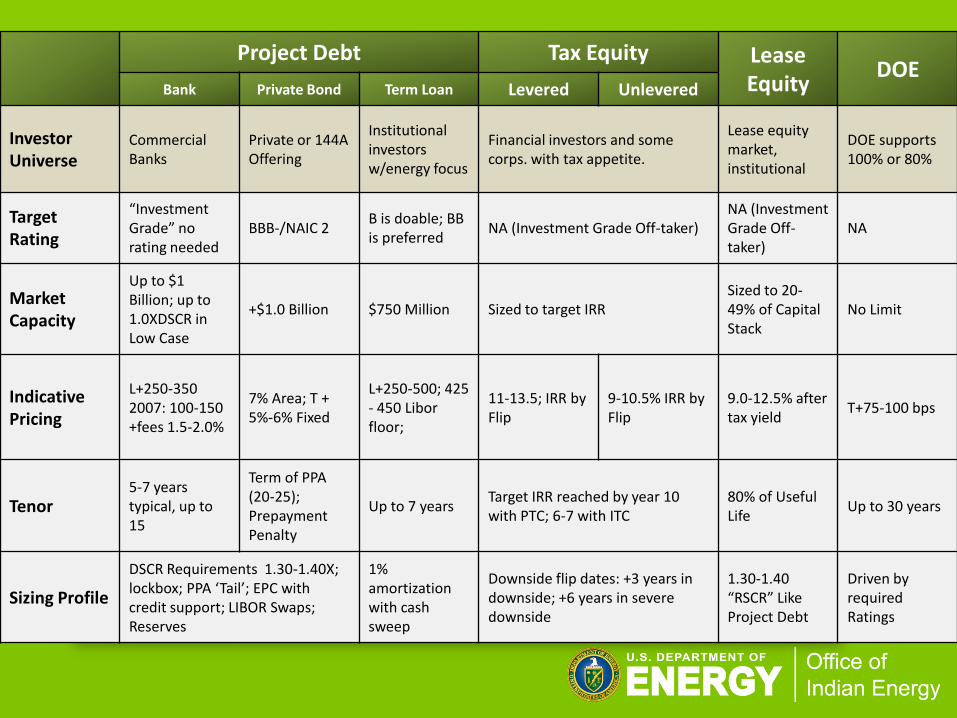
Project Finance
References: 2010 Barclays Capital; Alyra Renewable Energy Finance; Fulbright & Jaworski - For Information Only
Project Debt Tax Equity Lease Equity
DOE Bank Private Bond Term Loan Levered Unlevered
Investor Universe
Commercial Banks
Private or 144A Offering
Institutional investors w/energy focus
Financial investors and some corps. with tax appetite.
Lease equity market, institutional
DOE supports 100% or 80%
Target Rating
“Investment Grade” no rating needed
BBB-/NAIC 2 B is doable; BB is preferred
NA (Investment Grade Off-taker) NA (Investment Grade Off-taker)
NA
Market Capacity
Up to $1 Billion; up to 1.0XDSCR in Low Case
+$1.0 Billion $750 Million Sized to target IRR Sized to 20-49% of Capital Stack
No Limit
Indicative Pricing
L+250-350 2007: 100-150 +fees 1.5-2.0%
7% Area; T + 5%-6% Fixed
L+250-500; 425 - 450 Libor floor;
11-13.5; IRR by Flip
9-10.5% IRR by Flip
9.0-12.5% after tax yield
T+75-100 bps
Tenor 5-7 years typical, up to 15
Term of PPA (20-25); Prepayment Penalty
Up to 7 years Target IRR reached by year 10 with PTC; 6-7 with ITC
80% of Useful Life
Up to 30 years
Sizing Profile
DSCR Requirements 1.30-1.40X; lockbox; PPA ‘Tail’; EPC with credit support; LIBOR Swaps; Reserves
1% amortization with cash sweep
Downside flip dates: +3 years in downside; +6 years in severe downside
1.30-1.40 “RSCR” Like Project Debt
Driven by required Ratings
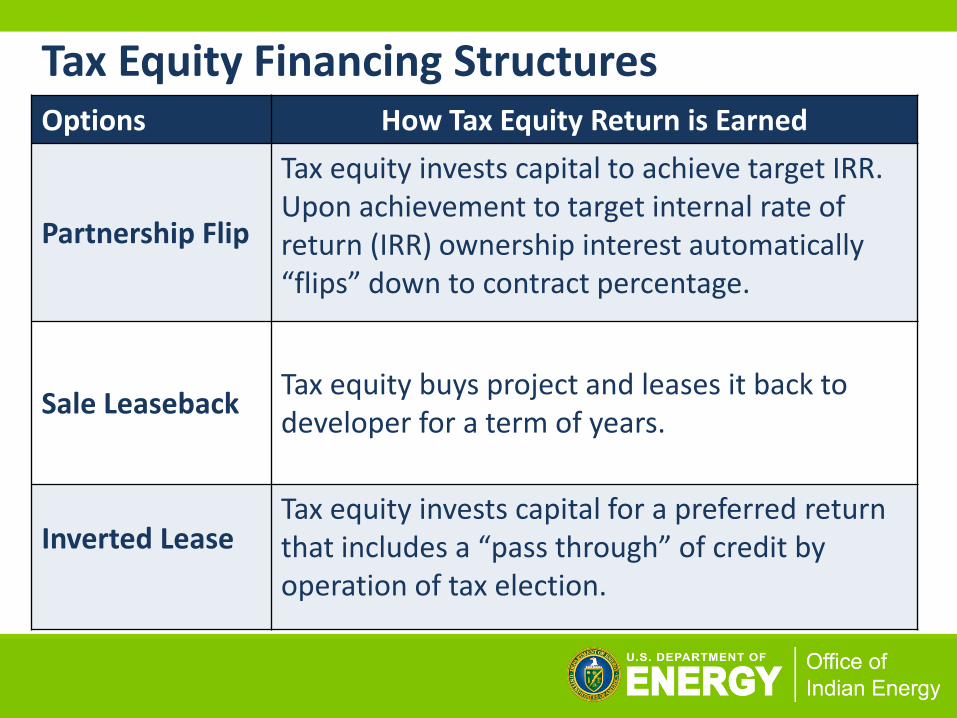
Tax Equity Financing Structures Options How Tax Equity Return is Earned
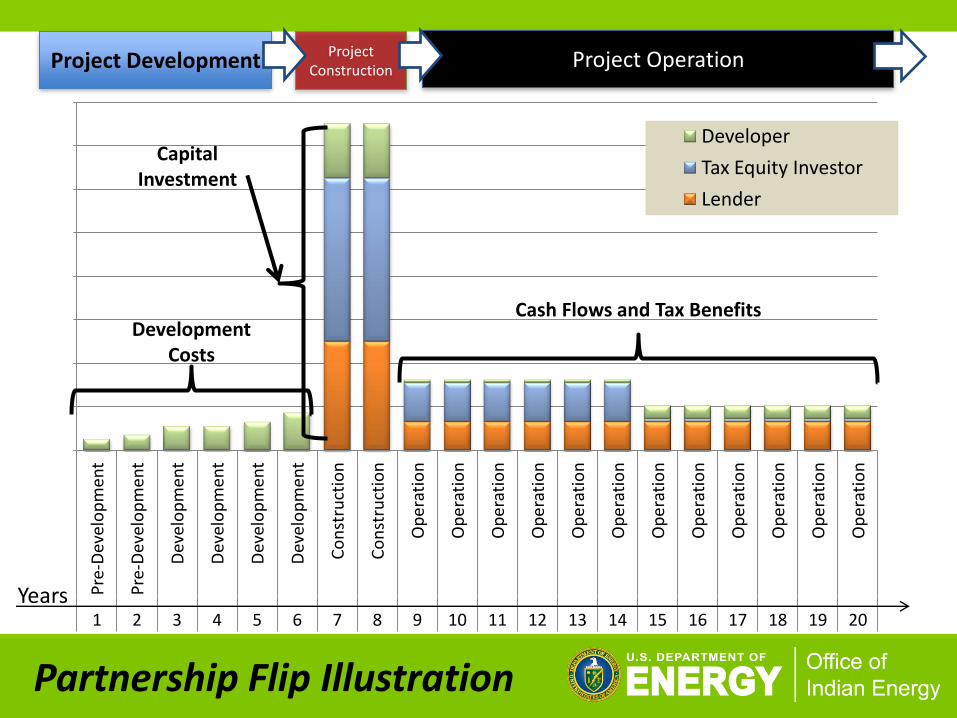
Partnership Flip
Tax equity invests capital to achieve target IRR. Upon achievement to target internal rate of return (IRR) ownership interest automatically “flips” down to contract percentage.
Sale Leaseback
Tax equity buys project and leases it back to developer for a term of years.
Inverted Lease
Tax equity invests capital for a preferred return that includes a “pass through” of credit by operation of tax election.
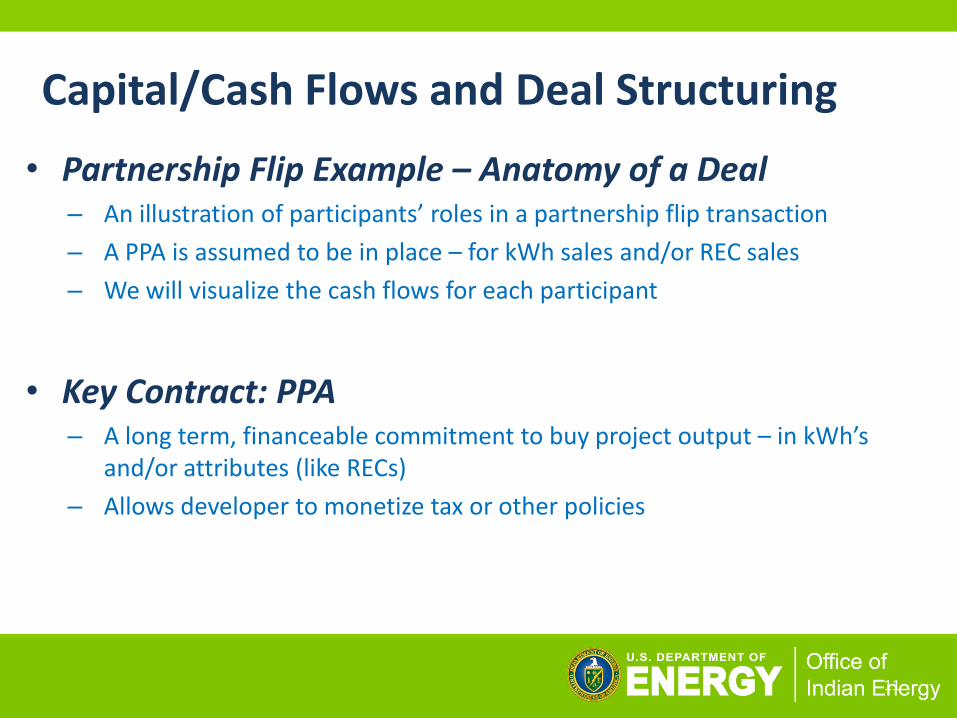
Capital/Cash Flows and Deal Structuring
11
• Partnership Flip Example – Anatomy of a Deal – An illustration of participants’ roles in a partnership flip transaction
– A PPA is assumed to be in place – for kWh sales and/or REC sales
– We will visualize the cash flows for each participant
• Key Contract: PPA – A long term, financeable commitment to buy project output – in kWh’s
and/or attributes (like RECs)
– Allows developer to monetize tax or other policies
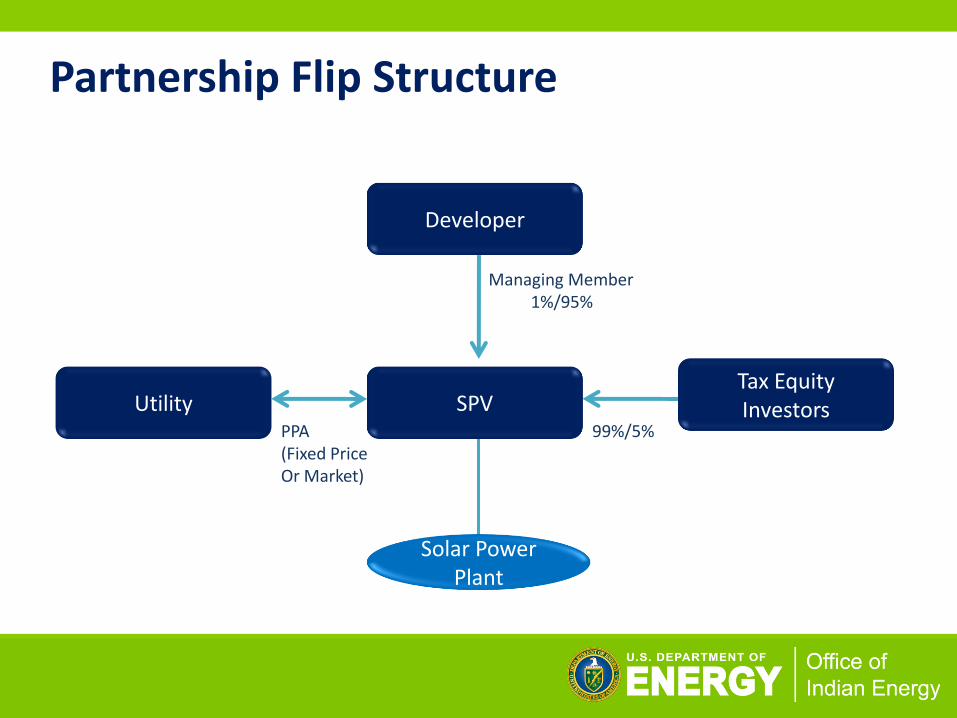
Partnership Flip Structure
Developer
SPV Utility Tax Equity Investors
Solar Power Plant
Managing Member 1%/95%
PPA (Fixed Price Or Market)
99%/5%
-
100.00
200.00
300.00
400.00
500.00
600.00
700.00
800.00 P
re-D
evel
op
men
t
Pre
-Dev
elo
pm
ent
Dev
elo
pm
ent
Dev
elo
pm
ent
Dev
elo
pm
ent
Dev
elo
pm
ent
Co
nst
ruct
ion
Co
nst
ruct
ion
Op
erat
ion
Op
erat
ion
Op
erat
ion
Op
erat
ion
Op
erat
ion
Op
erat
ion
Op
erat
ion
Op
erat
ion
Op
erat
ion
Op
erat
ion
Op
erat
ion
Op
erat
ion
1 2 3 4 5 6 7 8 9 10 11 12 13 14 15 16 17 18 19 20
Developer
Tax Equity Investor
Lender
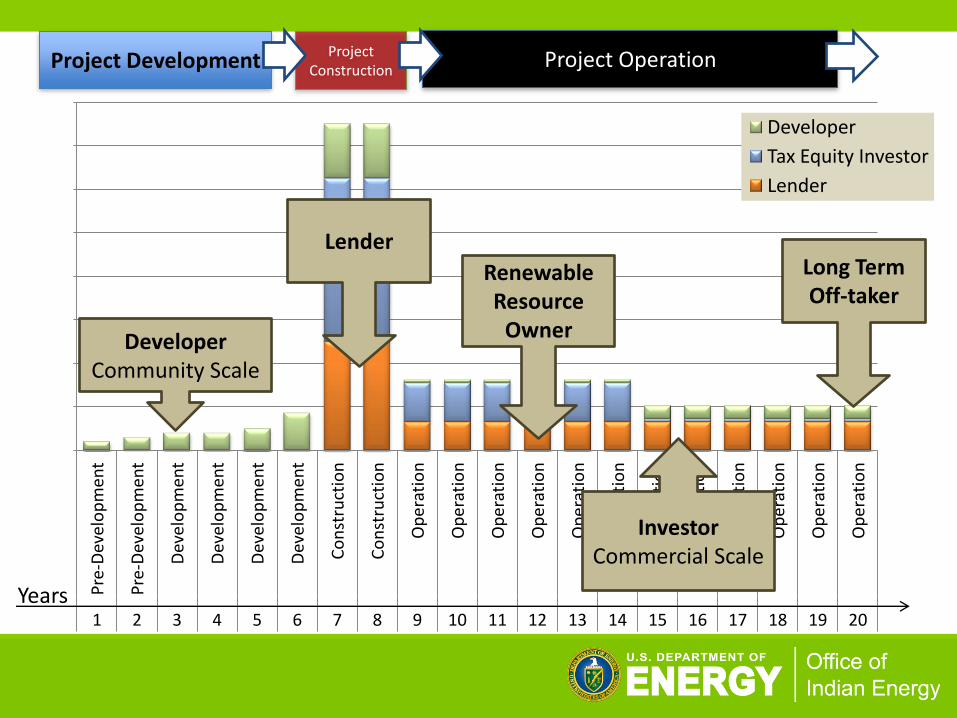
Project Development Project Construction
Project Operation
Years
Development Costs
Capital Investment
Cash Flows and Tax Benefits
Partnership Flip Illustration
-
100.00
200.00
300.00
400.00
500.00
600.00
700.00
800.00 P
re-D
evel
op
men
t
Pre
-Dev
elo
pm
ent
Dev
elo
pm
ent
Dev
elo
pm
ent
Dev
elo
pm
ent
Dev
elo
pm
ent
Co
nst
ruct
ion
Co
nst
ruct
ion
Op
erat
ion
Op
erat
ion
Op
erat
ion
Op
erat
ion
Op
erat
ion
Op
erat
ion
Op
erat
ion
Op
erat
ion
Op
erat
ion
Op
erat
ion
Op
erat
ion
Op
erat
ion
1 2 3 4 5 6 7 8 9 10 11 12 13 14 15 16 17 18 19 20
Developer
Tax Equity Investor
Lender
Project Development Project Construction
Project Operation
Years
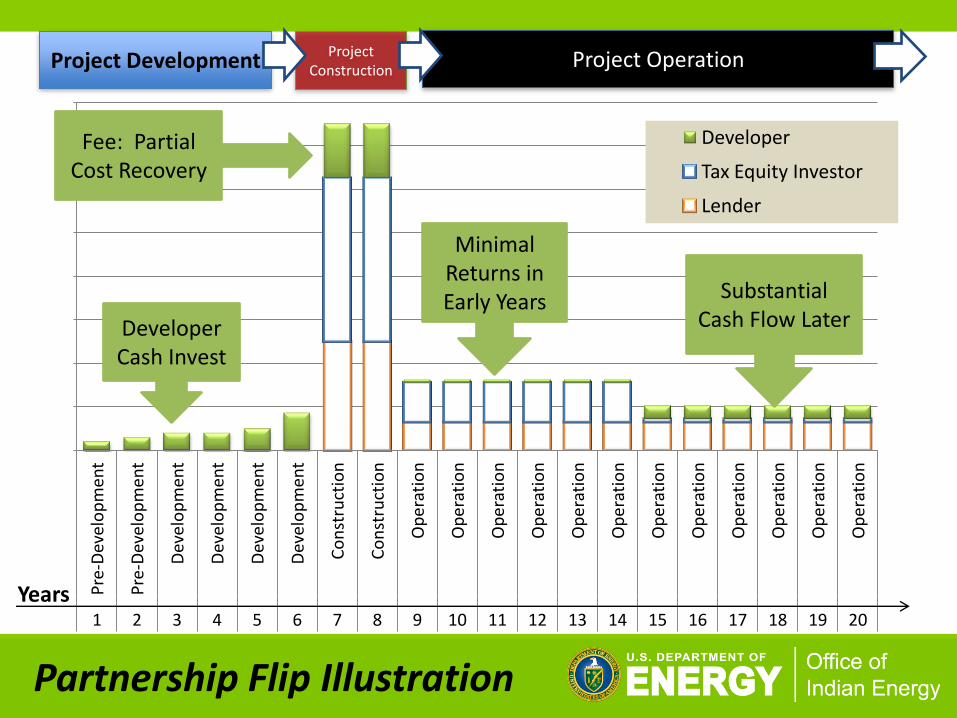
Partnership Flip Illustration
Developer Cash Invest
Fee: Partial Cost Recovery
Minimal Returns in Early Years Substantial
Cash Flow Later
-
100.00
200.00
300.00
400.00
500.00
600.00
700.00
800.00 P
re-D
evel
op
men
t
Pre
-Dev
elo
pm
ent
Dev
elo
pm
ent
Dev
elo
pm
ent
Dev
elo
pm
ent
Dev
elo
pm
ent
Co
nst
ruct
ion
Co
nst
ruct
ion
Op
erat
ion
Op
erat
ion
Op
erat
ion
Op
erat
ion
Op
erat
ion
Op
erat
ion
Op
erat
ion
Op
erat
ion
Op
erat
ion
Op
erat
ion
Op
erat
ion
Op
erat
ion
1 2 3 4 5 6 7 8 9 10 11 12 13 14 15 16 17 18 19 20
Developer
Tax Equity Investor
Lender
Project Development Project Construction
Project Operation
Years
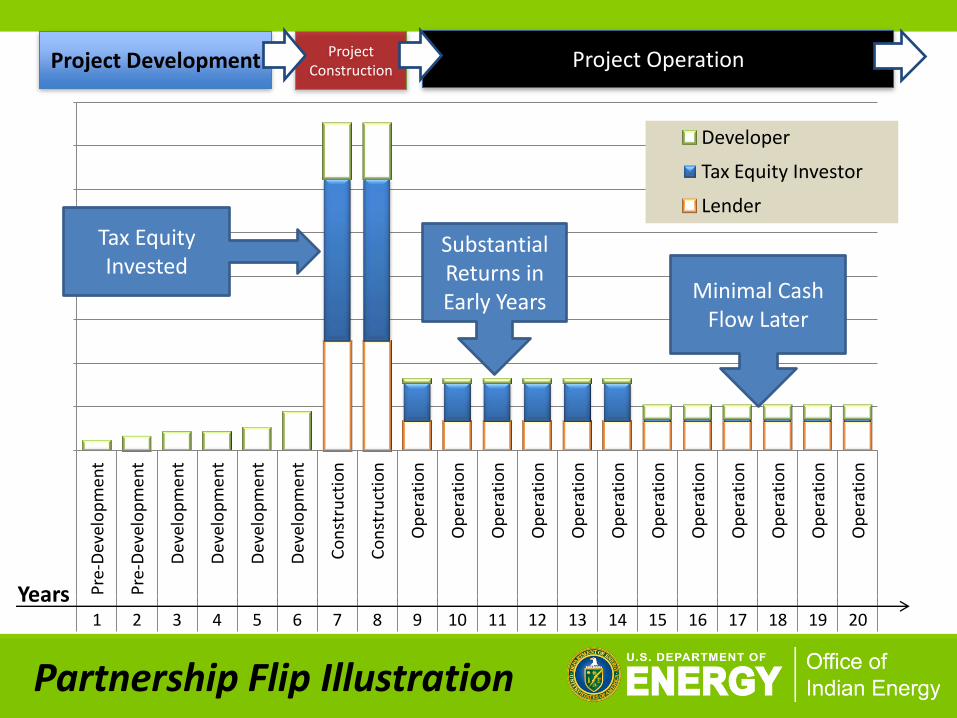
Partnership Flip Illustration
Tax Equity Invested
Substantial Returns in Early Years Minimal Cash
Flow Later
-
100.00
200.00
300.00
400.00
500.00
600.00
700.00
800.00 P
re-D
evel
op
men
t
Pre
-Dev
elo
pm
ent
Dev
elo
pm
ent
Dev
elo
pm
ent
Dev
elo
pm
ent
Dev
elo
pm
ent
Co
nst
ruct
ion
Co
nst
ruct
ion
Op
erat
ion
Op
erat
ion
Op
erat
ion
Op
erat
ion
Op
erat
ion
Op
erat
ion
Op
erat
ion
Op
erat
ion
Op
erat
ion
Op
erat
ion
Op
erat
ion
Op
erat
ion
1 2 3 4 5 6 7 8 9 10 11 12 13 14 15 16 17 18 19 20
Developer
Tax Equity Investor
Lender
Project Development Project Construction
Project Operation
Years
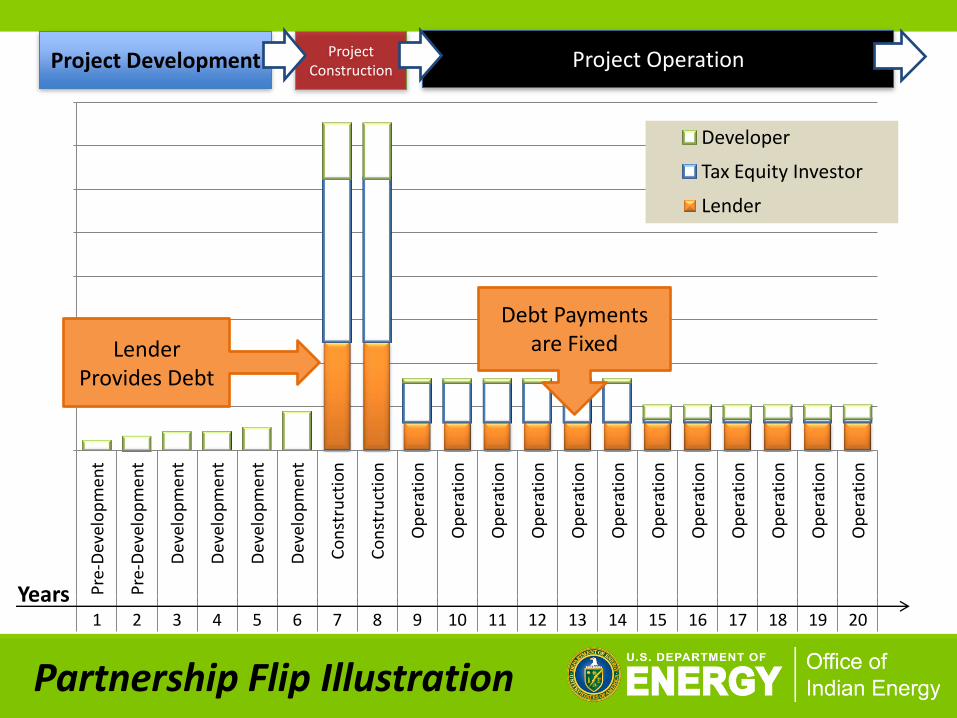
Partnership Flip Illustration
Lender Provides Debt
Debt Payments are Fixed
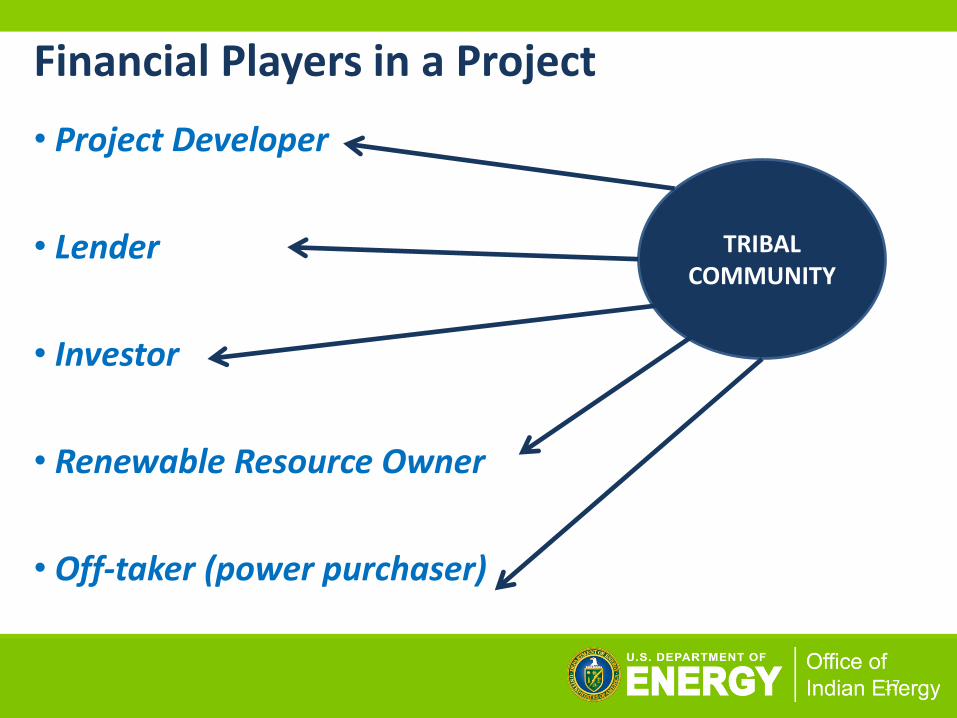
Financial Players in a Project
17
TRIBAL COMMUNITY
• Project Developer
• Lender
• Investor
• Renewable Resource Owner
• Off-taker (power purchaser)
-
100.00
200.00
300.00
400.00
500.00
600.00
700.00
800.00 P
re-D
evel
op
men
t
Pre
-Dev
elo
pm
ent
Dev
elo
pm
ent
Dev
elo
pm
ent
Dev
elo
pm
ent
Dev
elo
pm
ent
Co
nst
ruct
ion
Co
nst
ruct
ion
Op
erat
ion
Op
erat
ion
Op
erat
ion
Op
erat
ion
Op
erat
ion
Op
erat
ion
Op
erat
ion
Op
erat
ion
Op
erat
ion
Op
erat
ion
Op
erat
ion
Op
erat
ion
1 2 3 4 5 6 7 8 9 10 11 12 13 14 15 16 17 18 19 20
Developer
Tax Equity Investor
Lender
Project Development Project Construction
Project Operation
Years
Developer Community Scale
Lender
Investor Commercial Scale
Renewable Resource
Owner
Long Term Off-taker
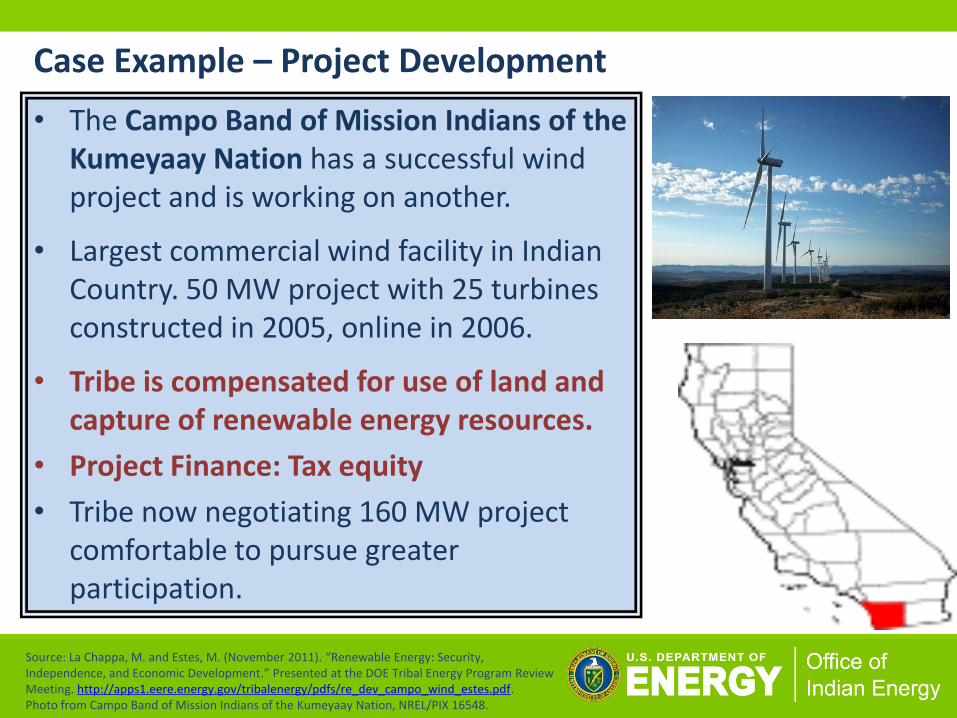
Case Example – Project Development
• The Campo Band of Mission Indians of the Kumeyaay Nation has a successful wind project and is working on another.
• Largest commercial wind facility in Indian Country. 50 MW project with 25 turbines constructed in 2005, online in 2006.
• Tribe is compensated for use of land and capture of renewable energy resources.
• Project Finance: Tax equity
• Tribe now negotiating 160 MW project comfortable to pursue greater participation.
Source: La Chappa, M. and Estes, M. (November 2011). “Renewable Energy: Security, Independence, and Economic Development.” Presented at the DOE Tribal Energy Program Review Meeting. http://apps1.eere.energy.gov/tribalenergy/pdfs/re_dev_campo_wind_estes.pdf. Photo from Campo Band of Mission Indians of the Kumeyaay Nation, NREL/PIX 16548.
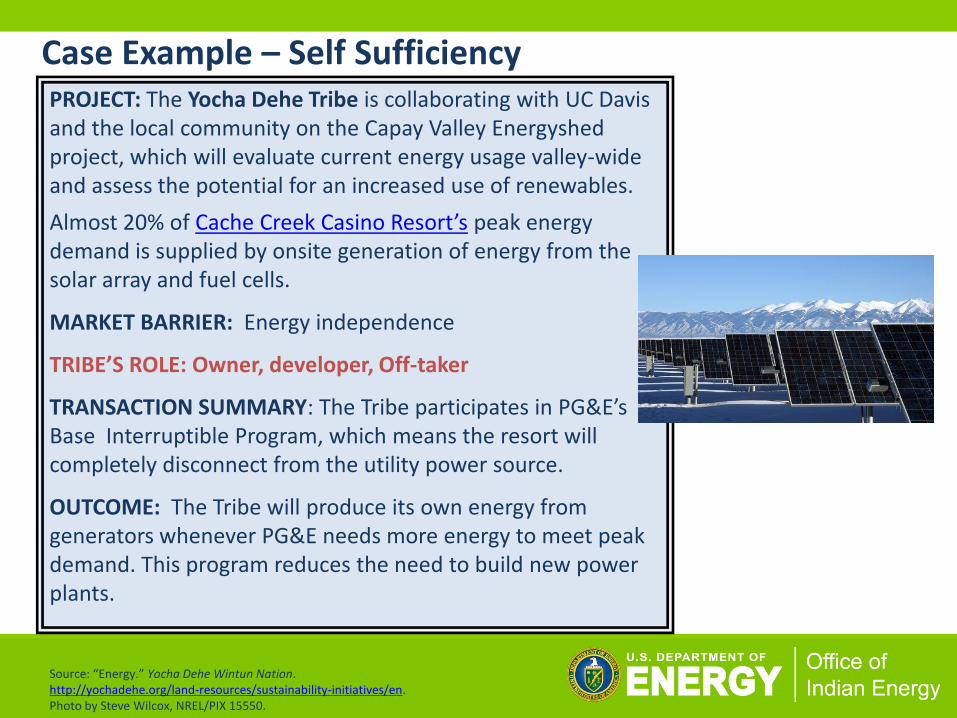
Case Example – Self Sufficiency PROJECT: The Yocha Dehe Tribe is collaborating with UC Davis and the local community on the Capay Valley Energyshed project, which will evaluate current energy usage valley-wide and assess the potential for an increased use of renewables.
Almost 20% of Cache Creek Casino Resort’s peak energy demand is supplied by onsite generation of energy from the solar array and fuel cells.
MARKET BARRIER: Energy independence
TRIBE’S ROLE: Owner, developer, Off-taker
TRANSACTION SUMMARY: The Tribe participates in PG&E’s Base Interruptible Program, which means the resort will completely disconnect from the utility power source.
OUTCOME: The Tribe will produce its own energy from generators whenever PG&E needs more energy to meet peak demand. This program reduces the need to build new power plants.
Source: “Energy.” Yocha Dehe Wintun Nation. http://yochadehe.org/land-resources/sustainability-initiatives/en. Photo by Steve Wilcox, NREL/PIX 15550.
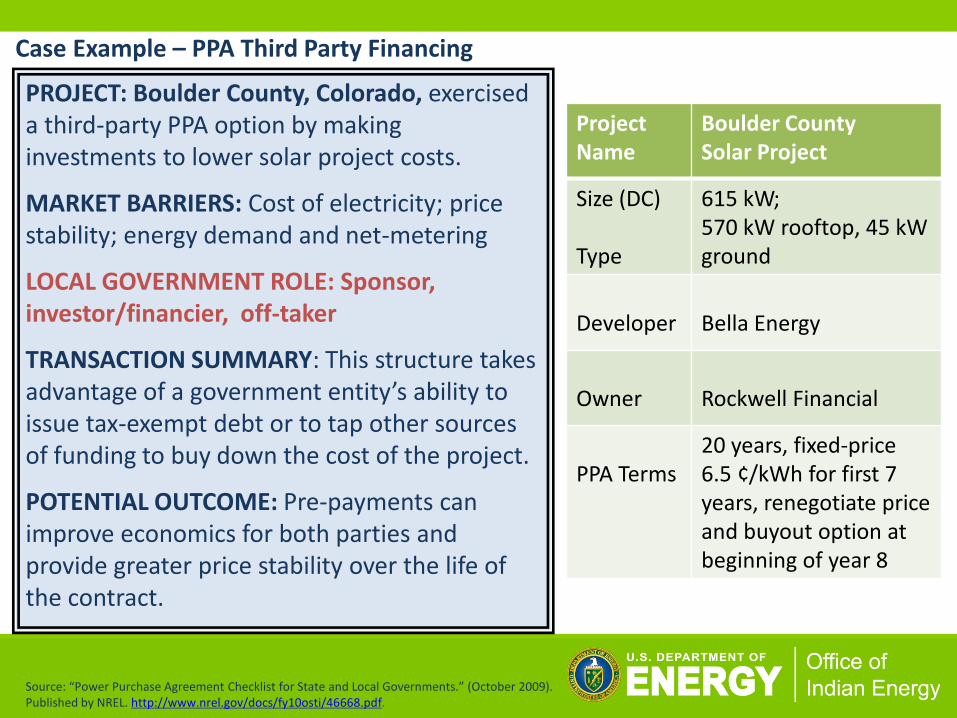
Case Example – PPA Third Party Financing
PROJECT: Boulder County, Colorado, exercised a third-party PPA option by making investments to lower solar project costs.
MARKET BARRIERS: Cost of electricity; price stability; energy demand and net-metering
LOCAL GOVERNMENT ROLE: Sponsor, investor/financier, off-taker
TRANSACTION SUMMARY: This structure takes advantage of a government entity’s ability to issue tax-exempt debt or to tap other sources of funding to buy down the cost of the project.
POTENTIAL OUTCOME: Pre-payments can improve economics for both parties and provide greater price stability over the life of the contract.
Project Name
Boulder County Solar Project
Size (DC) Type
615 kW; 570 kW rooftop, 45 kW ground
Developer
Bella Energy
Owner
Rockwell Financial
PPA Terms
20 years, fixed-price 6.5 ¢/kWh for first 7 years, renegotiate price and buyout option at beginning of year 8
Source: “Power Purchase Agreement Checklist for State and Local Governments.” (October 2009). Published by NREL. http://www.nrel.gov/docs/fy10osti/46668.pdf.
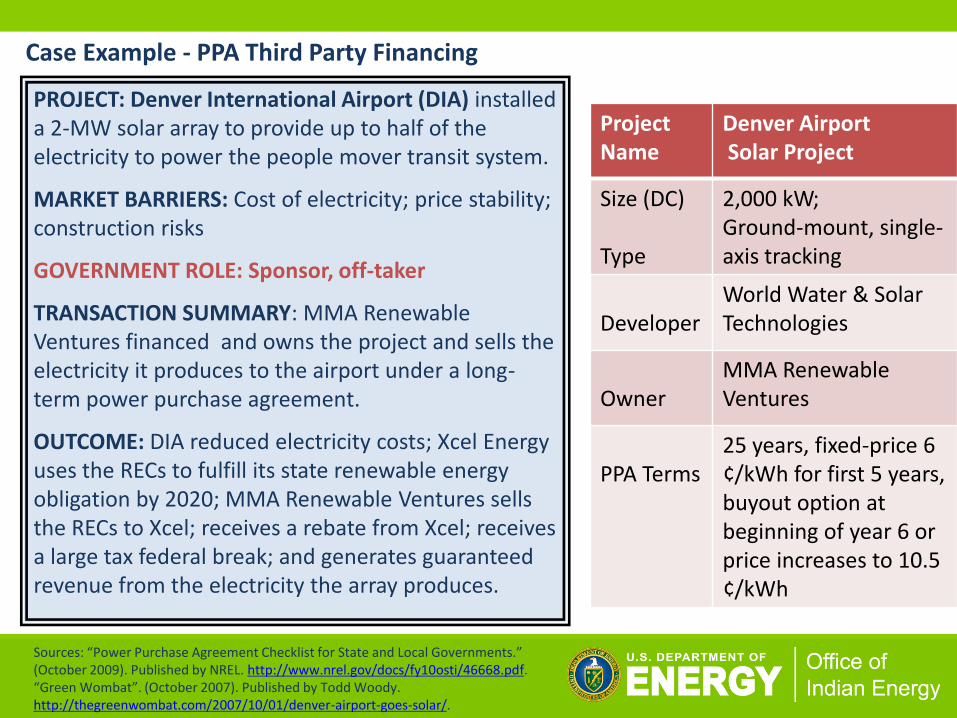
Case Example - PPA Third Party Financing
PROJECT: Denver International Airport (DIA) installed a 2-MW solar array to provide up to half of the electricity to power the people mover transit system.
MARKET BARRIERS: Cost of electricity; price stability; construction risks
GOVERNMENT ROLE: Sponsor, off-taker
TRANSACTION SUMMARY: MMA Renewable Ventures financed and owns the project and sells the electricity it produces to the airport under a long-term power purchase agreement.
OUTCOME: DIA reduced electricity costs; Xcel Energy uses the RECs to fulfill its state renewable energy obligation by 2020; MMA Renewable Ventures sells the RECs to Xcel; receives a rebate from Xcel; receives a large tax federal break; and generates guaranteed revenue from the electricity the array produces.
Project Name
Denver Airport Solar Project
Size (DC) Type
2,000 kW; Ground-mount, single-axis tracking
Developer
World Water & Solar Technologies
Owner
MMA Renewable Ventures
PPA Terms
25 years, fixed-price 6 ¢/kWh for first 5 years, buyout option at beginning of year 6 or price increases to 10.5 ¢/kWh
Sources: “Power Purchase Agreement Checklist for State and Local Governments.” (October 2009). Published by NREL. http://www.nrel.gov/docs/fy10osti/46668.pdf. “Green Wombat”. (October 2007). Published by Todd Woody. http://thegreenwombat.com/2007/10/01/denver-airport-goes-solar/.