Embed Size (px)
Citation preview

Developing and Evaluating an Eighth Grade Curriculum Unit that Links
Foundational Chemistry to Biological Growth: Designing Professional Development to Support Teaching
Rebecca Kruse, Elaine V. Howes, Janet Carlson, Kathleen Roth, Brooke Bourdélat-Parks
Biological Sciences Curriculum Study (BSCS)
Paper #3 of a related paper set presented at:
2013 NARST Annual International Conference
Rio Grande, Puerto Rico
April 6-9, 2013
Abstract
AAAS and BSCS are collaborating to develop and study a curriculum unit that supports
students’ ability to explain a variety of biological processes such as growth in chemical terms.
The unit provides conceptual coherence between chemical processes in nonliving and living
systems through the core idea of atom rearrangement and conservation during chemical
reactions, which is critical for understanding how growth occurs while conserving matter.
Abundant evidence in the literature suggests that many middle school teachers lack adequate
science preparation, but even teachers with excellent science content knowledge often lack
pedagogical skills necessary to effectively use research-based curricular materials. Thus, we
consider teacher support materials and professional development (PD) to be a critical component
of this intervention. We will describe the design of teacher support materials and professional
development to support teachers’ implementation of the curriculum through developing their
knowledge and skills in the areas of Content Coherence and Pedagogical Support for Student
Learning. In the context of face-to-face and online interactions with the curriculum unit, teachers
learn about science content, student ideas, and strategies for teaching the content and curriculum
effectively. This paper reports on the iterative development of the suite of teacher support
materials and PD, highlights of key features, findings of our Year 2 field test, and implications of
those findings for future revisions.

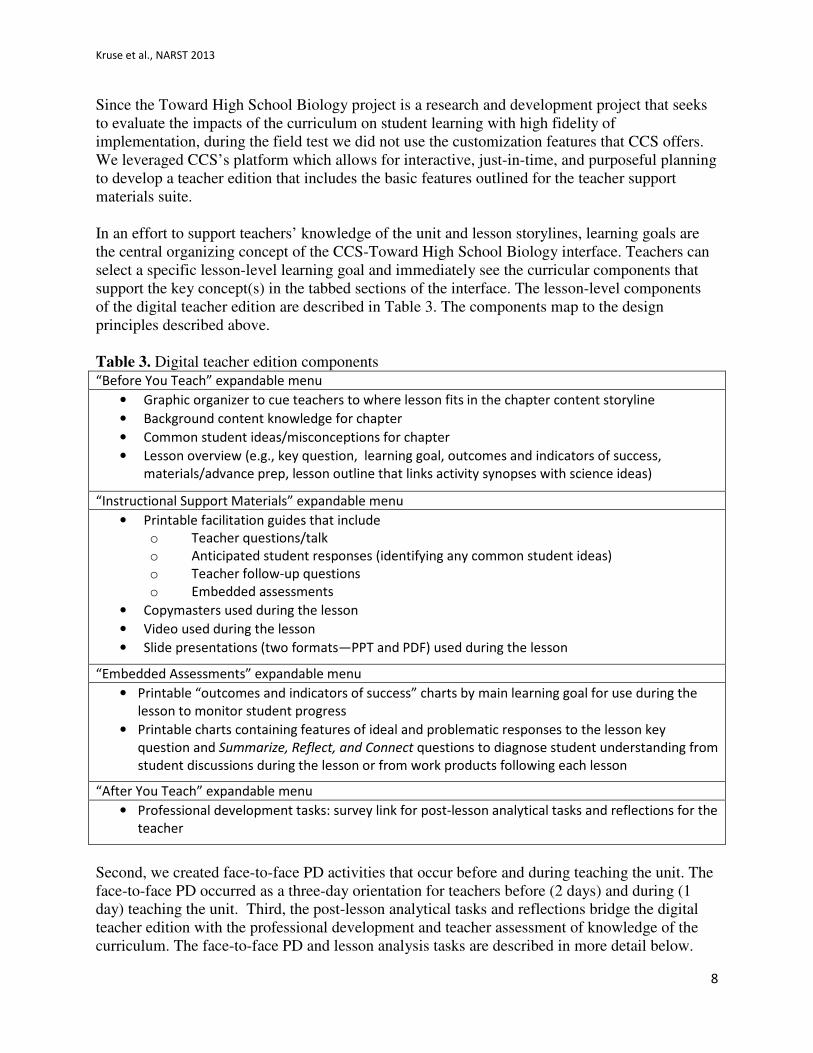
Kruse et al., NARST 2013
2
Introduction
Student understanding in science. Evidence from large-scale student assessments makes it
clear that U.S. students are not well prepared in science. For example, on the NAEP 2011 science
assessment, only 32% of eighth grade students scored at or above the proficient level, whereas
35% performed below basic (National Center for Education Statistics, 2012). While these data
show improvement from the 2009 science assessment data, there is still a significant number of
students entering high school with below basic understanding of science. Furthermore, on the
2009 NAEP science assessment only 21% of 12th
grade students reached proficient, and 40%
performed below basic (National Center for Education Statistics, 2012), indicating that little
more is learned during high school. Today’s middle and high school students must be better
prepared, whether to succeed in college-level science or just to participate productively in a
society becoming increasingly reliant on scientific and technology literacy.
Although U.S. students are not performing well in any of the sciences, we are particularly
concerned about students’ low achievement on topics that are essential for further study of
biology (e.g., Andersson, 1986; Mohan et al., 2009). The National Research Council has called
attention to the increased dependency of biology on chemistry, noting that this “trend will
continue, as more and more biological phenomena are explained in fundamental chemical terms”
(2003, p. 136). Anderson et al. (1990) claim that “students’ difficulties in understanding
biological processes are rooted in misunderstandings about concepts in the physical sciences,
such as conservation of matter … and atomic molecular theory, [that] were not addressed in
instruction” (p. 775). Similarly, we have found that student misconceptions related to these
topics and biological growth are prevalent at the middle and high school levels (AAAS Project
2061, n.d.). Taken together, these findings suggest that there is a need for more-effective
curriculum materials that can provide students with a foundation of chemistry knowledge on
which to build new biology knowledge.
The teacher-curriculum relationship. Curriculum materials play a defining role in classrooms.
Ball and Cohen state: “They are the stuff of lessons and units, of what teachers and students do
… they are well positioned to influence teachers’ work … they have ‘reach’ in the system”
(1996, p. 6). But curriculum materials are often less influential than anticipated because
developers do not consider the role that teachers play in enacting curriculum in the classroom.
Teachers play an interpretive role in bringing curricula to life for their students—deciding which
parts to select for instruction, or which parts to emphasize or deemphasize given teachers’ own
understandings and beliefs about what is best for their students. This interpretation may result in
enactment of curricula that is very different from the developers’ initial intentions (Ball &
Cohen, 1996).
Remillard (2005) has described a “teacher-curriculum relationship” as being rooted in context,
dependent upon both the teacher and curriculum, and related to other teacher practices. Ball and
Cohen (1996) call for developers to acknowledge this relationship between teachers and
curricula: “Curriculum materials could contribute to professional practice if they were created
with closer attention to the processes of curricular enactment” (p. 7). In other words, curriculum
development that attends to the teacher-curriculum relationship may result in curriculum that
Kruse et al., NARST 2013
3
positively influences teacher practice and serves as a valuable intervention for improving student
interest and achievement in science.
The Toward High School Biology Project. The Toward High School Biology Project is a
three-year collaboration between AAAS Project 2061 and BSCS focused on the development
and study of a middle school curriculum intervention that connects core chemistry and biology
ideas in order to help students build a strong conceptual foundation for their study of biology in
high school and beyond. The curriculum intervention consists of instructional materials for both
students and teachers and a suite of hybrid (face-to-face and online) professional development
materials. We have also developed a suite of measures to study student knowledge and skills,
teacher knowledge and skills, and feasibility of using the curriculum as intended. The findings of
these measures are used to improve the coherence and usability of the curriculum toward helping
students to understand and apply chemistry ideas in explaining a range of biological contexts
involving growth.
We value the essential role that teachers play in students’ learning processes and have designed
teacher materials and professional development to support this value. The teacher materials are
designed to be highly educative in that they help science teachers develop their pedagogical
content knowledge for science ideas and practices while deepening their own subject matter
knowledge. The professional development is centered on the effective implementation of the
curriculum materials, providing teachers opportunities to develop both knowledge and skills to
create better learning opportunities for students using the curriculum.
We are currently in the final year of the project. In the first year, we pilot tested an initial
version of the unit with a small number of schools (Herrmann Abell et al., 2012). Data from the
pilot test was used to revise the unit in preparation for the field test in Year 2. This paper reports
on the iterative development of the suite of teacher support materials and PD, focusing on the
Year 2 suite, findings, and implications of those findings for future revisions.
This paper reports on the design and development of teacher support materials and professional
development. Other papers in this set detail the selection of core ideas and practices (Roseman et
al., 2013), the design and development of the curriculum unit (Kruse et al., 2013), measures of
students’ understanding and field study results (Herrmann Abell et al., 2013), and measures of
teachers’ knowledge of the content and curriculum and field study results (Flanagan et al., 2013).
The Toward High School Biology Project is funded by a U.S. Department of Education IES Goal
2 Development and Innovation grant to develop and study the feasibility and usability of the
curriculum and a suite of teacher support materials.
Methodology Research-based design of teacher support. Our iterative, multifaceted development process
carefully integrates design with current research findings, which is an approach that is well
aligned with the theory on effective teacher learning.
Guiding the design and development of the teacher support materials is a theory of change
positing that teacher support materials that improve (1) teachers’ knowledge of the science

Kruse et al., NARST 2013
4
content in the unit and their knowledge of students’ ideas about the content and (2) teachers’
knowledge of the unit itself, including its content storyline, its various pedagogical features, and
the rationale for the specific phenomena and model-based reasoning activities will promote
students’ learning from the curriculum. Teachers who understand the underlying content,
strategic function, and strategies for revealing and supporting student responses are better
equipped to respond to events that occur in the classroom when teaching the curriculum. This
view is supported by a growing literature base about educative materials and effective
professional development.
In the teacher-curriculum relationship, teachers often play the role of learners. Teachers use their
curricula to deepen their own content knowledge, for ideas on presenting information to students,
or for assessment of student learning. Curriculum materials that explicitly address the teacher as
learner have been described as “educative” (Ball & Cohen, 1996; Davis & Krajcik, 2005). Davis
and Krajcik identified nine “heuristics” of educative science materials that articulate how science
curricula may support teachers as they implement reform-based curriculum with their students.
The heuristics focus on teachers’ subject matter knowledge as well as teachers’ pedagogical
content knowledge, rationale for curricular design decisions, and supports to teachers to adapt
the materials to respond to their own instructional contexts, including student learning needs.
Most teachers are not familiar with educative curriculum materials and are not experienced at
using them in a manner that allows them to take full advantage of these features (Ball & Cohen,
1996).
The effective implementation of curriculum materials is greatly enhanced by professional
development. Research suggests that high-quality curriculum coupled with professional
development focused on the implementation of the curriculum can have a significant impact on
both teaching and learning (Krajcik et al., 1994; Powell & Anderson, 2002; Taylor et al., 2003,
2008). There is a growing consensus (Darling-Hammond, 1997; Cohen & Hill, 2001; Loucks-
Horsley et al., 2010; Wei et al., 2009) that effective professional development should emphasis
analysis-of-practice formats that
• treat content in teachers’ curriculum as central and intertwined with pedagogy;
• enables teachers to see content and teaching issues embedded in real classroom contexts;
• focus on the tasks of teaching, assessment, observation, and reflection on student
learning; and
• are guided by an articulated theory of teacher learning
This research underpinning our theory of change influenced the articulation of a set of teacher
learning goals. The learning goals for teachers serve as the basis for the design of measures to
assess teacher knowledge and practice described elsewhere (Flanagan et al., 2013) and in the
clarification of design principles guiding the suite of teacher support materials. Because the
student materials are being designed to meet both Content Coherence and Instructional Support
criteria from the AAAS Textbook Evaluation Criteria (Roseman et al., 1997; Kesidou &
Roseman, 2002; Roseman et al., 2010), we are able to focus our attention on helping teachers to
understand and use the materials rather than on helping teachers to compensate for them. Thus,
the knowledge and skills fall under two broad categories: Content Coherence and Pedagogical
Support for Student Learning. Broadly speaking, the Content Coherence category includes
knowledge of the science ideas and practices within the content storyline and the ability to use

Kruse et al., NARST 2013
5
the models to explain phenomena. The Pedagogical Support category includes knowledge of
pedagogical features in the curriculum unit to find out students’ ideas (including misconceptions)
and ability to productively guide students’ thinking and reasoning. Tables 1 and 2 outline the two
categories of teacher knowledge and skills.
Table 1. Teacher knowledge and skills framework: Content coherence
Knowledge Skills
• Knowledge of the key ideas about matter
that are targeted in the unit (including
their boundaries) and why the treatment
of energy ideas is not included
• Describe the content storyline and the
contribution each lesson is intended to
make to it
• Knowledge of commonly held student
ideas and how they might be manifest in
student explanations of phenomena
• Describe the phenomena used in the
unit to illustrate the general principles
stated in the substance-level key ideas
and explained by the atomic-molecular
ideas
• Knowledge of the phenomena the unit
uses to illustrate the ideas targeted or to
illustrate the explanatory power of the
ideas and why these particular
phenomena were selected
• Use the representations employed in
the unit (LEGO bricks, ball-and-stick
models, structural formulas, molecular
formulas) to explain the phenomena
presented in the unit and other relevant
phenomena that might come up in class
discussions
• Knowledge of the
representations/models included in the
unit, why they were selected, and how
they are expected to support student
reasoning about and explanations of
phenomena
• Describe incorrect explanations of
phenomena that students might provide
and the misconceptions these incorrect
explanations might reflect
• Knowledge of the science content
storyline for the unit, what each lesson
contributes to it, and where students are
expected to be after each lesson

Kruse et al., NARST 2013
6
Table 2. Teacher knowledge and skills framework: Pedagogical support for student learning
Knowledge Skills
• Knowledge of student misconceptions
documented in the learning research
literature and how they may be manifest
in student explanations or questions
• Determine if students are able to make
the intended observations of
phenomena and support claims with
evidence
• Knowledge of the features provided by
the student and teacher materials to help
teachers find out students’ ideas and help
them move towards a more scientifically
correct understanding
• Determine if students are able to use the
representations/models to reason about
and explain the phenomena and support
claims with evidence
• Use class and small-group discussions to
guide student reasoning about
explanations of phenomena
• Summarize students’ ideas at the end of
the lesson, citing responses to Stop and
Think or Summarize, Reflect, and
Connect
• Determine if students are generalizing
the substance-level science ideas from
their experiences with phenomena and
supporting claims with evidence
• Determine if students are using the
atomic-molecular science ideas to
explain substance-level phenomena and
supporting claims with evidence
• Summarize the progress a sample of
students have made in understanding and
applying the science ideas (including
misconceptions they still have) and
supporting claims with evidence
We translated the Teacher Knowledge and Skills Framework into design principles that became
the unifying features of the suite of teacher materials and professional development. These
design principles that emerged from our goals on teacher learning include the following:
1. Knowledge of the unit storyline. The suite of teacher support materials helps teachers to
see the big picture, the science content storyline of the unit. The science content storyline
includes the science content ideas and the activities that are used to support their
development.
2. Knowledge of content and practices. The suite of teacher support materials helps to
deepen teachers’ knowledge of science content and practices related to the unit.

Kruse et al., NARST 2013
7
3. Knowledge of pedagogical purposes. The suite of teacher support materials helps
teachers to understand the design, intention, structure, and resources of each piece of the
curriculum, especially phenomena, data, and models used in the lesson activities.
4. Knowledge of lesson storylines. The suite of teacher support materials helps teachers to
understand the science content storyline (both ideas and activities) within each lesson.
5. Knowledge of teaching strategies that support making the storyline visible to students.
The suite of teacher support materials helps teachers to develop teaching strategies that
will enhance the implementation of the curriculum and the visibility of the science
content storyline.
6. Knowledge of teaching strategies that encourage the development of student thinking.
The suite of teacher support materials helps teachers learn to elicit, listen to, and respond
effectively to student ideas in support of student learning.
7. Analytical stance to teaching. The suite of teacher support materials helps teachers take
an analytical stance towards teachers’ planning, teaching, use of curriculum materials,
and assessment of student learning and learning needs.
Our rationale for design principles that primarily support teachers’ knowledge (rather than skills)
is that in the limited time we have for teacher PD and through the teacher support materials we
can realistically do more to increase teachers’ awareness than we can to develop skills. It is
through the teaching of the unit and completion of strategic analytical tasks that we anticipate
teachers will develop some skills necessary to teach the unit, though we realize that improvement
of skills benefits from feedback and is often prompted through self-analysis and reflection.
The Year 2 Suite of Teacher Support Materials
We developed an integrated suite of teacher support materials consisting of
• an educative web-based digital teacher edition (TE),
• face-to-face professional development activities that occur before the teaching of the unit,
and
• post-lesson analytical tasks that teachers complete while they are teaching the unit.
Together these materials constituted the coherent professional development program focused on
enhancing teachers’ abilities to help students construct meaningful understandings of the
curriculum’s learning goals while developing teachers’ analytical stance toward the teaching and
learning of science.
First, the educative digital teacher edition was developed using the Curriculum Customization
Service (CCS) platform. CCS is a web-based system built using National Science Digital
Library’s (NSDL’s) EduPak tools. CCS is designed to
• promote purposeful planning,
• guide teachers to make conceptually coherent customizations,
• support busy teachers to gradually integrate customizing into their normal planning
practices, and
• enable teachers to share their customizations with their professional learning community
Kruse et al., NARST 2013
8
Since the Toward High School Biology project is a research and development project that seeks
to evaluate the impacts of the curriculum on student learning with high fidelity of
implementation, during the field test we did not use the customization features that CCS offers.
We leveraged CCS’s platform which allows for interactive, just-in-time, and purposeful planning
to develop a teacher edition that includes the basic features outlined for the teacher support
materials suite.
In an effort to support teachers’ knowledge of the unit and lesson storylines, learning goals are
the central organizing concept of the CCS-Toward High School Biology interface. Teachers can
select a specific lesson-level learning goal and immediately see the curricular components that
support the key concept(s) in the tabbed sections of the interface. The lesson-level components
of the digital teacher edition are described in Table 3. The components map to the design
principles described above.
Table 3. Digital teacher edition components
“Before You Teach” expandable menu
• Graphic organizer to cue teachers to where lesson fits in the chapter content storyline
• Background content knowledge for chapter
• Common student ideas/misconceptions for chapter
• Lesson overview (e.g., key question, learning goal, outcomes and indicators of success,
materials/advance prep, lesson outline that links activity synopses with science ideas)
“Instructional Support Materials” expandable menu
• Printable facilitation guides that include
o Teacher questions/talk
o Anticipated student responses (identifying any common student ideas)
o Teacher follow-up questions
o Embedded assessments
• Copymasters used during the lesson
• Video used during the lesson
• Slide presentations (two formats—PPT and PDF) used during the lesson
“Embedded Assessments” expandable menu
• Printable “outcomes and indicators of success” charts by main learning goal for use during the
lesson to monitor student progress
• Printable charts containing features of ideal and problematic responses to the lesson key
question and Summarize, Reflect, and Connect questions to diagnose student understanding from
student discussions during the lesson or from work products following each lesson
“After You Teach” expandable menu
• Professional development tasks: survey link for post-lesson analytical tasks and reflections for the
teacher
Second, we created face-to-face PD activities that occur before and during teaching the unit. The
face-to-face PD occurred as a three-day orientation for teachers before (2 days) and during (1
day) teaching the unit. Third, the post-lesson analytical tasks and reflections bridge the digital
teacher edition with the professional development and teacher assessment of knowledge of the
curriculum. The face-to-face PD and lesson analysis tasks are described in more detail below.
Kruse et al., NARST 2013
9
While the digital TE and the PD incorporate all of the seven design principles, we prioritized
teacher learning goals for the PD based on what teachers could reasonably achieve prior to
actually teaching the unit and what was most critical to implementing the unit. The overarching
objective was to develop the capacity to teach the unit using the student edition (SE) and digital
teacher edition, with two primary goals being as follows:
1. Develop teachers’ knowledge of the unit’s content storyline and the rationale for
focusing on a few key concepts rather than on broad superficial coverage of many
(Design Principles 1–4)
2. Develop teachers’ understanding of pedagogical strategies that attend to student
thinking and learning (Design Principles 5–7)
The following examines how these goals were enacted in the professional development and
supported in the teacher edition.
PD Goal 1: Develop teachers’ knowledge of the unit’s content storyline and the rationale for
focusing on a few key concepts rather than on broad superficial coverage of many.
Toward Goal 1, face-to-face PD included opportunities for teachers to experience key activities
with phenomena and models as learners and collaboratively analyze the curriculum materials for
the visible content storyline. These PD strategies were intended to help teachers identify the
science ideas that are developed with each activity, identify places where students may get
confused, and help prepare teachers for making on-the-spot decisions about what student ideas to
address or set aside in service of establishing the coherent content storyline.
Teachers first experienced the key activities with phenomena and models as learners. Just as
their own students would later do, teachers constructed understanding by working
collaboratively, engaging in scientific conversation, and learning by doing, reading, thinking, and
writing. Teachers identified the science ideas developed in each activity by making their own
claims, supported by evidence from the activities, and using logic and science ideas in their
reasoning. Toward the end of the PD, teachers had opportunities to compare their understandings
with the developers’ claims-evidence-reasoning-assessment framework. It’s also worthwhile to
note that this immersion of teachers in both science and pedagogy of the curriculum has
additional benefits in that it serves to 1) develop or refine teachers’ own understandings of the
science concepts and 2) model relevant, effective teaching strategies, giving them a better sense
of what the teacher and student should be doing during the activity.
Teachers developed the visible content storyline for each chapter and for the unit through a
process that produces a conceptual flow graphic (CFG) as shown in Figure 1.

Kruse et al., NARST 2013
10
Figure 1. Conceptual Flow Graphic for THSB unit
The process of developing a CFG includes the following:
1. Teachers individually read each lesson in a chapter of the student edition as homework
before the PD.
2. Teachers individually determine and record (in a complete sentence) the science concept
that is/are being developed in each lesson as homework before the PD. They are given
time in the PD to refine their statement after experiencing the lessons as learners.
3. The group of teachers shares findings and negotiates to write a single-sentence concept
for each lesson on a sticky note.
4. The group of teachers determines the big, overarching concept for the chapter and writes
it on a sticky note.
5. Teachers use the lesson concept sticky notes and arrows to display the relationship
among and between the concepts for each chapter and show the flow of the science
content storyline. (Different arrows represent strong, weak, or no connections.)
6. The process is repeated for each chapter.
7. Arrows are used to display the relationship among and between concepts from chapter to
chapter and from chapter to the unit central learning goal.
Toward Goal 1, the TE materials also included a variety of components to support teachers in
situating themselves in the content storyline of the unit, chapter, and lesson during planning and
teaching of the curriculum.

Kruse et al., NARST 2013
11
• At the unit level, the Unit Overview describes the overarching learning goal of the
unit as it relates to the unit central questions and the core disciplinary ideas (NRC,
2012) developed in each chapter in service of the overarching unit learning goal. The
Unit Organizer provides a visual that highlights how the unit science content
storyline builds conceptually from chapter to chapter.
• At the chapter level, the Chapter Overview describes the concepts developed in that
chapter and provides a short synopsis of what students will do and think about in each
lesson. The Chapter Organizer provides a visual that highlights how the chapter
science content storyline builds conceptually from lesson to lesson.
• At the lesson level, the Lesson Overview provides a two-page overview of the lesson,
including an outline that explicitly links a short synopsis of what happens during each
phase of a lesson to the ideal thinking that should emerge from that phase.
• Background Content Knowledge provides more advanced information on the science
content, important observations students should make (and any observations teacher
might emphasize/de-emphasize), and rationale for the chemical reaction. Tables 4a
and 4b provide an example for the reaction between iron in steel wool and air.
Table 4a. Iron in steel wool and air (background) Steel Wool (Iron) and Air
Steel wool is made mostly of the element iron (Fe). To prevent the iron from rusting, steel wool is coated with an
oil-based coating that is removed with vinegar or heating. The rusting of iron is an electrochemical process that
begins with the transfer of electrons from iron to oxygen and involves multiple acid-base and dehydration
reactions. The rate of rust formation is affected by the presence of water and accelerated by other electrolytes.
The products of rust formation depend on the amount of oxygen and water present (e.g., a greenish-blue FeO may
form in oxygen-depleted conditions, an orange-brown Fe2O3 in oxygen-rich conditions). Iron metal is relatively
unaffected by dry oxygen, but because water is both part of the reactants and the products, the following chemical
equation is commonly used to represent the process:
4 Fe (s) + 3 O2 (g) → 2 Fe2O3 (s)
Given sufficient time, oxygen, and water, any iron sample will eventually convert completely to rust. The Fe2O3 rust
product is a delicate and brittle orange-brown solid that breaks apart with the slightest touch. This change in
texture often leads to misconceptions that rusting causes a decrease in mass, as opposed to the increase in mass
caused by chemically combining iron and oxygen. As this happens, an increase in mass occurs from chemically
combining iron and oxygen.
Since oxygen atoms have mass, rusted steel wool weighs more than the original steel wool. If the entire sample of
steel wool rusted (which is accomplished more easily by burning steel wool) it would weigh 30% more than its
original mass:
4 Fe (s) + 3 O2 (g) → 2 Fe2O3 (s)
4 × 56 amu 3 × 32 amu 2 × 160 amu
224 amu 96 amu 320 amu
(amu stands for atomic mass units)

Kruse et al., NARST 2013
12
Table 4b. Iron in steel wool and air (intended observations and rationale)
Chapter 1
Intended observations: Students will observe rust products that form on steel wool. By carrying out
the reaction in a flask sealed with a balloon, they will also have evidence that a gas in the flask is
involved in the reaction (e.g., the balloon is pushed or inverted into the flask as the air pressure
inside the flask decreases). Water plays an important role in this reaction, but is present at the
beginning (from vinegar) and at the end (product of dehydration reactions, will condense in the
sealed flask). Kids will make note of this, but try to focus students’ observations on what happens to
the steel wool and the balloon. In some instances, students have observed the greenish-blue FeO
rather than the orange-brown Fe2O3 when the flask is sealed by the balloon. Upon removing the
balloon and exposing the steel wool to more air, the orange-brown Fe2O3 appears.
Rationale for this reaction: In chapter 1, rusting provides an example of gaseous reactants yielding
solid products. This is analogous to photosynthesis reactions that “fix” carbon dioxide from the air to
form glucose for building plant materials.
Chapter 2
Intended observations: Students will observe that when the reaction is carried out in a sealed
container, a gas is used (as evidence by the inverted balloon) and a new solid forms, but the
measured mass does not change. When the container is opened, the measured mass will increase
over time until all of the iron has reacted to form rust.
Rationale for this reaction: Rusting provides an example of gaseous reactants yielding solid products.
In this reaction, the increase in measured mass that occurs when the container is opened is due to
chemically combining iron and oxygen from the air. This challenges common misconceptions that
matter is destroyed during rusting or that mass decreases when steel wool rusts. Thus, rusting may
help support students in contemplating photosynthesis reactions that “fix” gaseous carbon dioxide in
glucose monomers. Thus, carbon dioxide gas is the primary source of a plant’s matter (and hence,
mass).
PD Goal 2: Develop teachers’ understanding of pedagogical strategies that attend to student
thinking and learning.
In face-to-face PD, teachers were introduced to questioning strategies intended to help them
reveal, support, and guide students’ thinking and reasoning and to prepare them for responding
productively to student difficulties and misconceptions. Teachers learned about purpose and key
features for the three types of questions used in the SE and TE materials: questions to elicit,
probe, and challenge student thinking. Teachers reviewed the SE and TE materials and found
clear instances of each type of question and noted where used (phase) in the lesson. Teachers
discussed how to elicit and probe student thinking in whole-class format with maximum student
engagement. Teachers interviewed each other about content related to the unit in order to
practice on-the-spot use of probe and challenge questions. Teachers also practiced crafting their
own probe and challenge questions for a preselected sample of student responses from pilot
study notebooks.
During face-to-face PD teachers were also introduced to Lesson Analysis Tasks and Embedded
Assessment Analysis Chart tools used to support these tasks. The tasks and charts are intended
to help teachers diagnose and reflect upon student learning revealed by a representative sample

Kruse et al., NARST 2013
13
of student work in terms of indicators of success (e.g., use complete and accurate science ideas in
their explanations) and indicators of difficulty (e.g., use common or incomplete ideas in their
explanations) at the conclusion of key lessons in the unit. During PD teachers were introduced to
the 14 scaffolded tasks. They had opportunities to practice using the tools to diagnose and reflect
upon pre-selected student responses from pilot study notebooks and share their findings with the
group. Teachers then completed these 14 scaffolded tasks during their implementation of the unit
through survey links within the digital teacher edition. These post-lesson analytical tasks and
reflections were intended to bridge the digital teacher edition with the professional development,
as well as serve as a research measure of teachers’ knowledge of the curriculum. Details
regarding the lesson analysis tasks are provided in Table 5. Table 5 outlines the purpose of the
tasks, preparation, and procedure for completing tasks.
Table 5. Lesson Analysis Tasks
Purpose: To monitor and assess the impact of these lessons on student learning, you will periodically
analyze the thinking and learning of a subset of your students using analysis tools provided to
you.
Preparation for Lesson Analysis Tasks
• Identify the target students.
Before beginning your first lesson analysis task, identify 20 students whose work you will analyze
across the unit. The selected students might all be from one section, but they should represent
the range of students you teach in terms of ability, performance, and effort.
• Assign a number to each target student.
- Make a list of target students and assign each a number from 1 to 20.
- Use this list each time you fill out an embedded assessment analysis chart.
• For each lesson analysis task, you will look at how each of your 20 target students responded to
one selected question in the curriculum.
Directions for Doing the Lesson Analysis Tasks
Step 1. Gather target student responses to the assigned lesson analysis question.
Step 2. Read the embedded assessment analysis chart for the assigned question. Read the ideal
student response, the indicators of success (features of the ideal response), and indicators of
difficulties (features consistent with common student ideas/incomplete ideas).
Step 3. Compare each of your target student’s responses to the possible features of student
responses on the embedded assessment analysis chart. Each column from 1 to 20 represents
one of your target students. In each column place check marks to indicate all the features
included in that particular student’s response.
Step 4. Look at the pattern of check marks across the class and for each student. Write a reflection
addressing the following questions:
1. What science ideas seem to be well understood by your students? Give specific evidence
from the embedded assessment analysis chart or from your students’ written responses
that supports your assessment.
2. What science ideas might be causing some difficulty or confusion for students? Give specific
evidence from the embedded assessment analysis chart or from your students’ written
responses that supports your assessment.
3. Optional: Are you unsure about where students are at this point? Do you have conflicting
evidence from this analysis and other things you have observed in class? If so, please
explain.

Kruse et al., NARST 2013
14
Teachers used provided embedded assessment analysis charts to analyze a small but
representative set of target students’ written responses for selected assessment tasks items. Using
these analysis charts provides both diagnosis of an individual student’s thinking at the end of a
lesson, as well as a way to track the development of the individual’s understanding over the
course of the unit. The charts also provide a visual for quickly and easily identifying patterns in
student thinking across the larger sample of students. These tools are intended to support
teachers in developing analysis and reflection skills as described in the Pedagogical Support for
Student Learning framework (Table 2). A blank embedded assessment analysis chart is provided
in Figure 2 for the Lesson Analysis Task #2 (Lesson 5): Analyze the target students’ responses
to the lesson key question (Summarize, Reflect, and Connect question 1, p. 40): What happens to
atoms and molecules during chemical reactions?
Figure 2. Embedded Assessment Analysis Chart
Toward Goal 2, the TE also provides other embedded resources to support teachers’ ability to
anticipate, diagnose, and respond to student difficulties and common ideas in their daily planning
and teaching of the unit. The TE includes information about commonly held student ideas from
research literature and data from previous AAAS assessment projects to alert teachers to the
ideas students are likely to bring to the classroom. These and other common ideas noted in the
pilot study are included in the Student Misconceptions document by chapter, as well as in lesson
guides as “Anticipated Student Responses” to student edition questions. “Follow Up Questions”
intended to reveal student thinking and guide student reasoning are linked to specific anticipated
Kruse et al., NARST 2013
15
student responses, often those indicating incomplete ideas, misunderstandings, or use of fuzzy
language.
The TE identifies a specific embedded assessment task in each lesson, strategies for its use, and
indicators of success and difficulty for assessing student progress and difficulty. Usually these
assessment tasks are identified from a short number of questions in the Summarize, Reflect, and
Connect segment of a lesson that requires students to summarize the key idea(s) from the lesson,
practice using the key idea in a new context, and/or link the idea to a previous, but often future,
lesson (e.g., think about whether/how atom rearrangement might have something to do with the
digestion of food).
Select Findings and Implications for Revisions for Year 3
A field test was conducted with a relatively small but diverse sample of eight teachers and their
677 students in the East Coast and in the West. The purpose of the field test was to understand
whether the fundamental structure of the program was feasible to implement in a variety of
ordinary classroom settings, to conduct preliminary tests of impact on student achievement and
teacher learning, and to collect data to further inform revisions. The data sources and analyses
included the following:
• Quality of the student materials. A subset of Project 2061’s Textbook Evaluation Criteria were
used to analyze the student materials. Findings of the analysis of coherence and content alignment
to learning goals are described by Roseman et al. (2013).
• Quality of the teacher materials and professional development. A subset of Project 2061’s
Textbook Evaluation Criteria were used to analyze the coherence and quality of support for
teacher learning that are provided by teacher materials (TE) and professional development (PD).
A teacher pre-, mid-, posttest assessed teachers’ knowledge needed to teach the unit across the
subscales of content coherence and pedagogical support for student learning. The measure and
findings are described by Flanagan et al. (2013).
• Feasibility of use. Teacher pacing logs, student work, and teacher online reports of their
students’ progress were used to find out what lessons and activities teachers are using and how
much time it is taking them. Findings are summarized in Roseman et al. (2013). We also
videotaped four lessons in one of each teacher’s classes and analyzed them according to the
criteria and accompanying indicators that best predicted student learning in AAAS’ previous IERI
study: Guiding student interpretation and reasoning (Wilson & Roseman, 2012).
• Student pretests and posttests. A multiple choice assessment was developed and piloted that
aligned with the articulated learning goals, boundaries, and common and persistent
misconceptions. The measure and findings are described by Herrmann Abell et al. (2013).
• Student interviews. A small number of students were interviewed during and after the unit to
assess how consistent their performance on the student test is with their oral performance on
interview questions.
• Student classwork. Students’ written work is analyzed to determine what lessons and activities
were actually completed and serve as an indicator of what students understand.
The remainder of the paper will illustrate how the various data sources and findings produced
from these measures have informed the iterative development process of the teacher support
materials in Year 3, including 1) the redesign of the suite of teacher support materials that
addressed these findings, including a print teacher edition that better connected SE and TE; 2) a
Kruse et al., NARST 2013
16
restructuring and expansion of online resources (instructional videos, online tutorials and how-to
videos, and lesson analysis tasks); and 3) teacher professional development that included three
days of face-to-face PD and a webinar, both of which have a significant focus on pedagogical
support. The following provides more details regarding findings and how they were addressed in
revisions of the suite of teacher support materials during Year 3.
Format and structure of the digital teacher edition
Analytics and teacher feedback regarding their use of the digital TE indicated that teacher use
was limited primarily to accessing instructional media and for completing lesson analysis tasks.
Teachers cited the following as areas for further improvement. Teachers generally found the
format and organization of the digital TE too complex, with different components required for
planning, teaching, and analyzing teaching layered in different expandable menus of the CCS
online portal rather than all in one place. Even when printed, the format of the lesson guides did
not closely resemble the format of the student edition, nor were they connected proximally to the
student edition answer key (as a typical wrap-around version would provide, for example).
Finally, the student edition answer key included a range of typical student responses (some
accurate, some incomplete, some reflecting confusion or misconceptions), not just the ideal
response, making it difficult for teachers to discern where they might reasonably expect students
to be at a given point in the curriculum.
The revised teacher edition consists of 400+ pages of printed text (also available online)
providing teachers with information about the unit and in support of the enactment of the unit at
the unit, chapter, and lesson levels. The following are new to the TE:
Each Lesson Guide now consists of facing (alternating) student edition answer key and teacher
facilitation notes pages, providing a clear link between the student and teacher materials. Each
student edition answer key page includes the student edition page plus the ideal student response
we would expect from the “average” student at that point in the lesson. The teacher facilitation
notes pages include Teacher Talk and Actions, strategies for facilitating each page of the student
edition, including partner/small group work, prompts for whole-class discussion, science ideas to
highlight and strengthen visibility of the content storyline, and science notes addressing issues
for the teacher to be aware of. The teacher facilitation notes pages also include less-than-ideal
Anticipated Student Responses (e.g., student responses that use “fuzzy” language, include
misconceptions, or suggest other confusions) and Possible Follow-Up Questions the teacher can
pose to clarify what students are trying to communicate or for moving students toward more-
accurate ideas.
The teacher facilitation notes are not intended as a script, but provide the essence of the
developers’ intent for enactment of lessons, “typical” student responses, and reasonable ways for
teachers to productively respond to student thinking and adjust the curriculum to their students
and classroom situations in service of that intent.
Unit and Lesson Storylines
Asking teachers to individually identify the primary science concept for each lesson and chapter
and then negotiate these concepts with the group requires them to take a more analytical stance
in their review of the student materials, considering how ideas develop from activities and

Kruse et al., NARST 2013
17
identifying places in which they might anticipate students will need additional support.
However, during the Year 2 PD we acknowledged the tension that exists between wanting
teachers to construct their understanding versus time constraints of the three-day PD. First, the
process of teachers’ constructing their understanding is inherently more successful when they
can first experience lessons in their entirety just as their students will. Due to time constraints,
teachers only experienced key activities from each chapter, and often these experiences
significantly informed their identification of the lesson concepts. Teachers tended to neglect
important contributions of the rest of each lesson that they had not experienced. Second, teachers
bring with them their own experiences and ideas about how content should be sequenced and
presented to students for many of the fundamental concepts of the unit. As teachers were
negotiating the lesson concepts with the group, we observed teachers sometimes relying on their
past experiences and ideas rather than on the materials themselves. PD leaders expended much
time in challenging teachers to identify where their identified concept was developed (often they
misinterpreted the pedagogical purpose of an activity or question) and then to examine particular
activities and/or questions more carefully. Sometimes this involved additional time for the
unanticipated modeling of activities and/or questions to better illustrate lesson concepts.
In Year 3, we took the stance that teachers would benefit more from opportunities to interact
with the intended key lesson concept as well as the supporting science ideas developed in each
lesson than with their constructed understandings. Rather than using the process outlined
previously for creating the CFGs, we revised the process to focus on mapping the content
storyline through preprinted cards containing lesson concepts and science ideas. After
experiencing key activities from each lesson in a chapter as learners, the PD leaders highlighted
other important activities and questions from segments of the lessons teachers had not
experienced. Teachers were provided with preprinted cards, each containing a lesson concept.
Teachers were asked to assign each concept card to a lesson in the sequence and then draw
arrows to show connections and building of concepts between and among lessons. After
completing this for each of the four chapters, teachers were provided with preprinted cards, each
containing a science idea. Teachers were asked to create a sequenced map of the science ideas
(in major subsets of chemistry, animal growth, and plant growth) presented in the unit and then
draw arrows to show connections between and among science ideas. Figure 3 shows an example
of such a map. In the map, the more basic and foundational concepts are at the bottom and the
more complex ideas at the top. The hierarchical organization shows a clear building of ideas. By
including the science ideas for chemistry, animal growth, and plant growth on the same map,
teachers can more clearly visualize the foundational chemistry ideas and their contextualization
for the living contexts.

Kruse et al., NARST 2013
18
Figure 3. Map of Science Ideas
Pedagogical Purpose
Feasibility measures (e.g., teacher logs, student work, and classroom video) indicated that the
unit was too long for the five-week timeframe allotted. Curriculum developers made suggestions
as to activities that could be cut with minimal impact on the coherence of the content storyline.
Furthermore, teachers made some additional cuts due to unforeseen time losses. Some teachers
did not reach the end of the unit. One teacher did not reach the biology lessons, and two teachers
did not reach the lessons on photosynthesis and plant growth. Our data suggest that teachers
generally followed the curriculum script for the chemistry lessons. As it became clear that they
would not complete the biochemistry lessons if they maintained the intended pace, teachers
either kept that pace and didn’t finish, or they rushed through making significant cuts. Some

Kruse et al., NARST 2013
19
teachers’ cuts did not preserve coherence, suggesting lack of awareness of or attention to the
pedagogical purpose of activities (or other phases of a lesson) during planning and in-the-
moment decision making.
At the lesson level, the Lesson Guide provides a two-page overview of the lesson, including the
key question, target sciences ideas and practices, materials and advance preparation, and a
summary chart describing key phenomena, data, and models used, intended observations, and
their pedagogical purpose. The summary also provides rationale, including common ideas that
are challenged, and other helpful notes to the teacher (e.g., (de)emphasize idea, accept certain
ideas at this time). Table 3 provides a sample from Lesson 6: Using Models to Represent
Chemical Reactions. The intent of the summary table is to provide teachers with stronger
understanding of unit and lesson storylines and pedagogical purpose of specific tasks.

Kruse et al., NARST 2013
20
Table 3. Lesson Guide Summary Table for Lesson 6 Phenomena, Data, or
Models
Intended Observations Purpose Rationale
and/or Notes
Activity 1:
LEGO models
representing two
chemical reactions:
• Steel wool (iron)
and air (oxygen gas)
• Baking soda and
vinegar
• Bricks of the models of
starting substances are
rearranged and
connected in different
combinations to make
models of ending
substances, with no bricks
left over and no
additional bricks needed.
• Sometimes small groups
of bricks from the models
of starting substances
stay together and get
joined up with different
bricks in the models of
ending substances.
Students visualize
rearrangement of atoms (and
forecast conservation of
atoms) of starting substances
to account for new
substances that form during
chemical reactions.
The modeling activity
challenges common ideas
that atoms are created,
destroyed, or turned into
new atoms during chemical
reactions.
The modeling activity
represents the
stoichiometric (lowest
whole number)
relationships between
reactant and product
molecules, but it is not an
explicit focus of the
activity.
Activity 1:
Space-filling models
representing methane
gas and oxygen gas and
possible ending
substances
• Starting substances
(methane and oxygen
molecules) are collectively
made up of combinations
of H, C, and/or O atoms.
• Water, carbon dioxide,
and carbon monoxide are
collectively made up of
combinations of H, C,
and/or O atoms.
Ammonia is made up of N
and H atoms.
Students use accurate models
of molecules to predict
possible ending substances
given the atom composition
of starting substances.
The context challenges the
misconception that atoms
are not created, destroyed,
or turned into new atoms
during chemical reactions.
Pulling It Together:
Descriptions of
substance properties
and LEGO-model
images representing
two changes involving
the formation of gases:
• Chemical reaction of
hydrogen peroxide
forming oxygen gas
and water
• Dissolution of
carbon dioxide gas
from carbonated
water
• Description of substance
properties suggest a new
substance (a gas) is
formed
• LEGO models indicate
atoms are rearranged
when hydrogen peroxide
forms oxygen gas and
water (chemical reaction)
• LEGO models indicate
atoms are NOT
rearranged when carbon
dioxide gas leaves
carbonated water
(physical)
Students use accurate models
of atoms and molecules of the
starting and ending
substances to decide that a
chemical reaction has/has not
occurred and justify their
decision based on the ideas.
An ideal explanation would
include a) one or more
differences formed/did not
form using the same atoms as
those that made up the
starting substances and b)
according to the definition of
a chemical reaction, the
formation/lack of formation
of one or more molecules
from the original atoms
means that a chemical
reaction did/did not occur.
The contexts challenge the
misconception that gas
formation during a change
always is the result of a
chemical reaction.

Kruse et al., NARST 2013
21
Supporting the Science Practices
Unlike traditional textbooks, the curriculum does not merely state the central concepts students
should know and expect them to memorize them; rather, students develop their understanding of
these concepts through observing and interpreting phenomena and data sets, reasoning about
models that represent underlying molecular changes, and constructing and critiquing verbal and
written explanations of the phenomena. This is likely a shift in some teaching and learning
routines in traditional classrooms, and teachers need support in making these shifts.
Findings of the pre/posttests showed that students included more correct science ideas in their
written explanations (Herrmann Abell et al., 2013). However there was little improvement in the
students’ ability to construct scientific explanations. Few students included all parts of a
scientific explanation; that is, they did not include a claim, evidence, and reasoning (McNeill &
Krajcik, 2012). The measure of teacher knowledge indicated similar findings (Flanagan et al.,
2013). The Year 2 unit included four lessons dedicated to instructing students on how to
construct and evaluate scientific explanations. However, feasibility measures indicate that these
lessons were among the activities eliminated due to the time constraints, providing the most
logical reason why both students and their teachers made little improvement in this practice.
Findings of the feasibility measures indicated that in general teachers were engaging students in
the modeling activities. However, several teachers enacted the modeling tasks in Chapters 3 and
4 (with ball-and-stick models) almost exclusively as teacher-led demonstrations after a
challenging experience with protein digestion (e.g., some students completely dismantled the
protein model instead of breaking and making a few connections to make amino acids; other
students could not accurately reconnect the amino acids to build the protein models for the next
period). In informal conversations between classes and during planning periods, two teachers
suggested that these kinds of tasks require more class time and more extensive scaffolding than
was found in the SE.
For the Year 3 revisions to the student edition, we made the decision to cut some of the learning
goals that were not as central to the overarching goal of growth and repair of living things (for
example, building proteins in plants and building carbohydrates in animals) so that the
explanation activities could be added back in. Additionally, instead of having only four formal
explanation activities, the Year 3 version of the unit includes additional opportunities to practice
constructing scientific explanations in 11 of the 20 lessons We also revised the student materials
to increase the frequency that students engage in identifying monomeric units from ball-and-stick
model images of polymer segments. And we increased the level of scaffolding when ball-and-
stick physical models are used to ensure greater success in manipulating the models. For
example, students were provided step-by-step routines for
• building large carbon-based molecules,
• contemplating manipulations with photographs of the models before conducting them
with the physical models, and
• checking with the teacher for an “OK” to proceed with manipulating the models.
Revisions to the suite of teacher support materials also reflect the central role explanations and
models serve in the Year 3 curriculum.
Kruse et al., NARST 2013
22
The online tutorials included in the Year 3 online resources provide teachers with additional
support for apprenticing students in the science practices using models and constructing
explanations. Each online tutorial consists of an animated PowerPoint presentation with narration
converted to a 10–15 minute video. The tutorials include an introduction to the science practice,
key features of the practice, examples from the curriculum illustrating how the practice is used,
and strategies for supporting students in using the practice in THSB and beyond.
The online resources also include how-to videos that demonstrate and narrate activities as they
are presented in the student edition. The intent of the how-to videos is to provide teachers with
opportunities to observe phenomena and, especially, manipulations of models prior to their
teaching in the classroom. This allows teachers to “watch” activities that were not included in
face-to-face professional development and think through what their students will observe and do
in the classroom and how they as teachers can best support students. Though it is not our
preference, most of these videos may also be used as instructional media in classroom contexts
where hands-on manipulation of models is challenging for the teacher to enact. As these videos
can be projected, they are a better alternative to 28–32 students crowded around a teacher
demonstration the modeling.
Furthermore, during face-to-face PD teachers spend 6–8 hours investigating modeling and
explanations tasks. Teachers experience most of the modeling activities as learners. Then, for
each chapter, teachers examine explanation tasks and scaffolding provided, then practice
evaluating and/or constructing their own explanation for a specific task in partners or small
groups. The webinar that occurs during teachers’ implementation of the unit affords teachers
with an addition opportunity to reflect on the quality of their own students’ explanations using
the criteria established in the curriculum (below):
• Claim should answer the question.
• Evidence should include all available evidence that is relevant to the claim.
• Scientifically accurate models can be cited as evidence for atomic molecular changes.
• The science ideas relevant to the claim must be stated and all of the available evidence
must be consistent with these science ideas.
During the webinar, teachers use student work to identify progress and challenges associated
with student-developed explanations and consider what additional support is needed for students
moving forward.
Lesson Analysis Tasks
As developers, we intended that teachers would use the lesson analysis tasks and embedded
assessment analysis charts to contemplate how they would productively respond to problematic
student thinking and/or use student thinking as rationale for any adaptations made the next day
and/or for future lessons. For example, if the teacher notes evidence of difficulty, she can look
for evidence of the same difficulty in later, related lessons and plan questions or tasks to
challenge the idea. Or if a teacher notes evidence that many students share the same difficulty, he
may conclude that conducting an interactive lecture demonstration of a previous activity is
warranted to ensure students are making the appropriate observations and, through his questions,
Kruse et al., NARST 2013
23
guide students’ reasoning. Unfortunately, we found that generally teachers did not use lesson
analysis tasks as tools for informing instruction in the ways intended.
Findings from the lesson analysis task data and from teacher feedback indicated several areas for
improvement with lesson analysis tasks. First, teachers generally found lesson analysis tasks
time consuming given their frequency and other demands from the field test. Rather than
complete a lesson analysis task immediately after teaching the lesson from which the task came,
teachers tended to complete them over the weekend or complete all tasks associated with a
chapter at the end of the chapter. Some teachers waited until the end of the unit to complete a
majority of the lesson analysis tasks. This negated the use of lesson analysis tasks in informing
instruction “the next day”. In Year 3, we reduced the number of lesson analysis tasks from 14 to
4, selecting them from lessons in which key ideas (the concept central to the chapter) were
developed and likely used again in next/future lessons.
Second, we also found teachers generally treated the lesson analysis tasks academically,
completing them primarily as a tool to inform the research, not as a tool to help them uncover
and attend to problematic student thinking in next/future lessons. In the Year 3 iteration of the
teacher support materials, an additional reflection question has been added to provoke such
reflection on plans for responding to student thinking in next/future lessons:
Review the next lesson (and if possible, the next chapter). Where will the difficulties
from this lesson cause problems later in the unit? Where and how in coming lessons will
you challenge student difficulties or confusion that you observed in this lesson?
Teachers also used the analysis charts mechanistically: 1) looking very literally for students’ use
of specific phrasing and vocabulary rather than considering the ideas revealed in students’
responses and 2) looking only for the ideas listed in the charts rather than treating charts flexibly
and adding other pertinent ideas that emerged from students’ writing. This finding was
consistent with teachers’ ability to recognize only 1–2 misconceptions on the teacher knowledge
measure with no noticeable improvement after PD or after teaching the unit. We surmised that if
teachers do not recognize misconceptions challenged in the unit, they will fill in the chart
mechanistically. To better prepare teachers for completing and learning from these analyses,
more explicit attention was paid to misconceptions in the face-to-face PD and in the TE. In the
final iteration of the lesson analysis tasks, teachers are directed to use a 2-1-0 scoring system to
reflect use, partial/incomplete use, or no use of ideas, rather than a system of check mark or no
check mark. Teachers are also provided with customizable charts in a Word file and an
additional suggestion has been added to further encourage flexible use:
Students may use different words than those used in the features. Look for the ideas
represented, not the specific words used. If students use ideas that are not listed in the
indicators of difficulty table (e.g., misconceptions, confusions, “fuzzy” language), please
add these to the table.
Kruse et al., NARST 2013
24
Conclusions
This paper reported on the iterative development process of a suite of teacher support materials
(teacher edition and professional development) designed to support teachers’ enactment of a
research-based curriculum intervention. Here we described the Year 2 suite of teacher support
materials and, specifically highlighted how it enacts its seven research-based design principles.
We illustrated how findings from a variety of teacher and student data sources informed
revisions in the final year of the project.
The project has broader impacts for the field of science education at a critical time. As science
educators begin to incorporate the recommendations in the National Research Council’s
Framework for K-12 Science Education and to prepare for the final release of the Next
Generation Science Standards, this curriculum intervention serves as one of few models in
which teacher support materials have been created to support teachers in engaging students in
important scientific practices and their application of crosscutting themes and in their
understanding of core science ideas such as those identified in the NRC Framework. The
knowledge and experiences developed and the findings from this project may help inform the
design and study of curriculum, assessment, and professional development that is aligned to the
goals expressed in these documents.
Acknowledgements
The authors would like to acknowledge other members of the BSCS project team: Kerry
Skaradzinski, Rhiannon Baxter, Stacey Luce, and Chris Moraine, and the AAAS project team: Jo
Ellen Roseman, Cari Herrmann Abell, Jean Flanagan, Mary Koppal, Abigail Burrows, and
Caitlin Klein.
The research reported here was supported by the Institute of Education Sciences, U.S.
Department of Education, through Grant R305A100714 to the American Association for the
Advancement of Science. The opinions expressed are those of the authors and do not represent
views of the Institute or the U.S. Department of Education.
References
AAAS Project 2061 (1993) Benchmarks for Science Literacy. New York: Oxford University
Press.
AAAS Project 2061 (n.d.) AAAS Science Assessment Website. Retrieved from
http://assessment.aaas.org on March 19, 2013.
Anderson, C. W., Sheldon, T., & Dubay, J. (1990). The effects of instruction on college
nonmajors’ conceptions of respiration and photosynthesis. Journal of Research in Science
Teaching, 27(8), 761–776.
Andersson, B. R. (1986). Pupils’ explanations of some aspects of chemical reactions. Science
Education, 70(5), 549-563.
Ball, D. L., & Cohen, D. K. (1996). Reform by the book: What is - or might be - the role of
curriculum materials in teacher learning and instructional reform? Educational Researcher,
25(9), 6-14.
Cohen, D. K., & Hill, H. C. (2001). Learning policy: When state education reform works. New
Haven, CT: Yale University Press.

Kruse et al., NARST 2013
25
Darling-Hammond, L. (1997). The Right to Learn. San Francisco, CA: Jossey-Bass.
Davis, E., & Krajcik, J. (2005). Designing educative curriculum materials to promote teacher
learning. Educational Researcher, 34(3), 3-14.
Flanagan, J. C., Herrmann Abell, C. F., & Roseman, J. E. (April 2013). Developing and
Evaluating an Eighth Grade Curriculum Unit that Links Foundational Chemistry to
Biological Growth: Using Teacher Measures to Evaluate the Promise of the Intervention.
Paper presented at the National Association of Research in Science Teaching Annual
Conference, Rio Grande, PR.
Herrmann Abell, C. F., Flanagan, J. C., & Roseman, J. E. (April 2012). Results from a Pilot
Study of a Curriculum Unit Designed to Help Middle School Students Understand Chemical
Reactions in Living Systems. Paper presented at the National Association of Research in
Science Teaching Annual Conference, Indianapolis, IN.
Herrmann Abell, C. F., Flanagan, J. C., & Roseman, J. E. (April 2013). Developing and
Evaluating an Eighth Grade Curriculum Unit that Links Foundational Chemistry to
Biological Growth: Using Student Measures to Evaluate the Promise of the Intervention.
Paper presented at the National Association of Research in Science Teaching Annual
Conference, Rio Grande, PR.
Kesidou, S., & Roseman, J. E. (2002). How well do middle school science programs measure
up? Findings from Project 2061’s curriculum review study. Journal of Research in Science
Teaching, 39(6), 522-549.
Krajcik, J. S., Blumenfeld, P. C., Marx, R. W., & Soloway, E. (1994). A collaborative model for
helping middle grade science teachers learn project-based instruction. The Elementary School
Journal, 94(5), 483-497.
Kruse, R., Howes, E. V., Carlson, J., Roth, K., & Bourdelat-Parks, B. (April 2013). Developing
and evaluating an eighth grade curriculum unit that links foundational chemistry to
biological growth: Designing professional development to support teaching. Paper presented
at the National Association of Research in Science Teaching Annual Conference, Rio
Grande, PR.
Loucks-Horsley, S., Hewson, P. W., Love, N., & Stiles, K. E. (2010). Designing professional
development for teachers of science and mathematics (3nd ed.). Thousand Oaks, CA: Corwin
Press.
McNeill, K. L. & Krajcik, J. (2012). Supporting grade 5-8 students in constructing explanations
in science: The claim, evidence and reasoning framework for talk and writing. New York,
NY: Pearson Allyn & Bacon.
Mohan, L., Chen, J., & Anderson, C. (2009). Developing a multi-year learning progression for
carbon cycling in socio-ecological systems. Journal of Research in Science Teaching, 46(6),
675-698.
National Center for Education Statistics. (2012). The Nation’s report card: Science 2011 (NCES
2012–465). Washington, DC: Institute of Education Sciences, U.S. Department of Education.
National Research Council [NRC]. (2012). A Framework for K-12 science education: Practices,
crosscutting concepts, and core ideas. Washington, DC: National Academies Press.
Powell, J. C., & Anderson, R. D. (2002). Changing teachers' practice: Curriculum materials and
science education reform in the USA. Studies in Science Education, 37, 107-135.
Remillard, J. T. (2005). Examining Key Concepts in Research on Teachers’ Mathematics
Curricula. Review of Educational Research, 75(2), 211-246.

Kruse et al., NARST 2013
26
Roseman J. E., Herrmann-Abell, C. F., Flanagan, J. C., Kruse, R., Howes, E. V., Carlson, J.,
Roth, K., and Bourdelat-Parks, B. (April 2013). Developing and evaluating an eighth grade
curriculum unit that links foundational chemistry to biological growth: Selecting core ideas
and practices—an iterative process. Paper presented at the National Association of Research
in Science Teaching Annual Conference, Rio Grande, PR.
Roseman, J. E., Kesidou, S., & Stern, L. (1997). Identifying Curriculum Materials for Science
Literacy. A Project 2061 Evaluation Tool. Based on a paper prepared for the colloquium
Using the National Science Education Standards to Guide the Evaluation, Selection, and
Adaptation of Instructional Materials. National Research Council, November 10-12, 1996.
Roseman, J.E., Stern, L., & Koppal, M. (2010). A method for analyzing the coherence of high
school biology textbooks. Journal of Research in Science Teaching, 47(1), 47-70.
Taylor, J. A., Powell, J. C., Van Dusen, D. R., Pearson, B., Bess, K., & Schindler, B. (2003).
Rethinking the continuing education of science teachers: An example of transformative,
curriculum-based professional development NSTA Monograph Series: Exemplifying the more
emphasis conditions in the National Science Education Standards: NSTA.
Taylor, J. A., Van Scotter, P., Coulson, D., Bloom, M. V., Kowalski, S. M., & Stuhlsatz, M. A.
M. (2008). Assessing the impact of research-based instructional materials on student
achievement. In R. W. Bybee & M. V. Bloom (Eds.), Measuring our success: The first 50
Years of BSCS (pp. 95-111). Dubuque, IA: Kendall/Hunt Publishing.
Wei, R. C., Darling-Hammond, L., Andree, A., Richardson, N., Orphanos, S. (2009).
Professional learning in the learning profession: A status report on teacher development in
the United States and abroad. Dallas, TX: National Staff Development Council.
Wilson, L., & Roseman, J. (2012). A tool for analyzing instructional practices and curriculum
materials in the context of specific mathematics learning goals. In Approaches to Studying
the Enacted Mathematics Curriculum. (Eds.) K. Chval, D. Heck, I. Weiss, and S. Ziebarth.
Information Age Press.