Embed Size (px)
Citation preview
Developing and Evaluating an Eighth Grade Curriculum Unit that Links
Foundational Chemistry to Biological Growth:
Using Student Measures to Evaluate the Promise of the Intervention
Cari F. Herrmann-Abell, Jean C. Flanagan, and Jo Ellen Roseman
AAAS Project 2061
Paper #4 of a related paper set presented at
2013 NARST Annual International Conference
Rio Grande, Puerto Rico
April 6 – 9, 2013
Abstract
Students often have trouble understanding key biology ideas, in part because they lack an
understanding of foundational chemistry ideas. AAAS is collaborating with BSCS in the
development of a curriculum unit that connects core chemistry and biology ideas in order to help
eighth grade students build the conceptual foundation needed for high school biology. The unit
is designed to engage students in (a) observing phenomena that are explicitly aligned to the
targeted ideas and address common student misconceptions and difficulties and (b) using models
to help interpret the phenomena in light of the targeted ideas. An initial draft of the unit was
pilot tested at two schools in 2011. The results of the pilot test were used to revise the unit. In
the spring of 2012, the revised unit and teacher materials were field tested with 677 eighth grade
students from four states across the U.S. Pretests and posttests were used to measure the change
in students’ understanding of chemical reactions, conservation of mass, and biological growth.
The data were analyzed using Rasch modeling and the racking and stacking methods. The
stacking method showed that, overall, the students made statistically significant gains, suggesting
that their understanding of the targeted ideas improved. The racking method showed that the
difficulty of most of the items decreased as a result of the intervention, suggesting that the unit
successfully covered most of the ideas. An analysis of distractor selections and written
explanations of their answer choices showed that fewer students held misconceptions after
participating in the unit. These results were used to inform a second round of revisions to the
unit.
Herrmann-Abell et al., NARST 2013
4/4/2013 2
Introduction
Past research on student understanding. Evidence from the National Assessment of
Educational Progress (NAEP) science assessment makes it clear that students are not being well
prepared in science by the time they graduate from high school. On the 2009 assessment, only
21% of 12th-graders reached the proficient level, and 40% performed below basic (National
Center for Education Statistics, 2011). Eighth-graders did show some improvement on the
NAEP science assessment from 2009 to 2011 (p < .05). The percentage of eighth graders
performing below basic dropped from 37% to 35% and the percentage at or above the proficient
level rose from 30% to 32% (National Center for Education Statistics, 2012). While this trend is
encouraging, there is still a significant number of students entering high school with a below
basic understanding of science.
Although students are not performing well in any of the sciences, we are particularly concerned
about students’ low achievement on topics that are essential for further study of biology.
According to Anderson, Sheldon, and Dubay (1990), “students’ difficulties in understanding the
biological processes are rooted in misunderstandings about concepts in the physical sciences,
such as conservation of matter and energy, the nature of energy, and atomic-molecular theory
[that] were not addressed in instruction” (p. 775). In an assessment of middle school students’
understanding of photosynthesis, Marmaroti and Galanopoulou (2006) found that a great
majority of students do not appreciate that photosynthesis is a chemical reaction. Our own past
assessment research confirms students’ difficulties with these ideas. For example, fewer than
20% of a national sample of about 3000 middle school students correctly answered items testing
the link between matter transformation and growth, and performance on these items did not
significantly improve for high school graduates (DeBoer, Herrmann Abell, Wertheim, &
Roseman, 2009). Additionally, we have found misconceptions related to these topics to be
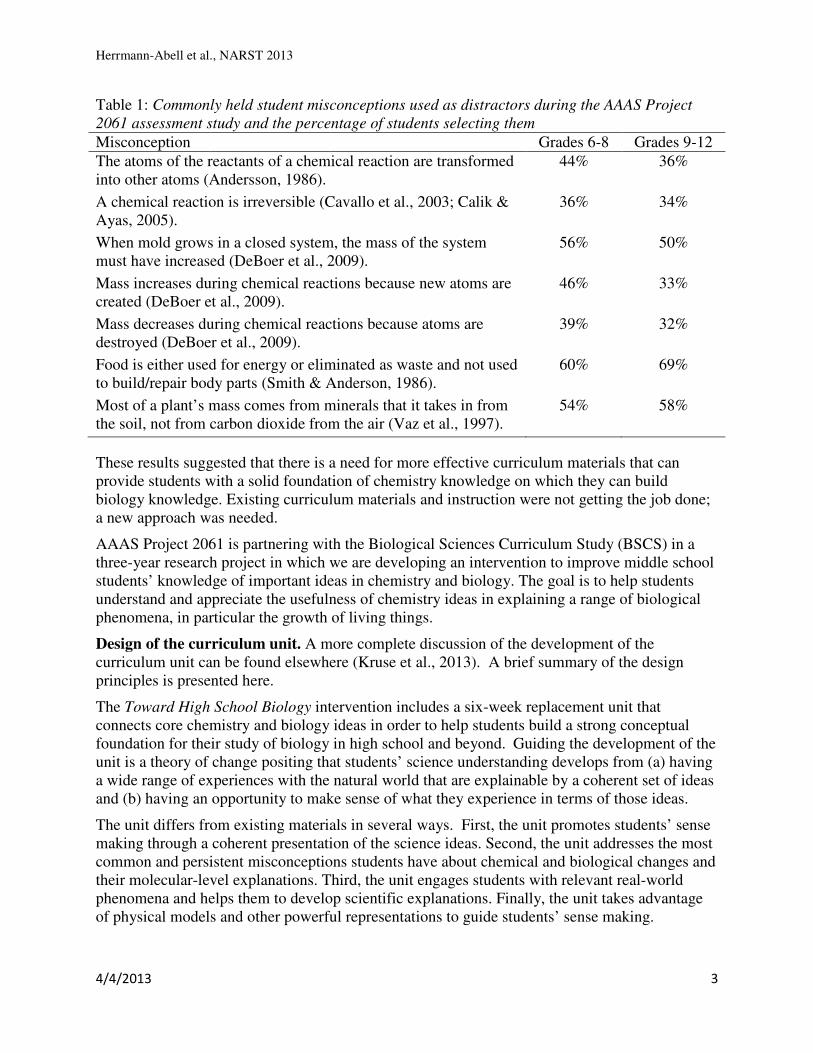
prevalent at both the middle and high school levels (AAAS Project 2061, n.d.). Table 1 provides
a list of the most commonly held misconceptions related to chemical reactions, conservation of
mass, and biological growth and the percentage of students selecting distractors aligned to the
misconception as their answer choice.
Herrmann-Abell et al., NARST 2013
4/4/2013 3
Table 1: Commonly held student misconceptions used as distractors during the AAAS Project
2061 assessment study and the percentage of students selecting them
Misconception Grades 6-8 Grades 9-12
The atoms of the reactants of a chemical reaction are transformed
into other atoms (Andersson, 1986).
44% 36%
A chemical reaction is irreversible (Cavallo et al., 2003; Calik &
Ayas, 2005).
36% 34%
When mold grows in a closed system, the mass of the system
must have increased (DeBoer et al., 2009).
56% 50%
Mass increases during chemical reactions because new atoms are
created (DeBoer et al., 2009).
46% 33%
Mass decreases during chemical reactions because atoms are
destroyed (DeBoer et al., 2009).
39% 32%
Food is either used for energy or eliminated as waste and not used
to build/repair body parts (Smith & Anderson, 1986).
60% 69%
Most of a plant’s mass comes from minerals that it takes in from
the soil, not from carbon dioxide from the air (Vaz et al., 1997).
54% 58%
These results suggested that there is a need for more effective curriculum materials that can
provide students with a solid foundation of chemistry knowledge on which they can build
biology knowledge. Existing curriculum materials and instruction were not getting the job done;
a new approach was needed.
AAAS Project 2061 is partnering with the Biological Sciences Curriculum Study (BSCS) in a
three-year research project in which we are developing an intervention to improve middle school
students’ knowledge of important ideas in chemistry and biology. The goal is to help students
understand and appreciate the usefulness of chemistry ideas in explaining a range of biological
phenomena, in particular the growth of living things.
Design of the curriculum unit. A more complete discussion of the development of the
curriculum unit can be found elsewhere (Kruse et al., 2013). A brief summary of the design
principles is presented here.
The Toward High School Biology intervention includes a six-week replacement unit that
connects core chemistry and biology ideas in order to help students build a strong conceptual
foundation for their study of biology in high school and beyond. Guiding the development of the
unit is a theory of change positing that students’ science understanding develops from (a) having
a wide range of experiences with the natural world that are explainable by a coherent set of ideas
and (b) having an opportunity to make sense of what they experience in terms of those ideas.
The unit differs from existing materials in several ways. First, the unit promotes students’ sense
making through a coherent presentation of the science ideas. Second, the unit addresses the most
common and persistent misconceptions students have about chemical and biological changes and
their molecular-level explanations. Third, the unit engages students with relevant real-world
phenomena and helps them to develop scientific explanations. Finally, the unit takes advantage
of physical models and other powerful representations to guide students’ sense making.
Herrmann-Abell et al., NARST 2013
4/4/2013 4
We are currently in the final year of the project. In the first year, we pilot tested an initial
version of the unit with a small number of schools (Herrmann-Abell et al., 2012). Data from the
pilot test was used to revise the unit in preparation for the field test in Year 2. This paper reports
on the results of pretests and posttests administered during the Year 2 field testing of the unit.
While the results are preliminary, they are promising and have been helpful in informing a
second round of revisions to the unit.
Methodology
Curriculum unit. Following the Year 1 pilot of the unit, the student and teacher editions were
revised and formal professional development was implemented (See Kruse et al., 2013 for details
about the professional development.). The number of learning goals was reduced to allow a
more focused and coherent treatment of the following overarching goal:
Students will be able to use the idea that all matter is made out of atoms to explain
growth and repair in living organisms (plants and animals). In order to grow and repair
body structures, plants and animals build polymers through chemical reactions from
monomers that plants make through other chemical reactions. Through all this, atoms are
rearranged and conserved.
The ideas covered in this overarching goal are included in the 6-8 grade band in the science
standards of nearly every state, including the states where we field tested the unit. The ideas are
also found in the 2011 NAEP Science Framework (National Assessment Governing Board,
2010), Benchmarks for Science Literacy (AAAS, 1993), the College Board Standards for
College Success (College Board, 2009), and the National Research Council’s Framework for K-
12 Science Education (NRC, 2012). More details about the selection of the learning goals can be
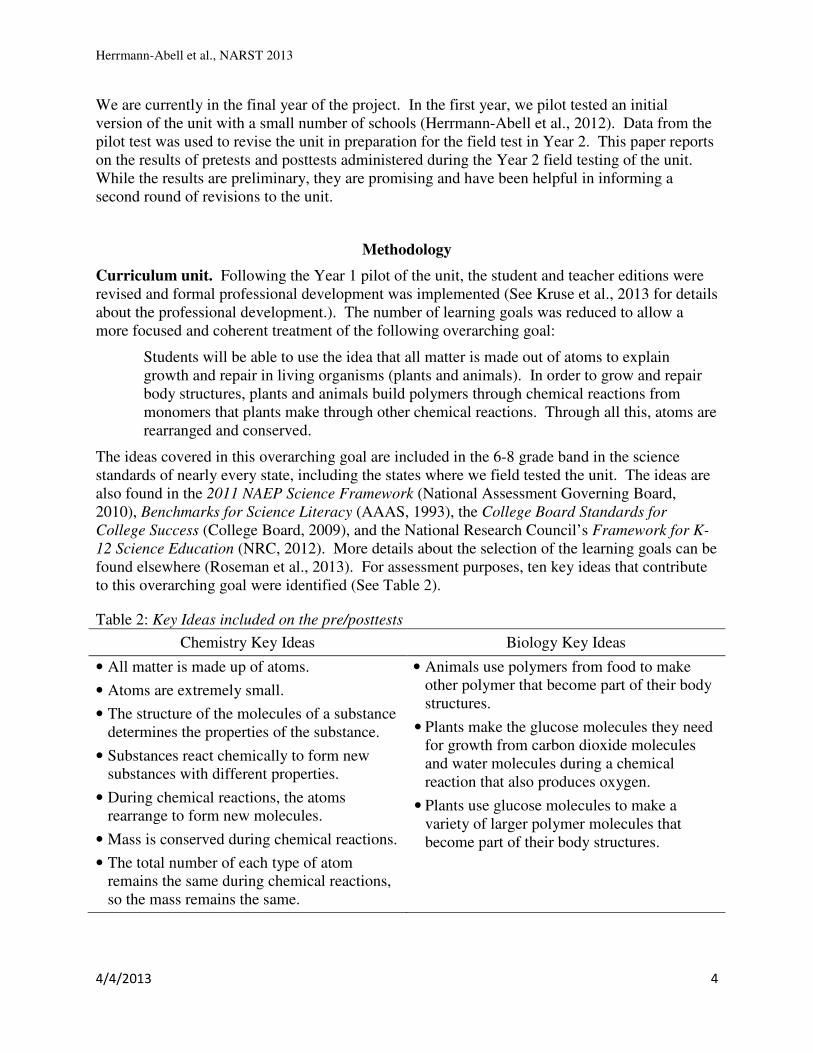
found elsewhere (Roseman et al., 2013). For assessment purposes, ten key ideas that contribute
to this overarching goal were identified (See Table 2).
Table 2: Key Ideas included on the pre/posttests
Chemistry Key Ideas Biology Key Ideas
• All matter is made up of atoms.
• Atoms are extremely small.
• The structure of the molecules of a substance
determines the properties of the substance.
• Substances react chemically to form new
substances with different properties.
• During chemical reactions, the atoms
rearrange to form new molecules.
• Mass is conserved during chemical reactions.
• The total number of each type of atom
remains the same during chemical reactions,
so the mass remains the same.
• Animals use polymers from food to make
other polymer that become part of their body
structures.
• Plants make the glucose molecules they need
for growth from carbon dioxide molecules
and water molecules during a chemical
reaction that also produces oxygen.
• Plants use glucose molecules to make a
variety of larger polymer molecules that
become part of their body structures.
Herrmann-Abell et al., NARST 2013
4/4/2013 5
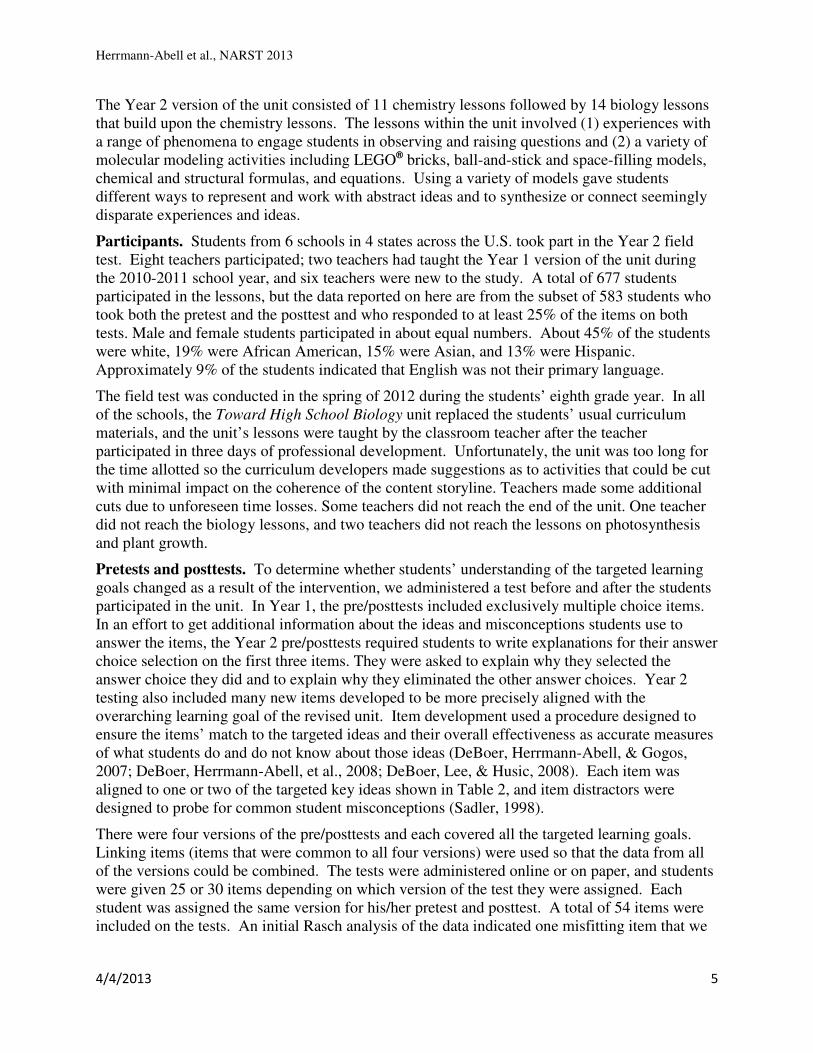
The Year 2 version of the unit consisted of 11 chemistry lessons followed by 14 biology lessons
that build upon the chemistry lessons. The lessons within the unit involved (1) experiences with
a range of phenomena to engage students in observing and raising questions and (2) a variety of
molecular modeling activities including LEGO® bricks, ball-and-stick and space-filling models,
chemical and structural formulas, and equations. Using a variety of models gave students
different ways to represent and work with abstract ideas and to synthesize or connect seemingly
disparate experiences and ideas.
Participants. Students from 6 schools in 4 states across the U.S. took part in the Year 2 field
test. Eight teachers participated; two teachers had taught the Year 1 version of the unit during
the 2010-2011 school year, and six teachers were new to the study. A total of 677 students
participated in the lessons, but the data reported on here are from the subset of 583 students who
took both the pretest and the posttest and who responded to at least 25% of the items on both
tests. Male and female students participated in about equal numbers. About 45% of the students
were white, 19% were African American, 15% were Asian, and 13% were Hispanic.
Approximately 9% of the students indicated that English was not their primary language.
The field test was conducted in the spring of 2012 during the students’ eighth grade year. In all
of the schools, the Toward High School Biology unit replaced the students’ usual curriculum
materials, and the unit’s lessons were taught by the classroom teacher after the teacher
participated in three days of professional development. Unfortunately, the unit was too long for
the time allotted so the curriculum developers made suggestions as to activities that could be cut
with minimal impact on the coherence of the content storyline. Teachers made some additional
cuts due to unforeseen time losses. Some teachers did not reach the end of the unit. One teacher
did not reach the biology lessons, and two teachers did not reach the lessons on photosynthesis
and plant growth.
Pretests and posttests. To determine whether students’ understanding of the targeted learning
goals changed as a result of the intervention, we administered a test before and after the students
participated in the unit. In Year 1, the pre/posttests included exclusively multiple choice items.
In an effort to get additional information about the ideas and misconceptions students use to
answer the items, the Year 2 pre/posttests required students to write explanations for their answer
choice selection on the first three items. They were asked to explain why they selected the
answer choice they did and to explain why they eliminated the other answer choices. Year 2
testing also included many new items developed to be more precisely aligned with the
overarching learning goal of the revised unit. Item development used a procedure designed to
ensure the items’ match to the targeted ideas and their overall effectiveness as accurate measures
of what students do and do not know about those ideas (DeBoer, Herrmann-Abell, & Gogos,
2007; DeBoer, Herrmann-Abell, et al., 2008; DeBoer, Lee, & Husic, 2008). Each item was
aligned to one or two of the targeted key ideas shown in Table 2, and item distractors were
designed to probe for common student misconceptions (Sadler, 1998).
There were four versions of the pre/posttests and each covered all the targeted learning goals.
Linking items (items that were common to all four versions) were used so that the data from all
of the versions could be combined. The tests were administered online or on paper, and students
were given 25 or 30 items depending on which version of the test they were assigned. Each
student was assigned the same version for his/her pretest and posttest. A total of 54 items were
included on the tests. An initial Rasch analysis of the data indicated one misfitting item that we
Herrmann-Abell et al., NARST 2013
4/4/2013 6
decided was not functioning properly. This item was removed from the set, so the results
presented here are from the remaining 53 items.
Rasch modeling. The data from the pre/posttests were analyzed using Rasch modeling. In the
dichotomous Rasch model, the probability that a student will respond to an item correctly is
determined by the difference in the student’s ability and the difficulty of the item (Bond & Fox,
2007; Liu & Boone, 2006). Student abilities and item difficulties are measured in the unit of
logarithm called log odds or logits, which can vary from -∞ to +∞. Student and item measures
are expressed on the same interval scale and are mutually independent, which is not the case for
percent correct statistics. (Note: Rasch modeling uses the term ‘ability’ to refer to the students’
understanding of the science ideas being targeted. It should not be interpreted as an underlying,
innate quality of the student, but more narrowly as the students’ understanding of the topic at the
time of testing.) In this study, student abilities and item difficulties were estimated using
Winsteps® Rasch measurement software (Lincare, 2012). The data from all four versions were
combined into one file and the uncommon items across the versions were treated as missing data.
When using Rasch modeling to analyze change over time, Wright (2003) proposed two methods
of structuring the data; stacking and racking. The output of the stacked data set shows how the
students’ abilities have changed and the output of the racked data set shows how the item
difficulties have changed. In this paper, we apply the stacking and racking methods to the pretest
and posttest data in order to investigate the change in student understanding as a result of
participating in the unit and to determine the ideas on which the unit was having the greatest
effect.
Stacking. The stacked analysis was done by first preparing a data file that contained two rows of
data per student; one for the pretest responses and one for the posttest responses. This analysis
results in two ability measures per student: a pretest ability and a posttest ability. The difference
between these ability measures represents the change in the students’ understanding as a result of
participating in the unit. For the stacked analysis, we are looking for an increase in student
abilities from pretest to posttest, which would indicate the unit was effective in improving their
understanding of the targeted ideas.
Racking. Racking the data permitted us to investigate the effect of the unit on the items’
difficulty level. The racked data set includes one row per student and two columns per item; one
for the pretest responses and one for the posttest responses. The assumption here is that the
items change in difficulty from pretest to posttest but the students remain unchanged. Racking
the data provides two difficulty measures per item: a pretest difficulty and a posttest difficulty.
The difference in the difficulty measures indicates the degree to which the unit successfully
targeted the ideas tested by the items. In this case, we hoped that the items would be easier for
students to respond to after participating in the unit and, therefore, the difficulty measure for
each item would decrease from pretest to posttest.
Herrmann-Abell et al., NARST 2013
4/4/2013 7
Results and Discussion
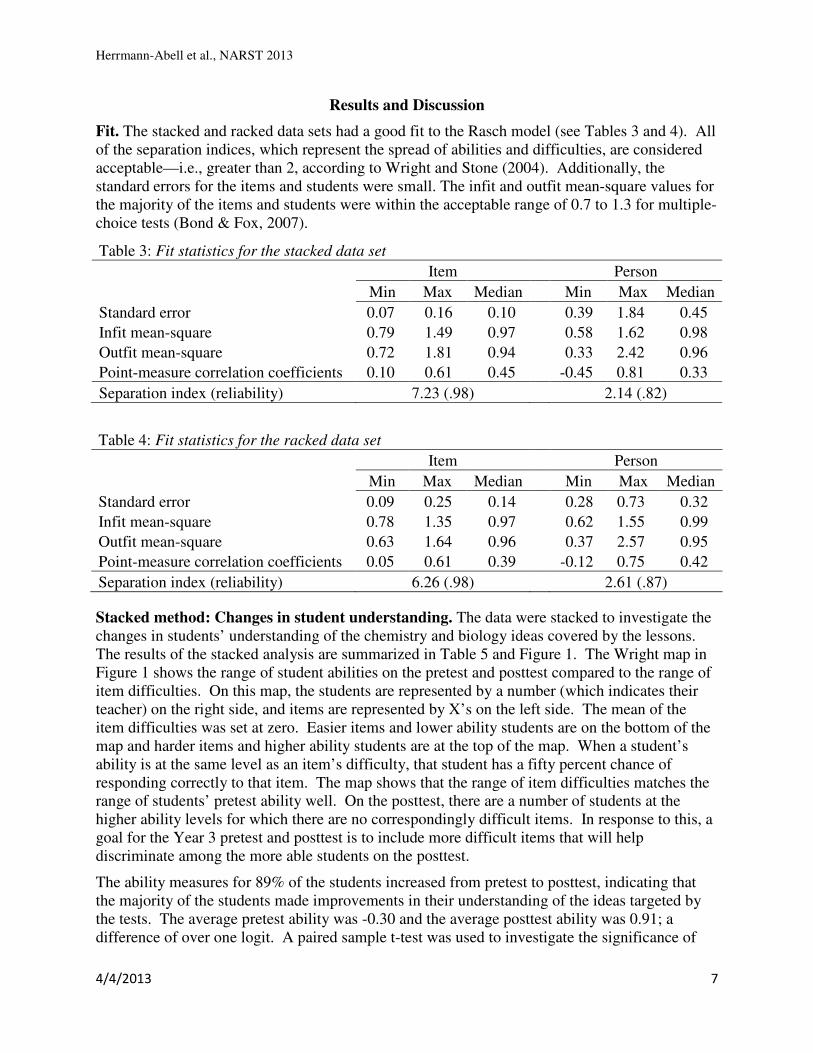
Fit. The stacked and racked data sets had a good fit to the Rasch model (see Tables 3 and 4). All
of the separation indices, which represent the spread of abilities and difficulties, are considered
acceptable—i.e., greater than 2, according to Wright and Stone (2004). Additionally, the
standard errors for the items and students were small. The infit and outfit mean-square values for
the majority of the items and students were within the acceptable range of 0.7 to 1.3 for multiple-
choice tests (Bond & Fox, 2007).
Table 3: Fit statistics for the stacked data set
Item Person
Min Max Median Min Max Median
Standard error 0.07 0.16 0.10 0.39 1.84 0.45
Infit mean-square 0.79 1.49 0.97 0.58 1.62 0.98
Outfit mean-square 0.72 1.81 0.94 0.33 2.42 0.96
Point-measure correlation coefficients 0.10 0.61 0.45 -0.45 0.81 0.33
Separation index (reliability) 7.23 (.98) 2.14 (.82)
Table 4: Fit statistics for the racked data set
Item Person
Min Max Median Min Max Median
Standard error 0.09 0.25 0.14 0.28 0.73 0.32
Infit mean-square 0.78 1.35 0.97 0.62 1.55 0.99
Outfit mean-square 0.63 1.64 0.96 0.37 2.57 0.95
Point-measure correlation coefficients 0.05 0.61 0.39 -0.12 0.75 0.42
Separation index (reliability) 6.26 (.98) 2.61 (.87)
Stacked method: Changes in student understanding. The data were stacked to investigate the
changes in students’ understanding of the chemistry and biology ideas covered by the lessons.
The results of the stacked analysis are summarized in Table 5 and Figure 1. The Wright map in
Figure 1 shows the range of student abilities on the pretest and posttest compared to the range of
item difficulties. On this map, the students are represented by a number (which indicates their
teacher) on the right side, and items are represented by X’s on the left side. The mean of the
item difficulties was set at zero. Easier items and lower ability students are on the bottom of the
map and harder items and higher ability students are at the top of the map. When a student’s
ability is at the same level as an item’s difficulty, that student has a fifty percent chance of
responding correctly to that item. The map shows that the range of item difficulties matches the
range of students’ pretest ability well. On the posttest, there are a number of students at the
higher ability levels for which there are no correspondingly difficult items. In response to this, a
goal for the Year 3 pretest and posttest is to include more difficult items that will help
discriminate among the more able students on the posttest.
The ability measures for 89% of the students increased from pretest to posttest, indicating that
the majority of the students made improvements in their understanding of the ideas targeted by
the tests. The average pretest ability was -0.30 and the average posttest ability was 0.91; a
difference of over one logit. A paired sample t-test was used to investigate the significance of
Herrmann-Abell et al., NARST 2013
4/4/2013 8
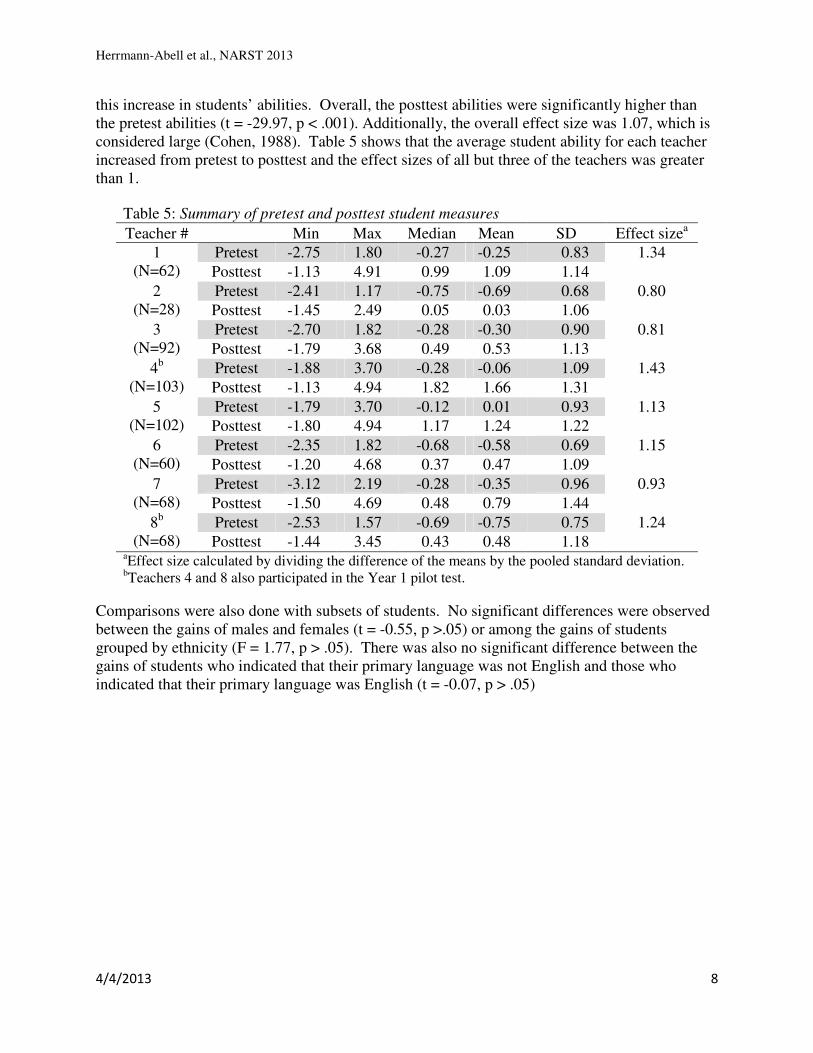
this increase in students’ abilities. Overall, the posttest abilities were significantly higher than
the pretest abilities (t = -29.97, p < .001). Additionally, the overall effect size was 1.07, which is
considered large (Cohen, 1988). Table 5 shows that the average student ability for each teacher
increased from pretest to posttest and the effect sizes of all but three of the teachers was greater
than 1.
Table 5: Summary of pretest and posttest student measures
Teacher # Min Max Median Mean SD Effect sizea
1
(N=62)
Pretest -2.75 1.80 -0.27 -0.25 0.83 1.34
Posttest -1.13 4.91 0.99 1.09 1.14
2
(N=28)
Pretest -2.41 1.17 -0.75 -0.69 0.68 0.80
Posttest -1.45 2.49 0.05 0.03 1.06
3
(N=92)
Pretest -2.70 1.82 -0.28 -0.30 0.90 0.81
Posttest -1.79 3.68 0.49 0.53 1.13
4b
(N=103)
Pretest -1.88 3.70 -0.28 -0.06 1.09 1.43
Posttest -1.13 4.94 1.82 1.66 1.31
5
(N=102)
Pretest -1.79 3.70 -0.12 0.01 0.93 1.13
Posttest -1.80 4.94 1.17 1.24 1.22
6
(N=60)
Pretest -2.35 1.82 -0.68 -0.58 0.69 1.15
Posttest -1.20 4.68 0.37 0.47 1.09
7
(N=68)
Pretest -3.12 2.19 -0.28 -0.35 0.96 0.93
Posttest -1.50 4.69 0.48 0.79 1.44
8b
(N=68)
Pretest -2.53 1.57 -0.69 -0.75 0.75 1.24
Posttest -1.44 3.45 0.43 0.48 1.18 aEffect size calculated by dividing the difference of the means by the pooled standard deviation.
bTeachers 4 and 8 also participated in the Year 1 pilot test.
Comparisons were also done with subsets of students. No significant differences were observed
between the gains of males and females (t = -0.55, p >.05) or among the gains of students
grouped by ethnicity (F = 1.77, p > .05). There was also no significant difference between the
gains of students who indicated that their primary language was not English and those who
indicated that their primary language was English (t = -0.07, p > .05)
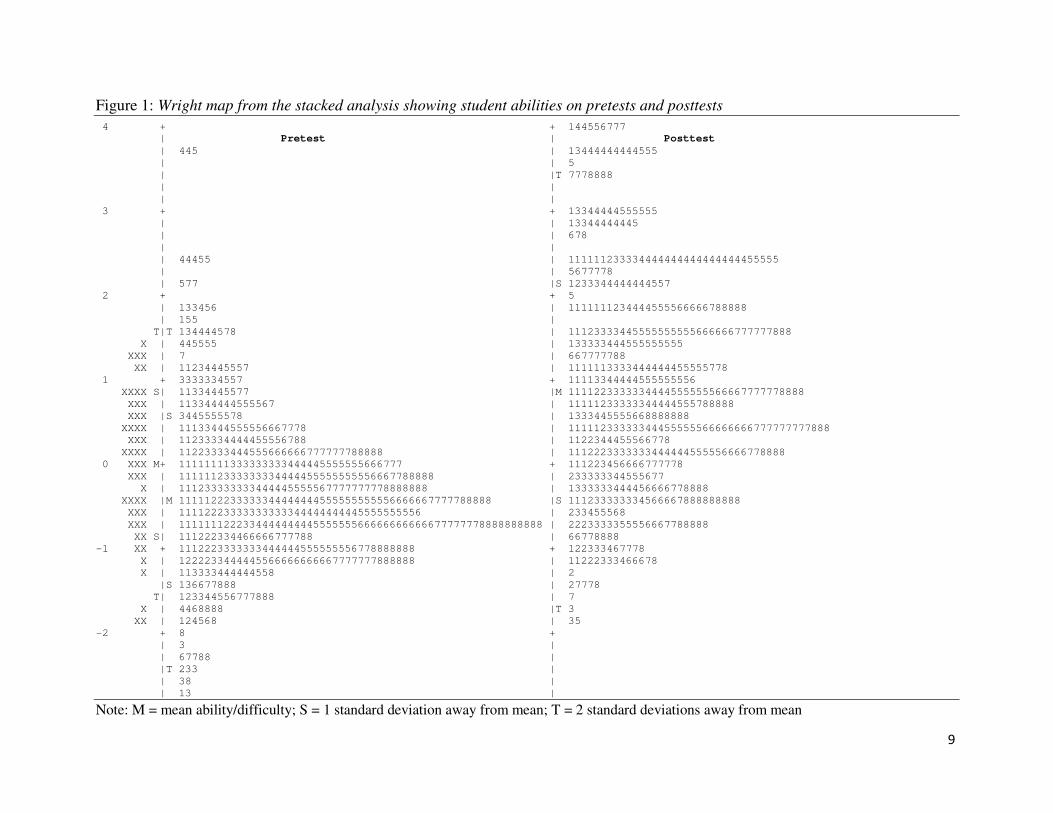
9
Figure 1: Wright map from the stacked analysis showing student abilities on pretests and posttests
4 + + 144556777
| Pretest | Posttest
| 445 | 13444444444555
| | 5
| |T 7778888
| |
| |
3 + + 13344444555555
| | 13344444445
| | 678
| |
| 44455 | 111111233334444444444444444455555
| | 5677778
| 577 |S 1233344444444557
2 + + 5
| 133456 | 1111111234444555566666788888
| 155 |
T|T 134444578 | 11123333445555555555666666777777888
X | 445555 | 133333444555555555
XXX | 7 | 667777788
XX | 11234445557 | 1111113333444444455555778
1 + 3333334557 + 11113344444555555556
XXXX S| 11334445577 |M 1111223333334444555555566667777778888
XXX | 113344444555567 | 11111233333344444555788888
XXX |S 3445555578 | 1333445555668888888
XXXX | 11133444555556667778 | 11111233333344455555566666666777777777888
XXX | 11233334444455556788 | 1122344455566778
XXXX | 11223333444555666666777777788888 | 1112223333333444444555556666778888
0 XXX M+ 11111111333333333444445555555666777 + 111223456666777778
XXX | 1111112333333334444455555555556667788888 | 233333344555677
X | 111233333333444445555567777777778888888 | 1333333444456666778888
XXXX |M 1111122233333344444444555555555556666667777788888 |S 111233333334566667888888888
XXX | 11112223333333333344444444445555555556 | 233455568
XXX | 111111122233444444444555555566666666666677777778888888888 | 2223333355556667788888
XX S| 111222334466666777788 | 66778888
-1 XX + 1112223333333444444555555556778888888 + 122333467778
X | 1222233444445566666666667777777888888 | 11222333466678
X | 113333444444558 | 2
|S 136677888 | 27778
T| 123344556777888 | 7
X | 4468888 |T 3
XX | 124568 | 35
-2 + 8 +
| 3 |
| 67788 |
|T 233 |
| 38 |
| 13 |
Note: M = mean ability/difficulty; S = 1 standard deviation away from mean; T = 2 standard deviations away from mean
Herrmann-Abell et al., NARST 2013
4/4/2013 10
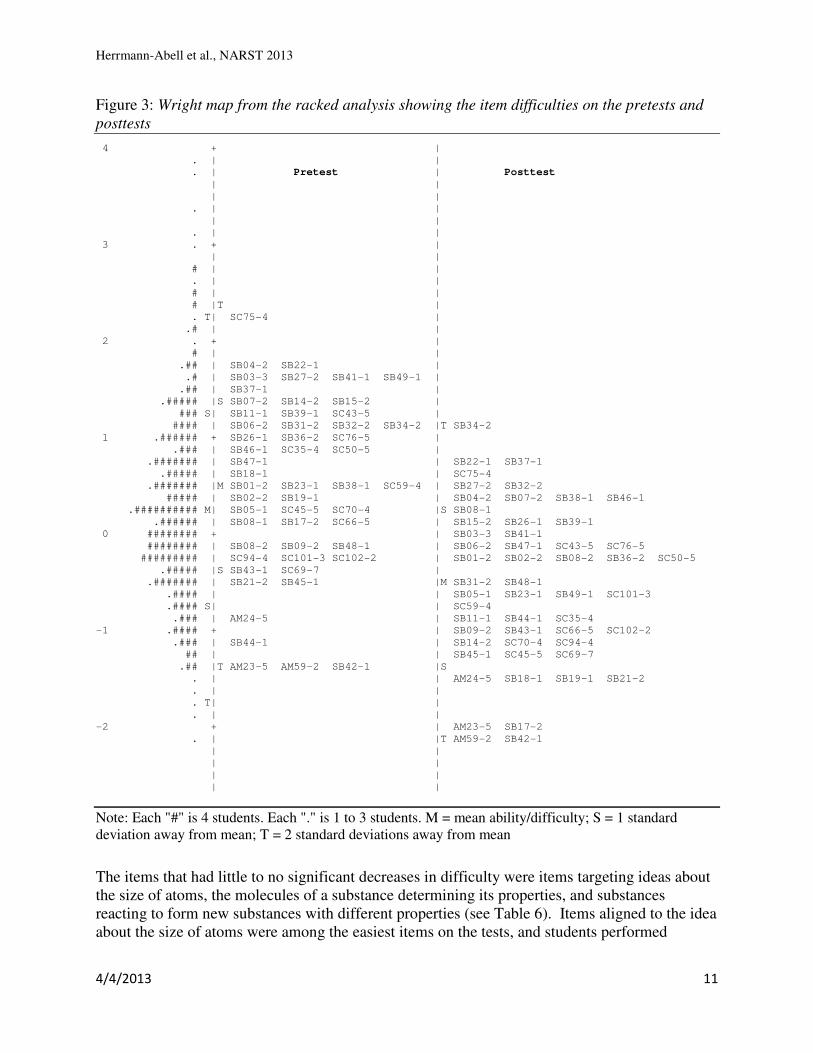
Racked method: Changes in item difficulties. The data were racked to investigate the changes
in item difficulties as a result of the intervention. Table 6 and Figure 2 present the results of the
racked analysis. The Wright map in Figure 2 shows the students on the left side of the map and
the item difficulties for the pretest and posttest on the right side of the map. Each item is
represented by its item code (e.g. SC75-4). The map shows that, as anticipated, the difficulties
of the items decreased from pretest to posttest. This suggests that overall the knowledge targeted
by the items was learned by the students who participated in the unit.
The difficulties of 49 items decreased from pretest to posttest, the difficulty of two items
remained the same, and the difficulties of two items increased. The average pretest difficulty was
0.52 and the average posttest ability was -0.52. According to a paired sample t-test, the decrease
in the mean item difficulty is significant (t = 12.64, p < .001). Table 6 shows the change in item
difficulties broken down by key idea. The items with the largest decrease in difficulty were
those targeting ideas about animal growth, atom rearrangement, and atom conservation. This is
encouraging because these ideas were some of the core ideas of the unit and many of the lessons
included activities and questions that focused on these ideas.
Table 6: Summary of item difficulties by idea
Idea Min Max Median Mean t Sig.
Matter is made up of atoms Pretest -1.39 -0.92 -1.34 -1.25 15.22 <.001
(N=4) Posttest -2.16 -1.50 -2.09 -1.96
Atoms are extremely small Pretest -1.12 -0.37 -0.75 -0.75 0.47 n.s.
(N=2) Posttest -0.95 -0.91 -0.93 -0.93
Molecules determine properties Pretest 0.81 0.87 0.84 0.84 3.26 n.s.
(N=2) Posttest -0.17 0.35 0.09 0.09
Substances react to form new
substances (N=5)
Pretest -0.55 0.08 -0.24 -0.23 2.04 n.s.
Posttest -1.30 0.24 -0.59 -0.63
Atoms rearrange during chemical
reactions (N=7)
Pretest 0.11 1.74 0.93 0.95 18.74 <.001
Posttest -1.11 0.42 -0.27 -0.42
Mass is conserved Pretest -0.26 2.20 0.74 0.86 7.88 <.01
(N=4) Posttest -1.09 0.63 -0.45 -0.34
Atoms are conserved Pretest -0.31 1.65 0.42 0.65 9.78 <.001
(N=8) Posttest -1.21 0.53 -0.28 -0.33
Animal growth Pretest -0.52 1.66 0.57 0.66 8.91 <.001
(N=9) Posttest -2.05 0.11 -1.15 -1.13
Photosynthesis & plant growth Pretest -0.12 1.67 1.10 0.97 4.99 <.01
(N=11) Posttest -0.60 1.17 0.10 0.11
Animal & plant growth &
conservation (N=1)
Pretest 1.72
Posttest 0.74
Herrmann-Abell et al., NARST 2013
4/4/2013 11
Figure 3: Wright map from the racked analysis showing the item difficulties on the pretests and
posttests
4 + |
. | |
. | Pretest | Posttest
| |
| |
. | |
| |
. | |
3 . + |
| |
# | |
. | |
# | |
# |T |
. T| SC75-4 |
.# | |
2 . + |
# | |
.## | SB04-2 SB22-1 |
.# | SB03-3 SB27-2 SB41-1 SB49-1 |
.## | SB37-1 |
.##### |S SB07-2 SB14-2 SB15-2 |
### S| SB11-1 SB39-1 SC43-5 |
#### | SB06-2 SB31-2 SB32-2 SB34-2 |T SB34-2
1 .###### + SB26-1 SB36-2 SC76-5 |
.### | SB46-1 SC35-4 SC50-5 |
.####### | SB47-1 | SB22-1 SB37-1
.##### | SB18-1 | SC75-4
.####### |M SB01-2 SB23-1 SB38-1 SC59-4 | SB27-2 SB32-2
##### | SB02-2 SB19-1 | SB04-2 SB07-2 SB38-1 SB46-1
.########## M| SB05-1 SC45-5 SC70-4 |S SB08-1
.###### | SB08-1 SB17-2 SC66-5 | SB15-2 SB26-1 SB39-1
0 ######## + | SB03-3 SB41-1
######## | SB08-2 SB09-2 SB48-1 | SB06-2 SB47-1 SC43-5 SC76-5
######### | SC94-4 SC101-3 SC102-2 | SB01-2 SB02-2 SB08-2 SB36-2 SC50-5
.##### |S SB43-1 SC69-7 |
.####### | SB21-2 SB45-1 |M SB31-2 SB48-1
.#### | | SB05-1 SB23-1 SB49-1 SC101-3
.#### S| | SC59-4
.### | AM24-5 | SB11-1 SB44-1 SC35-4
-1 .#### + | SB09-2 SB43-1 SC66-5 SC102-2
.### | SB44-1 | SB14-2 SC70-4 SC94-4
## | | SB45-1 SC45-5 SC69-7
.## |T AM23-5 AM59-2 SB42-1 |S
. | | AM24-5 SB18-1 SB19-1 SB21-2
. | |
. T| |
. | |
-2 + | AM23-5 SB17-2
. | |T AM59-2 SB42-1
| |
| |
| |
| |
Note: Each "#" is 4 students. Each "." is 1 to 3 students. M = mean ability/difficulty; S = 1 standard
deviation away from mean; T = 2 standard deviations away from mean
The items that had little to no significant decreases in difficulty were items targeting ideas about
the size of atoms, the molecules of a substance determining its properties, and substances
reacting to form new substances with different properties (see Table 6). Items aligned to the idea
about the size of atoms were among the easiest items on the tests, and students performed
Herrmann-Abell et al., NARST 2013
4/4/2013 12
relatively well on them even though the idea was only briefly mentioned in a reading in the unit
and was not the focus of an activity. As a result, we decided that the unit did not need to address
this idea directly nor would we need to assess this idea during the Year 3 study. Using
characteristic properties to determine when chemical reactions occur was an idea focused on in
an early lesson, but the unit quickly switches over to atomic level ideas for the remainder of the
lessons. The link between molecular structure and characteristic properties was touched on in
one of the early lesson but not explicitly revisited in later lessons. Because these ideas about
characteristic properties are important for understanding chemical reactions and biological
growth, the unit is being revised to address these ideas more specifically as described later in this
paper and elsewhere (Roseman, et al., 2013; Kruse et al., 2013).
Distractor analysis. Because common student misconceptions were incorporated in the many of
the item distractors, we can compare students’ answer choice selections on the pretest and
posttest to gain insight into the effects the curriculum unit had on their misconceptions. The
activities in the unit were designed to provide students with evidence that contradicted these
misconceptions and supported the correct science ideas.
Transmutation of atoms. One of the most common misconceptions about chemical reactions is
that the atoms that make up the reactants change into different types of atoms during the reaction
(Andersson, 1986). We probed for this misconception with six items. Overall, distractors
aligned to this misconception were selected 33% of the time on the pretest.
The students had experiences with a variety of chemical reactions in both non-living and living
systems throughout the Year 2 unit. For most of these reactions, students built models of the
reactant molecules and rearranged the “atoms” to form models of the product molecules. They
observed that the product molecules are always made from the same types of atoms that the
reactant molecules are made up of. No atoms change into other types of atoms during any of the
reactions.
Results on the items targeting the transmutation misconception suggest that these activities were
helpful in convincing students that atoms are not changed into other atoms. On the posttest,
distractors involving these misconceptions were chosen only 14% of the time (χ2 = 231.5,
p < .001).
Identifying chemical reactions based on irreversibility. There were four items on the pretests
and posttests that each described four different changes (a physical change, a change of state,
dissolving, and a chemical reaction) and asked the students to identify the chemical reaction.
Students were then asked to explain why they thought the change was a chemical reaction. On
the pretest, over half of the students were able to correctly identify which change was a chemical
reaction. However, their explanations revealed that they were not using the criteria that a new
substance with different properties formed or that atoms were rearranged to form new molecules
to judge whether or not a chemical reaction occurred. Of the students who correctly identified
the chemical reaction, 24% explained that the change was irreversible so it must be a chemical
reaction (see Table 7 for examples of students’ explanations). Students are sometimes taught in
their science classes to classify reversible changes as physical changes and irreversible changes
as chemical changes (Johnson, 2000). Only 24% of the students who selected the correct answer
provided an explanation that included the idea that a new substance was formed or mentioned
that the products had different properties than the reactants.
Herrmann-Abell et al., NARST 2013
4/4/2013 13
Table 7: Explanations from students who correctly identified a chemical reaction but
provided an explanation based on the misconception that chemical reactions are irreversible
changes
• “The answer is C because when a marshmallow is turned black after being heated over a
fire, you can’t get it back to its original state of being white and a chemical reaction is
when something is changed and cannot go back to its original shape, size, or color, etc.”
• “This answer is correct because a chemical change is a change that cannot be changed
back and making amino acids turn back into protein sounds like it can’t be reversed.”
One of the goals of the Toward High School Biology unit was to teach students that chemical
reactions are changes during which new substances with different properties are formed. The
unit also provided students opportunities to use models to observe that atoms are rearranged
during chemical reactions to form new molecules. If new substances or new molecules are not
formed, students should have concluded that a chemical reaction did not occur. While the unit
did not explicitly address the existence of reversible chemical reactions, it did encourage students
to look for new properties and new molecules as evidence that a reaction occurred. Our hope
was that after participating in the unit, fewer students would rely on scientifically inaccurate
criteria like reversibility when identifying chemical reactions.
On the posttest, there was no significant change in the percentage of students selecting the
correct answer to the items asking them to identify the chemical reaction, but the reasons
students gave for their answer choice selection did change. The percentage of students relying
on the irreversibility criterion decreased significantly from 24% to 15% (χ2 = 8.33, p < .01), and
the percentage of students using the new substances with different properties criterion increased
significantly from 24% to 49% (χ2 = 42.79, p < .001). Furthermore, 15% of the students
mentioned that the atoms that make up the reactants must have rearranged. On the pretest, only
one student mentioned that atoms rearrange during chemical reactions. Table 8 presents example
explanations from students who used the irreversibility criterion on the pretest and who used
more scientifically accurate criteria on the posttest. It is interesting to note that some students’
posttest explanations showed that they have a better understanding of chemical reactions but
have not let go of the irreversibility criterion (see the last row of Table 8 for an example).
Because the unit does not include experiences with reversible reactions, this is not surprising. We
have chosen not to incorporate reversible chemical reactions into the Toward High School
Biology unit because it is considered a high school idea (College Board, 2009; NRC, 2012) and it
does not contribute to the growth and repair of living organisms storyline.
Herrmann-Abell et al., NARST 2013
4/4/2013 14
Table 8: Explanations from students who provided an explanation based on a misconception
during the pretest and an explanation based on new substances forming/atoms rearranging
during the posttest
Pretest Explanation Posttest Explanation
“Answer choice C is a chemical
reaction because it is an example
of a reaction that cannot be seen
and that is irreversible.”
“This answer is correct because when we eat food, a
chemical reaction occurs with its proteins to form amino
acids. The original atoms in the proteins are rearranged and
a new substance is formed.”
“Choice C is the correct answer
choice because the proteins are
being broken down by amino
acids, and this change can never
be reversed. In other words, it’s
a chemical change.”
“Answer choice C is the correct answer because the proteins
are changed into a new substance. In chemical reactions, the
reactants are changed or turned into products. For example,
in this reaction, the proteins (reactants) are being broken
down by amino acids and becoming a part of the body
(products).”
“My answer is correct because
once the marshmallow turns
black, it will not turn white once
it is cooled again.”
“The atoms and molecules in the marshmallow are
rearranged to create the black substance, and when the atoms
are rearranged it is considered a chemical reaction.”
“A chemical reaction is non-
reversible once complete and is
not a change of physical state of
matter. A marshmallow turning
black when heated over a fire is a
chemical reaction that cannot be
reversed.”
“When the marshmallow turns black when it is being heated
by the fire a chemical reaction is occurring. This is because
atoms are being rearranged to form different molecules than
they originally were. A sign that a chemical reaction has
occurred is that the products have different properties than
the reactants. Another sign that a chemical reaction has
occurred is that it cannot be reversed.”
Conservation is violated during growth. It is well known that students have difficulty predicting
that mass will be conserved especially for systems where there appears to be an increase or
decrease of “stuff” (Mitchell & Gunstone, 1984). One item probed this misconception in the
context of mold growing on bread sealed in a plastic bag. On the pretest, 69% of the students
thought the weight of the bag and its contents would increase after the mold grew, and only 16%
knew that the weight would stay the same. This was the most difficult item on the pretest (item
difficulty = 2.20).
During the Year 2 unit, students observed several chemical reactions taking place in sealed
containers. The students compared the initial and final masses to see that the mass stayed the
same, even though it may have appeared that the amount of matter increased or decreased. Then
students opened the containers and compared the mass of the open container to the mass of the
closed container. They observed an increase in mass when a gas entered the container and a
decrease in mass when a gas left the container. In subsequent lessons, students modeled these
chemical reactions with LEGOs and compared the mass of the reactant models to the mass of the
product models to see that if the number of atoms does not change, the mass does not change.
After participating in the unit, fewer students thought the weight of the sealed bag and its
contents would increase after the mold grew (49%; χ2 = 22.82, p < .001) and significantly more
students knew the weight would stay the same (42%; χ2 = 45.71, p < .001). This increase in
understanding was evident in many of the students’ written comments (see Table 9 for examples
of students’ explanations). Furthermore, some students on the posttest volunteered atomic level
Herrmann-Abell et al., NARST 2013
4/4/2013 15
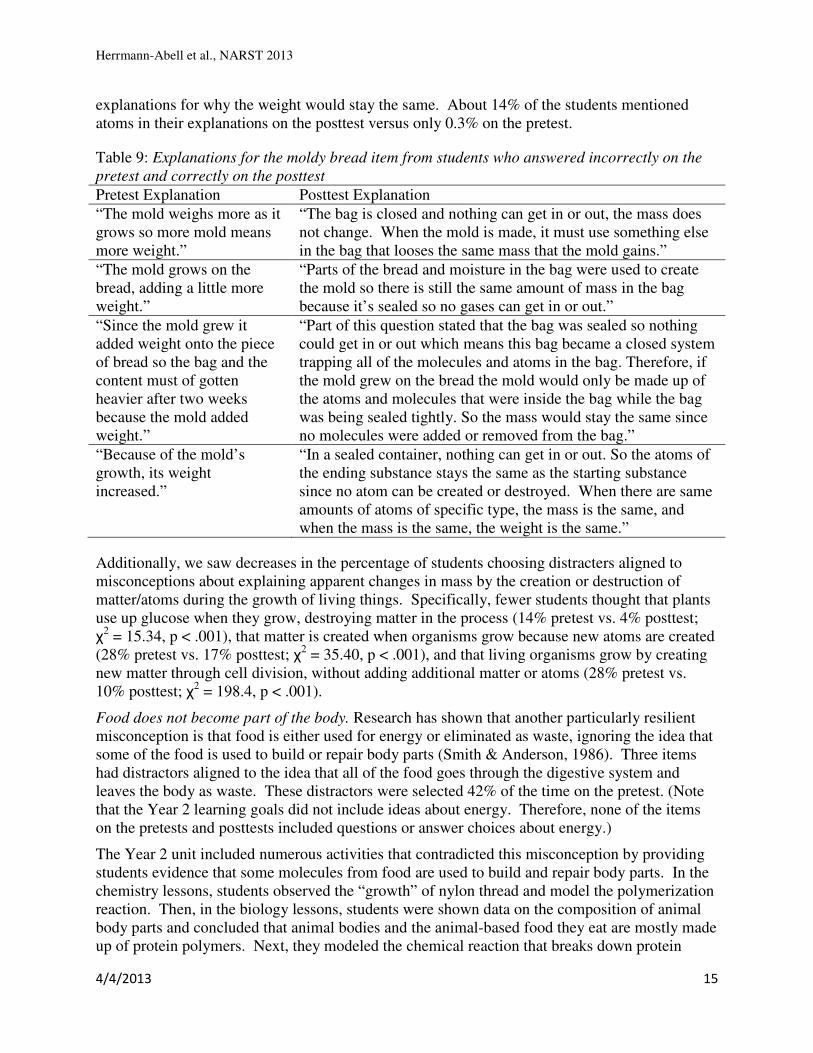
explanations for why the weight would stay the same. About 14% of the students mentioned
atoms in their explanations on the posttest versus only 0.3% on the pretest.
Table 9: Explanations for the moldy bread item from students who answered incorrectly on the
pretest and correctly on the posttest
Pretest Explanation Posttest Explanation
“The mold weighs more as it
grows so more mold means
more weight.”
“The bag is closed and nothing can get in or out, the mass does
not change. When the mold is made, it must use something else
in the bag that looses the same mass that the mold gains.”
“The mold grows on the
bread, adding a little more
weight.”
“Parts of the bread and moisture in the bag were used to create
the mold so there is still the same amount of mass in the bag
because it’s sealed so no gases can get in or out.”
“Since the mold grew it
added weight onto the piece
of bread so the bag and the
content must of gotten
heavier after two weeks
because the mold added
weight.”
“Part of this question stated that the bag was sealed so nothing
could get in or out which means this bag became a closed system
trapping all of the molecules and atoms in the bag. Therefore, if
the mold grew on the bread the mold would only be made up of
the atoms and molecules that were inside the bag while the bag
was being sealed tightly. So the mass would stay the same since
no molecules were added or removed from the bag.”
“Because of the mold’s
growth, its weight
increased.”
“In a sealed container, nothing can get in or out. So the atoms of
the ending substance stays the same as the starting substance
since no atom can be created or destroyed. When there are same
amounts of atoms of specific type, the mass is the same, and
when the mass is the same, the weight is the same.”
Additionally, we saw decreases in the percentage of students choosing distracters aligned to
misconceptions about explaining apparent changes in mass by the creation or destruction of
matter/atoms during the growth of living things. Specifically, fewer students thought that plants
use up glucose when they grow, destroying matter in the process (14% pretest vs. 4% posttest;
χ2 = 15.34, p < .001), that matter is created when organisms grow because new atoms are created
(28% pretest vs. 17% posttest; χ2 = 35.40, p < .001), and that living organisms grow by creating
new matter through cell division, without adding additional matter or atoms (28% pretest vs.
10% posttest; χ2 = 198.4, p < .001).
Food does not become part of the body. Research has shown that another particularly resilient
misconception is that food is either used for energy or eliminated as waste, ignoring the idea that
some of the food is used to build or repair body parts (Smith & Anderson, 1986). Three items
had distractors aligned to the idea that all of the food goes through the digestive system and
leaves the body as waste. These distractors were selected 42% of the time on the pretest. (Note
that the Year 2 learning goals did not include ideas about energy. Therefore, none of the items
on the pretests and posttests included questions or answer choices about energy.)
The Year 2 unit included numerous activities that contradicted this misconception by providing
students evidence that some molecules from food are used to build and repair body parts. In the
chemistry lessons, students observed the “growth” of nylon thread and model the polymerization
reaction. Then, in the biology lessons, students were shown data on the composition of animal
body parts and concluded that animal bodies and the animal-based food they eat are mostly made
up of protein polymers. Next, they modeled the chemical reaction that breaks down protein
Herrmann-Abell et al., NARST 2013
4/4/2013 16
polymers from food that animals eat into amino acids. After that, they studied data from
radiolabeled experiments, which showed that carbon atoms from amino acids became part of
animals’ bodies, and they modeled the formation of protein polymers from amino acids with
ball-and-stick models.
After participating in the unit, the percentage of students choosing distractors based on the
misconception that all of the food that an animal eats becomes waste dropped from 42% to 13%
(χ2 = 158.5, p < .001), while the percentage of students selecting the correct answer increased
from 50% to 82% (χ2 = 174.1, p < .001). The students’ written explanations to items including
this misconception as a distractor showed an improvement in their understanding of the chemical
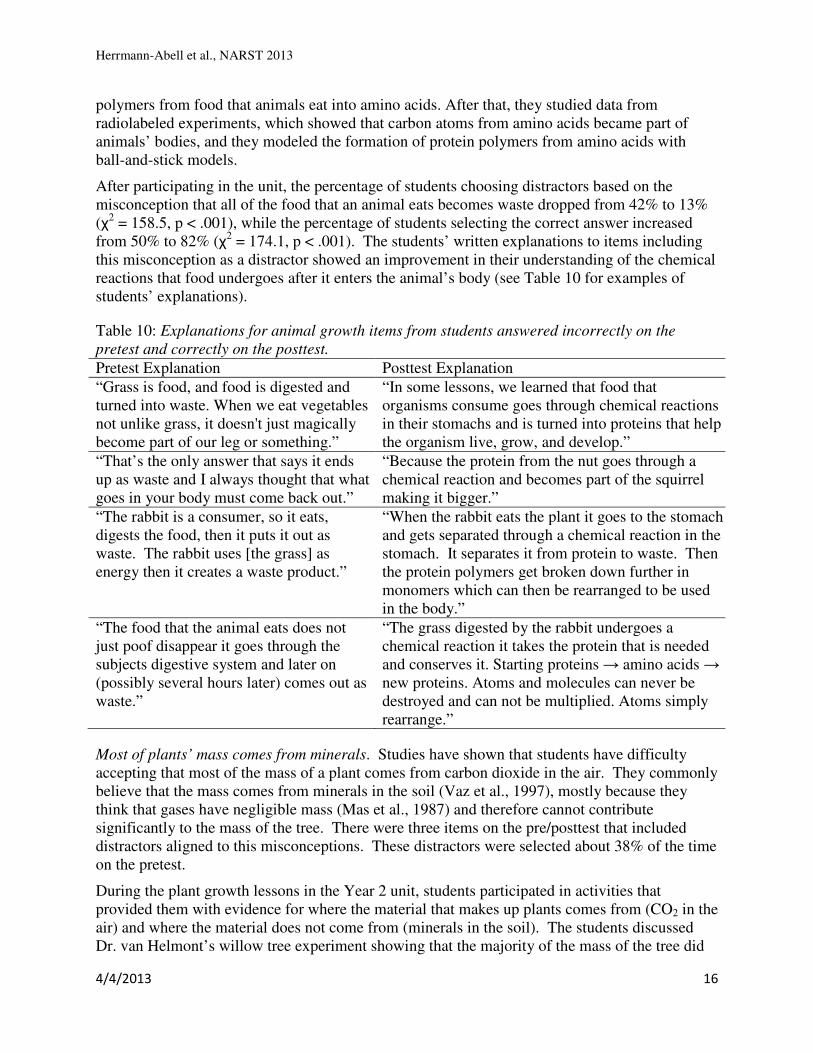
reactions that food undergoes after it enters the animal’s body (see Table 10 for examples of
students’ explanations).
Table 10: Explanations for animal growth items from students answered incorrectly on the
pretest and correctly on the posttest.
Pretest Explanation Posttest Explanation
“Grass is food, and food is digested and
turned into waste. When we eat vegetables
not unlike grass, it doesn't just magically
become part of our leg or something.”
“In some lessons, we learned that food that
organisms consume goes through chemical reactions
in their stomachs and is turned into proteins that help
the organism live, grow, and develop.”
“That’s the only answer that says it ends
up as waste and I always thought that what
goes in your body must come back out.”
“Because the protein from the nut goes through a
chemical reaction and becomes part of the squirrel
making it bigger.”
“The rabbit is a consumer, so it eats,
digests the food, then it puts it out as
waste. The rabbit uses [the grass] as
energy then it creates a waste product.”
“When the rabbit eats the plant it goes to the stomach
and gets separated through a chemical reaction in the
stomach. It separates it from protein to waste. Then
the protein polymers get broken down further in
monomers which can then be rearranged to be used
in the body.”
“The food that the animal eats does not
just poof disappear it goes through the
subjects digestive system and later on
(possibly several hours later) comes out as
waste.”
“The grass digested by the rabbit undergoes a
chemical reaction it takes the protein that is needed
and conserves it. Starting proteins → amino acids →
new proteins. Atoms and molecules can never be
destroyed and can not be multiplied. Atoms simply
rearrange.”
Most of plants’ mass comes from minerals. Studies have shown that students have difficulty
accepting that most of the mass of a plant comes from carbon dioxide in the air. They commonly
believe that the mass comes from minerals in the soil (Vaz et al., 1997), mostly because they
think that gases have negligible mass (Mas et al., 1987) and therefore cannot contribute
significantly to the mass of the tree. There were three items on the pre/posttest that included
distractors aligned to this misconceptions. These distractors were selected about 38% of the time
on the pretest.
During the plant growth lessons in the Year 2 unit, students participated in activities that
provided them with evidence for where the material that makes up plants comes from (CO2 in the
air) and where the material does not come from (minerals in the soil). The students discussed
Dr. van Helmont’s willow tree experiment showing that the majority of the mass of the tree did
Herrmann-Abell et al., NARST 2013
4/4/2013 17
not come from the soil. They were shown data from radiolabeling experiments that proved that
the carbon atoms of glucose molecules in plants come from carbon dioxide molecules in the air.
Additionally, students modeled the photosynthesis reaction that produces glucose and the
polymerization reaction that builds cellulose from glucose using ball-and-stick models.
On the posttest, the distractors relating plant growth to minerals in the soil were selected less
often. The frequency of selection dropped significantly from 38% to 25% (χ2 = 39.17, p < .001).
Correct answer choices corresponding to the idea that most of the mass comes from the carbon
dioxide in the air were selected 53% of the time on the posttest compared to 25% on the pretest
(χ2 = 30.43, p < .001). As mentioned earlier, not all of the teachers were able to complete the
plant growth lessons due to time constraints. The teachers who did cover these lessons indicated
that they had to rush through them and had to skip some parts. Therefore, the results of plant
growth items, like the ones discussed here, are encouraging and suggest that the key activities
included in the unit were powerful.
Revisions of the unit. The results of the student pre and posttest uncovered several areas for
improvement. This section outlines some of the changes that have been made to the unit in
preparation for the Year 3 study.
Characteristic properties. The Year 2 unit began with a lesson during which the students decide
whether a chemical reaction occurs based on information about the characteristic properties of
the starting and ending substances. The lesson assumed that students would have an
understanding of what characteristic properties are. Even though some students’ written
explanations showed an improvement in their ability to recognize chemical reactions by
comparing the properties of the starting and ending substances (See Table 8), students’ did not
perform better overall on items aligned to this idea during the posttest (see Table 6). We felt that
that the beginning chemistry lessons could be revised to better target this idea. Now, instead of
starting with the observation of substances reacting with one another, the unit begins with
students measuring and observing characteristic properties of individual substances. The
students use these properties to identify unknown substances and then compare the properties of
different substances to see that each substance has a unique set of properties. The hope is that
the new activities will lay a stronger base so that students will make greater gains in
understanding substance-level chemical reaction and biological growth ideas.
Linking molecular structure and characteristic properties. Two items on the pre/posttests
probed students’ understanding that different substances have different properties because they
are made up of different arrangements of atoms in molecules. The students’ performance on
these items suggested that the unit was unsuccessful in improving students understanding of this
idea (See Table 6). We felt that this idea was important to the overarching goal of the unit
because it helps students appreciate why the products of any chemical reaction have different
characteristic properties than the reactants. As a result, we revised the lesson that introduces
atoms and molecules to make the link between characteristic properties and molecular structure
clearer. Students are provided with information cards that indicate the characteristic properties
of the substances and include models of the molecules of the substances. Students then observe
that each substance has a unique set of characteristic properties that corresponds to a unique
molecular structure and conclude that the products have different properties than the reactants
because they are made up of different molecules. Additionally, this idea is now reinforced by
activities in the animal growth and plant growth chapters during which students compare the
Herrmann-Abell et al., NARST 2013
4/4/2013 18
properties and molecular structures of different proteins and carbohydrates that are used to build
biomaterials.
The practice of constructing scientific explanations. Results from the pre/posttests showed that
students included more correct science ideas in their written explanations after participating in
the unit (See Tables 8, 9, and 10). However there was little improvement in the students’ ability
to construct scientific explanations. Few students included all parts of a scientific explanation;
that is they did not include a claim, evidence, and reasoning (McNeill & Krajcik, 2012). The
Year 2 unit included four lessons dedicated to instructing students on how to construct and
evaluate scientific explanations, but these lessons were among the activities omitted due to time
constraints. For the Year 3 revision, we made the decision to eliminate some of the learning
goals that were not as central to the overarching goal of understanding growth and repair of
living things (for example, building proteins in plants and building carbohydrate in animals) so
that the explanation activities could be retained. Additionally, instead of having only four formal
explanation activities, the Year 3 version of the unit includes additional opportunities to practice
constructing scientific explanations in 11 of the 20 lessons.
Conclusions
This paper reports on the Year 2 field test of a new curriculum unit that targets foundational
chemistry and biochemistry ideas. Designed to emphasize the underlying molecular explanations
for observable biological events in the real world, the unit aims to improve on currently available
materials by engaging students with phenomena that occur in non-living and living systems and
scaffolding students’ sense making. This scaffolding includes questions and modeling tasks that
help students connect activities to a coherent set of science ideas, confront differences between
their own ideas and science ideas, and relate the science ideas targeted in each lesson to other
science ideas and experiences.
Rasch modeling was used to investigate the change in student understanding from pretest to
posttest and the impact of the unit on the difficulty of the items. The stacked data set showed
that, overall, the students’ understanding of the targeted ideas improved significantly. The
racked data set showed that most of the items got significantly easier from pretest to posttest. An
analysis of the students’ answer choice selections and written explanations also revealed an
increase in student understanding of the science ideas and a decrease in the number of students
holding misconceptions.
Next steps. We are now in the process of conducting a third iteration of the development
process to ensure that any concerns raised during the Year 2 field test have been addressed. In
the spring of 2013, we are planning a small cluster randomized trial with six teachers. Our hope
is that this small, low-power study will indicate that the unit has promise when compared to
“business as usual.” Based on the results of this study, we are considering a larger study to
examine the efficacy of the unit.
Herrmann-Abell et al., NARST 2013
4/4/2013 19
Acknowledgements
The authors would like to acknowledge the members of the BSCS project team: Janet Carlson,
Brooke Bourdelat-Parks, Elaine Howes, Rebecca Kruse, Kathy Roth, Aleigh Raffelson, Kerry
Skaradznski, Rhiannon Baxter, Stacey Luce, and Chris Moraine. The authors would like to
thank the follow staff members of AAAS Project 2061 for their contributions to the Toward
High School Biology project: Mary Koppal, Brian Sweeney, Abigail Burrows, and Caitlin Klein.
The research reported here was supported by the Institute of Education Sciences, U.S.
Department of Education, through Grant R305A100714 to the American Association for the
Advancement of Science. The opinions expressed are those of the authors and do not represent
views of the Institute or the U.S. Department of Education.
References
AAAS Project 2061 (n.d.) AAAS Science assessment website. Retrieved from
http://assessment.aaas.org on March 19, 2013.
American Association for the Advancement of Science. (1993). Benchmarks for science literacy.
NY: Oxford University Press.
Anderson, C. W., Sheldon, T., & Dubay, J. (1990). The effects of instruction on college
nonmajors’ conceptions of respiration and photosynthesis. Journal of Research in Science
Teaching, 27(8), 761–776.
Andersson, B. R. (1986). Pupils’ explanations of some aspects of chemical reactions. Science
Education, 70(5), 549-563.
Bond, T. G., & Fox, C. M. (2007). Applying the Rasch model: Fundamental measurement in the
human sciences (Second ed.). Mahwah, NJ: Lawrence Erlbaum Associates.
Calik, M. & Ayas, A. (2005). A comparison of level of understanding of eighth-grade students
and science student teachers related to selected chemistry concepts. Journal of Research in
Science Teaching, 42(6), 638–667.
Cavallo, A. M. L., McNeely, J. C., and Marek, E. A. (2003). Eliciting students’ understandings
of chemical reactions using two forms of essay questions during a learning cycle.
International Journal of Science Education, 25(5), 583-603.
Cohen, J. (1988). Statistical power analysis for the behavioral sciences (2nd
ed.). Hillsdale, NJ:
Erlbaum.
College Board. (2009) College Board standards for college success: Science. New York, NY:
Author.
DeBoer, G. E., Herrmann-Abell, C. F., & Gogos, A. (2007, April). Assessment linked to science
learning goals: Probing student thinking during item development. Paper presented at the
National Association of Research in Science Teaching Annual Conference, New Orleans,
LA.
DeBoer, G. E., Herrmann-Abell, C. F., Gogos, A., Michiels, A., Regan, T., & Wilson, P. (2008).
Assessment linked to science learning goals: Probing student thinking through assessment. In
J. Coffey, R. Douglas, & C. Stearns (Eds.), Assessing student learning: Perspectives from
research and practice (pp. 231-252). Arlington, VA: NSTA Press.
DeBoer, G. E., Herrmann-Abell, C. F., Wertheim, J., & Roseman, J. E. (2009, April). Assessment
linked to middle school science learning goals: A report on field test results for four middle
Herrmann-Abell et al., NARST 2013
4/4/2013 20
school science topics. Paper presented at the National Association of Research in Science
Teaching Annual Conference, Garden Grove, CA.
DeBoer, G. E., Lee, H. S., & Husic, F. (2008). Assessing integrated understanding of science. In
Y. Kali, M. C. Linn, & J. E. Roseman (Eds.), Coherent science education: Implications for
curriculum, instruction, and policy (pp. 153-182). New York, NY: Columbia University
Teachers College Press.
Herrmann-Abell, C. F., Flanagan, J. C., & Roseman, J. E. (2012, April). Results from a pilot
study of a curriculum unit designed to help middle school students understand chemical
reactions in living systems. Paper presented at the National Association of Research in
Science Teaching Annual Conference, Indianapolis, IN.
Johnson, P. (2000). Children’s understanding of substances, part 1: Recognizing chemical
change. International Journal of Science Education, 22(7), 719-737.
Kruse, R., Howes, E. V., Carlson, J., Roth, K., Bourdelat-Parks, B., Roseman, J. E., Herrmann-
Abell, C. F., & Flanagan, J. C. (2013, April). Developing and evaluating an eighth grade
curriculum unit that links foundational chemistry to biological growth: Changing the
research-based curriculum. Paper presented at the National Association of Research in
Science Teaching Annual Conference, Rio Grande, PR.
Kruse, R., Howes, E. V., Carlson, J., Roth, K., & Bourdelat-Parks, B. (2013, April). Developing
and evaluating an eighth grade curriculum unit that links foundational chemistry to
biological growth: Designing professional development to support teaching. Paper presented
at the National Association of Research in Science Teaching Annual Conference, Rio
Grande, PR.
Linacre, J. M. (2012). Winsteps® (Version 3.75.0) [Computer Software]. Beaverton, Oregon:
Winsteps.com. Retrieved January 1, 2011. Available from http://www.winsteps.com/.
Liu, X., & Boone, W. J. (2006). Introduction to Rasch measurement in science education. In X.
Liu & W. J. Boone (Eds.), Applications of Rasch measurement in science education (pp. 1-
22). Maple Grove, Minnesota: JAM Press.
Marmaroti, P., & Galanopoulou, D. (2006). Pupils' understanding of photosynthesis: A
questionnaire for the simultaneous assessment of all aspects. International Journal of Science
Education, 28(4), 383-403.
Mas, C. J., Perez, J. H. & Harris, H. (1987). Parallels between adolescents' conception of gases
and the history of chemistry. Journal of Chemical Education, 64(7), 616-618.
McNeill, K. L. & Krajcik, J. (2012). Supporting grade 5-8 students in constructing explanations
in science: The claim, evidence and reasoning framework for talk and writing. New York,
NY: Pearson Allyn & Bacon.
Mitchel, I. & Gunstone, R. (1984). Some student conceptions brought to the study of
stoichiometry. Research in Science Education. 14, 78-88.
National Assessment Governing Board. (2008). Science framework for the 2009 National
Assessment of Educational Progress, Washington, DC: Author.
National Center for Education Statistics. (2011). The Nation’s report card: Science 2009 (NCES
2011–451). Washington, DC: Institute of Education Sciences, U.S. Department of Education.
National Center for Education Statistics. (2012). The Nation’s report card: Science 2011 (NCES
2012–465). Washington, DC: Institute of Education Sciences, U.S. Department of Education.
National Research Council. (2012). A framework for K-12 science education: Practices,
crosscutting concepts, and core ideas. Washington, DC: National Academies Press.
Herrmann-Abell et al., NARST 2013
4/4/2013 21
Roseman J. E., Herrmann-Abell, C. F., Flanagan, J. C., Kruse, R., Howes, E. V., Carlson, J.,
Roth, K., & Bourdelat-Parks, B. (April 2013). Developing and evaluating an eighth grade
curriculum unit that links foundational chemistry to biological growth: Selecting core ideas
and practices—an iterative process. Paper presented at the National Association of Research
in Science Teaching Annual Conference, Rio Grande, PR.
Sadler, P.M. (1998). Psychometric models of student conceptions in science: Reconciling
qualitative studies and distractor-driven assessment instruments. Journal of Research in
Science Teaching, 35(3), 265-296.
Smith, E. L., & Anderson, C. W. (1986, April). Alternative student conceptions of matter cycling
in ecosystems. Paper presented at the the National Association of Research in Science
Teaching Annual Conference, San Francisco, CA.
Vaz, A. N., Carola, M. H., & Neto, A. J. (1997, April). Some contributions for a pedagogical
treatment of alternative conceptions in biology: An example from plant nutrition. Paper
presented at the National Association of Research in Science Teaching Annual Conference,
Oak Brook, IL.
Wright, B. D. (2003). Rack and stack: Time 1 vs. Time 2. Rasch measurement transactions.
17(1), 905-906. Retrieved March 12, 2012, from http://www.rasch.org/rmt/rmt171a.htm.
Wright, B. D., & Stone, M. H. (2004). Making Measures. Chicago, IL: The Phaneron Press.
![Developing and Evaluating Complex Interventions Draft of ... complex guidance draft for... · Updated Guidance: Developing and Evaluating Complex Interventions [DRAFT FOR CONSULTATION]](https://img.pdfslide.us/doc/110x75/5e030c51d9e2ea2f204183c7/developing-and-evaluating-complex-interventions-draft-of-complex-guidance-draft.jpg)