Embed Size (px)
Citation preview

1
Developing and analyzing The Neighborhood Early Warning System
In Hamline-Midway
Eric Myott February, 2000 Neighborhood Planning for Community Revitalization (NPCR) supported the work of the author of this report but has not reviewed it for publication. The content is solely the responsibility of the author and is not necessarily endorsed by NPCR. NPCR is coordinated by the Center for Urban and Regional Affairs at the University of Minnesota. NPCR is supported by grants from the US Department of Education Urban Community Service Program, The McKnight Foundation and The Minneapolis Foundation. St. Paul projects are funded in part by St. Paul Local Initiatives Support Corporation (LISC), The St. Paul, and St. Paul Companies. NPCR 330 Hubert H. Humphrey Center 301 - 19th Avenue South Minneapolis, MN 55455 phone: 612/625-1020 e-mail: [email protected] website: http://freenet.msp.mn.us/org/npcr

2
Developing and Analyzing the Neighborhood Early Warning System in Hamline-Midway.
Eric Myott. 2/2000
Introduction……………………………………………………………………….1
Data Access and the Joint Powers Agreement……………………………………2
Community Capacity to Use NEWS and GIS…………………………………….2
Development of Data Directory and GIS Manual………………………………...3
Assessing the Effectiveness of NEWS for Preventative Measures……………….5
Revising the NEWS Model……………………………………………………….9
Discontinued or Refined Indicators in 1999 NEWS Model………………………9
Indicators Used in 1998 that are re-incorporated into 1999 NEWS Model………10
Additional Indicators Used in 1999 NEWS Model……………………………….12
1999 NEWS Model……………………………………………………………….15
Conclusion………………………………………………………………………...22
Bibliography………………………………………………………………………25

3
Introduction.
Neighborhood Early Warning Systems have been developed in order to measure the amount of
housing distress within neighborhoods. A Neighborhood Early Warning System (NEWS)
incorporates a number of indicators often derived from government property data that determine
instances of tax delinquency, code violations, etc. at the parcel level. These indicators are
compiled to determine early warning signs that a property may face increasing problems such as
mortgage foreclosure or vacancy.
In 1998, the Hamline-Midway Area Rehabilitation Corporation (H-MARC) determined
that NEWS could be a good tool to organize data for research that would help develop more
pro-active housing strategies for their organization. A number of indicators were proposed for
the project. The indicators were developed with the help of existing literature (Mardock 1998,
Krouk 1996), existing NEWS web sites in Chicago and Los Angeles, and expert opinion at H-
MARC.
Next, a feasibility study was incorporated into the project to determine data accessibility
and capacity for H-MARC to use and display government information using Geographic
Information Systems (GIS). Finally, the indicators were given weighted scores determined by
simple statistics and expert opinion and summarized in a series of maps and a final distress
score for properties in the Hamline-Midway neighborhood. The spatial housing distress
patterns generated from the GIS component of the project both supported the perceptions of the
H-MARC staff and revealed a particular block where staff members did not realize the extent of
problems identified at those properties. The findings also broke a common perception in the
neighborhood that an area of public housing would be loaded with problems (Myott 1999).
However, a number of critical issues remain in determining the usefulness of NEWS.
These include questions about the accessibility and costs of property data (Kellner 1997). There
are also questions about the capacity of Community Development Corporations (CDCs) and
community groups to use NEWS effectively in preventative strategies (Blummner 1998).
Finally, there are questions about the effectiveness of NEWS to predict future distresses at the
property level (Mardock 1998).
Data Access and the Joint Powers Agreement.

4
The objectives of NEWS depend on the access to various property data. The City of St. Paul
and Ramsey County have solved the need to share data with each other through coordination of
the Ramsey County Users Group and regulations within the Joint Powers Agreement. Joint
Powers is an agreement that accounts for constituents that have use of Ramsey County and the
City of St. Paul GIS data. Previously Joint Powers loosely defined the allowances of
community groups and CDCs using county and city generated data. Recently, the Ramsey
County Users Group have taken steps towards having community groups as paying affiliates
within the user’s group.
If community groups and CDCs join the user’s group, they will together join a
consortium with educational institutions. The University of Minnesota, University of St.
Thomas and Macalester College would be provided monthly property data in a CD and would
deciminate the property data to the consortium. The data may be very useful for future
neighborhood research projects and GIS courses at the universities. The community groups and
CDCs in turn could benefit from the technical expertise of the institutions and any subsequent
findings from educational research efforts.
Community Capacity to Use NEWS and GIS.
Decisions were made by H-MARC to build the capacity of their organization to find and use
their property data with the help of GIS before the consortium of community GIS users formed.
Though groups like H-MARC could expect GIS support from the educational institutions, it
would still be good for community organizations to have the training to aid them in the day to
day use of GIS. It is unlikely that H-MARC could immediately use GIS and update the NEWS
database without technical assistance. However, products such as a file structure and data
directory, as well as a how to use GIS manual would benefit the capacity of future student intern
to develop NEWS. Student interns are more likely to have database than strictly GIS skills.
The education institutions in the consortium could in turn aid the methodology and
interpretation of research.
To build GIS capacity at H-MARC for NEWS use, a major component of this project
has been to develop a data directory of government / in-house data and to create a how to use
GIS manual. In the long-term non-profit housing organizations should directly educate the staff
to use GIS, but GIS training may be a more appropriate goal to be realized over a period of
time.

5
Development of Data Directory and GIS Manual
A large number of fields (columns) were created in the previous development of the
NEWS database. Each field contains data of a property attribute that runs vertically in the
database table, while each property has a row. For example, the NEWS database has fields
about assessed property values, exterior housing conditions, etc. To find out how a particular
property fares, you would have to follow the column until you found the particular cell that
represents the property (See Figure 1).
Figure 1: Part of NEWS Data Base. PIN FOADD CLASSCD VALUE CONDITION 262923330114 5XX SIXTH AVE H 10200 1 262923330097 6XX SIXTH AVE H 10100 3 262923330098 6XX SIXTH AVE NH 10200 5 262923330111 7XX SIXTH AVE H 5400 262923330112 7XX SIXTH AVE H 10200 5 262923330113 8XX SIXTH AVE CA 10200 3 262923330115 8XX SIXTH AVE H 10200 2 262923330116 9XX SIXTH AVE H 10200 3
A major problem with the NEWS database is the use of many different fields (over 80) with
field names that are not easily deciphered. For example, the above table shows a field heading
that is called CLASSCD that may be not easily understood as a tax classification. In addition to
the field name problem is the problem with deciphering classifications in the fields. For
example, it may not be easy to figure out that CA in the CLASSCD field is the classification for
commercially taxed properties. Also, there is no way to know what to know what the numbers
in the CONDITION field represent.
Compound these problems with an additional 70 fields of data (some more obscure) and
multiple users of the table (staff, future interns) and it becomes evident that a data directory is
necessary to understand the content of a NEWS database.
The NEWS Data Directory made for H-MARC comprises of a listing of field names, if
the field is numeric or a string (descriptive) and a brief description of the field. The second part
of the directory contains the classifications for each field (See figure 2)

6
Figure 2:
A problem that was faced when developing the data directory was determining the
classifications of certain fields from the Ramsey County data set. Though a directory was
provided for the Ramsey County data, there were a number of fields that were not documented
(e.g. Tax Delinquency) and the classification scheme of some fields were incomplete. A
number of classifications in the directory are therefore estimates or unknown.
Another important aspect of cataloging data for H-MARC was to maintain a file
directory structure. A file directory structure was needed to keep track of the various tables
derived from different data sources and files that are created from GIS analyses such as queries1
and address matching2.
The second part of building GIS capacity was to develop a how to use GIS manual for
H-MARC. The manual was created to aid the H-MARC’s staff understanding of GIS so they
1 Selecting all non-homestead properties and saving them as their own file. 2 Saving highlighted properties selected from a table of addresses.
Part 1 of Data Directory: Field Names and Descriptions. FIELD NAME TYPE DESCRIPTION SHAPE STRING POLYGON PARCELS FIRST_PIN** STRING PROPERTY ID NUMBER AREA NUMERIC MEASURED AREA IN PERIMETER NUMERIC MEASURED PERIMETER IN HAM8_ NUMERIC TOPOLOGY UACCD STRING URBAN-AGRICULTURE CABIN CODE CLASSCD STRING RAMSEY CO. TAX CLASSIFICATION CODE EXASCD STRING EXCEPTIONAL ASSESSMENT CODE USECD STRING USE CODE SUBCD STRING SUB-USE CODE NOUNITS NUMERIC NUMBER OF RESIDENTIAL UNITS AT PROPERTY Part 2 of Data Directory: Classification of Data Fields. CLASSCD :RAMSEY COUNTY TAX CLASSIFICATION CODE CA COMMERCIAL CI COMMERCIAL/INDUSTRIAL CR COMMERCIAL PREFERRED EXTENSION EX EXEMPT H HOMESTEAD HB HOMESTEAD BLIND HD HOMESTEAD DISABLED HP HOMESTEAD PARAPLEGIC NH NON-HOMESTEAD (3 OR LESS ) NJ APARTMENTS (4 OR MORE) TX TRUST EXEMPT

7
could develop basic skills necessary to search through and maintain their NEWS database.
Furthermore, it could help student interns who are more likely database than GIS savy.
Members of H-MARC went through the initial drafts of the manual while using GIS and
following the manual’s instructions. We were able to determine the strengths and weaknesses
of the manual and adjust it according to problems that were faced.
The manual was devided into four parts. The first part introduces the user to the basic
structure of the ArcView GIS program. It has the user move around in the program exposing
the user to tables, views and layouts in the program. The goal of this section is to familiarize
the user to the program.
The second part of the manual uses the existing 1998 NEWS database for the purpose of
the user to create an exterior housing conditions map. This familiarizes the user more with how
to select a field within the database and classify it within a view3. Part three introduces the
layout and printing procedures. The layout is the window where the image of a map view is
inserted and included with a title, legend, etc.
The fourth and last part to the manual introduces the user to creating a new table by
joining two or more databases together. It also has the user go through a series of queries and
selections in which the user can create a new map and table. This part also explores issues of
table maintenance and glitches that arise with the software.
The manual is not intended for its users to be experts with GIS. The intention is to
develop GIS skills that pertain directly to the NEWS database. It would be pertinent for users to
consult with a specialist when developing research, especially in the initial stages of H-MARC’s
use of GIS.
Assessing the Effectiveness of NEWS for Preventative Measures.
Neighborhood Early Warning Systems have yet to be tested for their predictability (Blumner
1998). Using statistics to determine probabilities that the indicators have causal relationships
with vacancy or mortgage foreclose is difficult because often the indicators are both causes and
effects for one another (Sawicki and Flynn 1996). It is also unlikely that any index or database
will capture all causes for vacancy (Mardock 1998). With the NEWS project in Hamline-
Midway, we wanted to explore these issues to see if there may be way to use statistics to
determine a correct indicator set and to help aid in weighting those factors.
3 The view is where you layer, classify and set color schemes for the map, which will be designed in the layout.

8
Dr. Bob Werner, from the University of St. Thomas Geography Department performed a
statistical analysis to determine the significance of the indicators. He also consulted with other
statisticians about the potential use of specific statistical methods. The use of a predictive
model was found to be impossible in this case. The problem with the predictive method
occurred because the NEWS data set we used was heavily skewed. For example, water shutoffs
in our database comprised of 87 occurrences with 3,658 non-occurrences (See figure 3). This
low occurrence (i.e. skewedness) made it impossible to determine probabilities that would be
accurate within the prediction method (Hyser, Myott and Werner 1999).
Though this is a methodological problem, it is a good sign that the Hamline-Midway
does not have chronic occurrences of distress. It is plausible that the prediction method would
work in a neighborhood with more housing difficulties.
Figure 3: Data Sources and Distributions.
MEASURE- MENT LEVEL, DATA SOURCE YEARS DISTRIBUTION 1. citizen complaints St. Paul Citizen Services various, monthly interval, skewed 2. problem properties H-MARC & HMC 1995-1998 nominal 3. ownership vicinity derived 1995-1998 ordinal, skewed 4. water shutoffs St. Paul Water Utility 1995-1998 interval, skewed 5. tax delinquencies Ramsey Co. 1998 interval, skewed 6. assessed property value Ramsey Co. 1993, 94, 97, 98 interval, skewed 7. MLS property sales MLS 1995, 1996, 1998 interval, skewed 8. vacant buildings St. Paul Public Health 1995-1998 nominal 9. vacant land Ramsey Co. & survey 1995-1998 nominal 10. building code violations St. Paul Citizen Services 1995-1998 interval, skewed 11. crimes St. Paul Police Dept. 1997 interval, skewed 12. contract for deed Ramsey Co. 1997 nominal 13. location of owner Ramsey Co. 1997, 1998 nominal 14. housing condition H-MARC, U of M 1996 ordinal, skewed
It was thought that a time-series analysis could be used. However, Ramsey County Property
data goes to microfilm after three years. It would be necessary to collect closer to twenty years
of data to utilize the time-series method. It is plausible that generating data by the month rather
than by the year would make this kind of analysis possible. Time constraints and the lack of
availability of monthly-generated data prevented us from pursuing time-series analysis.
Other methods such as discriminant analysis proved to be quite limited, probit and logit
statistical models may hold some hope for future research into the predictability of NEWS.
With the limitations of many statistical methods it was determined that the best we could do is
run hypothesis tests on the variables that the literature and expert opinion suggest (Hyser,

9
Myott, Werner 1999). This would help us determine if the data we used is the “right” data (See
Figure 4).
Figure 4: Significance of the variables in the H-MARC model.
The chosen indicators all were found to be significant. The data is the “right” data to use for
NEWS, but unfortunately we cannot validate the weights of scores used to summarize distress
in the Hamline-Midway area.
Another way Dr. Werner approached the problem of statistical significance was to test
an hypothesis with a dependent variable. We concluded that tax delinquencies and vacancies
were what we wanted as a dependent variable. Tax Delinquencies were seen as a possible
distress that leads to vacancy, because the state can take the title away and vacate a property
owned by a person who does not pay taxes (See figure 5).
Figure 5: Tax Delinquency as Dependent Variable.
Figure 5 shows that police calls and proximity to vacant were not sigificant when considering
tax delinquencies. This may be explained by the likelihood that a homeowner will not quit
paying property taxes solely because the adjacent home has been vacated or that the police are
called on their neighbors (Hyser, Myott and Werner 1999). However, proximity to vacant and
CROSSTABULATIONS Chi- sig. Chi- Square square df significant?
SUM OF WEIGHTS in the H-MARC model, by HOUSE CONDITION 3353.6 .000 22 yes PROPERTY VALUE CHANGE 87.1 .000 11 yes WATER SHUTOFFS 1566.6 .000 33 yes MORTGAGE & TAX DISTRESS 300.9 .000 11 yes CRIME (by street segment) 1937.5 .000 11 yes PROXIMITY TO VACANT 1945.5 .000 44 yes LOCATION OF OWNER 845.0 .000 22 yes CONTRACT FOR DEED 269.2 .000 22 yes
CROSSTABULATIONS Chi- sig. Chi- Square square df significant? TAX DELINQUINCY by PROBLEM PROPERTIES 142.2 .000 5 yes PROXIMITY TO VACANT 9..5 .976 20 no WATER SHUTOFFS 471.3 .000 35 yes HOUSE CONDITION 431.1 .000 25 yes LOCATION OF OWNER 96.7 .000 10 yes POLICE CALLS 26.7 .143 20 no CONTRACT FOR DEED 13.3 .021 5 yes VACANT 222.8 .000 5 yes
10
police calls may influence reasons why a homeowner would vacate their property (Goetz 1997).
To see the explanatory value of those indicators we used vacancy as the dependent variable (See
figure 6).
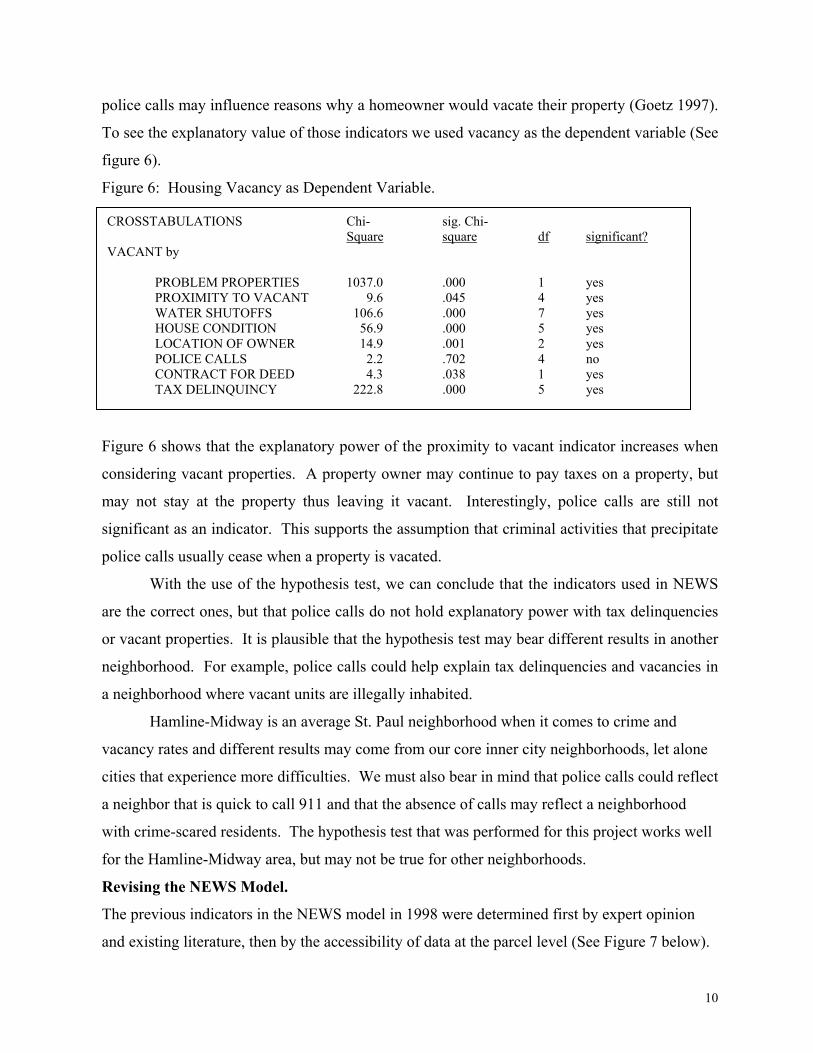
Figure 6: Housing Vacancy as Dependent Variable.
Figure 6 shows that the explanatory power of the proximity to vacant indicator increases when
considering vacant properties. A property owner may continue to pay taxes on a property, but
may not stay at the property thus leaving it vacant. Interestingly, police calls are still not
significant as an indicator. This supports the assumption that criminal activities that precipitate
police calls usually cease when a property is vacated.
With the use of the hypothesis test, we can conclude that the indicators used in NEWS
are the correct ones, but that police calls do not hold explanatory power with tax delinquencies
or vacant properties. It is plausible that the hypothesis test may bear different results in another
neighborhood. For example, police calls could help explain tax delinquencies and vacancies in
a neighborhood where vacant units are illegally inhabited.
Hamline-Midway is an average St. Paul neighborhood when it comes to crime and
vacancy rates and different results may come from our core inner city neighborhoods, let alone
cities that experience more difficulties. We must also bear in mind that police calls could reflect
a neighbor that is quick to call 911 and that the absence of calls may reflect a neighborhood
with crime-scared residents. The hypothesis test that was performed for this project works well
for the Hamline-Midway area, but may not be true for other neighborhoods.
Revising the NEWS Model.
The previous indicators in the NEWS model in 1998 were determined first by expert opinion
and existing literature, then by the accessibility of data at the parcel level (See Figure 7 below).
CROSSTABULATIONS Chi- sig. Chi- Square square df significant? VACANT by PROBLEM PROPERTIES 1037.0 .000 1 yes PROXIMITY TO VACANT 9.6 .045 4 yes WATER SHUTOFFS 106.6 .000 7 yes HOUSE CONDITION 56.9 .000 5 yes LOCATION OF OWNER 14.9 .001 2 yes POLICE CALLS 2.2 .702 4 no CONTRACT FOR DEED 4.3 .038 1 yes TAX DELINQUINCY 222.8 .000 5 yes

11
Each indicator in figure 7 (Above) was given a weight dependent upon the seriousness of the
event and the frequency of occurrence. The indicators reflect conditions that may be early
warnings of financial distress or property abandonment. The indicator points were then
summed up, classified (No Distress to Extreme Distress) and then mapped. Note: The 1998
model incorporated data from 1997, while the 1999 model incorporates 1998 property data.
Discontinued or Redefined Indicators in 1999 NEWS Model.
Some of the indicators used in 1998 are discontinued or redefined in 1999. The indicators no
longer used for the 1999 model are:
1) Property Value Decrease: Property value decrease was discontinued as an indicator,
because after further analysis it became determined that most properties that saw value
decreases were properties that became vacant. Because we wanted the model to have more
“predictive qualities”, it was decided to not count property value changes in NEWS.
2) Mortgage Foreclosures and Tax Forfeitures: Mortgage foreclosures and tax forfeitures
also lack predictability. Houses that are mortgage foreclosed or are taken by the state with tax
forfeiture are beyond the help of the potential preventative activities of H-MARC. It was later
determined that tax delinquency data could be purchased, which would be more of a early
warning sign than foreclosures and forfeitures.

12
3) Crimes by Street Segment: The Crimes indicator was discontinued, because of its
failure in the hypothesis test.
4) Potential Contract for Deeds: Lastly, the Potential Contract for Deeds indicator’s title
was redefined as Ownership (Taxpayer) Discrepancy. This indicator’s title was changed to
reflect the criteria used in determining potential contract for deeds. Ownership (Taxpayer)
Discrepancy takes into account when the taxpayer and the property owner title name are
different in property records. Different taxpayer and ownership names may mean the property
is a contract for deed, though some of this may account for errors in the Ramsey County
database. Contract for deed is a type of financing in which the seller allows payment
arrangements for the property over time that include interest and principle payments. Legal
“ownership” is transferred to the taxpayer. The seller/financier is the fee owner. Maintenance
of the home falls to the taxpayer, yet it is difficult to get home improvement loans without the
fee owner co-signing.
Indicators Used in 1998 that are re-incorporated into 1999 NEWS Model.
Indicators that were used again in 1999 include exterior housing conditions, water shutoffs,
proximity to vacant building and property ownership location. These indicators were found to
be significant in the hypothesis test and were found useful as early warning signs of housing
distress by the existing literature and the H-MARC staff. Each indicator can be defined as
following:
1) Exterior Housing Conditions. The housing conditions survey reviewed the exterior
elements of a housing structure that include its foundation, stairs, paint, wood, windows, and
roof. A survey of the housing conditions in Hamline-Midway was completed by a college
student in 1996 for H-MARC. Poor Building Conditions lead to housing decline, because they
affect the value of the home negatively. If a homeowner can afford to maintain the house’s
roof, foundation, and outside walls, then the homeowner can expect to have his or her home
valued higher than it would be if the home was not maintained at all. This includes subtracting
the cost for maintenance. If the exterior of a home is not kept it good shape, it may be a sign
that the homeowner cannot afford the upkeep. The condition survey data is in electronic form
as a part of the NEWS database.
2) Water Shutoffs. Water shutoffs and shutoff notices often are strong indicators of fiscal
distress in a household. Water is a basic necessity and when people are not paying their water

13
bill they are likely having difficulty paying for other things, including any investment into the
homes infrastructure, or the mortgage payment.
Water is shut off when either a payment isn’t made after the 45-day notice or if there are code
violations at the home for health reasons. Water can be shutoff many times at the same
household in a year. A water shutoff is also the cause of condemnation and forced vacancy, as it
is a primary utility. Water shutoff carries a large indicator weight for distress, because of the
likelihood that a foreclosure may ensue if the financial distress continues in the household.
Water shutoff data was provided in paper form by St. Paul Regional Water Utility.
3) Proximity to Vacant Building. Vacant properties on a block affect the perceptions of
both the neighbors and the Realtors in the neighborhood. Realtors will perceive that a block is
going down hill when a vacant building or lot is present. Subsequently, this could decrease the
values of the neighboring homes. Neighbors, in turn, may not invest in their own homes
because their properties are decreasing in value. It may seem more feasible to sell than to stay
and invest in the property (Goetz 1997). When a neighborhood faces decline, this cycle of
disinvestment often occurs. An adjustment in defining the Proximity to Vacant indicator was
that properties near vacant land were no longer given weights. Vacant land was no longer
included, because records were unreliable and windshield surveys were time consuming and
subjective. Properties near vacant buildings were given a score according to their distance (Up
to 950 ft.) from vacated buildings. St. Paul Public Health Code Violations provided vacant
property data in paper form.
4) Property Ownership Location. Owners that live outside the vicinity of the city,
metropolitan area or state are absentee owners of property. Absentee owned homes have the
potential of creating both social and financial problems for homes and surrounding homes in an
area. Sometimes absentee owners can overlook the condition of the home with an “out of sight,
out of mind” attitude. More often when problems are unattended to, owners not present at the
property are concerned, but are unaware that a problem is occurring. Also, it can be difficult for
tenants to voice their concerns about a problem when the owner resides across town or even in
another state.
Good caretakers and property managers can mitigate these problems when rental ownership
lives some distance away from their property. Therefore indicator weights for ownership
location are light compared to the other indicators. Electronic data was purchased through
Ramsey County Property Records and Revenue.

14
5) Ownership (Taxpayer) Discrepancy. This indicator uses the same criteria as the 1998
Potential Contract for Deeds indicator. Ownership (Taxpayer) Discrepancy was determined by
comparing the names of ownership and taxpayer fields in the property database for Hamline-
Midway. Electronic data was purchased through Ramsey County Property Records and
Revenue.
Additional Indicators Used in 1999 NEWS Model.
In addition to the previously discussed housing distress indicators, three new indicators were
developed for the 1999 NEWS model. These indicators are tax delinquencies, housing court
warrants and years and severity of repeated distress. The indicators are defined as following:
1) Years of Tax Delinquency. Tax Delinquencies are often used in the literature about
housing disinvestment and distress (Mardock 1998, Krouk 1998, Blumner 1998). Owners that
do not pay their taxes can eventually have them forfeited to the state. In St. Paul, homestead
owners can loose their properties in five years and rental owners can in three if they don’t pay
their taxes. Therefore, we weighted the tax delinquency score according to the years a property
has been delinquent and gave a different score depending upon the homestead status.
Homestead properties received a score after four years and rental units after two years.
Electronic tax delinquency data was purchased through Ramsey County Property Records and
Revenue.
2) Housing Court Warrants. Court warrants include excessive consumption and code
violations. Excessive consumption is when a city or county agency revisits a property multiple
times about a complaint or violation. The list of warrants issued in Hamline-Midway includes
persons who owe outstanding fines due to excessive consumption or code violations. We gave
a weight of two to properties with a warrant and a single point for each subsequent warrant.
Due to the recent crackdown in St. Paul on property owners with outstanding warrants, there
may not be many names listed in the future. In that case, this indicator may need to be revised.
The listing for housing court warrants can be found at www.stpaul.gov
3) Years and Severity of Repeated Distress. This indicator was devised from an analysis of
multiple years of indicator scores within a three-year period. We pursued this analysis because
properties that have repeatedly had housing problems may be more susceptible to tax
delinquencies, code violations and possibly vacancy. The Repeated Year of Distress Indicator
accounts for multiple years a property has a distress score from 1996 to 1998. Indicators from

15
the multiple years include Water Shutoffs, Ownership Discrepancy, Ownership Vicinity, and
Proximity to Vacant Units. These indicators used to have the same scoring system that was used
in the 1998 NEWS Model (See Page 10). The scoring weights are summarized for the Years
and Severity of Distress indicator.
Figure 8 classifies the total indicator score for properties with multiple years of distress (1996 –
1998) into natural breaks. That is, properties with multiple years of distress in Group 1 are
more alike (with similar years or distress scores) than properties in the other groups. Each
Group was given a new weight used for the Years and Severity of Distress indicator in the 1999
NEWS Model.
Figure 8. NEWS Score for Repeated Years of Distress.
The weights for the three year period are as following: Criteria for Indicator Indicator Score Repeat Years of Distress: Two Years of Distress 1 Three Years of Distress 2 Indicator score of repeatedly distressed properties: Group 1 (0 – 2) 0 Group 2 (2.5 – 3) 0.5 Group 3 (3.5 – 4.5) 1 Group 4 (5 – 7) 1.5 Group 5 (7.5 – 9.5) 2 Group 6 (10 or more) 2.5
NEWS Scores for Repeat Years
0.00
5.00
10.00
15.00
20.00
25.00
NEW
S Sc
ore
Group 1 0 to 2
Group 2 2.5 to 3
Group 3 3.5 to 4.5
Group 4 5 to 7
Group 5 7.5 to 20
Group 610 +
Figure 9

16
Figure 9 (above) shows that though there is a dispersion of repeatedly distressed properties from
1996 to 1998. However, there are areas where distress is repeated more frequently. Most
notable are 1 ½ blocks on Thomas and Simpson Avenues in the south central part of Hamline-
Midway and a concentration of distress on Hewitt and Hamline in the northeast part of the
neighborhood.
There are also a number of concentrations of repeated distress without the severity of the
previously mentioned properties. We also note a number of highly distressed properties that are
dispersed from concentrations of distress, predominantly in the southern part of the
neighborhood. Though we cannot make time-series inferences from three years of annual data,
we believe that a property that has experienced multiple years of distress is usually worse off
than a property that only experiences one year of problems.
1999 NEWS Model.
The 1999 NEWS model incorporates data that indicate if a property is experiencing distress that
may lead to other problems. The purpose of creating this model is to highlight areas of distress

17
in the Hamline-Midway neighborhood so that H-MARC may track distressed properties and
better understand any patterns of housing distress over space and time.
Figure 10: 1999 NEWS Model
The 1999 NEWS model summary seen in figure 10 shows each indicator and its score along
with a classification of the indicators’ summarized scores. With the scores summarized, we
were able to generate a map with the NEWS model as an index for housing distress using
Geographic Information Systems (See figure 11).

18
Figure 11: 1999 NEWS in Hamline-Midway.
The 1999 NEWS Model shows that concentrations of extreme distress are found in the south
central portion of the neighborhood. The areas with concentrated distress that are found both in
the repeated distress map and the 1999 NEWS map are due in part to the use of the Repeated
Years of Distress indicator in the 1999 NEWS Summary. Therefore, the areas that exhibited
high indicator summary scores in 1997 – 1999 model summary should be compared to the 1999
NEWS Model without the Repeated Years of Distress indicator. By not using the Repeat Years
of Distress indicator in the 1999 NEWS Summary, we avoid double counting in the summary.
In figure 12, areas that have experienced repeated distress levels are circled and are compared to
the 1999 model without the Repeated Years indicator.

19
Figure 12: Repeated Distress Scores and 1999 NEWS Summary.
By circling areas that have multiple years of distress and areas that have only recent distress, we
highlight potential target areas for H-MARC. Furthermore, we can see where new areas of
Areas of 1999 Concentrated Distress that had a relatively larger distress score than the total period of 1996 – 1998.

20
distress are occurring and establish a base for understanding change in distress patterns in
Hamline-Midway.
The 1999 NEWS Model without the repeated distress indicator shows that areas that
have experienced distress over the past three years typically have some distress presently.
However, there are also a few areas that experienced distress in 1999 that have not experienced
it as much in the past. In two of the three areas with new distress the NEWS score is higher due
to the changing patterns of vacancies in the neighborhood. In 1998 Hamline-Midway saw an
increase in the number of vacant units in areas where there were no vacancies in previous years
(See figure 13 on next page).
Particular concern should be paid attention to the southern-most area of new distress that
did not experience any vacant units within its boundary. Although this area has experienced
some previous distress, properties distress levels have increased recently.
Again, multiple years of distress account for ownership location and discrepancy, water
shutoffs and proximity to vacant buildings. Areas that have concentrations of multiple years of
distress through a three-year period have a larger proportion of tax delinquencies and housing
court cases. This is especially true of housing court cases, which areas of repeated distress have
seven of the neighborhood’s seventeen cases. Areas of multiple of distress also have lower
housing condition and assessed property values (See Figure 14).
Figure 14: Properties in Multiple Years of Distress Areas (See Fig. 12) Other Properties Indicator Count (Proportion) Count (Proportion) Properties 279 (8.4%) 3127 (91.6%) 1999 Assessed Property Value (Avg.) $70,312 $77,368 Tax Delinquency 10 (14.3%) 60 (85.7%) 1996 Housing Conditions* 2.93 3.04 1999 Housing Court Cases 7 (41.2%) 10 (58.8%) * 0 = Poor, 5 = Excellent
Though we know very little about trends during the 1996-1998 period, we do find often that
concentrations of distress in 1999 have faced distress over the three-year period as a whole. It
makes sense that problems will occur before a property becomes vacant. However, it is likely
that other non-recorded factors influence the process of the vacancy of a property. For example,
the death of the property holder or property owner’s job loss could be the predominant factor in
keeping up the building and the mortgage.
Figure 13: Vacancies and Proximity to Vacancy Indicator Scores 1996 - 1998
Vacancy in area with little distress in 1998 and in 3yr Period.
Areas of 1999 Concentrated Distress that had a relatively larger distress score than the total period of 1996 – 1998.

21
We do not know if a particular indicator influences the vacancy of a building more than another
factor. However, we do know that the indicators used in the repeated distress indicator do help
explain vacancy and that it makes sense to account for the accumulation of problems over time
when measuring housing distress.
In analyzing the maps of current and previous distress, we found that areas of current
concentrated distress often experienced high levels of distress over the past three years.
Housing distress tends to occur in the southern part of the neighborhood and distress is mostly
absent in much of the northwest section.
Vacancy patterns often generate concentrations of high distress scores. However, an area
in the south-central part of the neighborhood is experiencing increasing distress scores without
any vacant units within its boundary. Conversely, we find that there are units that became
vacant in 1998 that minimally affect 1998 distress levels and that have not been in areas of
distress over the 1996-1998 period (see top map on figure 13, previous page). Future research
may want to compare the status of vacant units in areas with high and low distress rates. For
example, it is plausible that a vacant unit that experienced a lot of distress in the past may
experience a longer duration of vacancy.
NEWS was created to show the early warning signs that a property will likely
experience worsening problems such as delinquencies and possible vacancy. In 1998, 28 of the
38 vacant units were not vacant in 1997. A quick comparison of these new vacant units and
their 1997 NEWS scores will show how much the indicator scores showed an early warning
sign. Of the 28 new vacant units, 17 experienced some degree of distress in 1997. Vacant units
that had no distress score only comprised of 0.2% of all properties with no distress, while vacant
units with extreme distress accounted for 21.1% of all extreme distress properties (See figure
14).
Though the percentage of extreme distressed properties in 1997 that became vacant in
1998 is not great, it is a significantly greater proportion than properties that had no distress at
all. This is also true for the revised 1999 NEWS summary. In 1999 eleven properties became
vacant of which two were considered with little distress, three considered moderate, two
considered high, and three considered extremely distressed by the 1999 summary. Only one of
the eleven new vacant buildings in 1999 was considered to have no distress, even though 60%
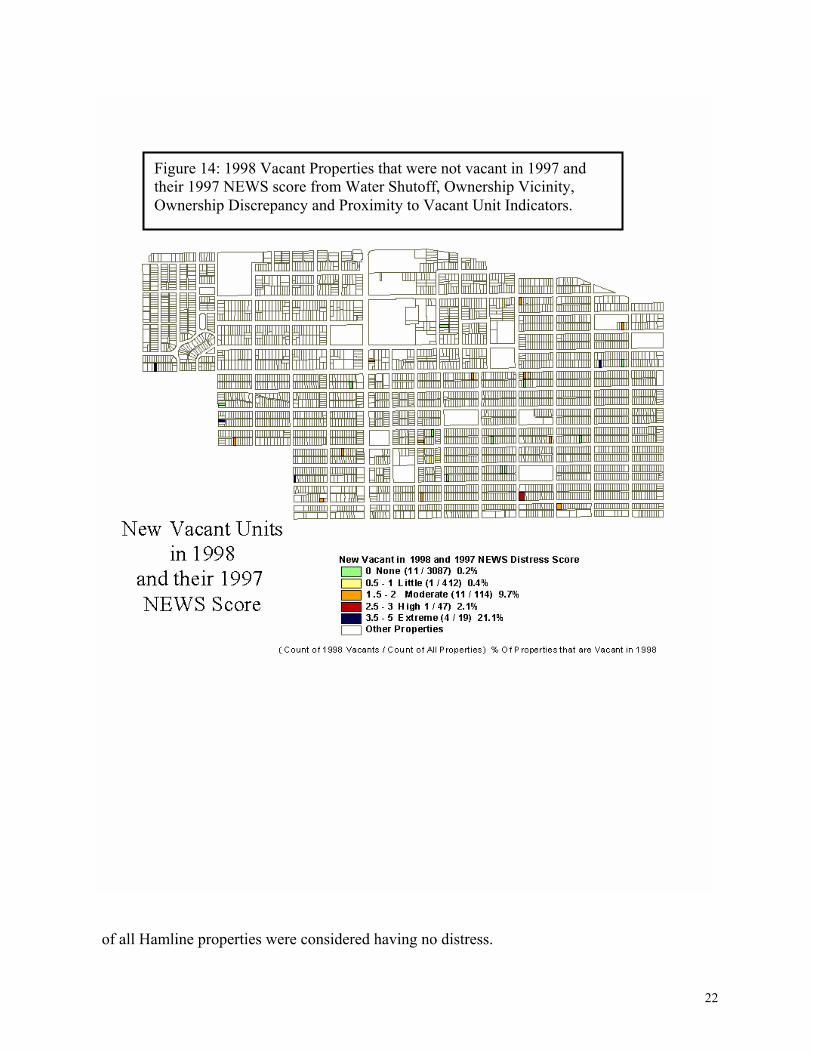
22
of all Hamline properties were considered having no distress.
Figure 14: 1998 Vacant Properties that were not vacant in 1997 and their 1997 NEWS score from Water Shutoff, Ownership Vicinity, Ownership Discrepancy and Proximity to Vacant Unit Indicators.

23
Future research of NEWS in Hamline-Midway should consider what happened to the
vacant properties that did not have distress as well as assess how the indicators showed up with
properties that did.
Conclusion.
NEWS in Hamline-Midway has become more feasible and useful for H-MARC since its
inception. Property data should become more accessible through the consortium of community
groups’ participating in the Ramsey County Users Group. The capacity of H-MARC to use
NEWS has increased with the creation of a data dictionary and a “how to use” GIS manual.
The combination of increasing staff skills with database/GIS technology and student intern
support on research projects should make possible the maintenance and innovation of GIS
projects, including NEWS. Future staff training with GIS should be contingent upon the
pragmatic use in developing housing strategies and solving day to day problems.
Questions persist about the “predictability” of NEWS. In this project’s analysis, we
determined that most of the data used in the NEWS model was significant when considering
vacancy and tax delinquency. However, we were not able to determine how much the factors
used in the model explain vacancy or delinquency. Neighborhoods with more occurrences of
distress may provide the possibility of predictive statistical analyses, but in Hamline-Midway
the large majority of non-occurrences does not allow for prediction methods that we attempted
to use.
A time-series analysis was also impossible due to the lack of the availability of historical
property data in a digital format. Future research on the predictability of NEWS will benefit
from the use of continuous distributions of data. Most of the data used in this model were
nominal or interval and comprised of mostly binary ones and zeros. Lastly, historical case
studies of properties that became vacant may yield insight into the process of vacancy and
potential indicators used in NEWS models.
A hypothesis test on the 1998 model determined the use of data in the 1999 indicator
model, three new indicators were included, and the factors (indicators) were weighed using
previous literature and expert opinion. The 1999 NEWS model was then mapped using GIS.
Both models found that housing distress was dispersed throughout the neighborhood, although
concentrations of distress were mostly present in the southern part of the neighborhood and
mostly absent in the northwest section.

24
Further analysis of the spatial patterns of housing distress found that most of the areas
with distress in 1998 had distress over the 1996-1998 period. These newly distressed areas
were found in the southern part of the neighborhood, nearby areas that have experienced past
distress. Last in the projects analysis, properties that became vacant in 1998 had a much larger
proportion of properties that had distress in 1997 than properties that did not show distress.
This was also true for new vacant buildings in 1999 using the 1999 NEWS. Though this gives
further support of the indicators ability to show early warning signs of a vacancy, it does not
completely explain why properties become vacant in Hamline-Midway.
Future research into NEWS should keep in mind the kind of data that works well for
predictive methods. Researching an area with more occurrences of distress or setting the
NEWS models indicators with more continuous numbers would likely help predictive models.
For example, picking a neighborhood with more incidents of vacancies and inputting the
number of months a property was vacant would increase the range and number of occurrences
within the database, which would better lend itself for predictive methods.
Questions also need to continue to be asked about quantifiable and non-quantifiable
causes of vacancy. For example, developing case studies about vacant buildings that look into
their history preceding vacancy would help clarify if and how indicators for housing distress
lead to a vacancy (see Mardock, forthcoming).
Maybe even more importantly, groups developing NEWS need to find practical,
innovative and effective ways of solving the distress they detect. For example, efforts in
Hamline-Midway could focus on mailing information about products or services available from
H-MARC or other groups to areas and incidents of high levels of distress. However, it is likely
that an additional understanding though case studies of distressed and vacant properties would
yield other practical strategies to prevent housing problems.
Bibliography. Blumner, Nicole. (1998) Data for the People: St. Paul and Integrated Property Information. St. Paul, MN Goetz, Edward and Cooper, Kristen and Hin Kin Lam (1997) The Fiscal Impacts of the St. Paul HOUSES TO HOMES Program. Minneapolis, MN
25
Hyser, Myott and Werner. (1999) Urban GIS: An Early Warning System to Predict Housing Vacancy in the Hamline-Midway Area of St. Paul, Minnesota. A paper presented at the MN GIS/LIS conference, 1999, St. Cloud, Minnesota Kellner, Stephanie. (1997) Accessing Housing Data in St. Paul and Ramsey County, Minnesota. Minneapolis, MN Kellner, Stephanie. (1997) Creating a Housing Database for the East Side Neighborhood of St. Paul, Minnesota. Minneapolis, MN Krouk, Daniel. (1996) Tax Delinquency and Urban Disinvestment in Los Angeles. Los Angeles, CA Krouk, Danny, Pitkin, Bill and Neal Richman. (1998) Internet-based Neighborhood Information Systems: A Comparative Analysis. Los Angeles, CA. Mardock, Lori (1998) Predicting Housing Abandonment in Minneapolis’ Central Neighborhood: Creating an Early Warning System. Minneapolis, MN Myott, Eric (1999) Early Warning System Feasibility In the Hamline Midway Area. NPCR Report. Minneapolis MN. Sawicki, David and Patrice Flynn. (1996) Neighborhood Indicators: A Review of the Literature and an Assessment of Conceptual and Methodological Issues. Journal of the American Planning Association. 62, 2: 165-183.
Internet Sites:
Center for Neighborhood Technology. http://www,cnt.org Neighborhood Knowledge Los Angeles. http://nkla.sppsr.ucla.edu Freenet’s Listing of Twin Cities Resources. http://tcfreenet.org/dpet.html Listing for St. Paul Vacant Units and housing court cases. www.stpaul.gov
VIII. Acknowledgements Geographic Analysis and Design was performed at The University of St. Thomas Geography Department’s GIS Lab. Dave Alstead and Beth Hyser. Hamline-Midway Area Rehabilitation Corporation. Dr. Bob Werner. University of St. Thomas Department of Geography. Cliff Nash St. Paul Water Utility. And Barb Woosley.
The University of Minnesota is committed to the policy that all persons shall have equal access to its programs, facilities, and employment without regard to race, color, creed, religion, national origin, sex, age, marital status,
disability, public assistance status, veteran status, or sexual orientation.