Embed Size (px)
Citation preview

Nat. Hazards Earth Syst. Sci., 15, 381–391, 2015
www.nat-hazards-earth-syst-sci.net/15/381/2015/
doi:10.5194/nhess-15-381-2015
© Author(s) 2015. CC Attribution 3.0 License.
Developing an effective 2-D urban flood inundation model for city
emergency management based on cellular automata
L. Liu1,2, Y. Liu1, X. Wang1, D. Yu3, K. Liu1, H. Huang1, and G. Hu4
1Center of Integrated Geographic Information Analysis, School of Geography and Planning, Sun Yat-sen University,
Guangzhou, PR China2Department of Geography, University of Cincinnati, Cincinnati, Ohio, USA3Centre for Hydrological and Ecosystem Science, Department of Geography, Loughborough University, Loughborough, UK4School of Geography and Planning, Guangdong Key Laboratory for Urbanization and Geo-simulation,
SunYat-sen University, Guangzhou, PR China
Correspondence to: L. Liu ([email protected]) and Y. Liu ([email protected])
Received: 8 August 2014 – Published in Nat. Hazards Earth Syst. Sci. Discuss.: 30 September 2014
Revised: 2 February 2015 – Accepted: 3 February 2015 – Published: 4 March 2015
Abstract. Flash floods have occurred frequently in the ur-
ban areas of southern China. An effective process-oriented
urban flood inundation model is urgently needed for urban
storm-water and emergency management. This study devel-
ops an efficient and flexible cellular automaton (CA) model
to simulate storm-water runoff and the flood inundation pro-
cess during extreme storm events. The process of infiltration,
inlets discharge and flow dynamics can be simulated with
little preprocessing on commonly available basic urban ge-
ographic data. In this model, a set of gravitational diverging
rules are implemented to govern the water flow in a rectangu-
lar template of three cells by three cells of a raster layer. The
model is calibrated by one storm event and validated by an-
other in a small urban catchment in Guangzhou of southern
China. The depth of accumulated water at the catchment out-
let is interpreted from street-monitoring closed-circuit televi-
sion (CCTV) videos and verified by on-site survey. A good
level of agreement between the simulated process and the re-
ality is reached for both storm events. The model reproduces
the changing extent and depth of flooded areas at the catch-
ment outlet with an accuracy of 4 cm in water depth. Compar-
isons with a physically based 2-D model (FloodMap) show
that the model is capable of effectively simulating flow dy-
namics. The high computational efficiency of the CA model
can meet the needs of city emergency management.
1 Introduction
Storm-water runoff simulation models are of fundamental
importance for assessing urban flooding dynamics (Chen and
Adams, 2007), risk assessment (Dunn et al., 2014; Mah-
moudi et al., 2013; Kubal et al., 2009; Taubenböck et al.,
2011; Tsakiris, 2014) and the evaluation of runoff quan-
tity and quality-control performance (Gilbert and Clausen,
2006; He et al., 2011). In the past decades, flash floods have
occurred frequently due to land cover and climate change
(Chang et al., 2010), especially in the urban areas of southern
China, and have caused serious damage to urban properties.
These problems present many challenges to urban manage-
ment, such as storm-water pipeline maintenance, non-point
source contamination, massive traffic jams. Therefore, a sim-
ple, efficient and process-considered urban flood inundation
model is urgently needed for urban storm-water and emer-
gency management. However, due to the complexity of the
urban infrastructure and built environment, urban flood mod-
eling that is sufficiently efficient for emergency management
has always been a challenging task (Bidur Ghimire, 2013).
Compared to lumped hydrological models, two-
dimensional (2-D) hydraulic models with high spatial
details based on hydraulic equations gain better accuracy
and credence in simulating the spread of water onto a wide
surface area that contains complex urban feature and can
provide detailed information about the flooding dynamics.
However, these models require a large amount of data,
Published by Copernicus Publications on behalf of the European Geosciences Union.

382 L. Liu et al.: Developing an effective 2-D urban flood inundation model for city emergency management
which are often difficult to obtain (Chen et al., 2012; Hunter
et al., 2005a; Neal et al., 2009; Schumann et al., 2011;
Zhang and Pan, 2014). Indeed, some cities do not have
detailed information on their sewer system, including exact
pipe junction locations and depths, pipe diameters and the
intricate morphology and boundary conditions of channel
and sewer networks (Zhang and Pan, 2014), especially
in the context of ancient and emergent urban areas as a
result of rapid urbanization of China. Thus, establishing
a physics-based model is a difficult task for most urban
management. In addition, urban flooding is a fast process
at a time scale as small as tens of minutes. The calculation
of the differential equations in these physics-based models
is complex and requires an immense computation time. In
contrast, floodplain inundation is most often characterized
by a much slower phenomenon (Leandro et al., 2014); thus,
the physics-based hydrologic model via calculation of the
differential equations is tolerable in a floodplain inundation
simulation but impractical in the urban flooding inundation
modeling and emergency management at present (Versini et
al., 2010).
A variety of measures have been developed for improving
the model performance, including grid coarsening (Yu and
Lane, 2006a), parallelization (Lamb et al., 2009; Sanders et
al., 2010; Yu, 2010), adaptive grid-based methods (Hunter
et al., 2005a; Wang and Liang, 2011), complexity-reduced
models (Liu and Pender, 2010) and simplified governing
equations (Bates et al., 2010). However, the loss of infor-
mation with low resolution in grid coarsening method often
leads to less accurate results, thus a subgrid treatment (Yu,
2010; Yu and Lane, 2006b) is developed to regain necessary
information. Although an unstructured mesh method can ef-
fectively reduce the computing burden among these methods
and has the potential to describe surface features, the pre-
processing of model setup data is complex, especially in an
urban area (Chen et al., 2012). Therefore, the requirements of
these methods do not fully meet the need of city emergency
management (Zhang and Pan, 2014). Accordingly, rapid and
simplified flood inundation models (RFIM) have appeared to
be common and straightforward for simulating flood inun-
dation recently, such as RFIM (Krupka et al., 2007), rapid
flood spreading model (Lhomme et al., 2008), urban inunda-
tion models based on geographic information system (GIS)
(Chen et al., 2009) and flood-connected domain calculation
(Zhang et al., 2014). Although these models have the advan-
tages of computing efficiency and robustness, they only sim-
ulate the maximum inundation extent and fail to provide the
flow and inundation processes.
Cellular automaton (CA) provides an alternative solution
by simplifying the physics-based 2-D models, with grid-
based simulation frame and allowing both time varying and
geo-algebraic solution of spatial dynamics (Parsons and Fon-
stad, 2007). Instead of solving the differential equations it-
eratively within the simulation domain, the CA model de-
scribes a system on the basis of the local interactions of their
constituent parts through incorporating gravitational rules to
represent surface-flow runoff (Burks, 1970; Di Gregorio and
Serra, 1999; Wolfram, 1984). Furthermore, CA is naturally
implementable through parallel computing, allowing for effi-
cient simulations. All these characters of CA models have the
tacit accordance with the requirements of city storm-water
and emergency management. While it is a sensible choice
to only use the gravitational term of the 2-D shallow wa-
ter equations for urban emergency management, it should be
noted that the algorithms in CA models do not solve all terms
in the equation necessary to replicate the full dynamics.
Since the storage cell approach was proposed by Zanobetti
et al. (1970) to predict floodplain inundation, many CA
models have become available in recent years for simu-
lating braided rivers (Parsons and Fonstad, 2007; Thomas
and Nicholas, 2002), river channels (Coulthard et al., 2002),
floodplain rivers (LISFLOOD-FP) (Bates and DeRoo, 2000)
and urban environments (Fewtrell et al., 2008, 2011). These
methods discretized flood plains into fine regular grids,
among which the fluxes of water are calculated according
to many uniform flow formulae, mostly simplified from the
Saint-Venant or Manning equations (Bates et al., 2010). For
instance, the LISFLOOD-FP is one of the most popular mod-
els and has been tested and improved by various schol-
ars, including comparing with other approaches (Horritt and
Bates, 2001, 2002), calibrating using different data (Hunter
et al., 2005a), proposing the adaptive time step (Hunter et al.,
2005b) and evaluating in an urban area (Fewtrell et al., 2008,
2011; Sampson et al., 2012). Bates (2010) presented a rea-
sonable approach which considered only the inertial term for
low computational cost. Thus, in some circumstances such
as urban emergency management, it is pragmatic to simplify
the flow-governing terms.
Therefore, this study aims to (i) develop an effective CA
model for efficient simulation of storm-water runoff for city
storm-water and emergency management by considering de-
tailed urban features with little preprocessing on commonly
available urban geographic data; and (ii) assess the feasibil-
ity and effectiveness of the model by using in situ observed
street water depth. The study area is a small independent
catchment in the downtown of Panyu district, Guangzhou,
China. Development of the model is described in Sect. 2.
Model calibration and validation are presented in Sect. 3. Re-
sults and discussion are elaborated in Sect. 4, followed by
conclusions in Sect. 5.
2 Model development
2.1 Model description
According to the underlying theory (Wolfram, 1985a, b,
1986a, b) of CA models, this study develops an urban surface
runoff simulation model. The model considers four parame-
ters:
Nat. Hazards Earth Syst. Sci., 15, 381–391, 2015 www.nat-hazards-earth-syst-sci.net/15/381/2015/

L. Liu et al.: Developing an effective 2-D urban flood inundation model for city emergency management 383
CA=< L,N,P,T > . (1)
L is the set of regular cells used to discretize the study area.
The model employs a 2-D lattice of regular cells to maintain
consistency with digital elevation models (DEM) in space
and to integrate with GIS software. The Von Neumann neigh-
borhood (Von Neumann, 1966) N is employed, allowing wa-
ter to be distributed to any of the four cells orthogonally sur-
rounding a central cell at each iteration. At a specific time,
each cell can exchange flow with all the four surrounding
cells, depending on the water surface elevation. Exchanges
between the central cell and the diagonal cells require two
consecutive iterations of the Von Neumann neighborhood ex-
changes.
P is the finite set of CA model parameters (Table 1) for de-
scribing the transition functions and the cell states. While cell
size, elevation and infiltration threshold do not change, other
state variables of the cell may be updated throughout the sim-
ulation. For instance, water is transmitted from the central
cell to its neighbors at each iteration, resulting in a corre-
sponding change of its water depth. T represents the tran-
sition rules that determine the flow routing from one cell to
another. During each iteration, precipitation, infiltration and
discharge to storm sewer inlets are considered within each
cell. The amount and timing of flow routing from one cell to
its neighbors are elaborated in Sect. 2.4.
During an urban storm event, surface water flow dynamics
consist of three major processes: infiltration to pervious sur-
face, discharge to storm sewer system and surface runoff of
excess water. Evapotranspiration can be neglected due to the
short duration and atmospheric conditions of a storm event.
Sections below present the individual transition functions as-
sociated with each process.
2.2 Infiltration
The process of infiltration is represented by a spatially vary-
ing infiltration rate for each pixel, limited by an infiltra-
tion threshold beyond which soil saturation is assumed to be
reached and infiltration is no longer allowed. The infiltration
threshold describes the maximum amount of surface water
loss to infiltration. Different land-cover types have different
infiltration rates and thresholds. Because the percentage of
pervious land is very small (only 16.6 % of the study area)
and the duration of the storm is relatively short, the follow-
ing simple function is used to present the infiltration in the
model for more efficient calibration. Once the cumulative in-
filtration amount is equal to or greater than the infiltration
threshold, no further infiltration will occur:
infiltrationa(t)= Ra × t, (2)
where Ra is the infiltration rate of cells of land cover a and
t is the CA time step for iteration.
Table 1. Parameters of the CA model.
Parameters Description
Side Size of the CA cell
t CA time step
El Elevation
Pre Precipitation
Wd Water depth
Ra Infiltration rate
It Infiltration threshold
Rc Roughness coefficient
D Drainage rate of inlets
2.3 Mass loss to storm sewer system
In addition to infiltration, discharge to a storm sewer sys-
tem needs to be considered during an urban rainstorm event.
Inlets are typically presented along the road edges in an ur-
ban environment, through which water can discharge to ur-
ban storm sewerage systems. In this CA model, storm sewer
inlets are explicitly represented by individual pixels. Instead
of infiltration, the pixel that contains an inlet has a sink term
associated with the mass loss to the underlying storm sewer
system. Storm sewer surcharge is not considered in the model
and it is assumed that the storm sewer system fully functions
during a storm event. The rate of mass loss at inlets depends
on a number of factors, including the local topography, storm
sewer capacity and inlet configuration. In this model, the rate
of discharge at the inlets to storm sewer system is determined
by a method by Sun (1999) (Eqs. 3 and 4):
Q= w ·C√
2gh · k, (3)
D =Q/Ar, (4)
where Q is the inlet discharge flow (m3 s−1), w is the area
of inlet (m2), C is orifice coefficient, g is gravitational accel-
eration, h is allowed storage of water head of an inlet, k is
orifice obstruction coefficient and Ar is the area of a cell; and
discharge(t)=D× t, (5)
where D is the discharge rate of an inlet and t is the CA time
step.
2.4 Surface-flow routing
After considering infiltration and inlet discharge, the rest of
the storm water can form surface flow, often termed as sur-
face runoff. An empirically derived hydrological rule known
as the minimization algorithm is used in the model to rep-
resent surface runoff. This empirical method is proposed by
Di Gregorio and Serra (1999) in the SCIARA model to sim-
ulate lava flow. D’Ambrosio et al. (2001) employed a simi-
lar method in the SCAVATU model and specified three inter-
nal transformations and two external interactions to simulate
www.nat-hazards-earth-syst-sci.net/15/381/2015/ Nat. Hazards Earth Syst. Sci., 15, 381–391, 2015

384 L. Liu et al.: Developing an effective 2-D urban flood inundation model for city emergency management
Figure 1. Example of minimization algorithm (Di Gregorio and
Serra, 1999).
the behavior of soil erosion by water. Avolio et al. (2003)
extended this method and proposed a new solution to over-
come the problem of constant velocity and lack of precision.
However, the specific time step is not given in the original
algorithms of the three aforementioned publications. In this
paper, the Manning equation is combined with the minimiza-
tion algorithm to calculate the amount of water routed from
a central cell to its orthogonal neighboring cells in the CA
model, which is an improvement of the original methods.
In the CA model, the distribution of water from a central
cell to its neighboring cells is based on an algorithm that aims
to minimize the water surface elevation difference between
cells. The minimization algorithm is given below.
a. weli denotes the water surface elevation of the central
cell i= 0 and its neighboring cells (i= 1, 2, 3, 4). The
average water surface elevation of the cells is computed
by Eq. (6):
av1 =
(wel0+
∑i∈A
weli
)m
, (6)
where m is the total cell count of the central cell plus the
neighboring cells involved in water redistribution – 5 in
step (a) – and term A refers to the set of neighboring
cells that receive water from the central cell.
b. Eliminate cells with weli > av1.
c. Calculate the average water elevation of the remaining
cells using Eq. (6) and further eliminate cells where
weli > av1.
d. Repeat step (c) until no further cells can be eliminated.
e. Partition the outflow from the central cell such that the
remaining neighboring cells have the same elevation as
the central cell.
This is illustrated in Fig. 1 using a set of cells with hypothet-
ical elevation values.
To determine the time step of the model iteration, Man-
ning’s equation is used to calculate the velocity for each
pixel, defined as a function of water depth (d), surface
slope (S) and roughness coefficient (n) (Eq. 7).
Figure 2. (a) Location of the catchment in Panyu, Guangzhou;
(b) the surface elevation DEM; (c) the components of this catch-
ment.
velocity=d2/3S1/2
n(7)
The time step is calculated for each pixel as the ratio between
cell size and velocity. The minimum time step among the
calculated values is used as a global time step so that stability
can be maintained in the simulation.
To summarize, the combination of the minimization algo-
rithm and Manning’s equation allows for the calculation of
the water elevation, the amount and direction of water ex-
change and time taken for the exchange. At each time step,
the model applies the CA rules to each cell in the follow-
ing order: (i) precipitation is added to cells according to the
length of the time step and precipitation rate; (ii) infiltration
or inlets discharge is subtracted to obtain the current water
depth in the cell; (iii) the velocity of each cell is calculated
according to Manning’s equation, the traverse time of each
cell is obtained and the minimum transverse time is chosen as
the CA iterative time step to prevent the water from crossing
a pixel in less than one time step; and (iv) the movable water
is distributed to its neighboring cells following the minimiza-
tion algorithm.
3 Case study and data availability
The model is tested in a 0.2 km2 urban catchment (Fig. 2), the
downtown of Panyu district, Guangzhou, China. While com-
mon flooding events in a natural watershed inundate large ar-
Nat. Hazards Earth Syst. Sci., 15, 381–391, 2015 www.nat-hazards-earth-syst-sci.net/15/381/2015/

L. Liu et al.: Developing an effective 2-D urban flood inundation model for city emergency management 385
Figure 3. Time series of precipitation (mm h−1) and observed water depth (cm) measured from the lowest point of the catchment during the
(a) 19 April and (b) 4 September 2012 events.
eas and last for hours and days, urban flooding events usually
occur in a small or even tiny subcatchment and on discrete
sites with lower elevation due to natural topology or civil
engineering projects. Most urban flooding events normally
last for tens of minutes. The test site is one of the frequently
flooded spots. It is located at a low section of a main avenue
in the downtown area, and the flooding often causes serious
traffic jam. There is a closed-circuit television (CCTV) cam-
era monitoring the site and a rain gauge nearby, thus pro-
viding good rainfall data and water inundation (depth and
volume) data on the street. Such data are critical for model
calibration.
The land-cover map of the catchment is obtained from
the local government, and the primary land-cover types are
grassland, building, road and concrete surfaces. Around 83 %
of the catchment surface is impervious. There are 96 indi-
vidual storm sewer inlets in the catchment. According to
Eqs. (3) and (4), the drainage rate of an inlet is calculated
as 4.6 mm s−1. All inlets have the same dimension (rectangle
of 0.21 m2), giving an orifice coefficient of 0.6 and obstruc-
tion coefficient of 0.67. Mark et al. (2004) suggested values
between 1 and 5 m as optimal grid size to capture the main
urban topographic features. The CA model is established us-
ing 5 m DEM grids. The elevation of buildings is universally
raised by 10 m above the ground for the simulation purpose.
Since the resolution and accuracy of the DEM are suffi-
ciently high, water runoff over the roads is explicitly con-
sidered in the simulation, including eventual lateral water in-
flows coming into the study area through the streets. As the
study area is an independent catchment area, the only way for
water to flow out of the system is through the 96 individual
storm sewer inlets.
The model is calibrated by a storm event occurred on
19 April 2012 and validated by another storm on 4 Septem-
ber 2012. The first storm event lasted for 1.2 h and the peak
rainfall intensity reached 91 mm h−1. Precipitation hyeto-
graph of a 1 min interval is presented in Fig. 3. Street mon-
itoring CCTV videos are available at the outlet of the catch-
ment for both events. Time series of water depth is estimated
with uncertainties of ±4 cm based on the traffic separation
metal fences and other street marks visible in the videos
reasonably well. Peak depths are validated on-site after the
events by measuring the watermarks left on the metal fences.
Time series of the observed water depth are presented in
Fig. 3a and b, depicting the inundating process and provid-
ing critical data for model calibration and validation. No sur-
charge was observed during the flood.
4 Results and discussion
4.1 Model calibration and sensitivity analysis
Model calibration and sensitivity analysis are undertaken for
the 19 April 2012 event to obtain the optimal set of parameter
values for the study site. Roughness value and infiltration rate
are identified as the key parameters in the CA model. Given
that this is an urban site, four relatively low values of Man-
ning’s n are tested (0.01, 0.02, 0.03 and 0.04) for each of the
four land-cover types (grassland, building, road and concrete
surfaces), and two infiltration rates (5.8 and 11.7 mm h−1)
are tested for grassland (Rossman, L., 2004). A total of 512
(4× 4× 4× 4× 4× 2= 512) simulation runs are generated
in the calibration process.
Nine representative simulations are presented below to
elaborate the sensitivity analysis (Table 2). They are clas-
sified into four groups. The impermeable land and paved
roads account for 51.61 % of the total area. Simulations 1–
4 are used to analyze the impact of the roughness of con-
crete surface on model predictions. Around 31.82 % of the
study site is occupied by buildings. Roughness is varied in
simulations 1, 5, 6 and 7 to test its impact on flow routing.
Simulations 1 and 8 are used to test the impact of rough-
www.nat-hazards-earth-syst-sci.net/15/381/2015/ Nat. Hazards Earth Syst. Sci., 15, 381–391, 2015
386 L. Liu et al.: Developing an effective 2-D urban flood inundation model for city emergency management
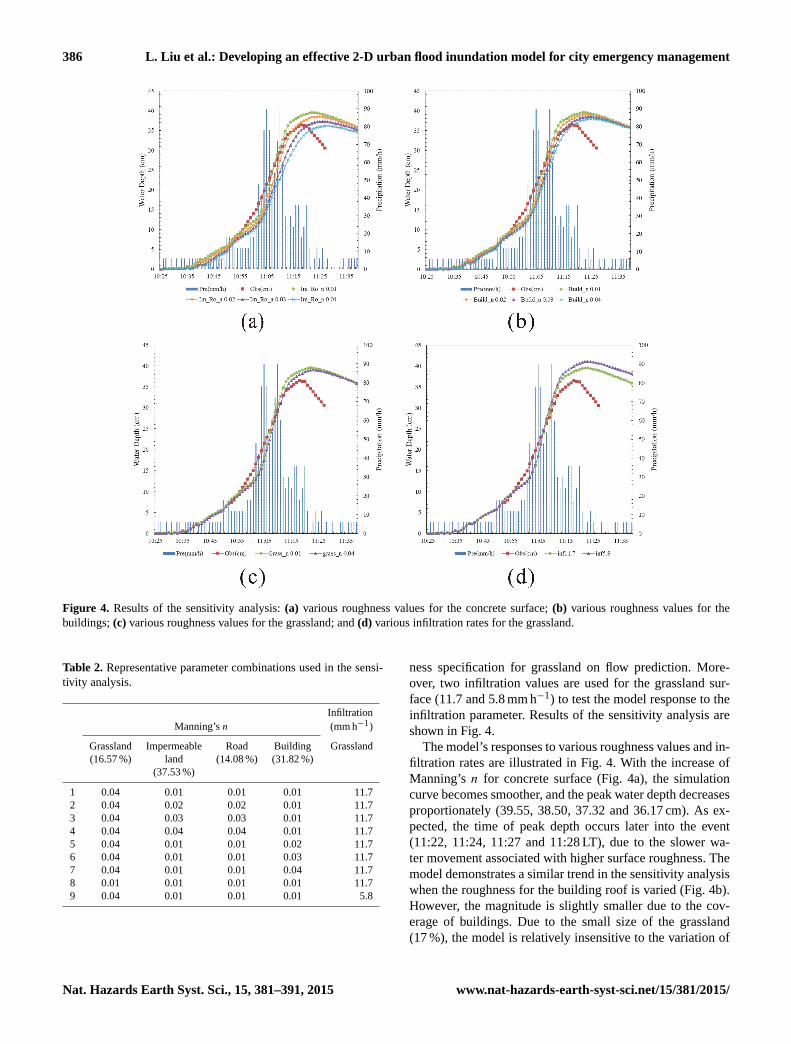
Figure 4. Results of the sensitivity analysis: (a) various roughness values for the concrete surface; (b) various roughness values for the
buildings; (c) various roughness values for the grassland; and (d) various infiltration rates for the grassland.
Table 2. Representative parameter combinations used in the sensi-
tivity analysis.
Infiltration
Manning’s n (mm h−1)
Grassland Impermeable Road Building Grassland
(16.57 %) land (14.08 %) (31.82 %)
(37.53 %)
1 0.04 0.01 0.01 0.01 11.7
2 0.04 0.02 0.02 0.01 11.7
3 0.04 0.03 0.03 0.01 11.7
4 0.04 0.04 0.04 0.01 11.7
5 0.04 0.01 0.01 0.02 11.7
6 0.04 0.01 0.01 0.03 11.7
7 0.04 0.01 0.01 0.04 11.7
8 0.01 0.01 0.01 0.01 11.7
9 0.04 0.01 0.01 0.01 5.8
ness specification for grassland on flow prediction. More-
over, two infiltration values are used for the grassland sur-
face (11.7 and 5.8 mm h−1) to test the model response to the
infiltration parameter. Results of the sensitivity analysis are
shown in Fig. 4.
The model’s responses to various roughness values and in-
filtration rates are illustrated in Fig. 4. With the increase of
Manning’s n for concrete surface (Fig. 4a), the simulation
curve becomes smoother, and the peak water depth decreases
proportionately (39.55, 38.50, 37.32 and 36.17 cm). As ex-
pected, the time of peak depth occurs later into the event
(11:22, 11:24, 11:27 and 11:28 LT), due to the slower wa-
ter movement associated with higher surface roughness. The
model demonstrates a similar trend in the sensitivity analysis
when the roughness for the building roof is varied (Fig. 4b).
However, the magnitude is slightly smaller due to the cov-
erage of buildings. Due to the small size of the grassland
(17 %), the model is relatively insensitive to the variation of
Nat. Hazards Earth Syst. Sci., 15, 381–391, 2015 www.nat-hazards-earth-syst-sci.net/15/381/2015/

L. Liu et al.: Developing an effective 2-D urban flood inundation model for city emergency management 387
the roughness parameter (Fig. 4c). When the infiltration rate
of grassland is halved from 11.7 to 5.8 mm h−1, the peak wa-
ter depth only increases by 1.6 cm and the peak depth timing
is delayed by 1 min, indicating the model is relatively insen-
sitive to the change of infiltration rate as well for the small
grassland area.
Root mean square error (RMSE) is calculated by compar-
ing the model-predicted depth with the observed depth at a
1 min interval using Eq. (7):
RMSE=
√√√√√ q∑i=1
(d
pred
i − drefi
)2
q, (8)
where, for each simulation, q is number of the paired val-
ues and dpred
i and drefi are the predicted and reference wa-
ter depths, respectively. The optimal set of parameters with
a Manning n value of 0.04 (grassland), 0.01 (impermeable
land and road) and 0.02 (building) and an infiltration rate
of 11.7 mm h−1 is found to produce the lowest RMSE value
(3.30 cm).
A series of maps (Fig. 5) is created to demonstrate the
change of flooded area during the inundation process. At the
beginning of the event (Fig. 5a, 10:50 LT), shallow water ap-
peared but was constrained to the road surface. As the storm
continued, water started to inundate the lower parts of the
catchment (Fig. 5b and c, 10:58–11:06 LT). Thereafter, water
started to accumulate around the outlet and expanded to the
largest areas with maximum depth in the catchment (Fig. 5d
and e, 11:14–11:22 LT). At the end of the storm event, the in-
undated water began to decline (Fig. 5f, 11:30 LT). The over-
all simulated pattern confirms the pattern observed from the
CCTV video.
4.2 Model validation
To avoid the potential problem of model overfitting, the op-
timal set of parameters identified in the model calibration
and sensitivity analysis for the storm event on 19 April 2012
(Fig. 6a) is used to simulate the inundation processes of an-
other storm event on 4 September 2012 (Fig. 6b).
The hydrograph of the inundation processes simulated by
the established CA model for both storm events are illus-
trated in Fig. 6. The CCTV videos obtained from the local
government only cover 35 and 13 min for the two events. The
overall patterns of water depth predicted in the two simula-
tions agree well with the observations. For the 19 April event,
the model prediction for the rising limb of the event agrees
well with the observation. The model-predicted peak water
depth is about 5 cm higher than the observed value from the
first storm on 19 April and is in agreement with the observed
values from the second storm on 4 September. It is likely that
part of the difference could be attributed to the intrinsic error
of the DEM model.
Figure 5. Process of flood inundation during the 19 April 2012
event.
In terms of timing, the predicted maximum water depth
is reached 4 min later than the observation for the first storm,
and the falling limb is much slower than the observed pattern.
For the second storm, the timing of the peak value is almost
identical between the observed and simulated results.
Overall, the Pearson correlation coefficient between model
prediction and observation of the first storm is 0.98, with
the two-tailed p value less than 0.01. Moreover, the Nash–
Sutcliffe model efficiency (E) coefficient (Nash and Sut-
cliffe, 1970) is calculated to assess the predictability of the
CA model and evaluate how consistent the predicted values
match the observed. The Nash–Sutcliffe efficiency is calcu-
lated to be 0.88, indicting a good level of temporal agree-
ment. For the second storm event (Fig. 6b), the Pearson cor-
relation coefficient is 0.95 (p= 0.01) and the E is 0.82, also
underscoring a good agreement between the predicted and
observed depth values in the time series.
The results above show that the model works well for both
storm events. Therefore, the model is validated and can be
applied to other storm events.
www.nat-hazards-earth-syst-sci.net/15/381/2015/ Nat. Hazards Earth Syst. Sci., 15, 381–391, 2015

388 L. Liu et al.: Developing an effective 2-D urban flood inundation model for city emergency management
Figure 6. Time series of observed and simulated water depth (cm), measured from the lowest point of the catchment, during the (a) 19 April
and (b) 4 September 2012 events.
Figure 7. (a) Locations of selected grids and (b, c, d) temporal variation of water depth simulated by FloodMap and CA model at three
selected grids.
4.3 Model comparison
To test the effectiveness of this CA model, a 2-D distributed
model, the FloodMap (Yu, 2010; Yu and Lane, 2006a, b),
is used to simulate the same storm event on 19 April 2012
in the study catchment. Three CA grids (Fig. 7a) were care-
fully selected to compare the inundating process simulated
by both models. The three grids are located at the discharge
point of this catchment (P1), on the flow routing paths along
the street (P2) and on the concrete surface between build-
Nat. Hazards Earth Syst. Sci., 15, 381–391, 2015 www.nat-hazards-earth-syst-sci.net/15/381/2015/

L. Liu et al.: Developing an effective 2-D urban flood inundation model for city emergency management 389
ings (P3). The overall results simulated by both models show
very good agreement (RMSEs= 0.43, 0.1, 0.02 cm, respec-
tively). Since the two models have different discharge mech-
anisms, the simulated results in Fig. 7 do not consider the
discharge of sewer network in order to eliminate its influence
on the inundation process.
For point 1, the inundated water depths by CA are
marginally higher than those of FloodMap before the peak
depth of CA is reached but lower toward the end of the simu-
lation. The inundated water depths at point 2 and 3 are much
lower than point 1 due to the difference of their location in the
catchment, while both models give consistent simulations.
According to the above comparison, the CA model is capa-
ble of simulating the urban inundation process with similar
performance to a common physically based 2-D distributed
model.
4.4 Discussion
Although the simulated water depth on 19 April 2012 was
in agreement with the observations in the rising limb, it fell
slower than the real situation in the falling limb. This is likely
related to the constant inlet discharge rate used in the CA
model. Thus, a dynamic discharge rate varied with water
depth could be a good choice to improve the agreement in
the falling limb. The relationship between discharge rate and
water depth is nonlinear, and we are collecting more observa-
tions to derive a reliable curve that can be used in the future.
In addition, DEM accuracy and grid size may have im-
pacts on inundation simulation, especially on the catchment
boundary, routing path and inundated water volume/depth.
The optimal resolution of DEM for explicitly expressed to-
pography in the CA model can be tested with various res-
olutions to improve the accuracy of the model. Currently,
the finest available DEM grid size is 5 m, and we are imple-
menting an airborne LiDAR (Light Detection And Ranging)
data collection that can obtain finer DEM grid size of 0.5 m
with higher accuracy of elevation in a much larger area of
20 km2. Thus, we can test the effects of different DEM grid
size on the performance of the CA model and its computing
efficiency.
5 Conclusions
This study develops an effective and efficient CA model to
simulate storm-water runoff and the flood inundation process
in an urban setting for city emergency management. This
CA model is established primarily by using a DEM data set
that considers buildings being elevated, plus the detailed ur-
ban land cover and inlet distribution along the sewerage pipe
lines, while assuming that the pipeline can drain all the inflow
from the inlets and ignore their possible surcharge. These two
assumptions are confirmed as reasonable in the field observa-
tions. The model is calibrated and validated by the two storm
events on 19 April and 4 September 2012, and simulated wa-
ter depths are comparable to those observed by CCTV videos
and a physically based 2-D model (FloodMap). These results
suggest that the CA model is capable of generating reliable
predictions to the urban storm runoff and the inundation pro-
cesses, which can provide useful information for city emer-
gency management.
This CA model is tested at a grid size of 5 m in a small
urban catchment for the purpose of quick model setup and
validation. At such a small catchment, the computing time
on Java platform for simulating the 1.2 h storm event on
19 April 2012 is 35 s (Intel i5 CPU 3.1 GHz, 4 GB of RAM,
NO parallelization). This CA model is so speed efficient pre-
cisely because it ignores important flow governing terms;
nonetheless, it is pragmatic to only use the gravitational term
of the 2-D shallow water equations for urban emergency
management.
Future studies will examine the use of higher-resolution
DEM, such as LiDAR-derived elevation data, for more accu-
rate simulation of urban flooding. Other forms of CA models
will be explored for possible improvement in efficiency. Fur-
thermore, the model will be tested in a parallel computing
environment for large metropolitan areas for the purpose of
citywide storm water and emergency management.
Acknowledgements. This work was supported by the National
High Technology Research and Development Program of
China (863 Program) (no. 2012AA121402, 2012AA121403),
the National Basic Research Program of China (973 Program)
(no. 2012CB955903) Foundations, the National Natural Science
Foundation of China (no. 41301419), and Fundamental Research
Funds for the Central Universities (no. 14gpy09). An anonymous
reviewer is also acknowledged.
Edited by: B. Merz
Reviewed by: G. J.-P. Schumann and one anonymous referee
References
Avolio, M. V., Crisci, G. M., D’Ambrosio, D., Di Gregorio, S.,
Iovine, G., Rongo, R., and Spataro, W.: An extended notion of
Cellular Automata for surface flows modelling, WSEAS Trans.
Comput., 2, 1080–1085, 2003.
Bates, P. D. and De Roo, A. P. J.: A simple raster-based model for
flood inundation simulation, J. Hydrol., 236, 54–77, 2000.
Bates, P. D., Horritt, M. S., and Fewtrell, T. J.: A simple inertial
formulation of the shallow water equations for efficient two-
dimensional flood inundation modelling, J. Hydrol., 387, 33–45,
2010.
Bidur Ghimire, A. S. C. M.: Formulation of a fast 2-D urban pluvial
flood model using a cellular automata approach, J. Hydroinform.,
15, 676–686, 2013.
Burks, A. W.: Essays on Cellular Automata, University of Illinois
Press, Paris, 1970.
www.nat-hazards-earth-syst-sci.net/15/381/2015/ Nat. Hazards Earth Syst. Sci., 15, 381–391, 2015

390 L. Liu et al.: Developing an effective 2-D urban flood inundation model for city emergency management
Chang, L.-C., Shen, H.-Y., Wang, Y.-F., Huang, J.-Y., and Lin, Y.-T.:
Clustering-based hybrid inundation model for forecasting flood
inundation depths, J. Hydrol., 385, 257–268, 2010.
Chen, A. S., Evans, B., Djordjevi, S., and Savi, D. A.: Multi-layered
coarse grid modelling in 2D urban flood simulations, J. Hydrol.,
470/471, 1–11, 2012.
Chen, J. and Adams, B. J.: Development of analytical models for
estimation of urban stormwater runoff, J. Hydrol., 336, 458–469,
2007.
Chen, J., Hill, A. A., and Urbano, L. D.: A GIS-based model for
urban flood inundation, J. Hydrol., 373, 184–192, 2009.
Coulthard, T. J., Macklin, M. G., and Kirkby, M. J.: A cellular
model of Holocene upland river basin and alluvial fan evolution,
Earth. Surf. Proc. Land., 27, 269–288, 2002.
D’Ambrosio, D., Di Gregorio, S., Gabriele, S., and Gaudio, R.: A
Cellular Automata model for soil erosion by water, Phys. Chem.
Earth B, 26, 33–39, 2001.
Di Gregorio, S. and Serra, R.: An empirical method for modelling
and simulating some complex macroscopic phenomena by cel-
lular automata, Future Generation Computer Systems, 16, 259–
271, 1999.
Dunn, G., Harris, L., Cook, C., and Prystajecky, N.: A comparative
analysis of current microbial water quality risk assessment and
management practices in British Columbia and Ontario, Canada,
Sci. Total. Environ., 468/469, 544–552, 2014.
Fewtrell, T. J., Bates, P. D., Horritt, M., and Hunter, N. M.: Evalu-
ating the effect of scale in flood inundation modelling in urban
environments, Hydrol. Process., 22, 5107–5118, 2008.
Fewtrell, T. J., Duncan, A., Sampson, C. C., Neal, J. C., and Bates, P.
D.: Benchmarking urban flood models of varying complexity and
scale using high resolution terrestrial LiDAR data, Phys. Chem.
Earth, 36, 281–291, 2011.
Gilbert, J. K. and Clausen, J. C.: Stormwater runoff quality and
quantity from asphalt, paver, and crushed stone driveways in
Connecticut, Water. Res., 40, 826–832, 2006.
He, J., Valeo, C., Chu, A., and Neumann, N. F.: Prediction of event-
based stormwater runoff quantity and quality by ANNs devel-
oped using PMI-based input selection, J. Hydrol., 400, 10–23,
2011.
Horritt, M. S. and Bates, P. D.: Predicting floodplain inundation:
Raster-based modelling versus the finite-element approach, Hy-
drol. Process., 15, 825–842, 2001.
Horritt, M. S. and Bates, P. D.: Evaluation of 1D and 2D numerical
models for predicting river flood inundation, J. Hydrol., 268, 87–
99, 2002.
Hunter, N. M., Bates, P. D., Horritt, M. S., De Roo, A. P. J., and
Werner, M. G. F.: Utility of different data types for calibrat-
ing flood inundation models within a GLUE framework, Hy-
drol. Earth Syst. Sci., 9, 412–430, doi:10.5194/hess-9-412-2005,
2005a.
Hunter, N. M., Horritt, M. S., Bates, P. D., Wilson, M. D., and
Werner, M. G. F.: An adaptive time step solution for raster-based
storage cell modelling of floodplain inundation, Adv. Water. Re-
sour., 28, 975–991, 2005b.
Krupka, M., Pender, G., Wallis, S., Sayers, P. B., and Mulet-Marti,
J.: A rapid flood inundation model, Progress of the Congress-
International Association for Hydraulic Research, Venice, p. 28,
2007.
Kubal, C., Haase, D., Meyer, V., and Scheuer, S.: Integrated
urban flood risk assessment – adapting a multicriteria ap-
proach to a city, Nat. Hazards Earth Syst. Sci., 9, 1881–1895,
doi:10.5194/nhess-9-1881-2009, 2009.
Lamb, R., Crossley, M., and Waller, S.: A fast two-dimensional
floodplain inundation model, Proc. Ice-Water Manage., 162,
363–370, 2009.
Leandro, J., Chen, A. S., and Schumann, A.: A 2D parallel diffusive
wave model for floodplain inundation with variable time step (P-
DWave), J. Hydrol., 517, 250–259, 2014.
Lhomme, J., Sayers, P. B., Gouldby, B. P., Samuels, P. G., Wills,
M., and Mulet-Marti, J.: Recent development and applica-
tion of a rapid flood spreading method, in: FLOODrisk 2008,
30 September–2 October 2008, Keble College, Oxford, UK,
2008.
Liu, Y. and Pender, G.: A new rapid flood inundation model, pro-
ceedings of the first IAHR European Congress, Edinburgh, 4–6,
2010.
Mahmoudi, H., Renn, O., Vanclay, F., Hoffmann, V., and Karami,
E.: A framework for combining social impact assessment and
risk assessment, Environ. Impact. Asses., 43, 1–8, 2013.
Mark, O., Weesakul, S., Apirumanekul, C., Aroonnet, S. B., and
Djordjevi, S.: Potential and limitations of 1D modelling of urban
flooding, J. Hydrol., 299, 284–299, 2004.
Nash, J. and Sutcliffe, J.: River flow forecasting through conceptual
models part I – a discussion of principles, J. Hydrol., 10, 282–
290, 1970.
Neal, J. C., Bates, P. D., Fewtrell, T. J., Hunter, N. M., Wilson, M.
D., and Horritt, M. S.: Distributed whole city water level mea-
surements from the Carlisle 2005 urban flood event and compar-
ison with hydraulic model simulations, J. Hydrol., 368, 42–55,
2009.
Parsons, J. A. and Fonstad, M. A.: cellular automata model of sur-
face water, Hydrol. Process., 2189–2195, 2007.
Rossman, L.: Storm Water Management Model (SWMM ver-
sion 5.0) user’s manual, United States Environment Protection
Agency, Cincinnati, Ohio, 2004.
Sampson, C. C., Fewtrell, T. J., Duncan, A., Shaad, K., Horritt, M.
S., and Bates, P. D.: Use of terrestrial laser scanning data to drive
decimetric resolution urban inundation models, Adv. Water. Re-
sour., 41, 1–17, 2012.
Sanders, B. F., Schubert, J. E., and Detwiler, R. L.: ParBreZo: A par-
allel, unstructured grid, Godunov-type, shallow-water code for
high-resolution flood inundation modeling at the regional scale,
Adv. Water. Resour., 33, 1456–1467, 2010.
Schumann, G. J. P., Neal, J. C., Mason, D. C., and Bates, P. D.:
The accuracy of sequential aerial photography and SAR data for
observing urban flood dynamics, a case study of the UK summer
2007 floods, Remote. Sens. Environ., 115, 2536–2546, 2011.
Sun, X.: Drainage engineering (I), China Building Industry Press,
Beijing, 1999.
Taubenböck, H., Wurm, M., Netzband, M., Zwenzner, H., Roth,
A., Rahman, A., and Dech, S.: Flood risks in urbanized ar-
eas – multi-sensoral approaches using remotely sensed data for
risk assessment, Nat. Hazards Earth Syst. Sci., 11, 431–444,
doi:10.5194/nhess-11-431-2011, 2011.
Thomas, R. and Nicholas, A. P.: Simulation of braided river flow
using a new cellular routing scheme, Geomorphology, 43, 179–
195, 2002.
Nat. Hazards Earth Syst. Sci., 15, 381–391, 2015 www.nat-hazards-earth-syst-sci.net/15/381/2015/

L. Liu et al.: Developing an effective 2-D urban flood inundation model for city emergency management 391
Tsakiris, G.: Flood risk assessment: concepts, modelling, ap-
plications, Nat. Hazards Earth Syst. Sci., 14, 1361–1369,
doi:10.5194/nhess-14-1361-2014, 2014.
Versini, P.-A., Gaume, E., and Andrieu, H.: Application of a dis-
tributed hydrological model to the design of a road inundation
warning system for flash flood prone areas, Nat. Hazards Earth
Syst. Sci., 10, 805–817, doi:10.5194/nhess-10-805-2010, 2010.
Von Neumann, J.: Theory of Self-Reproducing Automata, Univer-
sity of Illinois Press, Champaign, Illinois, 1966.
Wang, J. P. and Liang, Q.: Testing a new adaptive grid-based shal-
low flow model for different types of flood simulations, J. Flood
Risk Manage., 4, 96–103, 2011.
Wolfram, S.: Computation theory of cellular automata, Commun.
Math. Phys., 96, 15–57, 1984.
Wolfram, S.: Origins of randomness in physical systems, Phys. Rev.
Lett., 55, 449–452, 1985a.
Wolfram, S.: Undecidability and intractability in theoretical
physics, Phys. Rev. Lett., 54, 735–738, 1985b.
Wolfram, S.: Random sequence generation by cellular automata,
Adv. Appl. Math., 7, 123–169, 1986a.
Wolfram, S.: Cellular automaton fluids 1: Basic theory, J. Stat.
Phys., 45, 471–526, 1986b.
Yu, D.: Parallelization of a two-dimensional flood inundation model
based on domain decomposition, Environ. Model. Softw., 25,
935–945, 2010.
Yu, D. and Lane, S. N.: Urban fluvial flood modelling using a
two-dimensional diffusion-wave treatment, part 2: development
of a sub-grid-scale treatment, Hydrol. Process., 20, 1567–1583,
2006a.
Yu, D. and Lane, S. N.: Urban fluvial flood modelling using a two-
dimensional diffusion-wave treatment, part 1: mesh resolution
effects, Hydrol. Process., 20, 1541–1565, 2006b.
Zanobetti, D., Lorgeré, H., Preissman, A., and Cunge, J. A.:
Mekong delta mathematical model program construction, J. Wa-
terways Harbors Div., 96, 181–199, 1970.
Zhang, S. and Pan, B.: An urban storm-inundation simulation
method based on GIS, J. Hydrol., 517, 260–268, 2014.
Zhang, S., Wang, T., and Zhao, B.: Calculation and visualization
of flood inundation based on a topographic triangle network, J.
Hydrol., 509, 406–415, 2014.
www.nat-hazards-earth-syst-sci.net/15/381/2015/ Nat. Hazards Earth Syst. Sci., 15, 381–391, 2015