Embed Size (px)
Citation preview

University of Lethbridge Research Repository
OPUS http://opus.uleth.ca
Theses & Projects Faculty of Management Projects (Master's)
2006
Developing a strategic cost
management model : combininig the
balanced scorecard and activity-based
costing in the context of diabetes education
Venkatramanan, Atulya
Lethbridge, Alta. : University of Lethbridge, Faculty of Management, 2006
http://hdl.handle.net/10133/582
Downloaded from University of Lethbridge Research Repository, OPUS
brought to you by COREView metadata, citation and similar papers at core.ac.uk
provided by OPUS: Open Uleth Scholarship - University of Lethbridge Research Repository

DEVELOPING A STRATEGIC COST MANAGEMENT MODEL:
COMBINING THE BALANCED SCORECARD AND ACTIVITY-BASED
COSTING IN THE CONTEXT OF DIABETES EDUCATION
ATULYA VENKATRAMANAN Bachelor of Commerce
Mumbai University, Mumbai, India
A Research Project Submitted to the School of Graduate Studies
of the University of Lethbridge in Partial Fulfillment of the
Requirements for the Degree
MASTER OF SCIENCE IN MANAGEMENT
Faculty of Management University of Lethbridge
LETHBRIDGE, ALBERTA, CANADA
© Atulya Venkatramanan, 2006

ii

Abstract
The study presents the development of a strategic cost management model that combines
activity-based costing (ABC) with principles of the balanced scorecard (BSC). The purpose
of the combined ABC/BSC model is to provide cost information that could be used to
evaluate strategy implementation, monitor premises underlying strategy that may need to be
revised, and provide a strategic perspective to operational decisions. While ABC provides
activity-specific cost information, the BSC framework of different performance perspectives
(or activity dimensions) provides structure to data collection and organization, and facilitates
strategic analysis. The model is applied in the healthcare context of a diabetes client
education program, and the study includes a list of activities, activity drivers, and cost drivers
for Type-2 diabetes education. It also provides a summary of costs per client category and
proportion of resources consumed by different activity dimensions for a specific program.
iii

Acknowledgements
To Dr. Angela Downey and Dr. Helen Kelley – Thank you for being helpful and
supportive throughout the process of this study.
To my external examiner, Dr. Raili Pollanen – I am grateful to you for taking the
time to provide fresh perspective and insightful comments.
To Dr John Usher – Thank you for your time and participation in the Examining
Committee.
To the staff at the RHA that participated in the study – My study wouldn’t have been
possible without your co-operation and contribution. You shared your time though you had
none to spare, and I thank you for that.
To my cohort – You made it easy and fun, and I cannot be appreciative enough.
To my family – When the going gets tough, you keep me going.
iv

Table of Contents
Abstract ........................................................................................................................ iii Acknowledgements.......................................................................................................iv List of Tables ...............................................................................................................vii List of Figures ............................................................................................................ viii 1. Introduction............................................................................................................ 1
1.1 The need for a strategic cost management model.............................................................................1 1.2 The context of the study ...............................................................................................................3 1.3 Research question, objectives and significance.................................................................................4
2. Theoretical Foundation & Literature Review........................................................7 2.1 The benefits and limitations of using traditional ABC for strategy management.............................7
2.1.1 Operational advantages of ABC ............................................................................................ 7 2.1.2 Strategic benefits of ABC..................................................................................................... 10 2.1.3 Strategic limitations of ABC................................................................................................ 12
2.2 The strategic focus that BSC can provide to ABC ......................................................................13 2.2.1 About the Balanced scorecard............................................................................................... 13 2.2.2 Using the BSC with ABC for strategic cost management...................................................... 14 2.2.3 Modifying performance dimensions to match strategic objectives .............................................. 16
2.3 Potential uses of a combined model for strategic control ................................................................18 2.3.1 Evaluation of strategy implementation (Feedback role) ......................................................... 19 2.3.2 Monitoring the strategic environment (Feedforward role)........................................................ 19
2.4 Strategic management in healthcare ............................................................................................20 2.4.1 Internally focused long-range planning................................................................................... 20 2.4.2 Externally-oriented strategic planning................................................................................... 21 2.4.3 Sources of strategic information in healthcare organizations ................................................... 22
2.5 The importance of managing diabetes education costs strategically ................................................23 2.5.1 The role of costing in the healthcare sector ............................................................................. 23 2.5.2 The importance of diabetes patient education......................................................................... 25 2.5.3 Costs of patient education – A gap in the literature .............................................................. 28 2.5.4 Using ABC and BSC in healthcare .................................................................................... 29
3. Methodology.........................................................................................................30 3.1 Stage 1: Pre-interview ................................................................................................................32
3.1.1 Collecting preliminary information and creating an outline of the model ................................. 32 3.1.2 Developing a pre-interview form............................................................................................ 32 3.1.3 Validation of the data collection form by RHA managers .................................................... 33
3.2 Stage 2: Interview......................................................................................................................33 3.2.1 Collecting activity information and time estimates ................................................................. 33 3.2.2 Collecting cost and cost driver information............................................................................. 34
3.3 Stage 3: Post-interview...............................................................................................................34 4. Building the ABC/BSC model for diabetes education........................................35
4.1 Developing the model .................................................................................................................35 4.1.1 Identifying activity dimensions .............................................................................................. 35
v

4.1.2 Activity information collection .............................................................................................. 38 4.1.3 Defining cost objects and the processes they consume .............................................................. 39 4.1.4 Identifying drivers linking resources with processes................................................................. 42 4.1.5 Identifying activity drivers that link processes to cost objects ................................................... 44 4.1.6 An example for how process costs are computed .................................................................... 46
4.2 Using the ABC/BSC model for feedback control in diabetes education.......................................47 4.2.1 The costs of processes ............................................................................................................ 47 4.2.2 The costs of activity dimensions............................................................................................. 49 4.2.3 The costs of client categories .................................................................................................. 50
4.3 Using the model for feedforward control ......................................................................................51 4.3.1 Analyzing variations in time spent on processes .................................................................... 52 4.3.2 Analyzing variations in client numbers ................................................................................ 53
4.4 Results of sensitivity analysis......................................................................................................53 5. Contributions, Limitations, and Conclusion .......................................................55
5.1 Contributions of the study ..........................................................................................................55 5.1.1 Providing a tool for strategic cost management ....................................................................... 55 5.1.2 Providing strategic emphasis to operational decisions.............................................................. 55 5.1.3 Providing information about client education......................................................................... 56
5.2 Limitations of the study............................................................................................................56 5.3 Future research directions...........................................................................................................58 5.4 Final comments .........................................................................................................................60
References .................................................................................................................... 61 Appendixes
A. About the Balanced scorecard ....................................................................................................70 B. About diabetes ..........................................................................................................................72 C. About the RHA diabetes program ............................................................................................75 D. Data collection form for RHA staff ...........................................................................................77 E. Sample interview protocol for a clinician interview .......................................................................84 F. Study Assumptions ...................................................................................................................85 G. List of RHA education and support activities grouped into processes...........................................88 H. Resources, cost drivers and activity drivers at the RHA ..............................................................90 I. Results of sensitivity analysis......................................................................................................93
vi

List of Tables
3.1 Sources of information for ABC/BSC model development for diabetes education… 30
4.1 Linking processes to cost objects. . . . . . . . . . . . . . . . . . . . . . . . . . . . . . . . . . . . . . . . . . . . . . . . . . . . . . . . . . . . . . . . 41
4.2 Drivers linking resource costs to processes. . . . . . . . . . . . . . . . . . . . . . . . . . . . . . . . . . . . . . . . . . . . . . . . . . . . 43
4.3 Activity drivers linking process costs to cost objects. . . . . . . . . . . . . . . . . . . . . . . . . . . . . . . . . . . . . . . . . 44
4.4 Processes consumed by individual cost objects . . . . . . . . . . . . . . . . . . . . . . . . . . . . . . . . . . . . . . . . . . . . . . . 45
4.5 Proportional costs of RHA activity dimensions for Type-2 diabetes education. . . . . . . . 49
4.6 Costs of client category cost objects at RHA’s diabetes program.. . . . . . . . . . . . . . . . . . . . . . . . . 50
B1 Partial list of causes and common symptoms of diabetes. . . . . . . . . . . . . . . . . . . . . . . . . . . . . . . . . . . 73
B2 Predicted diabetes healthcare costs and prevalence in Canada: 2000 – 2016. . . . . . . . . . . . 74
vii

List of Figures
2.1 Difference between traditional and activity-based costing... . . . . . . . . . . . . . . . . . . . . . . . . . . . . . . . . 8
2.2 Generic representation of the ABC/BSC model.. . . . . . . . . . . . . . . . . . . . . . . . . . . . . . . . . . . . . . . . . . . . . 17
2.3 Possible healthcare cost management issues addressed by an ABC/BSC model.. . . . . . . 25
3.1 The process of customizing the ABC/BSC model to the RHA’s diabetes program.....31
4.1 Linking activity dimensions to strategic objectives of the RHA’s diabetes program.. . . 36
4.2 ABC-based processes arranged in BSC-based activity dimensions for the RHA’s diabetes program.. . . . . . . . . . . . . . . . . . . . . . . . . . . . . . . . . . . . . . . . . . . . . . . . . . . . . . . . . . . . . . . . . . . . . . . . . . . . . . . . . . . 39
A1 How the balanced scorecard translates strategy at the operational level. . . . . . . . . . . . . . . . . . 70
A2 An example of a balanced scorecard for a hospital. . . . . . . . . . . . . . . . . . . . . . . . . . . . . . . . . . . . . . . . . . . 71
viii

1. Introduction
1.1 The need for a strategic cost management model
Strategic decisions are aimed at maintaining an organization’s alignment with its
environment, while also managing internal interdependencies. Therefore, they involve
organizational goals as well as the allocation of resources needed to achieve these goals
(Snow & Hambrick, 1980). However, straightforward as this statement makes the strategic
process appear, there is no “right” way to arrive at optimum strategic decisions. Even in
organizations where strategy is well-formulated, translating strategic plans into reality
sometimes becomes a stumbling block (Spanyi, 2003).
Strategic cost management tools could help with this issue by providing important
information for strategy formulation, evaluation of strategy implementation, and highlighting
the practical limitations or problems with the adopted strategy (Shank & Govindarajan,
1993). Dent (1990) conducted a literature review and also identifies three possible avenues of
research into the interface between accounting systems and strategy – how accounting
system structure is adapted to strategy, the role of accounting systems in influencing the
strategic decision-making process, and the proactive role of accounting systems in strategic
change. Extant literature focuses on the role of cost management in creating strategic
competitive advantage (e.g., Kaplan & Cooper, 1998), but examples of cost information
being used to monitor strategy implementation and evaluate an existing strategy are not
found. The purpose of this study is to address this gap by combining the activity-based
costing and balanced scorecard frameworks into a combined strategic cost management
model. By doing so, positive attributes of both these powerful tools can be harnessed, and
used for strategic monitoring and strategy evaluation. The study differs from some existing
strategic cost management literature (e.g., Blocher, Chen, Cokins, & Lin, 2005; Cooper,
1

1996; and Shank & Govindarajan, 1993) by discussing strategy without limiting it to generic
competitive strategy such as cost leadership or product differentiation.
Activity-based costing (ABC) is a costing method that focuses on activities as
consumers of resources, and costs individual activities rather than allocating costs directly to
cost objects1. ABC uses different cost drivers to link costs to cost objects, thereby linking
costs to variety and complexity of products or services, and not just product volumes
(Kaplan & Cooper, 1998). For example, drivers of costs could be the number of machine
hours used, the number of square feet occupied in a building, or the number of machine set-
ups in a production process, and not just the volume of output. Such a multi-driver
approach has been shown to provide information that is more accurate and useful in
decision making about resource use and allocation, at various organizational levels (Kaplan
& Cooper, 1998; Plowman, 1998). Detailed activity and cost information could also have
strategic value if used to evaluate the contribution of a specific activity to strategy
achievement, and the cost of this contribution.
However, one of the limitations of ABC is that large amounts of complex activity
and cost driver data are collected during the process (Kaplan & Anderson, 2004), with no
framework to arrange them, no means of verifying that all important cost areas have been
included, and no clear indication of how groups of activities link to strategic objectives. A
strategic cost management model that uses ABC would therefore have to incorporate a
method or tool, such as the BSC, to create the link to strategy.
The Balanced scorecard (BSC) is a performance management tool that identifies
quantifiable performance measures and targets and links them to a unified strategy (Kaplan
1 Cost objects are defined as any unit of production, service, client, department, business unit etc. for which costs are incurred, and for which cost measurement is desired (Gunasekaran, 1999)
2

& Norton, 1996). In order to do this, the BSC defines performance dimensions that are
critical to strategy achievement. These dimensions are termed “perspectives” in the original
literature, and usually include satisfying customers and shareholders, excelling at internal
processes, and ensuring growth opportunities for employees (Kaplan & Norton, 1992).
A model that combines ABC and BSC could adapt the strategic BSC dimensions,
and use them as a means of collecting, organizing, and analyzing activity and cost
information. This would overcome the above mentioned limitation of ABC by organizing
complex activity and cost data, and by providing a clear strategic link between dimensions of
activity, costs, and strategic goals. The nature and costs of activities performed in an
organization could be analyzed for strategic purposes, in order to identify which activities
contribute positively to achievement of strategic goals, and which do not. Activities that are
not essential to strategy achievement, but still consume valuable resources, can then be
reassessed from a strategic point of view. Similarly, activities that contribute indirectly to
strategic objectives could be identified and given due importance.
1.2 The context of the study
This idea of creating a link between activities, costs, and strategic objectives can be
applied to any situation in different industries and contexts that requires a strategic
perspective of costs. It is, however, developed in the current study using the healthcare
context of diabetes patient education. There are three reasons for selecting this milieu.
First, there appears to be the need for a practical strategic management tool that can
connect the medical, business, and public service dimensions of strategic objectives in
healthcare. While the achievement of strategic objectives is important in any organization, in
the healthcare sector these objectives usually have broader implications beyond the impact
on an individual organization. Despite this, the healthcare sector has been especially slow in
3

adopting of the strategic management paradigm (Buller & Timpson, 1986). One possible
reason for this slower adoption could be the absence of a tool that provides the multi-
dimensional focus that the sector needs. Another reason could be the absence of an
illustration of how a business system could be useful in the non-profit domain.
Second, the healthcare service of patient education plays an important role in the
management and control of diabetes (Mensing et al., 2003). There is widespread acceptance
in academic and practitioner literature about the importance of patient education (e.g.,
Norris et al., 2001; Ryan, Todd, Estey, Cook, & Pick, 2002), and large amounts of resources
are invested in education programs (Williams et al., 2004). However patient education
(especially in chronic diseases) is absent from discussions in the literature about the costing
of healthcare services. By discussing strategic cost management in a diabetes program, this
study provides a starting point for further discussion of the costs of diabetes education. The
objectives of diabetes education programs, such as creating awareness of the disease and
ensuring patients lead productive lives, cannot be subordinated to cost control for its own
sake. Therefore, using a strategic cost management model that manages costs, without
adversely affecting the goals of patient education, would be appropriate.
Third, a local health authority was interested in obtaining detailed cost information
for its diabetes program. Therefore, it was willing to allow an examination of its diabetes
program, and participants and information were made readily available. The selection of
patient education to discuss strategic cost management was thus expedient.
1.3 Research question, objectives and significance
Two research questions are addressed in this study, and are as follows –
1. How can the BSC be combined with ABC to provide a tool for strategic cost
management that can be used in decision making?
4

2. What are the possible uses of such a combined model in strategic decision making?
The first question relates to the steps involved in developing a strategic cost
management model, while the second question addresses the use of such a strategic cost
management model. The study seeks to answer these two questions, and therefore its
objectives are –
∼ to develop a strategic cost management model that provides a strategic perspective
to ABC by combining it with some features of the BSC, and
∼ to examine possible strategic uses of the combined model by discussing it in the
context of a Type-2 diabetes education program.
A model that combines ABC and the BSC could be implemented in different
industries and settings, and used to understand relationships between the different
dimensions of activity and strategic objectives. The significant outcomes of the study,
specifically in the context of diabetes client education, are discussed below.
A model, overlaying the BSC over ABC, would link activities and their costs to the
strategic objectives of an education program (for example, prevention of complications and
optimization of quality of life [Norris et al., 2001]). Based on this information about the
strategic impact of activities, operational cost management decisions, resource allocation,
and process improvements could be implemented so as to maximize congruence with
strategic goals. The model could therefore be used to evaluate whether operational realities
reflect strategic plans, by showing where resources are being expended. Such a combined
model that contributes to the achievement of strategic goals would be a valuable strategic
cost management tool (Govindarajan & Shank, 1992).
The combined model could also be used to obtain information to reassess strategic
objectives. The model could indicate variations in resource consumption thereby directing
5

attention to changes in the strategic environment, or highlight whether assumptions
underlying the strategic choice are valid in reality. These issues could manifest themselves in
the combined model through variations between expectations and actualities.
The next chapter presents the motivation and support from the literature for the
development of a combined strategic cost management model, and its application to patient
education.
6

2. Theoretical Foundation & Literature Review
The theoretical basis for the combined strategic model can be discussed from five
different points of view – (1) the benefits and limitations of using traditional ABC in strategy
management, (2) the strategic focus that BSC can provide to ABC, (3) the use of the
combined model for strategic control, (4) the role of strategic management in healthcare, and
(5) the importance of managing diabetes education costs strategically.
2.1 The benefits and limitations of using traditional ABC for strategy management
In this section the following points are discussed – (i) the operational advantages of
ABC, (ii) the strategic benefits of ABC, and (iii) the strategic limitations of ABC. The
literature in these areas supports the development of a strategic cost management model,
and the use of ABC as a critical element within the model.
2.1.1 Operational advantages of ABC
ABC has significant advantages over its predecessor, standard costing. Standard
costing is driven by volume measures such as number of production units or number of
machine hours, and uses a predetermined (“standard”) cost rate per unit to assign overhead
costs (such as product design, and administrative costs) and evaluate performance (Kaplan &
Cooper, 1998). Standard costing thus assumes a direct relationship between overhead
resource consumption by each unit of output, which has been shown to be unrealistic
(Plowman, 1998). Standard costing techniques are also based on work standards and
standard costs that follow a top-down flow from management to line employees. Valuable
problem-solving skills and process improvement insights from frontline employees may thus
be lost, making these approaches inappropriate for strategic performance management
(Kaplan & Cooper, 1998).
7

Overhead Cost centre
1
Overhead Cost centre
2
Overhead Cost centre
x …
Production Cost centre
1
Production Cost centre
2
Production Cost centre
n …
Products
Direct labour Direct materials
Allocations based on factors such as number of employees
Allocations based on product volume-driven factors such as machine hours and direct labour hours
STANDARD COSTING
Resource expense
1
Resource expense
2
Resource expense
x …
Activity 1
Activity 2
Activity n …
Cost objects (Products, services & customers)
Direct labour Direct materials
Allocations based on resource cost drivers such as number of invoices processed, or number of product development hours
Allocations based on activity cost drivers such as machine hours (for activity Run machines), or number of products (for activity Support existing products)
ACTIVITY- BASED COSTING
Figure 2.1
Difference between traditional and activity-based costing (Adapted from Kaplan & Cooper, 1998, pp. 83-84)
ABC, on the other hand, focuses on activities that result from events or decisions,
and consume resources in order to produce output. Cost allocation is therefore moved from
cost centres (such as departments) to discrete units of activity. These activities are then
“consumed” by different cost objects such as a unit of production, a customer, or a business
8

department. This distinction between standard costing and ABC systems is represented in
Figure 2.1. An ABC system can thus provide resource consumption information for
activities, business processes, products, and customers (Kaplan & Cooper, 1998).
A link is established between resources and activities, and between activities and cost
objects, by identifying appropriate cost and activity drivers. These are factors that cause an
increase in cost or activity consumption. By using volume of output, employee time,
complexity, and other factors as possible drivers of costs, ABC estimates costs more
accurately. Also, by providing realistic information about activities, their costs, their drivers,
and how they link to form processes, ABC can provide information for activity-based
management (ABM), i.e. decision making based on an understanding of costs and cost
drivers, which can be managed and improved upon (Kaplan & Cooper, 1998; Plowman,
1998; Siegel et al., 1999). For example, cost information obtained from an ABC system for a
patient education program can also be used to evaluate the effect of changes in the system,
such as providing certain modules of instruction via digital media.
The insights provided by a multi-driver ABC system can be very valuable to service
organizations since almost all operating expenses in the service sector vary due to factors
other than volume (Buckingham & Loomba, 2001; Kaplan & Cooper, 1998). For example,
Hwang and Kirby (1994) find that if hospital inpatient costs are driven by multiple cost
drivers, but are allocated based on a single driver, the reported cost and, consequently, the
reimbursement to hospitals by insurers is hugely distorted. Scholars have further noted that
ABC is most useful in situations where there are large, increasing expenses especially for
indirect and support resources, or where there is high diversity – with a variety of products,
services and customers, or a combination of these variables (Kaplan & Cooper, 1998).
9

The ABC approach is therefore well-suited to a cost object such as a patient
education program, where the relationship between number of patients (i.e. volume) and
costs is not always linear2. Patient education is also a suitable candidate for ABC due to the
rapidly increasing number and changing demographics of persons diagnosed with Type-2
diabetes, and the wide variety of personalized services that are provided in these programs.
Studies have discussed the applicability and issues in implementation of ABC in
various settings, such as manufacturing (Swenson, 1995), financial services (Sapp, Crawford,
& Rebischke, 2005), and healthcare (Udpa, 1996). Though the goals of for-profit and non-
profit organizations are different by definition, the literature does not show that ABC is any
less applicable in the non-profit sector, though the decisions the ABC information is used
for may differ (Kaplan & Cooper, 1998). Some real-world examples of ABC being used in
the non-profit sector are seen in various departments in the Texas state government (Office
of the Texas Comptroller, 2001) and a Peruvian non-government organization (Water,
Abdallah, Santillán, & Richardson, 2003). The use of ABC for operational cost analysis is
therefore well-established. However, scholars such as Shank and Govindarajan (1993)
contend that such cost analysis must be supplemented by strategic analysis in order to
understand the true nature of a business problem or situation.
2.1.2 Strategic benefits of ABC
Strategic uses of control systems, including accounting systems, have been discussed
in the academic literature. For example, both Khandwalla (1972) and Simons (1987)
2 For examples of patient education costs that are not driven by volume, consider the cost of maintenance of the building in which patient education is provided, or of maintaining computer systems. These are examples of overhead costs that are incurred to run a patient education program effectively, but are not directly proportional to the number of clients. So allocating these costs based on client volume alone would provide inaccurate cost estimates.
10

conclude that there is a positive association between strategic factors such as the competitive
behaviour a firm engages in, and the use and types of sophisticated management controls.
Such studies, however, tend to focus on tailoring control systems to a specific strategy,
rather than present the use of accounting information to inform and influence strategy.
ABC can be used to influence how strategy is formulated. Porter (1996) emphasizes
the importance of activities to strategy, specifically the sustainable competitive advantage
(low cost or differentiation) that consistent, reinforcing and effort-optimizing activities can
bestow. Some suggested uses of ABC during strategy formulation include pricing decisions,
supplier selection, customer profitability analysis, product design and development, and cost
reduction (Blocher et al., 2005; Cooper & Kaplan, 1988; Kaplan & Cooper, 1998; Nair, 2000;
Plowman, 1998).
Information from ABC could also impact the strategy process during the
implementation and monitoring stages. ABC explicitly lists activities carried out in an
organizational unit, and then allocates resource costs to the activities. This information could
be analyzed to determine the relative importance of specific activities to the achievement of
strategic objectives, and the associated costs. Resources could then be managed to better
reflect organizational strategy. ABC would thus help strategy implementation by relating
activities to goals, indicating contradictions between goals and resource consumption, and
highlighting where improvements can be made. An ABC system could also be used to
monitor an organization’s strategic environment. Variations between plans and actual
performance could draw attention to changes in circumstances that call for a change in
strategic objectives, and the way they are implemented.
A search of literature does not reveal any discussion about the use of ABC for
strategy monitoring or reassessment. The proposed use of ABC for this purpose in addition
11

to the more traditionally discussed uses is, therefore, a variation in the existing themes of
strategic cost management literature, especially when it is applied in a healthcare context.
The strategic value of ABC in healthcare, which is the context of the current study, is
now discussed further. Some researchers feel that increasing the visibility of activities may
not automatically lead to better strategic control – especially in healthcare (Coombs, 1987;
Nyland & Pettersen, 2004). In this sector administrative control (i.e. bureaucratic powers)
and collegial control (i.e. domination of the medical profession) must co-exist with
ambiguous boundaries, and yet at odds (Coombs, 1987). Knowledge-sharing between
different clinical functions may occur ad hoc, without an established administrative protocol
for such interaction being in place (Nyland & Pettersen, 2004), which makes such activities
hard to identify and control.
However, given the increasing pressure of resource scarcity in the healthcare sector
(Ontario Case Costing Initiative [OCCI], Version 2.0), some means of directing activity from
the cost control perspective becomes necessary. Coombs (1987) suggests that “closer
integration of bureaucratic and collegial control mechanisms” (p.392) is a good way to fulfill
this necessity, and that greater visibility of activities will result, at a minimum, in attempts to
modify behaviour that affects strategic goal achievement. ABC models facilitate such
integration, as they link costs, which in this case are the form of administrative control, to
the activities needed to provide healthcare services to clients, which are largely the domain of
medical practitioners.
2.1.3 Strategic limitations of ABC
ABC, though not used to monitor and reassess strategy, is considered to be an
important component of strategic cost management and a useful strategic analysis tool.
However, it is not powerful enough to be used as the primary tool for this purpose. Shank
12

and Govindarajan (1993) point out that ABC systems assign “all... costs to products without
any concern as to whether or not the cost is legitimate in a strategic sense” (p. 181).
Therefore, some means or criteria for evaluating the short-term and long-term strategic
implications of control based on activity analysis is needed (Mitchell, 1994). This leads
directly into the reasons for incorporating the BSC into a combined strategic model that can
explicitly link costs to strategic objectives.
2.2 The strategic focus that BSC can provide to ABC
This section begins with a brief discussion about the development and uses of a
BSC, followed by the how the BSC can be useful in a strategic cost management model, and
finally, the modifications that are necessary for using the BSC dimensions for strategic cost
management in a specific context.
2.2.1 About the Balanced scorecard
The BSC is a performance management tool that addresses the agency theory
concern of implementation of legitimate stakeholders’ concerns, and acts as a governance
mechanism by aligning agency performance measures with the principal’s values (Eisenhardt,
1989; Johnsen, 2001). These values are represented in the BSC by the organization’s strategic
objectives. The BSC links performance at various levels to overall strategic objectives by –
∼ Identifying different important areas or perspectives of performance that an
organization must excel at for strategic success. These usually relate to financial goals,
customer needs, internal processes, and employee abilities, but can be modified to reflect a
specific organizational reality.
13

∼ Identifying specific, quantifiable measures or performance indicators within each
dimension of performance. These can be financial or non-financial in nature, and are
identified based on strategic objectives (Lawrie & Cobbold, 2004).
∼ Setting targets for each of the identified measures. Individual and business unit
performance can then be evaluated by comparing achievement of these targets. Areas for
improvement can be identified based on variance between targets and actual measures.
The BSC thus provides a unified, strategic focus to individual and organizational
performance, and communicates strategy at all organizational levels by providing
performance targets that are consistent with strategy (Kaplan & Norton, 1992, 1996, 2001).
Appendix A summarizes how the BSC operationalizes an abstract strategy, and presents
examples of goals and measures within the different performance perspectives for a hospital.
Cascading scorecards can be constructed at different levels, flowing from the
organization, to a business unit, to a department, to a work team, to each individual. By
measuring selected, strategically consistent outcomes at all levels, strategy can be
communicated effectively. The BSC thus acts as a coherent strategy management system, by
translating strategy into performance measures and targets, and communicating and
enforcing a consistent strategy through the organization.
The next step is to discuss the adaptation of BSC’s strengths to ABC and strategic
cost management.
2.2.2 Using the BSC with ABC for strategic cost management
Scholars have discussed how ABC complements the BSC by providing information
for performance measurement (Buckingham & Loomba, 2001; Plowman, 1998), and the
synergistic effect of the two systems on company performance (Maiga & Jacobs, 2003).
14

However, combining the two systems into a single model does not appear to have been
attempted. The two reasons presented in this research to support the use of the BSC
framework with ABC, in a combined strategic cost management model are – (i) to ensure
the completeness of activity information by providing structure and, (ii) to promote a
strategic view of costs. These are discussed below in more detail.
As the complexity of operations increases, ABC tends to become time-consuming
and expensive to implement and maintain (Hicks, 2005; Kaplan & Anderson, 2004; Kiani &
Sangeladji, 2003). To overcome this problem, activity dimensions can be used as a
framework to collect, classify, and organize activity information. The BSC has previously
been adapted to areas other than performance measurement. For example, Voordt (2004)
used the performance perspectives to analyze the costs and benefits of flexible workplace
design. A more pertinent example is the method adopted by Edwards, Downey, Griffin,
Lang, and Eldred (2005) of using the BSC to organize cost information while estimating the
costs of implementing nursing best practice guidelines. This study extends their use of the
BSC framework, firstly by using it specifically with ABC for activity and cost information
collection and classification, and secondly, by emphasizing the strategic value of such a
combination to cost management.
One of the problems faced in strategic cost management is that no tool or method
exists to connect strategic costing principles with their implementation at the operational
level (Buckingham & Loomba, 2001). A strategic cost management tool could create this link
by taking advantage of the BSC principle that allows it to relate day-to-day performance to
achievement of strategic goals (Kaplan & Norton, 2001). By clearly defining the goals of an
organization (or organizational unit), and then identifying the different dimensions of activity
and activity costs that are directed towards that purpose, an explicit link can be created
15

between activities, resource utilization, and objectives. This can provide a more strategic
orientation to cost management at the operational level.
In order for a combined ABC/BSC model to have true strategic value, the activity
dimensions chosen for the model must reflect the specific context in which the model will
be used. This issue is addressed in the following section.
2.2.3 Modifying performance dimensions to match strategic objectives
While the original BSC authors present four performance dimensions – customer,
internal business, innovation and learning, and financial (Kaplan & Norton, 1992, 1996),
researchers state that the use of these dimensions was mainly to promote the use of non-
financial performance measures (Lawrie & Cobbold, 2004). Some researchers and
practitioners, therefore, select and name perspectives based on the strategic objectives of a
particular organization. For example, Elefalk (2001) uses operational, staff, resources, and
citizen perspectives in an analysis of BSC use in a police force; Kalagnanam (2004) uses
customer and stakeholder, public purpose, leadership, innovation and learning, and financial
perspectives in his study of government-owned for-profit companies; and Pink et al. (2001)
use financial performance, patient satisfaction, system integration and change, and clinical
utilization and outcomes as performance perspectives in a public health service setting.
The literature indicates that, in a combined model for strategic cost management,
activity dimensions should reflect the goals of a specific program, as the use of standard
categorizations may not be relevant. Figure 2.2 is a generic representation of a combined
ABC/BSC model using the activity dimensions presented by Kaplan and Norton (1996).
The model can link each activity dimension and individual activity to a specific
strategic objective. Here, the activity information is the contribution of ABC, while the
activity dimensions and link to strategy are provided by the BSC. In the example provided in
16

the figure, activities in the customer dimension, such as making sales contact, and filling an
order, would contribute to the achievement of Objective 1 (Satisfy customers). Similarly,
activities in the learning and growth dimension, such as attending training sessions, could be
linked to Objective 3 (Be market leaders in innovation). The activities to be included in each
dimension would depend on the way the dimensions are defined.
Customer dimension
Activities involving customer interaction that affect how
customers see us
For example: Contact customer Deliver order Collect payment Handle customer queries & complaints
Internal business process
dimension Internal activities necessary to satisfy our shareholders
and customers For example: Design advertising campaigns Process customer orders Attend staff meetings Maintain accounts
BSC strategic dimension
ABC activity information
Organizational strategic objectives
For example: 1. Satisfy customers 2. Provide shareholders
with above average returns on their investment
3. Be the market leaders in innovation
Learning & Growth dimension
Activities that allow us to sustain our ability to change
and improve For example: Attend training sessions Publish in-house newsletter Organize social events
Financial dimension Activities relating to the
management of resources, to satisfy our shareholders
For example: Purchase fixed assets Negotiate loans from financial institutions
Figure 2.2 Generic representation of the ABC/BSC model
The relevance of an individual activity within a particular dimension can also be
linked to specific strategic objectives in the same way. The ABC process can provide the cost
17

associated with each activity. We can then evaluate the resource consumption associated
with the strategic contribution of activities and activity dimensions. For instance, some
activities in the internal business process dimension, such as attending staff meetings and
maintaining accounts, do not appear to link directly to any particular strategic objective.
They are still necessary components of the business but, due to their non-strategic nature, it
might be possible to control the amount of resources such activities consume, without
affecting the achievement of strategic objectives.
The next section of the study discusses in more detail how a combined ABC/BSC
cost management model can be used for strategic control.
2.3 Potential uses of a combined model for strategic control
Ensuring cost control without affecting non-cost strategic goals could be crucial,
especially in sectors such as public service and healthcare where strategic outcomes have
socio-economic implications. By overlaying ABC and BSC principles, a combined model
provides cost information, identifies the amount of resources particular activities consume,
and links activities and resource consumption to the achievement of strategic objectives.
Cost management decisions using the model could therefore be driven by more long-term
considerations, rather than cost minimization for its own sake.
Based on the literature, two strategic uses of a combined strategic cost management
model are identified. These are (i) to evaluate strategy implementation, by providing
information about the impact of decisions already taken, and (ii) to monitor the premises on
which strategy is based, and provide information that could affect future strategic decisions.
Schreyögg and Steinmann (1987) refer to these two aspects of strategic control as feedback
control and feedforward control respectively.
18
2.3.1 Evaluation of strategy implementation (Feedback role)
The model could be used to evaluate strategy implementation by using activity and
cost information to show how activities relate to strategy, and what resources they consume.
By showing where resources are being expended, in relation to strategy, a combined model
can provide feedback about whether a strategy is being implemented as planned. This use is
consistent with strategic control as defined by Schendel and Hofer (1979).
2.3.2 Monitoring the strategic environment (Feedforward role)
A combined model could draw attention to critical events that require a change in
the way strategy has been created or implemented; assumptions that are not valid in the
current environment; or factors that may not have been originally considered in the strategic
planning process. These events or factors may make themselves known through distortions
or variations in activity time and cost estimates obtained from the cost model. This
information can then be used to make adjustments to implementation or to the strategy
itself. The use of a strategic cost management tool for reassessment of the strategy itself is
consistent with the premise control, strategic surveillance, and implementation control stages
of Schreyögg and Steinmann’s (1987) strategic control framework, which has also been
discussed by other scholars such as Ittner and Larcker (1997).
While cost information has traditionally been used to evaluate the internal efficiency
of organizations, the use of such accounting information and controls to influence strategic
purposes such as customer satisfaction, employee learning and improvement in activities has
been criticized as misleading due to its rigidity and narrow scope (Dent, 1990; Johnson,
1990; Langfield-Smith, 1997). However, a cost measure of processes is essential to show
managers the financial impact of their decisions (Kaplan & Cooper, 1998). For such an
attention-directing role accounting information can be an objective indicator of resource use.
19

The study does not discuss the use of a combined model for strategy formulation.
This separates it from most literature discussing the strategic role of management control
systems (MCS)3, which focus heavily on the tailoring of MCS to strategy, the role of MCS in
strategy formulation and, to a lesser extent, on MCS’ role in strategy implementation
(Cooper, 1996; Dent, 1990; Henri, in press; Langfield-Smith, 1997; Simons, 1987).
The discussion now moves to the context in which the combined ABC/BSC model
is presented – healthcare and diabetes patient education.
2.4 Strategic management in healthcare
Strategic management is very important for healthcare organizations because of the
constantly changing environment they operate in (Buller & Timpson, 1986). The literature
recognising this need and discussing the role of strategy in healthcare organizations can be
broadly categorized as (i) studies about internally focused, long-range operational and
planning issues (e.g., Dansky, Weech-Maldonado, De Souza, & Dreachslin, 2003), (ii) studies
discussing the importance of an externally focused, long-range strategic perspective (e.g.,
Yasin, Zimmerer, Miller, & Zimmerer, 2002), and (iii) studies presenting strategic tools and
sources of strategic information in healthcare organizations (e.g., Wells, Lee, McClure,
Baronner, & Davis, 2004).
2.4.1 Internally focused long-range planning
There is a body of empirical and a priori research focusing on strategic ways to
realize effective internal operations in healthcare. Some examples include strategic brokerage
(i.e. the integration of diverse non-clinical support services to ensure effective operation of
clinical activities) (Heng, McGeorge, & Loosemore, 2005), retention of nursing staff through 3 MCS are defined as measurement systems that use information to influence organizational and individual behaviour patterns (Simons, 1987; Govindarajan & Shank, 1992).
20

improved work life conditions (Gifford, Zammuto, Goodman, & Hill, 2002), use of
operations research techniques for strategic resource allocation in hospitals (Blake & Carter,
2002), cost control through outsourcing (Roberts, 2001), and the relationship between
strategic orientation and level of diversity management (Dansky et al., 2003).
These internally oriented studies tend to focus on the aspects of healthcare
organizations that do not deal directly with the provision of clinical services but are
important facilitators of the core services, and achievement of strategic goals. A strategic
management tool that ensures that the strategic role of operational factors (both clinical and
non-clinical) is not overlooked would therefore be useful, especially if it can also identify
activities that consume resources without contributing to achievement of strategic objectives.
2.4.2 Externally-oriented strategic planning.
Researchers have also discussed the role and importance of strategic planning and
management in healthcare. For example, Buller and Timpson (1986) acknowledge the
importance of the various stages in the strategic process (including implementation and
continuous monitoring) in health services; Douglas and Ryman (2003), in their study of US
hospitals, show that a hospital’s strategic competencies (i.e. the ability to deliver superior
services resulting in competitive advantage) are positively related to financial performance;
Yasin et al. (2002) who also studied a sample of US hospitals, find that hospital executives
are attempting to overcome traditional barriers to new ideas, and implement new strategic
philosophies such as total quality management and business process re-engineering in
healthcare; Cuellar and Gertler (2006) try to understand strategic relationships between
hospitals and physicians using a transaction economics perspective.
These studies indicate that there is an increasing interest in strategic management in
healthcare. However, though most hospitals tend to have internally-focused planning
21

systems in place, not many have strategic planning systems that are externally-oriented,
proactively attempting to understand the changing environment, and moulding themselves
to achieve their objectives in that environment (Bruton, Oviatt, & Kallas-Bruton, 1995;
Buller & Timpson, 1986). Even in academic research, there seems to have been no attempt
to present a practical tool that can be used as a source of strategic information. A combined
strategic cost management model could address this gap by providing information for
strategic decisions.
2.4.3 Sources of strategic information in healthcare organizations
Some studies have looked at the sources of strategic information and strategy
formulation in healthcare. Daake, Dawley, and Anthony (2004) studied the strategic use of
data from formal sources (such as circulated reports, information from experts, journal and
magazine articles) and informal sources (based on experience, knowledge of operations,
informal discussions etc.) in a health organization. They conclude that “formal data should
be limited, concise, and structured” (p.244). A combined strategic cost model that uses the
BSC framework could provide such specific, structured information for strategic decisions.
Killingsworth, Newkirk, and Seeman (2006) present an example of a tool for
strategic planning using a strategic information systems approach, and discuss the
importance of incorporating internal and external analyses, and stakeholder influences into
the development of a strategic information system. Here again, a combined model that
utilizes the different activity dimensions from the BSC approach could address the need for
strategic information from different perspectives.
The literature does not supplement the discussion about the multi-dimensional
nature of healthcare strategic management with studies about the use of cost information in
a strategic way, or the need for systems and tools for strategic cost management in
22

healthcare. A discussion about strategic cost management model in the context of healthcare
would therefore be helpful. This study addresses this issue by providing information
specifically about patient education, a relatively ignored healthcare service.
2.5 The importance of managing diabetes education costs strategically
This section begins by discussing the role of costing in healthcare, followed by the
importance of patient education, and the extant literature about the costs of patient
education. As the combined model is developed using ABC and BSC, and is then applied to
patient education, the applicability of each of these methods to healthcare and patient
education forms the final part of the discussion.
2.5.1 The role of costing in the healthcare sector
The concept of costing healthcare services is not new, and the literature discusses its
importance through issues such as the information requirements for decision making in
healthcare (Kaskiw, Hanlon, & Wulf, 1987), the use and implications of DRGs4 (Beaty,
2005; US Congress OTA, 1986), the need for standard benchmarks to control costs
(Meeting, Saunders, & Curcio, 1988), and problems in developing benchmarks due to
differences in operations and costing practices (Negrini, Kettle, Shepherd, Mills, &
Edbrooke, 2004; Northcott & Llewellyn, 2002), and the positive relation between cost
system functionality, level of detail and perceived usefulness of cost data in hospitals
(Pizzini, 2006).
4 Diagnosis Related Groups or DRGs are the components of “a classification system that groups patients according to principal diagnosis, presence of a surgical procedure, age, presence or absence of significant comorbidities or complications, and other relevant criteria” (US Congress OTA, 1986, p. ix). A cost is associated with each DRG, and is commonly used in the US for Medicare reimbursements.
23

An argument can be made that the strategic objectives of healthcare organizations,
specifically patient education programs, are related to changing attitudes and lifestyles of
clients, rather than to cost containment. Though this may be true, resource optimization is
still a valid goal given the increasing pressure of resource scarcity in most healthcare systems
(OCCI, Version 2.0). Detailed information about the components and drivers of relevant
costs could guide decisions that improve operational efficiency, through improved cost
management, efficiency in resource utilization (Jagolinzer, 1984) and better resource
allocation that is in line with non-cost related strategic objectives of a health program or
service (Dent, 1990; Kaskiw et al., 1987; Suthummanon, Omachonu, & Akcin, 2005). In
other words, while cost reduction may not be a primary goal, cost management can make
resources available to meet strategic needs of healthcare organizations.
Some scholars have called for more research into the use of cost information for
decision making in healthcare. For example, Finkler and Ward (2003) comment on the
absence of evidence-based cost containment research that hospital managers can use in their
decisions. Their three-stage cost containment framework identifies possible avenues of
healthcare costing research. These include (i) the cost measurement aspect (such as the cost of
services, types of information currently available, differences in systems across
organizations), (ii) the cost control aspect (such as effective cost control strategies, conditions
leading to selection of one cost control strategy over another, non-financial impact of cost
control efforts), and (iii) the assessment of value aspect (such as the impact of cost control on
quality of services, value addition to healthcare organizations and society).
Within the context of Finkler and Ward’s framework (2003, p.350), a combined
ABC/BSC model could address issues from all three stages of strategic cost containment in
healthcare (see Figure 2.3). A combined model could use the ABC approach to identify the
24

costs of processes. Strategic activity dimensions would be provided by the BSC aspect of the
model, and costs could therefore be measured for these dimensions as well. While ABC on
its own could address the cost measurement aspect, the added strategic focus of the BSC is
needed to address questions in the other two areas (cost management and assessment of
value), which link costs to strategy achievement. As discussed earlier, ABC does not create
this explicit link to strategy and so, as a strategic tool, a combined ABC/BSC model would
be more useful than a traditional ABC model.
Cost management ∼ What cost management
strategies contribute to effective strategy implementation?
Assessment of value ∼ Has cost management contributed
to value by complementing strategic objectives?
∼ Does cost management information provide insights into the relevance of strategic objectives?
Evidence Evidence
Cost measurement ∼ What do services cost? ∼ What do strategic activity
dimensions cost?
Figure 2.3 Possible healthcare cost management issues addressed by an ABC/BSC model
(Framework adapted from Finkler & Ward, 2003, p.350)
We now move on to discuss the importance of diabetes patient education, and the
relevance of strategic cost management in this setting.
2.5.2 The importance of diabetes patient education
Diabetes is a chronic disease that is reaching epidemic levels in Canada, where nearly
two million people currently live with the condition – a number expected to increase 50%
by 2010 (Canadian Diabetes Association [CDA] & Diabète Québec, 2005). Ohinmaa, Jacobs,
25

Simpson, and Johnson (2004) estimate that the Canadian costs of diabetes and related
complications will increase from $4.6 billion in 2000 to $8.1 billion in 2016. Appendix B
discusses diabetes, its prevalence and costs further. These statistics highlight the extent and
severity of the diabetes crisis, and the importance of managing it as effectively as possible.
Type-2 diabetes, caused by insufficient production or absorption of insulin in the
body, accounts for almost 90% of all diagnosed cases. It can be controlled, or even
prevented in some cases, through healthy lifestyle choices (CDA, 2005). Therefore, an
important role of healthcare organizations is to improve diabetes knowledge, self-care
methods and habits through patient education. The goal is to improve, or at least maintain, a
patient’s level of well-being, preferably within acceptable cost levels (Karam, Sundre, &
Smith, 1986; Norris, Engelgau, & Venkat Narayan, 2001).
Diabetes education aims at promoting self-management which empowers clients.
This is a more efficient way of managing a chronic disease, as continuous monitoring of all
diagnosed cases is not practical for either the organizations or their clients. The self-
management approach benefits the patients, who can function with more independence, as
well as the healthcare organizations, from which some of the pressure of responsibility is
lifted (Coates, 1999). At the Regional Health Authority (RHA) studied in this project, client
management of diabetes is considered a key concept, and the organization aims at providing
disease-specific information to understand, manage, and live productively with the disease.
Managing diabetes is desirable, clinically, as well as from an economic perspective, as
better control of the disease translates into lower healthcare costs (Wagner et al., 2001).
Patient education can play an important role in diabetes management, as it appears to have a
positive impact on the well-being of patients, by improving knowledge levels, blood glucose
self-monitoring skills, and dietary habits, especially with short term follow-up (Loveman et
26

al., 2003; Norris et al., 2001; Ryan et al., 2002). Patient education can reduce risk factors and
increase compliance, leading to decreased morbidity and mortality (Bourie, 1993). In fact, the
1998 Canadian Clinical Practice Guidelines for management of diabetes recommend that,
“(i)nitial and ongoing education of the person with diabetes should be an integral part of
diabetes management and not merely an adjunct to treatment.” (Meltzer et al., 1998, p.S4)
In order to achieve therapeutic goals, education programs must meet certain
standards (see Appendix B) and, in addition to knowledge improvement, must also address
psychological and social aspects which influence the behaviour of clients with chronic
diseases (Coates, 1999, chap.6). Diabetes programs generally consist of individual and
classroom sessions, where clients are taught about the physiology of diabetes; diabetes
medication, blood glucose monitoring procedures and insulin adjustments; the role of diet in
diabetes control and menu planning; and the importance of exercise (Ryan et al., 2002).
Education is usually provided via face-to-face interaction between clients and an
interdisciplinary team of trained educators and clinicians such as nurses, dieticians, exercise
physiologists, and physicians (Meltzer et al., 1998; Mensing et al., 2003). These teams use
innovative education tools, and are required to maintain up-to-date skills and undergo
ongoing training (Maldonato, Bloise, Ceci, Fraticelli, & Fallucca, 1995; Mensing et al., 2003).
Consequently, diabetes education programs must carry out a range of activities, and
consume a variety of resources in order to be effective. These costs associated with the
provision of effective diabetes education are met from within a finite pool of resources and
therefore, must be optimized. This resource optimization, however, must be accomplished
without any negative impact on the quality of the programs, or their strategic objectives. The
use of strategic cost management therefore seems essential in this situation. Of course, in
order to manage costs, strategically or otherwise, they must first be known.
27

2.5.3 Costs of patient education – A gap in the literature
While studies have tried to estimate the direct and indirect costs of chronic diseases
in general (including diabetes) (Jacobs et al., 2004; Ohinmaa et al., 2004), and of specific
types of diabetes treatment such as combination therapy using different drugs (Caro et al.,
2003), there is little information specifically about the cost of patient education programs
(Williams et al., 2004). For example, Jacobs et al. (2000) present an inventory of healthcare
services and standard provincial costs, but do not list patient education separately. Most
research into patient education costs is limited to estimating the direct costs of nursing time
spent on pre- and post-operative patient education (Bourie, 1993; Williams et al., 2004). The
study by Karam et al. (1986) is an exception and estimates education costs for a surgical
procedure by adding indirect costs to direct educator and material costs.
However, as the focus of these studies is not chronic disease self-management, their
findings are not directly applicable to diabetes education. While pre- and post-operative
instruction is provided to help patients gain knowledge and skills that influence their
behaviour for a specific (usually short-term) period, chronic disease education serves a
fundamentally different purpose. For chronic diseases, changes in behaviour and habits must
be sustained for long periods of time (usually life), and so motivation and psychological
factors also play an important part in chronic disease instruction (Coates, 1999).
These unique characteristics of diabetes education require its costs to be analyzed
using a customized model. Also, processes and costs for different healthcare organizations
tend to differ and a single study cannot provide cost amounts that are relevant to all such
organizations (Siegel et al., 1999). Therefore, a study developing such a model should present
28

details of the model development process, activities, time, cost items, and possible cost
drivers for a diabetes program and for specific patient categories.
2.5.4 Using ABC and BSC in healthcare
The combination of ABC and BSC into a single strategic cost management tool has
not been attempted, and so it is not possible to conclusively assert the usefulness of such a
combined model to diabetes education or even healthcare in general. However, ABC and
BSC have been studied extensively in healthcare settings, as individual systems. For example,
studies have presented the benefits of using ABC in hospitals (Chan, 1993; Eden, Lay,
Maingot, & Doyle, 2006; Ramsey, 1994; Udpa, 1996), private practices (Siegel et al., 1999),
and specific hospital departments and wards (Maher & Marais, 1998; Suthummanon et al.,
2005). Similarly, applicability and successful use of BSC in healthcare, as long as appropriate
modifications are made to reflect strategy, has been discussed by many researchers including
Chow, Ganulin, Haddad, and Williamson (1998), Inamdar and Kaplan (2002), Pink et al.
(2001), Radnor and Lovell (2003), and Zelman, Pink, and Matthias (2003). The literature
thus confirms that the benefits of ABC can be experienced in healthcare, and that the BSC
link between performance and strategy applies in the healthcare setting. This strengthens the
argument that a combined strategic cost management model will be relevant in healthcare.
Having presented the theoretical evidence in support of developing a combined
ABC/BSC model, and the relevance of such a model to diabetes education, the study now
moves on to the steps involved in creating such a model.
29

3. Methodology
This chapter discusses the general steps that were followed to create a combined
ABC/BSC model for a large health unit of a Canadian Regional Health Authority (RHA)5.
The diabetes education program that was studied is part of an initiative to promote healthy
lifestyle choices amongst residents in the region. Appendix C describes the education
program for Type-2 diabetes, and the different client categories.
Various sources of information were used in the study. Table 3.1 summarizes these
different sources of primary and secondary data in the study.
Table 3.1 Sources of information for ABC/BSC model development for diabetes
education Primary Secondary
Stage 1
Pre-interview
∼ Meetings with RHA diabetes program managers
∼ Email and telephone correspondence with RHA diabetes program managers
∼ Academic journals & books
∼ Diabetes information websites
∼ RHA educational material
∼ RHA internal documents such as planning documents, process manuals, checklists, and activity logs
Stage 2
Interview
∼ Interviews with RHA staff for activity and cost information
∼ RHA documents such as annual reports, budgets, and internal accounting statements
Stage 3
Post-interview
All data from previous stages for costs of processes, activity dimensions, & cost objects
Figure 3.1 is a representation of the model development process.
5 Regional health authorities are responsible for promoting the health of the population in their respective health regions, and the prevention of disease and injury. They look after hospitals, continuing care facilities, community health services and public health programs. Provincial health ministries allocate operational funding to the RHAs. (Alberta Health & Wellness, 2005)
30

Interview RHA staff based on information
from data collection forms
Compute cost of cost objects
STA
GE
1
PR
E-IN
TER
VIE
W
STA
GE
2
INTE
RV
IEW
S
TAG
E 3
P
OS
T-IN
TER
VIE
W
Collect activity and dimension information from literature
Verify data collection form with RHA managers
Collect activity and patient category information from RHA managers
Conduct sensitivity analysis
Present completed model to RHA
Compute costs of activity
dimensions
Create final list of processes
Collect cost & cost driver information from
RHA personnel & internal documents
Reallocate indirect process costs to other processes
Compute cost per driver unit
Construct preliminary model
Send data collection form to RHA staff & collect responses
Update model with information from interviews
Allocate costs to processes
Link processes with cost objects
Obtain consent from participants
Create pre-interview data collection form
Obtain Human Subject Research
Approval
Figure 3.1 The process of customizing the ABC/BSC model to the RHA’s diabetes program
31

3.1 Stage 1: Pre-interview
3.1.1 Collecting preliminary information and creating an outline of the model
The first step in the development of the ABC/BSC model was to understand
diabetes education and the process at the RHA. A review of literature in the areas of diabetes
patient education and self-management was conducted. This was supplemented by RHA
documents and interviews with the program director and team leader. This information was
used to (a) identify important activity dimensions, (b) develop a preliminary list of activities,
and (c) identify client categories that would be the cost objects for the study.
Once the RHA Research Committee and the University of Lethbridge Ethics
Committee formally approved the study, the diabetes program staff attended a meeting
where the study and its purpose were outlined. Formal consent from individuals was
received at the end of this meeting.
3.1.2 Developing a pre-interview form
A pre-interview data collection form was created by categorizing the identified
activities into the activity dimensions. The form asked participants to indicate their role in
the diabetes program, and estimate the amount of time spent on different activities for
different categories of clients. They were also asked to add significant activities that had been
overlooked and provide time estimates for these newly added activities as well.
The purpose of collecting this data before commencing the interview process was to
provide specific direction to interview questions. Given the busy work schedules of
respondents, this was a more efficient way of collecting information as (a) it eliminated
repetitive questions during the interviews, (b) it allowed participants to think about the
activities they performed over a longer period time (usually 3-4 days) rather than in the
relatively short duration of an interview, resulting in a more accurate and complete list of
32

activities, and (c) it provided an opportunity to collect input from all staff involved in the
program, and not just from selected interviewees.
3.1.3 Validation of the data collection form by RHA managers
Once the pre-interview form was completed, it was pre-tested by the diabetes
program director and the team lead at the participating centre, to obtain their comments, and
suggestions for improvement. These suggestions were then incorporated into the form. By
involving senior staff at each stage of model development, the output at each stage of the
process was more accurate and streamlined. Appendix D shows the final draft of the form.
3.2 Stage 2: Interview
3.2.1 Collecting activity information and time estimates
The completed data collection form was sent out electronically to eight staff
members (roughly 50% of the program staff at the selected location) including nurses,
dieticians, administrative staff, and managers. Six of the forms were completed and returned.
The responses in the forms directed the specific questions to be asked in interviews. Three
of the six respondents were interviewed over the telephone at this stage, with each interview
lasting from 15 to 30 minutes. (See Appendix E for sample interview protocol). Information
collected from the forms and interviews was then used to refine the original diabetes
education activity list.
The updated list was then sent to the remaining participants, and the above process
of collecting information and interviews was repeated. Three more completed forms were
received in the second round, and all three respondents were interviewed telephonically,
again for 15-20 minutes each. At this point, no additional information was obtained from the
interviews or forms. The process was therefore concluded after two iterations.
33

Throughout the data collection process, the activity dimensions adapted from the
BSC approach were used to ensure that no important area of activity had been overlooked.
The use of this framework, combined with the iterative data collection process, ensures that
the activities and time estimates used in the model are reasonably complete and accurate.
3.2.2 Collecting cost and cost driver information
Cost information for the study was obtained from internal documents such as
diabetes program budgets. Some overhead information, for example, the program’s share of
occupancy costs, was not included in these documents. This information was collected from
a finance manager at the RHA’s centralized finance department, via email correspondence.
Internal planning documents and records were used to estimate cost driver information
including the number of clients, number of staff, and staff pay scales. For example, staffing
schedules provided the number of full-time equivalent employees for each of the RHA’s
diabetes centres, while a manager provided estimates of client numbers from client records.
3.3 Stage 3: Post-interview
This stage primarily involved working with information collected in the earlier stages
to estimate the costs of activity dimensions and cost objects. The steps involved were:
∼ Creating a list of processes from the activity information;
∼ Allocating resource costs to processes;
∼ Linking processes to each cost object and reallocating indirect costs to other processes;
∼ Computing cost per unit of cost drivers and total cost driver units for each cost object;
∼ Estimating the costs of the cost objects; and finally,
∼ Conducting sensitivity analyses based on assumptions made in the study.
Each of the steps is discussed in more detail in the following chapter.
34

4. Building the ABC/BSC model for diabetes education
This chapter is laid out as follows – the first section deals with diabetes education
information collected for the ABC/BSC model, and its construction; the second section
discusses the information obtained from the model that can be used for feedback control;
the third section presents examples to illustrate the ABC/BSC model’s feedforward use to
identify uncertainties and changes in the environment; the final section briefly discusses the
results of the study’s sensitivity analyses based on the study assumptions. A complete list of
assumptions is shown in Appendix F.
4.1 Developing the model
4.1.1 Identifying activity dimensions
The RHA participating in the study is part of the public health system. Using the
performance perspectives identified by Kaplan and Norton (1992, 1996), a review of
different BSC perspectives used in the literature (e.g., Elefalk, 2001; Kalagnanam, 2004; Pink
et al., 2001), the modifications made by Edwards et al. (2005) for cost classification, and an
analysis of the strategy and process at the RHA, four activity dimensions are identified to
collect and classify activity information (see Figure 4.1). The activity dimensions identified
for the ABC/BSC model focus on clients, internal processes, employee learning and growth,
and interaction with external stakeholders (including regulatory and government agencies,
donors, and the general public).
The client dimension includes all activities that require direct interaction (face-to-face,
telephone, email etc) with persons with diabetes. This corresponds with the
customer dimension presented by Kaplan and Norton (1996). In the figure, the
arrows show that this dimension affects the achievement of strategic objectives 2
35

(Offer patients the right level of care at the right time), and 3 (Make patients
accountable for their health).
Client dimension Activities involving direct interaction with persons
with diabetes
Internal process dimension
Activities that support the delivery of service to clients, but do not involve direct client
contact RHA Diabetes program strategic
objectives6
1. To support the diabetes healthcare needs of the community
2. To offer patients the right level of care at the right time
3. To make patients accountable for their health by providing consistent messages and information
4. To plan, administer, and evaluate the program based on current research and practice guidelines
5. To co-ordinate with other RHA programs and community partners to provide consistent, effective messages
Learning & Growth dimension
Activities necessary for maintaining skills and
abilities relevant to diabetes awareness and
education
External stakeholder dimension
Activities that fulfil the expectations of RHA’s external stakeholders
Figure 4.1 Linking activity dimensions to strategic objectives of the RHA’s diabetes program
The internal process dimension includes all activities that support the running of the
facility and delivery of service to clients, but do not involve direct contact with them.
This includes activities such as maintaining logs and records, purchasing materials,
and staffing. These activities therefore indirectly support the achievement of
6 Adapted from RHA documents
36

objectives 2 (Offer patients the right level of care at the right time), and 3 (Make
patients accountable for their health), which are the links shown in the figure.
The learning and growth dimension includes all activities undertaken by RHA staff to
maintain skills and abilities relevant to Type-2 diabetes awareness and education,
such as attending conferences. Figure 4.1 indicates that the activities in this
dimension affect the strategic objective of providing clients the right care when they
need it (Objective 2), and of managing the program based on current research
information and guidelines (Objective 4).
The external stakeholder dimension includes all activities undertaken to fulfill the
expectations of stakeholders external to the RHA such as donors, government and
regulatory organizations, and the general public. Examples of these activities include
managing funding, interacting with general public, and collaborating with community
partners for various diabetes-related initiatives. These activities are thus important to
the achievement of objective 1 (Support diabetes needs of the community) and
objective 5 (Co-ordinate with other programs and community partners).
The original BSC authors use the financial dimension as the fourth aspect of the BSC
(Kaplan & Norton, 1992, 1996), and this convention is followed in studies by other authors
as well. Where the financial dimension is used in performance measurement, its purpose is to
identify financial targets that an organization must achieve, in order to meet its strategic
objectives. However, due to the difference in purpose of the original BSC (performance
measurement via financial targets) and that of the new ABC/BSC model (linking activities
and their costs to strategic objectives of diabetes education), the fourth dimension has been
modified in the ABC/BSC model to include the activities required to accommodate the
37

numerous external stakeholders a public health organization typically must satisfy. As
discussed in Section 2.2.3, similar modifications have been made in other studies with non-
profit organizations (e.g., in the BSC for a police force [Elefalk, 2001]) so that the selected
dimensions reflect the goals of the organization being studied.
The specific selection of an External Stakeholder strategic dimension is supported by
other studies in healthcare. For example, Bart and Hupfer (2004) looked at responses from
executives of Canadian hospitals to identify general themes in mission statements, such as
concern for stakeholders (including employees, shareholders, and the general public), and
how these themes impact the way operations are managed. Wells et al. (2004) studied small
hospitals, and also highlights the importance of continual negotiations with external
stakeholders as the main source of strategic information.
It is important to note that the financial dimension has not been ignored in this
example, but has simply been included in the External Stakeholder dimension along with
other aspects of activity. Therefore, there is still a financial element in the external
stakeholder dimension. Donors and government agencies are external stakeholders
providing the RHA with funding, and they would be interested in the financial management
of the program. Therefore, finance-driven activities, such as managing the funds available to
the diabetes program, must be included here.
4.1.2 Activity information collection
As discussed in Section 3.1, activity information was collected in two iterations, and
resulted in a list of 48 activities. These activities were then combined in major education-
related and operational processes, based on their tendency to “cluster into larger units of
work” (Siegel et al., 1999, p. 7). Each process was thus a collection of activities that were
related, and for which individual analysis and cost allocation could not be easily carried out
38

(See Appendix G). For example, the activities Print off lab results; Review referral for priority;
Triage referral; Book referral; Sort referral and organize; and Mail package to client, are grouped into a
single process – Process 1 (Book client). This grouping reduces the number of activities to a
more practical and manageable number. The final list of 19 processes is shown in Figure 4.2.
Patient dimension 1. Book client 2. Conduct initial assessment 3. Schedule visits & follow-up
with clients 4. Deliver face-to-face follow-up 5. Deliver telephone follow-up /
consults 6. Deliver group sessions
Internal process dimension 7. Handle and maintain records8. Attend to correspondence &
communication 9. Develop & handle
educational materials 10. Travel to deliver education 11. Consult with clinicians &
physicians 12. Sustain operations 13. Create and implement
strategic plans
Learning & Growth dimension
14. Maintain certification 15. Update knowledge and skills
– Conferences 16. Update knowledge and skills
– Reading & Discussion 17. Maintain supporting system
skills
External stakeholder dimension
18. Manage funding 19. Interact with public & drop-in
clients
Figure 4.2 ABC-based processes arranged into BSC-based activity dimensions for the
RHA’s diabetes program
4.1.3 Defining cost objects and the processes they consume
Based on the different client categories and the study’s focus on Type-2 diabetes, the
following cost objects were identified for services delivered by the RHA’s diabetes education
program to clients newly-diagnosed with Type-2 diabetes.
39

1. Clients requiring lifestyle intervention only (LS)
Clients in this category can maintain blood glucose levels just by making changes in
lifestyle – mainly diet and exercise habits.
2. Clients requiring oral medication (OM)
Clients in this category require oral medication in addition to lifestyle changes to
maintain blood glucose levels.
3. Clients requiring oral medication and insulin or client with comorbidities (M&I)
This category includes patients with higher blood glucose levels over a longer period of
time, which requires oral medication as well as regular use of insulin. Persons with co-
morbidities, i.e. pre-existing health conditions such as heart disease in addition to
diabetes, are also included here. These two groups of clients do not overlap completely,
but are combined as a single unit because of the similarities in resource use.
4. Clients with gestational diabetes (PREG)
Clients who become diabetic due to hormonal changes during pregnancy are included in
this category.
5. Group sessions (GRP)
The group sessions provide general information about diabetes and related issues, and
are used to supplement the information provided in individual sessions. The clients in a
group typically come from across different client categories, and so the group sessions
are included as separate cost objects.
Table 4.1 shows the link between the processes and each of the cost objects. A brief
description of how this relationship is identified follows.
Consider as an example Process 1 (Book Client) which is shown to be consumed by
all cost objects except the group sessions. The reason for excluding group sessions is that
40

patients attending the group sessions will have already been booked as individual clients, and
so will not have to be booked again for group sessions. The same goes for processes 2, 4, 5,
and 7, which are unit-level activities, related to individual clients. Process 6 (Deliver group
sessions), on the other hand, is directly consumed by the cost object GRP only.
Table 4.1 Linking processes to cost objects
Activity dimension
# Process Cost objects
1. Book client LS, OM, M&I, PREG
2. Conduct initial assessment LS, OM, M&I, PREG
3. Schedule visits & follow-up with clients All
4. Deliver face-to-face follow-up LS, OM, M&I, PREG
5. Deliver telephone follow-up / consults LS, OM, M&I, PREG
CLIENT
6. Deliver group sessions GRP
7. Handle and maintain records LS, OM, M&I, PREG
8. Attend to correspondence & communication Reallocate to processes
1-7, 11
9. Develop & handle educational materials Reallocate to processes
2, 4, 6
10. Travel to deliver education All
11. Consult with clinicians & physicians OM, M&I, PREG
12. Sustain operations Reallocate to all other
processes
INTERNAL PROCESS
13. Create and implement strategic plans No cost driver link to selected cost objects or
other processes
14. Maintain certification Reallocate to processes
2, 4, 5, 6
15. Update knowledge and skills - Conferences Reallocate to processes
1-6, 9,11
16. Update knowledge and skills – Reading & Discussion
Reallocate to processes 1-6, 9,11
LEARNING & GROWTH
17. Maintain supporting system skills Reallocate to processes
1-9
18. Manage funding No cost driver link to selected cost objects or
other processes EXTERNAL STAKEHOLDER 19. Interact with public & drop-in clients No cost driver link to
selected cost objects or other processes
41

Certain processes, such as Process 12 (Sustain operations), include activities that are
essential for smooth operations and effective delivery of the organizational output (in this
case, education). However, instead of being consumed directly by the cost objects, these
service-sustaining processes facilitate other processes. Therefore, following the example of
Siegel et al. (1999), such processes are reallocated to the processes consuming them.
Finally, certain groups of activities, for example Process 13 (Create and implement
strategic plans), are facility-sustaining, and while essential to the success of the operational
unit as a whole, cannot be linked meaningfully either to any of the cost objects, or to other
processes. Process 19 (Interact with public) is another example of a process that is not
driven by the volume of clients or time spent on client groups. The costs associated with
such processes can be traced to the facility, but should not be arbitrarily assigned further
down to the client category-based cost objects (Kaplan & Cooper, 1998, p. 91). Such an
allocation that is made without a meaningful driver would distort cost information for the
cost objects. In Table 4.1, these processes are indicated with the comment “No cost driver link
to selected cost objects or other processes.” This does not mean that the costs of these processes are
excluded while estimating the cost of the program, but only that they are not passed on to
the individual cost objects.
4.1.4 Identifying drivers linking resources with processes
The purpose of this step is to identify the link between resource consumption and
processes. Table 4.2 shows the basis for allocating expenses of the diabetes program to each
of the 19 identified processes.
Resource costs were allocated to processes based on an understanding of the types
of resources or expenses included under each cost category, and the purpose of the expense.
For example, the cost item Staff compensation includes salaries, benefits and other employee
42

remuneration (excluding compensation paid to the program director). As every process
requires the resource that this expense pays for, it is allocated to all processes in the
proportion of the time spent on each activity. Program Director’s compensation on the other
hand, is paid to enable Process 13 (Create and Implement strategic plans), and Process 18
(Manage funding) as these are activities performed by the director.
Some expenses can be attributed directly to specific processes. For example, the cost
of promotion can be traced directly to Process 19 (Interact with public).
Appendix H provides a list and brief description of all cost items and drivers.
Table 4.2 Drivers linking resource costs to processes
Expense / Resource Driver Assigned to Process #
Staff compensation Time spent on each process All processes except 13 & 18
Program Director's compensation
Time spent on each process
13 – Create & implement strategic plans 18 – Manage funding
Educational material Direct 9 – Develop & handle educational material Travel between sites Direct 10 – Travel to deliver education Office supplies & small equipment Direct 12 – Sustain operations
Licence fees & other memberships Direct 12 – Sustain operations
Education & reference books
Time spent on each process
14 – Maintain certification 15 – Update knowledge (Conferences) 16 – Update knowledge (Reading & discussion)
Laboratory costs # of individual sessions
2 – Conduct initial assessment 4 – Deliver face-to-face follow-up
Equipment lease Direct 12 – Sustain operations
Medical supplies # of individual sessions
2 – Conduct initial assessment 4 – Deliver face-to-face follow-up
Occupancy costs Direct 12 – Sustain operations Promotion & advertising Direct 19 – Interact with public
Telecom Time spent on each process
3 – Schedule visits & follow-up with clients 5 – Deliver telephone follow-up & consults 8 – Attend to correspondence & communication
Allocated overheads Direct 12 – Sustain operations
43

4.1.5 Identifying activity drivers that link processes to cost objects
Table 4.3 Activity drivers linking process costs to cost objects
Dimension Process Activity driver Cost objects
1. Book client # of clients LS, OM, M&I, PREG
2. Conduct initial assessment # of initial assessment
minutes LS, OM, M&I, PREG
3. Schedule visits & follow-up with clients # of sessions (individual + group) All
4. Deliver face-to-face follow-up # of face-to-face follow-up minutes LS, OM, M&I, PREG
5. Deliver telephone follow-up / consults # of telephone follow-up minutes LS, OM, M&I, PREG
CLIENT
6. Deliver group sessions # of group sessions GRP
7. Handle and maintain records # of individual sessions LS, OM, M&I, PREG
8. Attend to correspondence & communication
Staff time spent on process
Reallocate to processes 1-7, 11
9. Develop & handle educational materials Staff time spent on process
Reallocate to processes 2, 4, 6
10. Travel to deliver education # of sessions (individual + group) All
11. Consult with clinicians & physicians # of minutes of consultation OM, M&I, PREG
12. Sustain operations Staff time spent on process
Reallocate to all other processes
INTERNAL PROCESS
13. Create and implement strategic plans No cost driver link to selected cost objects or other processes
14. Maintain certification Staff time spent on process
Reallocate to processes 2, 4, 5, 6
15. Update knowledge and skills - Conferences
Staff time spent on process
Reallocate to processes 2, 4, 5, 6
16. Update knowledge and skills – Reading & discussion
Staff time spent on process
Reallocate to processes 2, 4, 5, 6
LEARNING &
GROWTH
17. Maintain supporting system skills Staff time spent on process
Reallocate to processes 1-9
18. Manage funding No cost driver link to selected cost objects or other processes EXTERNAL
STAKE-HOLDER 19. Interact with public & drop-in clients No cost driver link to
selected cost objects or other processes
44

The next step is to link processes and their costs to specific cost objects using
appropriate activity drivers. Table 4.3 shows the drivers for each process. To facilitate
comparison across cost objects, Table 4.4 groups all processes for each cost object.
Table 4.4 Processes consumed by individual cost objects
Cost object Processes consumed
LS Client requiring lifestyle intervention only
1 – Book client 2 – Conduct initial assessment 3 – Schedule visits & follow-up with clients 4 – Deliver face-to-face follow-up 5 – Deliver telephone follow-up/consults 7 – Handle and maintain records 10 – Travel to deliver education
OM Client requiring oral medication
1 – Book client 2 – Conduct initial assessment 3 – Schedule visits & follow-up with clients 4 – Deliver face-to-face follow-up 5 – Deliver telephone follow-up/consults 7 – Handle and maintain records 10 – Travel to deliver education 11 – Consult with clinicians & physicians
M&I Client requiring oral medication & insulin or Client with comorbidities
1 – Book client 2 – Conduct initial assessment 3 – Schedule visits & follow-up with clients 4 – Deliver face-to-face follow-up 5 – Deliver telephone follow-up/consults 7 – Handle and maintain records 10 – Travel to deliver education 11 – Consult with clinicians & physicians
PREG Client with gestational diabetes
1 – Book client 2 – Conduct initial assessment 3 – Schedule visits & follow-up with clients 4 – Deliver face-to-face follow-up 5 – Deliver telephone follow-up/consults 7 – Handle and maintain records 10 – Travel to deliver education 11 – Consult with clinicians & physicians
GRP Group sessions
3 – Schedule visits & follow-up with clients 6 – Deliver group sessions 7 – Handle and maintain records 10 – Travel to deliver education
Consider Process 1 (Book client) and the associated driver (number of clients), which
imply that there is a direct relationship between the number of clients, and the cost of the
process i.e. if the number of clients increases, then the cost of the process will increase as it
45

has to be performed more often. Similarly, the costs of preparing and delivering group
sessions (Process 6) are directly proportional to the number of sessions delivered.
Reallocations of certain costs to other processes, such as the reallocation of Process
8 (Attend to correspondence) and Process 12 (Sustain operations), are based on time spent
on the processes to which allocation is made. No drivers are identified for unallocated costs.
4.1.6 An example for how process costs are computed
To clarify how the costs of processes are determined, a complete example is
presented for Process 1 (Book client). The first step was to identify the activities that form
this process. Due to their close relation, and the difficulty in estimating separate times for
each one, the activities Print off lab results; Review referral for priority; Triage referral; Book referral;
Sort referral and organize; Mail package were grouped into the single process – Book client.
The next step is to estimate the time spent on the process. Estimates from RHA
staff showed that administrative staff spent an average of 10 minutes booking each client,
while educators spent an additional 5 minutes per client. The total time spent on the process
for the year was then calculated based on the total number of clients in all categories. Using
an average compensation cost per minute for administrative and educator staff, the total cost
of the process was then calculated. As Table 4.2 (in Section 4.1.4) shows, the only cost item
allocated to this process was staff salary.
As this process can be traced to the selected client-based cost objects in the study,
there is no need for it to be reallocated to other processes. The next step, therefore, is to link
the process to various objects. The process cost driver is the number of clients, i.e. as the
number of clients increases, the time spent on the process and its total cost will increase. By
dividing the total cost of the process (approximately $30,120) by the total number of clients
(around 3295), the average cost of the process is calculated to be around $9.14 per client.
46

The total cost of Process 1 (Book client) is then allocated to each cost object, based on the
number of clients in the category. So, in the case of the category Clients requiring lifestyle
intervention only, the number of clients in the category is estimated to be around 2800, and so
the total cost of booking clients in this category is estimated at around $25,590.
In the next section, possible strategic uses of this type of information are discussed.
4.2 Using the ABC/BSC model for feedback control in diabetes education
The information obtained from the ABC/BSC model creates awareness about the
differences in resource consumption for different activities or client types. Some examples of
how the model does this are discussed in this section. Complete cost and driver information
is not included in the study for reasons of confidentiality. However, examples are provided
to discuss the relationships between activities and strategy, and how the model can be used
to influence cost management from a strategic point of view. The value of this strategic cost
management system can therefore be assessed based on its ability to complement strategic
plans (Finkler & Ward, 2003).
4.2.1 The costs of processes
The costs of the diabetes program are allocated to processes using the appropriate
drivers described in Table 4.2, and the total cost of each process. Information about the cost
of a specific process may allow decision makers to evaluate ways of controlling the cost,
especially if those activities are not directly related to meeting strategic goals. For example,
consider the information for the processes below.
Process Average cost Dimension 1 – Book client $0.61 /minute Client 10 – Travel to deliver education $0.90 /face-to-face session Internal process11 – Consult with clinicians & physicians $0.66 /minute Internal process
47

The cost of Process 1 (Book client) is $9.15 per client and, as an average of 15
minutes is consumed by this process (including administrative and clinical staff time), the
cost per minute is approximately $0.61. This activity does not directly contribute to the
achievement of any of the five strategic objectives of the program. Managers may therefore
feel this is a high cost to pay for a set of activities that do not add significantly to
achievement of strategy, and may try to find ways of reducing the time spent on the process.
Process 10 (Travel to deliver education) is a similar example of such a non-strategic process.
Process 11 (Consult with clinicians and physicians) on the other hand, has a unit
driver cost of approximately $0.66 per minute of consultation, and is a crucial part of the
education service. Sharing information and opinions about more complex cases is an integral
part of providing service to clients that helps educators understand a client’s condition. It
therefore contributes to the program objective of providing clients with the level of care they
need. So managers may not want to pressure educators to reduce time spent on such a
strategically relevant process. They may even try to increase the time spent on case
discussions if it leads to employee learning, especially given the relatively low cost per
minute, when compared to other processes.
While instinctively one may feel that activities in the Client dimension deserve
greater importance due to the personal interaction with clients, the above examples of
Processes 1 and 11 show that controlling activities based simply on the dimension may be
misleading. The purpose of an activity in relation to strategy must also be considered.
Information about costs of processes can also be useful to evaluate the processes in
relation to each other, and to identify better alternatives, that may cost less without
compromising strategic outcomes. This use of the cost information is consistent with the
suggested use of ABC cost data for optimizing resource allocation and use (Jagolinzer, 1984;
48

Kaskiw et al., 1987; Suthummanon et al., 2005). The ABC/BSC model provides the
additional link to strategy. For example, consider the following.
Process Average cost per minute Dimension 4 – Deliver individual (face-to-face) follow-up $0.75 Client 5 – Deliver telephone follow-up & consults $0.71 Client
Based on this information, RHA management could encourage clients to use
telephone or email for queries arising outside scheduled sessions. However, managers would
also have to consider the strategic impact of reducing the amount of face-to-face interaction.
This may not be a suitable course of action if it impacts quality of patient care, i.e. it
contradicts strategic objective 2 (To offer patients the right level of care at the right time).
These examples show the benefit of the combined cost management model over a
traditional ABC system, which would not link activities to strategic objectives. The examples
also highlight that the ABC/BSC model does not provide a direct cost solution. It must be
used with other strategically relevant information such as quality of service and client needs.
4.2.2 The costs of activity dimensions
Figure 4.2 (in section 4.1.2) shows the different processes within each of the activity
dimensions. Once the cost of each process has been computed as described in Tables 4.2
and 4.3, the total costs for each of the four activity dimensions can also be calculated. Table
4.5 summarizes this information for the RHA by showing the proportion of resources
consumed by each dimension.
Table 4.5 Proportional costs of RHA activity dimensions for Type-2 diabetes education
Dimension % of Total cost Client 36
Internal Process 59 Learning & Growth 2.5
External Stakeholder 2.5
49

This information can be used to evaluate the fit between resource use and strategic
objectives, and is part of monitoring strategy. For example, the RHA may find that the best
way to achieve strategic objective 2 (To offer patients the right level of care at the right time)
is through intensive personal interaction (either face-to-face or via telephone and email). The
distribution of costs shows that currently the resources used for internal processes (59%) is
more than 1.6 times that being spent on direct client interaction (36%). While some
activities within the Internal Process dimension are critical to meet strategic goals, a closer
analysis of the dimension may reveal possible avenues for cost control that will not impact
strategy achievement.
It is worth reiterating that the model does not provide strategic solutions, and only
informs decision making. Additional sources of information and more in-depth analyses of
qualitative factors are therefore essential when using the model.
4.2.3 The costs of client categories
Using information about the costs of processes and the different processes consumed by
each cost object, the total cost of each client category, and the average cost per client in each
category can be computed.
Table 4.6 Costs of client category cost objects at the RHA’s diabetes program
Cost object Total annual cost*
Avg. cost per client*
Clients requiring lifestyle intervention only $405,300 $ 144.75
Clients requiring oral medication $45,600 $ 276.50
Clients requiring oral medication & insulin $34,900 $ 423.50
Clients with gestational diabetes $99,400 $ 402.25
Group sessions $7,400 $ 154.00**
* Costs are rounded off ** Cost per session
50

Table 4.6 summarizes the cost per client information obtained for each cost object
from the RHA’s ABC/BSC model. The comparison of average cost per client (or session)
for the above cost objects makes it clear that there is a difference in the resources consumed
by the different patient categories. It would be absurd to suggest that the services to certain
groups of clients (such as cases requiring oral medication and insulin, or clients with
gestational diabetes) be curtailed because of higher average costs. However the model can
create the awareness that resources are consumed differently. Such a difference would be
intuitively expected, but the ABC/BSC model can also show where differences arise, and
their extent.
Decision makers can use this information when formulating strategic and operational
plans. For example, compare an anticipated increase in the number of gestational diabetes
clients with an anticipated increase in the number of clients that need lifestyle intervention
only. Management would have to provide more resources for an increase in the former
category, than if the increase were in the latter category. Budgeting for resources such as
educator time would be affected by this.
The above discussion uses the cost per client measure, though other measures such
as cost per hour of service could also be used. In fact, in case of large variations in time
spent on individual clients within the same category, other measures that are not client
specific may be more meaningful.
4.3 Using the model for feedforward control
The above examples of ABC/BSC model uses are based on feedback, i.e.
information about decisions already taken and implemented. However, Schreyögg and
Steinmann (1987) find that feedback control may not be received in time to make necessary
corrections to strategy implementation. They also state that for feedback control to be the
51

sole means of strategic management, the unrealistic assumption is made that there will be no
environmental changes that could necessitate changes to the strategic plan. A strategic tool
would therefore have to provide information that proactively influences future decisions.
The ABC/BSC model could address this issue by not only analyzing past data, but
also indicating the best direction for future actions (i.e. feedforward). By monitoring changes
in the environment, it could indicate where strategic adjustments may be needed. The
primary indicator of this nature from the ABC/BSC model would be variations in resource
consumption patterns. Variations in the cost of a process could be affected by two factors –
time spent on the process, and changes in other drivers such as client numbers.
4.3.1 Analyzing variations in time spent on processes
Changes in the average amount of time spent on a particular process could indicate a
change in the nature of service demanded by clients. For example, consider the client
category Oral medication & Insulin. Currently, the average time taken for Process 4 in the
model (Deliver individual follow-up) by this category is 270 minutes per client in the initial
year after referral to the RHA. If this average time decreases, it could indicate that clients
have fewer concerns or queries once the initial assessment has been completed. On the other
hand, if the average time increases, it might mean that clients are spending more time
interacting with their diabetes coach. Reasons for this could then be identified for either of
these situations, which may impact the way education is provided. Changes in client needs
and the instruction that is provided directly affect the achievement of the diabetes program’s
strategic objective number 2 (To offer patients the right level of care at the right time) and
number 3 (To make patients accountable for their health through consistent messages).
Traditional ABC could also indicate changes in the cost of individual processes.
However, because such a system would not link each activity to a specific strategic objective,
52

this valuable information may be lost among the large quantities of unstructured activity
information. The ABC/BSC model’s structure could thus be valuable for monitoring
assumptions and evaluating strategic objectives.
4.3.2 Analyzing variations in client numbers
Changes in the numbers of clients in different categories could also be an indicator
of changing environmental conditions. For instance, the current distribution of newly-
diagnosed Lifestyle only and Oral medication clients is in the ratio 17:1. A shift in numbers
towards clients requiring medication in order to control the disease may signify that lifestyle
habits are becoming less healthy and more awareness needs to be created. This could mean
changing the type of public awareness campaigns currently in place. This relates directly to
achievement of the RHA diabetes program’s strategic objectives 1 (Meeting the diabetes
needs of the community) and 5 (Providing effective messages to the community).
The above examples also highlight that the ABC/BSC model will not provide
reasons for changes in trends or costs. However it can direct decision makers’ attention to
strategic areas where there are changes, so that appropriate research and analysis can be
carried out to provide information for decision making.
4.4 Results of sensitivity analysis
All the examples used in this chapter are obtained from the model by making
assumptions about factors such as client numbers, time spent on processes, and staff
compensation. Appendix I presents the results of a sensitivity analysis showing how the
model changes with variations in some of these assumptions.
Consider the example of proportion of Type-2 cases. Based on the number of Type-
1 and Type-2 cases at the RHA, the baseline proportion of Type-2 cases is taken to be 85%.
The sensitivity analysis shows that when this is increased to 95%, the average cost per client
53

in each of the client categories (i.e. the cost objects) changes. For example, the cost per client
in the Lifestyle only category increases from $144.77 to $145.59, while the cost per client for
the same category falls to $143.84 when the proportion of Type-2 cases is considered to be
at a minimum level of 75% of all diagnosed cases.
The examples show that for the factors included in the sensitivity analysis, change in
costs for clients and activity dimensions is, for the most part, not significant. This could
indicate the model’s stability with respect to changes in the selected factors. As the model is
refined with use, the results of these analyses are likely to change as well.
54

5. Contributions, Limitations, and Conclusion
5.1 Contributions of the study
The study contributes to literature in three different areas by – (i) providing a model
for strategic cost management, (ii) using the model to provide strategic emphasis to
operational decisions, and (iii) providing activity and cost information for diabetes education.
5.1.1 Providing a tool for strategic cost management
A strategic cost management tool is developed in the study by leveraging the benefits
of two well-established management accounting systems. The ABC/BSC model provides a
tangible link between activities, activity costs, and their contribution to the strategic
objectives of an organization. This information can be used to evaluate strategic
implementation, and also to monitor the strategic environment and show where possible
changes in assumptions and strategies are needed. The study presents an example of a
strategic management tool that can use accounting information to provide strategic
orientation to cost control.
A review of strategy management literature shows that there is a specific need to
monitor the ever-changing environment of healthcare. The ABC/BSC model is therefore
relevant in the context it is applied to in the study. The model considers important external
factors causing environmental change through the Client and External Stakeholder dimensions.
By adding these to the Internal Process and Learning & Growth dimensions, the model
incorporates a wider range of factors, providing better input for strategic cost management.
5.1.2 Providing strategic emphasis to operational decisions
The second contribution of the study is to operational decision making. The
combined model retains all the operational advantages of the ABC, and can provide accurate
55

information about the resources consumed by different processes and cost objects. The
model can therefore be used to identify possible areas for cost control, how processes can be
modified to increase efficiency, and benchmark performance against reported best practices
(Siegel et al., 1999). The added advantage of the model is that these day-to-day, frontline,
operational decisions that affect consumption of resources (such as staffing, for example)
can be made while also considering whether the activities and outcomes of the decision are
consistent with the broader, strategic objectives of the organization.
5.1.3 Providing information about client education
While discussing the ABC/BSC model’s practical applications, the study provides a
list of activities necessary to providing diabetes client education. The ABC/BSC model also
shows how the different processes relate to the strategic goals for client education, and the
relative proportion of resources consumed by different dimensions of activity in a specific
diabetes program. The average costs per client for different client categories (cost objects)
are also calculated and reported. By including activity and cost driver information, the study
helps healthcare organizations understand the reasons for variation in costs of patient
education. All this information can be used to examine possible areas for cost control.
The actual processes and costs will vary between organizations, and the results from
the model may not be representative of the entire population of diabetes programs. So the
study does not merely summarize the results for client education, but also describes the
process of developing the combined model. Other programs can use this to create their own
models, making the study valuable to a broader audience.
5.2 Limitations of the study
The primary limitation of the study is that, owing to time constraints, the model’s use
in strategic decision making has not been evaluated by the RHA. Though the model
56

development has sound theoretical basis, a longitudinal study involving surveys and in-depth
interviews with decision makers would be necessary to show that input from the model has
practical value for organizations. This information is also needed to evaluate generalizability
of the model. However, there is no reason to believe that the model, if useful to one RHA,
would not be useful to other diabetes education situations, or to other organizations that
require a strategic perspective of cost management.
The quality of information obtained from a model is affected by the quality of the
input going into its development. The second limitation of the ABC/BSC model is that, in
its current form, it relies on historical cost data from year-end financial statements.
Therefore, the information from it may not be received in time to avoid the negative effects
of ineffective implementation or of changes in the strategic environment (Schreyögg &
Steinmann, 1987). However, ABC systems can be modified to use estimates and predict the
financial effects (such as resource requirements) of decisions before they are implemented
(Kaplan & Cooper, 1998), which would alleviate the negative effects of this limitation.
The third limitation pertains to the model as applied specifically to diabetes
education. The study uses limited data sources to develop the strategic model, focusing only
on Type-2 diabetes, and using activity and cost data collected from a single location of a
healthcare organization. The reliability of the model could be enhanced if more
geographically dispersed sources of information are used. Additional sources of information,
such as researcher observation and in-depth interviews could also be used to refine the
model. As far as the cost structure of diabetes patient education programs goes, the
generalizability of the findings from the study to other healthcare centres or regions is not
evaluated. However, given the extremely limited availability of cost information for chronic
disease education, the study’s contribution is not diminished by this factor.
57

The final limitation of the study arises from the set of assumptions it makes in
relation to diabetes patient education. The most important of these assumptions are that all
clients use all the recommended services the program offers, and that all clients within the
same category consume similar amounts of resources. In reality however, some clients do
not to return after initial assessment sessions, while others have more questions or concerns
and require additional consults. Anecdotal evidence shows that such differences are hard to
predict as they depend on individual client personalities. The proportion of such cases could
be noted from client records, and incorporated into the model to make it more realistic.
Also, once the model has been used and streamlined, clients using more or less than the
average amount of services could be added to the model as additional cost objects.
5.3 Future research directions
The value of the ABC/BSC model is based on the inherent premise that strategic
information and control have a positive impact on achievement of strategic objectives and
organizational performance. However, there is little empirical evidence in support of this
(Ittner & Larcker, 1997). Thus, more research is needed to positively claim that, as a strategic
management tool, the ABC/BSC model can contribute to organizational performance.
Another important area of study is the empirical evaluation of the ABC/BSC
model’s impact on strategic control. Such an evaluation could include its impact on
implementation control i.e. ensuring that strategy is implemented as planned, as well as
content control, i.e. shaping strategy content during implementation (Muralidharan, 2004).
Within the healthcare realm, once the model’s impact on strategic control and decision
making is better understood, further study could be made of the model’s eventual impact on
the service provided by healthcare organizations and patient outcomes.
58

More comprehensive longitudinal studies to assess the accuracy and usefulness of the
model in operational decision making are also a logical step from this study. From the point
of view of patient education information, studies could involve the inclusion of Type-1 and
Type-2 diabetes, as well as data collection from multiple locations or organizations.
Applicability of model to patient education in other chronic diseases, to other healthcare
services or even outside the health sector are also needed to show the true reliability of the
model in decision making. A more detailed sensitivity analysis of factors, such as differences
in resources consumed by individual clients, could also be included, testing the various
assumptions that are necessarily part of the costing of uncertain, complex services (Coombs,
1987) such as patient education.
Coombs (1987) raises a point that is relevant in the context of this study, and
indicates an interesting avenue of future research. An activity-cost system requires the active
co-operation of the people carrying out activities. However, managers and medical personnel
often do not perceive accounting information as being equally important to operational
decision making, and may have different objectives as well – the former more often tending
to use a cost-based definition of efficiency and the latter usually emphasizing the importance
of using the most effective medical techniques and optimizing patient outcomes (Coombs,
1987; Nyland & Pettersen, 2004). The combined model does highlight the importance of the
convergence of financial and strategic goals, and elaborately describes “the relationships
between clinical activities and resource consumption” (Coombs, 1987, p. 402), trying to
narrow the gap between the professional and administrative areas of activity. It would be
interesting to obtain the perceptions, from these different perspectives, of how influential
and useful such a strategic costing model is, and how authority and control are viewed to
shift when such a model is used to modify activity behaviour.
59

5.4 Final comments
The ABC/BSC model uses accounting information to show how much of an
organization’s resources are being utilized by specific activities, and whether or not this use
of resources contributes to achievement of strategic objectives. This information can show
where adjustments need to be made not only in operational decisions and implementation of
strategy, but even in the way a strategy has been formulated. Furthermore, strategic direction
and progress toward organizational goals need to be communicated regularly with variety in
delivery (Spanyi, 2003), at all levels of an organization. The ABC/BSC model could be a very
useful tool in this regard as it utilizes activity information, something individuals carrying out
the activities can closely identify with, to create a link with strategy.
In conclusion, it is important to point out that, while the model presented here is
useful in strategy evaluation and decision making, organizations must have other sources of
information as well. Strategic decision making is, as Dent (1990) succinctly states, “… a
complex, dynamic, multi-level activity, shaped by the interests of diverse individuals and
groups and the structural context through which decisions move” (p.14).
The greater the degree of environmental uncertainty, the greater should be the
quantity of data collected for strategic decision making (Makadok & Barney, 2001). Strategy
management based on a single source of information will be unidimensional and can
provide, at best, only a limited view of an organization’s internal and external environment.
This caveat is especially relevant in the current environment of increasing competition,
rapidly changing technology, and growing client knowledge and expectations, where
organizational success is often simply a war to survive. The ABC/BSC strategic cost
management model can thus be viewed as one possible weapon in an organization’s strategy
management arsenal.
60

References
Alberta Health & Wellness. (2005). Health regions. Retrieved August 2, 2006, from http://www.health.gov.ab.ca/regions/RHA.html
Bart, C. K., & Hupfer, M. (2004). Mission statements in Canadian hospitals. Journal of Health
Organization and Management, 18(2/3), 92-110. Beaty, L. (2005). A primer for understanding diagnosis-related groups and inpatient hospital
reimbursement with nursing implications [Electronic Version]. Critical Care Nursing Quarterly, 28, 360-369. Retrieved January 30, 2006 from the Academic Search Premier database.
Blake, J. T., & Carter, M. W. (2002). A goal programming approach to strategic resource
allocation in acute care hospitals [Electronic Version]. European Journal of Operational Research, 140, 541-561. Retrieved June 10, 2006 from the Elsevier ScienceDirect database.
Blocher, E. J., Chen, K., H., Cokins, G., & Lin, T. W. (2005). Cost management: A strategic
emphasis (3rd ed.). New York: McGraw-Hill. Bourie, P. Q. (1993). Costing the nursing service of patient education [Electronic Version].
Nursing Management, 24(8), 46-49. Retrieved March 10, 2006 from the ABI/INFORM Global database.
Bruton, G. D., Oviatt, B. M., & Kallas-Bruton, L. (1995). Strategic planning in hospitals: A
review and proposal [Electronic Version]. Health Care Management Review, 20, 16-25. Retrieved June 12, 2006 from the ABI/INFORM Global database.
Buckingham, M., & Loomba, A. P. S. (2001). Advantageous cost structure: A strategic
costing case study [Electronic Version]. Production & Inventory Management Journal, 42 (1), 12-18. Retrieved March 20, 2006 from the ABI/INFORM Global database.
Buller, P. F., & Timpson, L. (1986). The strategic management of hospitals: Toward an
integrative approach. Health Care Management Review, 11(2), 7-13. Canadian Diabetes Association (2005). Type 2 Diabetes - Things You Should Know.
Retrieved February 10, 2006, from http://www.diabetes.ca/Section_About/type2.asp
Canadian Diabetes Association, & Diabète Québec. (2005). Diabetes Report 2005: The
serious face of diabetes in Canada. Retrieved February 15, 2006, from http://www.diabetes.ca/files/diabetesreport2005/CDA-diabetesreport-2005-en.pdf
Caro, J. J., Salas, M., Ward, A. J., Raggio, G., O’Brien, J. A., & Grüger, J. (2003).
Combination therapy for type 2 diabetes: What are the potential health and cost Implications in Canada? [Electronic Version]. Canadian Journal of Diabetes, 27, 33-41.
61

Retrieved June 12, 2006 from http://www.diabetes.ca/Section_Professionals/pub_cjd.asp
Chan, Y. L. (1993). Improving hospital cost accounting with activity-based costing
[Electronic Version]. Health Care Management Review, 18, 71-77. Retrieved December 20, 2005 from the ABI/INFORM Global database.
Chow, C. W., Ganulin, D., Haddad, K., & Williamson, J. (1998). The balanced scorecard: A
potent tool for energizing and focusing healthcare organization management [Electronic Version]. Journal of Healthcare Management, 43, 263-280 . Retrieved April 10, 2006 from the ABI/INFORM Global database.
Coates, V. E. (1999). Education for patients and clients. London: Routledge. Coombs, R. W. (1987). Accounting for the control of doctors: Management information
systems in hospitals. Accounting, Organizations and Society, 12(4), 389-404. Cooper, R. (1996). Costing techniques to support corporate strategy: Evidence from Japan
[Electronic Version]. Management Accounting Research, 7, 219-246. Retrieved June 10, 2006 from the Elsevier ScienceDirect database.
Cooper, R., & Kaplan, R. S. (1988). Measure costs right: Make the right decisions [Electronic
Version]. Harvard Business Review, 66(5), 96-103. Retrieved March 22, 2006 from the Business Source Elite database.
Cuellar, A. E., & Gertler, P. J. (2006). Strategic integration of hospitals and physicians
[Electronic Version]. Journal of Health Economics, 25, 1-28. Retrieved June 10, 2006 from the Elsevier ScienceDirect database.
Daake, D., Dawley, D. D., & Anthony, W. P. (2004). Formal data use in strategic planning:
An organizational field experiment [Electronic Version]. Journal of Managerial Issues, 16, 232-247. Retrieved June 10, 2006 from the ABI/INFORM Global database.
Dansky, K. H., Weech-Maldonado, R., De Souza, G., & Dreachslin, J. L. (2003).
Organizational strategy and diversity management: Diversity-sensitive orientation as a moderating influence. Health Care Management Review, 28, 243-253.
Dent, J. F. (1990). Strategy, organization and control: Some possibilities for accounting
research. Accounting, Organizations and Society, 15, 3-25. Douglas, T. J., & Ryman, J. A. (2003). Understanding competitive advantage in the general
hospital industry: Evaluating strategic competencies [Electronic Version]. Strategic Management Journal, 24, 333-347. Retrieved May 12, 2006 from the ABI/INFORM Global database.
Eden, R., Lay, C., Maingot, M., & Doyle, G. (2006). Case studies of ABC adoption in
hospitals: A comparison across Canada and Ireland: University of Ottawa Working Paper.
62

Edwards, N., Downey, A., Griffin, P., Lang, A., & Eldred, S. (2005). Costing models for the implementation of RNAO best practice guidelines - Technical Report. Toronto: Ontario Ministry of Health & Long-Term Care.
Eisenhardt, K. M. (1989). Agency theory: An assessment and review [Electronic Version].
Academy of Management Review, 14, 57-74. Retrieved August 4, 2006 from the JSTOR Arts & Sciences database.
Elefalke, K. (2001). The balanced scorecard of the Swedish police service: 7000 officers in
total quality management project. Total Quality Management, 12, 958-966. Finkler, S. A., & Ward, D. M. (2003). The case for the use of evidence-based management
research for the control of hospital costs [Electronic Version]. Health Care Management Review, 28, 348-365. Retrieved June 30, 2006 from the Proquest Nursing & Allied Health Source database.
Gifford, B. D., Zammuto, R. F., Goodman, E. A., & Hill, K. S. (2002). The relationship
between hospital unit culture and nurses' quality of work life. Journal of Healthcare Management, 47(1).
Govindarajan, V., & Shank, J. K. (1992). Strategic cost management: Tailoring controls to
strategies. Cost Management, 6(3), 14-24. Gunasekaran, A. (1999). A framework for the design and audit of an activity-based costing
system [Electronic Version]. Managerial Auditing Journal, 14, 118-127. Retrieved April 10, 2006 from the ABI/INFORM Global database.
Heng, H. K. S., McGeorge, W. D., & Loosemore, M. (2005). Beyond strategy: Exploring the
brokerage role of facilities manager in hospitals. Journal of Health Organization and Management, 19, 16-31.
Henri, J.-F. (In press). Management control systems and strategy: A resource-based
perspective [Electronic Version]. Accounting, Organizations and Society. Retrieved June 24, 2006 from the Elsevier ScienceDirect database.
Hicks, D. T. (2005). Good decisions require good models: Developing activity-based
solutions that work for decision makers [Electronic Version]. Cost Management, 19(3), 32-40. Retrieved January 12, 2006 from the ABI/INFORM Global database.
Hwang, Y., & Kirby, A. J. (1994). Distorted Medicare reimbursements: The effect of cost
accounting choices. Journal of Management Accounting Research, 6, 128-143. Inamdar, N., & Kaplan, R. S. (2002). Applying the balanced scorecard in healthcare provider
organizations [Electronic Version]. Journal of Healthcare Management, 47, 179-196. Retrieved October 5, 2005 from the ABI/INFORM Global database.
63

Ittner, C. D., & Larcker, D. F. (1997). Quality strategy, strategic control systems, and organizational performance [Electronic Version]. Accounting, Organizations and Society, 22, 293-314. Retrieved June 24, 2006 from the Elsevier ScienceDirect database.
Jacobs, P., Assiff, L., Bachynsky, J., Baladi, J.-F., Botz, C., Brown, M., et al. (2000). A national
list of provincial costs for health care: Canada 1997/8, Version 1.0. Edmonton, Alberta: Institute of Health Economics.
Jacobs, P., Klarenbach, S., Ohinmaa, A., Golmohammadi, K., Demeter, S., & Schopflocher,
D. (2004). Chronic diseases in Alberta: Cost of treatment and investment in prevention. Retrieved January 30, 2006, from http://ihe.ca/working_papers.html
Jagolinzer, P. (1984). Costs per client served: An analytical tool for governmental agencies
and service providers. The Government Accountants Journal, 33(4), 37-44. Johnsen, Å. (2001). Balanced scorecard: Theoretical perspectives and public management
implications [Electronic Version]. Managerial Auditing Journal, 16, 319-330. Retrieved August 4, 2006 from the ABI/INFORM Global database.
Johnson, H. T. (1990). Beyond product costing: A challenge to cost management's
conventional wisdom. Journal of Cost Management, 4(3), 15-21. Kalagnanam, S. S. (2004). The adoption of the balanced scorecard in government-owned
corporations. In M. J. Epstein & J.-F. Manzoni (Eds.), Performance Measurement & Management Control: Superior Organizational Performance (First ed., Vol. 14). Greenwich, CT: JAI Press.
Kaplan, R. S., & Anderson, S. R. (2004). Time-driven activity-based costing [Electronic
Version]. Harvard Business Review, 82(11), 131-138. Retrieved February 12, 2006 from the Business Source Elite database.
Kaplan, R. S., & Cooper, R. (1998). Cost & Effect: Using integrated cost systems to drive profitability
and performance. Boston, MA: Harvard Business School Press. Kaplan, R. S., & Norton, D. P. (1992). The Balanced Scorecard - Measures that drive
performance. Harvard Business Review, 70(1), 71-79. Kaplan, R. S., & Norton, D. P. (1996). Using the balanced scorecard as a strategic
management system. Harvard Business Review, 74(1), 75-85. Kaplan, R. S., & Norton, D. P. (2001). The strategy-focused organization: How balanced scorecard
companies thrive in the new business environment. Boston, MA: Harvard Business School Press.
Karam, J. A., Sundre, A. M., & Smith, G. L. (1986). A cost/benefit analysis of patient
education. Hospital & Health Services Administration, 31(4), 82-90.
64

Kaskiw, E. A., Hanlon, P., & Wulf, P. (1987). Cost accounting in health care: Fad or fundamental? [Electronic Version]. Hospital & Health Services Administration, 32(4), 457-474. Retrieved February 10, 2006 from the ABI/INFORM Global database.
Khandwalla, P. N. (1972). The effect of different types of competition on the use of
management controls [Electronic Version]. Journal of Accounting Research, 10, 275-285. Retrieved June 20, 2006 from the JSTOR Arts & Sciences database.
Kiani, R., & Sangeladji, M. (2003). An empirical study about the use of ABC/ABM models
by some of the Fortune 500 largest industrial corporations in the USA [Electronic Version]. Journal of American Academy of Business, 3, 174-182. Retrieved February 1, 2006 from the ABI/INFORM Global database.
Killingsworth, B., Newkirk, H. E., & Seeman, E. (2006). An integrative health information
systems approach for facilitating strategic planning in hospitals. Health Care Management Review, 31, 119-129.
Langfield-Smith, K. (1997). Management control systems and strategy: A critical review
[Electronic Version]. Accounting, Organizations and Society, 22, 207-232. Retrieved June 24, 2006 from the Elsevier ScienceDirect database.
Lawrie, G., & Cobbold, I. (2004). Third-generation balanced scorecard: Evolution of an
effective strategic control tool [Electronic Version]. International Journal of Productivity & Performance Management, 53, 611-623. Retrieved June 21, 2006 from the ABI/INFORM Global database.
Loveman, E., Cave, C., Green, C., Royle, P., Dunn, N., & Waugh, N. (2003). The clinical
and cost-effectiveness of patient education models for diabetes: A systematic review and economic evaluation. Health Technology Assessment, 22(7). Retrieved January 25, 2006, from http://www.hta.nhsweb.nhs.uk/fullmono/mon722.pdf
Maher, M. W., & Marais, M. L. (1998). A field study on the limitations of activity-based
costing when resources are provided on a joint and indivisible basis [Electronic Version]. Journal of Accounting Research, 36, 129-142. Retrieved January 10, 2006 from the JSTOR database.
Maiga, A. S., & Jacobs, F. A. (2003). Balanced scorecard, activity-based costing and company
performance: An empirical analysis [Electronic Version]. Journal of Managerial Issues, 15, 283-301. Retrieved January 20, 2006 from the ABI/INFORM Global database.
Makadok, R., & Barney, J. B. (2001). Strategic factor market intelligence: An application of
information economics to strategy formulation and competitor intelligence. Management Science, 47, 1621-1638.
Maldonato, A., Bloise, D., Ceci, M., Fraticelli, E., & Fallucca, F. (1995). Diabetes mellitus:
Lessons from patient education [Electronic Version]. Patient Education and Counseling, 26, 57-66. Retrieved July 15, 2006 from the Elsevier ScienceDirect database.
65

Meeting, D. T., Saunders, G., & Curcio, R. F. (1988). Using DRGs and standard costs to control nursing labor costs [Electronic Version]. Healthcare Financial Management, 42(9), 62-74. Retrieved January 29, 2006 from the ProQuest Nursing Journals database.
Meltzer, S., Leiter, L., Daneman, D., Gerstein, H. C., Lau, D., Ludwig, S., et al. (1998). 1998
clinical practice guidelines for the management of diabetes in Canada [Electronic Version]. Canadian Medical Association Journal, 159 (Suppl. 8), S1-S29. Retrieved June 12, 2006 from http://www.cmaj.ca/cgi/content/full/159/8/DC1.
Mensing, C., Boucher, J., Cypress, M., Weinger, K., Mulcahy, K., Barta, P., et al. (2003).
National standards for diabetes self-management education [Electronic Version]. Diabetes Care, 26 (Suppl.1), S149-S156 . Retrieved December 20, 2005 from the ProQuest Nursing Journals database.
Mitchell, F. (1994). A commentary on the applications of activity-based costing. Management
Accounting Research, 5, 261-277. Retrieved January 23, 2006 from the Elsevier ScienceDirect database.
Muralidharan, R. (2004). A framework for designing strategy content controls [Electronic
Version]. International Journal of Productivity and Performance Management, 53, 590-601. Retrieved June 23, 2006 from the ABI/INFORM Global database.
Nair, M. (2000, Spring). Activity based costing: Who's using it and why? Management
Accounting Quarterly, 29-33. Negrini, D., Kettle, A., Sheppard, L., Mills, G. H., & Edbrooke, D. L. (2004). The cost of
hospital ward in Europe [Electronic Version]. Journal of Health Organization and Management, 18, 195-206. Retrieved January 12, 2006 from the ABI/INFORM Global database.
Norris, S. L., Engelgau, M. M., & Venkat Narayan, K. M. (2001). Effectiveness of self-
management training in type 2 diabetes [Electronic Version]. Diabetes Care, 24, 561-587. Retrieved January 31, 2006 from the Expanded Academic ASAP database.
Northcott, D., & Llewellyn, S. (2002). Challenges in costing health care services: Recent
evidence from the UK [Electronic Version]. The International Journal of Public Sector Management, 15, 188-203. Retrieved January 10, 2006 from the ABI/INFORM Global database.
Nyland, K., & Pettersen, I. J. (2004). The control gap: The role of budgets, accounting
information and (non-)decisions in hospital settings [Electronic Version]. Financial Accountability & Management, 20, 77-102. Retrieved May 23, 2006 from the Business Elite database.
OCCI. (Version 2.0). Ontario guide to case costing. Toronto: Ontario Case Costing Initiative.
Retrieved January 1, 2006 from http://www.occp.com/guide/o_guide.htm
66

Office of the Texas Comptroller of Public Accounts. (2001). Activity-Based Costing and
Management: The Texas Pilot Project. Retrieved September 7, 2006, from http://www.window.state.tx.us/specialrpt/abc/costmgmt.html
Ohinmaa, A., Jacobs, P., Simpson, S., & Johnson, J. A. (2004). The projection of prevalence
and cost of diabetes in Canada: 2000-2016 [Electronic Version]. Canadian Journal of Diabetes, 28(2), 1-8. Retrieved February 17, 2006 from http://www.diabetes.ca/Section_Professionals/cjd-jun04.asp.
Pink, G. H., McKillop, I., Schraa, E. G., Preyra, C., Montgomery, C., & Baker, G. R. (2001).
Creating a balanced scorecard for a hospital system [Electronic Version]. Journal of Health Care Finance, 27(3), 1-20. Retrieved October 10, 2005 from the ABI/INFORM Global database.
Pizzini, M. J. (2006). The relation between cost-system design, managers' evaluations of the
relevance and usefulness of cost data, and financial performance: An empirical study of US hospitals. Accounting, Organizations and Society, 31, 179-210.
Plowman, B. (1998). Activity Based Management: Improving processes and profitability. Aldershot:
Gower. Porter, M. (1996). What is strategy? Harvard Business Review, 74(6), 61-78. Radnor, Z., & Lovell, B. (2003). Defining, justifying and implementing the Balanced
Scorecard in the National Health Service [Electronic Version]. International Journal of Medical Marketing, 3, 174-188. Retrieved October 10, 2005 from the ABI/INFORM Global database.
Ramsey, R. H. (1994). Activity-based costing for hospitals [Electronic Version]. Hospital &
Health Services Administration, 39, 385-396. Retrieved January 10, 2006 from the ABI/INFORM Global database.
Roberts, V. (2001). Managing strategic outsourcing in the healthcare industry. Journal of
Healthcare Management, 46, 239-249. Rubin, A. L., & Blumer, I. (2004). Diabetes for Canadians for Dummies. Mississauga, ON: John
Wiley & Sons Canada. Ryan, E. A., Todd, K. R., Estey, A., Cook, B., & Pick, M. (2002). Diabetes education
evaluation: A prospective outcome study [Electronic Version]. Canadian Journal of Diabetes, 26, 113-119. Retrieved June 12, 2006 from http://www.diabetes.ca/Section_Professionals/pub_cjd.asp
Sapp, R. W., Crawford, D. M., & Rebischke, S. A. (2005). Activity-based information for
financial institutions [Electronic Version]. Journal of Performance Management, 18(2), 22-34. Retrieved May 13, 2006 from the ABI/INFORM Global database.
67

Schendel, D. E., & Hofer, C. W. (1979). Preface. In D. E. Schendel & C. W. Hofer (Eds.), Strategic management : A new view of business policy and planning. Boston, MA: Little, Brown.
Schreyögg, G., & Steinmann, H. (1987). Strategic control: A new perspective [Electronic
Version]. Academy of Management Review, 12, 91-103. Retrieved June 23, 2006 from the ABI/INFORM Global database.
Shank, J. K., & Govindarajan, V. (1993). Strategic Cost Management: The new tool for competitive
advantage. New York: The Free Press. Siegel, G., Florin, R., Ghosh, A., Ghosh, D., Hill, N., Kaciuba, G., et al. (1999). Applying
activity-based costing in healthcare. Montvale, NJ: IMA Foundation for Applied Research, Inc.
Simons, R. (1987). Accounting control systems and business strategy: An empirical analysis.
Accounting, Organizations and Society, 12, 357-374. Snow, C. C., & Hambrick, D. C. (1980). Measuring organizational strategies: Some
theoretical and methodological problems [Electronic Version]. The Academy of Management Review, 5, 527-538. Retrieved June 10, 2006 from the ABI/INFORM Global database.
Spanyi, A. (2003). Strategic achievement [Electronic Version]. Industrial Engineer, 35(3), 40-43.
Retrieved June 23, 2006 from the ABI/INFORM Global database. Suthummanon, S., Omachuno, V. K., & Akcin, M. (2005). Applying activity-based costing to
the nuclear medicine unit [Electronic Version]. Health Services Management Research, 18, 141-150. Retrieved January 12, 2006 from the ABI/INFORM Global database.
Swenson, D. (1995). The benefits of activity-based cost management to the manufacturing
industry [Electronic Version]. Journal of Management Accounting Research, 7, 167-180. Retrieved May 12, 2006 from the Business Source Elite database.
UK Department of Health, & Diabetes UK. (2005). Structured patient education in diabetes: Report
from the Patient Education Working Group. London: Department of Health. Retrieved June 12, 2006 from http://www.diabetes.nhs.uk/Reading_room/Other_Resources.asp
US Congress OTA. (1983). Diagnosis Related Groups (DRGs) and the Medicare program:
Implications for medical technology - A Technical Memorandum (No. OTA-TM-H-17). Washington, D.C.: U.S. Congress, Office of Technology Assessment. Retrieved January 29, 2006 from http://govinfo.library.unt.edu/ota/1983ota.htm
Udpa, S. (1996). Activity-based costing for hospitals [Electronic Version]. Health Care
Management Review, 21, 83-96. Retrieved December 12, 2005 from the ABI/INFORM Global database.
68

Voordt, T. J. M. van der. (2004). Costs and benefits of flexible workspaces: work in progress in The Netherlands [Electronic Version]. Facilities, 22, 240-246. Retrieved December 14, 2005 from the ABI/INFORM Global database.
Wagner, E. H., Sandhu, N., Newton, K. M., McCulloch, D. K., Ramsey, S. D., & Grothaus,
L. C. (2001). Effect of improved glycemic control on health care costs and utilization. Journal of the American Medical Association, 285, 182-189.
Waters, H., Abdallah, H., Santillán, D., & Richardson, P. (2003). Application of activity-based
costing (ABC) in a Peruvian NGO healthcare system (Operations Research Results 1 [3, Revised]). Bethesda, MD: The Quality Assurance Project (QAP) for U.S. Agency for International Development (USAID). Retrieved September 7, 2006, from http://www.qaproject.org/pubs/pubsor.html#cost
Wells, R., Lee, S.-Y. D., Mcclure, J., Baronner, L., & Davis, L. (2004). Strategy development
in small hospitals: Stakeholder management in constrained circumstances. Health Care Management Review, 29, 218-228.
Williams, A. R., McDougall, J. C., Bruggeman, S. K., Erwin, P. J., Kroshus, M. E., &
Naessens, J. M. (2004). Estimation of unreimbursed patient education costs at a large group practice [Electronic Version]. The Journal of Continuing Education in the Health Professions, 24, 12-19. Retrieved January 27, 2006 from the Wiley InterScience database.
Yasin, M. M., Zimmerer, L. W., Miller, P., & Zimmerer, T. W. (2002). An empirical
investigation of the effectiveness of contemporary managerial philosophies in a hospital operational setting. International Journal of Health Care Quality Assurance, 15, 268-276.
Zelman, W. N., Pink, G. H., & Matthias, C. B. (2003). Use of the balanced scorecard in
health care [Electronic Version]. Journal of Health Care Finance, 29(4), 1-16. Retrieved November 2, 2005 from the ABI/INFORM Global database.
69

Appendix A About the Balanced scorecard
The following figure A1 summarizes the BSC process.
Mission Statement What is the purpose of the organization’s operations?
Long-term objectives What must the organization achieve in the next 10-15 years to fulfill its
stated mission?
Strategy What are the operational steps to be taken to achieve these objectives?
Identify dimensions or perspectives of performance What areas of performance must be focused on to make the strategy a success?
Identify goals within each perspective What has to be done within in each performance dimension to make the
strategy a success?
Identify measures of the above goals How can we measure achievement of the identified goals within each
perspective?
Set targets for each measure How do we know what to work towards?
Measure performance How do we know what we are doing and where we have to improve?
Balanced scorecard process
Very broad Impossible to
objectively evaluate
performance
More specific actions
Still hard to set performance
targets
Very specific actions
Very clear measurement
of targets
Clear target to work towards
Possible to evaluate
performance
Figure A1 How the balanced scorecard translates strategy at the operational level
Adapted from Kaplan & Norton (2001)
70

Figure A2 is an example of BSC perspectives, goals and measures for a general hospital. The arrows in the figure indicate that the perspectives are linked to each other by congruent goals with the same strategic focus.
Financial perspective How do we look to shareholders?
Goals Measures Revenue growth ∼ Increased revenue from
new services Efficient resource
utilization
∼ Asset utilization ratio
Customer perspective How do customers see us?
Goals Measures Prompt emergency room response
∼ Avg. time to respond
∼ Patient satisfaction scores
High quality care ∼ Patient evaluations ∼ Repeat patients
Community image
∼ No. of favourable news articles in past year
Internal process perspective
What must we excel at? Goals Measures
Continuous innovation
∼ No. of new services in past 5 years
∼ Expenditure on new equipment/Total expenditure
∼ Utilization ratio of new software & equipment
Service excellence ∼ No. of complaints ∼ Accurate diagnosis rate
Maintain status as preferred employer
∼ Employee turnover ratio
∼ Employee satisfaction scores
Learning & Growth
How can we continue to improve? Goals Measures
Collaborate with medical community
∼ No. of conferences attended by employees
∼ No. of joint activities with other agencies
Promote research & maintain state-of-the-art skills
∼ No. of professional presentations & publications by staff
∼ No. of ongoing instructional programs
Figure A2 An example of a balanced scorecard for a hospital Adapted from Kaplan & Norton, 1992; Chow et al., 1998
71

Appendix B About diabetes
The following information about diabetes mellitus is taken from Rubin and Blumer’s Diabetes for Canadians (2004) and the Canadian Diabetes Association (CDA) website (2005).
What is diabetes? Glucose (or blood sugar) is the fuel used by the body to move muscles and also
helps certain chemical reactions to take place in the body. The glucose level in the human body is maintained by the pancreatic hormone insulin, without which cells are unable to absorb glucose and tissues start to break down. Diabetes is a chronic condition caused by insufficient amounts of insulin. The two main types of diabetes are Type-1, where the pancreas ceases to produce insulin, and Type-2, where the pancreas does not produce enough insulin or the body cannot effectively use insulin that is produced. Type-2 accounts for about 90% of diagnosed cases. A third type of diabetes is gestational diabetes with onset of the disease during pregnancy.
Causes, symptoms, & effects of diabetes The causes of diabetes are still not fully understood. Table A1 lists factors commonly believed to cause diabetes, and common symptoms associated with its different types.
Certain populations are considered to be at higher risk of being diabetic, including people of Aboriginal, Hispanic, South Asian, Asian, and African descent. Other causes of diabetes include surgical removal of the pancreas, pancreatitis, steroidal medicines, and certain alternative medicine treatments.
Diabetes, if not properly cared for, often leads to complications including peripheral vascular disease, heart disease, strokes, kidney disease, and blindness.
Controlling diabetes Depending on the type and severity, the three key therapies in diabetes management
are (i) diet management, (ii) exercise, and (iii) medication including oral agents and insulin. In addition to these treatments, people with diabetes must test their glucose levels regularly using a blood glucose meter, including before and post-meal tests. Again, the frequency of these tests varies with the type of diabetes and therapy being used. For example, if treatment consists only of lifestyle measures, testing once daily is sufficient, whereas someone taking insulin 3 or 4 times a day would have to test 4 to 7 times daily.
Another form of testing is A1C testing. Haemoglobin in the blood attaches itself to
glucose and forms glycohaemoglobin, of which the A1C form is the largest fraction and the easiest to test for. The amount of glycohaemoglobin in the blood is directly proportional to the amount of the glucose in the body, and remains in the blood for as long as the red blood cell that contains it exists (about 120 days). A1C levels therefore indicate glucose control over a longer period time, and these tests are used to complement blood glucose monitoring.
72

Table A1 Partial list of causes and common symptoms of diabetes
Adapted from Rubin & Blumer (2004) and CDA (2005)
Type Possible Causes Common Symptoms
1
∼ Antibodies attacking islet cells of pancreas because of viruses that shared appearance with pancreatic cells, or protein in cow’s milk causing same response as to a virus in non-breastfed babies
∼ Direct damage to pancreas by virus
∼ Accumulation of oxygen-free radicals in pancreas
∼ Ingestion of certain poisons or chemicals
∼ Frequent urination
∼ Increased thirst
∼ Weight loss & increased hunger
∼ Fatigue
∼ Fruity breath
∼ Blurred vision
2
∼ Genetic predisposition
∼ Overweight and sedentary lifestyle
∼ Being a member of a population considered to be at high risk for diabetes
∼ Frequent urination
∼ Increased thirst
∼ Weight loss & increased hunger
∼ Fatigue
∼ Blurred vision
∼ Slow wound healing
∼ Yeast infections
∼ Numbness in extremities
Gestational
∼ Obesity
∼ Age over 35 years
∼ History of polycystic ovary syndrome
∼ Being a member of a population considered to be at high risk for diabetes
∼ Similar to Type-2
Costs of diabetes Since diabetes often leads to severe health complications, its costs include not only
hospitalisation and rehabilitation, but also loss of economic productivity (CDA & Diabète Québec, 2005).
Table A2 shows the expected change in healthcare costs and prevalence of diabetes in each province of Canada.
73
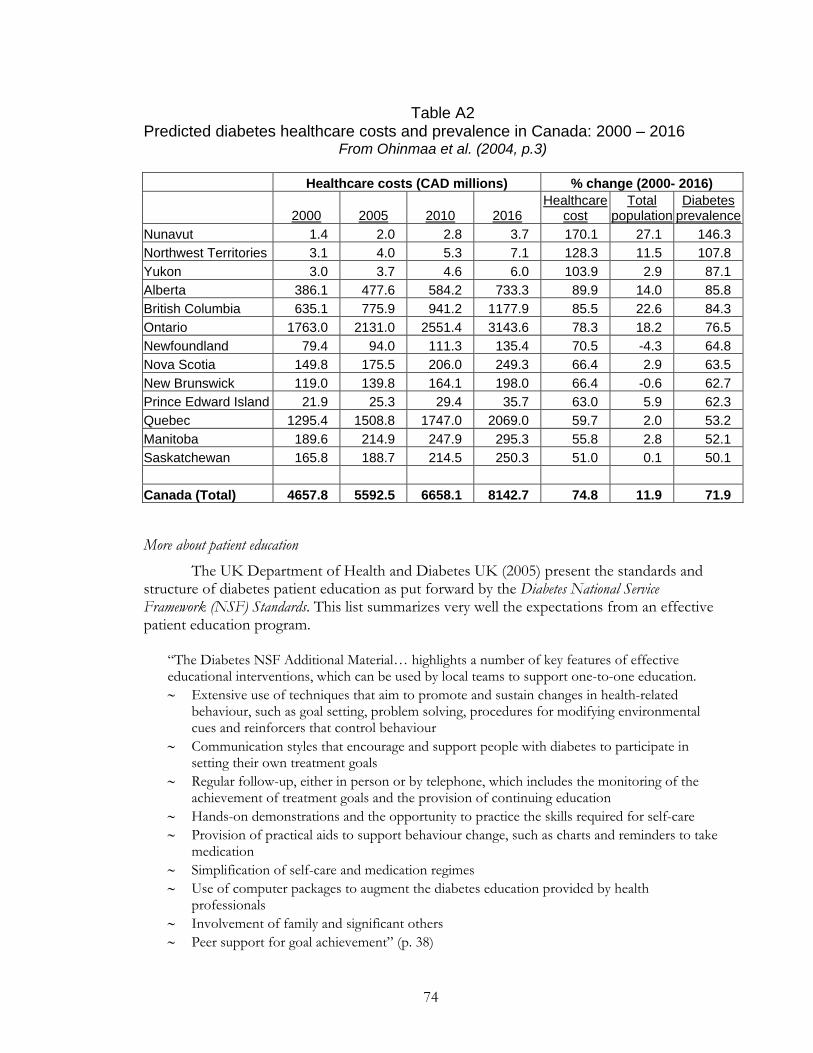
Table A2 Predicted diabetes healthcare costs and prevalence in Canada: 2000 – 2016
From Ohinmaa et al. (2004, p.3)
Healthcare costs (CAD millions) % change (2000- 2016)
2000 2005 2010 2016Healthcare
costTotal
populationDiabetes
prevalenceNunavut 1.4 2.0 2.8 3.7 170.1 27.1 146.3 Northwest Territories 3.1 4.0 5.3 7.1 128.3 11.5 107.8 Yukon 3.0 3.7 4.6 6.0 103.9 2.9 87.1 Alberta 386.1 477.6 584.2 733.3 89.9 14.0 85.8 British Columbia 635.1 775.9 941.2 1177.9 85.5 22.6 84.3 Ontario 1763.0 2131.0 2551.4 3143.6 78.3 18.2 76.5 Newfoundland 79.4 94.0 111.3 135.4 70.5 -4.3 64.8 Nova Scotia 149.8 175.5 206.0 249.3 66.4 2.9 63.5 New Brunswick 119.0 139.8 164.1 198.0 66.4 -0.6 62.7 Prince Edward Island 21.9 25.3 29.4 35.7 63.0 5.9 62.3 Quebec 1295.4 1508.8 1747.0 2069.0 59.7 2.0 53.2 Manitoba 189.6 214.9 247.9 295.3 55.8 2.8 52.1 Saskatchewan 165.8 188.7 214.5 250.3 51.0 0.1 50.1 Canada (Total) 4657.8 5592.5 6658.1 8142.7 74.8 11.9 71.9
More about patient education The UK Department of Health and Diabetes UK (2005) present the standards and structure of diabetes patient education as put forward by the Diabetes National Service Framework (NSF) Standards. This list summarizes very well the expectations from an effective patient education program.
“The Diabetes NSF Additional Material… highlights a number of key features of effective educational interventions, which can be used by local teams to support one-to-one education. ∼ Extensive use of techniques that aim to promote and sustain changes in health-related
behaviour, such as goal setting, problem solving, procedures for modifying environmental cues and reinforcers that control behaviour
∼ Communication styles that encourage and support people with diabetes to participate in setting their own treatment goals
∼ Regular follow-up, either in person or by telephone, which includes the monitoring of the achievement of treatment goals and the provision of continuing education
∼ Hands-on demonstrations and the opportunity to practice the skills required for self-care ∼ Provision of practical aids to support behaviour change, such as charts and reminders to take
medication ∼ Simplification of self-care and medication regimes ∼ Use of computer packages to augment the diabetes education provided by health
professionals ∼ Involvement of family and significant others ∼ Peer support for goal achievement” (p. 38)
74

Appendix C
About the RHA diabetes program
The following are the usual steps involved in diabetes education at the RHA.
Process:
A client is usually referred to the RHA for diabetes education by their personal physician, though walk-in cases are also common. Based on clinical reports, an initial session is scheduled with a “coach” who is the educator, and is either a registered nurse (RN) or a registered dietician (RD). The coach is the person actively involved in the following steps of the education process.
Initial assessment sessions provide basic information about what diabetes is, what clients need to watch for, the importance of diet and exercise, self-testing blood glucose or A1C levels, and if relevant, oral medication dosages and administering insulin.
Follow up sessions allow clinicians and clients to discuss any doubts they have, progress that has been made, changes in routine as needed. The number of follow-up meetings depends on a number of factors including complexity of cases and clients’ psychological need for support. The average number of follow-up visits for different patient categories is discussed later in this section. Clients and educators at the RHA unit often prefer telephone sessions as it is more convenient and saves time.
Group sessions cover general and specific topics such as diet and recipes for persons living with diabetes, the importance of exercise, ways to create an active lifestyle, and simple exercise routines, herbal remedies etc., and allow a maximum of 12-15 patients and their spouses to learn useful and important skills for living well. The average number of attendees at the RHA is usually around 12, i.e. with 6 patients and 6 family members. These sessions are delivered by a single educator (either RN or RD). Though specific sessions are recommended to each client by his/her coach (usually covering two or three topics), the actual number of sessions actually attended depends on a client’s personal choice and therefore varies between individuals.
Program staff: At the time of the study, the educator staff in the program consisted of the full-time
equivalent of three full-time RDs, and four full-time RNs, one of whom acted as team lead. All nursing staff teaching in the RHA’s Diabetes Program are required to have a degree in nursing, and with the exception of two or three clinicians, all other educators have Certified Diabetes Educator (CDE) certification. The clinicians are assigned as coaches to specific clients, and their primary duties include triaging the cases referred to the RHA, consulting with clients in person and over the telephone, charting, and updating the referring physicians about client progress.
Three full-time administrative support staff members work in the diabetes program performing duties such as booking client visits, identifying coaches for each case based on time availability, purchasing supplies and materials, and other general administration. The management activities in the diabetes education program at the selected location include planning, budgeting, and strategic change initiatives, and are handled by the team lead, a clinical co-ordinator, and the program director.
75

Patient categories: The patient education program, though including some specified modules and information, is not a single, homogenous unit of information transferred in a fixed number of sessions. Patients’ clinical conditions and the existence of co-morbidities, psychological acceptance of the condition, and other personal characteristics affect the number and duration of sessions with clinicians. The client categories that are used in the study as cost objects are
Type-2 Stable A1C – Lifestyle only Type-2 Elevated A1C – Oral Meds Type-2 Elevated A1C –Meds & Insulin or Type-2 with Comorbidities Type-2 – Gestational Group sessions
These categories are discussed in more detail in section 4.1.3.
76

Appendix D Data collection form for RHA staff
77

78

79

80

81 81

82 82

83 83

Appendix E Sample interview protocol for a clinician interview
Greeting and introduction
∼ Appreciation of participation
Response-specific questions
∼ I notice you recorded spending – minutes per week on the activity “Maintain
patient records”. Please tell me a little more about this activity.
(Similar question repeated for all activities consuming relatively larger
amounts of employee time)
∼ For activity “Consult with clinicians”, you note spending – minutes per day.
Does the amount of time spent vary with the number of clients or sessions in
the day?
∼ You say you spend – minutes for every group session. Can you tell me a little
more about what the group sessions are about?
∼ How many educators are present at each group session?
∼ You have added the activity “Interact with physicians”. What exactly does this
involve or what is the purpose of this interaction?
∼ You have added the activity “Read diabetes-related journals”. Could you
estimate how much time you spend on this activity?
General questions
∼ Can you think of any other activities that have been missed that should be
included?
∼ Do you have any other questions or comments about the study?
∼ If you think of any other activities that you think are significant, please feel
free to email or call me.
Thanks and closing remarks
84

Appendix F Study Assumptions
1. A newly diagnosed case is considered to extend up to one year following initial assessment.
2. For simplicity it is assumed that, within each of the identified categories, the number of sessions, time spent in individual sessions, and the resources consumed remain constant for all individuals.
3. Costs are apportioned between Type-1 and Type-2 diabetes based on the proportion of cases.
4. It is assumed that the Director spends 25% time on the diabetes program.
5. The following information was used while estimating the costs of different processes and activity dimensions at the RHA centre. All numbers are based on input from RHA staff and internal documents, unless otherwise stated.
Number of clients in different categories per year – Type 2
% of total Lifestyle only 2437 85 Oral medication required 143 5 Oral medication & Insulin required 72 2.5 Pregnancy 215 7.5
TOTAL 2868 Number of group sessions 48 ` Average number of clients per session 5
Time spent on individual sessions
Number of sessions
Time per session (in minutes)
Total time per client
(in minutes)
Initial assessment
Follow-up
Initial assessment
Follow-up*
Lifestyle only 1 2 50 35 120 Oral medication required
1 4 70 40 230
Oral medication & Insulin required
1 9 60 30 330
Pregnancy 1 6 90 45 360 * 2/3 of follow-up is assumed to be done face-to-face while the remaining 1/3 is done over the telephone.
85

Information about selected processes* Process Performed by Average time
(in minutes) Driver
Descriptive note
Administrative staff
10 Book client
Educator 5
Per client
Schedule visits & follow-up with
clients
Administrative staff
5 Per face-to-face session
Include initial assessment and face-to-face follow-up sessions
Educator 5 Deliver group
sessions Educator 150 Per session
Handle & maintain records
Educator 15 Per individual session
Including all sessions except group sessions
Attend to correspondence
& communication
Administrative staff
295 Per day Per employee
All other staff 120 Per day Per employee Develop &
handle educational materials
Educator 620 Per month Total for all educators
Administrative staff
60 Per month Total for all admin staff
Travel to deliver education
Educator 75 Per week Total for all educators
Consult with clinicians & physicians
Educator 315 Per week Total for all educators
Sustain operations
Administrative staff
1175 Per week Total for all admin staff
Manager 167 Per week Total for all managers
Maintain certification
Educator 625 Per year Total for all educators
Manager (Trainer) 1850 Per year Total for all managers
Update skills – conferences
Educator 2500 Per year Total for all educators
Manager 6000 Per year Total for all managers
Update skills –Discussion &
reading
Educators 1550 Per month For all educators
Maintain supporting
system skills
Administrative staff
1600 Per year Total for all admin staff
Educator 6200 Per year Total for all educators
* Time taken by different staff levels is shown separately due to differences in pay scales.
86

Information about selected processes*
Process Performed by Average time (in minutes)
Driver
Descriptive note
Create & implement
strategic plans
Director 260 Per week
Manage funding Director 185 Per week Interact with
public & drop-in clients
Admin 6660 Per year Total for all admin staff
Manager 7400 Per year Total for all managers
* Time taken by different staff levels is shown separately due to differences in pay scales.
Compensation information Employee category Pay scale
Per hour (in $)
Source of information
RD 32.58 Union Collective agreement RN / Manager 32.56 Union Collective agreement
Administrative staff 25.00 Assumption
Director 50.00 Based on average Director-level salary in Annual Report
87

Appendix G List of RHA education and support activities grouped into processes
Dimension Activity Process
1. Print off lab results 2. Review referral for priority 3. Triage referral 4. Book referral 5. Sort referral and organize 6. Mail package to client
1. Book client
7. Conduct initial assessment 2. Conduct initial assessment 8. Book sessions 9. Call clients to confirm session bookings 10. Follow-up with clients who miss sessions
3. Schedule visits & follow-up with clients
11. Prepare for 1-1 sessions 12. Conduct follow-up sessions (face to face)
4. Deliver face-to-face follow-up
13. Conduct follow-up sessions / consults (telephone)
5. Deliver telephone follow-up / consults
14. Prepare for group sessions
CLIENT
15. Conduct group sessions 6. Deliver group sessions
16. Maintain individual patient records
17. Pull labs 7. Handle and maintain records
18. Check email & phone messages 19. Answer telephone calls (with persons
other than clients) 20. Deliver faxes
8. Attend to correspondence & communication
21. Develop resource materials 9. Develop & handle educational materials
22. Travel between centres 10. Travel to deliver education 23. Attend group meetings 24. Consult with other clinicians for specific
cases 25. Interact with physicians for specific cases
11. Consult with clinicians & physicians
26. Purchase general office supplies / equipment
27. Provide IT support 28. Create and update internal documents 29. Monitor computer system 30. Develop employee schedules 31. Carry out staffing functions 32. Maintain financial records
12. Sustain operations
33. Evaluate system changes 34. Create budgets
INTERNAL PROCESS
35. Develop other strategic plans
13. Create and implement strategic plans
88

Dimension Activity Process
36. Maintain CDE certification 37. Maintain BGM certification
14. Maintain certification7
38. Attend diabetes-related conferences 39. Attend training sessions for diabetes
education 40. Organize learning fairs 41. Attend learning fairs
15. Update knowledge and skills - Conferences
42. Read literature to update knowledge 43. Discuss new methods & information
16. Update knowledge and skills – Reading & discussion
44. Attend training sessions for systems such as IT
LEARNING & GROWTH
45. Practice using IT system 17. Maintain supporting system skills
46. Manage program funding 18. Manage funding
47. Create public awareness about diabetes and the BHL program
EXTERNAL STAKEHOLDER
48. Provide information and support to drop-ins
19. Interact with public & drop-in clients
7 CDE: Certified Diabetes Educator; BGM: Blood Glucose Monitoring
89

Appendix H Resources, cost drivers and activity drivers at the RHA
Cost drivers linking resources with processes:
All the resource costs considered in the study were annual costs. Seasonal variations are therefore incorporated into the total, and are averaged out.
Staff compensation ∼ This cost includes basic salaries, and health and other benefits for administrative and
clinical personnel such as RDs and RNs. ∼ This resource was allocated to processes based on the time spent by staff on each of the
19 processes. Time estimates for the different activities were collected from RHA staff.
Program Director's compensation ∼ This cost includes basic salary, and other benefits for the Diabetes program director. As
the Director plays multiple roles, including management of initiatives other than diabetes education, an assumption is made about the amount of the time spent on the diabetes program. The proportionate amount of compensation is what is considered here.
∼ This resource was allocated to processes based on the time spent by the director on each of the identified processes.
Educational material ∼ This expense includes the cost of developing, printing and photocopying any educational
material, such as brochures, handouts, health journals, etc. ∼ The expense is directly allocated to the process of development of educational materials.
Travel ∼ This cost primarily consists of the reimbursements made to employees for travel
between two different teaching sites. ∼ It is directly allocated to Process 10 (Travel to deliver education).
Office supplies and small equipment ∼ These expenses relate to running and maintaining an office and include items such as
printing expenses and stationery. ∼ It is allocated directly to Process 12 (Sustain operations).
License fees and memberships ∼ This is the cost of membership to professional associations and unions. ∼ It is allocated directly to Process 12 (Sustain operations).
Education and reference books ∼ These are educational costs and clearly relate to the processes of maintaining skills
(Processes 14-16). ∼ They are allocated to the different processes in the proportion of time spent on each.
Laboratory ∼ This expense category includes the cost of running and maintaining the in-house
laboratory that is used for regular tests such A1C testing, and includes unit-level costs (such as specimen collection supplies), and overheads (such as lab staff salaries). The lab is used by diabetes patients other than those with Type-2 diabetes, by other programs
90

besides diabetes, and also by some external users. While unit-level costs can be traced directly to individual types of users, the overheads are allocated to the different groups of users, including Type-2 diabetes education, based on the number of clients.
∼ The lab costs are further allocated to Process 2 (Conduct initial assessment) and Process 4 (Deliver follow-up), as these are the points at which the services of the lab are usually made use of. The costs are allocated based on the number of individual sessions, which includes each time a client returns. So, if following an initial assessment session, a client returns for two follow-up sessions, the total number of individual sessions is three.
Equipment lease ∼ This cost includes the maintenance cost for computers, and other equipment. It is
allocated directly to Process 12 (Sustain operations).
Medical supplies ∼ This includes items such drugs and surgical supplies such as lancets and sharps. ∼ These items are usually used in individual sessions with clients, and so are allocated to
Process 2 (Conduct initial assessment) and Process 4 (Deliver follow-up) based on the number of sessions.
Occupancy ∼ This cost category includes items such as utilities, repairs and maintenance, and
insurance of premises that are charged to the diabetes program from the shared facility where it is located.
∼ It is assigned to Process 12 (Sustain operations) directly.
Promotion & advertising ∼ This category includes all expenses related to creating awareness about diabetes, the
importance of education, and type of services provided by the RHA. ∼ As the purpose of this expense is to create awareness among the general community, it is
assigned to Process 19 (Interact with public).
Telecom ∼ The telecommunications expense category includes telephone, fax, and Internet charges. ∼ The allocation of this expense is made to Process 3 (Schedule visits), Process 5 (Deliver
telephone follow-up/consults), and Process 8 (Attend to communication and correspondence), as these are the major consumers of the resource.
Allocated overheads ∼ This includes a portion of the costs of the RHA’s central management, executive offices,
organization-wide IT system development and maintenance, financial costs etc., which are passed on to the health unit of which diabetes education is a part. An allocation of these overheads is in turn made to the diabetes program, based on a suitable cost driver, in this case, the number of full-time equivalent employees.
∼ The portion passed on to the diabetes program is further charged directly to the process of sustaining operations (Process 12).
91

Description of activity drivers linking processes with cost objects:
Number of clients ∼ This driver is used to assign processes 1 (Book client) and 2 (Conduct initial assessment)
to the cost objects. The number of clients in each category is estimated from internal records.
Number of individual sessions ∼ An individual session is identified as a one-to-one interaction directly between an
educator and a client. This number is different from the number of clients, as a client may return for more than one follow-up.
∼ The absolute number of sessions is considered for processes where each session requires activities to be carried out, irrespective of the duration of each session. Process 3 (Schedule visits and follow-up) is an example.
Number of follow-up sessions ∼ This is the number of sessions clients in each category attend, either in person or over
the telephone, once the initial assessment has been completed. ∼ This category can be further divided into # of face-to-face follow-ups and # of telephone sessions.
The number of sessions in each of these sub-groups is based on estimates by staff.
Number of initial assessment minutes ∼ The time taken in each one-to-one client session varies significantly between the
different patient categories, and the cost of the process should, therefore, reflect this.
Number of follow-up session minutes ∼ This includes the average time in minutes spent on follow-up (both face-to-face and
telephone).
Number of group sessions ∼ The group sessions at the RHA cover a variety of topics including basic knowledge of
diabetes, diet and nutrition issues, recipes, exercise needs and regimens etc. These are not included as separate cost objects due to the similarity in resource requirements for all. The activity driver here, therefore, includes all types of group sessions.
Number of consultation minutes ∼ This driver is used specifically for Process 11 (Consult with clinicians and physicians).
This process is usually only applicable to cases where medication dosage has to be adjusted, or other unusual circumstances exist.
∼ The RHA staff identified the patient categories to which the process applied, and then estimated the percentage of cases within those categories requiring consultation with other qualified staff.
Some processes such as Process 12 (Sustain operations) and Process 14 (Maintain certification) include activities essential for delivery of the client education. However, instead of being consumed directly by the cost objects, these service-sustaining processes facilitate other processes. Such processes are reallocated to the processes consuming them in the proportion of staff time taken up by the consuming processes.
92

Appendix I Results of sensitivity analysis
93