Embed Size (px)
Citation preview
Developing a Statistics Teaching and Beliefs
Survey
Jiyoon Park
Audbjorg BjornsdottirDepartment of Educational Psychology
The National Statistics
Teaching Practice Survey Project
(NSF DUE-0808862)
• Statistics Teaching Inventory (STI)– PIs: Joan Garfield, Robert delMas, and Andrew Zieffler– NSF funded project to develop, pilot, and gather validity
evidence
• Background of Statistics Teaching Inventory (STI)• Development of Instrument• Process of STI Validation
– Psychometric validation– Interview validation
• Validation Results • Future plans
Overview
• Increasing calls for reform in undergraduate education in STEM disciplines
• Implications for teaching and learning:Students learn by constructing knowledgeReal-world problems provide effective ways to structure learningCollaborative groups facilitate learningClassroom discourse plays a critical role in learningWell-designed technological tools can help students visualize and explore abstract concepts and processes.
Background of STI
Background of STI - continued
• Reform in statistics– GAISE report endorsed by the ASA (2005)– http://www.amstat.org/education/gaise/
• GAISE recommendations: Emphasize statistical literacy and develop statistical thinking. Use real data. Stress conceptual understanding rather than mere knowledge
of procedures. Foster active learning in the classroom. Use technology for developing conceptual understanding and
analyzing data. Integrate assessments that are aligned with course goals to
improve as well as evaluate student learning.
Background of STI - continued
• Studies showing students’ lack understanding of statistical concepts and statistical reasoning
• Teachers’ resistance to recommended ways of teaching
• ARTIST project: need for instrument to use in research studies along with CAOS
• INSPIRE project: need for data on teachers
Development of STI
• Objectives of the STI– To assess practice and beliefs of teachers in
introductory statistics courses– To pilot an instrument and integrate it into a
database to explore the relationship between teaching and student learning in introductory statistics courses
• Funding from NSF (ARTIST, INSPIRE, and STEPS grants, 2002-2010)
• Support from two mini grants from Dept of Ed. Psych, University of Minnesota
Development of STI
• Development process of the STI
– The first version (102 items)– Pared down based on feedback from members of the
statistics education community (e.g., the Research Advisory Board (RAB) of CAUSE)
– Focus group conducted with faculty from the two different disciplines
– Online pilot testing followed by focus group interviews– The resulting version of the STI administered to 101
participants of the 2009 US Conference on Teaching Statistics (USCOTS)
STI
• The latest version of the STI: 50 multiple-choice items
• Four sections- Teaching Practice- Assessment Practice- Teaching Beliefs- Assessment Belief
Also, course characteristics and additional teacher information
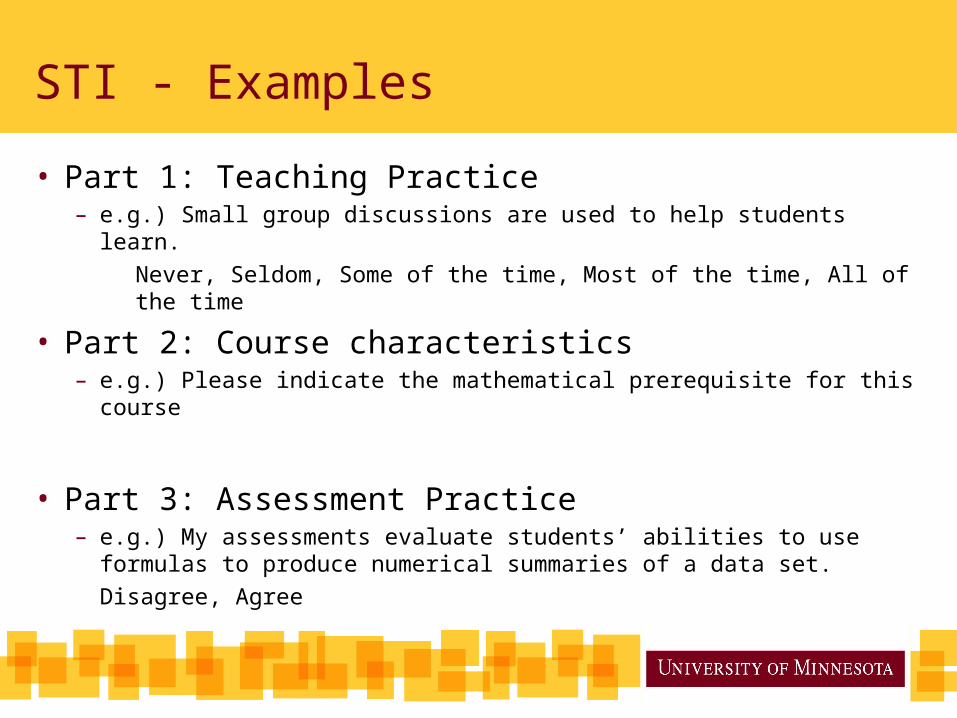
STI - Examples
• Part 1: Teaching Practice– e.g.) Small group discussions are used to help students learn.
Never, Seldom, Some of the time, Most of the time, All of the time
• Part 2: Course characteristics– e.g.) Please indicate the mathematical prerequisite for this
course
• Part 3: Assessment Practice– e.g.) My assessments evaluate students’ abilities to use
formulas to produce numerical summaries of a data set.Disagree, Agree
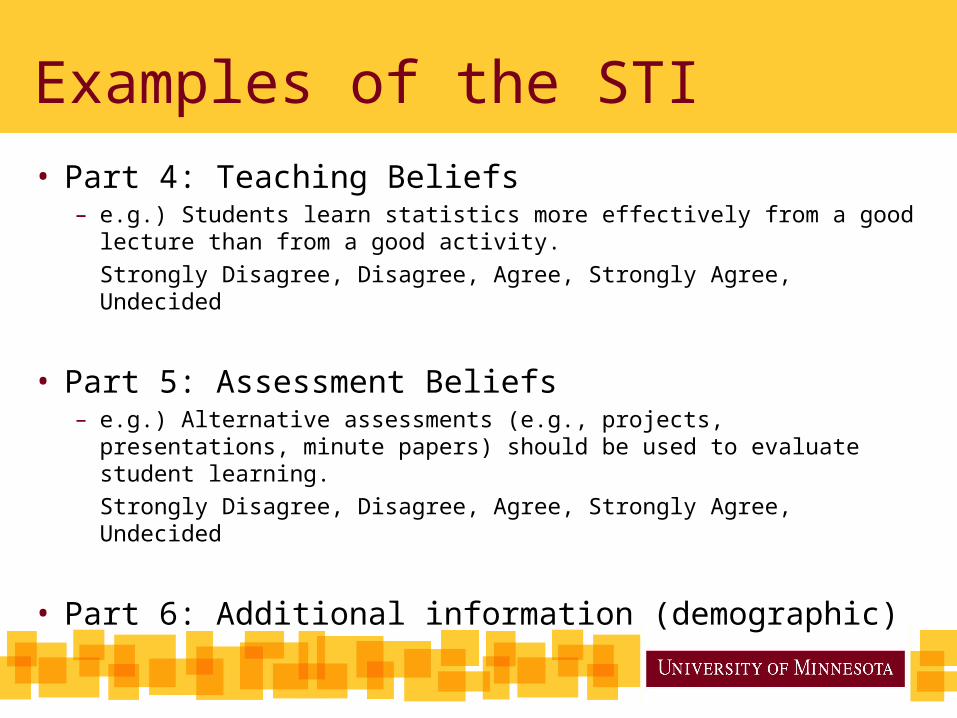
Examples of the STI
• Part 4: Teaching Beliefs – e.g.) Students learn statistics more effectively from a good
lecture than from a good activity. Strongly Disagree, Disagree, Agree, Strongly Agree, Undecided
• Part 5: Assessment Beliefs– e.g.) Alternative assessments (e.g., projects, presentations,
minute papers) should be used to evaluate student learning. Strongly Disagree, Disagree, Agree, Strongly Agree,
Undecided
• Part 6: Additional information (demographic)
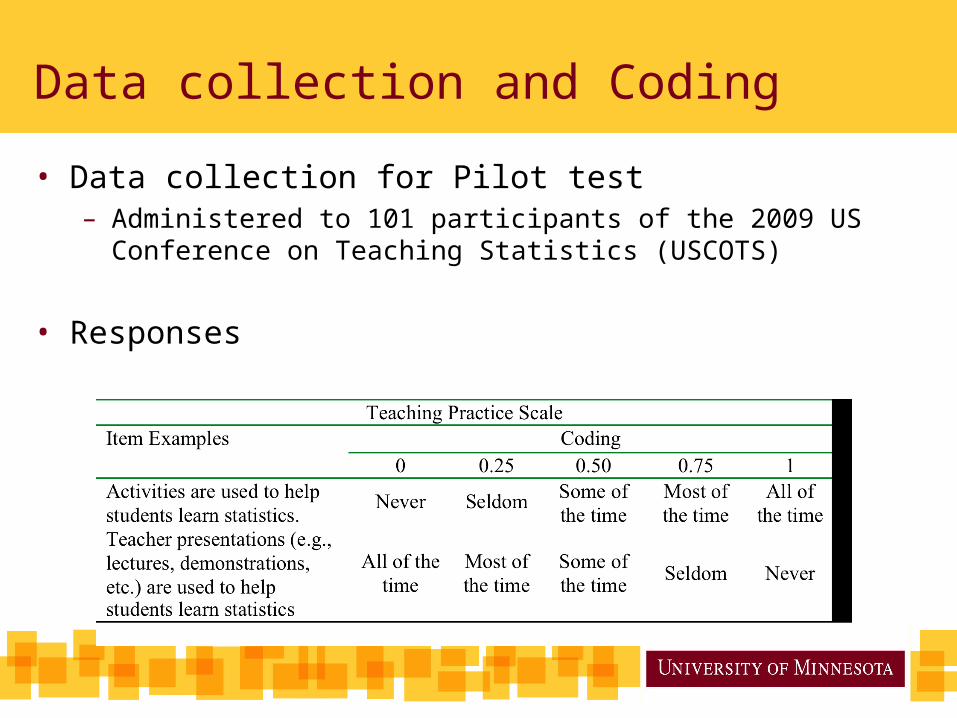
Data collection and Coding
• Data collection for Pilot test – Administered to 101 participants of the 2009 US Conference
on Teaching Statistics (USCOTS)
• Responses
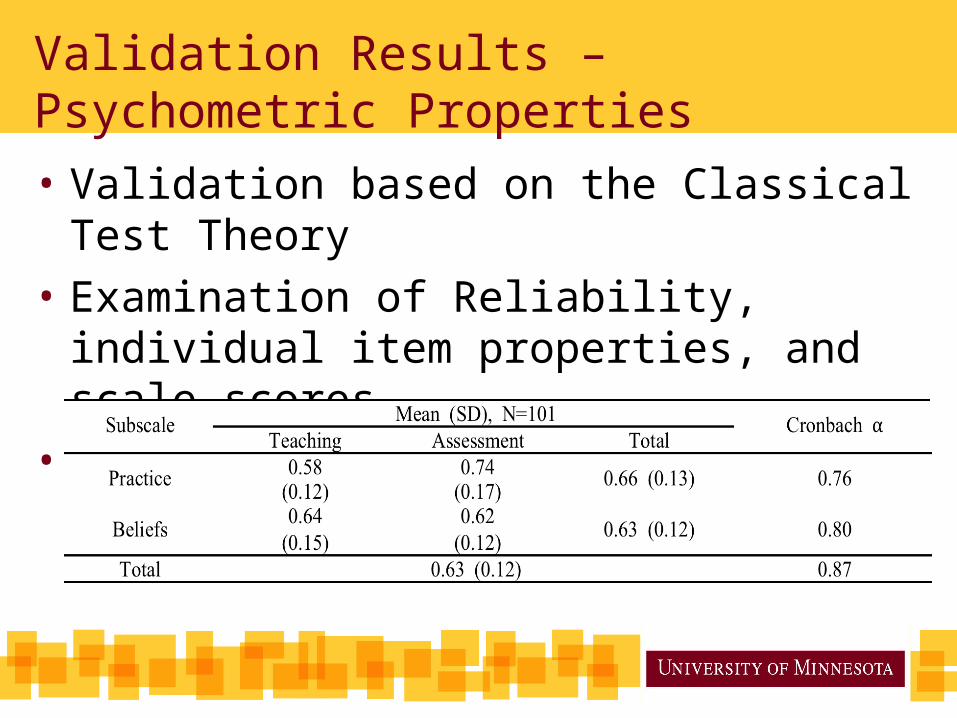
Validation Results – Psychometric Properties• Validation based on the Classical Test
Theory • Examination of Reliability, individual
item properties, and scale scores • Analysis results
Validation Results –Interview
• Interview validation process– Interviewees: 16 instructors who participated in
the STI– Face-to-face interview with 10 people at USCOTS– Phone interview with 6 people– Course syllabus and other course materials
provided for validity evidence– Rating of interview based on the GAISE report – A consensus of rating reached from discussions
with three professionals
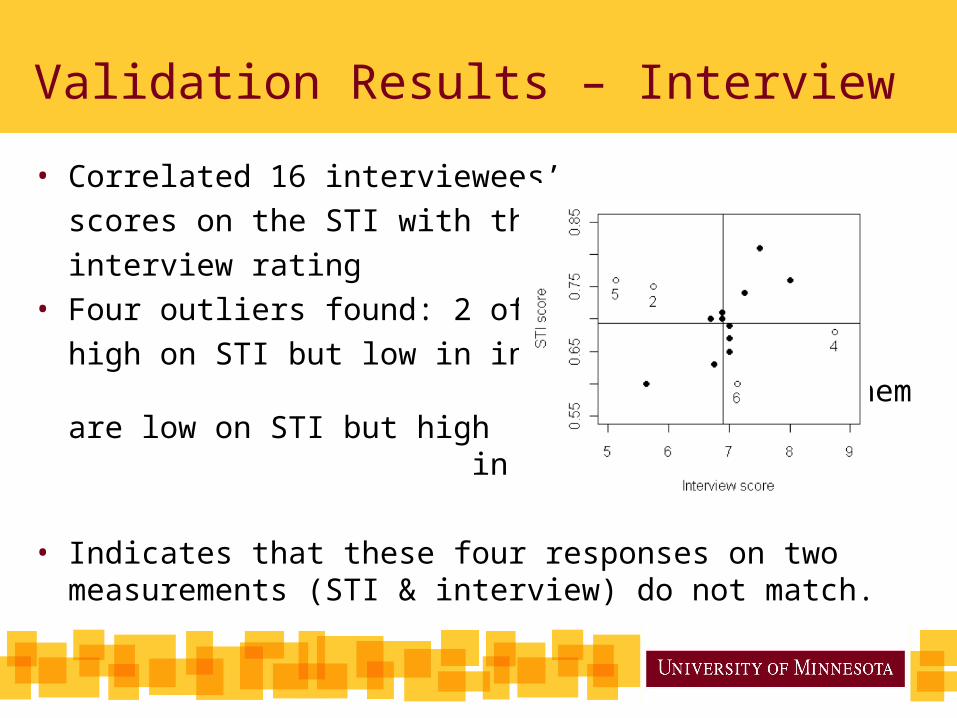
Validation Results – Interview
• Correlated 16 interviewees’ scores on the STI with their interview rating
• Four outliers found: 2 of them are high on STI but low in interview; 2 of them are low on STI but high in interview
• Indicates that these four responses on two measurements (STI & interview) do not match.
Validation Results – Interview
• Why the outliers?
– Thorough examination of interview recording and course materials
– Some of them changed the course after taking the STI
– Some of them have different ideas of use of technology or the teaching methods recommended in GAISE.
Conclusions
• Psychometric validation of the STI supported through high value of Cronbach-alpha (>0.80)
• The instructors sampled use a moderately reformed approach in teaching statistics
• Difference between the mean scores for the Teaching Practice (0.58) and the Assessment Practice (0.74) which suggests
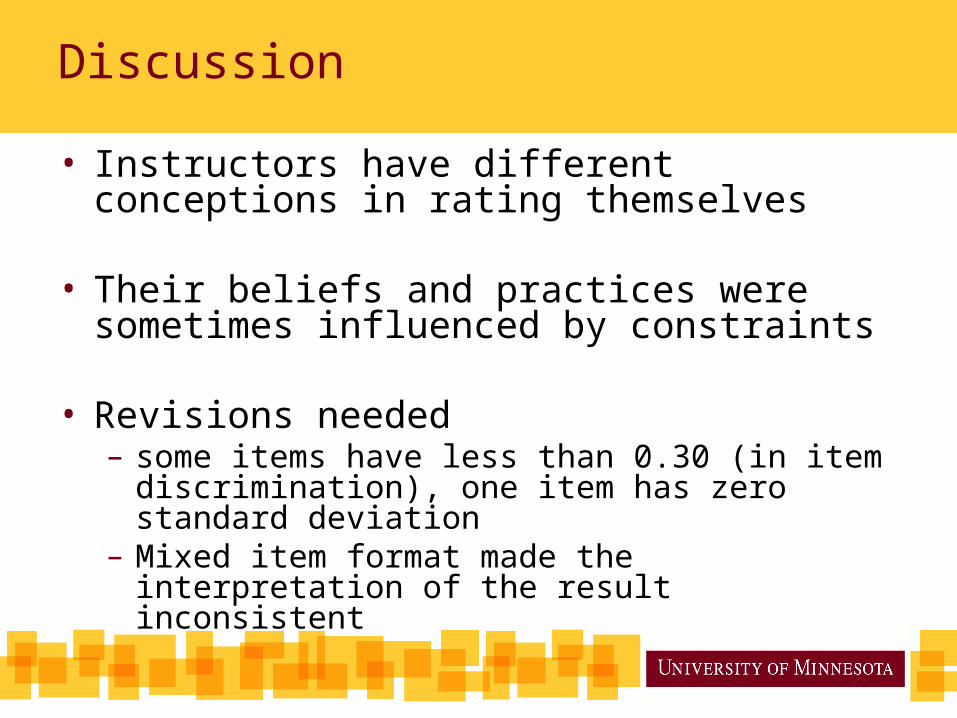
Discussion
• Instructors have different conceptions in rating themselves
• Their beliefs and practices were
sometimes influenced by constraints
• Revisions needed– some items have less than 0.30 (in item
discrimination), one item has zero standard deviation
– Mixed item format made the interpretation of the result inconsistent
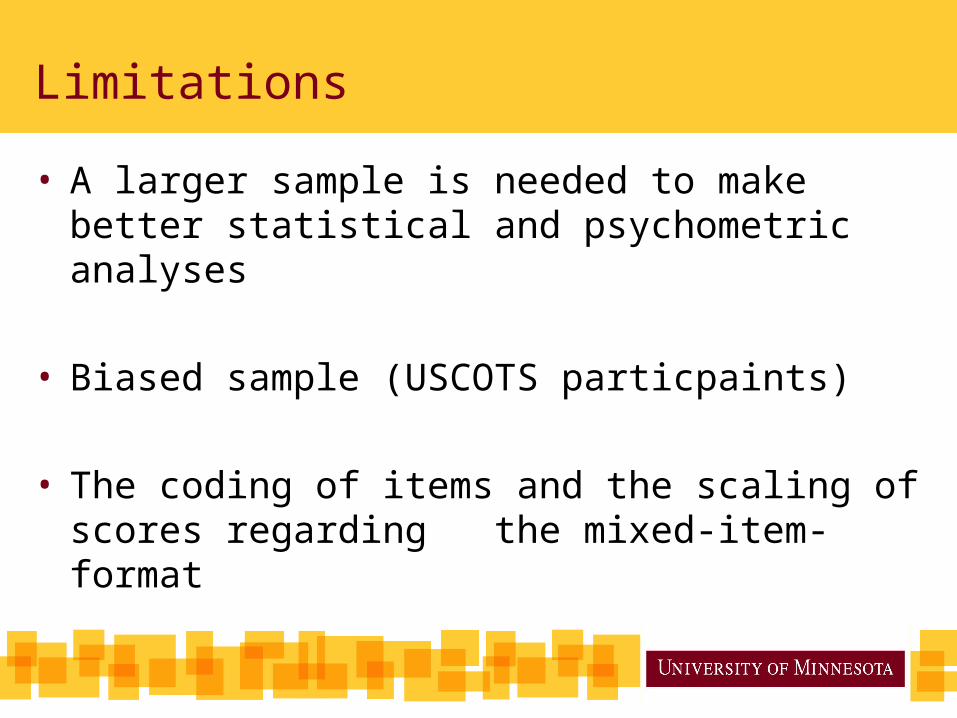
Limitations
• A larger sample is needed to make better statistical and psychometric analyses
• Biased sample (USCOTS particpaints)
• The coding of items and the scaling of scores regarding the mixed-item-format
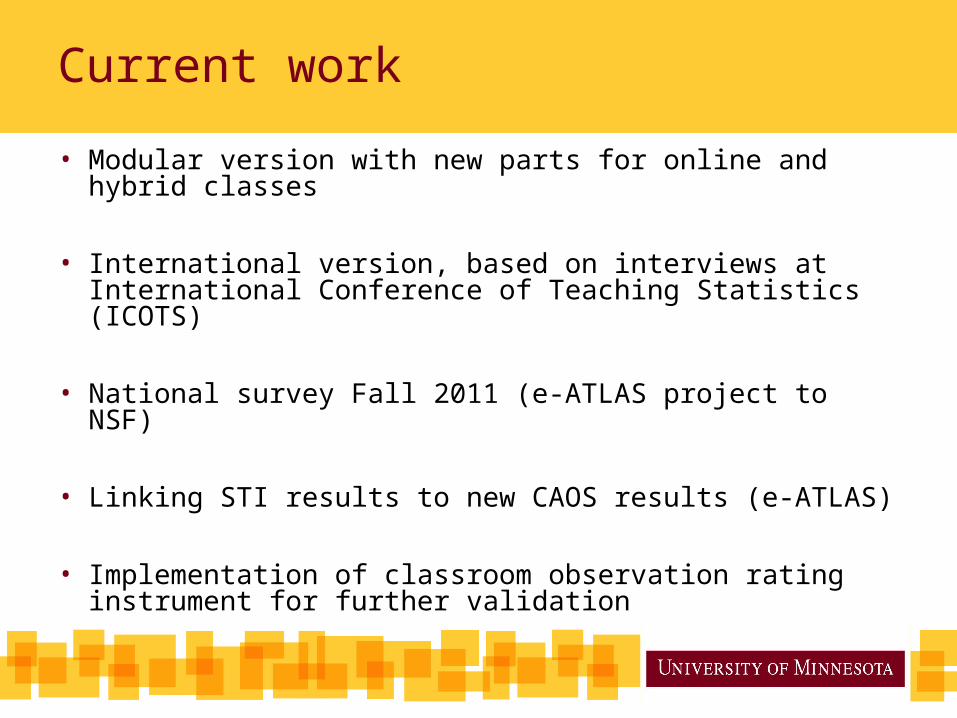
Current work
• Modular version with new parts for online and hybrid classes
• International version, based on interviews at International Conference of Teaching Statistics (ICOTS)
• National survey Fall 2011 (e-ATLAS project to NSF)
• Linking STI results to new CAOS results (e-ATLAS)
• Implementation of classroom observation rating instrument for further validation
Thank You
[email protected]@gmail.com
Jiyoon ParkAudbjorg Bjornsdottir
Department of Educational Psychology