Embed Size (px)
Citation preview
DEVELOPING A METHODOLOGY FOR
SUPPLIER BASE REDUCTION
Department of Management and Engineering
Division of Logistics Management
A Case Study at Dynapac GmbH
Authors Elin Böris Vendela Hall
Supervisors Mike Malmgren (LiU) Shrikant Pangarkar (Dynapac GmbH)
Master Thesis LIU-IEI-TEK-A--15/02161--SE

PREFACE
With this thesis we complete our Master of Science in Industrial Engineering and Management with
specialization in Logistics Management at the Department of Management and Engineering at
Linköping University. The intention with this master thesis has been to develop a customized
methodology for supplier base reduction for the case company Dynapac GmbH.
We would like to express our gratitude towards Dynapac GmbH for giving us the opportunity to
conduct this study at their company. We want to say thank you to all of our colleagues, especially at
the Purchasing department, for providing us with their support and great company. Furthermore, we
wish to highlight our gratitude towards Shrikant Pangarkar, Markus Pieper, Thorsten Mundt, Renke
Backhus and Thorsten Bode who have provided us with tremendous insight and guidance.
Finally, we would like to address our appreciation towards our supervisor Mike Malmgren and our
opponents Cecilia Malmgren and Emilia Lundgren for continuously providing us with guidance,
valuable inputs and great feedback on our report and progress.
Linköping, 2015-06-11
Elin Böris Vendela Hall

ABSTRACT
Title: Developing a Methodology for Supplier Base Reduction at Dynapac GmbH
Authors: Elin Böris and Vendela Hall
Supervisors: Mike Malmgren, Faculty of Management and Engineering, Linköping University
Shrikant Pangarkar, Dynapac GmbH
Purpose: The purpose of the master thesis is to develop a methodology for supplier base
reduction which is customized for the current situation of the case company.
Summary: Dynapac GmbH is a manufacturer of road construction equipment and has historically
been acquired and merged with several companies, resulting in an expansion of their
supplier base. Currently, they are experiencing a large supplier base within direct
material causing a decrease in the effectiveness and efficiency in the management of
the suppliers. Dynapac GmbH therefore wishes to lower the number of suppliers in
order to obtain desired effects, such as cost savings, reduction of administrative
workload, higher control, higher quality and improved communication with suppliers.
The purpose of the study is therefore to develop a methodology that describes all the
activities needed to successfully reduce the number of suppliers.
At the moment, approximately 80 percent of the total purchasing budget is allocated
to only 14 percent of the supplier base. The supplier base can therefore be assumed to
consist of a high number of suppliers supplying only a few products with a low
turnover. Based on this, it can be concluded that the supplier base includes several
opportunities for supplier base reduction. The action of reducing the supplier base is
perceived as being in line with the sourcing strategy as well as the business strategy
and the needed support is therefore believed to be present in order to succeed with
performing supplier base reduction.
Based on existing research, a conceptual model for supplier base reduction was
created. The current situation at Dynapac GmbH was thereafter analysed in order to
enable a customization of the model. Interviews were held to obtain input regarding
the model and the activities. The overall view on the model was positive and all
activities were considered to be relevant to include. Possible customizations of the
activities were discussed during the interviews, which resulted in a customized model
consisting of activities with either two types of customizations: (1) defined variables
or (2) developed processes. Lastly, the model was validated in a pilot test before it
was reconfigured and handed over as a methodology.
The finalized methodology included a thorough description on how to conduct
supplier base reduction from beginning to end, consisting of 14 activities
corresponding to five different phases. The first two phases intend to lay the basis for
enabling a reduction of the supplier base and the third phase aims at implementing it
in practice. The fourth phase consists of analysing the result of the implementation
followed by the last phase with focus on continuous improvement of the supplier
base.
Key words: Supplier Base Reduction, Supply Base Reduction, Supplier Base Management,
Supply Base Management, Supplier Consolidation, Supplier Base, Supply Base
TABLE OF CONTENT
1 Introduction ..................................................................................................................................... 1
1.1 Problem Description ................................................................................................................ 1
1.2 Purpose .................................................................................................................................... 1
1.2.1 Clarification of the Purpose ............................................................................................. 2
1.3 Directives................................................................................................................................. 2
1.4 Limitations............................................................................................................................... 2
1.5 Studied System ........................................................................................................................ 2
1.6 Disposition of the Thesis ......................................................................................................... 3
2 Company Presentation ..................................................................................................................... 5
2.1 History ..................................................................................................................................... 5
2.2 Dynapac Today ........................................................................................................................ 5
2.2.1 The Purchasing Department ............................................................................................ 6
3 Theory of Reference ........................................................................................................................ 9
3.1 Introduction to Purchasing ...................................................................................................... 9
3.1.1 Sourcing ......................................................................................................................... 12
3.2 Supplier Base Reduction ....................................................................................................... 16
3.2.1 Benefits and Drawbacks ................................................................................................ 16
3.2.2 Success Factors .............................................................................................................. 18
3.2.3 Processes ....................................................................................................................... 19
3.2.4 Approaches .................................................................................................................... 21
3.2.5 Tools .............................................................................................................................. 23
3.3 Synthesis of Theory of Reference ......................................................................................... 25
4 Problem Specification .................................................................................................................... 27
4.1 Developing the Analysis Model ............................................................................................ 28
4.2 Research Questions ............................................................................................................... 28
4.2.1 Conceptual Model ......................................................................................................... 29
4.2.2 Current Situation ........................................................................................................... 32
4.2.3 Customized Model......................................................................................................... 33
4.2.4 Validation ...................................................................................................................... 34
4.3 Synthesis of Problem Specification ....................................................................................... 34
5 Research Method ........................................................................................................................... 36
5.1 Course of Action ................................................................................................................... 36
5.1.1 Planning Phase .............................................................................................................. 36
5.1.2 Data Collection Phase.................................................................................................... 39
5.1.3 Analysis Phase ............................................................................................................... 41
5.2 Practical Method of Research Questions ............................................................................... 42
5.2.1 Conceptual Model ......................................................................................................... 42
5.2.2 Current Situation ........................................................................................................... 42
5.2.3 Customized Model......................................................................................................... 45
5.2.4 Validation ...................................................................................................................... 46
5.3 Credibility of the Study ......................................................................................................... 48
5.3.1 Objectivity ..................................................................................................................... 48
5.3.2 Validity .......................................................................................................................... 49
5.3.3 Reliability ...................................................................................................................... 49
5.4 Criticism of the Research Method ......................................................................................... 49
5.5 Synthesis of Research Method .............................................................................................. 50
6 Empirical Data ............................................................................................................................... 52
6.1 Business Strategy .................................................................................................................. 52
6.2 Sourcing Strategy .................................................................................................................. 53
6.3 Stakeholders in Sourcing Decisions ...................................................................................... 54
6.4 The Supplier Base ................................................................................................................. 55
6.4.1 Segmentation and Management .................................................................................... 56
6.4.2 Characteristics ............................................................................................................... 56
6.5 Evaluation of Conceptual Model ........................................................................................... 58
6.5.1 The First Workshop ....................................................................................................... 59
6.5.2 The Second Workshop .................................................................................................. 60
6.6 Synthesis of Empirical Data .................................................................................................. 61
7 Analysis ......................................................................................................................................... 62
7.1 Current Situation ................................................................................................................... 62
7.1.1 The Sourcing Strategy and its Alignment with the Business Strategy .......................... 62
7.1.2 Stakeholders in Sourcing Decisions .............................................................................. 63
7.1.3 Segmentation and Management of the Supplier Base ................................................... 64
7.1.4 Current State of the Supplier Base ................................................................................ 65
7.2 Customized Model ................................................................................................................ 67
7.2.1 Relevant Activities for Dynapac ................................................................................... 67
7.2.2 Customization of the Activities ..................................................................................... 68
7.3 Synthesis of Analysis ............................................................................................................ 87
8 Validation ...................................................................................................................................... 88
8.1 Execution of the Activities .................................................................................................... 88
8.2 Evaluation of the Activities ................................................................................................... 89
8.3 Adjustments of the Activities ................................................................................................ 90
9 Conclusions and Discussion .......................................................................................................... 92
9.1 Presentation of the Result ...................................................................................................... 92
9.2 Exploration of the Result ....................................................................................................... 92
9.3 Generalisation of the Result .................................................................................................. 93
9.4 Further Research .................................................................................................................... 94
10 Bibliography .................................................................................................................................. 95
TABLE OF FIGURES
Figure 1: The studied system on an overall level, highlighted in dark blue ............................................ 3
Figure 2: The studied system in detail, highlighted in dark blue ............................................................ 3
Figure 3: Machines produced at Dynapac. From the left a feeder followed by a paver. ......................... 5
Figure 4: An overview of the processes at Dynapac ............................................................................... 6
Figure 5: The organization of the Purchasing department ...................................................................... 7
Figure 6: The complete purchasing process ............................................................................................ 7
Figure 7: Illustration of the content of the Theory of Reference ............................................................. 9
Figure 8: The value chain ..................................................................................................................... 10
Figure 9: The purchasing process .......................................................................................................... 10
Figure 10: Different purchasing situations ............................................................................................ 11
Figure 11: The Kraljic matrix ................................................................................................................ 14
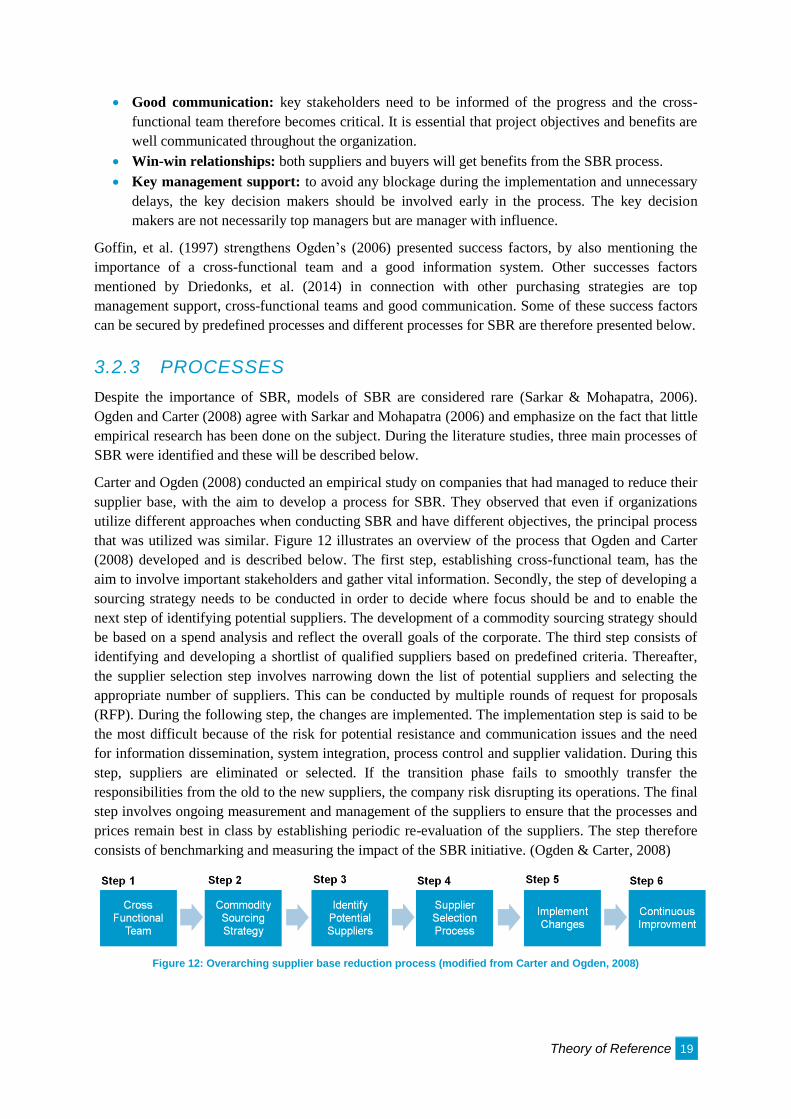
Figure 12: Overarching supplier base reduction process....................................................................... 19
Figure 13: The supplier reduction process ............................................................................................ 20
Figure 14: Supplier base reduction process ........................................................................................... 21
Figure 15: A graphical illustration of elimination of suppliers in compression to time ........................ 22
Figure 16: Supplier base reduction with the tiering approach ............................................................... 23
Figure 17: The key steps for spend analysis .......................................................................................... 24
Figure 18: The analysis model of the study ........................................................................................... 28
Figure 19: First phase of the conceptual model ..................................................................................... 30
Figure 20: First and second phase of the conceptual model .................................................................. 31
Figure 21: First, second and third phase of the conceptual model ........................................................ 31
Figure 22: The conceptual model .......................................................................................................... 32
Figure 23: A summary of the research questions and their associated sub-questions ........................... 35
Figure 24: The overall approach of the study's research method .......................................................... 36
Figure 25: Illustration of the problem specification ............................................................................. 38
Figure 26: An illustration of how the activities were graded based on different variables ................... 46
Figure 27: An illustration of how the activities were graded based on different variables ................... 47
Figure 28: Illustration of the concepts of validity and reliability .......................................................... 48
Figure 29: A summary of the practical methods ................................................................................... 51
Figure 30: Illustration of how the purchasing budget is divided between the active suppliers ............. 57
Figure 31: Total spend per commodity ................................................................................................. 57
Figure 32: Number of suppliers per commodity ................................................................................... 58
Figure 33: Average spend per supplier per commodity ........................................................................ 58
Figure 34: Compilation of empirical data gathered from the spend analysis ........................................ 66
Figure 35: The model used as reference ................................................................................................ 68
Figure 36: The elements of the cross-functional team .......................................................................... 70
Figure 37: Illustration of how to define the scope ................................................................................. 72
Figure 38: An illustration of the order with a description of the approaches ........................................ 73
Figure 39: First phase of the customized model .................................................................................... 74
Figure 40: The elimination criteria and an illustration of the execution of the activity ........................ 76
Figure 41: The selection criteria and an illustration of the execution of the activity ............................ 77
Figure 42: An illustration of the execution of the activity and which elimination criteria to apply ...... 79
Figure 43: First and second phase of the customized model ................................................................. 79
Figure 44: First, second and third phase of the customized model ....................................................... 83
Figure 45: The variables used to analyse the project results located along a timeline .......................... 84
Figure 46: An illustration of which variables to measure and which actions to perform ...................... 85
Figure 47: A summary of the customized model .................................................................................. 86
Figure 48: Illustration of how suppliers for elimination were identified ............................................... 89
Figure 49: A summary of the customized model .................................................................................. 91
TABLE OF TABLES
Table 1: Advantages and disadvantages of single and multiple sourcing ............................................. 13
Table 2: The approaches and methods to supplier segmentation .......................................................... 16
Table 3: Benefits of supplier base reduction ......................................................................................... 18
Table 4: Drawbacks of supplier base reduction .................................................................................... 18
Table 5: Summary of criteria for SBR from different sources .............................................................. 25
Table 6: Summary of the conducted interviews in the study ................................................................ 42
Table 7: Illustration of what the sources were expected to provide deeper knowledge in .................... 43
Table 8: Illustration of what the sources were expected to provide deeper knowledge in .................... 44
Table 9: Illustration of what the sources were expected to provide deeper knowledge in .................... 44
Table 10: Illustration of what the sources were expected to provide deeper knowledge in .................. 45
Table 11: The roles of the functions ...................................................................................................... 63
Table 12: The involvement of the departments ..................................................................................... 70
Table 13: Elimination criteria adapted to Dynapac ............................................................................... 76
Table 14: Selection criteria adapted to Dynapac ................................................................................... 77
Table 17: The defined elimination criteria ............................................................................................ 88
Table 18: The defined selection criteria ................................................................................................ 88
Table 19: The grading of the activities .................................................................................................. 89
TABLE OF APPENDICES
Appendix 1: Additional Information on Atlas Copco .............................................................................. i
Appendix 2: Extended Theory of Reference ........................................................................................... ii
Appendix 3: Extended Research Method ............................................................................................... iv
Appendix 4: Interview Guide for Q2.1 .................................................................................................. vii
Appendix 5: Interview Guide for Q2.2 ................................................................................................... ix
Appendix 6: Interview Guide for Q2.3 .................................................................................................... x
Appendix 7: Presentation for Workshop ................................................................................................ xi
Appendix 8: Summary of Interviews ................................................................................................... xvi
Appendix 9: Summary of Workshops .............................................................................................. xxxiii
Appendix 10: List of Commdities ....................................................................................................... xliii
Appendix 11: Flowchart Analyse the Products .................................................................................... xlv
Appendix 12: Validation of SBR Model ............................................................................................. xlvi
Appendix 13: The Methodology ............................................................................................................ lii
ACRONYMS
CCB Change Board
D&D Design and Development
ERP Enterprise Resource Planning
PPM Parts Per Million
RFQ Request For Quotation
SBR Supplier Base Reduction
SQA Supplier Quality Assurance
GLOSSARY
Active suppliers Suppliers registered in a company’s database and actively used to
purchase products and services from.
Commodity A group of products. Similar products belong to the same commodity.
Component A product or a specific part of a product with a unique article number.
Can also be called part.
Enterprise Resource Planning Software for business process management which integrates
applications to manage the business and automates several
administrative functions.
Gantt chart Illustrates the start and finish dates and the required activities of a
project. A common tool used for planning and following up.
Inactive suppliers Suppliers registered in a company’s database without being selected
for purchase.
Initial sample An activity used to test a supplier’s product during selection of a new
supplier. A supplier’s ability to follow the product specifications is
examined.
Part A product or a specific part of a product with a unique article number.
Can also be called part.
Parts Per Million A measurement used to measure the quality performance of suppliers
by measuring the number of defects of the delivered parts.
Request For Quotation A standard business process with the purpose to invite suppliers into a
bidding process on specific products/services.
Supplier Base Reduction The process aimed at reducing the number of suppliers registered in a
company’s database.
Introduction 1
1 INTRODUCTION
This section provides information regarding the details of the study and acts as a basis for the study's
investigation. First, a description of the problem is presented followed by the purpose of the study. The
directives and the limitations of the study are thereafter presented and the studied system is visualized.
Last, the disposition of the thesis is presented and described.
1.1 PROBLEM DESCRIPTION
Today's global business environment is increasingly becoming more complex and is changing the
international competitive picture. The changing business environment has affected companies'
business processes and activities that are not considered to be core activities have gradually become
outsourced. This has resulted in a more distinct focus on purchasing with the aim to develop the most
competitive supplier base. (van Weele, 2010) However, outsourcing can result in a more complex
supplier base since the risk of buying too many things from too many different suppliers becomes
more significant. The consequential complex supplier base adds both costs and risks. To solve this
matter, supplier base reduction has been proved to be an efficient strategy which can result in a greater
leverage for supplier negotiation and thereby lowering costs. (Mitchell & Sawchuk, 2012)
Supplier base reduction has attracted significant interest in the recent years and researchers argue that
companies can obtain beneficial outcomes of the process, such as reduced transaction cost, supplier
and customer responsiveness, supplier innovation and a better relationship with suppliers (Cai, et al.,
2010). Furthermore, Ogden (2006) describes that the recent trends within purchasing support and
encourage the use of fewer suppliers and the establishment of closer relationship with suppliers.
Dynapac GmbH, hereinafter referred to as Dynapac, is a manufacturer of construction road equipment
called pavers and feeders located in Wardenburg, Germany. Currently, they are experiencing a large
supplier base within direct material consisting of approximately 250 suppliers at the time of writing.
Historically, Dynapac has been acquired and merged with several companies, resulting in an
expansion of their supplier base. This is believed to be one of the main causes of the large number of
suppliers. Other causes are considered to be the frequent use of highly customized components and the
previously expansion of suppliers based in China. (Purchasing team leader 2 & HR manager and Lean
project manager, 2015)
Dynapac wishes to lower the number of suppliers in order to enable most of all cost savings. However,
other desired effects are a reduction of the administrative workload, getting better control of the
logistical flow, improving the communication with suppliers and achieving a higher quality. Dynapac
has already begun the process of reducing the number of suppliers but now they wish to develop a
standardized methodology for supplier base reduction that can assist them in this current situation but
also in the future if the same problem occurs. (Purchasing team leader 2 & HR manager and Lean
project manager, 2015)
1.2 PURPOSE
The purpose of the master thesis is to develop a methodology for supplier base reduction which is
customized for the current situation of the case company.
Introduction 2
1.2.1 CLARIFICATION OF THE PURPOSE
To provide further understanding of the purpose, an explanation of certain terms used in the
formulation will be provided. The purpose mentions develop a methodology and this is referred to the
material Dynapac will receive at the end of the study. It will contain a standardized approach
consisting of a multiple steps and clarifications of which activities need to be performed in order for
Dynapac to conduct supplier base reduction. The term customized is also mentioned, which in this
case is referred to the adaptation of the methodology and its activities to Dynapac’s current situation.
The methodology is going to be used by and at Dynapac and it is therefore essential to design it in
accordance with their organization. Moreover, the methodology should be able to be used again at a
later stage if the same problem occurs or if they wish to reduce the supplier base even further.
1.3 DIRECTIVES
Björklund and Paulsson (2013) argue that when the study has a project owner, it is important to
mention the directives that have been set for the study. In this study, Dynapac is the project owner and
they have provided directives for the study that will be clarified below.
Firstly, Dynapac wishes to receive a customized methodology describing the implementation of
supplier base reduction consisting of descriptions of the actions needed. Furthermore, they wish the
methodology to focus on suppliers providing direct material and thereby leaving out suppliers
providing indirect material, i.e. material that is not considered to be components in their products.
1.4 LIMITATIONS
The focus for this study is finding a methodology for reducing the supplier base. Therefore, processes
connected to finding and evaluating new suppliers are considered limited from the study and such
processes will not be included in the methodology. However, if Dynapac wishes to investigate or to
add new suppliers while performing supplier base reduction they are permitted to do so, but the
processes will not be investigated or described in the methodology. Dynapac has furthermore already
developed and established processes intended to clarify the processes of finding and evaluating new
suppliers, thereby strengthening the limitation of excluding these elements as it is not considered to be
of value to investigate already established processes.
1.5 STUDIED SYSTEM
Dynapac describes its organization using three main processes: management processes, core business
processes and supporting processes. With the help from this description, a clarification of which area
of these processes will be included in the study is provided. Since the purpose of the study is to
develop a methodology for supplier base reduction, the system will have its starting point in the area
of purchasing located in the process for the core business. This can be seen in the highlighted area in
Figure 1.
Introduction 3
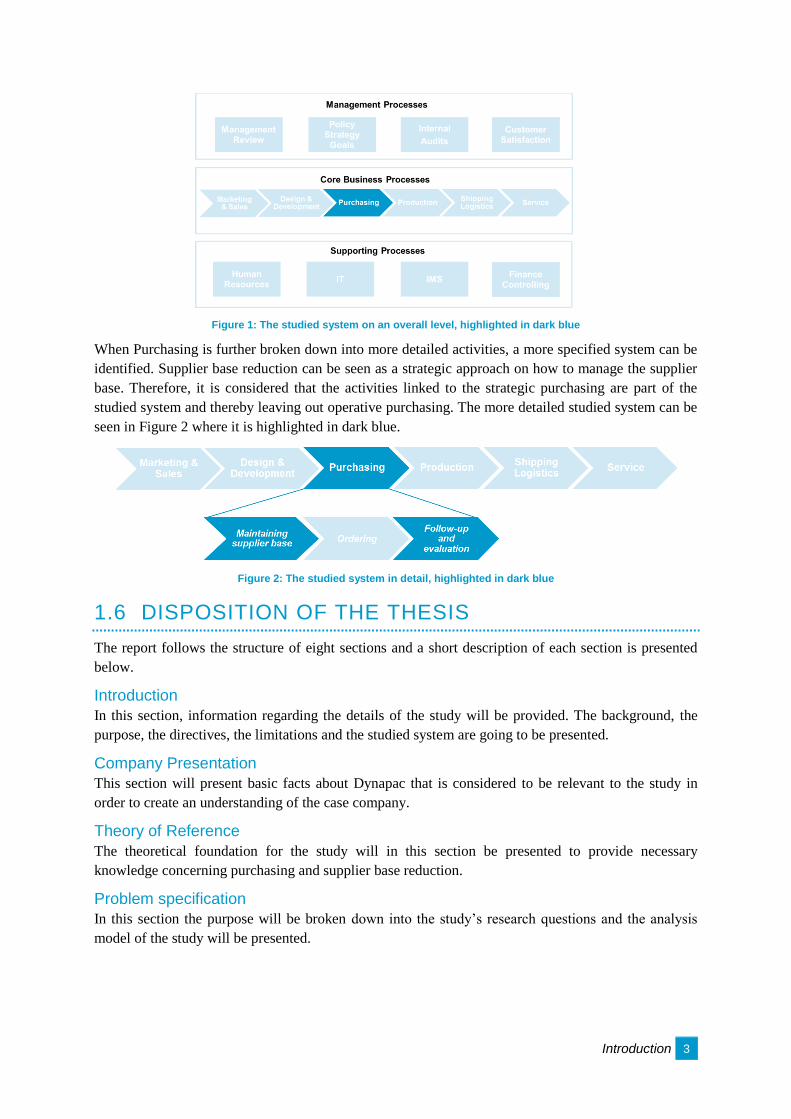
Figure 1: The studied system on an overall level, highlighted in dark blue
When Purchasing is further broken down into more detailed activities, a more specified system can be
identified. Supplier base reduction can be seen as a strategic approach on how to manage the supplier
base. Therefore, it is considered that the activities linked to the strategic purchasing are part of the
studied system and thereby leaving out operative purchasing. The more detailed studied system can be
seen in Figure 2 where it is highlighted in dark blue.
Figure 2: The studied system in detail, highlighted in dark blue
1.6 DISPOSITION OF THE THESIS
The report follows the structure of eight sections and a short description of each section is presented
below.
Introduction
In this section, information regarding the details of the study will be provided. The background, the
purpose, the directives, the limitations and the studied system are going to be presented.
Company Presentation
This section will present basic facts about Dynapac that is considered to be relevant to the study in
order to create an understanding of the case company.
Theory of Reference
The theoretical foundation for the study will in this section be presented to provide necessary
knowledge concerning purchasing and supplier base reduction.
Problem specification
In this section the purpose will be broken down into the study’s research questions and the analysis
model of the study will be presented.
Introduction 4
Research method
The underlying approach for the study will be presented in this section. The research method will at
first be described on a general basis and will thereafter be followed by a more detailed description
regarding the practical methods for answering the research questions. The credibility of the study in
terms of objectivity, validity and reliability will also be discussed.
Empirical Data
The section will present the empirical data related to the case company regarding the business strategy,
the sourcing strategy, stakeholders in sourcing decisions and the management of the supplier base. The
data collection regarding the configuration of the model for supplier base reduction will also be
presented.
Analysis
This section will present the analysis of the information from the empirical data. The analysis will be
conducted by comparing collected data with theory. The relevance of the findings will be discussed
and a customized model for supplier base reduction at Dynapac will be developed.
Validation
The proposed customized model for supplier base will be validated using a pilot test and the execution
of the activities and the needed improvements will be presented in this section in order to refine the
customized model.
Conclusions and Discussion
This section will return to the purpose of the study and the final customized methodology for supplier
base reduction will be presented. Furthermore, a discussion on whether the purpose and the research
questions have been fulfilled is presented followed by suggestions for future research.
Company Presentation 5
2 COMPANY PRESENTATION
This section is intended to provide basic facts about Dynapac that is considered to be relevant to the
study. The information is intended to create an understanding of the company and touches the areas of
their history, the structure of their organization and the purchasing processes. The description is
based on, unless otherwise stated, information collected from the company's webpage and from
interviews conducted with employees working at the departments for Purchasing, Marketing and
Finance.
2.1 HISTORY
Dynapac is a German manufacturer of road construction equipment and was established in 1949 as
KG Hoes KG. In 1984 it was acquired by Dynapac Group and thereby became a part of the
corporation. Dynapac is now considered to be the head quarter of Dynapac Group and has
approximately 260 employees.
Dynapac Group is an international company operating in the manufacturing industry, producing
compaction and paving equipment for road construction. In addition to the manufacturing unit in
Wardenburg, they also have manufacturing units in Brazil, China, India and Sweden. Dynapac Group
was founded in 1934 as AB Vibro-Betong in Stockholm and in 1973 they changed their name to
Dynapac Group. In 2007 Atlas Copco decided to acquire Dynapac Group as part of their growth
strategy and Dynapac Group was therefore merged into the unit Road Construction Equipment. More
information regarding Atlas Copco and the acquisition of Dynapac Group can be found in Appendix 1.
2.2 DYNAPAC TODAY
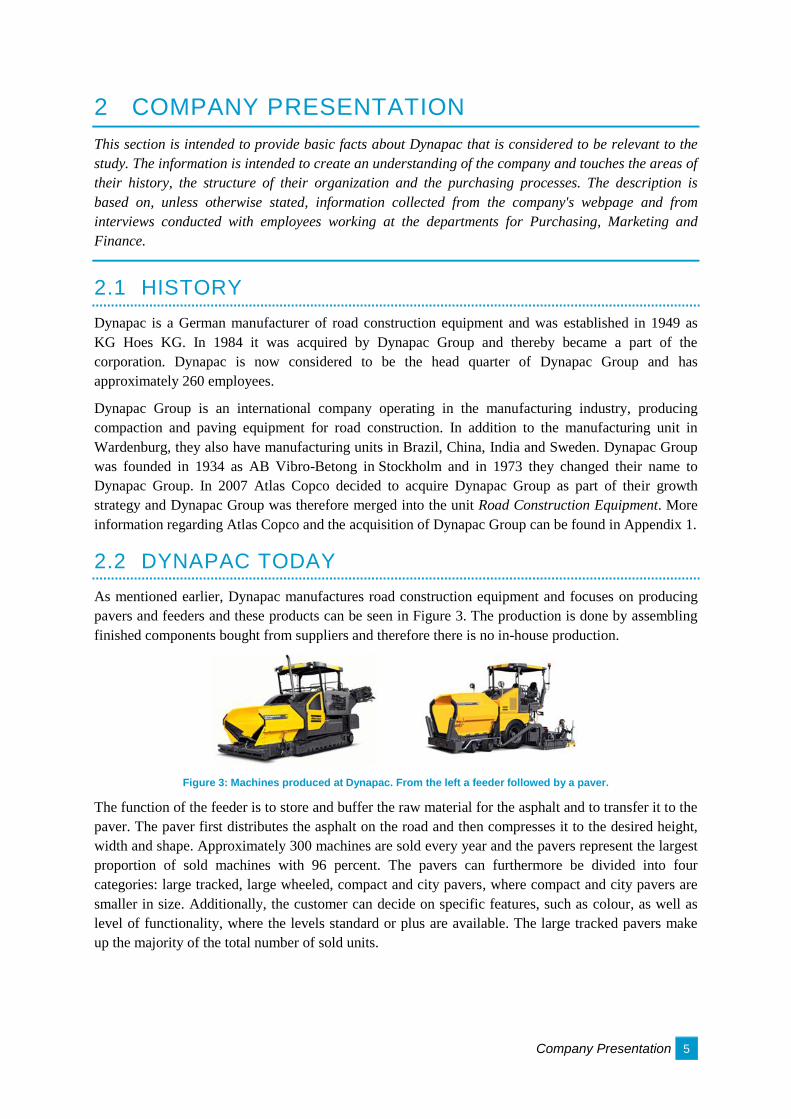
As mentioned earlier, Dynapac manufactures road construction equipment and focuses on producing
pavers and feeders and these products can be seen in Figure 3. The production is done by assembling
finished components bought from suppliers and therefore there is no in-house production.
Figure 3: Machines produced at Dynapac. From the left a feeder followed by a paver.
The function of the feeder is to store and buffer the raw material for the asphalt and to transfer it to the
paver. The paver first distributes the asphalt on the road and then compresses it to the desired height,
width and shape. Approximately 300 machines are sold every year and the pavers represent the largest
proportion of sold machines with 96 percent. The pavers can furthermore be divided into four
categories: large tracked, large wheeled, compact and city pavers, where compact and city pavers are
smaller in size. Additionally, the customer can decide on specific features, such as colour, as well as
level of functionality, where the levels standard or plus are available. The large tracked pavers make
up the majority of the total number of sold units.
Company Presentation 6
The market for road construction equipment is dominated by a few larger players, all with a global
presence. Dynapac is one of them, with their biggest competitors being Vögele, Volvo, Caterpillar and
Bomag. The market also contains smaller competitors working on a more regional level. All the larger
players can offer the same functionality as Dynapac. However, Dynapac wishes to primarily
differentiate themselves by developing and offering the newest technology, high comfort and high
quality. Europe is considered to be the largest market for Dynapac, where Germany, Scandinavia and
the Benelux-countries are the biggest.
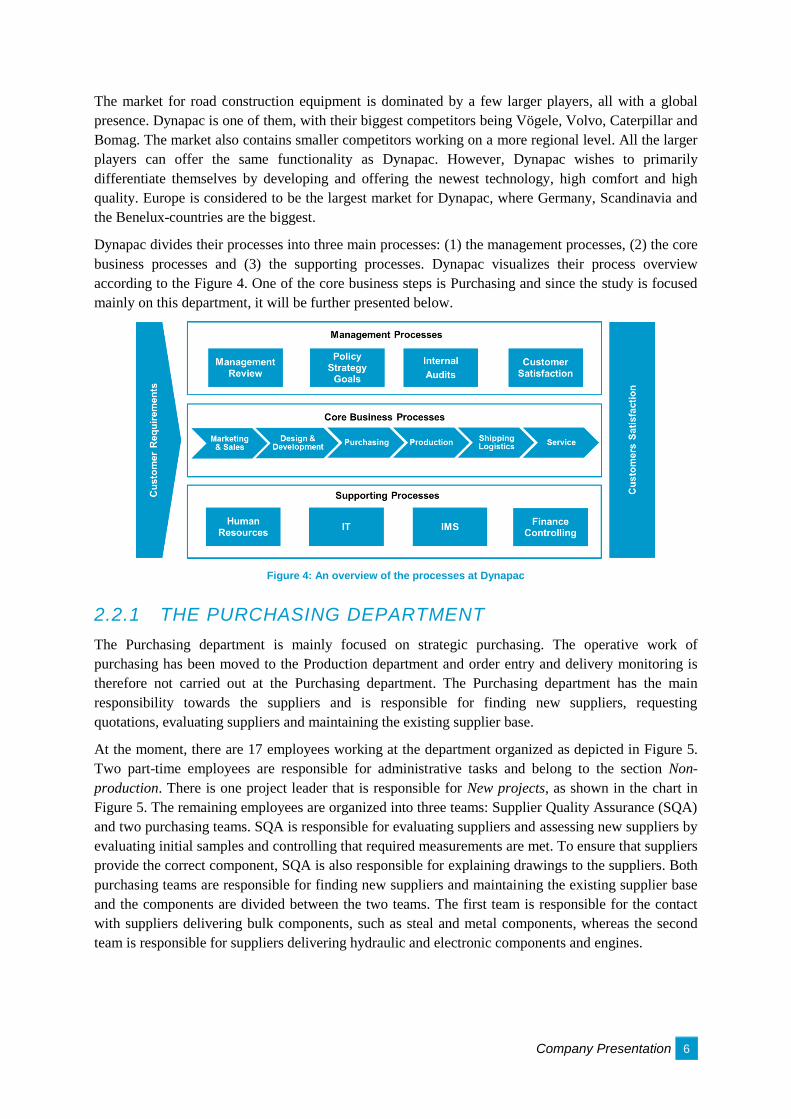
Dynapac divides their processes into three main processes: (1) the management processes, (2) the core
business processes and (3) the supporting processes. Dynapac visualizes their process overview
according to the Figure 4. One of the core business steps is Purchasing and since the study is focused
mainly on this department, it will be further presented below.
Figure 4: An overview of the processes at Dynapac
2.2.1 THE PURCHASING DEPARTMENT
The Purchasing department is mainly focused on strategic purchasing. The operative work of
purchasing has been moved to the Production department and order entry and delivery monitoring is
therefore not carried out at the Purchasing department. The Purchasing department has the main
responsibility towards the suppliers and is responsible for finding new suppliers, requesting
quotations, evaluating suppliers and maintaining the existing supplier base.
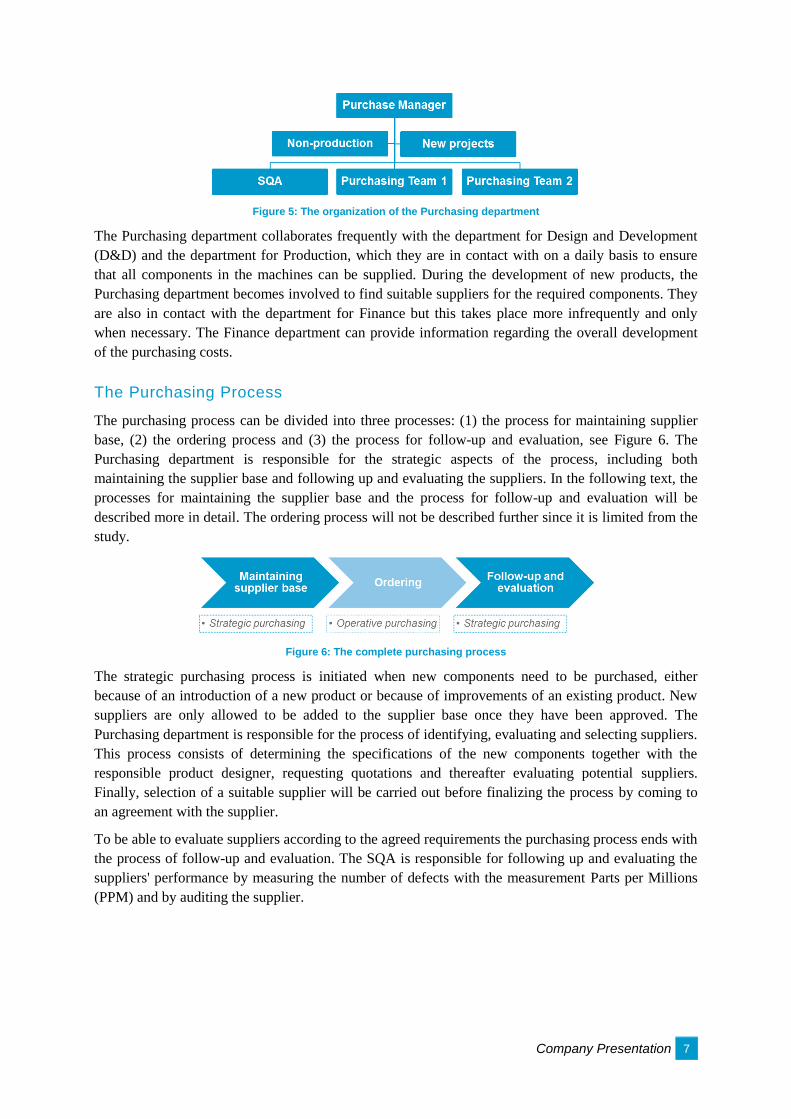
At the moment, there are 17 employees working at the department organized as depicted in Figure 5.
Two part-time employees are responsible for administrative tasks and belong to the section Non-
production. There is one project leader that is responsible for New projects, as shown in the chart in
Figure 5. The remaining employees are organized into three teams: Supplier Quality Assurance (SQA)
and two purchasing teams. SQA is responsible for evaluating suppliers and assessing new suppliers by
evaluating initial samples and controlling that required measurements are met. To ensure that suppliers
provide the correct component, SQA is also responsible for explaining drawings to the suppliers. Both
purchasing teams are responsible for finding new suppliers and maintaining the existing supplier base
and the components are divided between the two teams. The first team is responsible for the contact
with suppliers delivering bulk components, such as steal and metal components, whereas the second
team is responsible for suppliers delivering hydraulic and electronic components and engines.
Company Presentation 7
Figure 5: The organization of the Purchasing department
The Purchasing department collaborates frequently with the department for Design and Development
(D&D) and the department for Production, which they are in contact with on a daily basis to ensure
that all components in the machines can be supplied. During the development of new products, the
Purchasing department becomes involved to find suitable suppliers for the required components. They
are also in contact with the department for Finance but this takes place more infrequently and only
when necessary. The Finance department can provide information regarding the overall development
of the purchasing costs.
The Purchasing Process
The purchasing process can be divided into three processes: (1) the process for maintaining supplier
base, (2) the ordering process and (3) the process for follow-up and evaluation, see Figure 6. The
Purchasing department is responsible for the strategic aspects of the process, including both
maintaining the supplier base and following up and evaluating the suppliers. In the following text, the
processes for maintaining the supplier base and the process for follow-up and evaluation will be
described more in detail. The ordering process will not be described further since it is limited from the
study.
Figure 6: The complete purchasing process
The strategic purchasing process is initiated when new components need to be purchased, either
because of an introduction of a new product or because of improvements of an existing product. New
suppliers are only allowed to be added to the supplier base once they have been approved. The
Purchasing department is responsible for the process of identifying, evaluating and selecting suppliers.
This process consists of determining the specifications of the new components together with the
responsible product designer, requesting quotations and thereafter evaluating potential suppliers.
Finally, selection of a suitable supplier will be carried out before finalizing the process by coming to
an agreement with the supplier.
To be able to evaluate suppliers according to the agreed requirements the purchasing process ends with
the process of follow-up and evaluation. The SQA is responsible for following up and evaluating the
suppliers' performance by measuring the number of defects with the measurement Parts per Millions
(PPM) and by auditing the supplier.
Company Presentation 8
The Current Supplier Base
Dynapac currently has, at the time of writing, 247 active suppliers of direct material with an annual
purchasing volume of approximately 40 million Euros. The supplier with the largest purchasing
volume represents 7 percent of the total purchasing volume and the five largest suppliers together
represent 24 percent. Some suppliers are defined as critical depending on what kind of components
they supply and on the location of the supplier. Suppliers of components with a high cost and/or
complex design, such as engines, hydraulic and electronic components, software and hardware used in
the machines and components that are specially designed for Dynapac are considered to be critical.
Suppliers located in China are also considered to be critical due to the long lead time.
Every second week, the Purchasing department sends an updated forecast of the production plan to the
suppliers to prepare them for upcoming orders. Other information that is shared with the suppliers is
measurement of performance and quality, such as PPM and delivery performance, drawings, rules and
history about component development.
Theory of Reference 9
3 THEORY OF REFERENCE
This section aims at providing a thorough theoretical background to the problem and providing the
reader with the necessary knowledge concerning purchasing and supplier base reduction. The section
starts off at a general level, presenting the area of purchasing, followed by the introduction of supplier
base reduction.
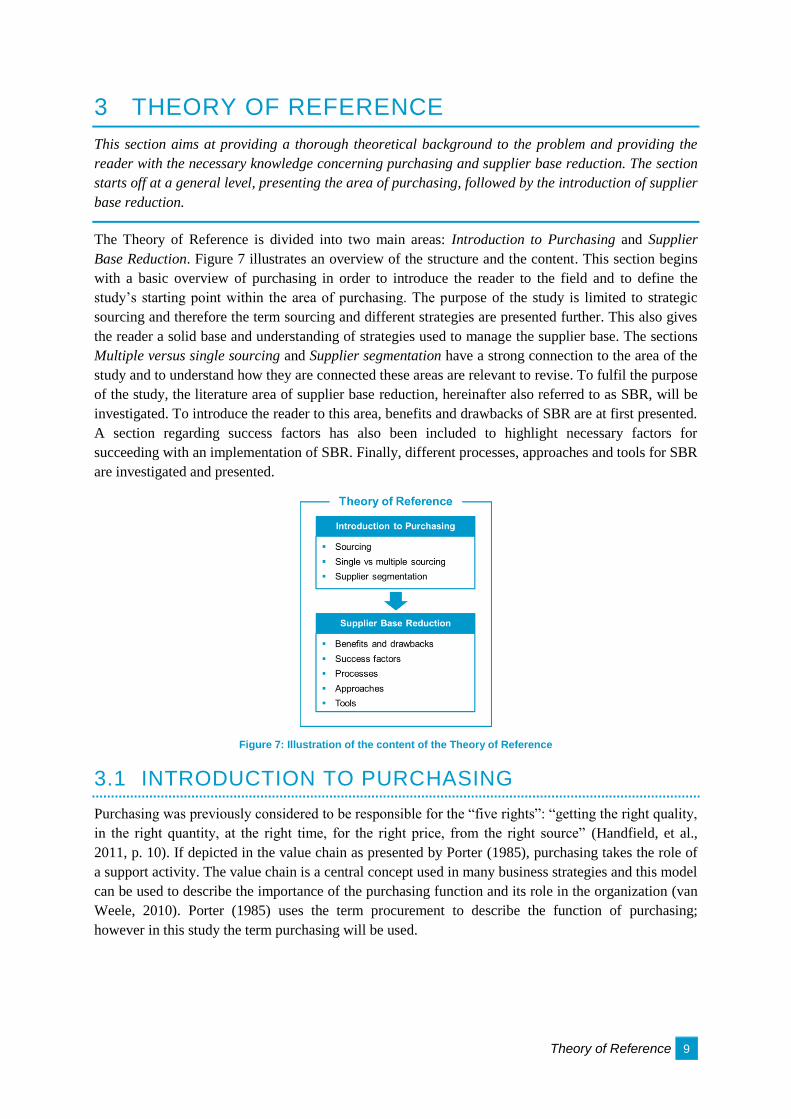
The Theory of Reference is divided into two main areas: Introduction to Purchasing and Supplier
Base Reduction. Figure 7 illustrates an overview of the structure and the content. This section begins
with a basic overview of purchasing in order to introduce the reader to the field and to define the
study’s starting point within the area of purchasing. The purpose of the study is limited to strategic
sourcing and therefore the term sourcing and different strategies are presented further. This also gives
the reader a solid base and understanding of strategies used to manage the supplier base. The sections
Multiple versus single sourcing and Supplier segmentation have a strong connection to the area of the
study and to understand how they are connected these areas are relevant to revise. To fulfil the purpose
of the study, the literature area of supplier base reduction, hereinafter also referred to as SBR, will be
investigated. To introduce the reader to this area, benefits and drawbacks of SBR are at first presented.
A section regarding success factors has also been included to highlight necessary factors for
succeeding with an implementation of SBR. Finally, different processes, approaches and tools for SBR
are investigated and presented.
Figure 7: Illustration of the content of the Theory of Reference
3.1 INTRODUCTION TO PURCHASING
Purchasing was previously considered to be responsible for the “five rights”: “getting the right quality,
in the right quantity, at the right time, for the right price, from the right source” (Handfield, et al.,
2011, p. 10). If depicted in the value chain as presented by Porter (1985), purchasing takes the role of
a support activity. The value chain is a central concept used in many business strategies and this model
can be used to describe the importance of the purchasing function and its role in the organization (van
Weele, 2010). Porter (1985) uses the term procurement to describe the function of purchasing;
however in this study the term purchasing will be used.
Theory of Reference 10
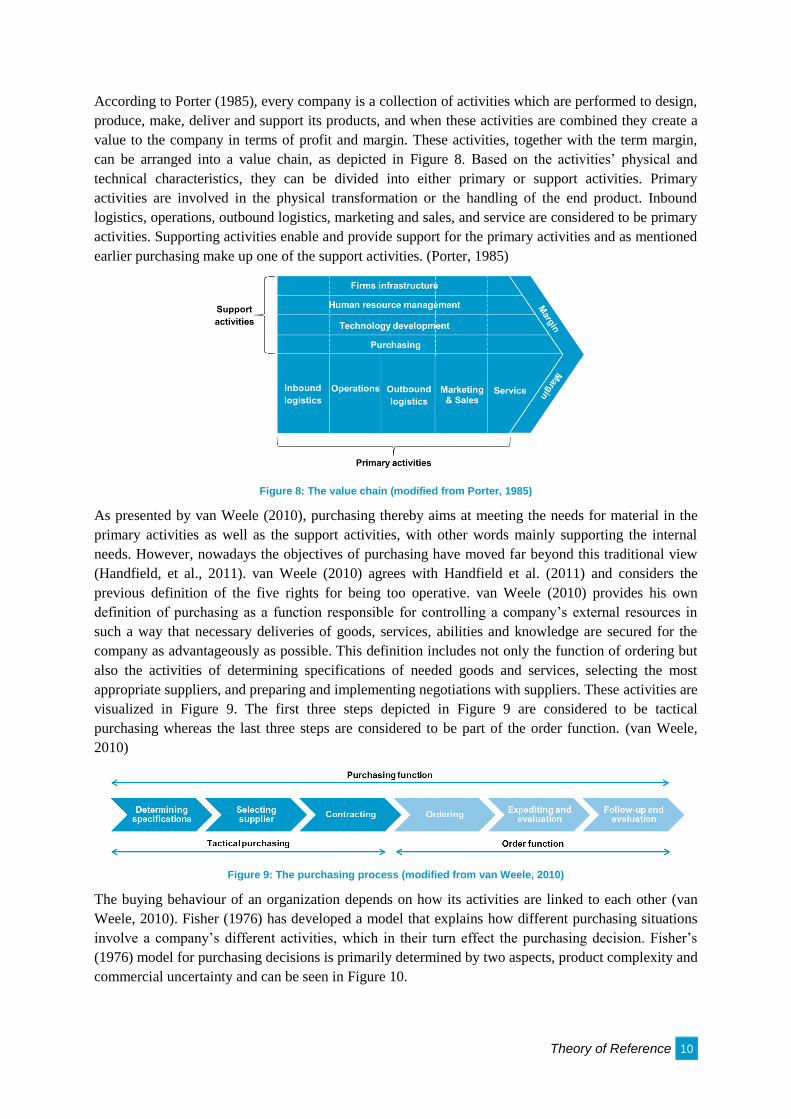
According to Porter (1985), every company is a collection of activities which are performed to design,
produce, make, deliver and support its products, and when these activities are combined they create a
value to the company in terms of profit and margin. These activities, together with the term margin,
can be arranged into a value chain, as depicted in Figure 8. Based on the activities’ physical and
technical characteristics, they can be divided into either primary or support activities. Primary
activities are involved in the physical transformation or the handling of the end product. Inbound
logistics, operations, outbound logistics, marketing and sales, and service are considered to be primary
activities. Supporting activities enable and provide support for the primary activities and as mentioned
earlier purchasing make up one of the support activities. (Porter, 1985)
Figure 8: The value chain (modified from Porter, 1985)
As presented by van Weele (2010), purchasing thereby aims at meeting the needs for material in the
primary activities as well as the support activities, with other words mainly supporting the internal
needs. However, nowadays the objectives of purchasing have moved far beyond this traditional view
(Handfield, et al., 2011). van Weele (2010) agrees with Handfield et al. (2011) and considers the
previous definition of the five rights for being too operative. van Weele (2010) provides his own
definition of purchasing as a function responsible for controlling a company’s external resources in
such a way that necessary deliveries of goods, services, abilities and knowledge are secured for the
company as advantageously as possible. This definition includes not only the function of ordering but
also the activities of determining specifications of needed goods and services, selecting the most
appropriate suppliers, and preparing and implementing negotiations with suppliers. These activities are
visualized in Figure 9. The first three steps depicted in Figure 9 are considered to be tactical
purchasing whereas the last three steps are considered to be part of the order function. (van Weele,
2010)
Figure 9: The purchasing process (modified from van Weele, 2010)
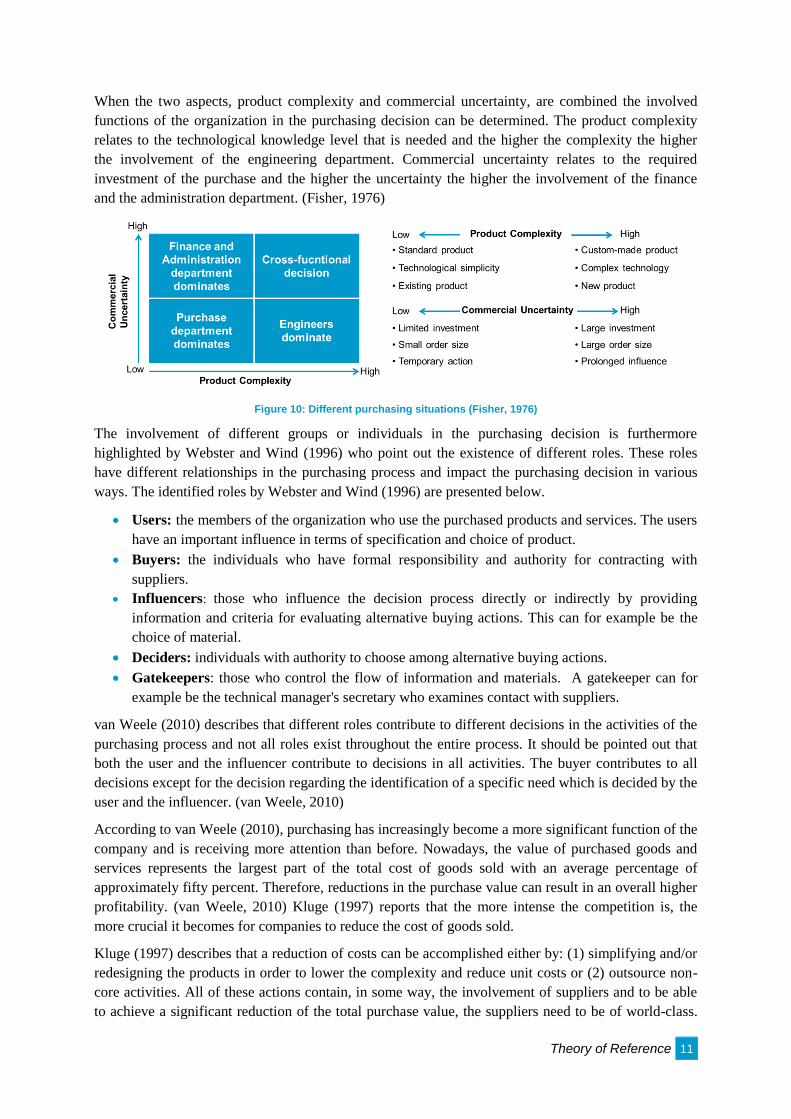
The buying behaviour of an organization depends on how its activities are linked to each other (van
Weele, 2010). Fisher (1976) has developed a model that explains how different purchasing situations
involve a company’s different activities, which in their turn effect the purchasing decision. Fisher’s
(1976) model for purchasing decisions is primarily determined by two aspects, product complexity and
commercial uncertainty and can be seen in Figure 10.
Theory of Reference 11
When the two aspects, product complexity and commercial uncertainty, are combined the involved
functions of the organization in the purchasing decision can be determined. The product complexity
relates to the technological knowledge level that is needed and the higher the complexity the higher
the involvement of the engineering department. Commercial uncertainty relates to the required
investment of the purchase and the higher the uncertainty the higher the involvement of the finance
and the administration department. (Fisher, 1976)
Figure 10: Different purchasing situations (Fisher, 1976)
The involvement of different groups or individuals in the purchasing decision is furthermore
highlighted by Webster and Wind (1996) who point out the existence of different roles. These roles
have different relationships in the purchasing process and impact the purchasing decision in various
ways. The identified roles by Webster and Wind (1996) are presented below.
Users: the members of the organization who use the purchased products and services. The users
have an important influence in terms of specification and choice of product.
Buyers: the individuals who have formal responsibility and authority for contracting with
suppliers.
Influencers: those who influence the decision process directly or indirectly by providing
information and criteria for evaluating alternative buying actions. This can for example be the
choice of material.
Deciders: individuals with authority to choose among alternative buying actions.
Gatekeepers: those who control the flow of information and materials. A gatekeeper can for
example be the technical manager's secretary who examines contact with suppliers.
van Weele (2010) describes that different roles contribute to different decisions in the activities of the
purchasing process and not all roles exist throughout the entire process. It should be pointed out that
both the user and the influencer contribute to decisions in all activities. The buyer contributes to all
decisions except for the decision regarding the identification of a specific need which is decided by the
user and the influencer. (van Weele, 2010)
According to van Weele (2010), purchasing has increasingly become a more significant function of the
company and is receiving more attention than before. Nowadays, the value of purchased goods and
services represents the largest part of the total cost of goods sold with an average percentage of
approximately fifty percent. Therefore, reductions in the purchase value can result in an overall higher
profitability. (van Weele, 2010) Kluge (1997) reports that the more intense the competition is, the
more crucial it becomes for companies to reduce the cost of goods sold.
Kluge (1997) describes that a reduction of costs can be accomplished either by: (1) simplifying and/or
redesigning the products in order to lower the complexity and reduce unit costs or (2) outsource non-
core activities. All of these actions contain, in some way, the involvement of suppliers and to be able
to achieve a significant reduction of the total purchase value, the suppliers need to be of world-class.

Theory of Reference 12
What sets a world-class supplier apart from an average supplier is the product design and complexity
of their supplied products as well as their operational efficiency. By collaborating with suppliers, in
order to improve their product design and operations, the buyer’s overall purchase costs can be
reduced. (Kluge, 1997) Another benefit mentioned by Handfield, et al. (2011), is that a supplier can
even contribute to differentiating the buyer’s final product.
Collaborating with suppliers is therefore considered to be of high importance. A collaboration can
however only be achieved with close relationships, which in turn is dependent on not having too many
suppliers. The activity of managing suppliers is called sourcing and it is a powerful tool for improving
profitability. Because of its high importance, sourcing is described in more detail below. (Kluge, 1997)
3.1.1 SOURCING
Sourcing is defined by van Weele (2010, p. 410) as “finding, selecting, contracting and managing the
best possible source of supply on a worldwide basis”. A sourcing strategy comprises in general of
three main decisions which need to be decided on in order to create an effective supplier base and
consequently an effective supply chain (Burke & Vakharia, 2004). These decisions regard determining
the appropriate number of suppliers, developing criteria for selecting suppliers and deciding on which
quantity to order from each supplier (Burke & Vakharia, 2004). In this study, the focus is on the
amount of suppliers to order from, i.e. the first mentioned decision. Since supply chains are exposed to
various risks concerning the inbound supply, the choice of the number of suppliers is therefore
considered to be an important strategic decision (Costantino & Pellegrino, 2009). This decision and its
possible sourcing strategies will therefore be further described below in the section about single and
multiple sourcing.
According to Handfield, et al. (2011), a sourcing strategy is usually focused on a particular category of
products. Rezaei and Ortt (2012) state that a segmentation is highly valuable, especially when working
with different types of suppliers, but in contrast to Handfield, et al. (2011) they choose to focus on the
segmentation of suppliers. With the help from such a segmentation it is possible to choose the most
suitable sourcing strategy for each segment (Rezaei & Ortt, 2012). Treleven and Bergman Schweikhart
(1988) describe that a segmentation would consequently result in different sourcing strategies for
different segments depending on the characteristics of each segment. Because of the high value of
segmenting suppliers, possible segmentation methods are presented below in the section about
supplier segmentation.
When formulating a sourcing strategy Treleven and Bergman Schweikhart (1988) highlight the need
for it to be in accordance with the company’s already existing quality strategies and policies.
Handfield, et al. (2011) also stress the importance of the sourcing strategy to be aligned with the
company’s overall strategies and objectives. Before initiating the development of a sourcing strategy,
it is necessary to incorporate key stakeholders from the executive level of the company (Handfield, et
al., 2011). In failing to do so, Handfield, et al. (2011) believe that the result from a sourcing strategy
will not likely be successful.
Theory of Reference 13
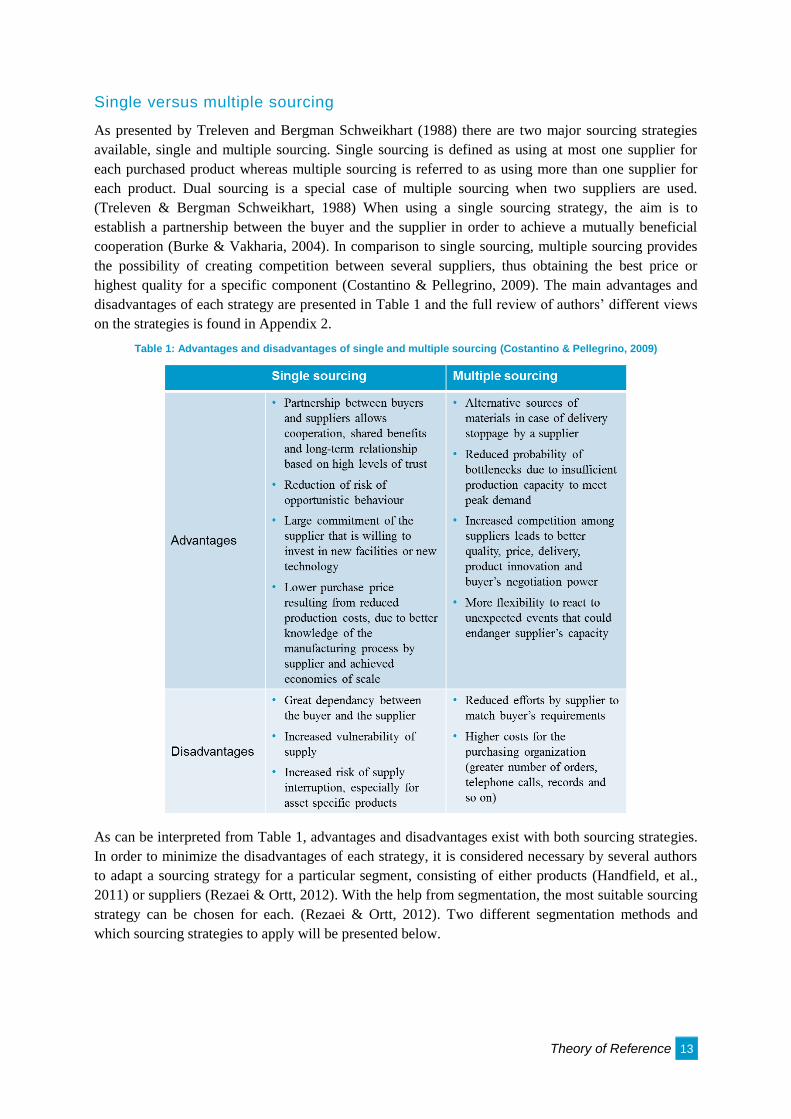
Single versus multiple sourcing
As presented by Treleven and Bergman Schweikhart (1988) there are two major sourcing strategies
available, single and multiple sourcing. Single sourcing is defined as using at most one supplier for
each purchased product whereas multiple sourcing is referred to as using more than one supplier for
each product. Dual sourcing is a special case of multiple sourcing when two suppliers are used.
(Treleven & Bergman Schweikhart, 1988) When using a single sourcing strategy, the aim is to
establish a partnership between the buyer and the supplier in order to achieve a mutually beneficial
cooperation (Burke & Vakharia, 2004). In comparison to single sourcing, multiple sourcing provides
the possibility of creating competition between several suppliers, thus obtaining the best price or
highest quality for a specific component (Costantino & Pellegrino, 2009). The main advantages and
disadvantages of each strategy are presented in Table 1 and the full review of authors’ different views
on the strategies is found in Appendix 2.
Table 1: Advantages and disadvantages of single and multiple sourcing (Costantino & Pellegrino, 2009)
As can be interpreted from Table 1, advantages and disadvantages exist with both sourcing strategies.
In order to minimize the disadvantages of each strategy, it is considered necessary by several authors
to adapt a sourcing strategy for a particular segment, consisting of either products (Handfield, et al.,
2011) or suppliers (Rezaei & Ortt, 2012). With the help from segmentation, the most suitable sourcing
strategy can be chosen for each. (Rezaei & Ortt, 2012). Two different segmentation methods and
which sourcing strategies to apply will be presented below.
Theory of Reference 14
Supplier segmentation
As mentioned earlier, it is considered beneficial to segment suppliers and adapt a sourcing strategy for
each segment (Rezaei & Ortt, 2012). Handfield, et al. (2011) proposes that it is the products or
services that should be segmented and categorized. A literature review shows that both approaches of
segmenting suppliers and segmenting products are represented and used among researchers. Rezaei
and Ortt (2012) performed an extensive literature search on supplier segmentation which resulted in
the classification of several different methods into three groups: process methods, portfolio methods
and involvement methods. A process method describes the process of finding a suitable segmentation
without specifying it, a portfolio method focuses on the characteristics of the purchased products, and
the involvement method bases the segmentation on the relationship between the buyer and the supplier
(Rezaei & Ortt, 2012). Since a process method does not provide a clear specification of the
segmentation and since developing a method for segmentation lies outside of the scope, this method
will not be further described. Two pioneering methods of the other two types will be described below
in order to provide a sound basis for the process of segmenting suppliers.
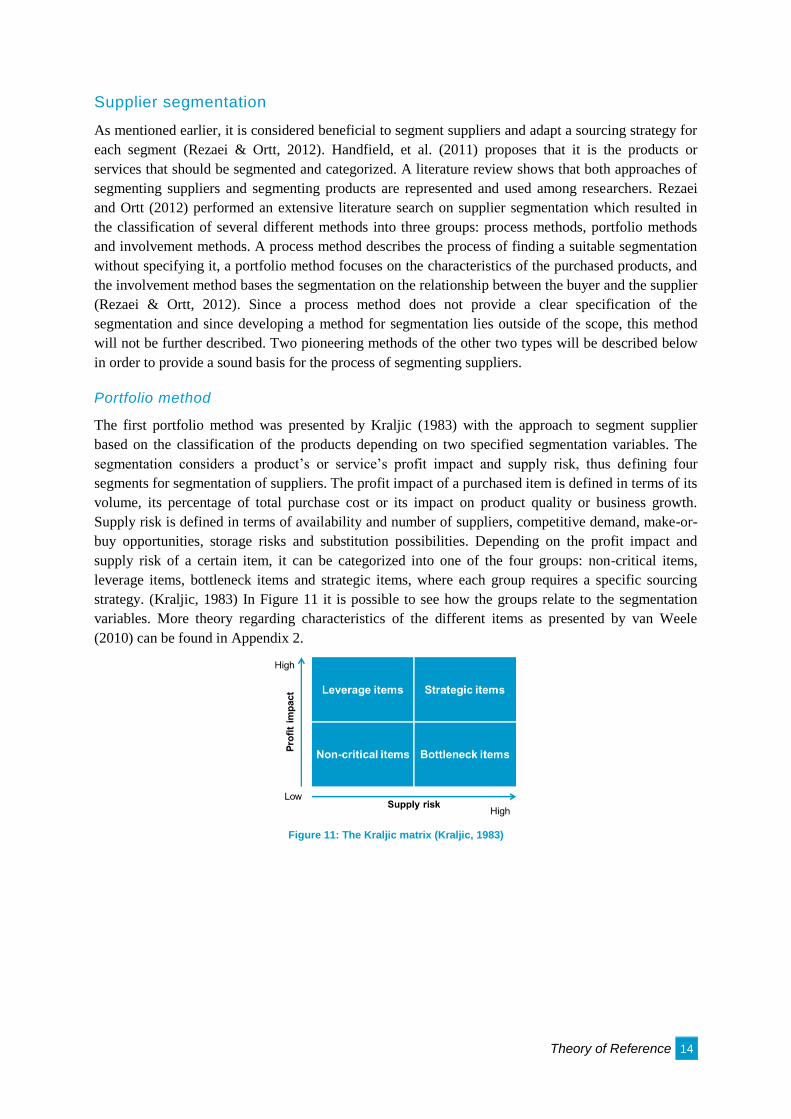
Portfolio method
The first portfolio method was presented by Kraljic (1983) with the approach to segment supplier
based on the classification of the products depending on two specified segmentation variables. The
segmentation considers a product’s or service’s profit impact and supply risk, thus defining four
segments for segmentation of suppliers. The profit impact of a purchased item is defined in terms of its
volume, its percentage of total purchase cost or its impact on product quality or business growth.
Supply risk is defined in terms of availability and number of suppliers, competitive demand, make-or-
buy opportunities, storage risks and substitution possibilities. Depending on the profit impact and
supply risk of a certain item, it can be categorized into one of the four groups: non-critical items,
leverage items, bottleneck items and strategic items, where each group requires a specific sourcing
strategy. (Kraljic, 1983) In Figure 11 it is possible to see how the groups relate to the segmentation
variables. More theory regarding characteristics of the different items as presented by van Weele
(2010) can be found in Appendix 2.
Figure 11: The Kraljic matrix (Kraljic, 1983)
Theory of Reference 15
van Weele (2010) proposes four different strategies on how to manage the suppliers, each of which
can be applied for a specific category. For strategic items, van Weele (2010) proposes the usage of
partnership between the buyer and one supplier. With a close and long term relationship, it is possible
to achieve a mutual participation that can be beneficial for both parties. The strategy of competitive
bidding is considered suitable for leverage items since multiple suppliers exist and therefore more
emphasis can be placed on reaching a low price. However, the quality of the supplied components
must still be retained. Because of the high volume of leverage items, even small changes in price can
have a big effect on the overall cost of goods sold and therefore it is beneficial to actively search for
new suppliers that can offer lower prices. Bottleneck items are considered to have a big effect on the
supply chain and it is therefore beneficial to primarily aim at securing the delivery of these items in
order to prevent an occurrence of inaccurate deliveries, even if that would result in a higher cost. It is
also important to simultaneously look for new alternatives for bottleneck items and their suppliers to
avoid being too dependent of a particular supplier. For non-critical items it is important to
continuously work on streamlining the purchasing processes in order to minimize the costs for
managing these items. This can be done by standardizing the product range, lowering the number of
suppliers, working with electronic ordering, ordering over the internet or using electronic forms of
payment. (van Weele, 2010)
Involvement method
An involvement method was presented by Dyer, et al. (1998) after having compared buyer-supplier
relationships in the automotive industry in the United States, Japan and Korea. Dyer, et al. (1998)
developed a method for segmenting suppliers into two groups of relationships: strategic and durable
arm’s length relationships. Only one segmentation variable is used, which is based on how purchased
resources are related to the company’s core competencies. Resources that are related to core activities
are called strategic resources, while resources that are related to non-core activities are called non-
strategic resources. (Dyer, et al., 1998)
Strategic resources are typically inputs of high value and contribute to differentiating the company’s
final product. Due to the potential benefits of customization, it is Dyer, et al. (1998) recommend that a
strategic partnership should be applied. With a partnership it is possible to achieve a high degree of
coordination between the buyer and the supplier. In order to maintain the partnership, relation-specific
investments and sharing of information are necessary for both parties. Therefore, it is important
develop a high degree of trust between all partners. (Dyer, et al., 1998)
Non-strategic resources are explained by Dyer, et al. (1998) considered to be standardized and
standalone products and therefore the need for coordination between the buyer and the supplier is
lower. These resources do not contribute to the differentiation of the product and therefore the aim is
to obtain the inputs at a low cost. Consequently, for non-strategic resources Dyer, et al. (1998) suggest
that a durable arm’s length relationship should be performed. With a durable arm’s length relationship,
two or three long term suppliers can be used be assured some future business as long as the offered
prices stay competitive. Competitive bidding between the long term suppliers can be performed to
keep the suppliers on their toes. It is also possible to reopen the bidding for all suppliers to ensure that
the long term suppliers have the lowest costs and best capabilities. However, in order to provide
enough incentive for the suppliers to become willing to invest in the relationship, the bidding should
be held at longer time intervals, for example every five years. (Dyer, et al., 1998)
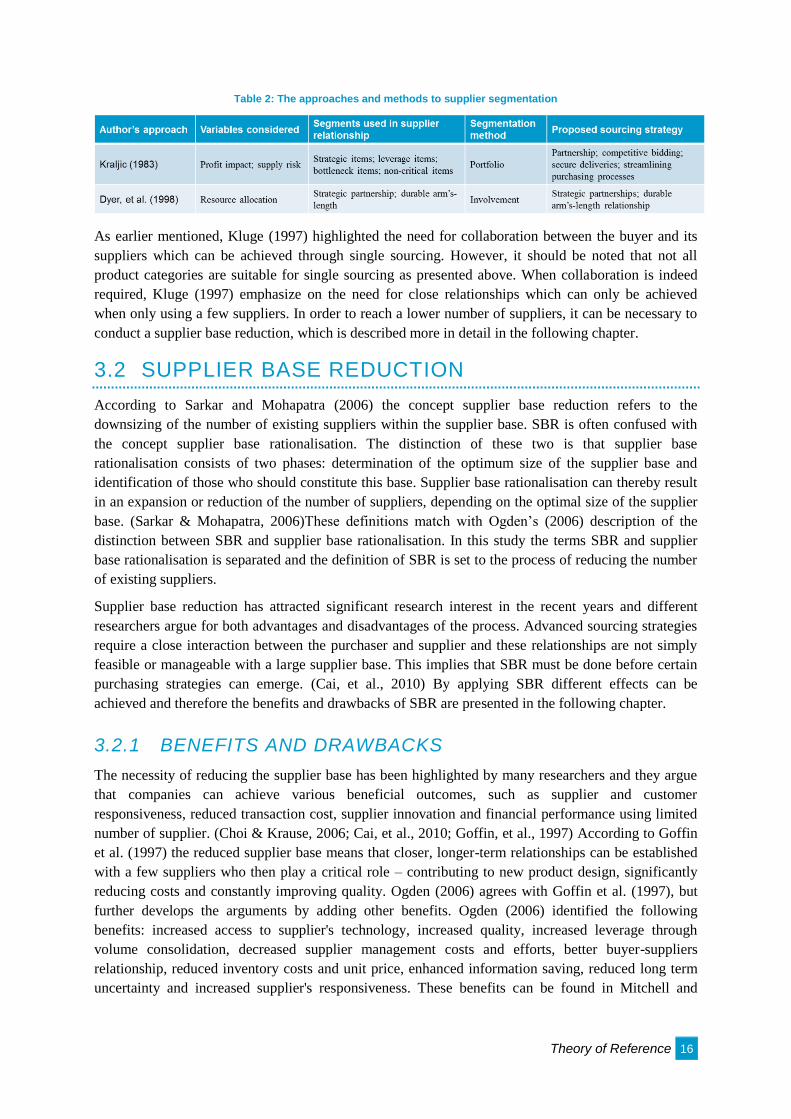
Two fundamental supplier segmentation methods have been presented and in Table 2 the properties of
these methods are summarized.
Theory of Reference 16
Table 2: The approaches and methods to supplier segmentation
As earlier mentioned, Kluge (1997) highlighted the need for collaboration between the buyer and its
suppliers which can be achieved through single sourcing. However, it should be noted that not all
product categories are suitable for single sourcing as presented above. When collaboration is indeed
required, Kluge (1997) emphasize on the need for close relationships which can only be achieved
when only using a few suppliers. In order to reach a lower number of suppliers, it can be necessary to
conduct a supplier base reduction, which is described more in detail in the following chapter.
3.2 SUPPLIER BASE REDUCTION
According to Sarkar and Mohapatra (2006) the concept supplier base reduction refers to the
downsizing of the number of existing suppliers within the supplier base. SBR is often confused with
the concept supplier base rationalisation. The distinction of these two is that supplier base
rationalisation consists of two phases: determination of the optimum size of the supplier base and
identification of those who should constitute this base. Supplier base rationalisation can thereby result
in an expansion or reduction of the number of suppliers, depending on the optimal size of the supplier
base. (Sarkar & Mohapatra, 2006)These definitions match with Ogden’s (2006) description of the
distinction between SBR and supplier base rationalisation. In this study the terms SBR and supplier
base rationalisation is separated and the definition of SBR is set to the process of reducing the number
of existing suppliers.
Supplier base reduction has attracted significant research interest in the recent years and different
researchers argue for both advantages and disadvantages of the process. Advanced sourcing strategies
require a close interaction between the purchaser and supplier and these relationships are not simply
feasible or manageable with a large supplier base. This implies that SBR must be done before certain
purchasing strategies can emerge. (Cai, et al., 2010) By applying SBR different effects can be
achieved and therefore the benefits and drawbacks of SBR are presented in the following chapter.
3.2.1 BENEFITS AND DRAWBACKS
The necessity of reducing the supplier base has been highlighted by many researchers and they argue
that companies can achieve various beneficial outcomes, such as supplier and customer
responsiveness, reduced transaction cost, supplier innovation and financial performance using limited
number of supplier. (Choi & Krause, 2006; Cai, et al., 2010; Goffin, et al., 1997) According to Goffin
et al. (1997) the reduced supplier base means that closer, longer-term relationships can be established
with a few suppliers who then play a critical role – contributing to new product design, significantly
reducing costs and constantly improving quality. Ogden (2006) agrees with Goffin et al. (1997), but
further develops the arguments by adding other benefits. Ogden (2006) identified the following
benefits: increased access to supplier's technology, increased quality, increased leverage through
volume consolidation, decreased supplier management costs and efforts, better buyer-suppliers
relationship, reduced inventory costs and unit price, enhanced information saving, reduced long term
uncertainty and increased supplier's responsiveness. These benefits can be found in Mitchell and
Theory of Reference 17
Sawchuck’s (2012) three summarized benefits of SBR and these are therefore presented and described
below.
Reduced purchasing costs: historically, the largest opportunity created by SBR was financial
in the form of lower purchasing costs. As the number of suppliers is reduced, the buying power
increases. Purchase price and associated costs as shipping and handling, are referred to
"purchased costs". As the number of suppliers rises, the annual incremental savings associated
with these purchased costs decrease.
Reduced procurement and supplier management costs: with fewer suppliers, the number of
separate transactions is reduced and the amount of time spent on managing suppliers is
decreased. By using fewer suppliers the efficiency can increase and result in a reduced the
transaction costs.
Reduced noncompliance- and increase stakeholder satisfaction: with fewer suppliers, it also
becomes easier to monitor and control the suppliers against requirements, such as fraud
reduction, supplier diversity requirements etcetera. Furthermore, it is easier to be transparent
with fewer suppliers. Selecting fewer suppliers and managing them actively and professionally
is critical to enabling value in this area.
The above mentioned benefits are in line with each other but according to Rogers and Coulter (2008)
and Cousins (1999), SBR can lead to a negative impact. Rogers and Coulter (2008) discuss that the
benefits can carry a hidden cost in terms of risk. When reducing the number of suppliers, the company
becomes more dependent on fewer suppliers which in their turn can become dependent on fewer
suppliers and thereby increasing the overall supply chain risk. (Rogers & Coulter, 2008).
Cousins (1999) also mentions the risk of using fewer suppliers which could result in the risk of being
affected by increased prices, reduction in service levels, poor quality and end up in an inflexible
position. Furthermore, he argues that SBR requires the company to use a different supplier
management style; buyers will need to become much more strategic in their focus as they lose their
leveraging ability and they need to work more cross-functionally. This requires new skills,
competencies and measurement systems for both buyers and suppliers (Cousins, 1999). In his
empirical study, Cousins (1999) could see that around 50 percent of the companies that had conducted
SBR could not see any improvement on the total spend figure. However, he found that 92 percent of
the respondents claimed that their transaction costs had decreased but no "hard data" could justify the
claim. Both Cousins (1999) and Goffin et al. (1997) argue that the benefits from an SBR initiative are
not easily achievable and very rarely measurable. They concluded that many companies are reducing
the number of suppliers just for the sake of doing it and that they neglect the long term implications of
such initiative.
Moreover, Porter (1997) found that reducing the number of suppliers reduces the competition among
the suppliers rather than enhancing it. The positive market mechanism disappears and the risk of
higher prices for lower quality increases (Porter, 1997). She defined four conceptual reasons for not
implementing SBR activities.
The fear of risking to stultify rather than to enhance competition among suppliers.
The need for a formalized system for evaluating supplier performance.
The large amount of time needed to build consensus and to breakdown cultural barrier among
corporate divisions.
The large amount of time needed to develop their supplier consolidation policy.
Theory of Reference 18
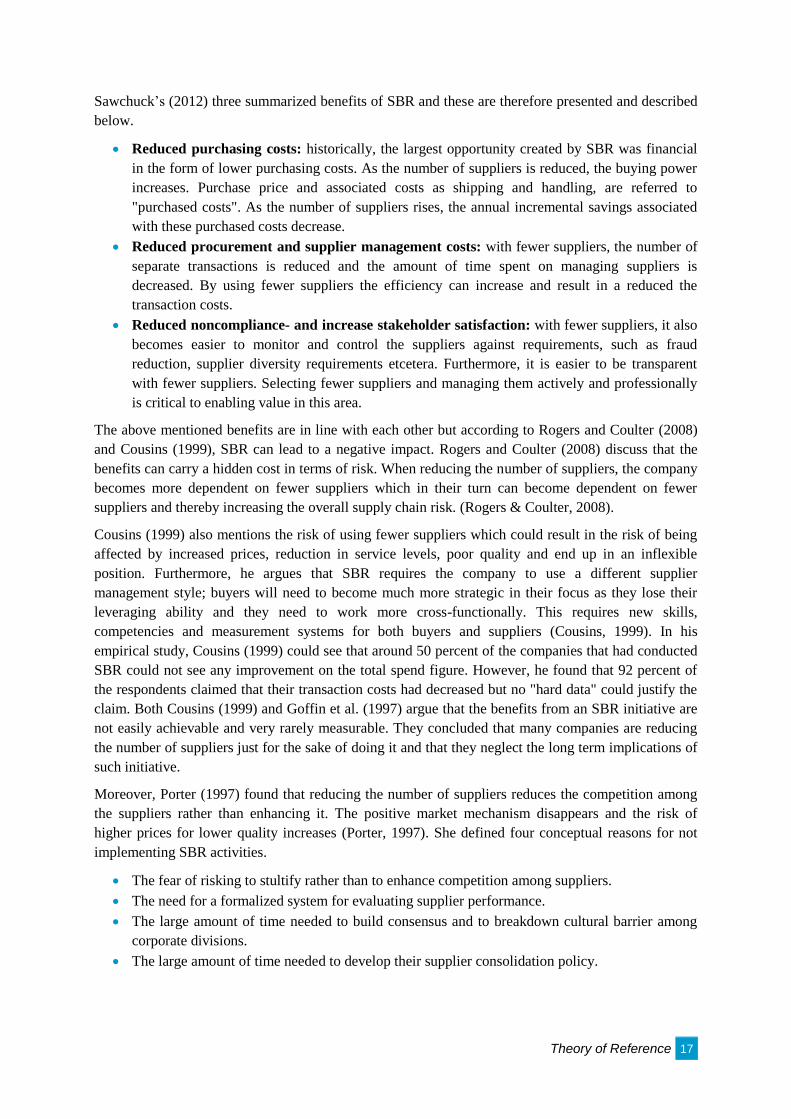
The above mentioned benefits and drawbacks are summarized in Table 3 and Table 4.
Table 3: Benefits of supplier base reduction
Table 4: Drawbacks of supplier base reduction
As can be interpreted from the two tables, several authors emphasize same benefits and drawbacks.
Furthermore, some variables are mentioned both as a drawback and a benefit. In order to only achieve
the benefits several authors highlight the importance of having control and investigate the supply risk
and price development (Ogden, 2006; Rogers & Coulter, 2008; Mitchell & Sawchuk, 2012). Different
success factors have also been discussed by several authors and will be presented below.
3.2.2 SUCCESS FACTORS
To enable a successful implementation of SBR, companies need to consider a number of important
elements. In an empirical study from Ogden (2006) on companies that have implemented SBR
projects, respondents were asked to identify critical success factors. Overall, Ogden (2006) identified
20 success factors and the most critical and important factors are presented below.
Good information system: first, a good information system allows companies to gather
historical information regarding suppliers’ products. One of the main barriers to SBR is lack of
historical data to utilize in decision making. Second, an effective information system will also
support compliance initiatives during the implementation phase. Third, it helps standardization
efforts by allowing decision makers to visualize the spending across the organization. A good
information system is therefore considered to be a prerequisite for an effective SBR.
Cross-functional team: teams enhance the probability of participation of stakeholders in the
SBR process and to secure the implementation. Getting inputs from different departments can
provide valuable information. For example, receiving input from the engineering department
can help the purchasing department discover potential issues. Furthermore, stakeholders are
more likely to approve changes when they have input in shaping changes initially.
Selecting the right supplier: when shifting larger volumes to fewer suppliers, the company
needs to ensure that the selected suppliers have the capacity and capability to support larger
volumes within the lead time requirements.
Theory of Reference 19
Good communication: key stakeholders need to be informed of the progress and the cross-
functional team therefore becomes critical. It is essential that project objectives and benefits are
well communicated throughout the organization.
Win-win relationships: both suppliers and buyers will get benefits from the SBR process.
Key management support: to avoid any blockage during the implementation and unnecessary
delays, the key decision makers should be involved early in the process. The key decision
makers are not necessarily top managers but are manager with influence.
Goffin, et al. (1997) strengthens Ogden’s (2006) presented success factors, by also mentioning the
importance of a cross-functional team and a good information system. Other successes factors
mentioned by Driedonks, et al. (2014) in connection with other purchasing strategies are top
management support, cross-functional teams and good communication. Some of these success factors
can be secured by predefined processes and different processes for SBR are therefore presented below.
3.2.3 PROCESSES
Despite the importance of SBR, models of SBR are considered rare (Sarkar & Mohapatra, 2006).
Ogden and Carter (2008) agree with Sarkar and Mohapatra (2006) and emphasize on the fact that little
empirical research has been done on the subject. During the literature studies, three main processes of
SBR were identified and these will be described below.
Carter and Ogden (2008) conducted an empirical study on companies that had managed to reduce their
supplier base, with the aim to develop a process for SBR. They observed that even if organizations
utilize different approaches when conducting SBR and have different objectives, the principal process
that was utilized was similar. Figure 12 illustrates an overview of the process that Ogden and Carter
(2008) developed and is described below. The first step, establishing cross-functional team, has the
aim to involve important stakeholders and gather vital information. Secondly, the step of developing a
sourcing strategy needs to be conducted in order to decide where focus should be and to enable the
next step of identifying potential suppliers. The development of a commodity sourcing strategy should
be based on a spend analysis and reflect the overall goals of the corporate. The third step consists of
identifying and developing a shortlist of qualified suppliers based on predefined criteria. Thereafter,
the supplier selection step involves narrowing down the list of potential suppliers and selecting the
appropriate number of suppliers. This can be conducted by multiple rounds of request for proposals
(RFP). During the following step, the changes are implemented. The implementation step is said to be
the most difficult because of the risk for potential resistance and communication issues and the need
for information dissemination, system integration, process control and supplier validation. During this
step, suppliers are eliminated or selected. If the transition phase fails to smoothly transfer the
responsibilities from the old to the new suppliers, the company risk disrupting its operations. The final
step involves ongoing measurement and management of the suppliers to ensure that the processes and
prices remain best in class by establishing periodic re-evaluation of the suppliers. The step therefore
consists of benchmarking and measuring the impact of the SBR initiative. (Ogden & Carter, 2008)
Figure 12: Overarching supplier base reduction process (modified from Carter and Ogden, 2008)
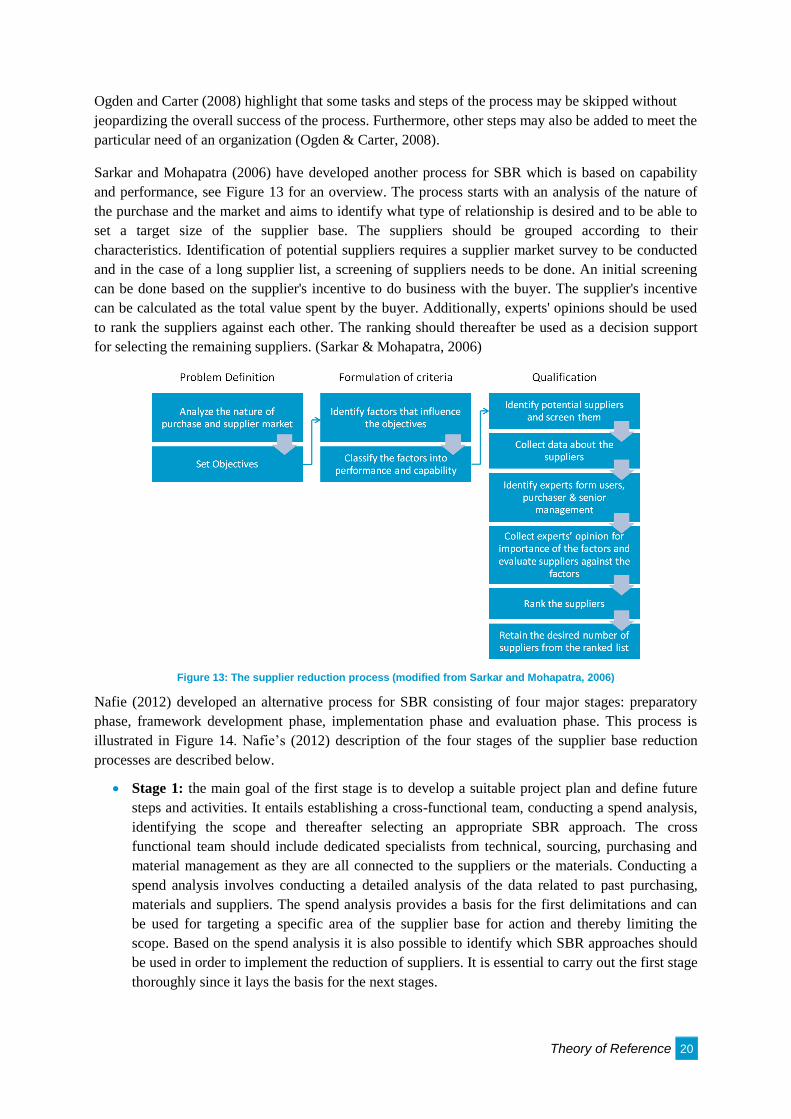
Theory of Reference 20
Ogden and Carter (2008) highlight that some tasks and steps of the process may be skipped without
jeopardizing the overall success of the process. Furthermore, other steps may also be added to meet the
particular need of an organization (Ogden & Carter, 2008).
Sarkar and Mohapatra (2006) have developed another process for SBR which is based on capability
and performance, see Figure 13 for an overview. The process starts with an analysis of the nature of
the purchase and the market and aims to identify what type of relationship is desired and to be able to
set a target size of the supplier base. The suppliers should be grouped according to their
characteristics. Identification of potential suppliers requires a supplier market survey to be conducted
and in the case of a long supplier list, a screening of suppliers needs to be done. An initial screening
can be done based on the supplier's incentive to do business with the buyer. The supplier's incentive
can be calculated as the total value spent by the buyer. Additionally, experts' opinions should be used
to rank the suppliers against each other. The ranking should thereafter be used as a decision support
for selecting the remaining suppliers. (Sarkar & Mohapatra, 2006)
Figure 13: The supplier reduction process (modified from Sarkar and Mohapatra, 2006)
Nafie (2012) developed an alternative process for SBR consisting of four major stages: preparatory
phase, framework development phase, implementation phase and evaluation phase. This process is
illustrated in Figure 14. Nafie’s (2012) description of the four stages of the supplier base reduction
processes are described below.
Stage 1: the main goal of the first stage is to develop a suitable project plan and define future
steps and activities. It entails establishing a cross-functional team, conducting a spend analysis,
identifying the scope and thereafter selecting an appropriate SBR approach. The cross
functional team should include dedicated specialists from technical, sourcing, purchasing and
material management as they are all connected to the suppliers or the materials. Conducting a
spend analysis involves conducting a detailed analysis of the data related to past purchasing,
materials and suppliers. The spend analysis provides a basis for the first delimitations and can
be used for targeting a specific area of the supplier base for action and thereby limiting the
scope. Based on the spend analysis it is also possible to identify which SBR approaches should
be used in order to implement the reduction of suppliers. It is essential to carry out the first stage
thoroughly since it lays the basis for the next stages.
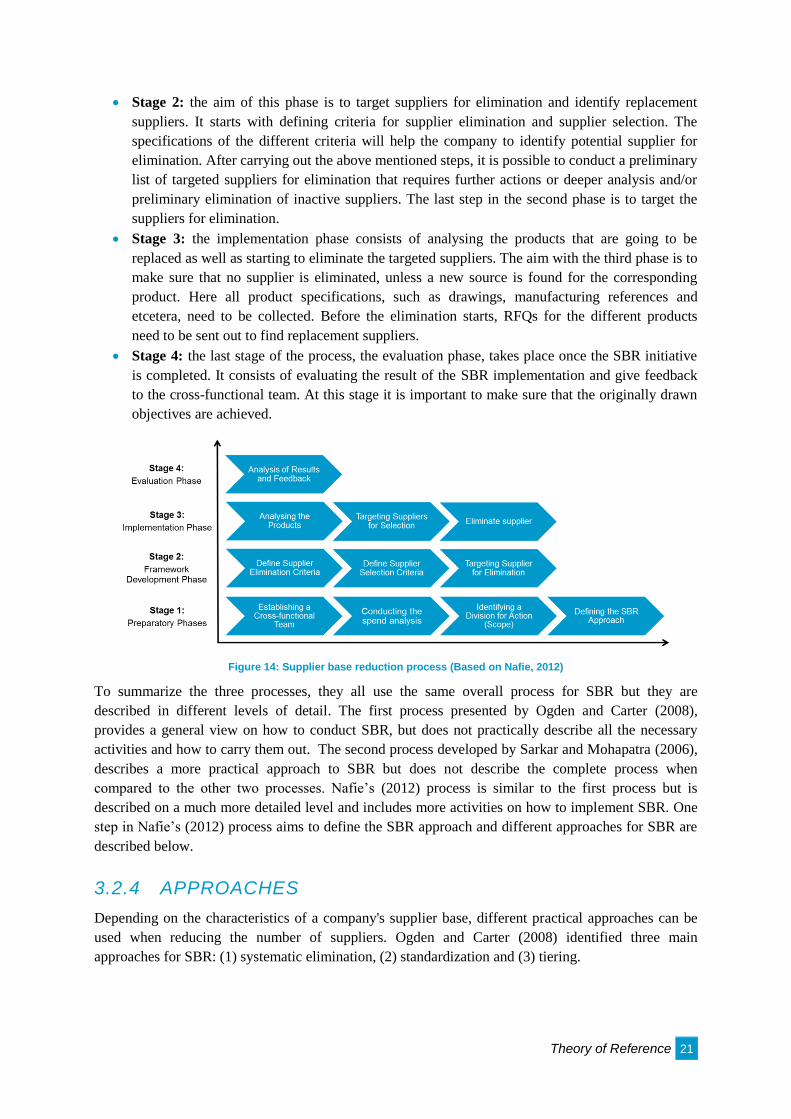
Theory of Reference 21
Stage 2: the aim of this phase is to target suppliers for elimination and identify replacement
suppliers. It starts with defining criteria for supplier elimination and supplier selection. The
specifications of the different criteria will help the company to identify potential supplier for
elimination. After carrying out the above mentioned steps, it is possible to conduct a preliminary
list of targeted suppliers for elimination that requires further actions or deeper analysis and/or
preliminary elimination of inactive suppliers. The last step in the second phase is to target the
suppliers for elimination.
Stage 3: the implementation phase consists of analysing the products that are going to be
replaced as well as starting to eliminate the targeted suppliers. The aim with the third phase is to
make sure that no supplier is eliminated, unless a new source is found for the corresponding
product. Here all product specifications, such as drawings, manufacturing references and
etcetera, need to be collected. Before the elimination starts, RFQs for the different products
need to be sent out to find replacement suppliers.
Stage 4: the last stage of the process, the evaluation phase, takes place once the SBR initiative
is completed. It consists of evaluating the result of the SBR implementation and give feedback
to the cross-functional team. At this stage it is important to make sure that the originally drawn
objectives are achieved.
Figure 14: Supplier base reduction process (Based on Nafie, 2012)
To summarize the three processes, they all use the same overall process for SBR but they are
described in different levels of detail. The first process presented by Ogden and Carter (2008),
provides a general view on how to conduct SBR, but does not practically describe all the necessary
activities and how to carry them out. The second process developed by Sarkar and Mohapatra (2006),
describes a more practical approach to SBR but does not describe the complete process when
compared to the other two processes. Nafie’s (2012) process is similar to the first process but is
described on a much more detailed level and includes more activities on how to implement SBR. One
step in Nafie’s (2012) process aims to define the SBR approach and different approaches for SBR are
described below.
3.2.4 APPROACHES
Depending on the characteristics of a company's supplier base, different practical approaches can be
used when reducing the number of suppliers. Ogden and Carter (2008) identified three main
approaches for SBR: (1) systematic elimination, (2) standardization and (3) tiering.
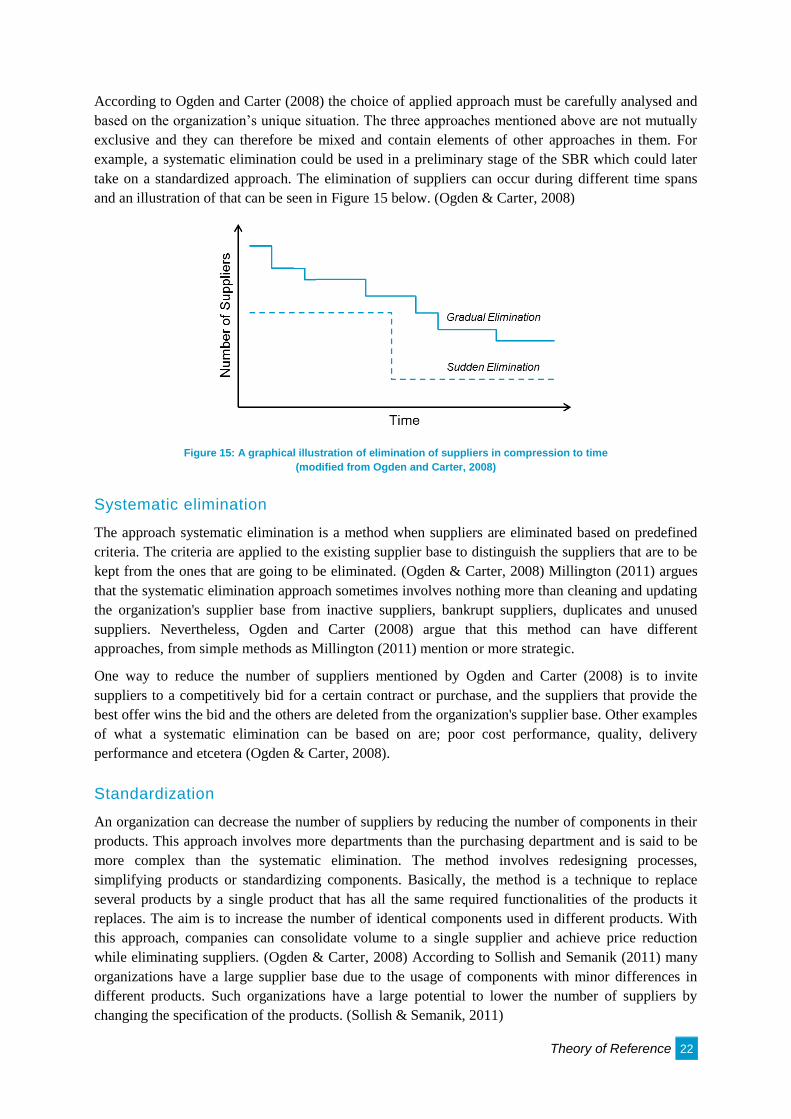
Theory of Reference 22
According to Ogden and Carter (2008) the choice of applied approach must be carefully analysed and
based on the organization’s unique situation. The three approaches mentioned above are not mutually
exclusive and they can therefore be mixed and contain elements of other approaches in them. For
example, a systematic elimination could be used in a preliminary stage of the SBR which could later
take on a standardized approach. The elimination of suppliers can occur during different time spans
and an illustration of that can be seen in Figure 15 below. (Ogden & Carter, 2008)
Figure 15: A graphical illustration of elimination of suppliers in compression to time
(modified from Ogden and Carter, 2008)
Systematic elimination
The approach systematic elimination is a method when suppliers are eliminated based on predefined
criteria. The criteria are applied to the existing supplier base to distinguish the suppliers that are to be
kept from the ones that are going to be eliminated. (Ogden & Carter, 2008) Millington (2011) argues
that the systematic elimination approach sometimes involves nothing more than cleaning and updating
the organization's supplier base from inactive suppliers, bankrupt suppliers, duplicates and unused
suppliers. Nevertheless, Ogden and Carter (2008) argue that this method can have different
approaches, from simple methods as Millington (2011) mention or more strategic.
One way to reduce the number of suppliers mentioned by Ogden and Carter (2008) is to invite
suppliers to a competitively bid for a certain contract or purchase, and the suppliers that provide the
best offer wins the bid and the others are deleted from the organization's supplier base. Other examples
of what a systematic elimination can be based on are; poor cost performance, quality, delivery
performance and etcetera (Ogden & Carter, 2008).
Standardization
An organization can decrease the number of suppliers by reducing the number of components in their
products. This approach involves more departments than the purchasing department and is said to be
more complex than the systematic elimination. The method involves redesigning processes,
simplifying products or standardizing components. Basically, the method is a technique to replace
several products by a single product that has all the same required functionalities of the products it
replaces. The aim is to increase the number of identical components used in different products. With
this approach, companies can consolidate volume to a single supplier and achieve price reduction
while eliminating suppliers. (Ogden & Carter, 2008) According to Sollish and Semanik (2011) many
organizations have a large supplier base due to the usage of components with minor differences in
different products. Such organizations have a large potential to lower the number of suppliers by
changing the specification of the products. (Sollish & Semanik, 2011)
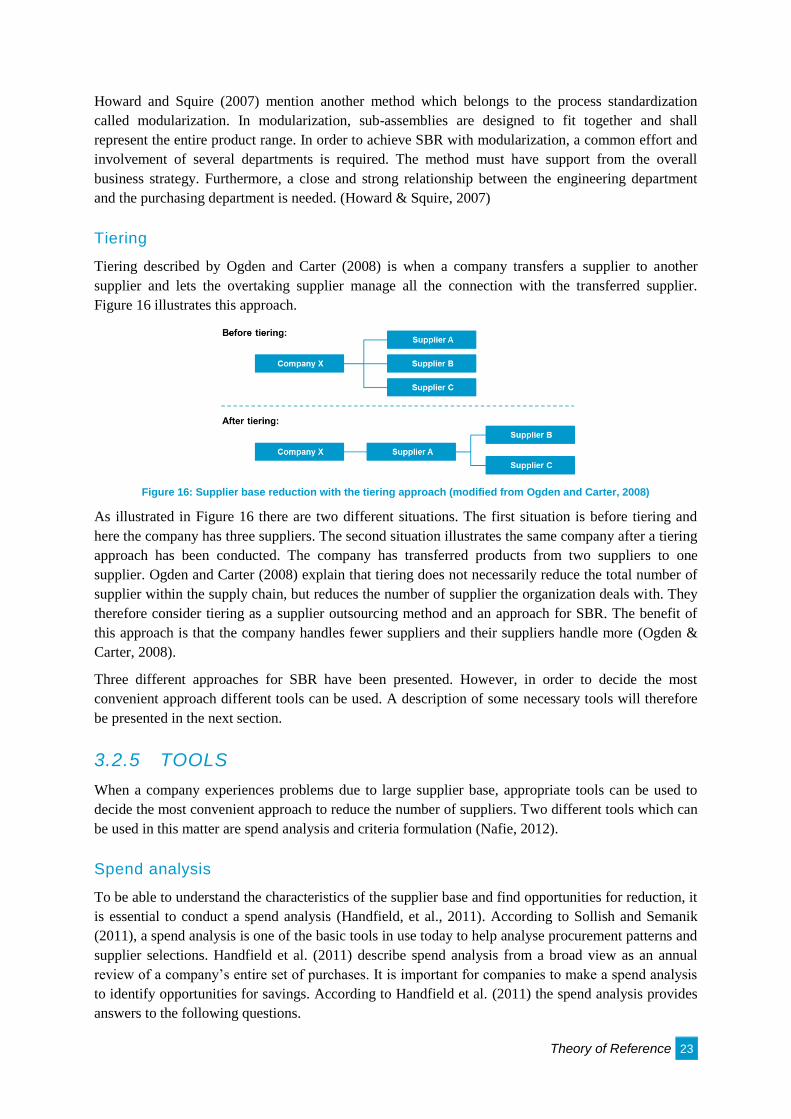
Theory of Reference 23
Howard and Squire (2007) mention another method which belongs to the process standardization
called modularization. In modularization, sub-assemblies are designed to fit together and shall
represent the entire product range. In order to achieve SBR with modularization, a common effort and
involvement of several departments is required. The method must have support from the overall
business strategy. Furthermore, a close and strong relationship between the engineering department
and the purchasing department is needed. (Howard & Squire, 2007)
Tiering
Tiering described by Ogden and Carter (2008) is when a company transfers a supplier to another
supplier and lets the overtaking supplier manage all the connection with the transferred supplier.
Figure 16 illustrates this approach.
Figure 16: Supplier base reduction with the tiering approach (modified from Ogden and Carter, 2008)
As illustrated in Figure 16 there are two different situations. The first situation is before tiering and
here the company has three suppliers. The second situation illustrates the same company after a tiering
approach has been conducted. The company has transferred products from two suppliers to one
supplier. Ogden and Carter (2008) explain that tiering does not necessarily reduce the total number of
supplier within the supply chain, but reduces the number of supplier the organization deals with. They
therefore consider tiering as a supplier outsourcing method and an approach for SBR. The benefit of
this approach is that the company handles fewer suppliers and their suppliers handle more (Ogden &
Carter, 2008).
Three different approaches for SBR have been presented. However, in order to decide the most
convenient approach different tools can be used. A description of some necessary tools will therefore
be presented in the next section.
3.2.5 TOOLS
When a company experiences problems due to large supplier base, appropriate tools can be used to
decide the most convenient approach to reduce the number of suppliers. Two different tools which can
be used in this matter are spend analysis and criteria formulation (Nafie, 2012).
Spend analysis
To be able to understand the characteristics of the supplier base and find opportunities for reduction, it
is essential to conduct a spend analysis (Handfield, et al., 2011). According to Sollish and Semanik
(2011), a spend analysis is one of the basic tools in use today to help analyse procurement patterns and
supplier selections. Handfield et al. (2011) describe spend analysis from a broad view as an annual
review of a company’s entire set of purchases. It is important for companies to make a spend analysis
to identify opportunities for savings. According to Handfield et al. (2011) the spend analysis provides
answers to the following questions.
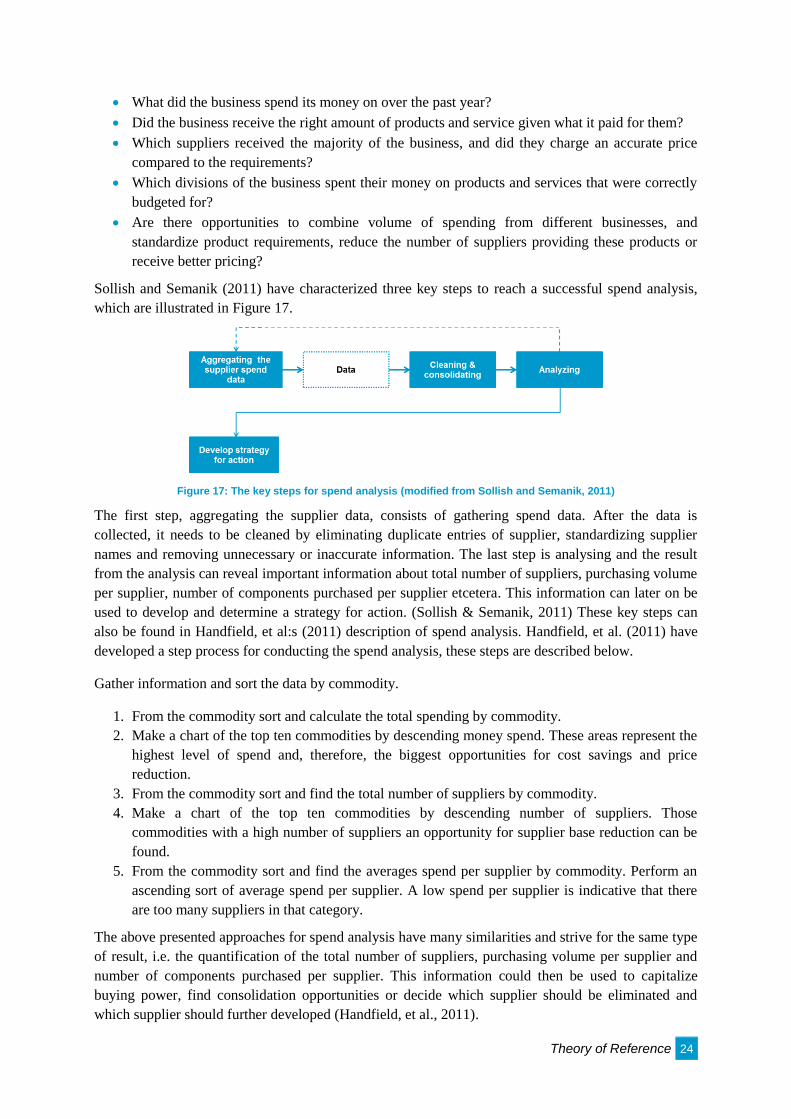
Theory of Reference 24
What did the business spend its money on over the past year?
Did the business receive the right amount of products and service given what it paid for them?
Which suppliers received the majority of the business, and did they charge an accurate price
compared to the requirements?
Which divisions of the business spent their money on products and services that were correctly
budgeted for?
Are there opportunities to combine volume of spending from different businesses, and
standardize product requirements, reduce the number of suppliers providing these products or
receive better pricing?
Sollish and Semanik (2011) have characterized three key steps to reach a successful spend analysis,
which are illustrated in Figure 17.
Figure 17: The key steps for spend analysis (modified from Sollish and Semanik, 2011)
The first step, aggregating the supplier data, consists of gathering spend data. After the data is
collected, it needs to be cleaned by eliminating duplicate entries of supplier, standardizing supplier
names and removing unnecessary or inaccurate information. The last step is analysing and the result
from the analysis can reveal important information about total number of suppliers, purchasing volume
per supplier, number of components purchased per supplier etcetera. This information can later on be
used to develop and determine a strategy for action. (Sollish & Semanik, 2011) These key steps can
also be found in Handfield, et al:s (2011) description of spend analysis. Handfield, et al. (2011) have
developed a step process for conducting the spend analysis, these steps are described below.
Gather information and sort the data by commodity.
1. From the commodity sort and calculate the total spending by commodity.
2. Make a chart of the top ten commodities by descending money spend. These areas represent the
highest level of spend and, therefore, the biggest opportunities for cost savings and price
reduction.
3. From the commodity sort and find the total number of suppliers by commodity.
4. Make a chart of the top ten commodities by descending number of suppliers. Those
commodities with a high number of suppliers an opportunity for supplier base reduction can be
found.
5. From the commodity sort and find the averages spend per supplier by commodity. Perform an
ascending sort of average spend per supplier. A low spend per supplier is indicative that there
are too many suppliers in that category.
The above presented approaches for spend analysis have many similarities and strive for the same type
of result, i.e. the quantification of the total number of suppliers, purchasing volume per supplier and
number of components purchased per supplier. This information could then be used to capitalize
buying power, find consolidation opportunities or decide which supplier should be eliminated and
which supplier should further developed (Handfield, et al., 2011).
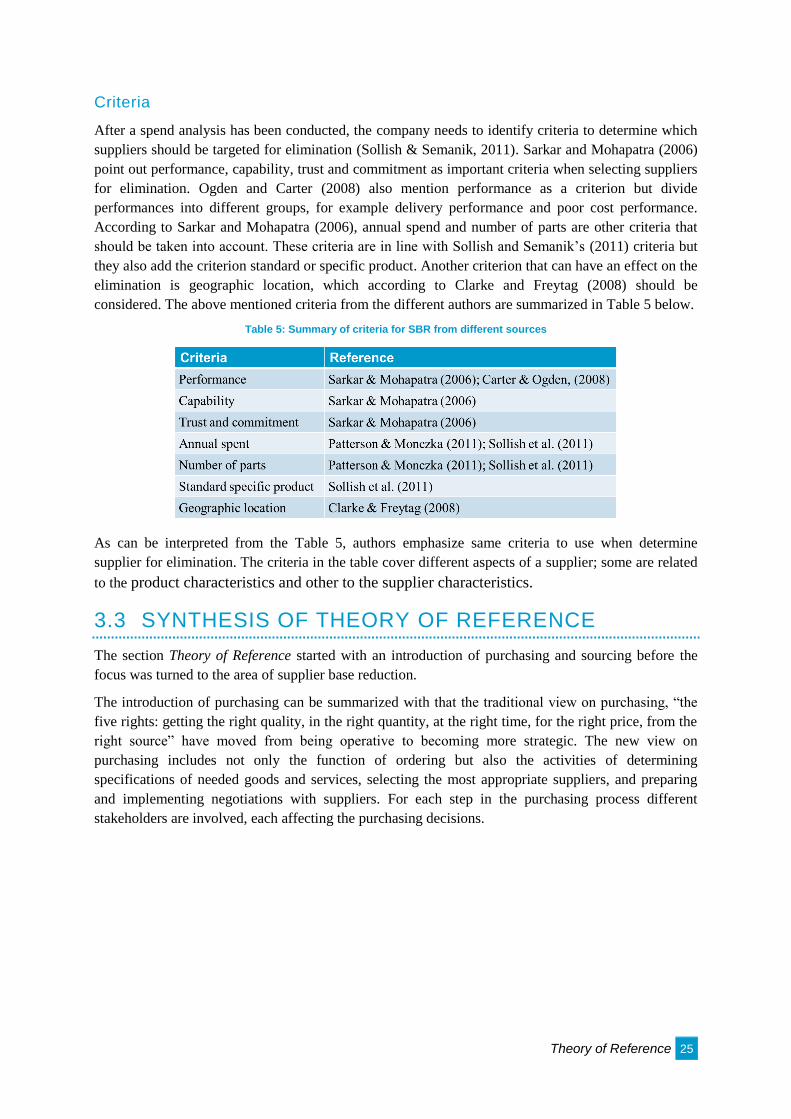
Theory of Reference 25
Criteria
After a spend analysis has been conducted, the company needs to identify criteria to determine which
suppliers should be targeted for elimination (Sollish & Semanik, 2011). Sarkar and Mohapatra (2006)
point out performance, capability, trust and commitment as important criteria when selecting suppliers
for elimination. Ogden and Carter (2008) also mention performance as a criterion but divide
performances into different groups, for example delivery performance and poor cost performance.
According to Sarkar and Mohapatra (2006), annual spend and number of parts are other criteria that
should be taken into account. These criteria are in line with Sollish and Semanik’s (2011) criteria but
they also add the criterion standard or specific product. Another criterion that can have an effect on the
elimination is geographic location, which according to Clarke and Freytag (2008) should be
considered. The above mentioned criteria from the different authors are summarized in Table 5 below.
Table 5: Summary of criteria for SBR from different sources
As can be interpreted from the Table 5, authors emphasize same criteria to use when determine
supplier for elimination. The criteria in the table cover different aspects of a supplier; some are related
to the product characteristics and other to the supplier characteristics.
3.3 SYNTHESIS OF THEORY OF REFERENCE
The section Theory of Reference started with an introduction of purchasing and sourcing before the
focus was turned to the area of supplier base reduction.
The introduction of purchasing can be summarized with that the traditional view on purchasing, “the
five rights: getting the right quality, in the right quantity, at the right time, for the right price, from the
right source” have moved from being operative to becoming more strategic. The new view on
purchasing includes not only the function of ordering but also the activities of determining
specifications of needed goods and services, selecting the most appropriate suppliers, and preparing
and implementing negotiations with suppliers. For each step in the purchasing process different
stakeholders are involved, each affecting the purchasing decisions.
Theory of Reference 26
By applying a more strategic approach within purchasing, additional resources for maintaining the
supplier base are needed and the more suppliers the more resources are required. In recent years, the
concept of SBR has attracted significant interest among researchers and it refers to a downsizing of the
supplier base. The stated benefits of SBR are lower purchasing and transaction costs, closer and better
supplier relationships, improved quality, increased supplier innovation and higher control. However,
the implementation of SBR can also implicate drawbacks, such as increased supply risk, increased
price levels, decreased quality, inflexible position and time consuming. To enable a successful
implementation of SBR, companies need to consider a number of important elements. Some of the
critical success factors that were highlighted were good information system, a cross-functional team,
selection of the right supplier, a win-win relationships and key management support.
There exist different processes for SBR and three different processes have been presented. In
summary, all of the three processes use the same overall process but are described using different
levels of detail. Depending on the characteristics of a company's supplier base, the company can
choose between the different practical approaches for SBR: systematic elimination, standardization
and/or tiering.
Problem Specification 27
4 PROBLEM SPECIFICATION
This section intends to specify the study with the help from a discussion of the purpose followed by
breakdown of the purpose resulting in the development of an analysis model for the study. The
analysis model is thereafter broken down into the study's research questions and sub-questions, which
are presented and discussed.
The purpose of the study is the basis for this section and therefore it is relevant to present the purpose
once again. This time, the key concepts of the purpose have been underlined.
"The purpose of the master thesis is to develop a methodology for supplier base reduction
that is customized for the current situation of the case company."
The purpose has been developed in accordance to the problem description provided by Dynapac. It is
their wish to develop a methodology that can be put in practice at the Purchasing department. It is
considered necessary to discuss whether the stated purpose is feasible or not to proceed with. The
directives given by Dynapac will also be discussed to investigate their effect on the study. This
discussion will be presented below.
To enable a discussion regarding the feasibility of the purpose it is first of all necessary to question
whether it is even possible to design a methodology for the implementation of SBR. The answer to this
question can be found in section 3 Theory of Reference where already defined processes for SBR have
been presented. The authors are of the opinion that if it has been performed before then it is possible to
do it again. Therefore, it is considered possible to design a methodology for SBR. Moreover, it is
possible to question whether it is justifiable to focus merely on developing a methodology for the
implementation of SBR. From section 3 Theory of Reference, it can be determined that a great amount
of research already has been conducted on the topic of SBR with a main focus on the conceptual
benefits of such action. It is therefore possible to conclude that SBR is thought to be an interesting
area of study among researchers. Ogden and Carter (2008) highlight that despite the obvious interest in
the conceptual benefits, little empirical studies have been done on the topic. Sarkar and Mohapatra
(2006) furthermore state that research done specifically on models for SBR is rare. Since the issue of
lack of models has been raised multiple times in research before it is therefore considered to be of
interest to investigate the possibility of designing a methodology and how such a methodology might
look like. With this being said, the purpose of the study is considered to be feasible and justifiable to
complete.
In accordance with Dynapac’s directive, the development of a customized methodology is focused on
providing detailed descriptions of the actions needed to enable a reduction of suppliers. This directive
thereby provides the direction towards only investigating how a supplier base reduction should be
performed. The practical implementation of the actual elimination of suppliers is therefore considered
to be out of the scope for this study. This directive is not considered to inhibit the study, since it is
believed possible to establish a suitable methodology based on information regarding existing
processes and approaches at the company.
Dynapac also wants the methodology to focus on suppliers providing direct material. Direct material is
in this study defined as material that is used in the manufactured machines. According to van Weele
(2010), it is the direct material that receives the most attention from the business management due to
its high percentage of the total purchasing costs. It is clear that the management of Dynapac believe
that the suppliers of direct material are of most interest and they believe that the highest cost savings
can be found among these suppliers. Therefore, this directive is considered to be suitable for this
study.
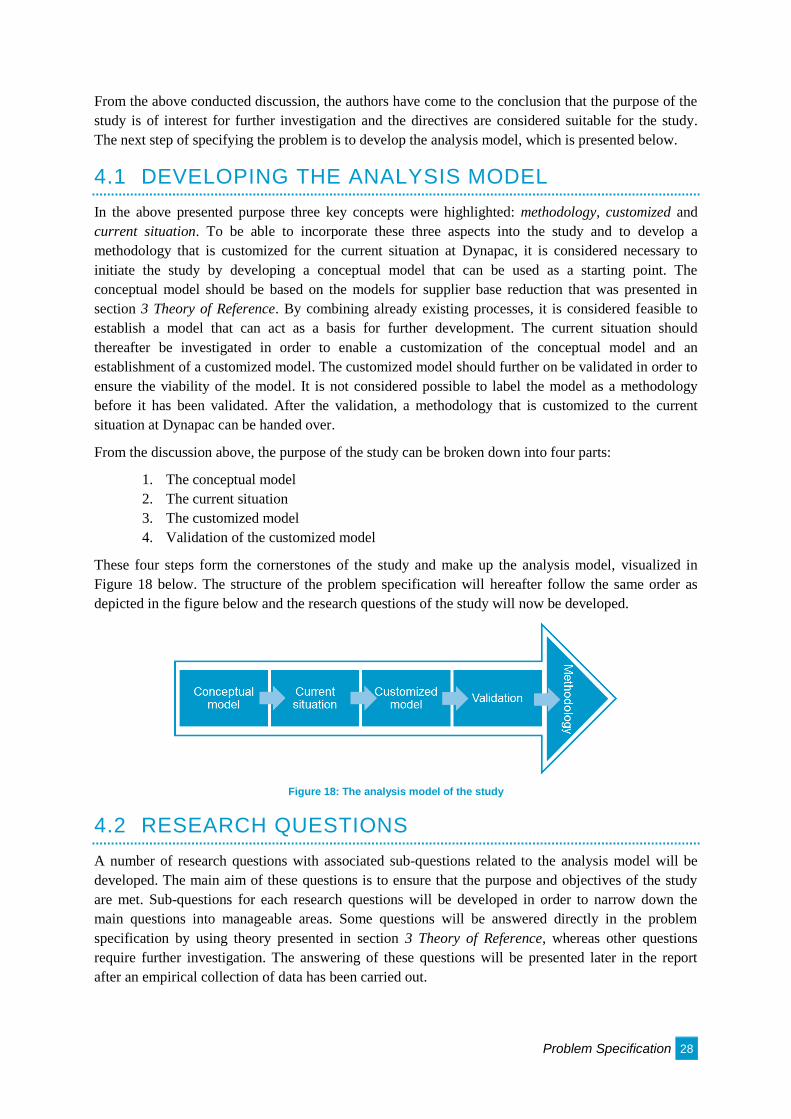
Problem Specification 28
From the above conducted discussion, the authors have come to the conclusion that the purpose of the
study is of interest for further investigation and the directives are considered suitable for the study.
The next step of specifying the problem is to develop the analysis model, which is presented below.
4.1 DEVELOPING THE ANALYSIS MODEL
In the above presented purpose three key concepts were highlighted: methodology, customized and
current situation. To be able to incorporate these three aspects into the study and to develop a
methodology that is customized for the current situation at Dynapac, it is considered necessary to
initiate the study by developing a conceptual model that can be used as a starting point. The
conceptual model should be based on the models for supplier base reduction that was presented in
section 3 Theory of Reference. By combining already existing processes, it is considered feasible to
establish a model that can act as a basis for further development. The current situation should
thereafter be investigated in order to enable a customization of the conceptual model and an
establishment of a customized model. The customized model should further on be validated in order to
ensure the viability of the model. It is not considered possible to label the model as a methodology
before it has been validated. After the validation, a methodology that is customized to the current
situation at Dynapac can be handed over.
From the discussion above, the purpose of the study can be broken down into four parts:
1. The conceptual model
2. The current situation
3. The customized model
4. Validation of the customized model
These four steps form the cornerstones of the study and make up the analysis model, visualized in
Figure 18 below. The structure of the problem specification will hereafter follow the same order as
depicted in the figure below and the research questions of the study will now be developed.
Figure 18: The analysis model of the study
4.2 RESEARCH QUESTIONS
A number of research questions with associated sub-questions related to the analysis model will be
developed. The main aim of these questions is to ensure that the purpose and objectives of the study
are met. Sub-questions for each research questions will be developed in order to narrow down the
main questions into manageable areas. Some questions will be answered directly in the problem
specification by using theory presented in section 3 Theory of Reference, whereas other questions
require further investigation. The answering of these questions will be presented later in the report
after an empirical collection of data has been carried out.
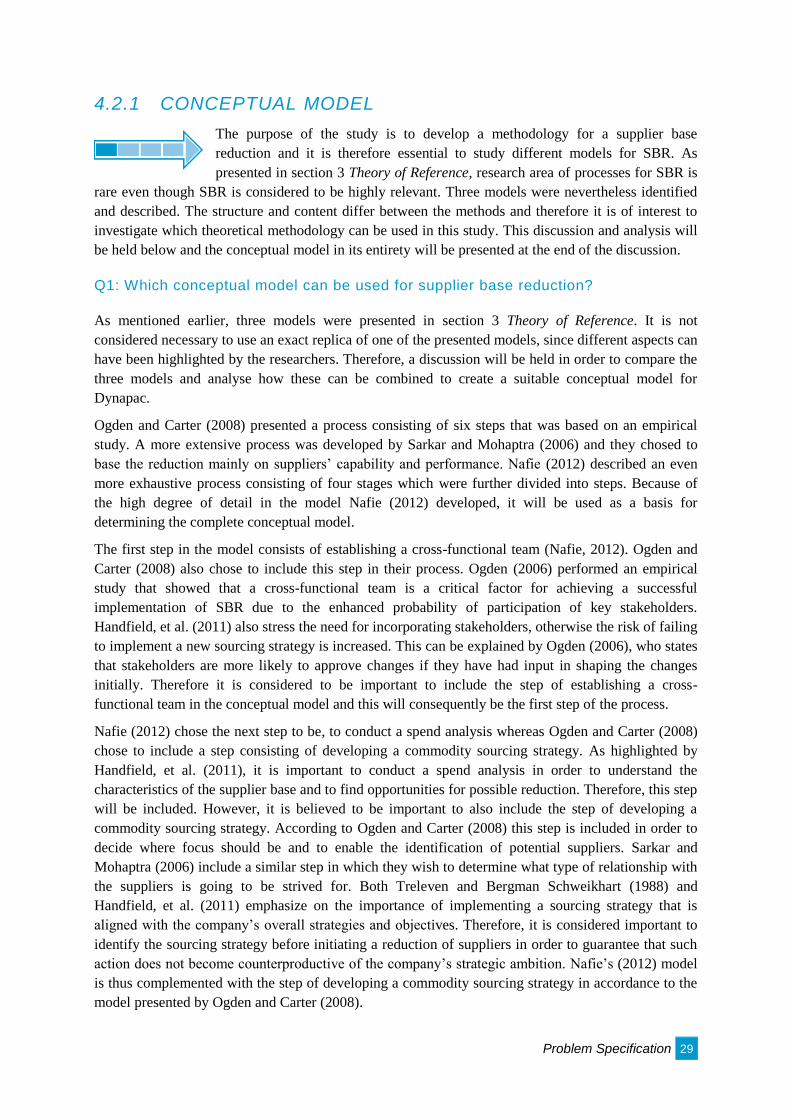
Problem Specification 29
4.2.1 CONCEPTUAL MODEL
The purpose of the study is to develop a methodology for a supplier base
reduction and it is therefore essential to study different models for SBR. As
presented in section 3 Theory of Reference, research area of processes for SBR is
rare even though SBR is considered to be highly relevant. Three models were nevertheless identified
and described. The structure and content differ between the methods and therefore it is of interest to
investigate which theoretical methodology can be used in this study. This discussion and analysis will
be held below and the conceptual model in its entirety will be presented at the end of the discussion.
Q1: Which conceptual model can be used for supplier base reduction?
As mentioned earlier, three models were presented in section 3 Theory of Reference. It is not
considered necessary to use an exact replica of one of the presented models, since different aspects can
have been highlighted by the researchers. Therefore, a discussion will be held in order to compare the
three models and analyse how these can be combined to create a suitable conceptual model for
Dynapac.
Ogden and Carter (2008) presented a process consisting of six steps that was based on an empirical
study. A more extensive process was developed by Sarkar and Mohaptra (2006) and they chosed to
base the reduction mainly on suppliers’ capability and performance. Nafie (2012) described an even
more exhaustive process consisting of four stages which were further divided into steps. Because of
the high degree of detail in the model Nafie (2012) developed, it will be used as a basis for
determining the complete conceptual model.
The first step in the model consists of establishing a cross-functional team (Nafie, 2012). Ogden and
Carter (2008) also chose to include this step in their process. Ogden (2006) performed an empirical
study that showed that a cross-functional team is a critical factor for achieving a successful
implementation of SBR due to the enhanced probability of participation of key stakeholders.
Handfield, et al. (2011) also stress the need for incorporating stakeholders, otherwise the risk of failing
to implement a new sourcing strategy is increased. This can be explained by Ogden (2006), who states
that stakeholders are more likely to approve changes if they have had input in shaping the changes
initially. Therefore it is considered to be important to include the step of establishing a cross-
functional team in the conceptual model and this will consequently be the first step of the process.
Nafie (2012) chose the next step to be, to conduct a spend analysis whereas Ogden and Carter (2008)
chose to include a step consisting of developing a commodity sourcing strategy. As highlighted by
Handfield, et al. (2011), it is important to conduct a spend analysis in order to understand the
characteristics of the supplier base and to find opportunities for possible reduction. Therefore, this step
will be included. However, it is believed to be important to also include the step of developing a
commodity sourcing strategy. According to Ogden and Carter (2008) this step is included in order to
decide where focus should be and to enable the identification of potential suppliers. Sarkar and
Mohaptra (2006) include a similar step in which they wish to determine what type of relationship with
the suppliers is going to be strived for. Both Treleven and Bergman Schweikhart (1988) and
Handfield, et al. (2011) emphasize on the importance of implementing a sourcing strategy that is
aligned with the company’s overall strategies and objectives. Therefore, it is considered important to
identify the sourcing strategy before initiating a reduction of suppliers in order to guarantee that such
action does not become counterproductive of the company’s strategic ambition. Nafie’s (2012) model
is thus complemented with the step of developing a commodity sourcing strategy in accordance to the
model presented by Ogden and Carter (2008).
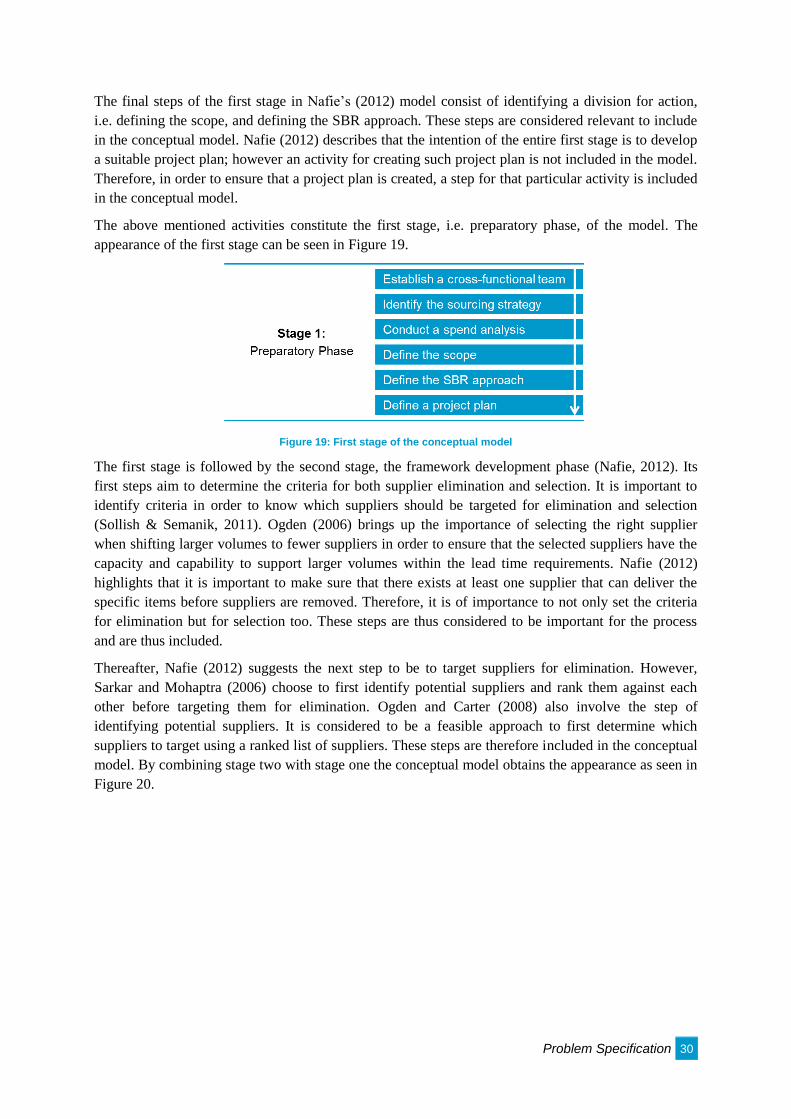
Problem Specification 30
The final steps of the first stage in Nafie’s (2012) model consist of identifying a division for action,
i.e. defining the scope, and defining the SBR approach. These steps are considered relevant to include
in the conceptual model. Nafie (2012) describes that the intention of the entire first stage is to develop
a suitable project plan; however an activity for creating such project plan is not included in the model.
Therefore, in order to ensure that a project plan is created, a step for that particular activity is included
in the conceptual model.
The above mentioned activities constitute the first stage, i.e. preparatory phase, of the model. The
appearance of the first stage can be seen in Figure 19.
Figure 19: First stage of the conceptual model
The first stage is followed by the second stage, the framework development phase (Nafie, 2012). Its
first steps aim to determine the criteria for both supplier elimination and selection. It is important to
identify criteria in order to know which suppliers should be targeted for elimination and selection
(Sollish & Semanik, 2011). Ogden (2006) brings up the importance of selecting the right supplier
when shifting larger volumes to fewer suppliers in order to ensure that the selected suppliers have the
capacity and capability to support larger volumes within the lead time requirements. Nafie (2012)
highlights that it is important to make sure that there exists at least one supplier that can deliver the
specific items before suppliers are removed. Therefore, it is of importance to not only set the criteria
for elimination but for selection too. These steps are thus considered to be important for the process
and are thus included.
Thereafter, Nafie (2012) suggests the next step to be to target suppliers for elimination. However,
Sarkar and Mohaptra (2006) choose to first identify potential suppliers and rank them against each
other before targeting them for elimination. Ogden and Carter (2008) also involve the step of
identifying potential suppliers. It is considered to be a feasible approach to first determine which
suppliers to target using a ranked list of suppliers. These steps are therefore included in the conceptual
model. By combining stage two with stage one the conceptual model obtains the appearance as seen in
Figure 20.
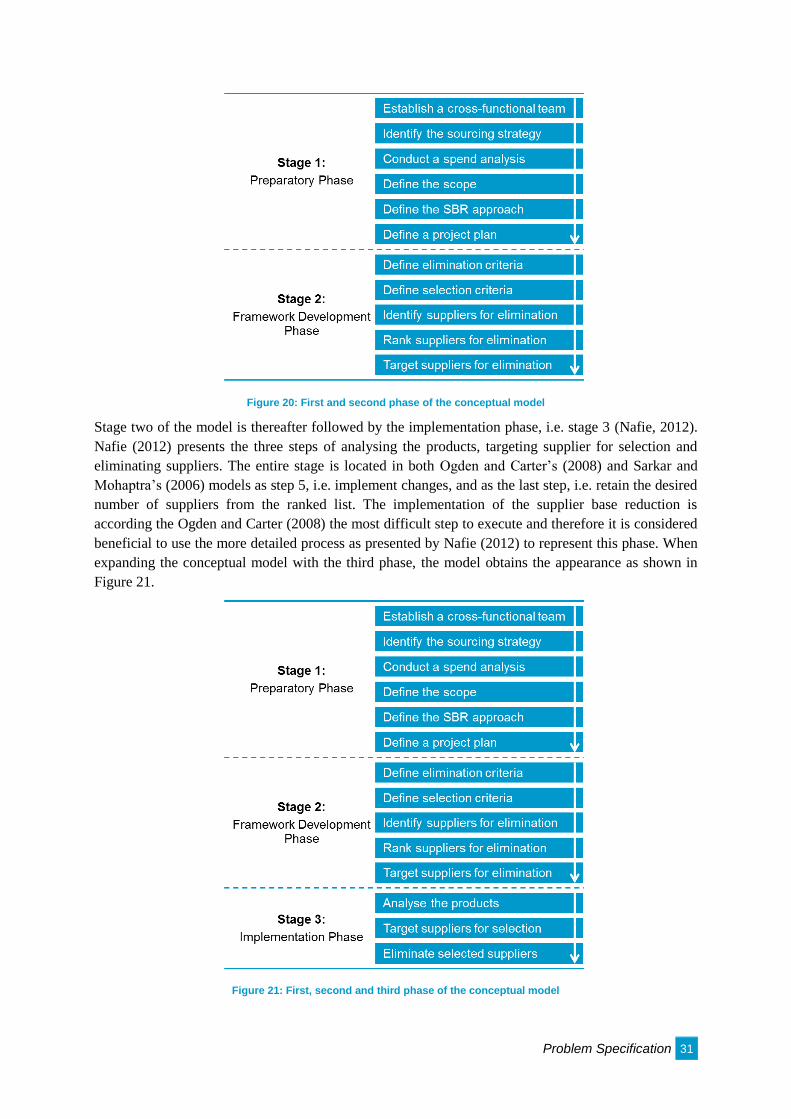
Problem Specification 31
Figure 20: First and second phase of the conceptual model
Stage two of the model is thereafter followed by the implementation phase, i.e. stage 3 (Nafie, 2012).
Nafie (2012) presents the three steps of analysing the products, targeting supplier for selection and
eliminating suppliers. The entire stage is located in both Ogden and Carter’s (2008) and Sarkar and
Mohaptra’s (2006) models as step 5, i.e. implement changes, and as the last step, i.e. retain the desired
number of suppliers from the ranked list. The implementation of the supplier base reduction is
according the Ogden and Carter (2008) the most difficult step to execute and therefore it is considered
beneficial to use the more detailed process as presented by Nafie (2012) to represent this phase. When
expanding the conceptual model with the third phase, the model obtains the appearance as shown in
Figure 21.
Figure 21: First, second and third phase of the conceptual model
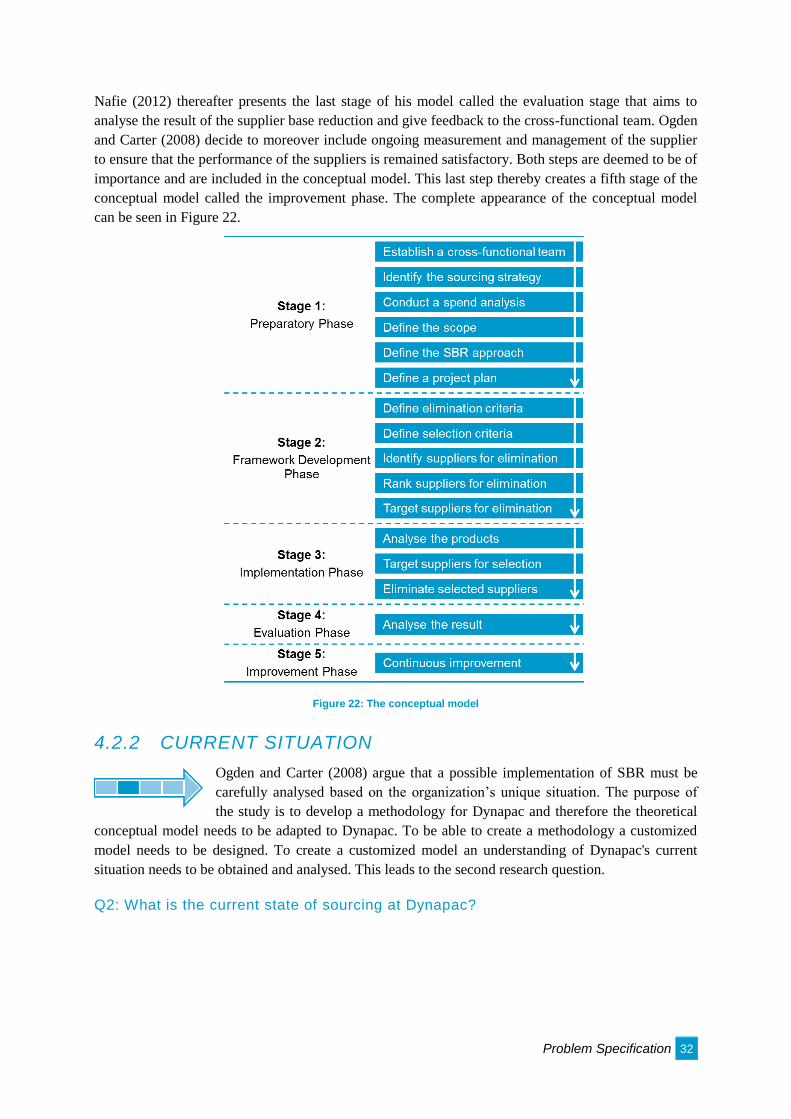
Problem Specification 32
Nafie (2012) thereafter presents the last stage of his model called the evaluation stage that aims to
analyse the result of the supplier base reduction and give feedback to the cross-functional team. Ogden
and Carter (2008) decide to moreover include ongoing measurement and management of the supplier
to ensure that the performance of the suppliers is remained satisfactory. Both steps are deemed to be of
importance and are included in the conceptual model. This last step thereby creates a fifth stage of the
conceptual model called the improvement phase. The complete appearance of the conceptual model
can be seen in Figure 22.
Figure 22: The conceptual model
4.2.2 CURRENT SITUATION
Ogden and Carter (2008) argue that a possible implementation of SBR must be
carefully analysed based on the organization’s unique situation. The purpose of
the study is to develop a methodology for Dynapac and therefore the theoretical
conceptual model needs to be adapted to Dynapac. To be able to create a methodology a customized
model needs to be designed. To create a customized model an understanding of Dynapac's current
situation needs to be obtained and analysed. This leads to the second research question.
Q2: What is the current state of sourcing at Dynapac?
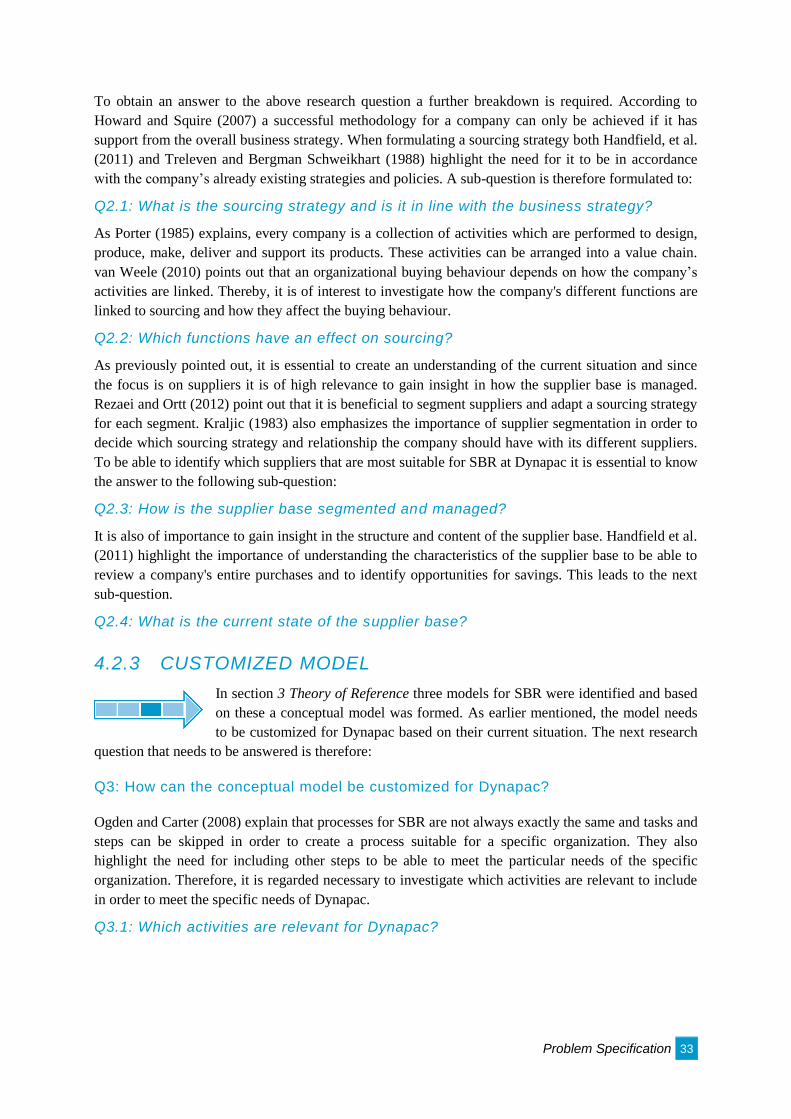
Problem Specification 33
To obtain an answer to the above research question a further breakdown is required. According to
Howard and Squire (2007) a successful methodology for a company can only be achieved if it has
support from the overall business strategy. When formulating a sourcing strategy both Handfield, et al.
(2011) and Treleven and Bergman Schweikhart (1988) highlight the need for it to be in accordance
with the company’s already existing strategies and policies. A sub-question is therefore formulated to:
Q2.1: What is the sourcing strategy and is it in line with the business strategy?
As Porter (1985) explains, every company is a collection of activities which are performed to design,
produce, make, deliver and support its products. These activities can be arranged into a value chain.
van Weele (2010) points out that an organizational buying behaviour depends on how the company’s
activities are linked. Thereby, it is of interest to investigate how the company's different functions are
linked to sourcing and how they affect the buying behaviour.
Q2.2: Which functions have an effect on sourcing?
As previously pointed out, it is essential to create an understanding of the current situation and since
the focus is on suppliers it is of high relevance to gain insight in how the supplier base is managed.
Rezaei and Ortt (2012) point out that it is beneficial to segment suppliers and adapt a sourcing strategy
for each segment. Kraljic (1983) also emphasizes the importance of supplier segmentation in order to
decide which sourcing strategy and relationship the company should have with its different suppliers.
To be able to identify which suppliers that are most suitable for SBR at Dynapac it is essential to know
the answer to the following sub-question:
Q2.3: How is the supplier base segmented and managed?
It is also of importance to gain insight in the structure and content of the supplier base. Handfield et al.
(2011) highlight the importance of understanding the characteristics of the supplier base to be able to
review a company's entire purchases and to identify opportunities for savings. This leads to the next
sub-question.
Q2.4: What is the current state of the supplier base?
4.2.3 CUSTOMIZED MODEL
In section 3 Theory of Reference three models for SBR were identified and based
on these a conceptual model was formed. As earlier mentioned, the model needs
to be customized for Dynapac based on their current situation. The next research
question that needs to be answered is therefore:
Q3: How can the conceptual model be customized for Dynapac?
Ogden and Carter (2008) explain that processes for SBR are not always exactly the same and tasks and
steps can be skipped in order to create a process suitable for a specific organization. They also
highlight the need for including other steps to be able to meet the particular needs of the specific
organization. Therefore, it is regarded necessary to investigate which activities are relevant to include
in order to meet the specific needs of Dynapac.
Q3.1: Which activities are relevant for Dynapac?
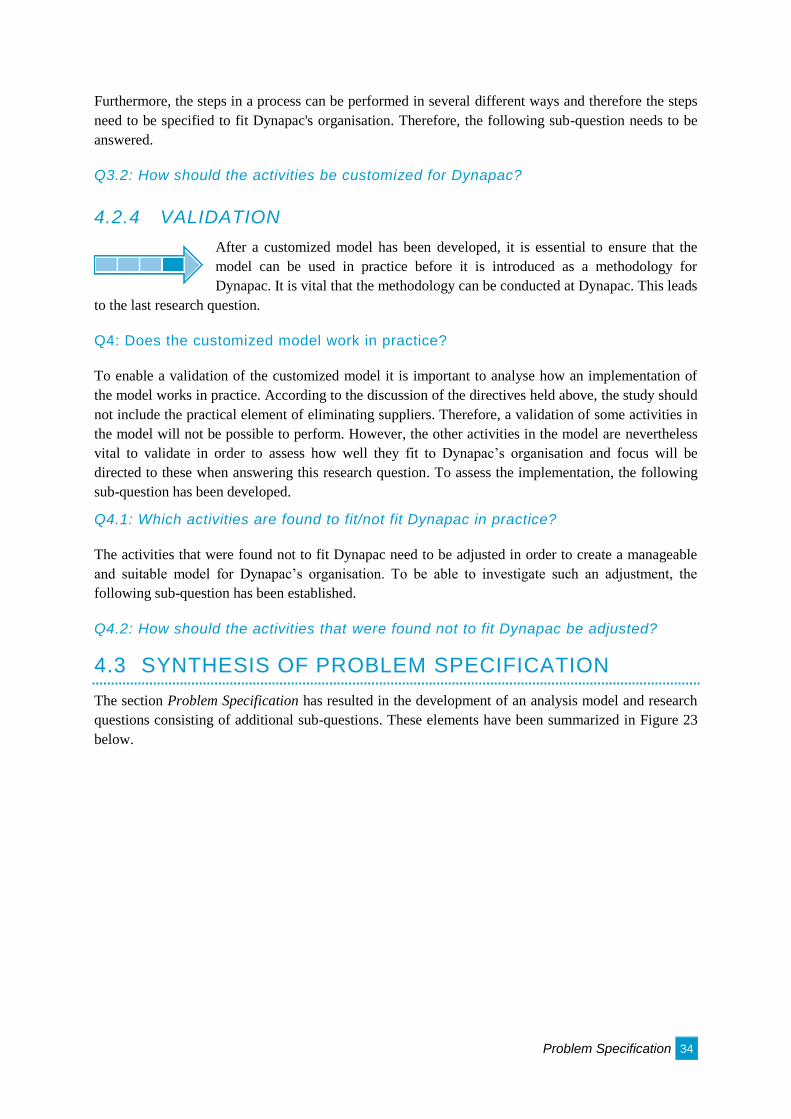
Problem Specification 34
Furthermore, the steps in a process can be performed in several different ways and therefore the steps
need to be specified to fit Dynapac's organisation. Therefore, the following sub-question needs to be
answered.
Q3.2: How should the activities be customized for Dynapac?
4.2.4 VALIDATION
After a customized model has been developed, it is essential to ensure that the
model can be used in practice before it is introduced as a methodology for
Dynapac. It is vital that the methodology can be conducted at Dynapac. This leads
to the last research question.
Q4: Does the customized model work in practice?
To enable a validation of the customized model it is important to analyse how an implementation of
the model works in practice. According to the discussion of the directives held above, the study should
not include the practical element of eliminating suppliers. Therefore, a validation of some activities in
the model will not be possible to perform. However, the other activities in the model are nevertheless
vital to validate in order to assess how well they fit to Dynapac’s organisation and focus will be
directed to these when answering this research question. To assess the implementation, the following
sub-question has been developed.
Q4.1: Which activities are found to fit/not fit Dynapac in practice?
The activities that were found not to fit Dynapac need to be adjusted in order to create a manageable
and suitable model for Dynapac’s organisation. To be able to investigate such an adjustment, the
following sub-question has been established.
Q4.2: How should the activities that were found not to fit Dynapac be adjusted?
4.3 SYNTHESIS OF PROBLEM SPECIFICATION
The section Problem Specification has resulted in the development of an analysis model and research
questions consisting of additional sub-questions. These elements have been summarized in Figure 23
below.
Problem Specification 35
Figure 23: A summary of the research questions and their associated sub-questions
Research Method 36
5 RESEARCH METHOD
This section highlights the underlying approach for the study. First, the research method is described
on a general basis, followed by a more detailed description of the methods used when answering the
research questions. Last, the credibility of the study is discussed in terms of objectivity, validity and
reliability and possible criticism towards the methods is thereafter raised and discussed.
5.1 COURSE OF ACTION
Börklund and Paulsson (2013) divide a study into two overall phases: (1) the planning phase and (2)
the execution and analysis phase. These phases can also be found in this study’s research method but
instead divided into three main phases: (1) planning phase, (2) data collection phase and (3) analysis
phase. This research method and its activities are visualized in Figure 24 below.
Figure 24: The overall approach of the study's research method (inspired from Björklund and Paulsson, 2013)
5.1.1 PLANNING PHASE
The planning phase consisted largely of identifying the problem, describing the problem and
conducting a literature study. After the literature had been reviewed, the problem of the study was
further specified and research questions with associated sub-questions were formulated. Lastly, the
choice of approach of the study was formulated.
Problem description
Bell (2006) describes the importance of the first steps in a study which results in the clarification of
the purpose of the project, finding where the main focus should be and what should be prioritized.
Jacobsen (2002) stresses that each study is initiated with an interest of knowing more about a specific
area and that each study usually starts with a formulated question. The question is then followed by
speculations that lead to formulated hypotheses. A hypothesis is a statement and that statement must
be examined to see if it can be rejected or not.
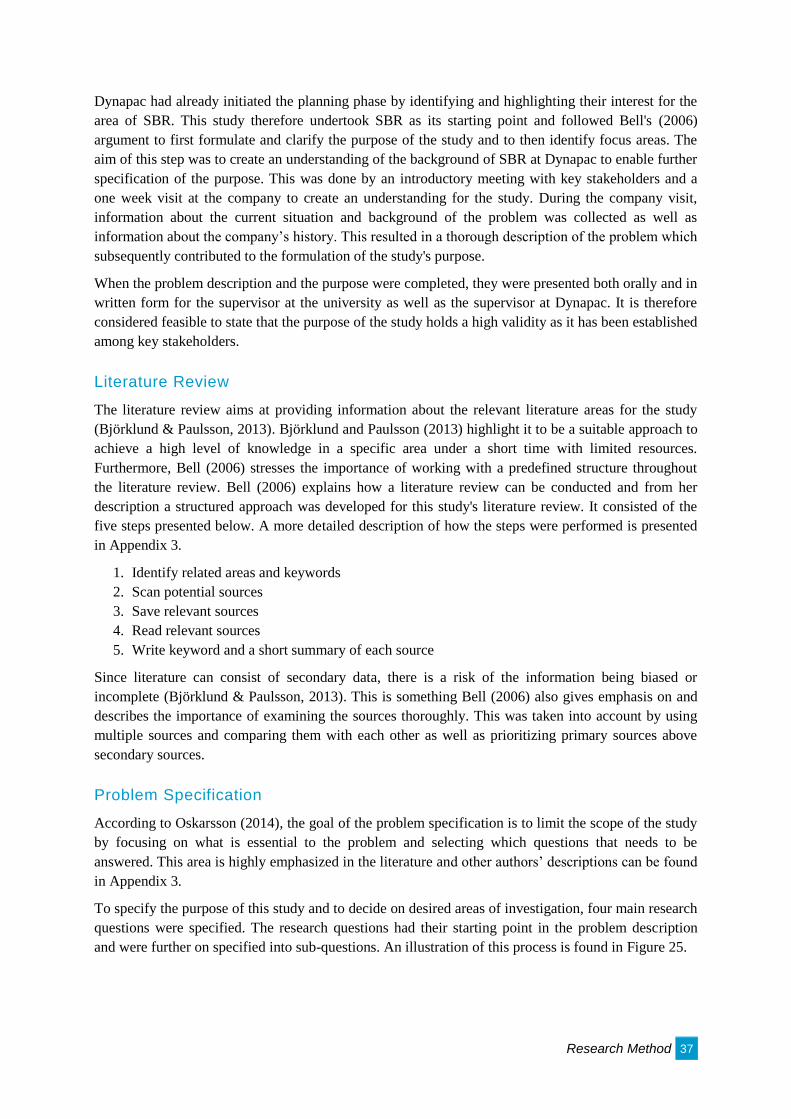
Research Method 37
Dynapac had already initiated the planning phase by identifying and highlighting their interest for the
area of SBR. This study therefore undertook SBR as its starting point and followed Bell's (2006)
argument to first formulate and clarify the purpose of the study and to then identify focus areas. The
aim of this step was to create an understanding of the background of SBR at Dynapac to enable further
specification of the purpose. This was done by an introductory meeting with key stakeholders and a
one week visit at the company to create an understanding for the study. During the company visit,
information about the current situation and background of the problem was collected as well as
information about the company’s history. This resulted in a thorough description of the problem which
subsequently contributed to the formulation of the study's purpose.
When the problem description and the purpose were completed, they were presented both orally and in
written form for the supervisor at the university as well as the supervisor at Dynapac. It is therefore
considered feasible to state that the purpose of the study holds a high validity as it has been established
among key stakeholders.
Literature Review
The literature review aims at providing information about the relevant literature areas for the study
(Björklund & Paulsson, 2013). Björklund and Paulsson (2013) highlight it to be a suitable approach to
achieve a high level of knowledge in a specific area under a short time with limited resources.
Furthermore, Bell (2006) stresses the importance of working with a predefined structure throughout
the literature review. Bell (2006) explains how a literature review can be conducted and from her
description a structured approach was developed for this study's literature review. It consisted of the
five steps presented below. A more detailed description of how the steps were performed is presented
in Appendix 3.
1. Identify related areas and keywords
2. Scan potential sources
3. Save relevant sources
4. Read relevant sources
5. Write keyword and a short summary of each source
Since literature can consist of secondary data, there is a risk of the information being biased or
incomplete (Björklund & Paulsson, 2013). This is something Bell (2006) also gives emphasis on and
describes the importance of examining the sources thoroughly. This was taken into account by using
multiple sources and comparing them with each other as well as prioritizing primary sources above
secondary sources.
Problem Specification
According to Oskarsson (2014), the goal of the problem specification is to limit the scope of the study
by focusing on what is essential to the problem and selecting which questions that needs to be
answered. This area is highly emphasized in the literature and other authors’ descriptions can be found
in Appendix 3.
To specify the purpose of this study and to decide on desired areas of investigation, four main research
questions were specified. The research questions had their starting point in the problem description
and were further on specified into sub-questions. An illustration of this process is found in Figure 25.
Research Method 38
Figure 25: Illustration of the problem specification (based on Eriksson and Wiedersheim-Paul, 2011)
Choice of Approach
Björklund and Paulsson (2013) bring up the possibility of classifying a study based on the authors’
knowledge in the area of study as well as based on the type of data is used in the study.
To classify a study in accordance to the knowledge in the field of study, Björklund and Paulsson
(2013) present four different choices of studies: (1) explorative study, (2) descriptive study, (3)
explanative study and (4) normative study. An explorative study is required when there is little
knowledge in the chosen field of study and the aim is therefore to attain basic knowledge in the field.
When basic knowledge already exists, it is beneficial to choose a descriptive study which aims at
describing the nature of the problem instead of explaining the causes of the problem. An explanative
study, on the other hand aims at both describing and explaining the causes of the problem. However,
this study requires a deeper knowledge in the area of interest. When the study aims at providing future
guidance and actions and when knowledge and understanding of the area already exists, a normative
study should be chosen. (Björklund & Paulsson, 2013)
For this study, it was chosen to perform a descriptive study. The authors of the study only possess
basic knowledge in the chosen field of study and therefore it was considered to be beneficial to
conduct a descriptive study. A descriptive study was considered to be within the authors’ knowledge
range and could therefore be made justice. The aim of the study is also of a descriptive nature since a
methodology will be developed and described in detail. Consequently, the scope of the study does not
take into account the possible effect that the different steps may have on each other but rather focus on
describing the execution of the steps. It is considered to be sufficient to perform a descriptive study in
order to develop an effective methodology since the essence of the study is to describe how to perform
the steps in the methodology.
When focusing on what type of data will be used in the study, Björklund and Paulsson (2013) provide
two approaches for classification: (1) quantitative study and (2) qualitative study. Quantitative studies
contain research based only on numerical values whereas qualitative studies are mainly based on
interviews and observations. The usage of a quantitative study evidently creates limitations regarding
what kind of data can be used and therefore which problems can be investigated. A qualitative study
on the other hand, provides the possibility of creating a deeper understanding regarding a certain
problem, event or situation. However, a qualitative study is considered to be less suitable for
generalization when compared to quantitative studies. (Björklund & Paulsson, 2013)
Research Method 39
In this study, a qualitative approach has been used to develop the methodology. The customization of
the methodology is mainly based on interviews and the need for a qualitative study is therefore
evident. However, when investigating the current state of the supplier base it was necessary to include
numerical values to be able to determine the size and structure of the supplier base. Therefore, the
qualitative approach was supplemented with a few quantitative measures. In summary, it is possible to
conclude that the conducted study is of a descriptive and qualitative character with elements of
quantitative measures.
5.1.2 DATA COLLECTION PHASE
The data collection phase consisted mostly of collecting data that was to be used in the study. It
consisted also of compiling the data into a manageable form. Methods for achieving this are described
below.
Data Collection
The selected research method for data collection was adapted to fit the study approach, which in this
case was a case study with a qualitative approach with some quantitative measures. According to
Jacobsen (2002) there are four suitable data collection methods for a qualitative study: open individual
interview, group interview, observation and document examination. The first three methods collect
primary data and the fourth method collect secondary data (Jacobsen, 2002). The authors Björklund
and Paulsson (2013) and Jacobsen (2002) agree that these selected data collection methods are
considered to be the most suitable for a study with a qualitative approach. Furthermore, Björklund and
Paulsson (2013) highlight that a higher credibility of the study can be achieved by using triangulation,
i.e. that the same situation is examined in different ways.
In order to be able to develop an adapted methodology for Dynapac, data was collected on site by
using the methods of open individual interviews and group interviews. A detailed description to why
these were chosen as well as how they were performed can be found in section 5.2 Practical Method
of Research Questions. Since the study has some quantitative elements, the authors of the study added
a collection of quantitative data extracted from the company’s enterprise resource planning (ERP)
system. The chosen data collection methods will theoretically be explained below and the practical
performances of these methods are described in section 5.2 Practical Method of Research Questions.
Qualitative Data
A big benefit with interview methods lies in their flexibility. There exist many different types of
interview techniques and depending on the situation some are more suitable than others (Bell, 2006).
Jacobsen (2002) stresses that an interview can be performed either open or closed. This can be
explained by how controlled the interview correspondent is during the interview by the interviewer.
Open interviews consist of open questions which give the interviewee the opportunity of describing
their point of view freely which can open up for new questions. Open interviews also increase the
chance of discovering other underlying factors. (Jacobsen, 2002) Interviews can thereafter be
performed individually or in groups and differences between these are described in Appendix 3.
Research Method 40
During this study, the interviews that were held were in majority open interviews. It was found to be
essential to allow the interviewee to express his or her viewpoint and to elaborate further without
being interrupted. This furthermore opened up for the possibility of gaining more insight than if closed
interviews would have been held. To create a solid base of data, both individual and group interviews
were held. Group interviews were held in the beginning to give the authors of the study an
understanding and background of the study. Thereafter, mainly individual interviews were conducted
in order to obtain deeper knowledge in specified areas. However, it was considered necessary to
conduct group interviews when customizing the model for SBR. This was mainly done because of the
wish to start a discussion between the participants and to eventually reach a common opinion of the
model.
In Appendix 3 Bell’s (2006) and Jacobsen’s (2002) recommendations regarding guidelines and
recordings are described. Based on these, interview guides were prepared for the interviews and the
interviewees were recorded in order to be able to maintain full attention on the interview
correspondent. A more thorough description of the usage of these recommendations can also be found
in Appendix 3.
Quantitative Data
Quantitative data is considered to be numerical data which primarily involves the use of already
existing data (Eriksson & Wiedersheim-Paul, 2011). Holme and Solvang (1997) point out that the
quantitative methods underline the fact that information can be quantified. Eriksson and Wiedersheim-
Paul (2011) describe that quantitative data can be collected for example from ERP systems, databases
or surveys. However, they highlight the problem of wanting to collect data that does not exist. Holme
and Solvang (1997) stress the importance of structuring and predefining the layout of the collection
before it starts. The collection of quantitative data was carried out in a predefined structured manner as
proposed by Holme and Solvang (1997). In order to avoid the problem of not finding wanted data, the
data was mainly collected from the ERP system. Thereby, the methods for collecting data were
defined using data types that were known to exist in the system. The collection of the specified
quantitative data is further explained in section 5.2 Practical Method of Research Questions.
Compilation of Data
Bell (2006) presented the importance of recording interviewees in order to maintain full attention on
the correspondent. For compilation of the information collected in interviews, Bell (2006) proposes
the usage of transcription of interviews. With transcription Bell (2006) argues that it enables coding,
summarizing and recording of information that is of particular interest. Multiple researchers advocate
the usage of transcription of interviews to ensure correct retelling of the collected information (Bell,
2006). Holme and Solvang (1997) state that a transcription of the interviews in whole can enable an
extensive analysis, however it is considered to be a resource consuming process in regards to both
time and effort. They therefore present an alternative solution of transcribing only the most important
parts of the interviews and summarizing the remaining parts.
For this study, it was considered to be too time consuming to transcribe all interviews in detail since
eight interviews were conducted, with the duration of approximately one and a half hour each. This
would mean that more than approximately 48 hours would have been spent on transcription which was
not considered to be justifiable when comparing to the output that it could be provide. Therefore, it
was decided to only transcribe what was considered to be the most important parts of the interviews
and to summarize the rest. These summaries can be found in Appendix 8.
Research Method 41
When the collection of data is finalized, Merriam (1994) emphasizes on the importance of organizing
the collected data in order to streamline the analysis of data. A compilation of all the collected data
was performed with the aim to create a manageable database that could be easily used for the analysis
of the data in accordance with research method theories. A presentation of the different research
theories regarding possible compilations and how the compilation was performed are described in
Appendix 3.
5.1.3 ANALYSIS PHASE
The analysis phase sought to analyse the collected information to enable that conclusions of the
findings could be drawn. The methods for how the analyses have been performed are described in the
following sections.
Analysis of Data
According to Merriam (1994), the analysis of data is the process of making sense of the data that has
been collected. The goal is to ultimately be able to draw credible conclusions (Merriam, 1994).
Merriam (1994) provides a method on how to start processing the collected data. Holme and Solvang
(1997) also present methods on how to analyse data. They present two methods that can be used: (1)
holistic analysis and (2) part analysis. Furthermore, Björklund and Paulsson (2013) describe another
way of analysing data by using an analysis model. These different methods for analysing data are
further described in Appendix 3.
In this study, both holistic and part analyses have been performed on the collected data. A holistic
approach has been applied when analysing data regarding the current situation of Dynapac and its
supplier base. It was found to be essential to use the entirety of the information to be able to draw
conclusions about the current situation. The aim was to at first establish an overview of the current
situation before choosing which aspects were of most interest to work further on and therefore the
holistic approach was found appropriate to use. To establish which aspects to focus on, Merriam’s
(1994) method for processing data was used and the information were therefore read through multiple
times. This created a good overview of the possible aspects that could be used before choosing which
to work further on.
Part analyses were then used to develop the customized version of the model as well as for validating
the model. For these parts, it was of interest to investigate the different steps and therefore focus was
not on the model as an entirety but on the individual steps. Validation of the steps was performed by
utilizing Björklund and Paulsson’s (2013) version of an analysis model. It was found to be suitable to
use an analysis models to enable a structured and systematic way of validating the activities of the
model. The chart was later on utilized in order to draw conclusions regarding the performance and
appearance of the model. The designed analysis model can be found in section 5.2 Practical Method of
Research Questions and seen in Figure 27.
Conclusions
Björklund and Paulsson (2013) discuss that conclusions should be drawn from the analysis that has
been carried. The conclusions consist of a summarization of the result, a discussion of possible causes
and a discussion of what consequences the result may bring. When summarizing the result it is
necessary to only highlight the most relevant parts of the result in order to create a manageable amount
of information. Therefore it is important to objectively motivate why these specific parts were chosen
to be presented. (Björklund & Paulsson, 2013)
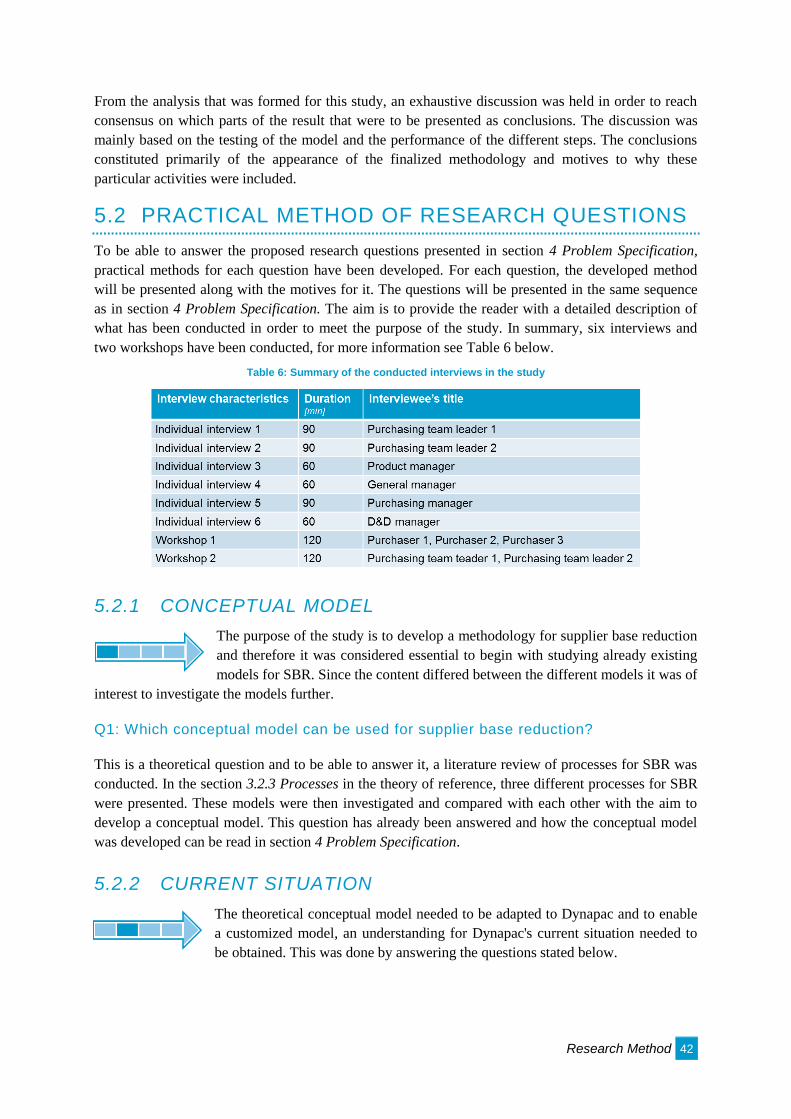
Research Method 42
From the analysis that was formed for this study, an exhaustive discussion was held in order to reach
consensus on which parts of the result that were to be presented as conclusions. The discussion was
mainly based on the testing of the model and the performance of the different steps. The conclusions
constituted primarily of the appearance of the finalized methodology and motives to why these
particular activities were included.
5.2 PRACTICAL METHOD OF RESEARCH QUESTIONS
To be able to answer the proposed research questions presented in section 4 Problem Specification,
practical methods for each question have been developed. For each question, the developed method
will be presented along with the motives for it. The questions will be presented in the same sequence
as in section 4 Problem Specification. The aim is to provide the reader with a detailed description of
what has been conducted in order to meet the purpose of the study. In summary, six interviews and
two workshops have been conducted, for more information see Table 6 below.
Table 6: Summary of the conducted interviews in the study
5.2.1 CONCEPTUAL MODEL
The purpose of the study is to develop a methodology for supplier base reduction
and therefore it was considered essential to begin with studying already existing
models for SBR. Since the content differed between the different models it was of
interest to investigate the models further.
Q1: Which conceptual model can be used for supplier base reduction?
This is a theoretical question and to be able to answer it, a literature review of processes for SBR was
conducted. In the section 3.2.3 Processes in the theory of reference, three different processes for SBR
were presented. These models were then investigated and compared with each other with the aim to
develop a conceptual model. This question has already been answered and how the conceptual model
was developed can be read in section 4 Problem Specification.
5.2.2 CURRENT SITUATION
The theoretical conceptual model needed to be adapted to Dynapac and to enable
a customized model, an understanding for Dynapac's current situation needed to
be obtained. This was done by answering the questions stated below.
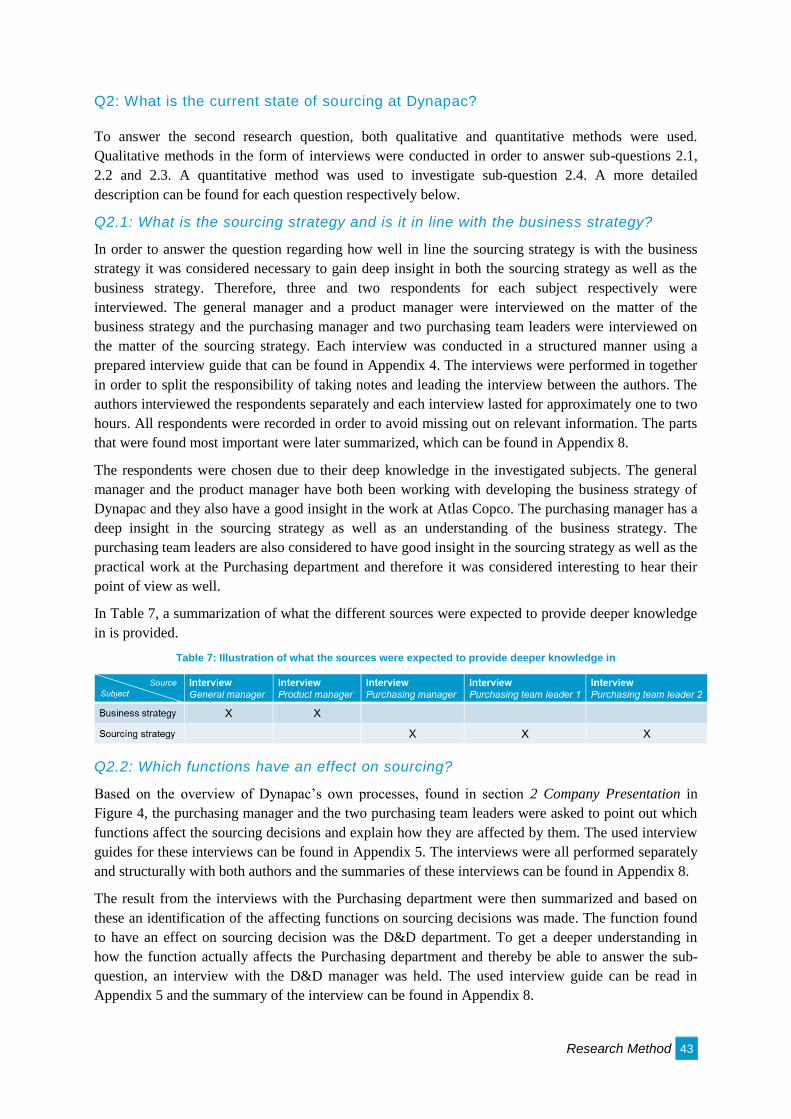
Research Method 43
Q2: What is the current state of sourcing at Dynapac?
To answer the second research question, both qualitative and quantitative methods were used.
Qualitative methods in the form of interviews were conducted in order to answer sub-questions 2.1,
2.2 and 2.3. A quantitative method was used to investigate sub-question 2.4. A more detailed
description can be found for each question respectively below.
Q2.1: What is the sourcing strategy and is it in line with the business strategy?
In order to answer the question regarding how well in line the sourcing strategy is with the business
strategy it was considered necessary to gain deep insight in both the sourcing strategy as well as the
business strategy. Therefore, three and two respondents for each subject respectively were
interviewed. The general manager and a product manager were interviewed on the matter of the
business strategy and the purchasing manager and two purchasing team leaders were interviewed on
the matter of the sourcing strategy. Each interview was conducted in a structured manner using a
prepared interview guide that can be found in Appendix 4. The interviews were performed in together
in order to split the responsibility of taking notes and leading the interview between the authors. The
authors interviewed the respondents separately and each interview lasted for approximately one to two
hours. All respondents were recorded in order to avoid missing out on relevant information. The parts
that were found most important were later summarized, which can be found in Appendix 8.
The respondents were chosen due to their deep knowledge in the investigated subjects. The general
manager and the product manager have both been working with developing the business strategy of
Dynapac and they also have a good insight in the work at Atlas Copco. The purchasing manager has a
deep insight in the sourcing strategy as well as an understanding of the business strategy. The
purchasing team leaders are also considered to have good insight in the sourcing strategy as well as the
practical work at the Purchasing department and therefore it was considered interesting to hear their
point of view as well.
In Table 7, a summarization of what the different sources were expected to provide deeper knowledge
in is provided.
Table 7: Illustration of what the sources were expected to provide deeper knowledge in
Q2.2: Which functions have an effect on sourcing?
Based on the overview of Dynapac’s own processes, found in section 2 Company Presentation in
Figure 4, the purchasing manager and the two purchasing team leaders were asked to point out which
functions affect the sourcing decisions and explain how they are affected by them. The used interview
guides for these interviews can be found in Appendix 5. The interviews were all performed separately
and structurally with both authors and the summaries of these interviews can be found in Appendix 8.
The result from the interviews with the Purchasing department were then summarized and based on
these an identification of the affecting functions on sourcing decisions was made. The function found
to have an effect on sourcing decision was the D&D department. To get a deeper understanding in
how the function actually affects the Purchasing department and thereby be able to answer the sub-
question, an interview with the D&D manager was held. The used interview guide can be read in
Appendix 5 and the summary of the interview can be found in Appendix 8.
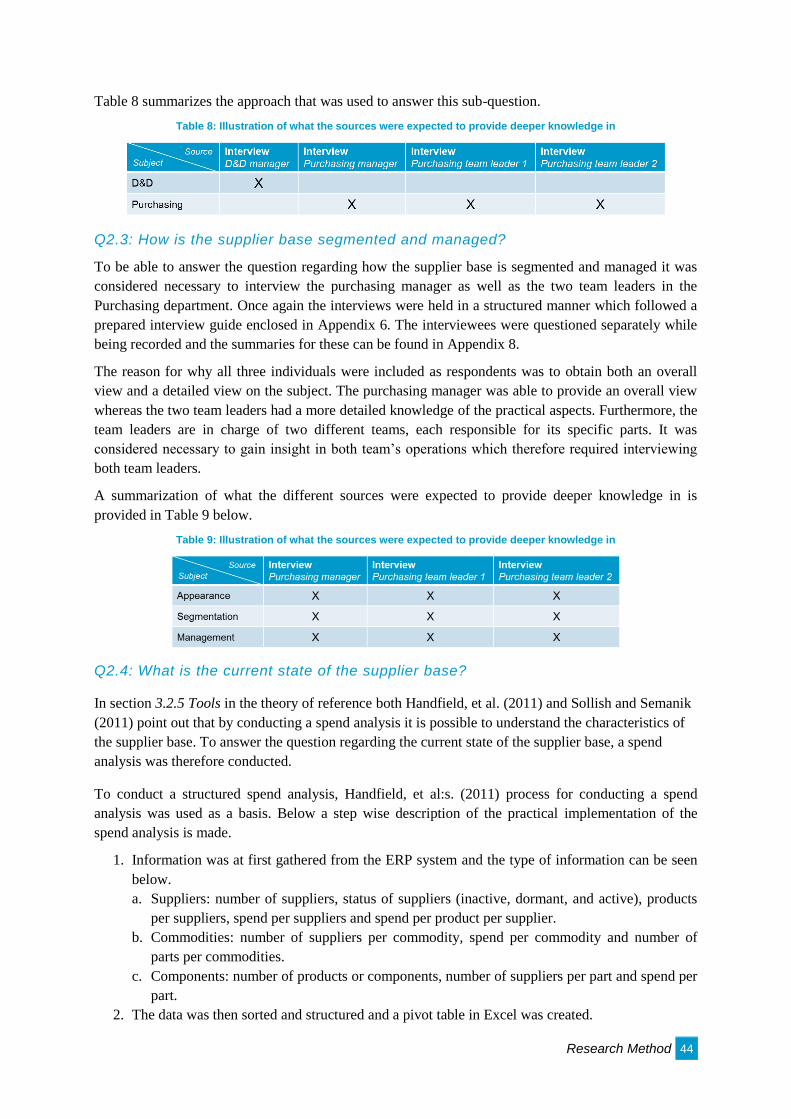
Research Method 44
Table 8 summarizes the approach that was used to answer this sub-question.
Table 8: Illustration of what the sources were expected to provide deeper knowledge in
Q2.3: How is the supplier base segmented and managed?
To be able to answer the question regarding how the supplier base is segmented and managed it was
considered necessary to interview the purchasing manager as well as the two team leaders in the
Purchasing department. Once again the interviews were held in a structured manner which followed a
prepared interview guide enclosed in Appendix 6. The interviewees were questioned separately while
being recorded and the summaries for these can be found in Appendix 8.
The reason for why all three individuals were included as respondents was to obtain both an overall
view and a detailed view on the subject. The purchasing manager was able to provide an overall view
whereas the two team leaders had a more detailed knowledge of the practical aspects. Furthermore, the
team leaders are in charge of two different teams, each responsible for its specific parts. It was
considered necessary to gain insight in both team’s operations which therefore required interviewing
both team leaders.
A summarization of what the different sources were expected to provide deeper knowledge in is
provided in Table 9 below.
Table 9: Illustration of what the sources were expected to provide deeper knowledge in
Q2.4: What is the current state of the supplier base?
In section 3.2.5 Tools in the theory of reference both Handfield, et al. (2011) and Sollish and Semanik
(2011) point out that by conducting a spend analysis it is possible to understand the characteristics of
the supplier base. To answer the question regarding the current state of the supplier base, a spend
analysis was therefore conducted.
To conduct a structured spend analysis, Handfield, et al:s. (2011) process for conducting a spend
analysis was used as a basis. Below a step wise description of the practical implementation of the
spend analysis is made.
1. Information was at first gathered from the ERP system and the type of information can be seen
below.
a. Suppliers: number of suppliers, status of suppliers (inactive, dormant, and active), products
per suppliers, spend per suppliers and spend per product per supplier.
b. Commodities: number of suppliers per commodity, spend per commodity and number of
parts per commodities.
c. Components: number of products or components, number of suppliers per part and spend per
part.
2. The data was then sorted and structured and a pivot table in Excel was created.
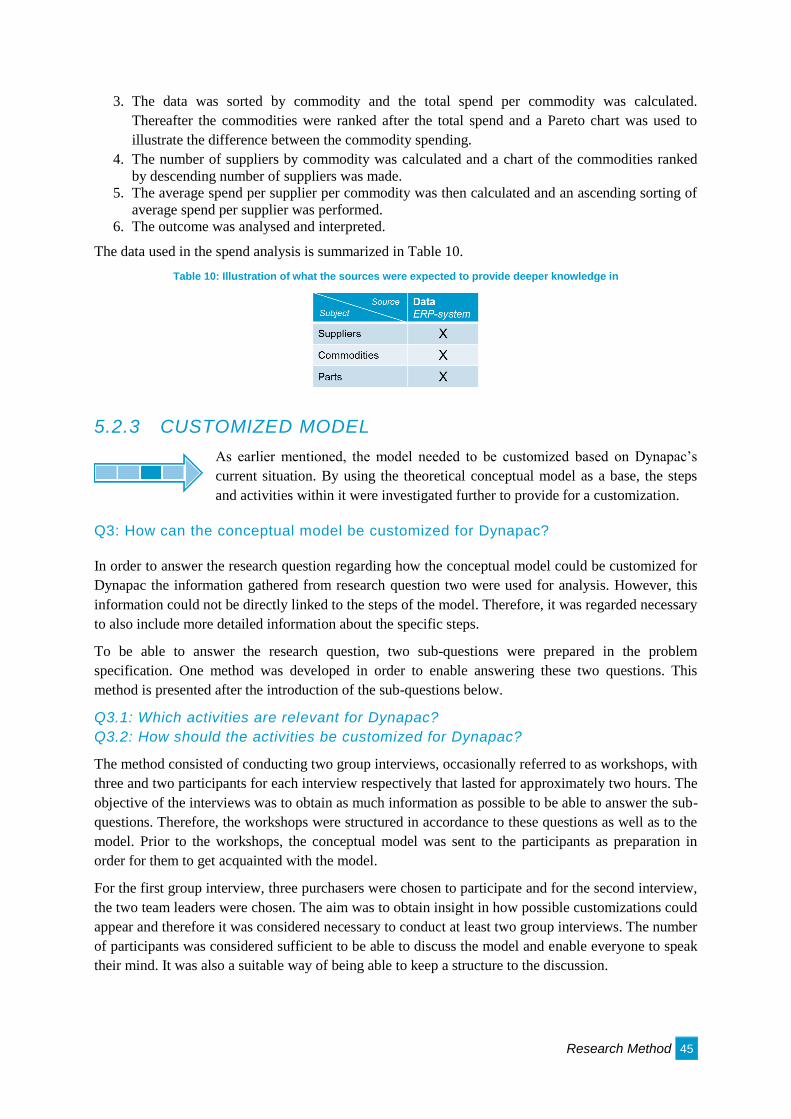
Research Method 45
3. The data was sorted by commodity and the total spend per commodity was calculated.
Thereafter the commodities were ranked after the total spend and a Pareto chart was used to
illustrate the difference between the commodity spending.
4. The number of suppliers by commodity was calculated and a chart of the commodities ranked
by descending number of suppliers was made.
5. The average spend per supplier per commodity was then calculated and an ascending sorting of
average spend per supplier was performed.
6. The outcome was analysed and interpreted.
The data used in the spend analysis is summarized in Table 10.
Table 10: Illustration of what the sources were expected to provide deeper knowledge in
5.2.3 CUSTOMIZED MODEL
As earlier mentioned, the model needed to be customized based on Dynapac’s
current situation. By using the theoretical conceptual model as a base, the steps
and activities within it were investigated further to provide for a customization.
Q3: How can the conceptual model be customized for Dynapac?
In order to answer the research question regarding how the conceptual model could be customized for
Dynapac the information gathered from research question two were used for analysis. However, this
information could not be directly linked to the steps of the model. Therefore, it was regarded necessary
to also include more detailed information about the specific steps.
To be able to answer the research question, two sub-questions were prepared in the problem
specification. One method was developed in order to enable answering these two questions. This
method is presented after the introduction of the sub-questions below.
Q3.1: Which activities are relevant for Dynapac?
Q3.2: How should the activities be customized for Dynapac?
The method consisted of conducting two group interviews, occasionally referred to as workshops, with
three and two participants for each interview respectively that lasted for approximately two hours. The
objective of the interviews was to obtain as much information as possible to be able to answer the sub-
questions. Therefore, the workshops were structured in accordance to these questions as well as to the
model. Prior to the workshops, the conceptual model was sent to the participants as preparation in
order for them to get acquainted with the model.
For the first group interview, three purchasers were chosen to participate and for the second interview,
the two team leaders were chosen. The aim was to obtain insight in how possible customizations could
appear and therefore it was considered necessary to conduct at least two group interviews. The number
of participants was considered sufficient to be able to discuss the model and enable everyone to speak
their mind. It was also a suitable way of being able to keep a structure to the discussion.
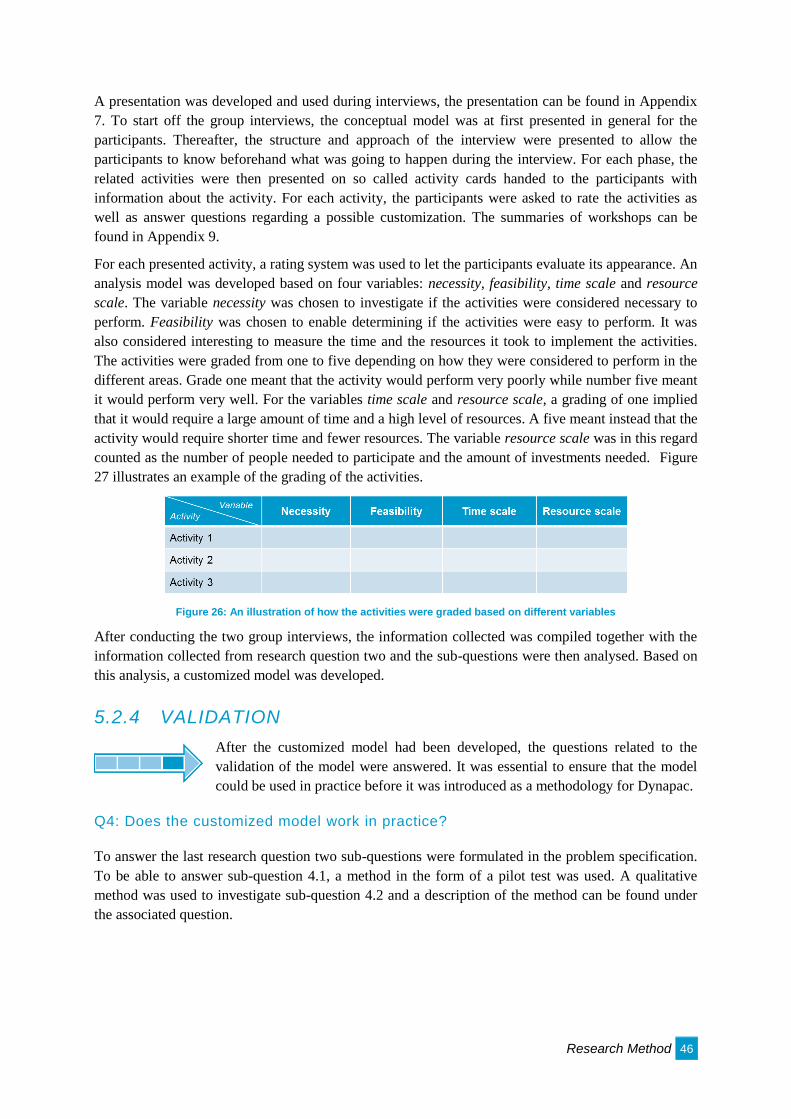
Research Method 46
A presentation was developed and used during interviews, the presentation can be found in Appendix
7. To start off the group interviews, the conceptual model was at first presented in general for the
participants. Thereafter, the structure and approach of the interview were presented to allow the
participants to know beforehand what was going to happen during the interview. For each phase, the
related activities were then presented on so called activity cards handed to the participants with
information about the activity. For each activity, the participants were asked to rate the activities as
well as answer questions regarding a possible customization. The summaries of workshops can be
found in Appendix 9.
For each presented activity, a rating system was used to let the participants evaluate its appearance. An
analysis model was developed based on four variables: necessity, feasibility, time scale and resource
scale. The variable necessity was chosen to investigate if the activities were considered necessary to
perform. Feasibility was chosen to enable determining if the activities were easy to perform. It was
also considered interesting to measure the time and the resources it took to implement the activities.
The activities were graded from one to five depending on how they were considered to perform in the
different areas. Grade one meant that the activity would perform very poorly while number five meant
it would perform very well. For the variables time scale and resource scale, a grading of one implied
that it would require a large amount of time and a high level of resources. A five meant instead that the
activity would require shorter time and fewer resources. The variable resource scale was in this regard
counted as the number of people needed to participate and the amount of investments needed. Figure
27 illustrates an example of the grading of the activities.
Figure 26: An illustration of how the activities were graded based on different variables
After conducting the two group interviews, the information collected was compiled together with the
information collected from research question two and the sub-questions were then analysed. Based on
this analysis, a customized model was developed.
5.2.4 VALIDATION
After the customized model had been developed, the questions related to the
validation of the model were answered. It was essential to ensure that the model
could be used in practice before it was introduced as a methodology for Dynapac.
Q4: Does the customized model work in practice?
To answer the last research question two sub-questions were formulated in the problem specification.
To be able to answer sub-question 4.1, a method in the form of a pilot test was used. A qualitative
method was used to investigate sub-question 4.2 and a description of the method can be found under
the associated question.
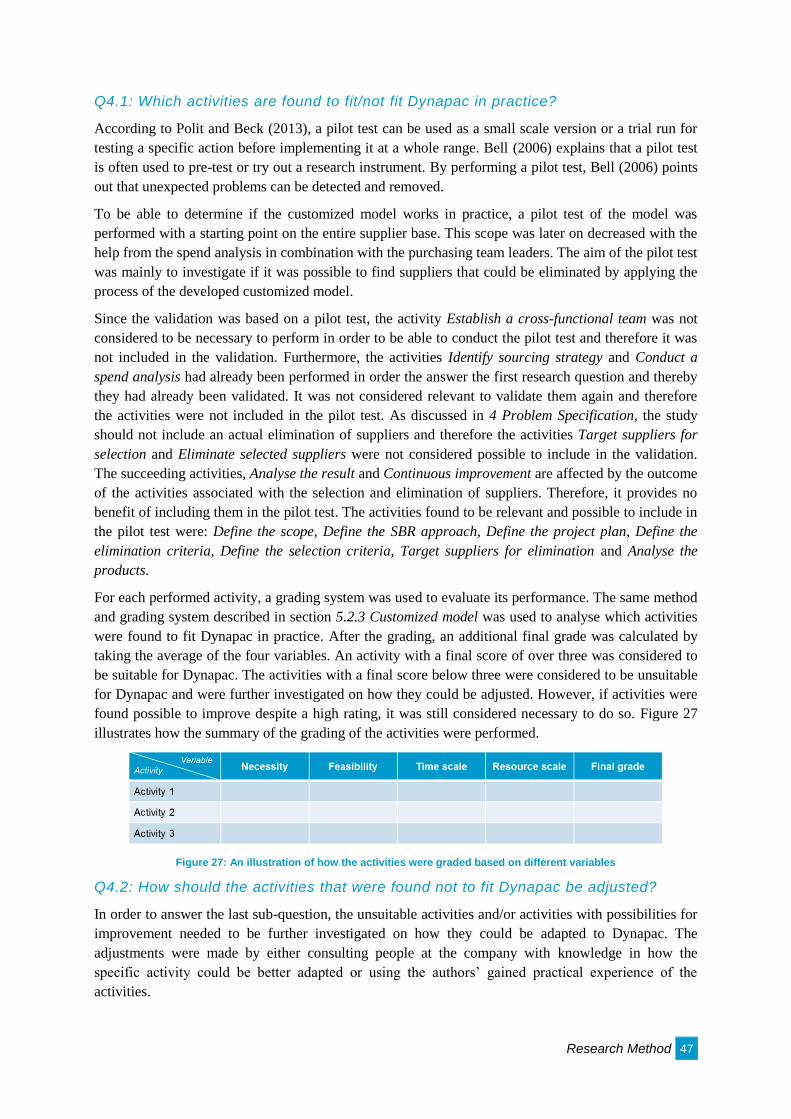
Research Method 47
Q4.1: Which activities are found to fit/not fit Dynapac in practice?
According to Polit and Beck (2013), a pilot test can be used as a small scale version or a trial run for
testing a specific action before implementing it at a whole range. Bell (2006) explains that a pilot test
is often used to pre-test or try out a research instrument. By performing a pilot test, Bell (2006) points
out that unexpected problems can be detected and removed.
To be able to determine if the customized model works in practice, a pilot test of the model was
performed with a starting point on the entire supplier base. This scope was later on decreased with the
help from the spend analysis in combination with the purchasing team leaders. The aim of the pilot test
was mainly to investigate if it was possible to find suppliers that could be eliminated by applying the
process of the developed customized model.
Since the validation was based on a pilot test, the activity Establish a cross-functional team was not
considered to be necessary to perform in order to be able to conduct the pilot test and therefore it was
not included in the validation. Furthermore, the activities Identify sourcing strategy and Conduct a
spend analysis had already been performed in order the answer the first research question and thereby
they had already been validated. It was not considered relevant to validate them again and therefore
the activities were not included in the pilot test. As discussed in 4 Problem Specification, the study
should not include an actual elimination of suppliers and therefore the activities Target suppliers for
selection and Eliminate selected suppliers were not considered possible to include in the validation.
The succeeding activities, Analyse the result and Continuous improvement are affected by the outcome
of the activities associated with the selection and elimination of suppliers. Therefore, it provides no
benefit of including them in the pilot test. The activities found to be relevant and possible to include in
the pilot test were: Define the scope, Define the SBR approach, Define the project plan, Define the
elimination criteria, Define the selection criteria, Target suppliers for elimination and Analyse the
products.
For each performed activity, a grading system was used to evaluate its performance. The same method
and grading system described in section 5.2.3 Customized model was used to analyse which activities
were found to fit Dynapac in practice. After the grading, an additional final grade was calculated by
taking the average of the four variables. An activity with a final score of over three was considered to
be suitable for Dynapac. The activities with a final score below three were considered to be unsuitable
for Dynapac and were further investigated on how they could be adjusted. However, if activities were
found possible to improve despite a high rating, it was still considered necessary to do so. Figure 27
illustrates how the summary of the grading of the activities were performed.
Figure 27: An illustration of how the activities were graded based on different variables
Q4.2: How should the activities that were found not to fit Dynapac be adjusted?
In order to answer the last sub-question, the unsuitable activities and/or activities with possibilities for
improvement needed to be further investigated on how they could be adapted to Dynapac. The
adjustments were made by either consulting people at the company with knowledge in how the
specific activity could be better adapted or using the authors’ gained practical experience of the
activities.
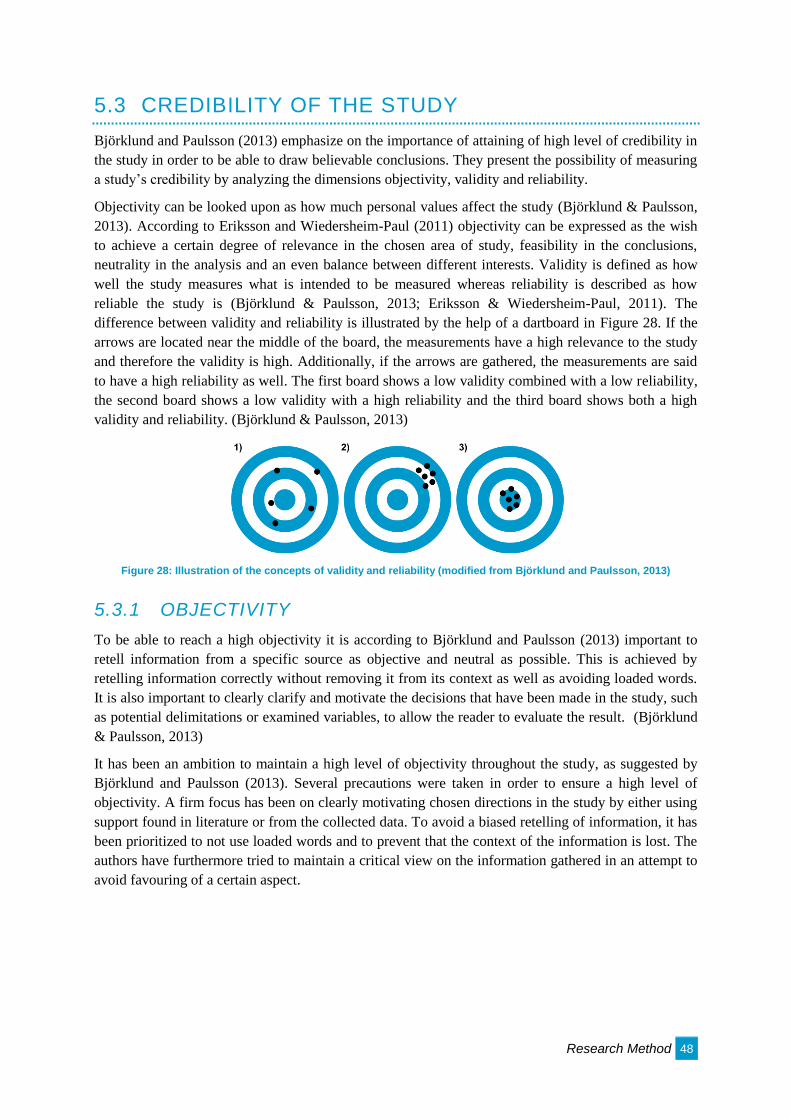
Research Method 48
5.3 CREDIBILITY OF THE STUDY
Björklund and Paulsson (2013) emphasize on the importance of attaining of high level of credibility in
the study in order to be able to draw believable conclusions. They present the possibility of measuring
a study’s credibility by analyzing the dimensions objectivity, validity and reliability.
Objectivity can be looked upon as how much personal values affect the study (Björklund & Paulsson,
2013). According to Eriksson and Wiedersheim-Paul (2011) objectivity can be expressed as the wish
to achieve a certain degree of relevance in the chosen area of study, feasibility in the conclusions,
neutrality in the analysis and an even balance between different interests. Validity is defined as how
well the study measures what is intended to be measured whereas reliability is described as how
reliable the study is (Björklund & Paulsson, 2013; Eriksson & Wiedersheim-Paul, 2011). The
difference between validity and reliability is illustrated by the help of a dartboard in Figure 28. If the
arrows are located near the middle of the board, the measurements have a high relevance to the study
and therefore the validity is high. Additionally, if the arrows are gathered, the measurements are said
to have a high reliability as well. The first board shows a low validity combined with a low reliability,
the second board shows a low validity with a high reliability and the third board shows both a high
validity and reliability. (Björklund & Paulsson, 2013)
Figure 28: Illustration of the concepts of validity and reliability (modified from Björklund and Paulsson, 2013)
5.3.1 OBJECTIVITY
To be able to reach a high objectivity it is according to Björklund and Paulsson (2013) important to
retell information from a specific source as objective and neutral as possible. This is achieved by
retelling information correctly without removing it from its context as well as avoiding loaded words.
It is also important to clearly clarify and motivate the decisions that have been made in the study, such
as potential delimitations or examined variables, to allow the reader to evaluate the result. (Björklund
& Paulsson, 2013)
It has been an ambition to maintain a high level of objectivity throughout the study, as suggested by
Björklund and Paulsson (2013). Several precautions were taken in order to ensure a high level of
objectivity. A firm focus has been on clearly motivating chosen directions in the study by either using
support found in literature or from the collected data. To avoid a biased retelling of information, it has
been prioritized to not use loaded words and to prevent that the context of the information is lost. The
authors have furthermore tried to maintain a critical view on the information gathered in an attempt to
avoid favouring of a certain aspect.
Research Method 49
5.3.2 VALIDITY
Merriam (1994) proposes several approaches on how to increase the validity of a study. First of all it is
possible to use triangulation to achieve a high level of validity (Merriam, 1994; Björklund & Paulsson,
2013). Furthermore, the respondents should be allowed to control the information that they have
contributed with in order to guarantee that no information has been misinterpreted. The information
should be controlled continuously during the study. Thereafter, Merriam (1994) proposes that external
and independent individuals can be used to control the result as a means to confirm the reasonableness
of the result. It is also important to present and clarify any biases in the beginning of the study to
provide further understanding of the results. (Merriam, 1994)
Triangulation has been used throughout the study in order to increase the validity. Initially, the
compilation of the theory of reference provided the opportunity of presenting different researchers’
view on the studied area. Triangulation has also been used in the research method by using several
different sources and at times by using different approaches when answering the same research
question. For example, when investigating the current state of the supplier base, not only was
qualitative data collected but also quantitative data. In that way, the qualitative data could be verified
with the help of the quantitative data and vice versa. The interviewees were also asked to control the
information that they had provided in order to ensure its accuracy. At several occasions, the report was
additionally read through by the supervisor at the company in order to verify both the progress of the
study and the facts stated in the report. All together, the above stated measures are considered to be
sufficient for achieving a high degree of validity.
5.3.3 RELIABILITY
To obtain a high level of reliability, Merriam (1994) proposes once again the usage of triangulation
and especially the usage of several different methods for collecting and analysing data. By clarifying
underlying assumptions and theories to the study, such as the criteria for choosing interviewees, it is
also possible to increase the reliability. In order to enable a review of the study as a means for ensuring
reliability, it is important that the research method is described in such detail that an external can
repeat the study. (Merriam, 1994)
As mentioned earlier, triangulation has been used several times throughout the study and therefore it
has contributed to the reliability of the study as well. The authors of the study have aimed at
thoroughly explaining the decisions that were made throughout the study and providing explanations
regarding underlying causes. It is also considered that the research method has been explained in such
detail that it is possible to conduct the study again, thereby enabling the possibility of reviewing it.
With that being said, a high degree of reliability is considered to be achieved in the study.
5.4 CRITICISM OF THE RESEARCH METHOD
According to Jacobsen (2002) the study's authors should examine the quality of the study's findings
before the results can be presented. This is the reason for why criticism of the research method is
included as a section.
Research Method 50
The literature review has been done partly through different databases and partly by reviewing
reference lists enclosed in articles and books. The risk with reviewing references of one source to
another is that only sources with a homogeneous approach can have been reviewed. The authors of the
study have tried to minimize this risk by applying the aim of conducting a broad literature review and
thereby securing that several different perspectives have been taken into account. For example both
benefits and drawbacks of SBR have been raised, three different processes for SBR are presented and
different ways of segmenting suppliers have been described.
Bell (2006) points out the risk for interviews being too subjective and at times even distorted.
According to Bell (2006), the risk of distortion can be minimized by using the same interviewer for
each interview. To avoid the occurrence of distortion in the study, interviews concerning the same area
were conducted by the same person. In order to ensure that no lack of information or
misunderstanding has occurred, every interview correspondent was asked to verify the summary of
their interview. Furthermore, all questions have been designed in such a way that they are regarded to
be objective and non-leading. However, there is always a risk for questions being leading, which could
mean that some of the responses obtained have been angled to favour the study. In order to minimize
this risk, triangulation has been used in most cases, which is considered to have contributed to increase
the credibility to the study.
The study took place in Germany and since the native language was a foreign language for the authors
of the study, language barriers could in certain occasions arise. The study was conducted in English
and by constantly thinking of speaking clearly, slowly and choosing words wisely this barrier is
considered to have been reduced. The authors also had basic knowledge in the native language and
therefore clarifications in German could be made if found to be needed. To avoid misunderstanding
with the supervisor at the company, conversations and updates of the progress of the study were held
continuously. To avoid language barriers during interviews, the formulation of the questions were
based on the interview correspondent's vocabulary and sometimes certain terms and questions were
translated into the native language.
Regarding research question four1 and the validation of the model, only some of the activities were
possible to include in the pilot test. The activities which were considered to be most critical for SBR
without including elements of the actual elimination of suppliers were included in the validation and
the validation can therefore be considered to have a correct focus. Even though all activities were not
validated, they were nevertheless developed and customized together with the Purchasing department
at Dynapac and it was also verified by them. The activities which were not included in the pilot test
can therefore be seen as customized activities without having been validated. This together with the
same arguments given in section 5.2.4 Validation, it is considered that the pilot test of the model was
sufficient regarding the purpose of the study and the available timespan.
5.5 SYNTHESIS OF RESEARCH METHOD
The section Research Method consisted of a thorough description of the course of action taken during
the study, the practical methods applied, the credibility of the study and finally the criticism of the
method used.
1 Does the customized model work in practice?
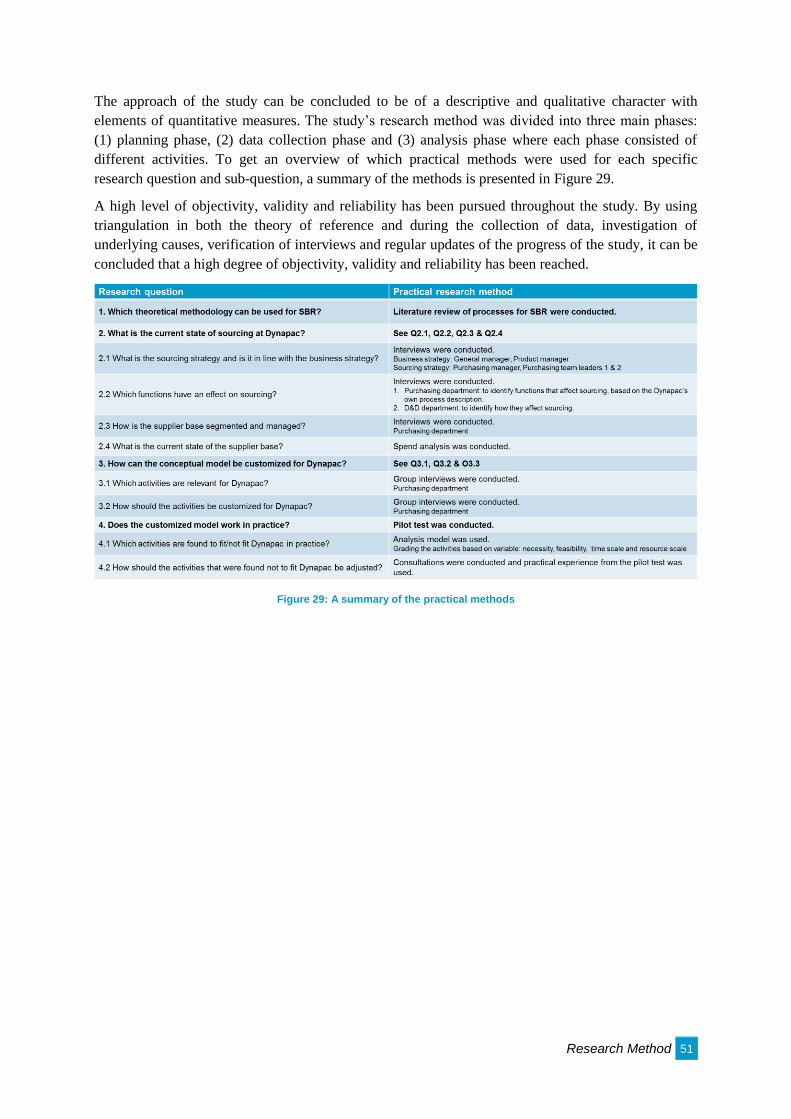
Research Method 51
The approach of the study can be concluded to be of a descriptive and qualitative character with
elements of quantitative measures. The study’s research method was divided into three main phases:
(1) planning phase, (2) data collection phase and (3) analysis phase where each phase consisted of
different activities. To get an overview of which practical methods were used for each specific
research question and sub-question, a summary of the methods is presented in Figure 29.
A high level of objectivity, validity and reliability has been pursued throughout the study. By using
triangulation in both the theory of reference and during the collection of data, investigation of
underlying causes, verification of interviews and regular updates of the progress of the study, it can be
concluded that a high degree of objectivity, validity and reliability has been reached.
Figure 29: A summary of the practical methods
Empirical Data 52
6 EMPIRICAL DATA
This section presents the empirical data related to the case company Dynapac. The information
included in this section is directly related to the study’s research questions two2 and three
3 stated in
the section 4 Problem Specification. The section begins with a description of the business strategy and
the sourcing strategy at Dynapac. Thereafter, the stakeholders in sourcing decisions are presented
followed by a description of the current supplier base. Finally, the evaluation of the conceptual model
is presented. In order to simplify the reading of this section, the presented information is structured as
a synopsis of the material gathered from interviews and the ERP system.
6.1 BUSINESS STRATEGY
The empirical data presented below has been compiled from interviews held with the business
manager (Business manager, 2015) and the product manager (Product manager, 2015). A summary of
each interview with associated citations can be found in Appendix 8.
The vision of Dynapac is the vision of Atlas Copco which is to be “First in mind, first in choice”. This
vision means that when a customer has a demand that can be supplied by Atlas Copco, the customer
should immediately think of Atlas Copco and also choose their product. In order to reach this vision,
Dynapac needs to offer the right products with the right specifications, quality and cost. They want to
become the market leader to enable the fulfilling of the vision. However, at the moment there is
already a strong market leader that Dynapac does not yet have the capability to pass in market shares.
Therefore, Dynapac is aiming at becoming a strong number two. To reach this goal they need to grow
in volume and in market shares but it is important to point out that it has to be a profitable growth.
In order to reach a profitable growth, Dynapac aims at becoming cost leaders. Low cost can be defined
as being cost efficient but still retaining best quality and best functionality. It is mainly the cost of
production that is of interest which therefore includes purchasing costs, labour costs as well overhead
costs. The general management has set overall goals for desired future net savings which have been
broken down into targets for the different departments. The concept of Lean Production has for
example been implemented at the production line in order to minimize the occurrence of waste and
reduce the production cost. At the Purchasing department, the focus needs to be on finding suppliers
that can deliver at lowest possible cost with high quality.
According to the general management, Dynapac needs to exceed their customers’ expectations
regarding quality. They need to be able to maintain a high reliability in their products to assure the
customer that the machines will not fail during operation. Therefore, the mind-set of being “first time
right” is actualized in every step of the process. This means that the work should be done correctly the
first time. Quality assurance also needs to be present during the entire production line in order to
maintain the high quality that Dynapac wants to achieve. The phrase “first time right” also applies for
the purchased material which therefore once again highlights the need for material with high quality.
Dynapac also wants to become more innovative in order to meet customers’ demands regarding
functionality and they need to be able to foresee what the customer wants in the future. This is a
moving target and it is therefore important to follow the trends on the market.
2 What is the current state of sourcing at Dynapac?
3 How can the conceptual model be customized for Dynapac?
Empirical Data 53
To summarize the current view on the business strategy, the focus is set on cost, quality and
functionality with a main focus on becoming more cost efficient. Targets have been set and are being
constantly monitored and analysed in order to control the progress and to make sure the company is
moving in the right direction.
6.2 SOURCING STRATEGY
The empirical data on sourcing strategy was compiled from interviews with the purchasing manager
(Purchasing manager, 2015) and the two purchasing team leaders (Purchasing team leader 1, 2015;
Purchasing team leader 2, 2015). The summary of each interview and the corresponding citations can
be found in Appendix 8.
The sourcing strategy is at the moment focused on three main areas: (1) cost, (2) quality and (3)
delivery performance. The vision of the sourcing department is to find the best solution which can be
defined as finding suppliers that are able to supply with low cost, high quality and high delivery
performance. Lead time is also highlighted as being an important factor to take into account when
choosing supplier since the cost factor is affected by the lead time. In order to reach this vision,
multiple targets have been set. These targets concern the following areas:
Total number of suppliers
Number of suppliers evaluated
Number of suppliers audited
Delivery performance
PPM
Net savings
Number of payment days
The KPIs were introduced and designed by the new purchasing manager and they are based on targets
provided by the general management. They have thereafter been broken down for each team and for
each purchaser. On a weekly basis the teams meet up to discuss the progress of the KPIs in order to
analyse the progress.
To be able to meet the targets, the purchasing teams work mostly with evaluating suppliers and finding
new suppliers. The aim is to strive for long term relationships with the suppliers with a focus on
supplier development, which is something that is highlighted as a strength at the Purchasing
department. The department has implemented a process for handling suppliers with poor performance
in order to help them develop their processes as well as increasing their quality. A system for
automatically notifying suppliers with inadequate performance is in use, sending out emails to the
affected suppliers with their performance measures. More pressure is also put on suppliers to
implement processes that can assure quality and delivery performance at the suppliers’ production site.
The sourcing department needs to be able to ensure that the delivered material is hundred percent
quality assured.
To reach the full potential of the sourcing strategy, the number of suppliers is considered necessary to
reduce since the current supplier base requires a too high level of resources.
Empirical Data 54
6.3 STAKEHOLDERS IN SOURCING DECISIONS
The empirical data regarding the identification of stakeholders in sourcing decisions were compiled
from interviews with the purchasing manager (Purchasing manager, 2015), the two purchasing team
leaders (Purchasing team leader 1, 2015; Purchasing team leader 2, 2015) and the D&D manager
(D&D manager, 2015). Summaries and details from the interviews as well as citations can be found in
Appendix 8.
The department for Marketing is the main initiator of changes in the machines since they have the
closest contact with the customer. This will therefore indirectly affect the sourcing decisions.
However, it is the design created by the D&D department that has the direct effect on sourcing. The
Purchasing department is in other words affected by the designs of the machines and their
components. The design of a machine is first created during a new development process and thereafter
changes can be made to the design depending on what the customers demand, which legislations need
to be followed and which improvements can be made. The communication between the D&D
department and the Purchasing department is therefore of high importance.
The Purchasing department becomes involved during the development of new products and can then
influence the decisions regarding material. The D&D department starts by making the drawings of the
machine. Currently, the D&D department is working on finding possible solutions for standardizations
and before designing a new component they first ensure that no existing component can be reused.
Before the drawings can be released, they need to be approved by all affected departments, including
the Purchasing department. Suitable material is chosen by the D&D department based on their
experience and knowledge and is then discussed with the Purchasing department. During this process,
the D&D department has direct contact with the Purchasing department in order to ensure that all of
the components in the design can be supplied. Suppliers can also contribute to the discussion by
recommending possible improvements of the material which is then forwarded to the D&D
department by the Purchasing department.
The Purchasing department has the last call when deciding which suppliers to use. However, in some
cases there is a need for an early decision during a new development process regarding some specific
components and then the decision needs to be made together with the D&D department. This mainly
concerns the choice of suppliers supplying so called black box items. These items are specific items
that the suppliers have more knowledge about than Dynapac. General specifications regarding what
the component should be able to do and what it should look like is sent to the supplier. The supplier
thereafter designs the product from these specifications but does not provide information to Dynapac
about what is inside the component and what material it is made of. Typical black box items are
engines, gear boxes and hydraulic parts. The choice of these suppliers has a great effect on the design
of the machines and the decision is therefore made by the Purchasing department and the D&D
department together.
Once the machines are in serial production, the department for Production provides feedback on how
the assembly of the components works. Should problems occur during production, the Purchasing
department will be notified and the responsible supplier will be informed and an action plan for
preventing the problem from occurring again will be demanded. If the problems do not seize to occur,
the responsible supplier will eventually be phased out from the supplier base. However, if problems
occur due to a malfunction in the design a change can be made in retrospect by the D&D department.
Empirical Data 55
Changes in the design can also be requested if opportunities for improving the design, simplifying the
assembly of the machine or lowering the production cost are found. An Engineering Change Request
(ECR) needs to be submitted to the Change Board (CCB) which comes together every week to
evaluate requests for changes. The approved changes thereafter need to be implemented. Thereby, all
departments, including the Purchasing department, can affect the design of the machines and their
components.
The Production department is also in charge of deciding how the components should be delivered and
is in charge of the internal logistics. The Purchasing department needs to follow the specifications
regarding packaging, such as type of carrier and quantity. However, these specifications do not affect
the decision of supplier, unless the supplier is not able to deliver as specified.
6.4 THE SUPPLIER BASE
The data collected on the supplier base has been compiled from both qualitative data gathered from
interviews held with the purchasing manager (Purchasing manager, 2015) and the two purchasing
team leaders (Purchasing team leader 1, 2015; Purchasing team leader 2, 2015) and from quantitative
data from the ERP system. More detailed information associated with the interviews can be found in
the Appendix 8.
Currently, the supplier base of 247 suppliers is considered to be too large. An ideal situation would be
if it contained in total 150 suppliers. To Purchasing team leader 1 (2015), around hundred suppliers
were even regarded as being more or less unknown. The view of the supplier base is that it consists of
several smaller suppliers with a low turnover as well as several suppliers supplying special parts, so
called black box items, which cannot be purchased from another supplier.
Several strengths of the supplier base have been identified by the interviewees. First of all, the supplier
base consists of numerous mid-size suppliers that can react quickly to changes regarding design, time
or quantity due to the high leverage Dynapac has on them. The supplier base furthermore consists of
suppliers with a high level of knowledge in technology that can produce critical components that no
one else can. Several of the suppliers are also committed to collaborating with Dynapac in order to
improve their own operations as well as to come with suggestions on possible changes with the
components.
The main weakness of the supplier base is as mentioned earlier, its size which hinders the Purchasing
department to manage the suppliers in their desired way. Another weakness is the fact that it contains
suppliers that Dynapac are highly dependent on since these suppliers provide advanced components
that only they have knowledge in how the components are produced. Even though these suppliers were
considered to create an advantage, it is also considered to create issues in forms of complicating the
process of finding potential replacement suppliers which therefore increases the dependency. There
also exist suppliers with poor performance which affect the overall performance negatively at
Dynapac.
Empirical Data 56
6.4.1 SEGMENTATION AND MANAGEMENT
The supplier base is currently segmented based on commodities and is grouped in accordance to the
commodities’ function into different categories. There are in total 72 different commodities which can
be seen in Appendix 10 together with the associated category. For each commodity there are in
average eight suppliers. Different strategies are used on different commodities depending on what the
cost drivers are for the commodities. No segmentation is based on relationship because all suppliers
are viewed as business partners. However, 24 critical suppliers have been identified and they receive
more attention than other suppliers. These suppliers provide special and critical components that can
disrupt the production if they are not delivered in time or with the right quality. Therefore, they are
regularly controlled on their delivery performance and PPM and their performance is frequently
communicated to the suppliers in order to prevent disruptions. At times suppliers receive more
attention than what is justifiable when compared to their turnover. One interviewee expressed the wish
to use some kind of classification in order to provide more guidance of which suppliers should receive
more focus.
Even though suppliers are not segmented based on relationship, they are still ranked in order of
preference. This is mainly done to simplify the search for suppliers for new developments. According
to the interviewees, the suppliers ranked the lowest will not be used in new projects. However, this
ranking does not affect the how the relationship with the suppliers is maintained.
The Purchasing department strives for maintaining a long term relationship, a partnership, with all of
their suppliers. Their wish is to provide assistance and help the suppliers develop their manufacturing
operations to become more efficient and to be responsive when suppliers come with suggestions for
improvements.
6.4.2 CHARACTERISTICS
Based on data collected from the ERP system, Dynapac currently has 247 active suppliers registered in
the database at the time of writing. However, around 15 of these did not have a turnover at Dynapac in
the last twelve months. Approximately 6200 different components are purchased from these suppliers
with a combined yearly purchasing budget of approximately 40 million Euros. For each component,
one supplier has been appointed the main supplier but other suppliers of the same component can exist
in the system. However, the number of additional suppliers differs widely depending on the
component.
The purchasing budget is highly fragmented, meaning that a large part of the purchasing budget is
allocated to only a limited number of suppliers, which is depicted in Figure 30. As Figure 30
illustrates, about 80 percent of the purchasing budget is allocated to only 14 percent of the total
supplier base, with the remaining 20 percent of the purchasing budget being divided among 86 percent
of the suppliers.
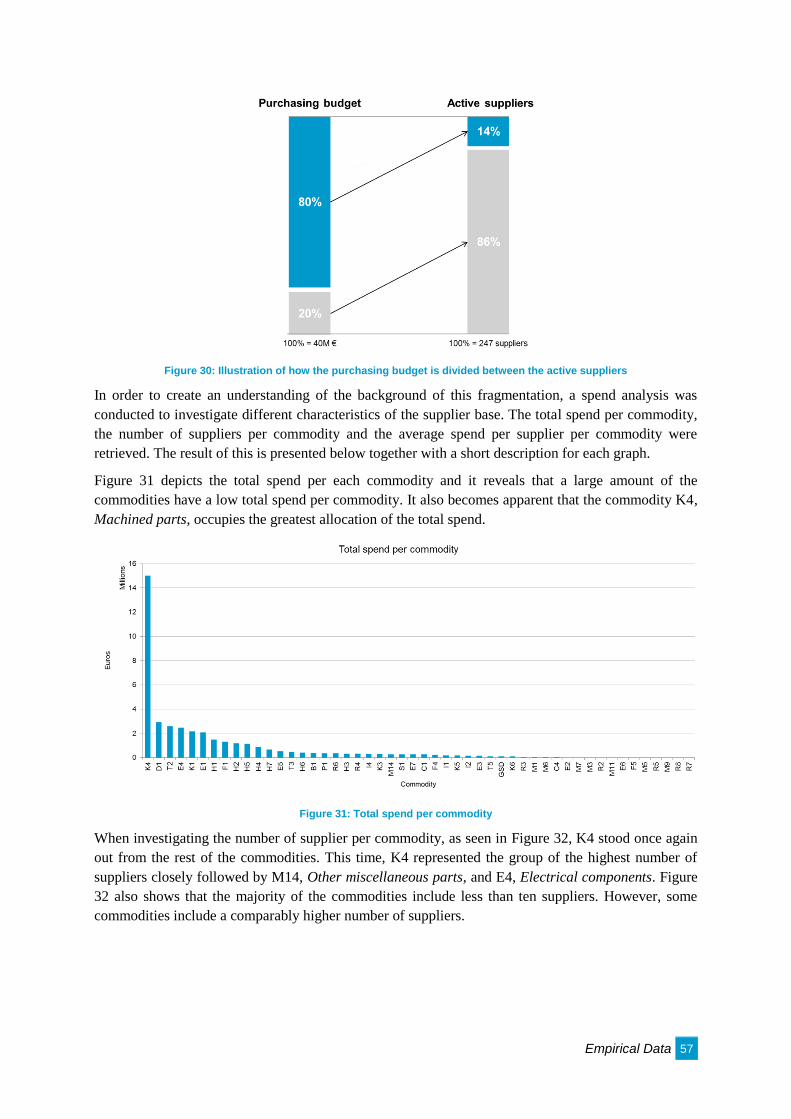
Empirical Data 57
Figure 30: Illustration of how the purchasing budget is divided between the active suppliers
In order to create an understanding of the background of this fragmentation, a spend analysis was
conducted to investigate different characteristics of the supplier base. The total spend per commodity,
the number of suppliers per commodity and the average spend per supplier per commodity were
retrieved. The result of this is presented below together with a short description for each graph.
Figure 31 depicts the total spend per each commodity and it reveals that a large amount of the
commodities have a low total spend per commodity. It also becomes apparent that the commodity K4,
Machined parts, occupies the greatest allocation of the total spend.
Figure 31: Total spend per commodity
When investigating the number of supplier per commodity, as seen in Figure 32, K4 stood once again
out from the rest of the commodities. This time, K4 represented the group of the highest number of
suppliers closely followed by M14, Other miscellaneous parts, and E4, Electrical components. Figure
32 also shows that the majority of the commodities include less than ten suppliers. However, some
commodities include a comparably higher number of suppliers.
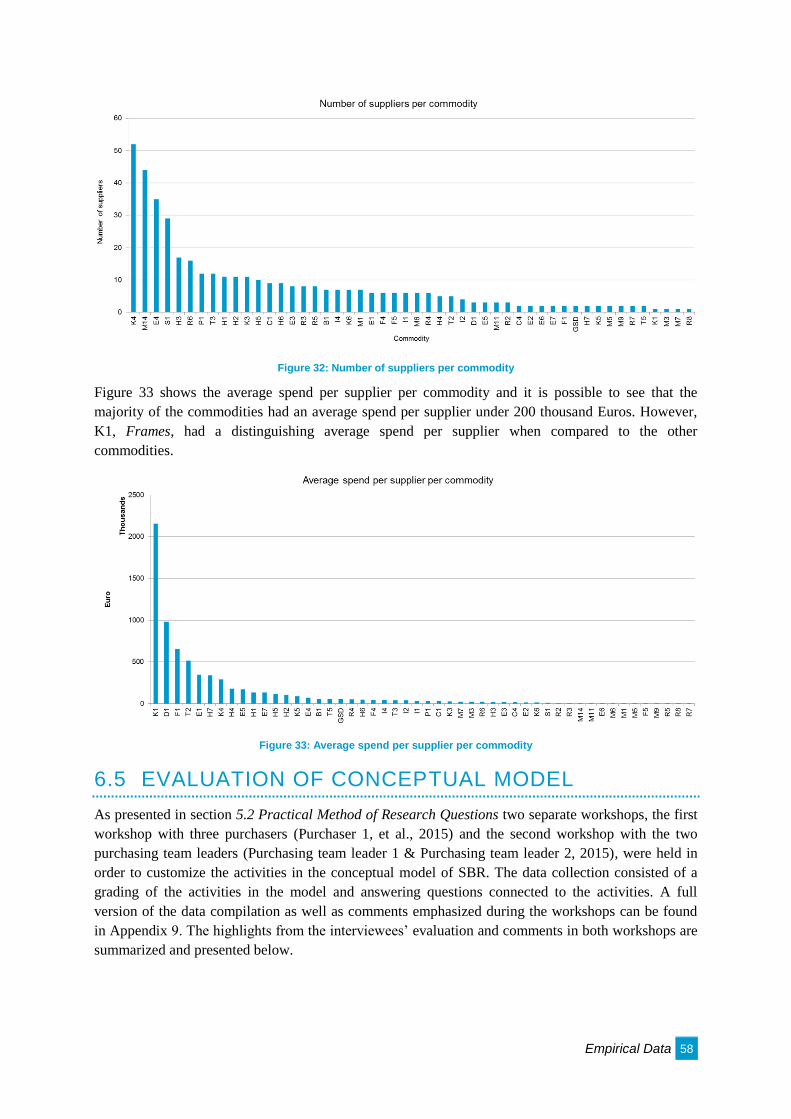
Empirical Data 58
Figure 32: Number of suppliers per commodity
Figure 33 shows the average spend per supplier per commodity and it is possible to see that the
majority of the commodities had an average spend per supplier under 200 thousand Euros. However,
K1, Frames, had a distinguishing average spend per supplier when compared to the other
commodities.
Figure 33: Average spend per supplier per commodity
6.5 EVALUATION OF CONCEPTUAL MODEL
As presented in section 5.2 Practical Method of Research Questions two separate workshops, the first
workshop with three purchasers (Purchaser 1, et al., 2015) and the second workshop with the two
purchasing team leaders (Purchasing team leader 1 & Purchasing team leader 2, 2015), were held in
order to customize the activities in the conceptual model of SBR. The data collection consisted of a
grading of the activities in the model and answering questions connected to the activities. A full
version of the data compilation as well as comments emphasized during the workshops can be found
in Appendix 9. The highlights from the interviewees’ evaluation and comments in both workshops are
summarized and presented below.
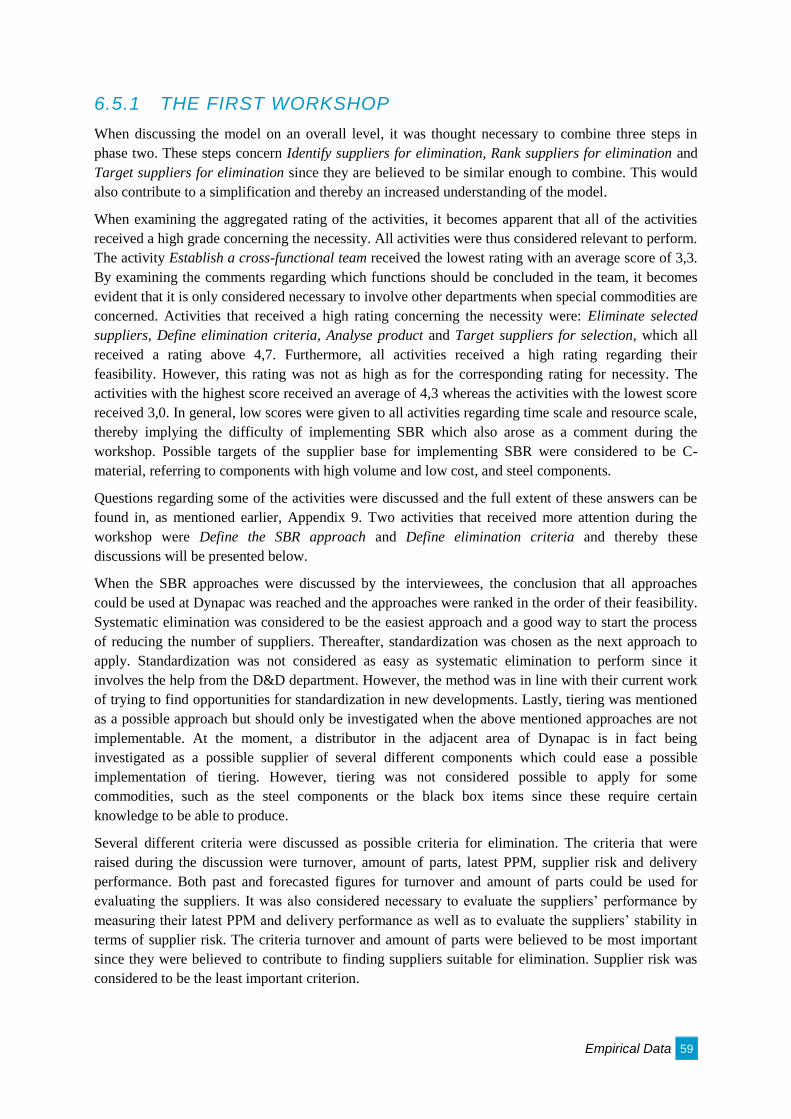
Empirical Data 59
6.5.1 THE FIRST WORKSHOP
When discussing the model on an overall level, it was thought necessary to combine three steps in
phase two. These steps concern Identify suppliers for elimination, Rank suppliers for elimination and
Target suppliers for elimination since they are believed to be similar enough to combine. This would
also contribute to a simplification and thereby an increased understanding of the model.
When examining the aggregated rating of the activities, it becomes apparent that all of the activities
received a high grade concerning the necessity. All activities were thus considered relevant to perform.
The activity Establish a cross-functional team received the lowest rating with an average score of 3,3.
By examining the comments regarding which functions should be concluded in the team, it becomes
evident that it is only considered necessary to involve other departments when special commodities are
concerned. Activities that received a high rating concerning the necessity were: Eliminate selected
suppliers, Define elimination criteria, Analyse product and Target suppliers for selection, which all
received a rating above 4,7. Furthermore, all activities received a high rating regarding their
feasibility. However, this rating was not as high as for the corresponding rating for necessity. The
activities with the highest score received an average of 4,3 whereas the activities with the lowest score
received 3,0. In general, low scores were given to all activities regarding time scale and resource scale,
thereby implying the difficulty of implementing SBR which also arose as a comment during the
workshop. Possible targets of the supplier base for implementing SBR were considered to be C-
material, referring to components with high volume and low cost, and steel components.
Questions regarding some of the activities were discussed and the full extent of these answers can be
found in, as mentioned earlier, Appendix 9. Two activities that received more attention during the
workshop were Define the SBR approach and Define elimination criteria and thereby these
discussions will be presented below.
When the SBR approaches were discussed by the interviewees, the conclusion that all approaches
could be used at Dynapac was reached and the approaches were ranked in the order of their feasibility.
Systematic elimination was considered to be the easiest approach and a good way to start the process
of reducing the number of suppliers. Thereafter, standardization was chosen as the next approach to
apply. Standardization was not considered as easy as systematic elimination to perform since it
involves the help from the D&D department. However, the method was in line with their current work
of trying to find opportunities for standardization in new developments. Lastly, tiering was mentioned
as a possible approach but should only be investigated when the above mentioned approaches are not
implementable. At the moment, a distributor in the adjacent area of Dynapac is in fact being
investigated as a possible supplier of several different components which could ease a possible
implementation of tiering. However, tiering was not considered possible to apply for some
commodities, such as the steel components or the black box items since these require certain
knowledge to be able to produce.
Several different criteria were discussed as possible criteria for elimination. The criteria that were
raised during the discussion were turnover, amount of parts, latest PPM, supplier risk and delivery
performance. Both past and forecasted figures for turnover and amount of parts could be used for
evaluating the suppliers. It was also considered necessary to evaluate the suppliers’ performance by
measuring their latest PPM and delivery performance as well as to evaluate the suppliers’ stability in
terms of supplier risk. The criteria turnover and amount of parts were believed to be most important
since they were believed to contribute to finding suppliers suitable for elimination. Supplier risk was
considered to be the least important criterion.
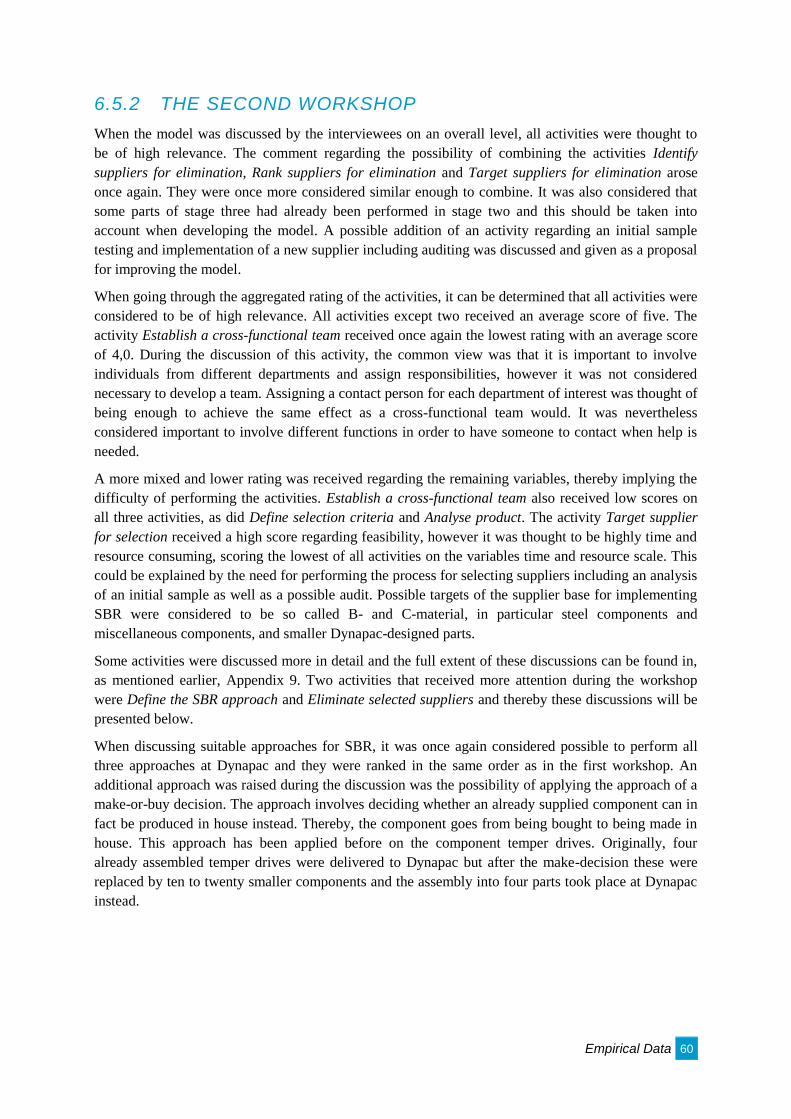
Empirical Data 60
6.5.2 THE SECOND WORKSHOP
When the model was discussed by the interviewees on an overall level, all activities were thought to
be of high relevance. The comment regarding the possibility of combining the activities Identify
suppliers for elimination, Rank suppliers for elimination and Target suppliers for elimination arose
once again. They were once more considered similar enough to combine. It was also considered that
some parts of stage three had already been performed in stage two and this should be taken into
account when developing the model. A possible addition of an activity regarding an initial sample
testing and implementation of a new supplier including auditing was discussed and given as a proposal
for improving the model.
When going through the aggregated rating of the activities, it can be determined that all activities were
considered to be of high relevance. All activities except two received an average score of five. The
activity Establish a cross-functional team received once again the lowest rating with an average score
of 4,0. During the discussion of this activity, the common view was that it is important to involve
individuals from different departments and assign responsibilities, however it was not considered
necessary to develop a team. Assigning a contact person for each department of interest was thought of
being enough to achieve the same effect as a cross-functional team would. It was nevertheless
considered important to involve different functions in order to have someone to contact when help is
needed.
A more mixed and lower rating was received regarding the remaining variables, thereby implying the
difficulty of performing the activities. Establish a cross-functional team also received low scores on
all three activities, as did Define selection criteria and Analyse product. The activity Target supplier
for selection received a high score regarding feasibility, however it was thought to be highly time and
resource consuming, scoring the lowest of all activities on the variables time and resource scale. This
could be explained by the need for performing the process for selecting suppliers including an analysis
of an initial sample as well as a possible audit. Possible targets of the supplier base for implementing
SBR were considered to be so called B- and C-material, in particular steel components and
miscellaneous components, and smaller Dynapac-designed parts.
Some activities were discussed more in detail and the full extent of these discussions can be found in,
as mentioned earlier, Appendix 9. Two activities that received more attention during the workshop
were Define the SBR approach and Eliminate selected suppliers and thereby these discussions will be
presented below.
When discussing suitable approaches for SBR, it was once again considered possible to perform all
three approaches at Dynapac and they were ranked in the same order as in the first workshop. An
additional approach was raised during the discussion was the possibility of applying the approach of a
make-or-buy decision. The approach involves deciding whether an already supplied component can in
fact be produced in house instead. Thereby, the component goes from being bought to being made in
house. This approach has been applied before on the component temper drives. Originally, four
already assembled temper drives were delivered to Dynapac but after the make-decision these were
replaced by ten to twenty smaller components and the assembly into four parts took place at Dynapac
instead.
Empirical Data 61
When discussing how suppliers should be eliminated, both participants highlight the importance of
being open with the suppliers and informing them about a possible phase out. However, before a phase
out can be informed to the supplier it is vital to first make sure that a replacement supplier has been
found and that it has passed the supplier selection process, including an approval of an initial sample
and a possible audit. Additionally, if the supplier has rest stock of the supplied products, Dynapac also
needs to take responsibility of it.
6.6 SYNTHESIS OF EMPIRICAL DATA
The section Empirical Data provided information regarding the business and sourcing strategy,
stakeholders in sourcing decisions and a description regarding the current supplier base. The
evaluation of the conceptual model was also presented.
The business strategy at Dynapac is focused on cost, quality and functionality with the main focus on
becoming more cost efficient. The sourcing strategy is at the moment focused on three main areas:
cost, quality and delivery performance. In order to follow the sourcing strategy the Purchasing
department uses and measures KPIs, such as total number of suppliers, delivery performance, PPM
and net savings.
The supplier base is currently segmented based on commodities and contains at the time of writing
247 active suppliers. About 80 percent of the purchasing budget is allocated to only 14 percent of the
total supplier base, with the remaining 20 percent of the purchasing budget being divided among 86
percent of the suppliers. The commodity with the greatest allocation of the total spend is K4,
Machined parts.
To summarize the data collection from the workshops all activities were thought to be of high
relevance. However it was highlighted in both workshops that it was necessary to combine three steps
in stage two, since they were believed to be too similar.
Analysis 62
7 ANALYSIS
This section aims at analysing the information gathered in section 6 Empirical Data with the theory
from section 3 Theory of Reference and answering the research questions two4 and three
5 stated in
section 4 Problem Specification. The research questions will be answered in the same order as
presented in the problem specification. The current situation of sourcing at Dynapac will at first be
analysed before all activities in the model stepwise will be analysed and customized.
7.1 CURRENT SITUATION
The first research question regarding the current state of sourcing at Dynapac will
be analysed in order to determine the situation of the company. It is necessary to
understand the current situation at Dynapac in order to be able to develop a
customized model for SBR. With the help from four sub-questions the current state of sourcing at
Dynapac will be analysed and conclusions will be drawn. At the end of the analysis of the current
situation a synthesis will be provided.
7.1.1 THE SOURCING STRATEGY AND ITS ALIGNMENT
WITH THE BUSINESS STRATEGY
As stated in the section 6 Empirical Data, the business strategy of Dynapac is mainly focused on
increasing market shares and doing so in a profitable manner with focus on cost, quality and
functionality. The sourcing strategy is focused on finding the best solution in regards to finding the
suppliers able to supply with low cost, high quality and high delivery performance.
When comparing the two strategies it becomes apparent that the sourcing strategy is aligned with the
business strategy. The reason for this is mainly due to the mutual focus on cost leadership and quality.
The Purchasing department bases their decisions mainly on these two factors and the sourcing strategy
is therefore considered to be aligned with the overall business strategy.
The sourcing strategy includes the wish to perform supplier base reduction which can be looked upon
as a step in the right direction towards increasing cost and quality awareness. Both Goffin, et al.
(1997) and Ogden (2006) presented the benefits of reduced costs and increased quality when the
supplier base is reduced. This is mainly due to the fact that closer and longer-term relationships with
the suppliers can be established (Goffin, et al., 1997). However, Cousins (1999) highlights the need for
new skills, competencies and measurement systems to be able to establish the new supplier
management style that is needed for obtaining the benefits of SBR. Without a new management style,
the effect of SBR could instead be the opposite of what is expected with increased costs and reduced
quality as result (Cousins, 1999). It is nevertheless believed to be possible to implement SBR
successfully if the critical success factors are achieved. One of the success factors, as presented by
Ogden (2006), is the need for key management support in order to avoid blockage during the
implementation. Since the action of reducing the supplier base is perceived as being in line with the
sourcing strategy as well as the business strategy, the needed support is therefore believed to be
present.
4 What is the current state of sourcing at Dynapac?
5 How can the conceptual model be customized for Dynapac?
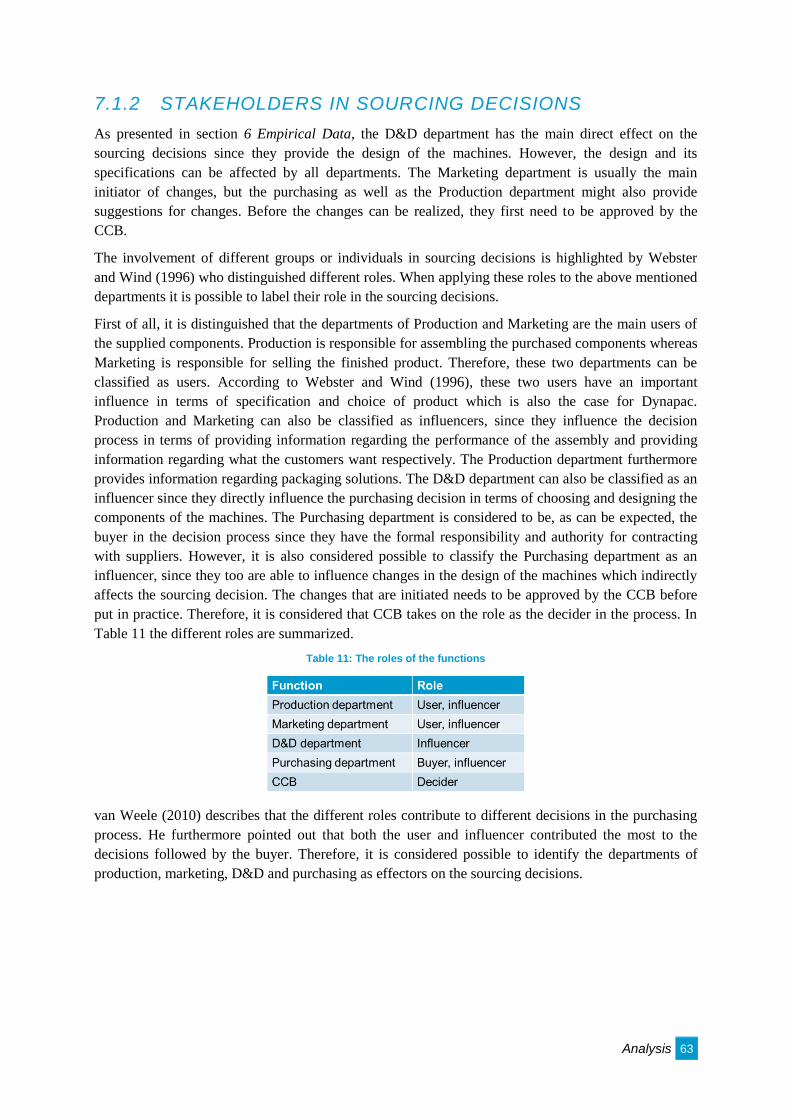
Analysis 63
7.1.2 STAKEHOLDERS IN SOURCING DECISIONS
As presented in section 6 Empirical Data, the D&D department has the main direct effect on the
sourcing decisions since they provide the design of the machines. However, the design and its
specifications can be affected by all departments. The Marketing department is usually the main
initiator of changes, but the purchasing as well as the Production department might also provide
suggestions for changes. Before the changes can be realized, they first need to be approved by the
CCB.
The involvement of different groups or individuals in sourcing decisions is highlighted by Webster
and Wind (1996) who distinguished different roles. When applying these roles to the above mentioned
departments it is possible to label their role in the sourcing decisions.
First of all, it is distinguished that the departments of Production and Marketing are the main users of
the supplied components. Production is responsible for assembling the purchased components whereas
Marketing is responsible for selling the finished product. Therefore, these two departments can be
classified as users. According to Webster and Wind (1996), these two users have an important
influence in terms of specification and choice of product which is also the case for Dynapac.
Production and Marketing can also be classified as influencers, since they influence the decision
process in terms of providing information regarding the performance of the assembly and providing
information regarding what the customers want respectively. The Production department furthermore
provides information regarding packaging solutions. The D&D department can also be classified as an
influencer since they directly influence the purchasing decision in terms of choosing and designing the
components of the machines. The Purchasing department is considered to be, as can be expected, the
buyer in the decision process since they have the formal responsibility and authority for contracting
with suppliers. However, it is also considered possible to classify the Purchasing department as an
influencer, since they too are able to influence changes in the design of the machines which indirectly
affects the sourcing decision. The changes that are initiated needs to be approved by the CCB before
put in practice. Therefore, it is considered that CCB takes on the role as the decider in the process. In
Table 11 the different roles are summarized.
Table 11: The roles of the functions
van Weele (2010) describes that the different roles contribute to different decisions in the purchasing
process. He furthermore pointed out that both the user and influencer contributed the most to the
decisions followed by the buyer. Therefore, it is considered possible to identify the departments of
production, marketing, D&D and purchasing as effectors on the sourcing decisions.
Analysis 64
The above mentioned roles contribute to all sourcing decisions. It is however considered interesting to
investigate further into one of the sourcing decisions, namely the decision regarding the choice of
supplier. This decision affects the characteristics of the supplier base, thus affecting a possible
implementation of SBR. When deciding which supplier to use, the Purchasing department has in most
cases the last call. However, for some certain components the decision was made together with the
D&D department. These components, as explained in the empirics, need to be decided on early in the
process of a new development and the decision is made together with the D&D department. The
components are so called black box items, that the suppliers have more knowledge of than Dynapac.
An explanation of this is the high level of technology and knowledge required for producing these
items.
Fisher (1976) has developed a model that can explain the reason for the need of a jointly decision in
this matter. The model is primarily comprised of two aspects, product complexity and commercial
uncertainty (Fisher, 1976). In this case, black box items hold a high level of product complexity
because of the high technology involved. Fisher (1976) stated that the higher the complexity the higher
the involvement of the engineering. Therefore, when deciding on suppliers for black box items it is
crucial to involve the D&D department and their involvement in an SBR implementation is necessary.
7.1.3 SEGMENTATION AND MANAGEMENT OF THE
SUPPLIER BASE
As described in section 6 Empirical Data, the segmentation used to categorize the supplier base is
stated to be merely based on the different commodities. No segmentation is made on the relationship
with the suppliers since all suppliers are viewed as business partners. Nevertheless, 24 critical
suppliers have been identified based on how critical the supplied product is considered to be. They
therefore receive more attention than other suppliers in terms of frequent communication regarding
their performance. However, the Purchasing department strives for maintaining a long term
relationship, a partnership, with all of their suppliers.
Two segmentation methods were described in the theory of reference. Kraljic (1983) presented a
method used for segmenting the products whereas Dyer, et al. (1998) presented a method used for
segmenting the relationships with the suppliers. When analysing the segmentation method used at
Dynapac it is possible to conclude that they base their segmentation on the products’ functionality.
This segmentation method can be compared with the method presented by Kraljic (1983) in terms of
segmenting the products. However, that is where the similarities end. Kraljic (1983) chooses to
segment the products based on the two segmentation variables profit impact and supply risk, thereby
creating four segments, whereas at Dynapac the segmentation is mainly based on functionality of the
products and in this case 72 different segments exist corresponding to the number of commodities. van
Weele (2010) further describes that each of Kraljic’s (1983) segment can be used as a basis for
deciding what type of strategy on how to manage the suppliers should be applied and presents four
different relationships. However, these types of relationships are not applied at Dynapac since the
Purchasing department strives for maintaining a long term relationship with all of their suppliers. In
hindsight, the resemblance between the portfolio method presented by Kraljic (1983) and the method
used at Dynapac is therefore considered to be slim.
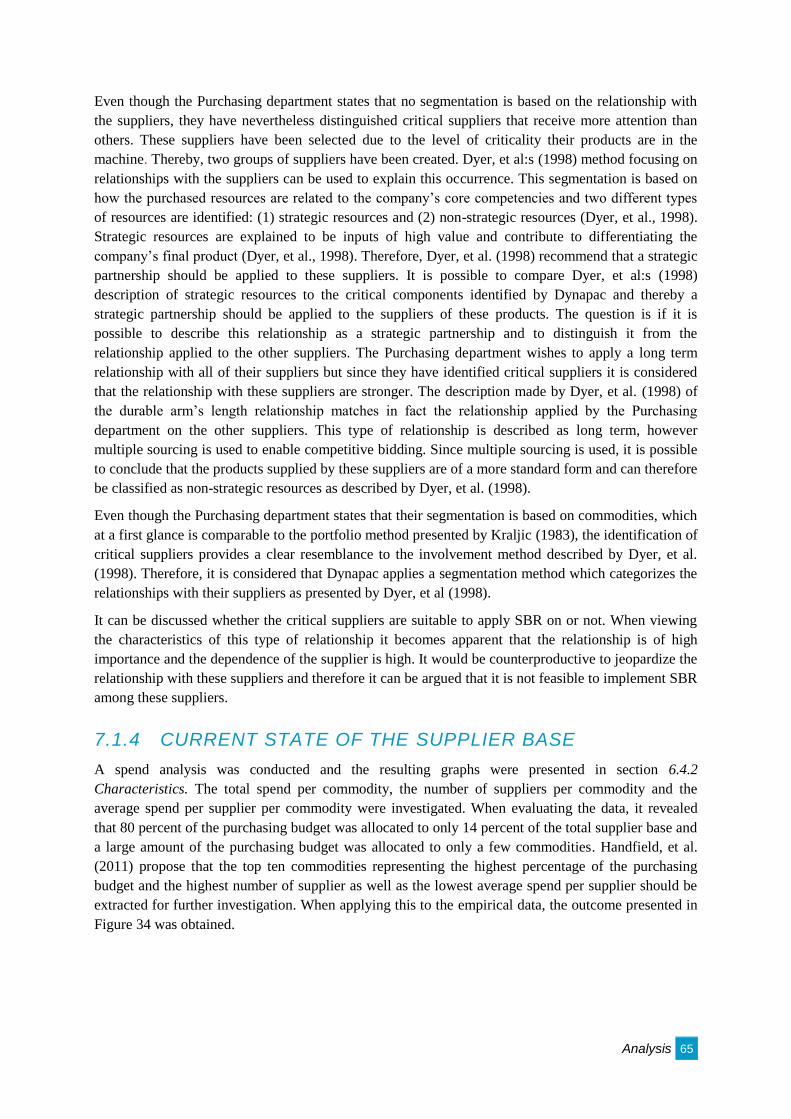
Analysis 65
Even though the Purchasing department states that no segmentation is based on the relationship with
the suppliers, they have nevertheless distinguished critical suppliers that receive more attention than
others. These suppliers have been selected due to the level of criticality their products are in the
machine. Thereby, two groups of suppliers have been created. Dyer, et al:s (1998) method focusing on
relationships with the suppliers can be used to explain this occurrence. This segmentation is based on
how the purchased resources are related to the company’s core competencies and two different types
of resources are identified: (1) strategic resources and (2) non-strategic resources (Dyer, et al., 1998).
Strategic resources are explained to be inputs of high value and contribute to differentiating the
company’s final product (Dyer, et al., 1998). Therefore, Dyer, et al. (1998) recommend that a strategic
partnership should be applied to these suppliers. It is possible to compare Dyer, et al:s (1998)
description of strategic resources to the critical components identified by Dynapac and thereby a
strategic partnership should be applied to the suppliers of these products. The question is if it is
possible to describe this relationship as a strategic partnership and to distinguish it from the
relationship applied to the other suppliers. The Purchasing department wishes to apply a long term
relationship with all of their suppliers but since they have identified critical suppliers it is considered
that the relationship with these suppliers are stronger. The description made by Dyer, et al. (1998) of
the durable arm’s length relationship matches in fact the relationship applied by the Purchasing
department on the other suppliers. This type of relationship is described as long term, however
multiple sourcing is used to enable competitive bidding. Since multiple sourcing is used, it is possible
to conclude that the products supplied by these suppliers are of a more standard form and can therefore
be classified as non-strategic resources as described by Dyer, et al. (1998).
Even though the Purchasing department states that their segmentation is based on commodities, which
at a first glance is comparable to the portfolio method presented by Kraljic (1983), the identification of
critical suppliers provides a clear resemblance to the involvement method described by Dyer, et al.
(1998). Therefore, it is considered that Dynapac applies a segmentation method which categorizes the
relationships with their suppliers as presented by Dyer, et al (1998).
It can be discussed whether the critical suppliers are suitable to apply SBR on or not. When viewing
the characteristics of this type of relationship it becomes apparent that the relationship is of high
importance and the dependence of the supplier is high. It would be counterproductive to jeopardize the
relationship with these suppliers and therefore it can be argued that it is not feasible to implement SBR
among these suppliers.
7.1.4 CURRENT STATE OF THE SUPPLIER BASE
A spend analysis was conducted and the resulting graphs were presented in section 6.4.2
Characteristics. The total spend per commodity, the number of suppliers per commodity and the
average spend per supplier per commodity were investigated. When evaluating the data, it revealed
that 80 percent of the purchasing budget was allocated to only 14 percent of the total supplier base and
a large amount of the purchasing budget was allocated to only a few commodities. Handfield, et al.
(2011) propose that the top ten commodities representing the highest percentage of the purchasing
budget and the highest number of supplier as well as the lowest average spend per supplier should be
extracted for further investigation. When applying this to the empirical data, the outcome presented in
Figure 34 was obtained.
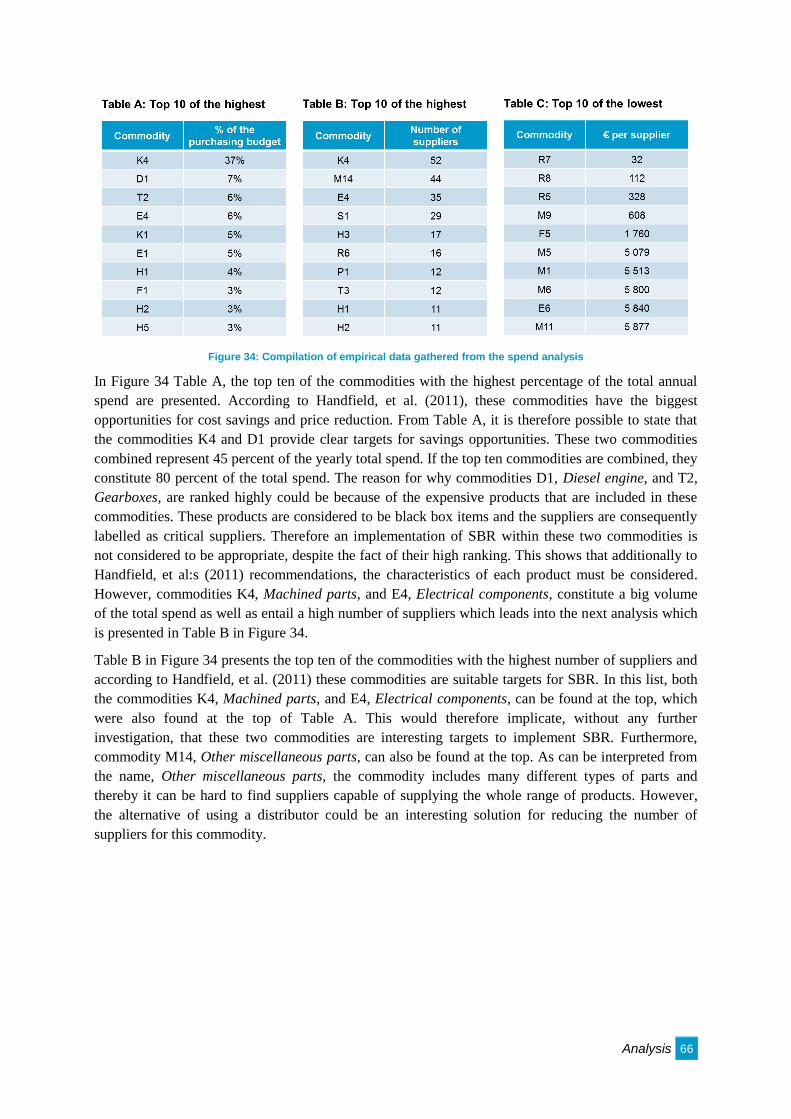
Analysis 66
Figure 34: Compilation of empirical data gathered from the spend analysis
In Figure 34 Table A, the top ten of the commodities with the highest percentage of the total annual
spend are presented. According to Handfield, et al. (2011), these commodities have the biggest
opportunities for cost savings and price reduction. From Table A, it is therefore possible to state that
the commodities K4 and D1 provide clear targets for savings opportunities. These two commodities
combined represent 45 percent of the yearly total spend. If the top ten commodities are combined, they
constitute 80 percent of the total spend. The reason for why commodities D1, Diesel engine, and T2,
Gearboxes, are ranked highly could be because of the expensive products that are included in these
commodities. These products are considered to be black box items and the suppliers are consequently
labelled as critical suppliers. Therefore an implementation of SBR within these two commodities is
not considered to be appropriate, despite the fact of their high ranking. This shows that additionally to
Handfield, et al:s (2011) recommendations, the characteristics of each product must be considered.
However, commodities K4, Machined parts, and E4, Electrical components, constitute a big volume
of the total spend as well as entail a high number of suppliers which leads into the next analysis which
is presented in Table B in Figure 34.
Table B in Figure 34 presents the top ten of the commodities with the highest number of suppliers and
according to Handfield, et al. (2011) these commodities are suitable targets for SBR. In this list, both
the commodities K4, Machined parts, and E4, Electrical components, can be found at the top, which
were also found at the top of Table A. This would therefore implicate, without any further
investigation, that these two commodities are interesting targets to implement SBR. Furthermore,
commodity M14, Other miscellaneous parts, can also be found at the top. As can be interpreted from
the name, Other miscellaneous parts, the commodity includes many different types of parts and
thereby it can be hard to find suppliers capable of supplying the whole range of products. However,
the alternative of using a distributor could be an interesting solution for reducing the number of
suppliers for this commodity.
Analysis 67
Furthermore, Table C in Figure 34 presents the top ten commodities with the lowest average spend per
supplier per commodity. According to Handfield, et al. (2011), a low spend per supplier is an
indication of too many suppliers being used for supplying products in that particular commodity.
Interestingly, the commodities listed in Table C in Figure 34 have not been listed in either Table A or
Table B before. A further investigation of the two commodities R7, Other sealing, and R8, Plastic
tanks, which are ranked highly in Table C in Figure 34, revealed that R7 has the lowest total yearly
spend followed by R8. Moreover, R7 only contains two suppliers whereas R8 only contains one
supplier. Handfield, et al:s (2011) statement regarding how a low spend per supplier is an indication of
too many supplier can thereby be misleading in the case of when a commodity has a low total spend as
well as a low number of suppliers. However, R7 should still be investigated to see if a reduction to
only one supplier is possible. A further inspection of the whole list in Table C in Figure 34 revealed
that the commodities R5, Gaskets and O-rings, F5, Drivers cabs others, and M1, Labels, all contained
around seven suppliers and are therefore possible targets for SBR. Handfield, et al:s (2011) statement
regarding how a low spend per supplier is an indication of too many supplier is nevertheless important
to investigate and it clearly highlights opportunities for SBR which otherwise is easy to miss.
Handfield, et al:s (2011) guidelines for finding opportunities for SBR are useful and helpful. By
extracting the top ten commodities of the highest percentage of the purchasing budget and the highest
number of supplier as well as the lowest average spend per supplier, it is possible to get a quick
overview of the current state of the supplier base and to find possible targets for SBR. However, as
earlier described, the Handfield, et al:s (2011) statements are not always applicable and the
characteristics of each product need to be taken into consideration when deciding on targets for SBR.
7.2 CUSTOMIZED MODEL
The conceptual model was developed in section 4 Problem Specification and an
overview of the model can be seen in Figure 22 in the same section. At first the
model will be analysed on an overall level in accordance with the first sub-question stated in section 4
Problem Specification. Thereafter, each activity will be analysed separately in order to determine how
the activities can be customized for Dynapac, consistent with sub-question two. Before each activity
analysis, a short description of the activity as well as an introduction of what will be customised will
be presented. The resulting customized model will be presented at the end of this section.
7.2.1 RELEVANT ACTIVITIES FOR DYNAPAC
The overall view on the conceptual model was positive and from the rating regarding necessity it is
possible to state that all proposed activities were considered to be relevant to include in the model. It
was not considered necessary to include more activities. In fact, a few comments were raised during
both workshops regarding the possibility of combining several activities into one activity. This action
concerned the three steps Identify suppliers for elimination, Rank suppliers for elimination and Target
suppliers for elimination from the Framework development phase. They were believed to be similar
enough to enable such combination. Another possible change was raised during the second workshop
concerning the inclusion of an additional step to stage three regarding initial sample testing and
implementation of a new supplier including auditing. This change has been taken into consideration
when designing the activities and it has been concluded unnecessary to add another activity for this
step. This is mainly due to the limitation of not describing the process of targeting new suppliers but
also because of the possibility of including parts of these steps in the activity Target suppliers for
selection.
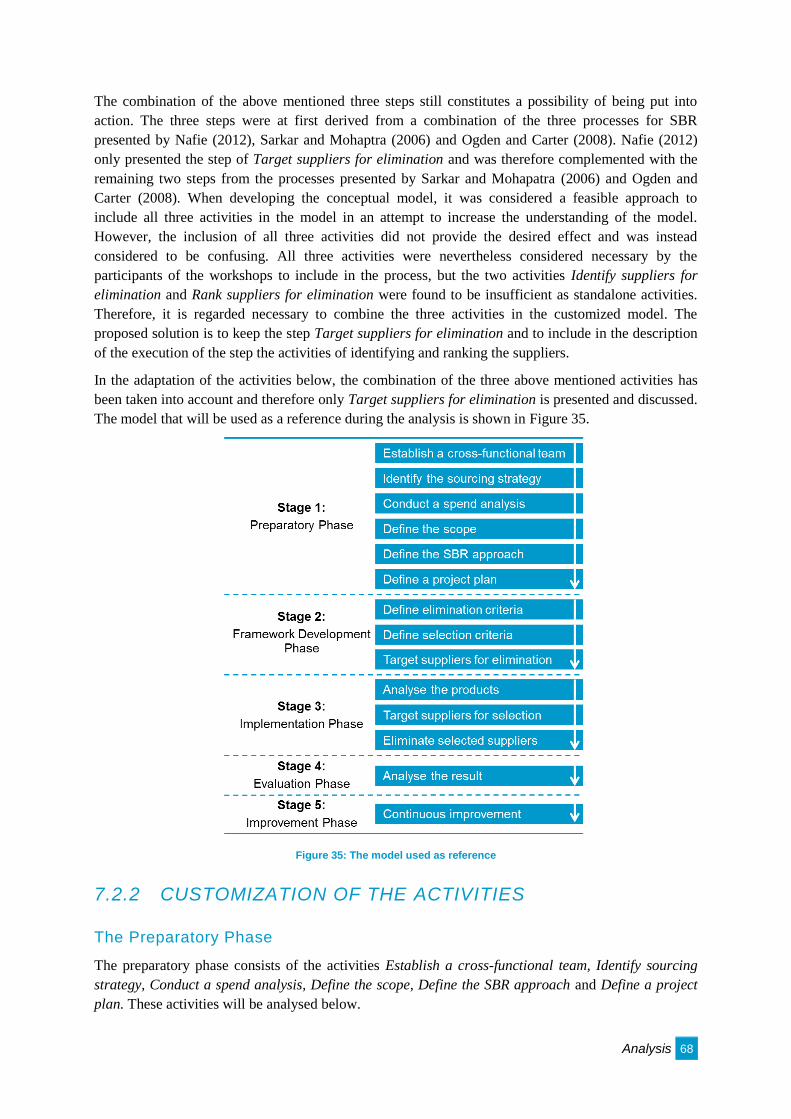
Analysis 68
The combination of the above mentioned three steps still constitutes a possibility of being put into
action. The three steps were at first derived from a combination of the three processes for SBR
presented by Nafie (2012), Sarkar and Mohaptra (2006) and Ogden and Carter (2008). Nafie (2012)
only presented the step of Target suppliers for elimination and was therefore complemented with the
remaining two steps from the processes presented by Sarkar and Mohapatra (2006) and Ogden and
Carter (2008). When developing the conceptual model, it was considered a feasible approach to
include all three activities in the model in an attempt to increase the understanding of the model.
However, the inclusion of all three activities did not provide the desired effect and was instead
considered to be confusing. All three activities were nevertheless considered necessary by the
participants of the workshops to include in the process, but the two activities Identify suppliers for
elimination and Rank suppliers for elimination were found to be insufficient as standalone activities.
Therefore, it is regarded necessary to combine the three activities in the customized model. The
proposed solution is to keep the step Target suppliers for elimination and to include in the description
of the execution of the step the activities of identifying and ranking the suppliers.
In the adaptation of the activities below, the combination of the three above mentioned activities has
been taken into account and therefore only Target suppliers for elimination is presented and discussed.
The model that will be used as a reference during the analysis is shown in Figure 35.
Figure 35: The model used as reference
7.2.2 CUSTOMIZATION OF THE ACTIVITIES
The Preparatory Phase
The preparatory phase consists of the activities Establish a cross-functional team, Identify sourcing
strategy, Conduct a spend analysis, Define the scope, Define the SBR approach and Define a project
plan. These activities will be analysed below.
Analysis 69
Establish a cross-functional team
In the activity Establish a cross-functional team, the people that will be involved in the SBR project
will be chosen to be part of a team. A project leader amongst the team members will also be selected.
To be able to customize the activity to Dynapac, an analysis regarding which functions are essential to
include in the team is needed. This analysis will therefore be provided below.
The activity Establish a cross-functional team received the lowest rating regarding the variable
necessity in both workshops. In the first workshop with the purchasers, it was expressed that a cross-
functional team was not necessary and the responsibility for the project should lie within the
Purchasing department. The involvement of D&D and Marketing department was only seen as
necessary for some special commodities. In the second workshop with the team leaders, the activity
also received the lowest score among all activities regarding necessity. It was nevertheless a high score
with an average 4,0 and the activity was therefore considered to be highly relevant. In the second
workshop it was also expressed that the Purchasing department should have the main responsibility
and that the cross-functional team should include D&D and if necessary the Production department.
Based on the two workshops, the opinions regarding the necessity were diverse but there was a
common opinion of where the main responsibility should lie.
This activity has been highly emphasized in the literature and both Nafie (2012) and Ogden and
Carter (2008) include this activity in their processes for implementing SBR, with the aim to involve
important stakeholders, gather vital information and create a commitment across different
departments. Furthermore, Ogden (2006) and Handfield, et al. (2011) highlight the cross-functional
team as a critical factor for achieving a successful implementation of SBR. Even though some of the
comments regarding establishing a cross-functional team were not in line with the theory it is
nevertheless considered important to include this activity in order to not lose the positive effects
induced by a cross-functional team. In the second workshop the activity was consider to be vital and a
means to get affected department committed to the project, which strengthens and Ogden and Carter
(2008) statement regarding commitment.
By combining the empirical data and the theory, it is considered that a cross-functional team should be
established. In both workshops, the D&D department was distinguished as the key player and the other
departments were only seen as necessary for some occasions. The cross-functional team that will
actively work on the project should therefore consist of the Purchasing and the D&D department
where the Purchasing department should be assigned the main responsible and a purchaser should
thereby be assigned project leader. In additional, to get the valuable cross-functional effects, persons
from the other involved departments, Marketing and Production, should get assigned responsibility
related to the SBR project but not actively be involved in the project. According to Ogden (2006),
stakeholders are more likely to approve changes when they have input in shaping the changes and
therefore by establishing a cross-functional team and assigning responsibilities to the other less
involved departments they will more likely become committed to the SBR project and assist when
needed.
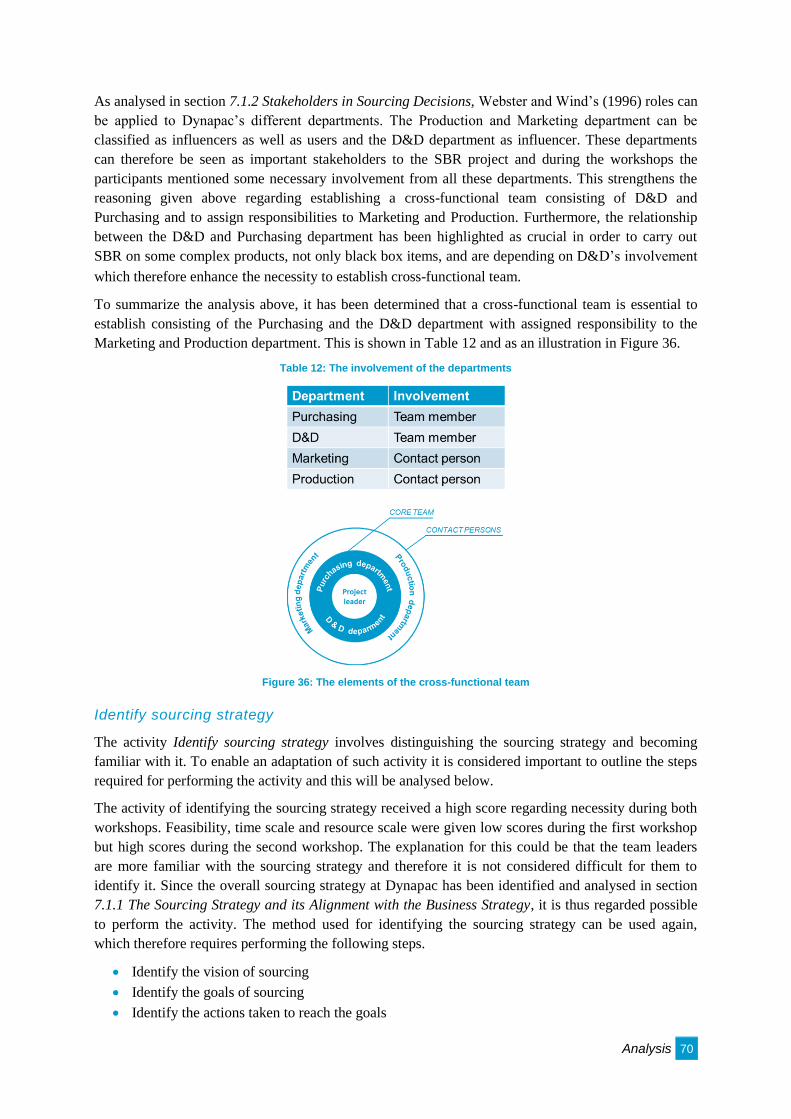
Analysis 70
As analysed in section 7.1.2 Stakeholders in Sourcing Decisions, Webster and Wind’s (1996) roles can
be applied to Dynapac’s different departments. The Production and Marketing department can be
classified as influencers as well as users and the D&D department as influencer. These departments
can therefore be seen as important stakeholders to the SBR project and during the workshops the
participants mentioned some necessary involvement from all these departments. This strengthens the
reasoning given above regarding establishing a cross-functional team consisting of D&D and
Purchasing and to assign responsibilities to Marketing and Production. Furthermore, the relationship
between the D&D and Purchasing department has been highlighted as crucial in order to carry out
SBR on some complex products, not only black box items, and are depending on D&D’s involvement
which therefore enhance the necessity to establish cross-functional team.
To summarize the analysis above, it has been determined that a cross-functional team is essential to
establish consisting of the Purchasing and the D&D department with assigned responsibility to the
Marketing and Production department. This is shown in Table 12 and as an illustration in Figure 36.
Table 12: The involvement of the departments
Figure 36: The elements of the cross-functional team
Identify sourcing strategy
The activity Identify sourcing strategy involves distinguishing the sourcing strategy and becoming
familiar with it. To enable an adaptation of such activity it is considered important to outline the steps
required for performing the activity and this will be analysed below.
The activity of identifying the sourcing strategy received a high score regarding necessity during both
workshops. Feasibility, time scale and resource scale were given low scores during the first workshop
but high scores during the second workshop. The explanation for this could be that the team leaders
are more familiar with the sourcing strategy and therefore it is not considered difficult for them to
identify it. Since the overall sourcing strategy at Dynapac has been identified and analysed in section
7.1.1 The Sourcing Strategy and its Alignment with the Business Strategy, it is thus regarded possible
to perform the activity. The method used for identifying the sourcing strategy can be used again,
which therefore requires performing the following steps.
Identify the vision of sourcing
Identify the goals of sourcing
Identify the actions taken to reach the goals
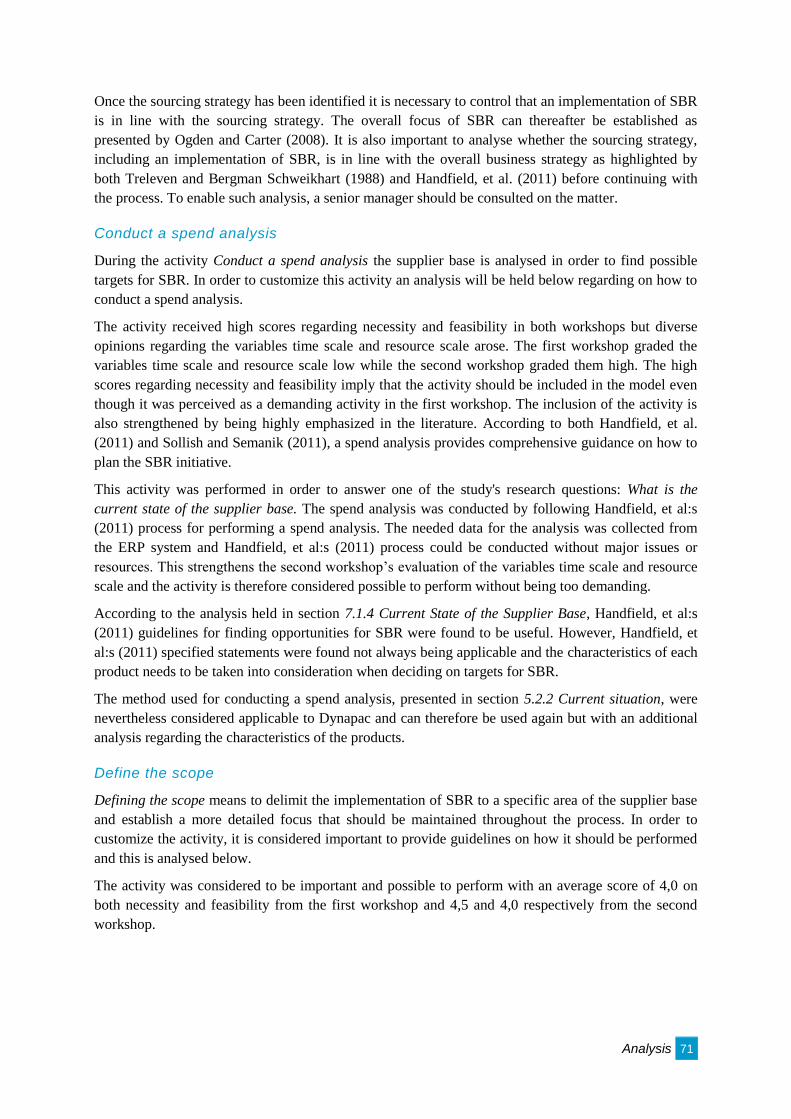
Analysis 71
Once the sourcing strategy has been identified it is necessary to control that an implementation of SBR
is in line with the sourcing strategy. The overall focus of SBR can thereafter be established as
presented by Ogden and Carter (2008). It is also important to analyse whether the sourcing strategy,
including an implementation of SBR, is in line with the overall business strategy as highlighted by
both Treleven and Bergman Schweikhart (1988) and Handfield, et al. (2011) before continuing with
the process. To enable such analysis, a senior manager should be consulted on the matter.
Conduct a spend analysis
During the activity Conduct a spend analysis the supplier base is analysed in order to find possible
targets for SBR. In order to customize this activity an analysis will be held below regarding on how to
conduct a spend analysis.
The activity received high scores regarding necessity and feasibility in both workshops but diverse
opinions regarding the variables time scale and resource scale arose. The first workshop graded the
variables time scale and resource scale low while the second workshop graded them high. The high
scores regarding necessity and feasibility imply that the activity should be included in the model even
though it was perceived as a demanding activity in the first workshop. The inclusion of the activity is
also strengthened by being highly emphasized in the literature. According to both Handfield, et al.
(2011) and Sollish and Semanik (2011), a spend analysis provides comprehensive guidance on how to
plan the SBR initiative.
This activity was performed in order to answer one of the study's research questions: What is the
current state of the supplier base. The spend analysis was conducted by following Handfield, et al:s
(2011) process for performing a spend analysis. The needed data for the analysis was collected from
the ERP system and Handfield, et al:s (2011) process could be conducted without major issues or
resources. This strengthens the second workshop’s evaluation of the variables time scale and resource
scale and the activity is therefore considered possible to perform without being too demanding.
According to the analysis held in section 7.1.4 Current State of the Supplier Base, Handfield, et al:s
(2011) guidelines for finding opportunities for SBR were found to be useful. However, Handfield, et
al:s (2011) specified statements were found not always being applicable and the characteristics of each
product needs to be taken into consideration when deciding on targets for SBR.
The method used for conducting a spend analysis, presented in section 5.2.2 Current situation, were
nevertheless considered applicable to Dynapac and can therefore be used again but with an additional
analysis regarding the characteristics of the products.
Define the scope
Defining the scope means to delimit the implementation of SBR to a specific area of the supplier base
and establish a more detailed focus that should be maintained throughout the process. In order to
customize the activity, it is considered important to provide guidelines on how it should be performed
and this is analysed below.
The activity was considered to be important and possible to perform with an average score of 4,0 on
both necessity and feasibility from the first workshop and 4,5 and 4,0 respectively from the second
workshop.
Analysis 72
Nafie (2012) stresses on the possibility of defining the scope by using the result from the spend
analysis as basis whereas Ogden and Carter (2008) emphasize that the focus should be derived from
the sourcing strategy. When asking the participants which areas of the supplier base, regarding direct
martial, could be of interest particular steel components and so called B- and C-material (components
with high volume but low cost) were the response from both workshops. When examining the spend
analysis conducted in this study it is possible to see that K4, Steel components, constitute both the
commodity with the highest percentage of the total annual spend and the highest number of suppliers
and can therefore be analysed as suitable for SBR as proposed by Nafie (2012). As analysed in section
7.1.4 Current State of the Supplier Base, K4, Steel components, would moreover provide clear targets
for savings opportunities, and the action of implementing SBR among these components would
therefore also be in line with the sourcing strategy, as proposed by Ogden and Carter (2008).
As demonstrated above it is possible to derive the scope from both the spend analysis and the sourcing
strategy and can be used to strengthen a particular feeling about feasible scopes for SBR. It is therefore
considered necessary to use both aspects from the spend analysis and sourcing strategy when
determining the scope and combine it with existing knowledge and experience of the supplier base. An
illustration of the activity can be seen in Figure 37.
Figure 37: Illustration of how to define the scope
Define the SBR approach
When defining the SBR approach, the wanted approach for the process is chosen. As presented by
Ogden and Carter (2008), it is possible to combine several approaches and therefore the choice is not
limited to only one approach. To customize this activity, it is regarded important to analyse which
approaches and in which order they can be performed at Dynapac. The customization of how the
approaches should be performed is connected with the activity Analyse product and will therefore be
presented in the analysis of that activity instead.
The activity Define the SBR approach was considered essential but time- and resource-consuming by
the participants. This is consistent with what is brought up in the theory of reference. As mentioned,
several different approaches exist and according to Ogden and Carter (2008) the approaches need to be
analysed before the choice can be made. The approaches can also be combined, resulting in several
different choices that need to be taken into consideration, thus complicating the decision of SBR
approach.
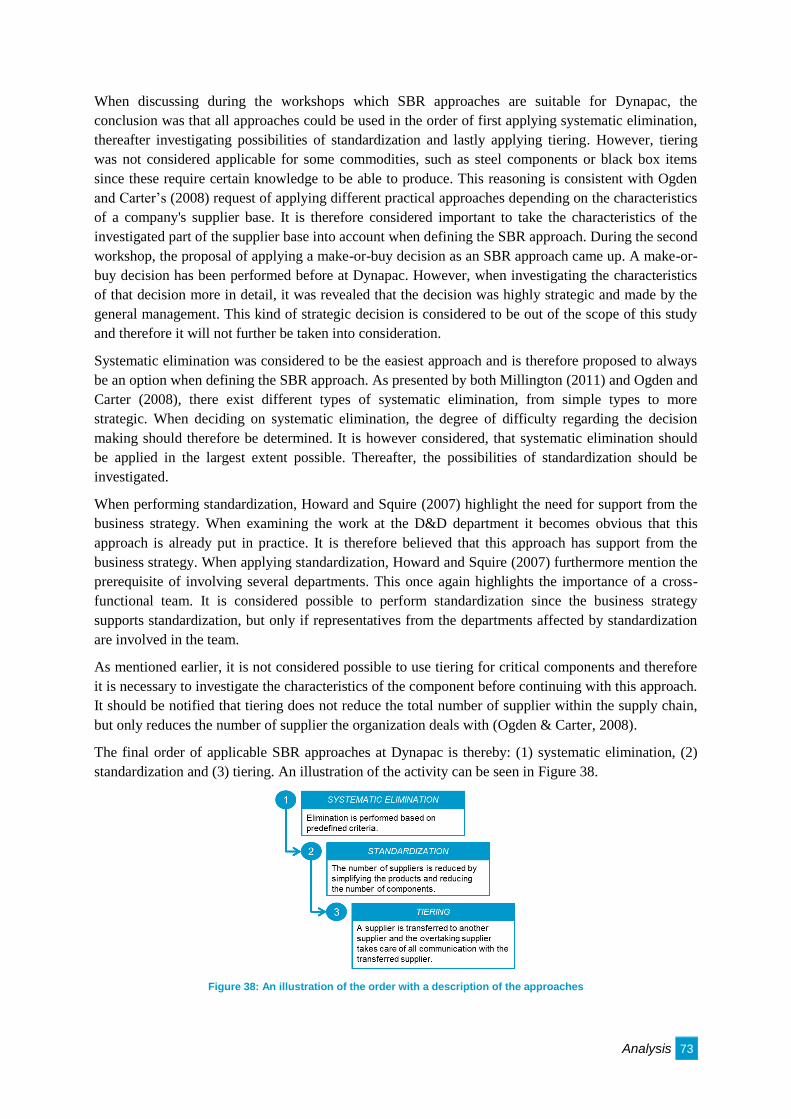
Analysis 73
When discussing during the workshops which SBR approaches are suitable for Dynapac, the
conclusion was that all approaches could be used in the order of first applying systematic elimination,
thereafter investigating possibilities of standardization and lastly applying tiering. However, tiering
was not considered applicable for some commodities, such as steel components or black box items
since these require certain knowledge to be able to produce. This reasoning is consistent with Ogden
and Carter’s (2008) request of applying different practical approaches depending on the characteristics
of a company's supplier base. It is therefore considered important to take the characteristics of the
investigated part of the supplier base into account when defining the SBR approach. During the second
workshop, the proposal of applying a make-or-buy decision as an SBR approach came up. A make-or-
buy decision has been performed before at Dynapac. However, when investigating the characteristics
of that decision more in detail, it was revealed that the decision was highly strategic and made by the
general management. This kind of strategic decision is considered to be out of the scope of this study
and therefore it will not further be taken into consideration.
Systematic elimination was considered to be the easiest approach and is therefore proposed to always
be an option when defining the SBR approach. As presented by both Millington (2011) and Ogden and
Carter (2008), there exist different types of systematic elimination, from simple types to more
strategic. When deciding on systematic elimination, the degree of difficulty regarding the decision
making should therefore be determined. It is however considered, that systematic elimination should
be applied in the largest extent possible. Thereafter, the possibilities of standardization should be
investigated.
When performing standardization, Howard and Squire (2007) highlight the need for support from the
business strategy. When examining the work at the D&D department it becomes obvious that this
approach is already put in practice. It is therefore believed that this approach has support from the
business strategy. When applying standardization, Howard and Squire (2007) furthermore mention the
prerequisite of involving several departments. This once again highlights the importance of a cross-
functional team. It is considered possible to perform standardization since the business strategy
supports standardization, but only if representatives from the departments affected by standardization
are involved in the team.
As mentioned earlier, it is not considered possible to use tiering for critical components and therefore
it is necessary to investigate the characteristics of the component before continuing with this approach.
It should be notified that tiering does not reduce the total number of supplier within the supply chain,
but only reduces the number of supplier the organization deals with (Ogden & Carter, 2008).
The final order of applicable SBR approaches at Dynapac is thereby: (1) systematic elimination, (2)
standardization and (3) tiering. An illustration of the activity can be seen in Figure 38.
Figure 38: An illustration of the order with a description of the approaches
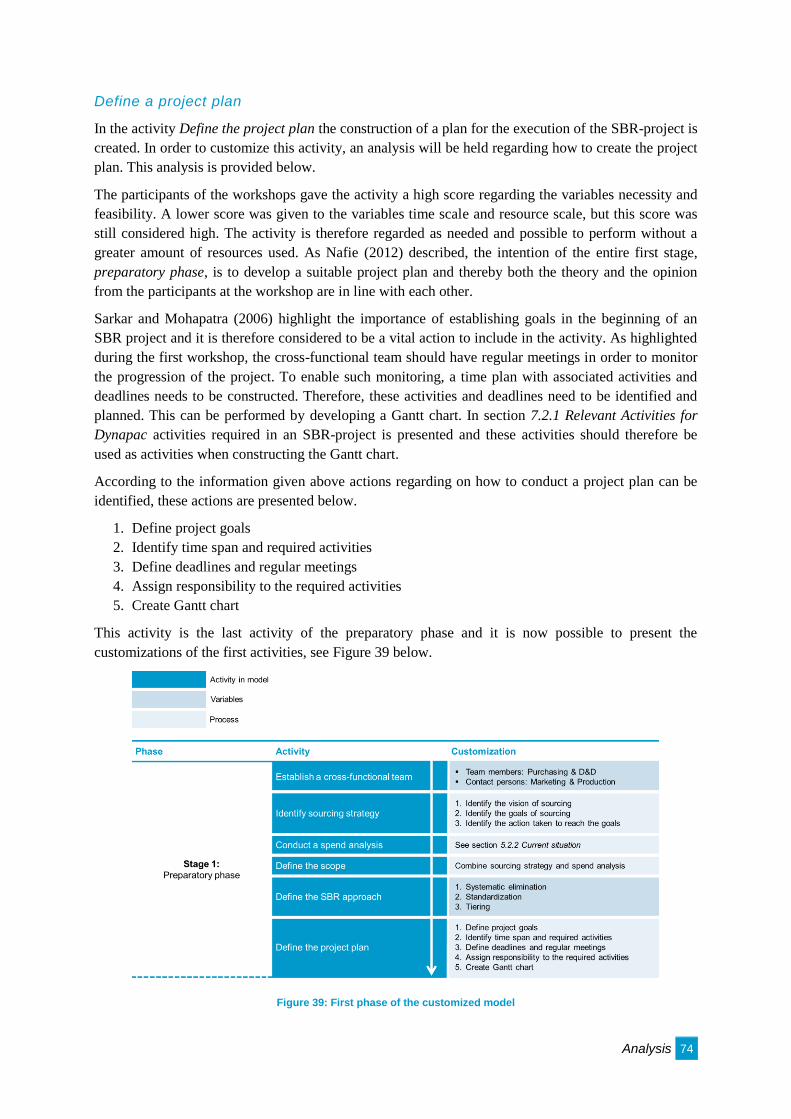
Analysis 74
Define a project plan
In the activity Define the project plan the construction of a plan for the execution of the SBR-project is
created. In order to customize this activity, an analysis will be held regarding how to create the project
plan. This analysis is provided below.
The participants of the workshops gave the activity a high score regarding the variables necessity and
feasibility. A lower score was given to the variables time scale and resource scale, but this score was
still considered high. The activity is therefore regarded as needed and possible to perform without a
greater amount of resources used. As Nafie (2012) described, the intention of the entire first stage,
preparatory phase, is to develop a suitable project plan and thereby both the theory and the opinion
from the participants at the workshop are in line with each other.
Sarkar and Mohapatra (2006) highlight the importance of establishing goals in the beginning of an
SBR project and it is therefore considered to be a vital action to include in the activity. As highlighted
during the first workshop, the cross-functional team should have regular meetings in order to monitor
the progression of the project. To enable such monitoring, a time plan with associated activities and
deadlines needs to be constructed. Therefore, these activities and deadlines need to be identified and
planned. This can be performed by developing a Gantt chart. In section 7.2.1 Relevant Activities for
Dynapac activities required in an SBR-project is presented and these activities should therefore be
used as activities when constructing the Gantt chart.
According to the information given above actions regarding on how to conduct a project plan can be
identified, these actions are presented below.
1. Define project goals
2. Identify time span and required activities
3. Define deadlines and regular meetings
4. Assign responsibility to the required activities
5. Create Gantt chart
This activity is the last activity of the preparatory phase and it is now possible to present the
customizations of the first activities, see Figure 39 below.
Figure 39: First phase of the customized model
Analysis 75
The Framework Development Phase
The framework development phase consists of the activities Define elimination criteria, Define
selection criteria and Target suppliers for elimination. These activities will be analysed below.
Define elimination criteria
The activity Define elimination criteria is intended to specify the criteria used for identifying suppliers
for elimination by designating values and establishing limits for the criteria. These criteria can
thereafter be used in the different activities in the model as guidelines on how to target suppliers for
elimination. How to identify and use the criteria will be explained in the analysis of the associated
activity. To enable the execution of the activity Define elimination criteria it is needed to analyse
which criteria will be used at Dynapac.
The activity received one of the highest scores regarding necessity and feasibility but interestingly the
activity also received one of the lowest scores regarding time and resource scale. This implies that the
activity is vital to the model but hard to perform. Nevertheless, during the workshop the participants
could easily mention elimination criteria suitable for Dynapac and thereby the low scores regarding
time and resource scale might be misleading and inaccurate. Due to the high score regarding relevance
from the participants, their view is in accordance with the theory. This activity has been highly
emphasized in the literature and according to Sollish and Semanik (2011) a company needs to identify
criteria in order to determine which suppliers should be targeted for elimination.
The different elimination criteria which have been highlighted in the literature by several authors are:
performance, capability, trust and commitment, annual spent, number of products, standard products
and geographical location. The elimination criteria raised during the workshop discussions were
turnover, delivery performance, quality, complexity, number of products and supply risk. Turnover is
described as the turnover per supplier on a twelve months basis, delivery performance describes the
delivery performance of each supplier, quality measures the PPM per suppliers, complexity describes
the complexity of a certain product, number of products is the number of parts supplied by each
supplier and supply risk focuses on estimating the risk associated with a specific supplier. When
comparing the elimination criteria mentioned in the theory and the ones raised during the workshops,
several elimination criteria were found to be equivalent.
When the participants of the workshop were asked to rank the raised elimination criteria, the criteria
regarding Turnover, Delivery performance and Quality were placed at the top. From the analysis in
section 7.1.1 The Sourcing Strategy and its Alignment with the Business Strategy it was highlighted
that the sourcing strategy revolves around three important factors: cost, quality and delivery
performance. There is thereby a strong connection between the three criteria turnover, quality and
delivery performance and the sourcing strategy. These criteria have also been raised by several authors
in terms of annual spent and performance. Thereby it is considered necessary to include Turnover,
Delivery performance and Quality in the list of elimination criterion.
The criterion standard product mentioned by Sollish and Semanik (2011) is considered to be
associated with the level of complexity of a product. This criterion can thereby be linked to the
criterion Complexity which was mentioned during a workshop and will therefore be added to the list of
elimination criteria. The criterion number of products can also be associated with what is brought up
by several authors as a suitable criterion for elimination. It also received a high ranking by the
participants during the first workshop. This is considered sufficient in order to include it as an
elimination criterion and therefore Number of products is also included in the list.
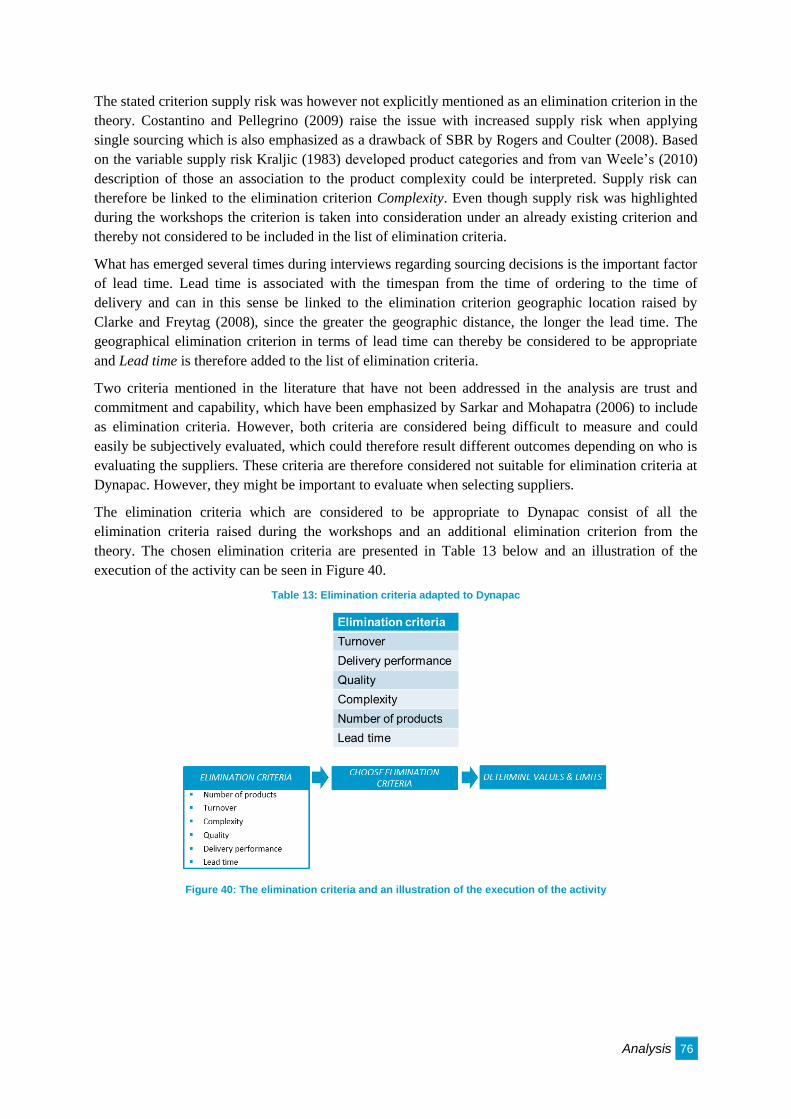
Analysis 76
The stated criterion supply risk was however not explicitly mentioned as an elimination criterion in the
theory. Costantino and Pellegrino (2009) raise the issue with increased supply risk when applying
single sourcing which is also emphasized as a drawback of SBR by Rogers and Coulter (2008). Based
on the variable supply risk Kraljic (1983) developed product categories and from van Weele’s (2010)
description of those an association to the product complexity could be interpreted. Supply risk can
therefore be linked to the elimination criterion Complexity. Even though supply risk was highlighted
during the workshops the criterion is taken into consideration under an already existing criterion and
thereby not considered to be included in the list of elimination criteria.
What has emerged several times during interviews regarding sourcing decisions is the important factor
of lead time. Lead time is associated with the timespan from the time of ordering to the time of
delivery and can in this sense be linked to the elimination criterion geographic location raised by
Clarke and Freytag (2008), since the greater the geographic distance, the longer the lead time. The
geographical elimination criterion in terms of lead time can thereby be considered to be appropriate
and Lead time is therefore added to the list of elimination criteria.
Two criteria mentioned in the literature that have not been addressed in the analysis are trust and
commitment and capability, which have been emphasized by Sarkar and Mohapatra (2006) to include
as elimination criteria. However, both criteria are considered being difficult to measure and could
easily be subjectively evaluated, which could therefore result different outcomes depending on who is
evaluating the suppliers. These criteria are therefore considered not suitable for elimination criteria at
Dynapac. However, they might be important to evaluate when selecting suppliers.
The elimination criteria which are considered to be appropriate to Dynapac consist of all the
elimination criteria raised during the workshops and an additional elimination criterion from the
theory. The chosen elimination criteria are presented in Table 13 below and an illustration of the
execution of the activity can be seen in Figure 40.
Table 13: Elimination criteria adapted to Dynapac
Figure 40: The elimination criteria and an illustration of the execution of the activity
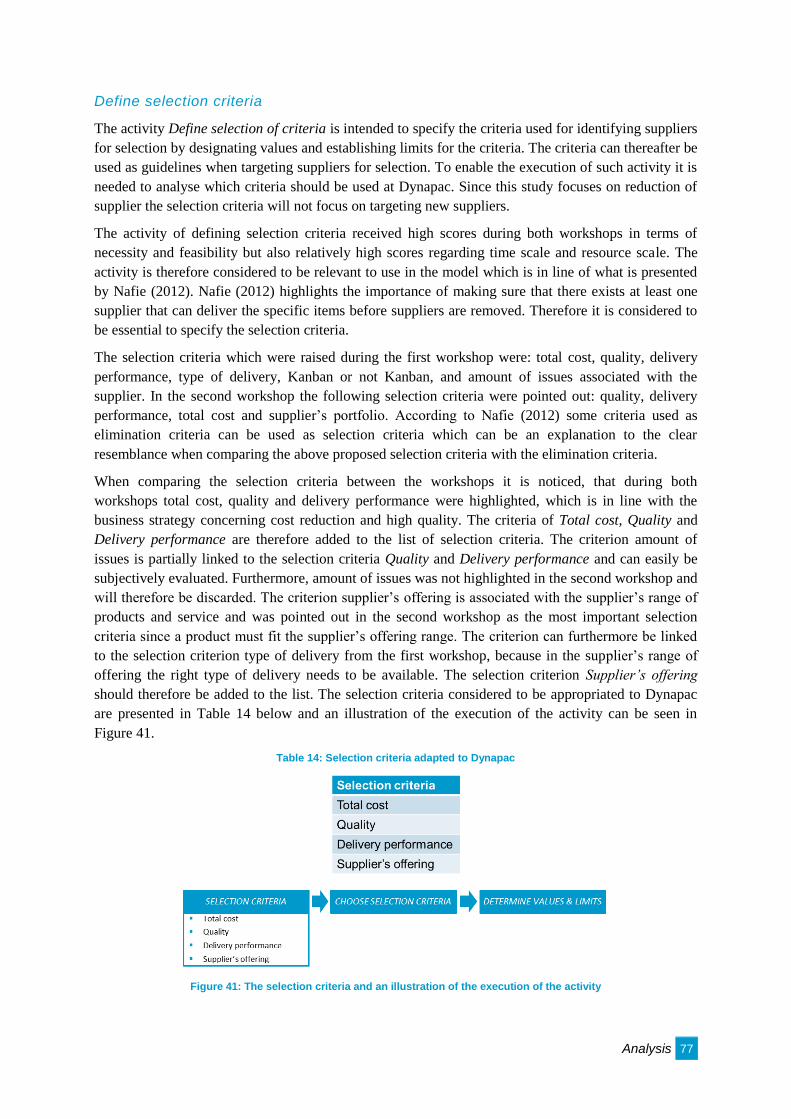
Analysis 77
Define selection criteria
The activity Define selection of criteria is intended to specify the criteria used for identifying suppliers
for selection by designating values and establishing limits for the criteria. The criteria can thereafter be
used as guidelines when targeting suppliers for selection. To enable the execution of such activity it is
needed to analyse which criteria should be used at Dynapac. Since this study focuses on reduction of
supplier the selection criteria will not focus on targeting new suppliers.
The activity of defining selection criteria received high scores during both workshops in terms of
necessity and feasibility but also relatively high scores regarding time scale and resource scale. The
activity is therefore considered to be relevant to use in the model which is in line of what is presented
by Nafie (2012). Nafie (2012) highlights the importance of making sure that there exists at least one
supplier that can deliver the specific items before suppliers are removed. Therefore it is considered to
be essential to specify the selection criteria.
The selection criteria which were raised during the first workshop were: total cost, quality, delivery
performance, type of delivery, Kanban or not Kanban, and amount of issues associated with the
supplier. In the second workshop the following selection criteria were pointed out: quality, delivery
performance, total cost and supplier’s portfolio. According to Nafie (2012) some criteria used as
elimination criteria can be used as selection criteria which can be an explanation to the clear
resemblance when comparing the above proposed selection criteria with the elimination criteria.
When comparing the selection criteria between the workshops it is noticed, that during both
workshops total cost, quality and delivery performance were highlighted, which is in line with the
business strategy concerning cost reduction and high quality. The criteria of Total cost, Quality and
Delivery performance are therefore added to the list of selection criteria. The criterion amount of
issues is partially linked to the selection criteria Quality and Delivery performance and can easily be
subjectively evaluated. Furthermore, amount of issues was not highlighted in the second workshop and
will therefore be discarded. The criterion supplier’s offering is associated with the supplier’s range of
products and service and was pointed out in the second workshop as the most important selection
criteria since a product must fit the supplier’s offering range. The criterion can furthermore be linked
to the selection criterion type of delivery from the first workshop, because in the supplier’s range of
offering the right type of delivery needs to be available. The selection criterion Supplier’s offering
should therefore be added to the list. The selection criteria considered to be appropriated to Dynapac
are presented in Table 14 below and an illustration of the execution of the activity can be seen in
Figure 41.
Table 14: Selection criteria adapted to Dynapac
Figure 41: The selection criteria and an illustration of the execution of the activity
Analysis 78
Target suppliers for elimination
As mentioned earlier, the change of combining the activities Identify suppliers for elimination, Rank
suppliers for elimination and Target suppliers for elimination was brought up during the workshops.
Therefore the three steps have been combined into one, which is Target suppliers for elimination. The
activity therefore contains the action of localizing suitable suppliers for elimination and choosing a
number of suppliers for further analysis. In order to enable a customization, an analysis regarding how
the activity should be performed will be held below.
According to both Nafie (2012) and Ogden and Carter (2008), the elimination criteria will help to
identify possible suppliers for elimination and create a preliminary list of targeted suppliers for
elimination that requires further actions or deeper analysis. To easily locate targetable suppliers it is
considered beneficial to create such list, however it is not considered feasible to apply all defined
elimination criteria to determine the first group of suppliers. Seven criteria have been defined and if all
were to be applied, a too complex analysis will be needed in order to identify suitable suppliers for
elimination. It is therefore proposed that two criteria will be applied to create the first list of suppliers.
The criteria Turnover and Number of parts are regarded suitable for the first screening of suppliers.
The data on Turnover and Number of parts provide an easy filtering option that can be seen as
appropriate to use in this case. This type of data can also be considered to be of an objective character
and therefore suitable for a first screening.
As explained by Nafie (2012), the list of suppliers can firstly be used to preliminary eliminate inactive
suppliers. If this action has not already taken place when performing the spend analysis, this can
therefore be performed during this activity. Before active suppliers are targeted for elimination, Sarkar
and Mohapatra (2006) describe the need for ranking the suppliers against each other based on experts’
opinions. The ranked list can thereafter be used as decision support for performing the next stage of
screening of suppliers (Sarkar & Mohapatra, 2006). When asked during the workshops how the
suppliers should be ranked, the response was to rank the suppliers in terms of the proposed elimination
criteria. It was also considered possible to use weightings in order to accentuate certain highly
important criteria. Even though the stated criteria are not based on experts’ opinion, they are still
considered suitable to use for ranking suppliers. It is considered beneficial to rank the suppliers so that
the most interesting suppliers are processed first in the upcoming activities. It is therefore proposed
that the remaining elimination criteria, Complexity, Quality, Delivery performance and Lead time,
should be used for the ranking of suppliers and if considered necessary an additional screening can be
performed. For the additional screening it is considered suitable to apply the criterion Complexity. If
the product or supplier is considered to be too complex to process further for reduction, it is possible
to remove the supplier from the preliminary list. Thereby, focus can be centred on suppliers believed
to be suitable for reduction. It is also possible to apply weightings for ranking the suppliers if it is
found to be beneficial, however it is not considered necessary to use weightings to enable a ranking of
suppliers. Thereafter, it is possible to explicitly target the suppliers that are found to be of interest to
perform SBR on.
The activity of targeting suppliers for elimination thereby consists of: (1) identifying suppliers for
elimination with the help from the two elimination criteria Turnover and Number of parts (2) ranking
the suppliers using the remaining elimination criteria with eventually highlighting more important
criteria with the help of weightings if that is found necessary and (3) targeting the suppliers that
require further actions or deeper analysis. This process and the applied elimination criteria are
visualized in Figure 42.
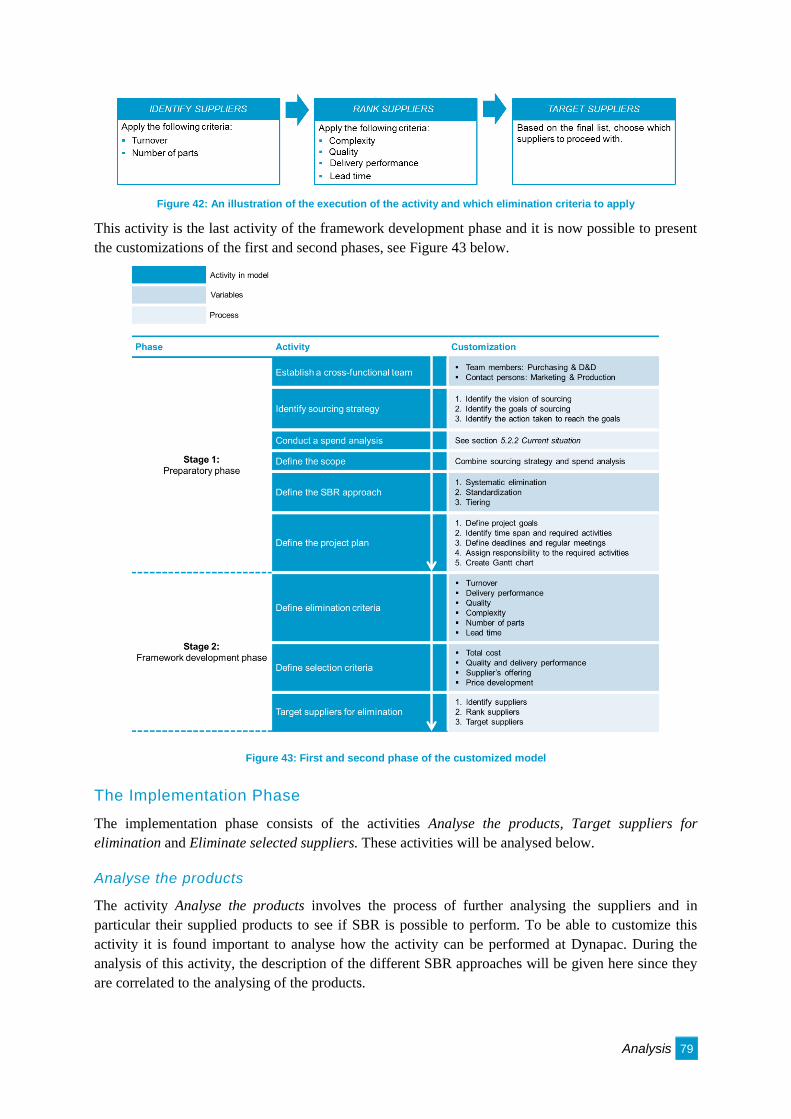
Analysis 79
Figure 42: An illustration of the execution of the activity and which elimination criteria to apply
This activity is the last activity of the framework development phase and it is now possible to present
the customizations of the first and second phases, see Figure 43 below.
Figure 43: First and second phase of the customized model
The Implementation Phase
The implementation phase consists of the activities Analyse the products, Target suppliers for
elimination and Eliminate selected suppliers. These activities will be analysed below.
Analyse the products
The activity Analyse the products involves the process of further analysing the suppliers and in
particular their supplied products to see if SBR is possible to perform. To be able to customize this
activity it is found important to analyse how the activity can be performed at Dynapac. During the
analysis of this activity, the description of the different SBR approaches will be given here since they
are correlated to the analysing of the products.
Analysis 80
The activity of analysing the products received high scores regarding necessity from all participants in
the workshops. However, all participants also thought it was a difficult and resource consuming
activity to perform. The low rating finds support in the research literature by Ogden and Carter (2008),
who emphasize on the difficulty of implementing SBR, a step which includes an analysis of the
products.
Nafie (2012) suggests that the analysis should start with the collection of product specifications, such
as drawings and OEM references. When asked during the workshops, the response is in line with
Nafie (2012). The specifications can according to the participants be used to see which material and
which technology is used to manufacture the products.
It is considered necessary to analyse the products in accordance with the SBR approach applied, since
each SBR approach is performed differently. In the activity Define the SBR approach, three different
SBR approaches were found to be possible to perform at Dynapac in the order of (1) systematic
elimination, (2) standardization and (3) tiering. Depending on the SBR approach, the objective of the
product analysis will be different and the analysis for each SBR approach will therefore be presented
separately.
Systematic elimination was proposed to be applied first. Based on the list of targeted suppliers, each of
the suppliers’ products will need to be analysed. Before the elimination can take place, it is necessary
to analyse the products in order to see if there exist replacement suppliers. The specifications should
be analysed with regards to the complexity of the product. The participants of the second workshop
highlighted the importance of not eliminating suppliers with key knowledge. Therefore, if the product
is too complex it will not be suitable for elimination. If replacement suppliers can be identified, the
next step will then be to contact them in order to see if they can supply the requested product and what
their estimated cost is. The department for production thereafter needs to be consulted in order to
verify that the replacement supplier will not affect the internal logistics negatively. Next, a business
case needs to be developed in order to investigate whether the change of supplier is profitable. If the
change is profitable then it is possible to go ahead with the next activity of targeting supplier for
selection. Thereafter, the analysis continues with investigating if there exist possibilities for
standardization. It is proposed that the products are at first analysed on a general level before
assistance from the D&D department is requested. Thereafter, it is considered necessary to consult the
Marketing department on the possible changes in order to make sure that no changes will affect the
customer satisfaction. If Marketing also approves the change, suitable suppliers should be contacted in
order to request information. Once again, the department for production needs to be consulted on the
effects on the internal logistics. Based on this information, a business case should be put together to
evaluate the effect of the change. If it is considered to be profitable change, an engineering change
request should be filed and the business case should be presented for the CCB. It is then up to the CCB
to decide whether the change will be approved or not. If the change is approved, the standardization
will be performed and the activity of targeting supplier for selection can be initiated. If the change is
not approved, the possibility of tiering should be looked into.
The possibility of tiering should lastly be investigated. It is necessary to begin with investigating the
characteristics of the component before continuing with the tiering approach since it was considered
unwise to apply tiering for more complex components. If components are found to be suitable for
tiering, a distributor should be located and contacted. Dynapac has already begun the process of
identifying possible distributors which can be used when deciding on tiering. Thereafter the
Production department should be consulted on the internal logistics before continuing with putting
together a business case and measuring the effects of the change. If it is found to be a profitable
change, the process for targeting supplier for selection can be initiated.
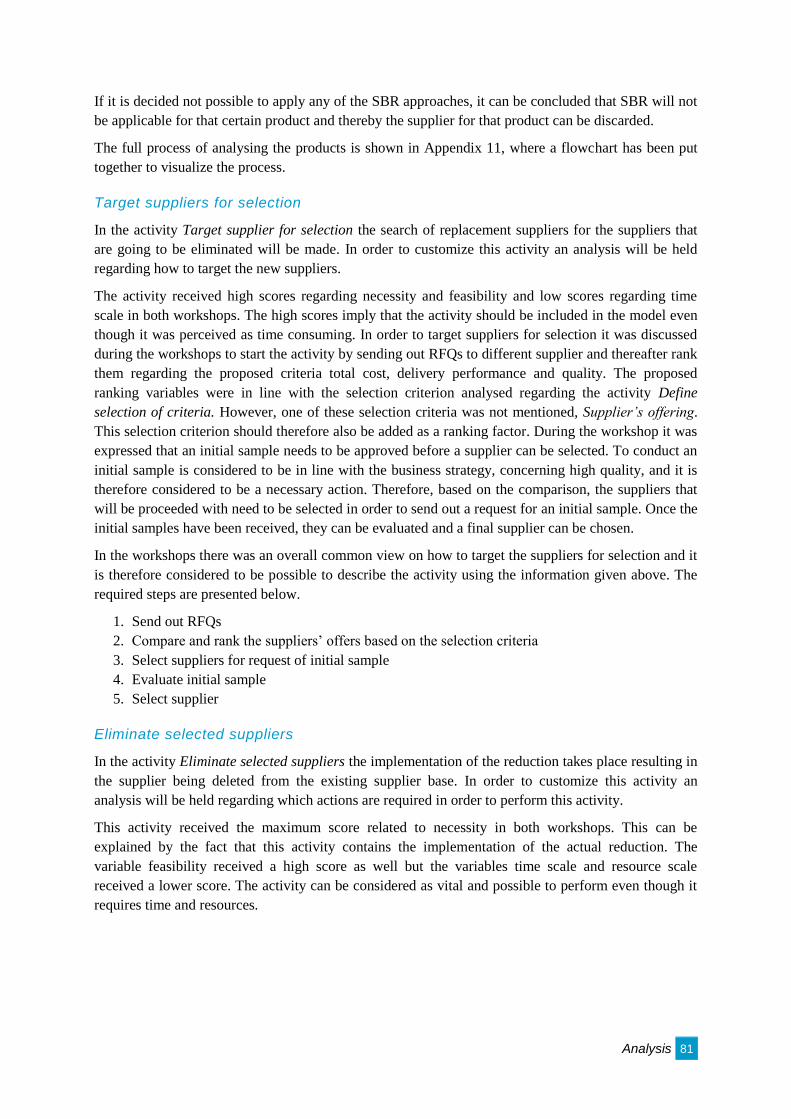
Analysis 81
If it is decided not possible to apply any of the SBR approaches, it can be concluded that SBR will not
be applicable for that certain product and thereby the supplier for that product can be discarded.
The full process of analysing the products is shown in Appendix 11, where a flowchart has been put
together to visualize the process.
Target suppliers for selection
In the activity Target supplier for selection the search of replacement suppliers for the suppliers that
are going to be eliminated will be made. In order to customize this activity an analysis will be held
regarding how to target the new suppliers.
The activity received high scores regarding necessity and feasibility and low scores regarding time
scale in both workshops. The high scores imply that the activity should be included in the model even
though it was perceived as time consuming. In order to target suppliers for selection it was discussed
during the workshops to start the activity by sending out RFQs to different supplier and thereafter rank
them regarding the proposed criteria total cost, delivery performance and quality. The proposed
ranking variables were in line with the selection criterion analysed regarding the activity Define
selection of criteria. However, one of these selection criteria was not mentioned, Supplier’s offering.
This selection criterion should therefore also be added as a ranking factor. During the workshop it was
expressed that an initial sample needs to be approved before a supplier can be selected. To conduct an
initial sample is considered to be in line with the business strategy, concerning high quality, and it is
therefore considered to be a necessary action. Therefore, based on the comparison, the suppliers that
will be proceeded with need to be selected in order to send out a request for an initial sample. Once the
initial samples have been received, they can be evaluated and a final supplier can be chosen.
In the workshops there was an overall common view on how to target the suppliers for selection and it
is therefore considered to be possible to describe the activity using the information given above. The
required steps are presented below.
1. Send out RFQs
2. Compare and rank the suppliers’ offers based on the selection criteria
3. Select suppliers for request of initial sample
4. Evaluate initial sample
5. Select supplier
Eliminate selected suppliers
In the activity Eliminate selected suppliers the implementation of the reduction takes place resulting in
the supplier being deleted from the existing supplier base. In order to customize this activity an
analysis will be held regarding which actions are required in order to perform this activity.
This activity received the maximum score related to necessity in both workshops. This can be
explained by the fact that this activity contains the implementation of the actual reduction. The
variable feasibility received a high score as well but the variables time scale and resource scale
received a lower score. The activity can be considered as vital and possible to perform even though it
requires time and resources.
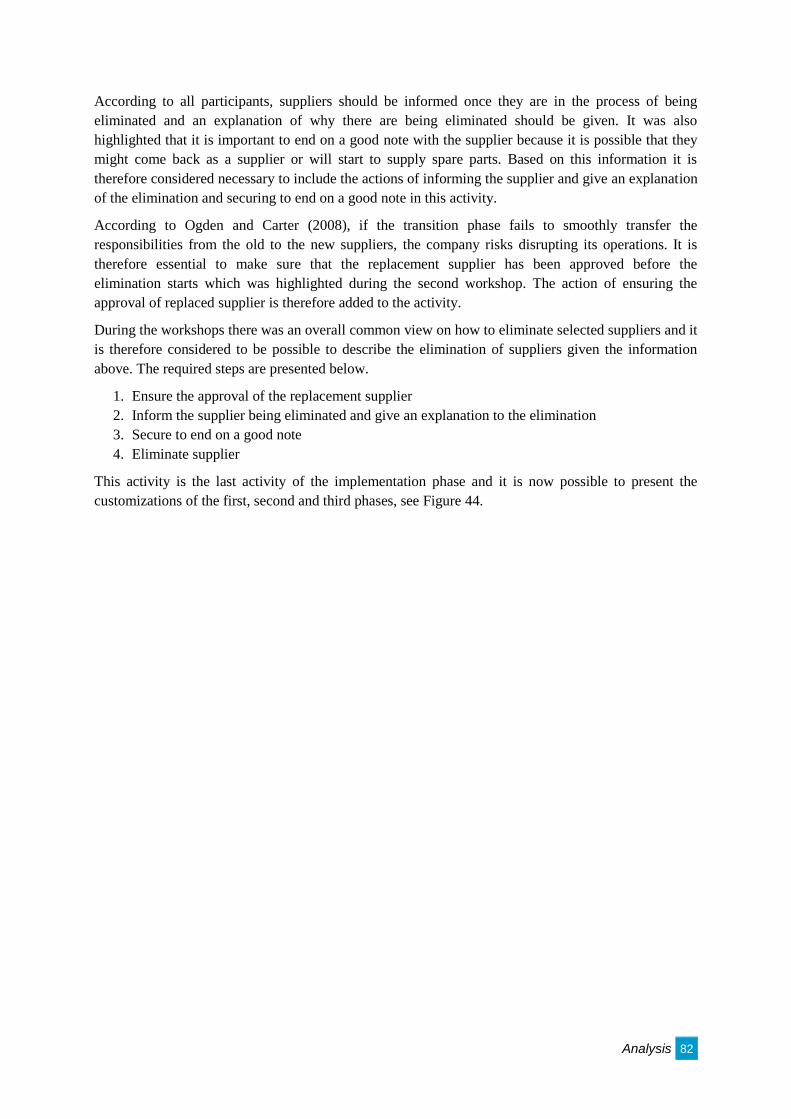
Analysis 82
According to all participants, suppliers should be informed once they are in the process of being
eliminated and an explanation of why there are being eliminated should be given. It was also
highlighted that it is important to end on a good note with the supplier because it is possible that they
might come back as a supplier or will start to supply spare parts. Based on this information it is
therefore considered necessary to include the actions of informing the supplier and give an explanation
of the elimination and securing to end on a good note in this activity.
According to Ogden and Carter (2008), if the transition phase fails to smoothly transfer the
responsibilities from the old to the new suppliers, the company risks disrupting its operations. It is
therefore essential to make sure that the replacement supplier has been approved before the
elimination starts which was highlighted during the second workshop. The action of ensuring the
approval of replaced supplier is therefore added to the activity.
During the workshops there was an overall common view on how to eliminate selected suppliers and it
is therefore considered to be possible to describe the elimination of suppliers given the information
above. The required steps are presented below.
1. Ensure the approval of the replacement supplier
2. Inform the supplier being eliminated and give an explanation to the elimination
3. Secure to end on a good note
4. Eliminate supplier
This activity is the last activity of the implementation phase and it is now possible to present the
customizations of the first, second and third phases, see Figure 44.
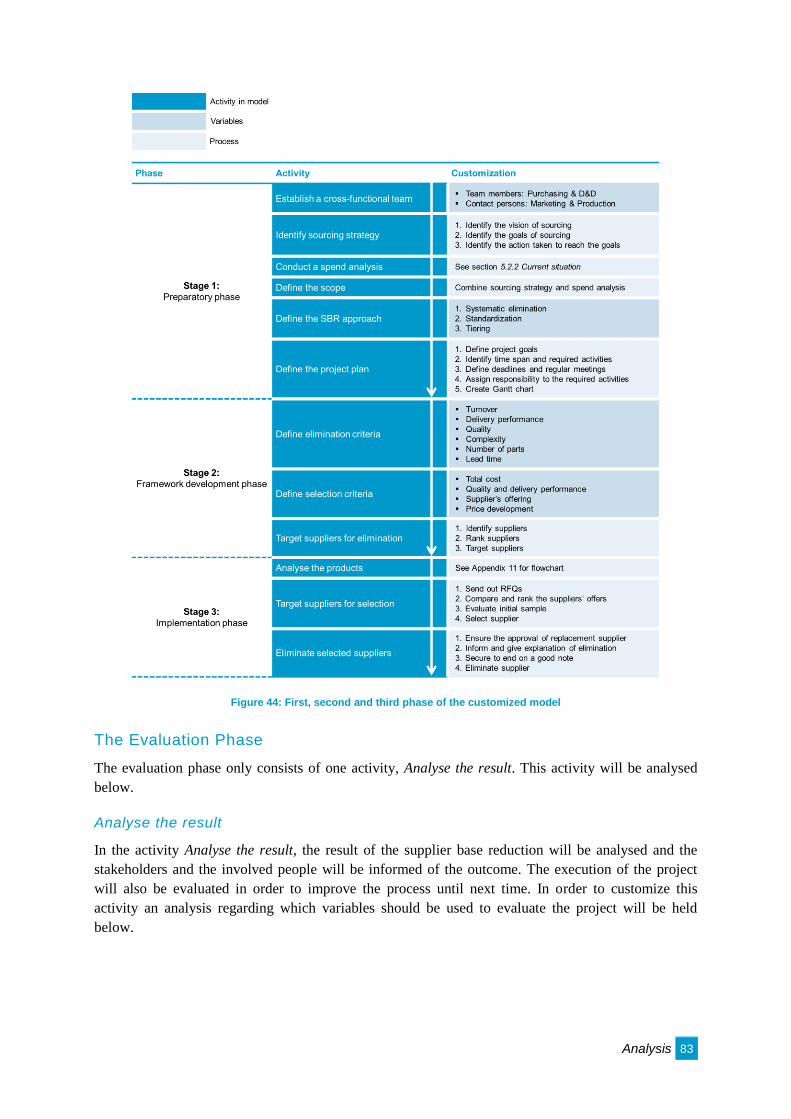
Analysis 83
Figure 44: First, second and third phase of the customized model
The Evaluation Phase
The evaluation phase only consists of one activity, Analyse the result. This activity will be analysed
below.
Analyse the result
In the activity Analyse the result, the result of the supplier base reduction will be analysed and the
stakeholders and the involved people will be informed of the outcome. The execution of the project
will also be evaluated in order to improve the process until next time. In order to customize this
activity an analysis regarding which variables should be used to evaluate the project will be held
below.
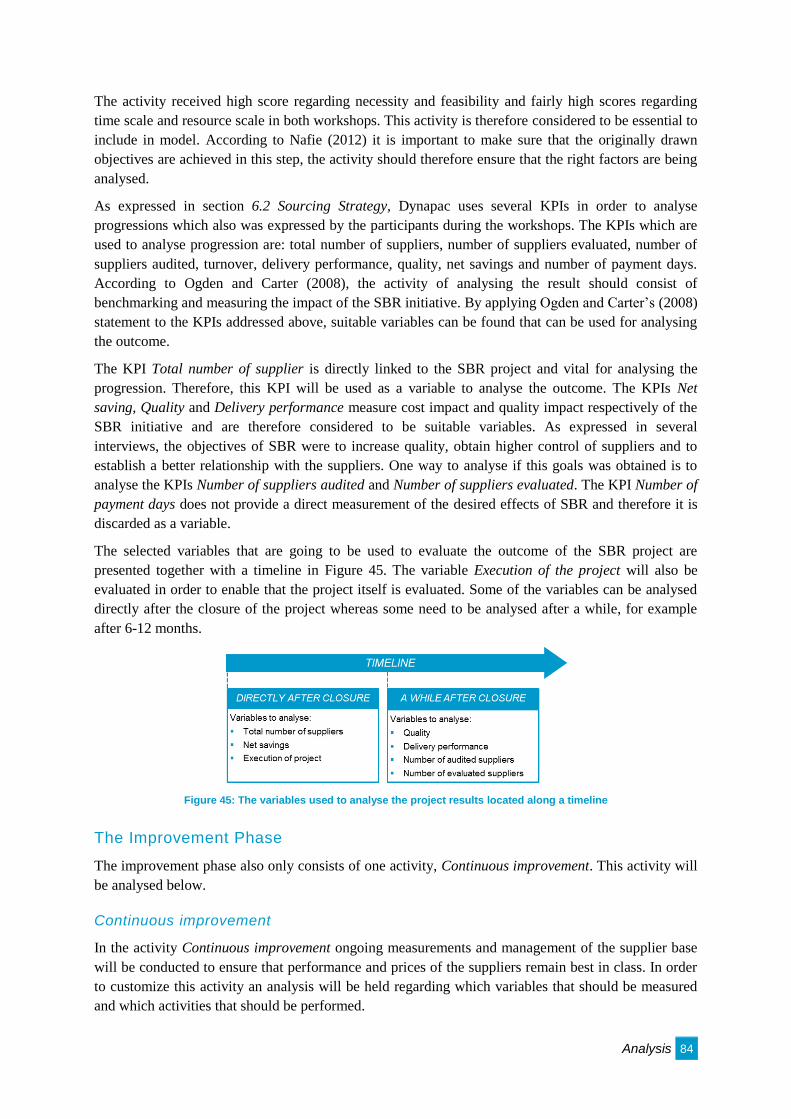
Analysis 84
The activity received high score regarding necessity and feasibility and fairly high scores regarding
time scale and resource scale in both workshops. This activity is therefore considered to be essential to
include in model. According to Nafie (2012) it is important to make sure that the originally drawn
objectives are achieved in this step, the activity should therefore ensure that the right factors are being
analysed.
As expressed in section 6.2 Sourcing Strategy, Dynapac uses several KPIs in order to analyse
progressions which also was expressed by the participants during the workshops. The KPIs which are
used to analyse progression are: total number of suppliers, number of suppliers evaluated, number of
suppliers audited, turnover, delivery performance, quality, net savings and number of payment days.
According to Ogden and Carter (2008), the activity of analysing the result should consist of
benchmarking and measuring the impact of the SBR initiative. By applying Ogden and Carter’s (2008)
statement to the KPIs addressed above, suitable variables can be found that can be used for analysing
the outcome.
The KPI Total number of supplier is directly linked to the SBR project and vital for analysing the
progression. Therefore, this KPI will be used as a variable to analyse the outcome. The KPIs Net
saving, Quality and Delivery performance measure cost impact and quality impact respectively of the
SBR initiative and are therefore considered to be suitable variables. As expressed in several
interviews, the objectives of SBR were to increase quality, obtain higher control of suppliers and to
establish a better relationship with the suppliers. One way to analyse if this goals was obtained is to
analyse the KPIs Number of suppliers audited and Number of suppliers evaluated. The KPI Number of
payment days does not provide a direct measurement of the desired effects of SBR and therefore it is
discarded as a variable.
The selected variables that are going to be used to evaluate the outcome of the SBR project are
presented together with a timeline in Figure 45. The variable Execution of the project will also be
evaluated in order to enable that the project itself is evaluated. Some of the variables can be analysed
directly after the closure of the project whereas some need to be analysed after a while, for example
after 6-12 months.
Figure 45: The variables used to analyse the project results located along a timeline
The Improvement Phase
The improvement phase also only consists of one activity, Continuous improvement. This activity will
be analysed below.
Continuous improvement
In the activity Continuous improvement ongoing measurements and management of the supplier base
will be conducted to ensure that performance and prices of the suppliers remain best in class. In order
to customize this activity an analysis will be held regarding which variables that should be measured
and which activities that should be performed.
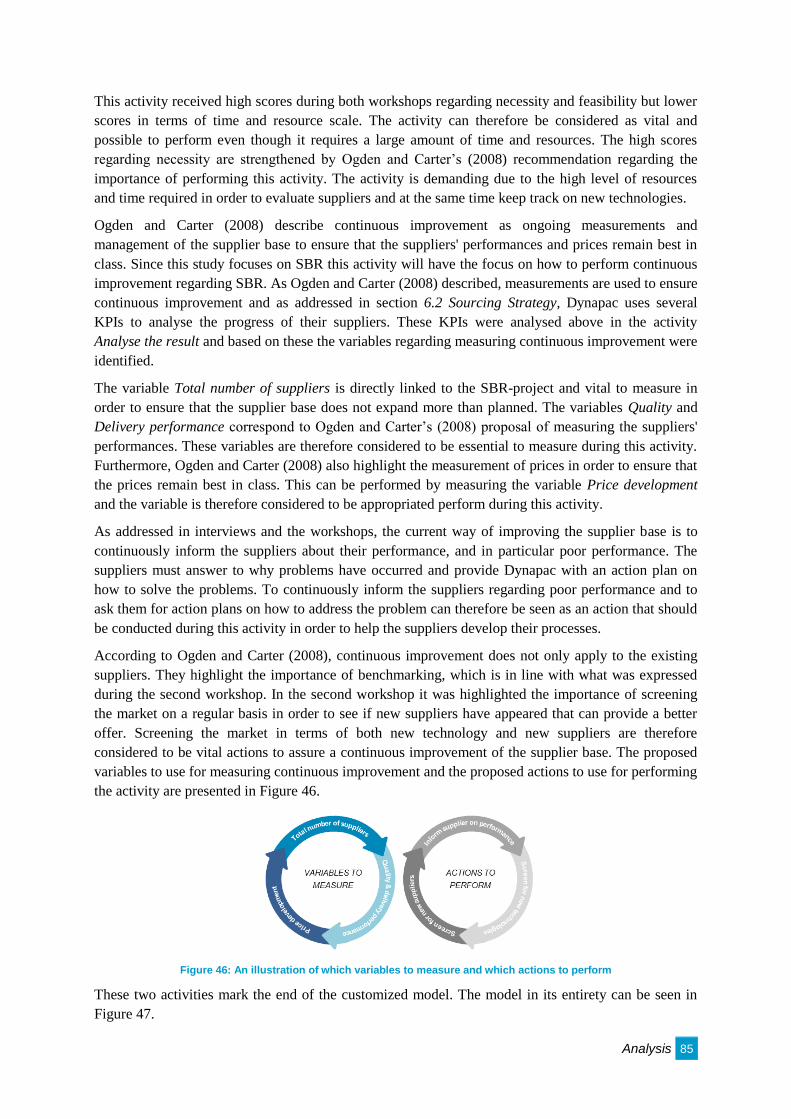
Analysis 85
This activity received high scores during both workshops regarding necessity and feasibility but lower
scores in terms of time and resource scale. The activity can therefore be considered as vital and
possible to perform even though it requires a large amount of time and resources. The high scores
regarding necessity are strengthened by Ogden and Carter’s (2008) recommendation regarding the
importance of performing this activity. The activity is demanding due to the high level of resources
and time required in order to evaluate suppliers and at the same time keep track on new technologies.
Ogden and Carter (2008) describe continuous improvement as ongoing measurements and
management of the supplier base to ensure that the suppliers' performances and prices remain best in
class. Since this study focuses on SBR this activity will have the focus on how to perform continuous
improvement regarding SBR. As Ogden and Carter (2008) described, measurements are used to ensure
continuous improvement and as addressed in section 6.2 Sourcing Strategy, Dynapac uses several
KPIs to analyse the progress of their suppliers. These KPIs were analysed above in the activity
Analyse the result and based on these the variables regarding measuring continuous improvement were
identified.
The variable Total number of suppliers is directly linked to the SBR-project and vital to measure in
order to ensure that the supplier base does not expand more than planned. The variables Quality and
Delivery performance correspond to Ogden and Carter’s (2008) proposal of measuring the suppliers'
performances. These variables are therefore considered to be essential to measure during this activity.
Furthermore, Ogden and Carter (2008) also highlight the measurement of prices in order to ensure that
the prices remain best in class. This can be performed by measuring the variable Price development
and the variable is therefore considered to be appropriated perform during this activity.
As addressed in interviews and the workshops, the current way of improving the supplier base is to
continuously inform the suppliers about their performance, and in particular poor performance. The
suppliers must answer to why problems have occurred and provide Dynapac with an action plan on
how to solve the problems. To continuously inform the suppliers regarding poor performance and to
ask them for action plans on how to address the problem can therefore be seen as an action that should
be conducted during this activity in order to help the suppliers develop their processes.
According to Ogden and Carter (2008), continuous improvement does not only apply to the existing
suppliers. They highlight the importance of benchmarking, which is in line with what was expressed
during the second workshop. In the second workshop it was highlighted the importance of screening
the market on a regular basis in order to see if new suppliers have appeared that can provide a better
offer. Screening the market in terms of both new technology and new suppliers are therefore
considered to be vital actions to assure a continuous improvement of the supplier base. The proposed
variables to use for measuring continuous improvement and the proposed actions to use for performing
the activity are presented in Figure 46.
Figure 46: An illustration of which variables to measure and which actions to perform
These two activities mark the end of the customized model. The model in its entirety can be seen in
Figure 47.
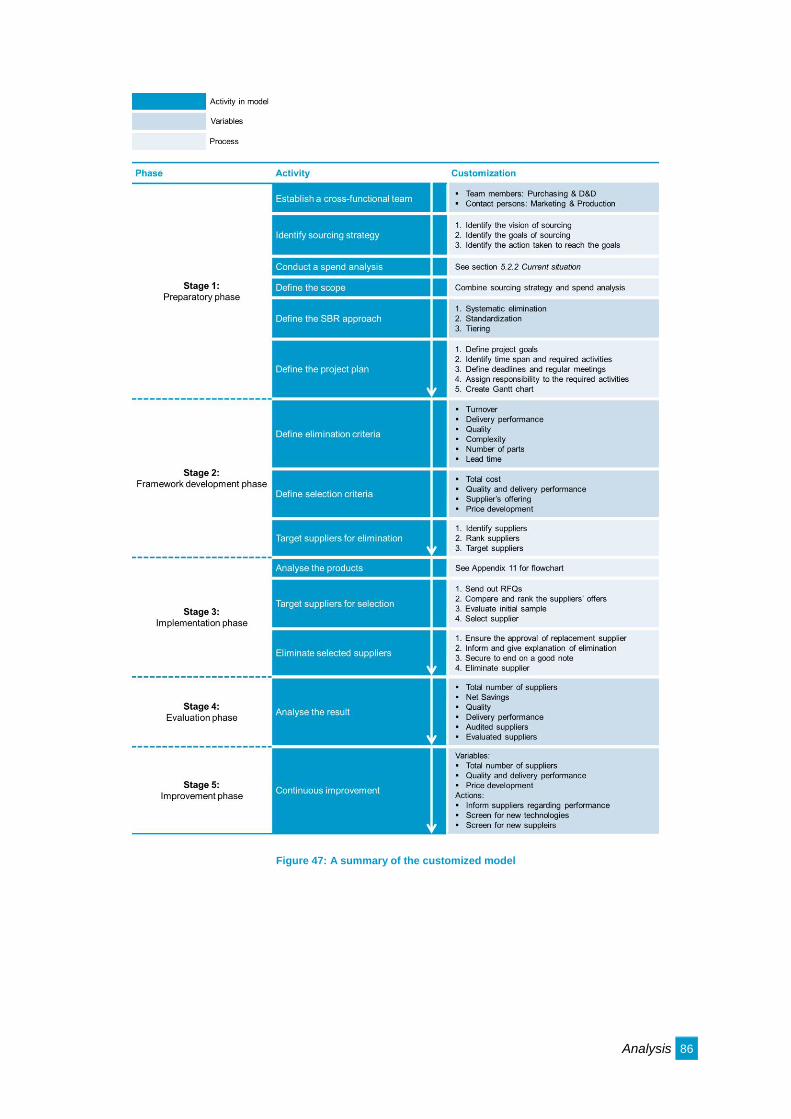
Analysis 86
Figure 47: A summary of the customized model
Analysis 87
7.3 SYNTHESIS OF ANALYSIS
The section Analysis focused on answering the second and third research question from section 4
Problem Specification concerning the current situation of sourcing and the customization of the
conceptual model.
When analysing the current situation of sourcing, the action of reducing the supplier base was found to
be in line with the sourcing strategy as well as the business strategy and the needed support is
therefore believed to be present. When investigating stakeholders in sourcing decisions it could be
seen that the Production and Marketing department act as the roles of the users and the influencers,
whereas the Purchasing department takes the roles as the buyer and an influencer as well. The D&D
department has the role of an influencer and the CCB as a decider. The Purchasing department is
found to apply a segmentation method which categorizes the relationships with their suppliers into
either strategic relationships, applied with all of their critical suppliers, or durable arm’s length
relationships. The aim is to maintain long term relationships with all of the suppliers, which fit well
into the description of these types of relationships. The current state of the supplier base, based on the
conducted spend analysis showed that 80 percent of the purchasing budget was allocated to only 14
percent of the total supplier base and a large amount of the purchasing budget was allocated to only a
few commodities. It also revealed several possible targets for SBR such as K4, Machined parts, E4,
Electrical components, and M14, Other miscellaneous parts. Based on the analyses a solid base for
developing a customized model was established.
All activities in the conceptual model were thereafter analysed based on the evaluation of the model as
well as the result from the analysis of the current situation combined with theory. The development of
the customized model resulted in two types of customizations. The first type consisted of defined
variables and the other of step-wise processes. To get an overview of the developed customized model,
the activities and their customization is presented in Figure 47 on the page before. In the figure the
different types of customizations can be recognised by the marking of the colour.
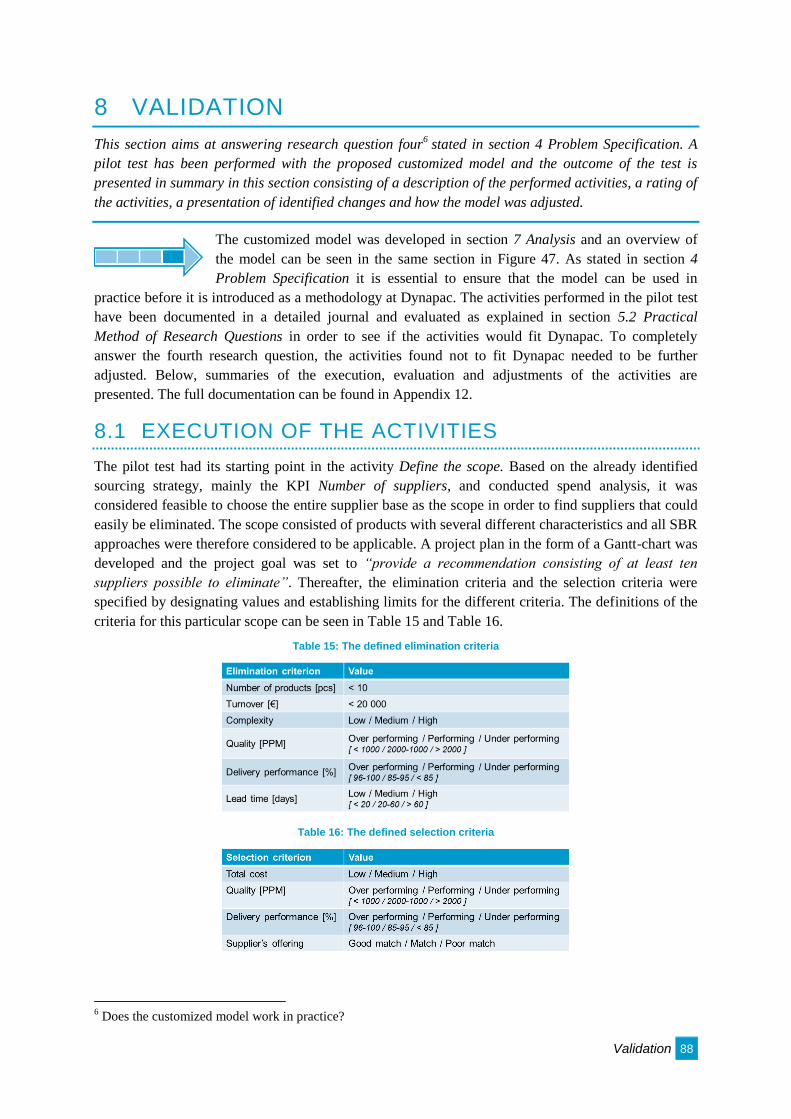
Validation 88
8 VALIDATION
This section aims at answering research question four6 stated in section 4 Problem Specification. A
pilot test has been performed with the proposed customized model and the outcome of the test is
presented in summary in this section consisting of a description of the performed activities, a rating of
the activities, a presentation of identified changes and how the model was adjusted.
The customized model was developed in section 7 Analysis and an overview of
the model can be seen in the same section in Figure 47. As stated in section 4
Problem Specification it is essential to ensure that the model can be used in
practice before it is introduced as a methodology at Dynapac. The activities performed in the pilot test
have been documented in a detailed journal and evaluated as explained in section 5.2 Practical
Method of Research Questions in order to see if the activities would fit Dynapac. To completely
answer the fourth research question, the activities found not to fit Dynapac needed to be further
adjusted. Below, summaries of the execution, evaluation and adjustments of the activities are
presented. The full documentation can be found in Appendix 12.
8.1 EXECUTION OF THE ACTIVITIES
The pilot test had its starting point in the activity Define the scope. Based on the already identified
sourcing strategy, mainly the KPI Number of suppliers, and conducted spend analysis, it was
considered feasible to choose the entire supplier base as the scope in order to find suppliers that could
easily be eliminated. The scope consisted of products with several different characteristics and all SBR
approaches were therefore considered to be applicable. A project plan in the form of a Gantt-chart was
developed and the project goal was set to “provide a recommendation consisting of at least ten
suppliers possible to eliminate”. Thereafter, the elimination criteria and the selection criteria were
specified by designating values and establishing limits for the different criteria. The definitions of the
criteria for this particular scope can be seen in Table 15 and Table 16.
Table 15: The defined elimination criteria
Table 16: The defined selection criteria
6 Does the customized model work in practice?
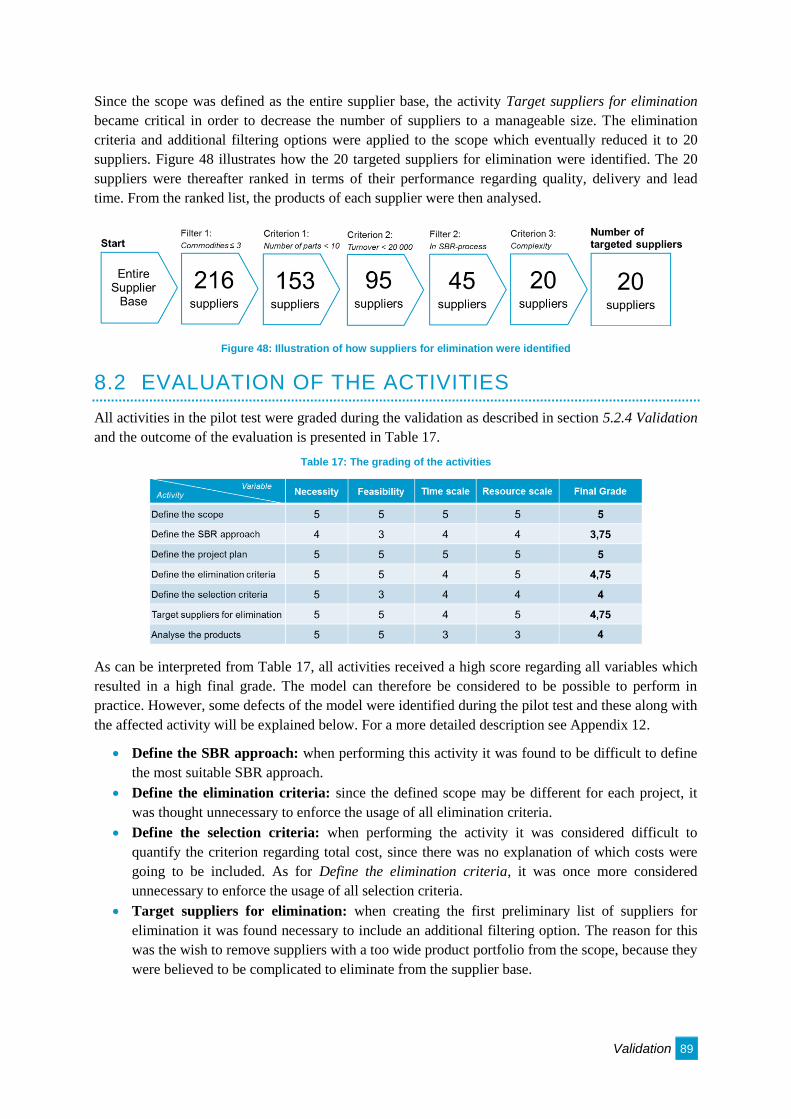
Validation 89
Since the scope was defined as the entire supplier base, the activity Target suppliers for elimination
became critical in order to decrease the number of suppliers to a manageable size. The elimination
criteria and additional filtering options were applied to the scope which eventually reduced it to 20
suppliers. Figure 48 illustrates how the 20 targeted suppliers for elimination were identified. The 20
suppliers were thereafter ranked in terms of their performance regarding quality, delivery and lead
time. From the ranked list, the products of each supplier were then analysed.
Figure 48: Illustration of how suppliers for elimination were identified
8.2 EVALUATION OF THE ACTIVITIES
All activities in the pilot test were graded during the validation as described in section 5.2.4 Validation
and the outcome of the evaluation is presented in Table 17.
Table 17: The grading of the activities
As can be interpreted from Table 17, all activities received a high score regarding all variables which
resulted in a high final grade. The model can therefore be considered to be possible to perform in
practice. However, some defects of the model were identified during the pilot test and these along with
the affected activity will be explained below. For a more detailed description see Appendix 12.
Define the SBR approach: when performing this activity it was found to be difficult to define
the most suitable SBR approach.
Define the elimination criteria: since the defined scope may be different for each project, it
was thought unnecessary to enforce the usage of all elimination criteria.
Define the selection criteria: when performing the activity it was considered difficult to
quantify the criterion regarding total cost, since there was no explanation of which costs were
going to be included. As for Define the elimination criteria, it was once more considered
unnecessary to enforce the usage of all selection criteria.
Target suppliers for elimination: when creating the first preliminary list of suppliers for
elimination it was found necessary to include an additional filtering option. The reason for this
was the wish to remove suppliers with a too wide product portfolio from the scope, because they
were believed to be complicated to eliminate from the supplier base.
Validation 90
8.3 ADJUSTMENTS OF THE ACTIVITIES
In the section above, a number of defects were highlighted which need to be addressed before the
customized methodology can be established. Based on these findings, the customized model can be
reconfigured.
Define the SBR approach: to handle the issue of not knowing which SBR approach to choose,
it is proposed that the action of getting familiar with the scope before the choosing approaches is
added to the activity. However, this action is optional and it is up to the user to decide whether it
is necessary or not. This change will be added to the methodology.
Define the elimination criteria: to avoid having to apply criteria found unnecessary for a
particular scope, it is regarded appropriate to modify the activity by letting the user first choose
which of the elimination criteria to apply. Thereafter, values and limits can be specified.
Define the selection criteria: to simplify the activity, the criterion total cost will need to be
further specified into cost types that can be used to evaluate the replacement suppliers. From the
validation, it was found necessary to include cost types that were easily quantifiable and
therefore it was proposed that only cost types that were simple to measure and gave an
indication on what the total cost would be should be included. Two cost types, transportation
and purchasing costs, were thereafter identified as suitable types to include in the total cost.
When reviewing the cost types as well as consulting purchasers on the matter, the same
conclusion was reached. Thereby, an alteration to the activity regarding which cost types to
include is made as well as providing the option of including other cost types if that is found to
be necessary. Based on the same arguments given to the activity Define the elimination criteria,
suitable selection criterion should at first be selected before specifying values and limits to
handle the problem of applying redundant criteria.
Target suppliers for elimination: the need for adding more filtering options when identifying
suppliers for elimination opens up for the possibility of customizing the search for suitable
suppliers. This is regarded as a positive outcome of the change and it is therefore considered
suitable to allow additional filtering options when identifying suppliers and creating the first
preliminary list. What should be remarked is the usage of the notion of filtering option and not
criterion. Additional options should only be applied when creating the first list of suppliers,
thereafter the defined criteria should be used. This is considered necessary in order to maintain
the focus of the supplier base reduction on the sourcing strategy.
When combining the customized model presented in Figure 47 in section 7.3 Synthesis of Analysis
with the above mentioned changes, a sound basis for the establishment of a methodology can be
obtained and thereby answer research question four. Even though all activities were not validated, they
were customized together with employees at Dynapac and therefore can research question four still be
considered as sufficient answered. A summary of the final customized model is illustrated in Figure 49
below and the changes discussed above are highlighted in orange.
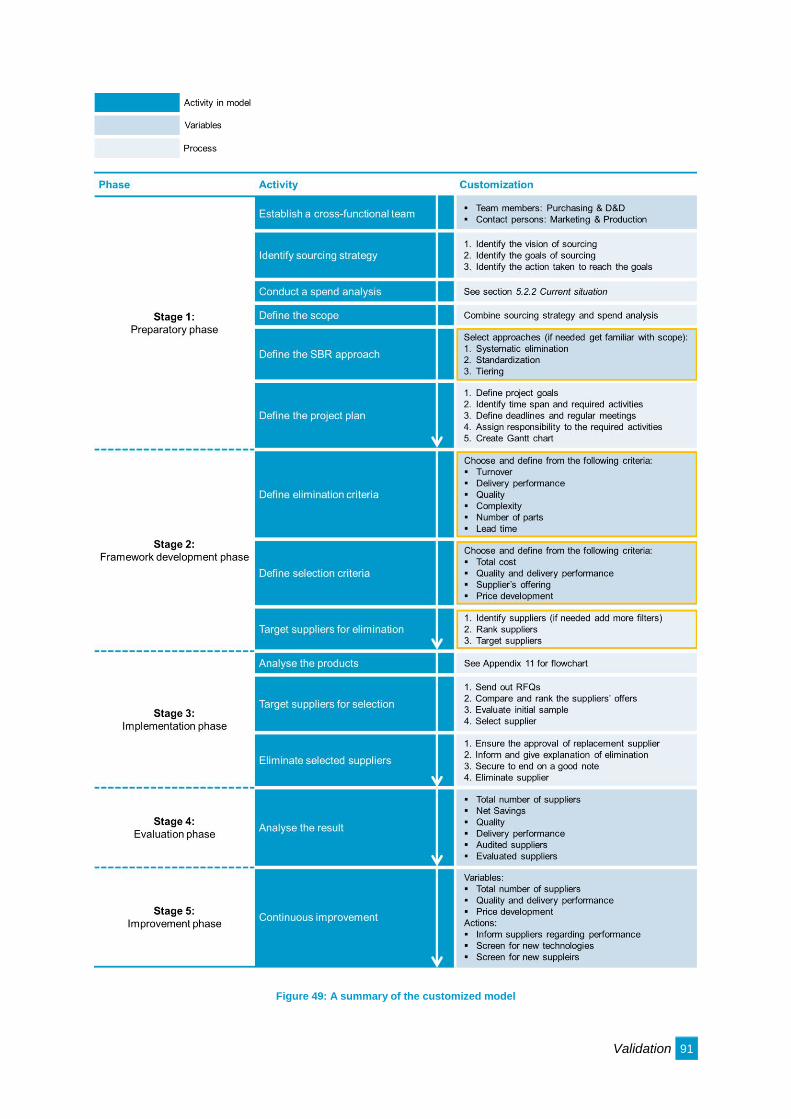
Validation 91
Figure 49: A summary of the customized model
Conclusions and Discussion 92
9 CONCLUSIONS AND DISCUSSION
In the following section the result of the study is at first presented and discussed leading up to the
answer of the purpose of the study. Thereafter, an exploration of the result and the usefulness of the
methodology are discussed. Lastly, ideas and proposals for future research are presented.
9.1 PRESENTATION OF THE RESULT
What started out as a conceptual model based on already existing models has now
become a customized model based on the current situation of Dynapac. As
explained in section 4.1 Developing the Analysis Model, the customized model
cannot be labelled as a methodology before it has been validated. In section 8 Validation, the
customized model was at last validated which resulted in the identification of changes which were
seen upon as potential improvements of the model. The changes were discussed and it was concluded
that they were of value to incorporate into the model, thus contributing to refining the model into an
even more suitable model for Dynapac.
When examining the analysis model of the study, as presented in section 4.1 Developing the Analysis
Model, it can be concluded that all steps have been completed and all research questions have been
answered. It can therefore be established that the customized model presented in Figure 49 on the
previous page can in fact be labelled as a methodology. It can hereby be concluded that the
methodology customized for the current situation of Dynapac contains a standardized approach
consisting of multiple activities with clarifications of what needs to be performed in order to enable an
implementation SBR as pictured in Figure 49.
The methodology with all details regarding the execution of the activities is considered to be too long
to include in this section and it is therefore presented in Appendix 13. This document, which was
handed over to Dynapac, is a stand-alone document that can be used for implementing the
methodology without having read the full report. For an overview of the methodology, the reader is
once more directed to Figure 49.
9.2 EXPLORATION OF THE RESULT
The purpose of the study was to develop a customized methodology for SBR. In order to fulfil the
purpose, an analysis model was developed consisting of research questions with associated sub-
questions. All research questions and sub-questions were answered and contributed to the
establishment of a customized methodology for SBR at Dynapac. The result of the study can therefore
be considered to have reached the study’s purpose.
Conclusions and Discussion 93
The literature area of SBR is a specific and limited area. Nevertheless, it has attracted significant
interest during recent years. The existing research regarding SBR has had a focus on how to
theoretically perform SBR and on what can be achieved with SBR. However, the described processes
of SBR did not practically describe all the necessary activities and how they should be carried out.
Furthermore, most of these processes did not describe the entire implementation of SBR; they only
described a specific part of the process. Several activities presented in already existing processes can
also be found in the study’s developed methodology, but these have been described in a much greater
level of detail on how to conduct the activities. This study is therefore considered to contribute to the
literature by having developed a more detailed methodology on how to conduct SBR. Since an
expanding and oversized supplier base is a common phenomenon in many manufacturing companies,
the result of the study can be seen as potential guidelines on how to solve this recurring problem.
As can be interpreted from the text above the study achieved its purpose as well as contributed to the
literature by combining important aspects of supplier base management and providing a new and more
detailed methodology on how to conduct SBR from beginning to end.
9.3 GENERALISATION OF THE RESULT
It is interesting to discuss the generalisation of the result in order to investigate whether the findings
can be applied or used in other environments than the one at Dynapac.
The methodology developed in this study is customized to Dynapac and has a focus on suppliers of
direct material. It is therefore interesting to first of all discuss whether it is possible or not to apply the
methodology for SBR on other types of suppliers, for example on suppliers of indirect material or
services. For some of the activities in the methodology there is a strong connection to direct material,
such as Establish a cross-functional team, Define the elimination criteria and Analyse the product but
for some activities there is no connection at all. In order to be able to apply the methodology on other
areas, the activities with connections to direct material needs to be redefined. In the study, the different
activities were at first described on an overall view before they were customized. By using the
developed methodology and taking support from the overall descriptions of the activities to redefine
the relevant activities, it is considered possible to conduct the methodology on supplier supplying
other types of products or services.
Furthermore, Dynapac is owned by the corporation Atlas Copco Group which contains several
different subsidiaries, both smaller and larger compared to Dynapac. All companies in Atlas Copco
Group apply the same core values and operate according to the same established standard processes.
Since this methodology is adapted to these processes, the methodology is therefore considered to be
applicable on other companies within Atlas Copco Group. The methodology includes an activity
where the user of the methodology defines the scope of SBR and thereby the methodology is not
limited to a specific size of the company. As earlier mentioned, some of the activities are adapted to
the processes used in Atlas Copco Group. The methodology is therefore not considered to be
applicable to other external companies. However, external companies could use the methodology as
guidelines in order to create a customized methodology suitable for their unique situation.
In summary, it can be concluded that with or without small modifications the customized methodology
is applicable for other types of supplier areas within Dynapac. Furthermore, the methodology is also
considered to be useful for other subsidiaries, regardless of their size, within the Atlas Copco Group
that wish to conduct SBR. The methodology was not considered applicable on other external
companies, but it was considered possible for them to use it as guidance while performing SBR.

Conclusions and Discussion 94
9.4 FURTHER RESEARCH
The analysis of the study touches upon the subject of keeping the supplier base in desired size, which
can be linked to the activity Continuous improvement aiming at keeping the existing supplier base in
“world class”. Further research of value, would be to investigate why companies’ supplier bases
expand and result in a high number of suppliers. If the reasons for this were to be mapped, companies
could learn how to avoid ending up in the same situation again, thus maintaining a manageable size of
their supplier base.
Even though both Cousins (1999) and Goffin, et al. (1997) highlight the difficulties with measuring
the effect from SBR, it is still considered an interesting area to investigate. Further research could
therefore be to investigate if it is possible to measure the effect of SBR and how it should be
performed. If researchers find a way to estimate and measure the effects of SBR, companies would
have a helpful and powerful tool for analysing the outcome and thereby receiving good input on the
decision if suppliers should be eliminated or not as well as being able to show the profit yielded from
an SBR initiative.
Bibliography 95
10 BIBLIOGRAPHY
Bell, J., 2006. Introduktion till forskningsmetodik. 4:2 ed. Denmark: Studentlitteratur AB.
Björklund, M. & Paulsson, U., 2013. Seminarieboken. 2:2 ed. Lund: Studentlitteratur AB.
Burke, G. J., Carrillo, J. E. & Vakharia, A. J., 2007. Single versus multiple supplier sourcing
strategies. European Journal of Operational Research, 182(2007), pp. 95-112.
Burke, G. J. & Vakharia, A. J., 2004. Supply Chain Management, New York: John Wiley & Sons,
Inc..
Business manager, 2015. [Interview] (11 March 2015).
Cai, S., Yang, Z. & Hu, Z., 2010. The effects of volume consolidation on buyer-supplier relationships:
A study on Chinese firms. Journal of Puchsing & Supply Management, Volume 16, pp. 152-162.
Choi, T. Y. & Krause, D. R., 2006. The supply base and its complexity: implications for transaction
costs, risks, responsiveness, and innovation.. Journal of Operations Management, Volume 24, pp.
637-652.
Clarke, A. H. & Freytag, P. V., 2008. An intra- and interorganizational perspective on industrial
segmentation: A segmentation classification framework. European Journal of Marketing,
42(2008), pp. 1023-1038.
Costantino, N. & Pellegrino, R., 2009. Choosing between single and multiple sourcing based on
supplier default risk: A real options approach. Journal of Purchasing and Supply Management,
16(2010), pp. 27-40.
Cousins, P. D., 1999. Supply base rationalisation: myth or reality. European Journal of Purchasing &
Supply Management, 5(1999), pp. 143-155.
D&D manager, 2015. [Interview] (12 March 2015).
Driedonks, B. A., Gevers, J. M. & van Weele, A. J., 2014. Success factors for sourcing teams: How to
foster. European Management Journal, 32(2014), pp. 288-304.
Dyer, J. H., Cho, D. S. & Chu, W., 1998. Strategic Supplier Segmentation: The Next "Best Practice"
in Supply Chain Management. California Management Review, 40(2), pp. 57-77.
Eriksson, L. T. & Wiedersheim-Paul, F., 2011. Att utreda, forska och rapportera. 9:1 ed. Malmö:
Liber AB.
Fisher, V. L., 1976. Industrial Marketing: An Analytical Approach to Planning and Execution. 2nd ed.
London: Random House Business Books.
Goffin, K., Szwejczewski, M. & New, C., 1997. Managing suppliers: when few can mean more.
International Jour of Physical Distribution & Logistics Management, Volume 7, pp. 422-436.
Handfield, R. B., Monczka, R. M., Giunipero, L. C. & Patterson, J. L., 2011. Sourcing and Supply
Chain Management. 5th ed. Ohio, USA: South-Western Cengage Learning.
Holme, I. M. & Solvang, B. K., 1997. Forskningsmetodik: Om kvalitativa och kvantitativa metoder. 2
ed. Lund: Studentlitteratur AB.
Howard, M. & Squire, B., 2007. Modularization and the impact on supply relationships. International
Journal of Operations & Production Management, 8(2007), pp. 224-240.
Bibliography 96
Jacobsen, D. I., 2002. Vad, hur och varför? - Om metodval i företagsekonomi och andra
samhällsvetenskapliga ämnen. Lund: Studentlitteratur AB.
Kluge, J., 1997. Reducing the cost of goods sold: Role of complexity, design, relationships. McKinsey
Quarterly, Issue 2, pp. 212-215.
Kraljic, P., 1983. Purchasing must become supply management. Harvard Business Review,
September-October, pp. 109-117.
Merriam, S. B., 1994. Fallstudien som forskningsmetod. Lund: Studentlitteratur AB.
Millington, C., 2011. Driving Decisions on Supplier Numbers. Supply Chain Europe, 20(2011), p. 28.
Mitchell, P. & Sawchuk, C., 2012. The Benefits of Supllier Consolidation Extend Far Beyond
Sourcing Savings, New York: The Hackett Group.
Nafie, O., 2012. Developing a Supplier Base Reduction Process, Helsinki: Helsinki Metropolia
University of Applied Sciences.
Ogden, J. A., 2006. Supply Base Reduction: An Empirical Study of Critical Success Factors. The
Journal of Supply Chain Management, pp. 29-39.
Ogden, J. A. & Carter, P. L., 2008. The supply base reduction process: an empirical investigation. The
International Journal of Logistics Management, 19(2008), pp. 5-28.
Oskarsson, B., 2014. Logistikutredningar - en praktisk metodik. Linköping, Kurskompendium
Projektkurs Logistik Institutionen IEI vid Linköpings Universitet.
Polit, D. F. & Beck, C., 2013. Essentials of Nursing Research: Methods, Appraisal, and Utilization. 8
red. Philadelphia: Lippincott Williams & Wilkins.
Porter, A. M., 1997. Supply-base `optimization' stokes market competition. Purchasing, 123(1997),
pp. 18-21.
Porter, M. E., 1985. Competitive Advantage. New York: The Free Press.
Product manager, 2015. [Interview] (11 March 2015).
Purchaser 1, Purchaser 2 & Purchaser 3, 2015. [Interview] (13 March 2015).
Purchasing manager, 2015. [Interview] (11 March 2015).
Purchasing team leader 1, 2015. [Interview] (10 March 2015).
Purchasing team leader 1 & Purchasing team leader 2, 2015. [Interview] (31 March 2015).
Purchasing team leader 2, 2015. [Interview] (20 March 2015).
Purchasing team leader 2 & HR manager and Lean project manager, 2015. Introduction Meeting
[Interview] (27 January 2015).
Rezaei, J. & Ortt, R., 2012. A multi-variable approach to supplier segmentation. International Journal
of Production Research, 50(16), pp. 4593-4611.
Rogers, C. & Coulter, J., 2008. Supply-Chain Consolidation: Gaining efficiencies, minimizing risk,
US: CFO Publishing Corp..
Sarkar, A. & Mohapatra, P. K., 2006. Evalutaion of supplier capability and performance: A method for
supply base reduction. Journal of Purchasing & Supply Management, Issue 12, pp. 148-163.
Bibliography 97
Sollish, F. & Semanik, J., 2011. Strategic Global Sourcing Best Practices. 1 ed. New Jersey:
Hoboken.
Treleven, M. & Bergman Schweikhart, S., 1988. A Risk/Benefit Analysis of Sourcing Strategies:
Single vs. Multiple Sourcing. Journal of Operations Management, 7(4).
van Weele, A. J., 2010. Purchasing and Supply Chain Management. 5th ed. United Kingdom:
Cengage Learning EMEA.
Webster, F. E. & Wind, Y., 1996. A General Model for Understranding Organizational Buying
Behavior. Marketing Mnagement, Volume 4, pp. 52-57.
Yu, H., Zeng, A. Z. & Zhao, L., 2009. Single or dual sourcing: decision-making in the presence of
supply chain disruption risks. The International Journal of Management Science, 37(2009), pp.
788-800.
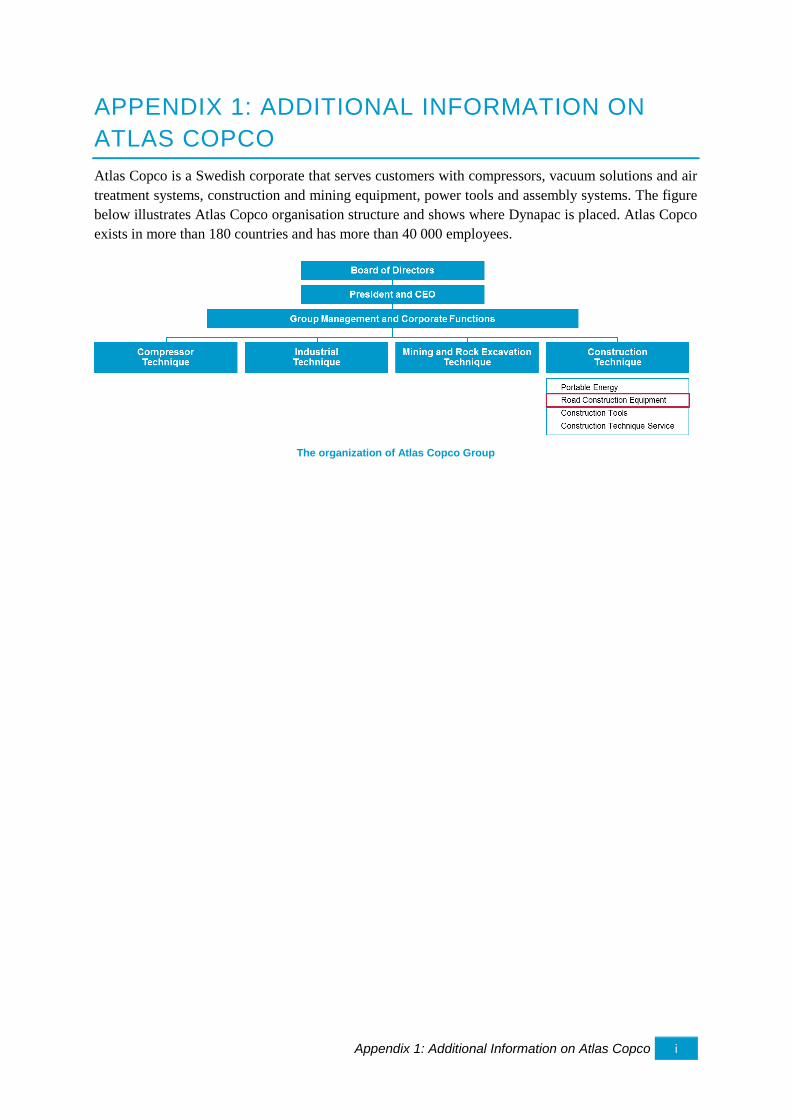
Appendix 1: Additional Information on Atlas Copco i
APPENDIX 1: ADDITIONAL INFORMATION ON
ATLAS COPCO
Atlas Copco is a Swedish corporate that serves customers with compressors, vacuum solutions and air
treatment systems, construction and mining equipment, power tools and assembly systems. The figure
below illustrates Atlas Copco organisation structure and shows where Dynapac is placed. Atlas Copco
exists in more than 180 countries and has more than 40 000 employees.
The organization of Atlas Copco Group
Appendix 2: Extended Theory of Reference ii
APPENDIX 2: EXTENDED THEORY OF
REFERENCE
SINGLE VERSUS MULTIPLE SOURCING
When using a single sourcing strategy, the aim is to establish a partnership between the buyer and the
supplier in order to achieve a mutually beneficial cooperation (Burke & Vakharia, 2004). Yu, et al.
(2009) point out the general benefits for the buyer to be the higher quality at lower total cost. Owing to
the possibility for order consolidation it is possible to achieve quantity discounts (Burke & Vakharia,
2004). It is also possible to achieve reduced order lead times as well as logistical cost reduction due to
the reduced supplier base (Burke & Vakharia, 2004). However, Burke and Vakharia (2007) point out
the diminished advantage of lowered ordering costs, since Internet purchasing tools have streamlined
the order processes.
Treleven and Bergman Schweikhart (1988) raise the issue of opportunistic behaviour and the risk of
the supplier increasing its prices when becoming the only source of a specific component or product.
With only one source, the buyer loses the power of playing suppliers against each other to attain the
lowest price. Buyers fear that without such a competition, this could result in opportunistic behaviour
and the prices could thereby be increased. However, they point out that if single sourcing is
implemented properly, the long term relationship between the buyer and the supplier would result in
motivating the supplier to charge fair prices and might even result in a price decrease. (Treleven &
Bergman Schweikhart, 1988)
Despite the apparent benefits of a partnership that single sourcing provides, Yu, et al. (2009) stress on
the increased risk of supply chain interruption with such great dependency. Costantino and Pellegrino
(2009) also point out the increased risk for supply vulnerability. For asset-specific products, i.e.
products with a highly narrow purpose, the above mentioned risks become more severe since a higher
asset specificity results in a higher dependency (Costantino & Pellegrino, 2009). For asset-specific
products it is also considered to be more difficult to find equivalent suppliers whereas for commodities
it is fairly easy to find another supplier who can provide the same product (Costantino & Pellegrino,
2009). Because of the risks of a close relationship between a buyer and a supplier, Burke and Vakharia
(2007) point out that the single sourcing benefits need to justify the risks.
In comparison to single sourcing, multiple sourcing provides the possibility of creating competition
between several suppliers, thus obtaining the best price or highest quality for a specific component
(Costantino & Pellegrino, 2009) Multiple sourcing also provides a greater flexibility (Burke &
Vakharia, 2004). When using multiple sourcing it is possible to switch supplier for a product without
having to search, select and negotiate with a new supplier (Costantino & Pellegrino, 2009). It also
contributes to keeping the buyer’s leverage over the supplier intact since the buyer’s requirements are
split between multiple sources (Costantino & Pellegrino, 2009). By diversifying the total requirements
among multiple sources, the risks and costs associated with supply chain interruption may therefore
decrease (Costantino & Pellegrino, 2009). Furthermore, multiple sources hinders the opportunity for
creating a monopolistic supplier that would result in an unwanted single sourcing, so called sole
sourcing (Burke & Vakharia, 2004).
However, despite the above stated benefits, Costantino and Pellegrino (2009) presents that multiple
sourcing results in higher costs, both initial and ongoing costs, in contrast to single sourcing. This is
mainly as a result of the need for managing more suppliers and the loss of scale of economies
(Costantino & Pellegrino, 2009).
Appendix 2: Extended Theory of Reference iii
SUPPLIER SEGMENTATION
According to van Weele (2010), strategic products are often high-technological products with
customizations and usually only one source of supply is available. Most likely, the cost of these
products constitutes a large part of the total cost of goods sold. Leverage items on the other hand are
considered to be standard products and can often be bought from several different suppliers. They are
usually bought in large volumes and constitute therefore a large part of the total cost of goods sold as
well. Bottleneck products are considered to be of low value but they can cause a negative effect on the
supply chain if not delivered correctly. They can usually only be bought from one specific supplier.
The last category, non-critical items, consists usually of products with a low impact on the total costs
as well as a high availability among suppliers. Non-critical items are usually characterized by
requiring a high level of management costs in comparison to the value of the products (van Weele,
2010)

Appendix 3: Extended Research Method iv
APPENDIX 3: EXTENDED RESEARCH METHOD
LITERATURE REVIEW
Bell (2006) highlights the importance of developing a strategy on how the literature review should be
conducted in order to only identify recourses of relevance to the study. Therefore, the literature review
began with a brainstorming of relevant keywords associated to the study's purpose that could be used
in the literature search. The keywords were later used to conduct the search. The main literature
database that was used in the study was Linköping University’s UniSearch, where books, magazines,
reports, dissertations, theses and articles can be found. Other databases used were Google Scholar and
Google Books.
To find relevant sources and eliminate irrelevant material the keywords need to be concrete and
delimited (Bell, 2006). To delimitate the research results filters, such as Supply base reduction,
Supplier base reduction, Supplier consolidation, Supply base reduction process, Supplier base
reduction process and Supplier management, were used. A large amount of the search results from
supplier consolidation was related to a more logistical flow approach and was avoided by the
delimitation of the word logistics. Aside from the usage of keywords, literature resources were also
found by looking up references from one source to another, thereby yielding the literature closer to the
primary source. When a number of interesting sources had been found, the abstracts and table of
contents of the sources were examined. The sources that were considered as relevant to the study were
transferred to a literature review list. The last stage in the literature search process was to read selected
articles and book chapters to gather essential information that could be used for the study. The Figure i
below illustrates the literature review list that was used to compile information about the different
relevant sources.
Figure i: Illustration of the literature review list
PROBLEM SPECIFICATION
Based on the problem description the problem should be specify and adapted from a theoretical level
to an operational level (Jacobsen, 2002). Jacobsen (2002) stresses that this phase is time consuming
but it is nevertheless important and highly necessary in order to enable an execution of the study. The
problem specification forms the way for how the study is conducted (Holme & Solvang, 1997).
Furthermore, Holme and Solvang (1997) explain that the problem specification should highlight the
desired areas for investigation. According to Holme and Solvang (1997), the problem specification
should contain questions of the character of what, who, how, when, why and with what consequences.
They highlight that the question can be used as starting points and be further specified.
Appendix 3: Extended Research Method v
DATA COLLECTION
QUALITATIVE DATA
Individual interview and group interview
Individual interview: according to Jacobsen (2002), the individual interview is characterized by the
interviewer and the interviewee having a regular conversation. The interview is usually conducted
face to face but due to, for example, cost reasons or different geographic locations it can also be done
over the phone. (Jacobsen, 2002)
Group interview: data collection form a group interview is not significantly different from the
individual interview (Jacobsen, 2002). According to Jacobsen (2002), the interviews are performed in
groups instead of interviewing each individual separately. Furthermore, the author means that at a
group interview a common understanding of a particular situation can be developed. On the other
hand, individual viewpoints are therefore tended to be toned down and the group’s common opinion is
instead lifted. Both Jacobsen (2002) and Bell (2006) argue that group interviews are appropriate to
use when there is interest to highlight possible conflicts between individuals. Furthermore, both
authors highlight that a group interview can give an indication of the degree of homogeneity of the
composition of the group.
Recommendations of recordings and guidelines
While conducting an interview, Bell (2006) describes the benefits of recording in order to be able to
have full attention on the interview. It also provides the opportunity to listen to the interview again.
This recommendation was followed in the study and therefore all the interviews were recorded with
the interviewee’s consent. The interviews were conducted by both authors of the study and therefore
notes were also being taken.
Bell (2006) highlight that interviews are time consuming and therefore it is important to formulate
questions before the interview. Jacobsen (2002) agrees with Bell (2006) and argues that an interview
should follow a guideline which contains topics or questions on the areas that are to be lifted during
the interview. Another benefit of structuring the interviews in advance is that it becomes less complex
to analyse (Jacobsen, 2002). Therefore, in order to prepare for the interviews, guidelines consisting of
questions that the authors of the study wanted to be answered were developed. The main areas that
were to be lifted during the interview were also sent to the interviewee in advance as another measure
to prepare them for the interview.
Compilation of Data
When the collection of data is finalized, Merriam (1994) emphasizes on the importance of organizing
the collected data in order to streamline the analysis of data. When the collection of data is finalized,
Merriam (1994) emphasizes on the importance of organizing the collected data in order to streamline
the analysis of data. Bell (2006) agrees with Merriam (1994) and points out that the collected data is
not valuable until it has been categorized. Firstly, all of the information needs to be gathered in order
to create a database for the study (Merriam, 1994). Thereafter it is important to edit the information,
sort out redundant or repeated information and then organize the information in terms of either time or
subject in order to create a complete and manageable database (Merriam, 1994). Holme and Solvang
(1997) propose a grouping of information concerning the same matter or situation in order to enable a
comparison between different sources, thus creating a complete compilation of data.
Appendix 3: Extended Research Method vi
A categorization of all the collected data was performed with the aim to create a manageable database
that could be easily used for the analysis of the data. All of the information was at first gathered in one
document and then organized into specific groups. The groups were chosen in accordance to the
research questions that were established in the problem specification. This was considered to be a
suitable grouping, since each research question needs to be answered in order to fulfil the purpose of
the study. It is however important to point out that the groups were not mutually exclusive. After the
categorization of data, redundant information was then removed. It was considered appropriate to keep
repeated information, especially for the groups containing information regarding the customization of
the model, since this provided an insightful indication of the overall opinion of the steps of the model.
ANALYSIS OF DATA
Merriam (1994) provides a method on how to start processing the collected data. It consists of reading
through the information multiple times and taking notes about ideas, comments and questions that
might emerge. The aim is to eventually be able to locate what is of most interest in the collected data
by examining what has been written down as notes. (Merriam, 1994) Another way of analysing the
collected data is by using a text analysis (Holme & Solvang, 1997). Holme and Solvang (1997) present
two methods that can be used: (1) holistic analysis and (2) part analysis. When using a holistic
approach, it is important to see to the entirety and therefore the information gathered can only gain
meaning when they are put in the same context. From the entirety, a few specific aspects are chosen to
work further on, thereby leaving out irrelevant aspects. In contrast, a part analysis focuses more on the
different sources instead of the entirety. The information gathered can be seen as independent parts
that are more or less linked to the studied area. The independent parts can eventually be compiled in a
chart and used for analysis to enable an interpretation of the studied area. (Holme & Solvang, 1997)
An example of a part analysis is presented by Björklund and Paulsson (2013) where the use of an
analysis model is described. Björklund and Paulsson (2013) describe an analysis model as a technique
to enable accumulation of information in a structured manner in a chart. They found the usage of
analysis models to be beneficial when performing an evaluation of the collected data. It is possible to
utilize an already existing analysis model but it is also possible to develop an own model adapted to a
specific problem (Björklund & Paulsson, 2013).
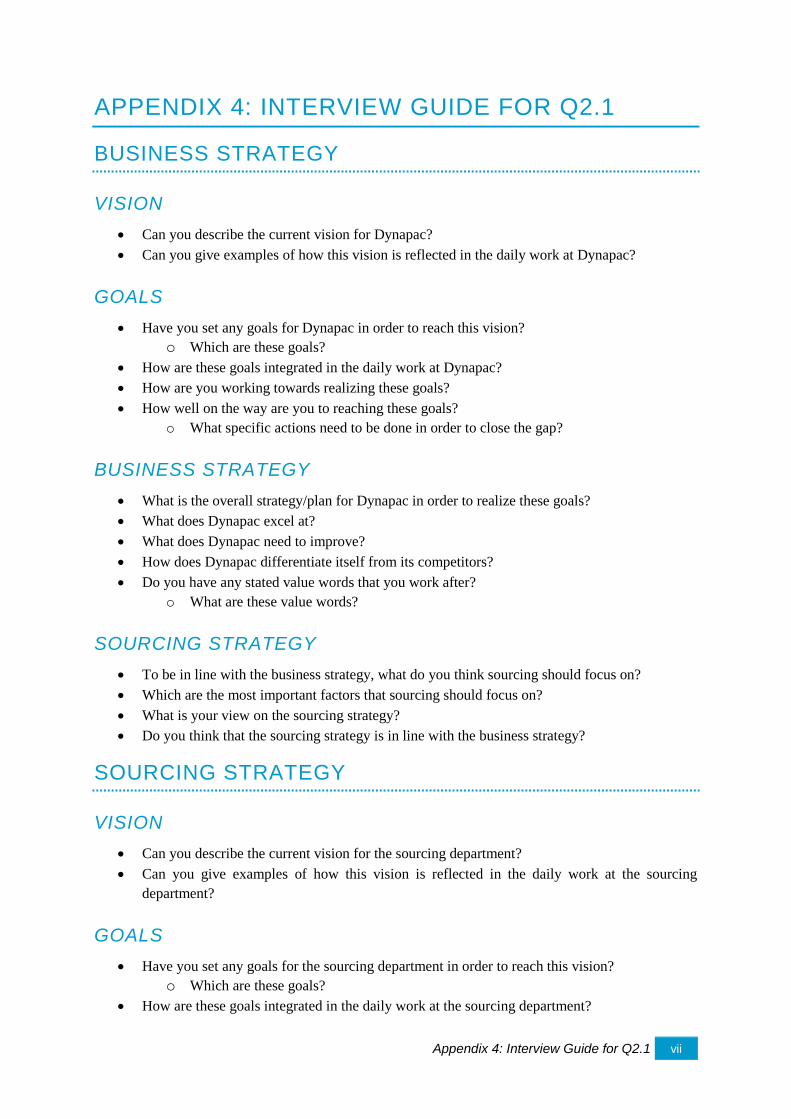
Appendix 4: Interview Guide for Q2.1 vii
APPENDIX 4: INTERVIEW GUIDE FOR Q2.1
BUSINESS STRATEGY
VISION
Can you describe the current vision for Dynapac?
Can you give examples of how this vision is reflected in the daily work at Dynapac?
GOALS
Have you set any goals for Dynapac in order to reach this vision?
o Which are these goals?
How are these goals integrated in the daily work at Dynapac?
How are you working towards realizing these goals?
How well on the way are you to reaching these goals?
o What specific actions need to be done in order to close the gap?
BUSINESS STRATEGY
What is the overall strategy/plan for Dynapac in order to realize these goals?
What does Dynapac excel at?
What does Dynapac need to improve?
How does Dynapac differentiate itself from its competitors?
Do you have any stated value words that you work after?
o What are these value words?
SOURCING STRATEGY
To be in line with the business strategy, what do you think sourcing should focus on?
Which are the most important factors that sourcing should focus on?
What is your view on the sourcing strategy?
Do you think that the sourcing strategy is in line with the business strategy?
SOURCING STRATEGY
VISION
Can you describe the current vision for the sourcing department?
Can you give examples of how this vision is reflected in the daily work at the sourcing
department?
GOALS
Have you set any goals for the sourcing department in order to reach this vision?
o Which are these goals?
How are these goals integrated in the daily work at the sourcing department?
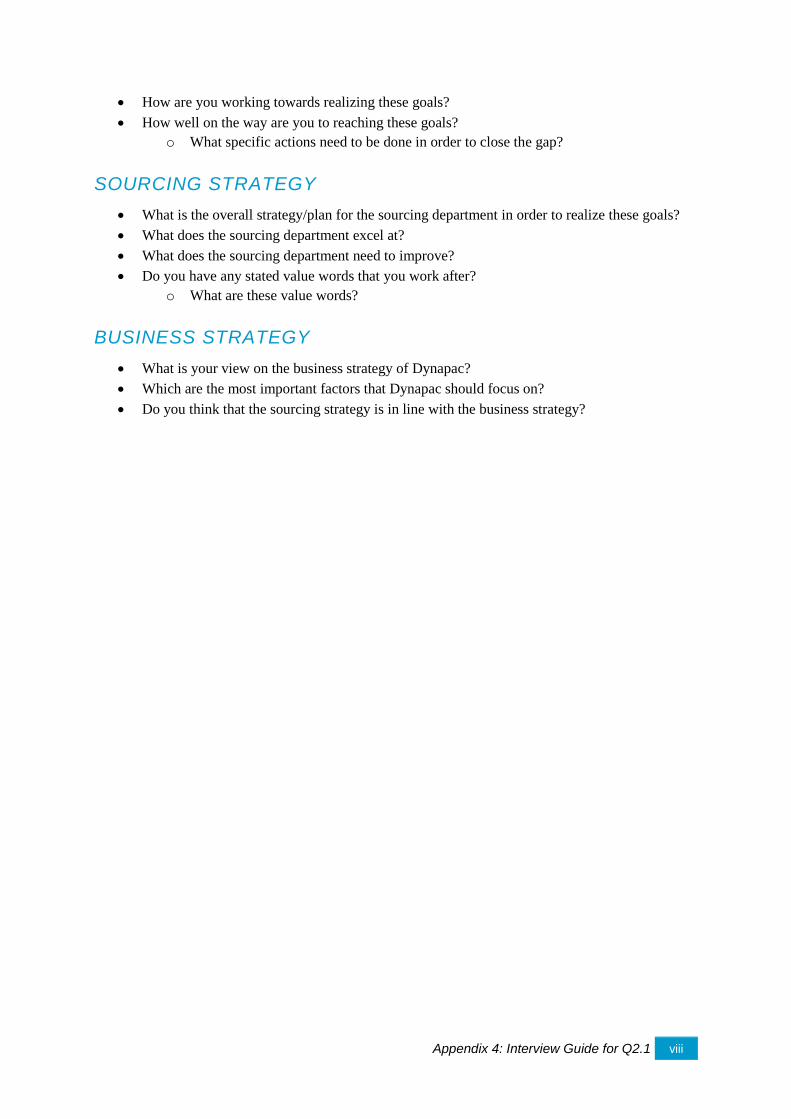
Appendix 4: Interview Guide for Q2.1 viii
How are you working towards realizing these goals?
How well on the way are you to reaching these goals?
o What specific actions need to be done in order to close the gap?
SOURCING STRATEGY
What is the overall strategy/plan for the sourcing department in order to realize these goals?
What does the sourcing department excel at?
What does the sourcing department need to improve?
Do you have any stated value words that you work after?
o What are these value words?
BUSINESS STRATEGY
What is your view on the business strategy of Dynapac?
Which are the most important factors that Dynapac should focus on?
Do you think that the sourcing strategy is in line with the business strategy?
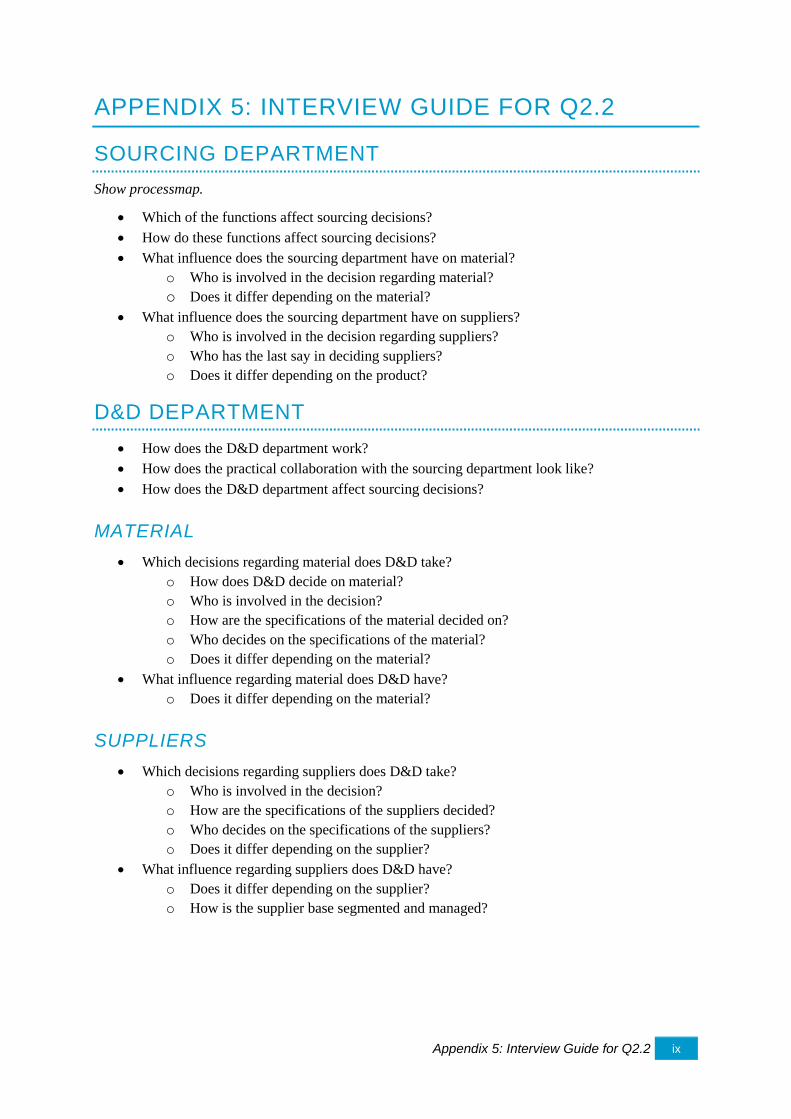
Appendix 5: Interview Guide for Q2.2 ix
APPENDIX 5: INTERVIEW GUIDE FOR Q2.2
SOURCING DEPARTMENT
Show processmap.
Which of the functions affect sourcing decisions?
How do these functions affect sourcing decisions?
What influence does the sourcing department have on material?
o Who is involved in the decision regarding material?
o Does it differ depending on the material?
What influence does the sourcing department have on suppliers?
o Who is involved in the decision regarding suppliers?
o Who has the last say in deciding suppliers?
o Does it differ depending on the product?
D&D DEPARTMENT
How does the D&D department work?
How does the practical collaboration with the sourcing department look like?
How does the D&D department affect sourcing decisions?
MATERIAL
Which decisions regarding material does D&D take?
o How does D&D decide on material?
o Who is involved in the decision?
o How are the specifications of the material decided on?
o Who decides on the specifications of the material?
o Does it differ depending on the material?
What influence regarding material does D&D have?
o Does it differ depending on the material?
SUPPLIERS
Which decisions regarding suppliers does D&D take?
o Who is involved in the decision?
o How are the specifications of the suppliers decided?
o Who decides on the specifications of the suppliers?
o Does it differ depending on the supplier?
What influence regarding suppliers does D&D have?
o Does it differ depending on the supplier?
o How is the supplier base segmented and managed?
Appendix 6: Interview Guide for Q2.3 x
APPENDIX 6: INTERVIEW GUIDE FOR Q2.3
APPEARANCE
Can you shortly describe the supplier base for me?
o How would you say that the supplier base looks like?
How do you think the supplier base will evolve?
o What kind of changes will affect the supplier base?
What are the weaknesses of your supplier base?
What are the strengths of your supplier base?
Do you think the supplier base needs improvement?
o If so, where?
SEGMENTATION
Is the supplier base segmented?
o If so, how is the supplier base segmented?
Which variables are considered in the segmentation?
How were the variables chosen?
How many segments exist?
o How many suppliers exist per segment?
o Does the segmentation work in practice?
Are the segments well balanced?
Does it require some changes?
Do you think the suppliers are correctly segmented?
MANAGEMENT
How does the communication with the suppliers look like?
o Does it differ depending on segment (supplier)?
What kind of relationships with the suppliers is aimed at?
o Does it differ depending on segment (supplier)?
Which segments receive more attention than others?
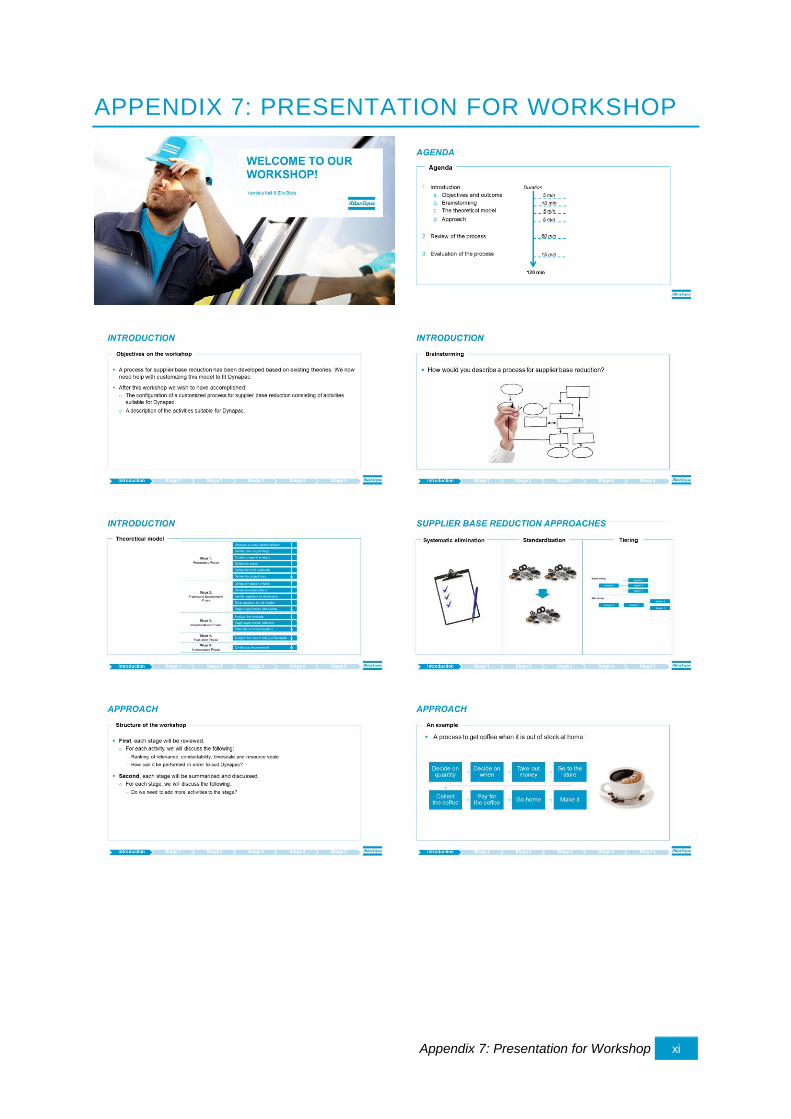
Appendix 7: Presentation for Workshop xi
APPENDIX 7: PRESENTATION FOR WORKSHOP

Appendix 7: Presentation for Workshop xii
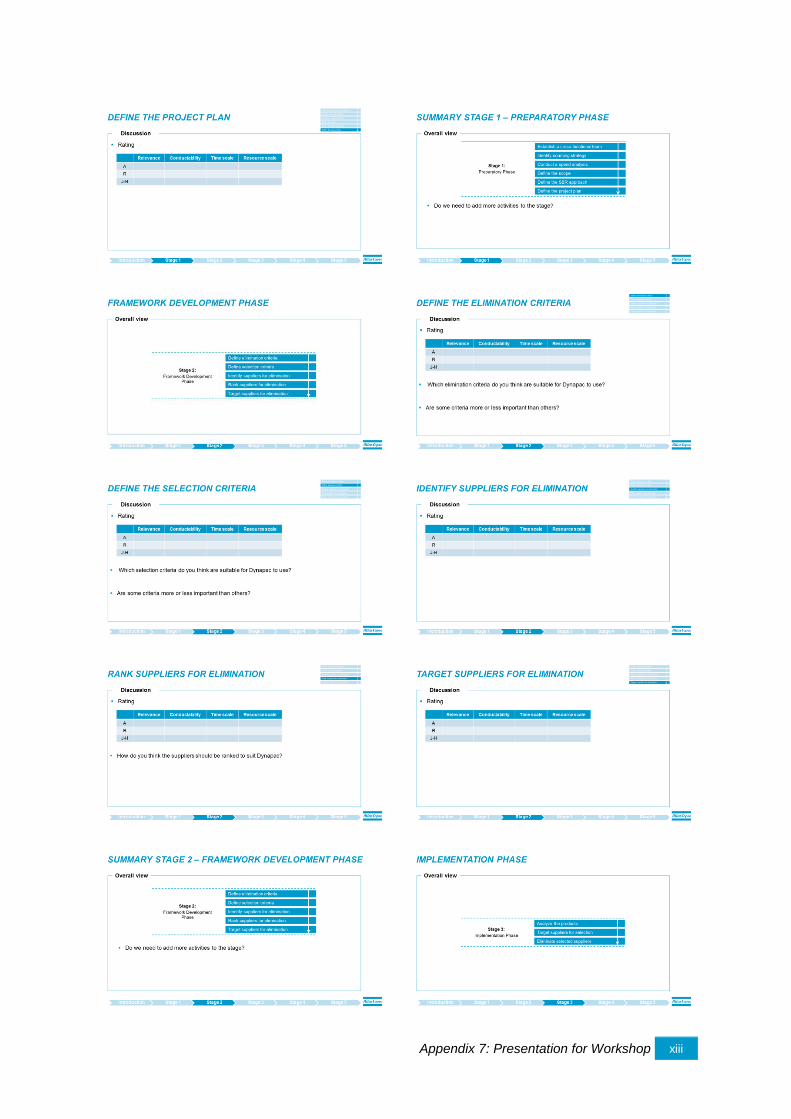
Appendix 7: Presentation for Workshop xiii
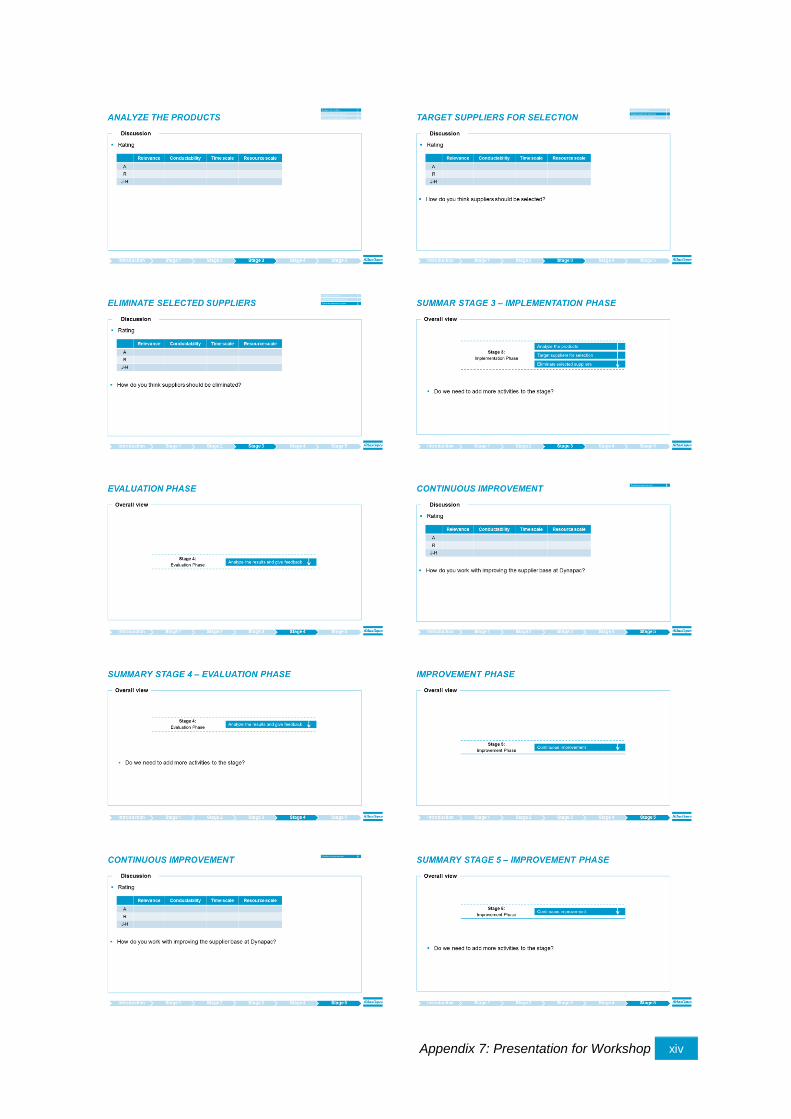
Appendix 7: Presentation for Workshop xiv
Appendix 7: Presentation for Workshop xv
Appendix 8: Summary of Interviews xvi
APPENDIX 8: SUMMARY OF INTERVIEWS
The conducted interviews have been summarized and will be presented below in the order of
appearance in the report. The summaries both include summarized information brought up during the
interviews and specific citations found to be of particular importance.
SUMMARY OF INTERVIEW WITH GENERAL MANAGER
BACKGROUND
Is the general manager for Dynapac in Wardenburg and Vice President for the Production of the
Dynapac Group. He has been working globally within the Atlas Copco Group for over 26 years.
Vision
The vision is to become number one in the market. However, that is not possible at the moment since
Vögele has such a strong market position. Therefore, the aim is to become a strong number two. They
therefore need to grow in volume and market share. However, it is important to point out that it needs
to be a profitable growth.
GOALS
Dynapac has set many KPIs, for example capital employed, cost of products, market share etc. The
general management gives the departments specific targets that they need to work on. For the
Purchasing department it is the lead time, cost, quality, PPM.
Dynapac wishes to become cost leaders. It is the cost of production that is of interest, which includes
purchase value, personal value and overhead value.
Low cost can be defined as being cost efficient but still retaining best quality and best functionality.
It is important to find suppliers that can deliver at lowest possible cost but with high quality.
BUSINESS STRATEGY
Dynapac excel at their product focus. They are good at defining the market and defining their
customer. From that they have designed a few standard products but at the same time they have
managed to remain close to the customer.
Improvements: Everything needs to be improved, and to do so they are watching over the KPI’s to
watch over the trends. It is important that they become more cost efficient.
Dynapc mainly needs to focus on:
Quality: they need to exceed customer’s expectation in regards to quality. This is a moving target that
changes according to what the customer demands.
In production they need to be first time right and quality assurance needs to be present in the entire
production line.
Functionality: they need to meet the customer’s expectation in regards to functionality. There is a
main focus on innovation which engineering takes a big part in. This a moving target that changes
according to what the customer demands.
Cost leadership: they need to be cost efficient.
Appendix 8: Summary of Interviews xvii
Value words: Quality, Functionality and cost leaders
SOURCING STRATEGY
The important factors of sourcing are cost, lead time and quality. They need to assure that they have
the best suppliers regarding all these factors. The cost factor takes into account not only cost but also
quality and lead time. The new sourcing strategy is to strive for a long term relationship with the
supplier with a focus on supplier development, which currently cannot be done due to the size of the
supplier base. The new sourcing strategy also includes the removing of the inspections of deliveries to
Dynapac. Sourcing is not yet in line with the current sourcing strategy but the targets are there and the
suppliers need to be retuned. The sourcing strategy will thereafter be in line with the business strategy
CITATIONS
Vision
“The current vision is to be the number one in the market. In short time this will not happen because
there is a strong number one player in the market. What we want to do today is to be a strong number
two which is growing with a profitable growth. The vision is to grow in the market and become a big
shareholder.”
Business Strategy
“We have many goals and KPIs, for example capital employed, cost of products and market share is
another one. It is never one goal, because it does not function that way.”
“We realize the goals by giving every department specific targets. For instants, in production you will
find stock, lead time, quality, and efficiency. If you look at purchasing: lead time from suppliers, cost,
quality, PPM, or it could be rejection lines. If you look in engineering it is something like: delivery of
projects or the right quality without losing functionality. Every department itself has specific targets.
But the common goal is that we want to profitably grow in market shares.”
“You can always grow, but the growth has to be profitable.”
“We are on a quite good way to become number one, because number one is clearly getting nervous.
The thing is that normally number one is always in a strong position because he is dominant on the
price setting. What we have in our market is that the number one does not really define that he wants
to be the price leader and to set the price on the market.”
“Atlas Copco’s vision is to be cost leader and Atlas Copco has a strong competence of being that and
has a strong knowledge how to make things at the lowest cost, not the cheapest because that is a
different word.”
“Lowest cost means to remake a product where there is now debate on quality, no debate on
functionality but to make it more cost efficient. That is a strong competence and that is there we try to
win.”
“We are very clear in our strategy. We want to be cost leaders, because if you have cost leadership,
you can buy market shares. We will not compare how far we are from the market leader that is not the
goal. We will continuously look for lower costs in production.”
“We want to be a premium mark that is no debate on that and there is no problem to be both cost
leader and a premium mark.”
Appendix 8: Summary of Interviews xviii
“Make sure that our supplier, except for black box items, produce to the lowest cost and that we leave
out a profit margin. Because without profit margin our supplier dies and we will die with them.”
“For black box items we always look for a strong supplier with the right quality at the right cost.”
“Dynapac excels at product focus. We strongly focus on product and try to stick to what gets us most
of the market. It is hard to please everyone, we cannot do that. Based on that we define our market and
customer, define what he needs and for that we make a standard product but of course with different
variations.”
“Strong focus and staying close to the customer is actually an Atlas Copco strategy. In the past,
Dynapac had a more pleasing strategy and was trying to do everything for everybody, it was very
costly.”
“The market leader has a different strategy; their product variation is much higher than ours.”
“Dynapac needs to improve everything, there is always a better way. Continuously we scan our KPIs;
we watch for trends to see if they go in the right direction or if they need to be improved.”
“At this point in time, Dynapac should mostly focus on cost efficiency, because there is where we can
gain. We want to be the cost leader without losing quality and functionality of the customer
expectation, which are two very important side parameters.”
“The goal is to meet the customers’ expectations therefore both quality and functionality are moving
targets. We must exceed customers’ expectations on quality and at least meet the expectations on
functionality. We even try to drive open innovations which mean to create needs for customers that are
not there today.”
“Quality, functionality and cost leadership lay the foundation to the whole strategy.”
Sourcing strategy
“The sourcing strategy is to be the cost leader. We want to make sure that we meet quality
expectations and that the demanded functionalities are there. The purchasing needs to assure first time
right quality. The sourcing strategy comes down to three targets: Cost, lead time and quality. This
means we want to assure that the suppliers produce the components at the right cost and right quality.
Lead time is important because we need flexibility in the business due to the seasonal sales.”
“The sourcing strategy is at the moment not in line with the business strategy, but, the sourcing
strategy has the target to become in line with the business strategy.”
“One reason, why they are not in line is because the suppliers are not yet in our thinking. Dynapac has
changed its thinking from the old way of working to the Atlas Copco thinking, which is new for many
suppliers.”
“The new sourcing strategy is more in line with the business strategy.”
“It is important to involve both engineering and purchasing earlier in the design phase.”
Appendix 8: Summary of Interviews xix
SUMMARY OF INTERVIEW WITH PRODUCT MANAGER
BACKGROUND
The product manager is currently working at the Marketing department as a product manager for large
pavers. His main tasks are to coordinate what the field wants with what the factory produces. He needs
to make sure that Dynapac can offer what the market demands. Marketing also supports the customer
centers in terms of price and answering questions.
VISION
The vision is the vision of Atlas Copco: First in mind, first in choice.
They need to offer the right products with the right specifications, quality and cost.
GOALS
In order to be first in mind, first in choice, Dynapac needs to become market leaders and for that they
need to increase their market share which they have set an internal goal for.
Dynapac also needs to increase the overall profitability, which implies that either the price needs to
increase or the cost needs to be reduced. Since it is difficult to increase the price, they are instead
working on becoming cost leaders. The general management sets overall goals for savings which are
then broken down into targets for the different departments.
Dynapac also wants to become more innovative in order to meet the customers’ demands in the
future. They need to live up to customers’ expectations.
BUSINESS STRATEGY
Dynapac needs to be able to foresee what the customer wants in three years. They do so by gathering
information from the customer. They are also actively visiting the customers to establish a good
relationship.
They try to lower the costs in the production by implementing Lean Production. Furthermore, the
purchasers are working on ensuring that the best material is bought at the best cost.
Value words: innovation, commitment and communication.
SOURCING STRATEGY
The most important factors for sourcing are cost reduction and lead time. Both cost reduction and lead
time are of the same importance but depending on the season that might however differ. For example,
when customers are in line for receiving their new product, the lead time is more important than the
cost. However, Dynapac will not accept cost increases from supplier to get faster delivery, nor will
they buy from more expensive suppliers. During this time the focus from purchase tends to shift from
finding cost reductions to trying to get all the material in on time in the high season.
Currently, the sourcing department is working with implementing supplier base reduction which
according to the product manager is positive and in line with the business strategy. Supplier base
reduction is however hard to achieve without the support from the engineering department. On the
other hand, the engineering department mainly wants to work with developing new products which
Appendix 8: Summary of Interviews xx
makes it difficult to receive help with specifications or changes of a specific component, which are
critical activities for the supplier base reduction process. At the end, lowering the number of suppliers
is a KPI for the Purchasing department and not the D&D department.
Sourcing strategy is according to the product manager in line with the business strategy.
CITATIONS
Business strategy
“Dynapac’s vision is Atlas Copco’s vision which is, first in mind first in choice and to be market
leader.”
“We want to reach the vison by offering the right products regarding specifications, quality, cost and
productivity. We try to foresee what the customer wants in three years so we can develop new
machines which are customized after the new demand.”
“We go to the customers and ask questions as: What do you want? What do you see happening in the
market? What are the new technologies? What are the new trends? How do you see our machine in the
future? By gathering this information we try to come up with an image of how we want our machines
to look like in five years. “
“Realizing the vision, first in mind first in choice, is done by going to customer and trying to catch
what he wants even before he knows he wants it.”
“Our machines are premium machines.”
“Quality and reliability are very important in our business because in the field our product is critical,
meaning that many other resources depends on it. If our machine breaks down we don’t only have the
cost of the machine but also all the other related costs.”
“To be market leader is a very ambitious goal because we have a very strong market leader, but step
by step we want to increase our market share worldwide and increase the profitability.”
“We have goals for market shares and profitability but unfortunately I’m not allowed to disclosure
them.”
“The main strategies for Dynapac is to increase market shares and internally it is to increase
profitability by actively try to reduce costs but of course without sacrificing quality”
“Increasing the price is very hard if you want to win market shares.”
“We want to become cost leader, if you are the cost leader you can buy market shares without
jeopardizing the profitability. In this aspect, we try to become cost leader and this is when sourcing
comes in.”
“Three guiding words from Atlas Copco that we are working after is innovation, commitment and
communication.”
Sourcing strategy
“From an overall business strategy we want to be cost leader and therefore the sourcing should focus
on cost reduction, but they need to keep in mind the lead times.”
“From the market side we try to sell our products at the highest price as possible and from a sourcing
point of view it means to reduce product cost.”
Appendix 8: Summary of Interviews xxi
“The most important factors sourcing should focus on, from a market point of view, are cost and lead
time. If you have cost under control the lead time is most important but they have to come together. At
this moment cost reduction is very important, but due to a seasonal selling the lead time comes up in
ranking.”
“We need to be cost leader in order to realize our overall goals.”
“A good relationship with the engineering and support from them is the most important part when
conducting supplier base reduction. Often supplier base reduction is something people don’t like to do
and it takes a lot of effort. But without engineering support you can forget supplier base reduction.”
“The best thing would be if you can have two suppliers that can offer the same thing.”
“The problem is that the engineering department works with developing new products in a larger scale
than specific components, which the Purchasing department wants them to look at. Reducing the
number of suppliers is an internal KPI for the purchasing organization and the engineering department
doesn’t gain anything from it.”
SUMMARY OF INTERVIEW WITH PURCHASING
MANAGER
SOURCING STRATEGY
At the moment the current sourcing strategy is changing to become more in line with the overall Atlas
Copco strategy. Basically explained, the sourcing strategy is based on three areas: quality, cost and
delivery. The products need to have a high reliability and cannot fail in the field, because if they do
you are out of the business. The sourcing department therefore needs to ensure that the delivered
material is 100% quality assured and for that reason quality is most important.
The stated problem is the large number of suppliers in the supply base. The more suppliers the more
time is needed to manage them. To fulfil the sourcing strategy the supplier base need to be reduced
followed by consolidation of the commodities, but at the same time new suppliers can be added in
order to follow the technology development.
Goals
Quality: The goal connected to quality is the measurement of PPM where the goal is 2000.To reach
this goal a three step approach was defined:
Define which suppliers are critical and which commodities are critical and write them down on a list.
Based on this list, investigate the suppliers with the aim to see how they can assure to deliver 100%
quality. In order to prove it they need to explain how they work with quality and what kind of
processes they use.
Find the loop holes and eliminate them.
Conduct the same process on the rest of the suppliers.
Delivery: The delivery target is set to 96%. They are on a good track to realizing this goal. Before the
delivery percent was 62% and now it is around 85%. In the past there was no link between the
Purchasing department and the suppliers which resulted in that the suppliers were not aware of their
performance. Today, a system which automatically sends a notation to the suppliers with inadequate
performance is in use.
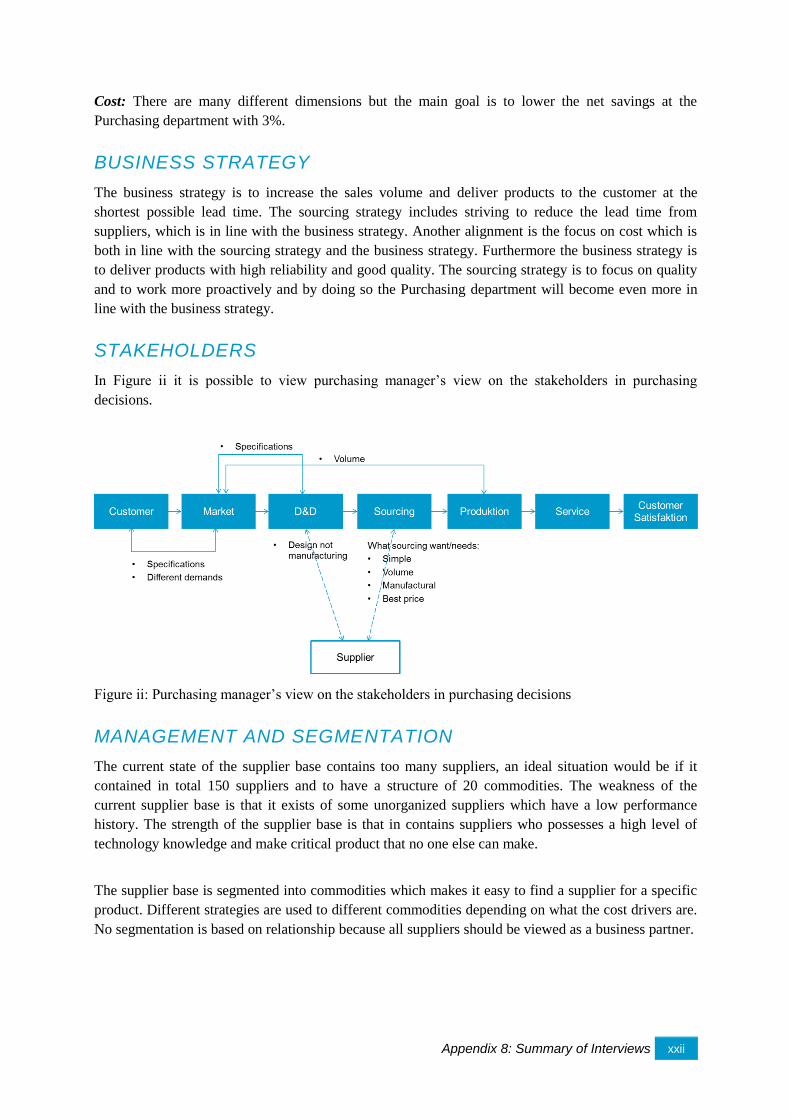
Appendix 8: Summary of Interviews xxii
Cost: There are many different dimensions but the main goal is to lower the net savings at the
Purchasing department with 3%.
BUSINESS STRATEGY
The business strategy is to increase the sales volume and deliver products to the customer at the
shortest possible lead time. The sourcing strategy includes striving to reduce the lead time from
suppliers, which is in line with the business strategy. Another alignment is the focus on cost which is
both in line with the sourcing strategy and the business strategy. Furthermore the business strategy is
to deliver products with high reliability and good quality. The sourcing strategy is to focus on quality
and to work more proactively and by doing so the Purchasing department will become even more in
line with the business strategy.
STAKEHOLDERS
In Figure ii it is possible to view purchasing manager’s view on the stakeholders in purchasing
decisions.
Figure ii: Purchasing manager’s view on the stakeholders in purchasing decisions
MANAGEMENT AND SEGMENTATION
The current state of the supplier base contains too many suppliers, an ideal situation would be if it
contained in total 150 suppliers and to have a structure of 20 commodities. The weakness of the
current supplier base is that it exists of some unorganized suppliers which have a low performance
history. The strength of the supplier base is that in contains suppliers who possesses a high level of
technology knowledge and make critical product that no one else can make.
The supplier base is segmented into commodities which makes it easy to find a supplier for a specific
product. Different strategies are used to different commodities depending on what the cost drivers are.
No segmentation is based on relationship because all suppliers should be viewed as a business partner.
Appendix 8: Summary of Interviews xxiii
CITATIONS
Sourcing strategy
“Dynapac has a different rooted sourcing strategy and the strategy is to align it with the Atlas Copco
strategy by sticking to the basics of sourcing which are cost, quality and delivery.”
“We need to make sure that the products don’t fail in the field because if they do you are out forever,
therefore the sourcing department needs to assure that the delivered material is 100% quality assured.”
“Quality is the most important thing.”
“First of all we have too many suppliers here, the more suppliers, the more you need to maintain them
and the more it costs. First we need to reduce the suppliers and consolidate the commodities.”
“My target is 215 active suppliers.”
“What we have been doing here is mostly firefighting quality issues and from this we want to become
more proactive. In order to become more proactive we have designed three steps, to make it simple in
the beginning. (1) Define what is critical for my business, meaning define critical suppliers and critical
commodities. Make a list of them and approach theses suppliers with the question: How can you
assure that the product you are serving me is 100% quality assured and that it will not fail in the field?
This in order to investigate if the suppliers have an assurance plan and using the right processes. (2)
Document and try to find the loop holes and make sure we can plug them. This means that we might
audit and evaluate the suppliers again. (3) Increase the list and conduct the same process again.”
“Inspecting does not solve the problem. There is no inspectors there are only reactors because most of
the time they react to the part but do not investigate the problem.”
“To realize the strategy specific targets have been set within the three areas: quality, cost and
delivery.”
“To realize the goals linked to quality and delivery, we measure delivery performance and PPM. If the
suppliers are below the target, we inform the result to these suppliers and give them a list of reasons to
choose between why they underperformed. The list forces the supplier to tell us what the problem
was.”
“The natural business strategy within Dynapac is to sell more and deliver products to the customer at
the shortest lead time as possible which means that the delivery performance needs to be high and the
lead times need to be short. This shows that there is an alignment between the business strategy and
sourcing strategy. Another alignment is the continuous focus on getting the cost down which exists in
both strategies. By focusing on a more proactive approach within the sourcing strategy, the sourcing
strategy will become more aligned with the business strategy.”
Effectors on sourcing strategy
“Everything in the value chain affects the Purchasing department, but the most immediate effect
comes from D&D. Therefore D&D affects the most.”
“Deciding the supplier is always the Purchasing department’s decision.”
Management and segmentation
“The supplier base can be described strictly on commodity basis. And thereafter I would decide the
number of supplier per commodity.”
Appendix 8: Summary of Interviews xxiv
“The best case scenario would be to have 150 supplier and maximum 15 commodities, which is a
dream scenario for me.”
“The weakness of the supplier base is that some of our suppliers are not organized and has low
performance. Strengths are that some suppliers are capable of manufacturing complex products to a
reasonable good price and some suppliers are really special with very critical parts that other suppliers
are not capable of manufacturing.”
“I would like to increase the number of critical suppliers to be able to set even higher targets and push
them further.”
“Different strategies are used for different commodities”
“With black box suppliers we use the strategy to have a go-easy policy with the aim to maintain the
supplier.”
“We strive to have long term relationships with all our suppliers, strive to have them as business
partners but also to have backup suppliers.”
“You need to ask the supplier for open book calculations. This is what we push our supplier to give us
but at the end of the day we need to give him some profit margin otherwise he will die and we will die
with him. This is a very important policy in purchasing.”
“The relationship with suppliers has to be really clear; they are business partners and should not be
seen as suppliers. They are the left hand side of our supply chain.”
SUMMARY OF INTERVIEW WITH TEAM LEADER 1
BACKGROUND
Team leader 1 has been working for Dynapac since 2006 when he started in the division aftermarket
for spare parts. In 2011 he started to work within strategic sourcing and is now a team leader.
SOURCING STRATEGY
The main vision is to have a supplier base consisting of the right suppliers at the best cost and quality.
They use specific targets, KPIs, to reach this vision:
Number of suppliers
Suppliers evaluated
Suppliers audited
Delivery performance
PPM
Net savings
Payment days
According to team leader 1, they are on a good way to meeting these goals.
The KPIs were introduced and designed by the new sourcing manager and they are based on his own
targets provided by the general management. They have thereafter been broken down for each team
and for each purchaser. On a weekly basis the teams meet up to discuss the progress of one of the
KPIs. For each week a new KPI is discussed.
Appendix 8: Summary of Interviews xxv
To be able to meet the targets that are set, the sourcing teams work mostly with evaluating suppliers
and finding new suppliers.
One of the sourcing department’s strengths is that they are good at evaluating the suppliers and
maintaining a good relationship with critical suppliers.
A weakness is that they have a bad and unmodern administration flow where fax is still in use.
However, EDI is soon being implemented. Another weakness is that they at the moment have many
targets which therefore make it hard to know which KPI is the most critical one and required most
focus. At the moment there is not enough capacity enough to focus on all.
No value words are in use at the sourcing department.
BUSINESS STRATEGY
The main goal of the company is to win market share and increase volume. The Marketing department
is however very quiet about their strategy and aim.
According to team leader 1, it is important to focus on service and customer satisfaction as well in
order to win market share.
STAKEHOLDERS
According to team leader 1, D&D and Production (inbound logistics) are the departments with most
influence on sourcing.
Relationship with D&D: the sourcing department have a better relationship with the D&D
department now than what they had before. Sourcing becomes involved during development of new
products and can then influence the decisions regarding material. If sourcing finds opportunities for
savings by changing components in the machines, D&D will listen. This also applies when suppliers
come with suggestions. However, it should be noted that there is little capacity at D&D to work on
evaluating suggestions for changes in the machines. In new development teams, sourcing can provide
specialists if it is necessary. Sourcing has the last call when deciding which suppliers to use, however
in some cases there is a need for an early decision regarding some specific components and then the
decision is made together with D&D with the same power.
Paver2014: a running project aiming at improving the existing serial production. In the beginning
there were a lot of changes but now it occurs less frequently. A team working together.
ECN-flow: When a component in a machine is going to change, an engineering change request needs
to be made and then it needs to be approved from all departments before it can be accepted. It goes
through the ECN-flow and at two times there is a meeting where it is decided on the change before it
can be implemented.
CCB-meeting: every Tuesday, all departments participate.
Last year, 300 changes were made.
Black box item: these are specific items that the suppliers have more knowledge about than Dynapac.
Dynapac only sends some general specifications regarding what the product should be able to do and
what it should look like. The supplier then designs the product from these specifications. Therefore,
Dynapac does not know what is inside the product and what material it is made of. Typical black box
items are the remote control, engine, gear box and some hydraulic parts. Dynapac wants to minimize
Appendix 8: Summary of Interviews xxvi
the number of black box items since the aim is to at least be able to apply dual sourcing in order to
have a back-up if quality problems should arise.
Relationship with Production: production decides how they want the components to be delivered.
They provide packaging specifications, such as which carrier to use as well as the quantity, which the
sourcing department needs to follow. There is one standard packing specification but for some special
products it has the packing specifications may differ and therefore needs to be decided on.
For example, for Kanban-products, smaller lot sizes are used with short lead times.
SUPPLIER BASE
Appearance: the current supplier base is viewed as being too big, where around 100 suppliers are
regarded as being more or less unknown to the interviewee. The supplier base consists of many small
suppliers with a low turnover as well as several suppliers supplying special parts, i.e. black box items,
which cannot be purchased from another supplier. For every commodity, they have around 3-4
suppliers. The interviewee wishes to reduce the supplier base and only use around one supplier for
each commodity. The main weakness of the supplier base is its size. The main strength is that there
exist suppliers that help them improve the machines by suggesting possible changes. With these
suppliers, sourcing maintain a good relationship.
Segmentation: today the department is segmented based on commodities. However, they segment out
critical suppliers who receive more attention than other suppliers. These suppliers provide special and
critical components that can disrupt the production if they are not delivered in time or with the right
quality. Therefore, they are regularly controlled on their delivery performance and PPM, which is
communicated to the suppliers so they know if they need to improve.
Suppliers are also ranked in order of preference in the order of one, two and three. From this list,
category 3-suppliers are not to be used in new projects. However, this segmentation doesn’t affect the
relationship.
The interviewee is of the opinion that at times some suppliers receive too much attention compared to
their turnover. He therefore expresses the wish to use a classification to provide more guidance of
which suppliers should receive more focus. A possible segmentation is to use the variables “Buyer’s
power” and “Supplier’s power” to decide which relationship is most suitable.
Management:
Communication: suppliers are contacted when there is a new development in process or when a
problem as occurred. Personal meeting is preferred; however it is always good to have it in print as
well. The suppliers receive more communication than before in terms of a monthly report based on the
KPI-progress. Sourcing also ask for open book calculations when requesting a price.
As a way to eliminate critical suppliers with low number of products, sourcing is investigating the use
of a distributor for these products. The wish is to only use one distributor who can replace a number of
suppliers with small turnovers. But before this can become an option, the action towards changing the
specifications of the products in order to make them more standardized must be investigated.
CITATIONS
Sourcing strategy
“The vision [for the sourcing department], in general, is to find the right suppliers for us and for our
products, based on the best cost level and quality level.”
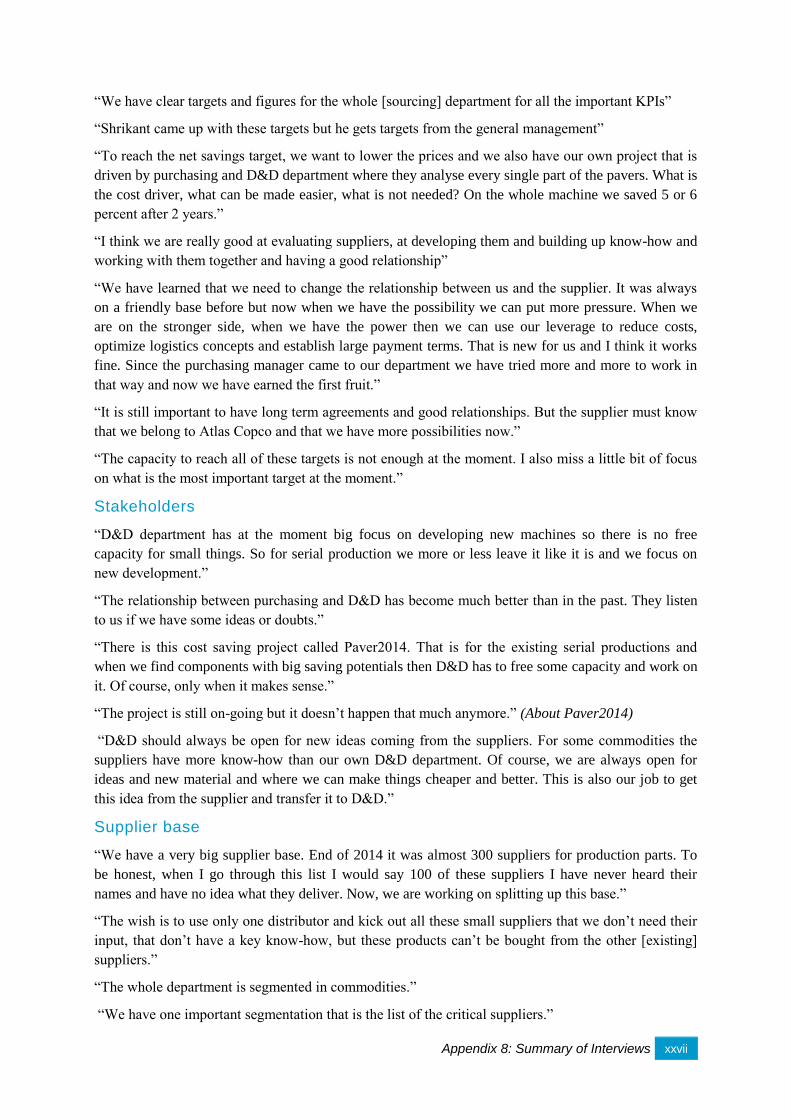
Appendix 8: Summary of Interviews xxvii
“We have clear targets and figures for the whole [sourcing] department for all the important KPIs”
“Shrikant came up with these targets but he gets targets from the general management”
“To reach the net savings target, we want to lower the prices and we also have our own project that is
driven by purchasing and D&D department where they analyse every single part of the pavers. What is
the cost driver, what can be made easier, what is not needed? On the whole machine we saved 5 or 6
percent after 2 years.”
“I think we are really good at evaluating suppliers, at developing them and building up know-how and
working with them together and having a good relationship”
“We have learned that we need to change the relationship between us and the supplier. It was always
on a friendly base before but now when we have the possibility we can put more pressure. When we
are on the stronger side, when we have the power then we can use our leverage to reduce costs,
optimize logistics concepts and establish large payment terms. That is new for us and I think it works
fine. Since the purchasing manager came to our department we have tried more and more to work in
that way and now we have earned the first fruit.”
“It is still important to have long term agreements and good relationships. But the supplier must know
that we belong to Atlas Copco and that we have more possibilities now.”
“The capacity to reach all of these targets is not enough at the moment. I also miss a little bit of focus
on what is the most important target at the moment.”
Stakeholders
“D&D department has at the moment big focus on developing new machines so there is no free
capacity for small things. So for serial production we more or less leave it like it is and we focus on
new development.”
“The relationship between purchasing and D&D has become much better than in the past. They listen
to us if we have some ideas or doubts.”
“There is this cost saving project called Paver2014. That is for the existing serial productions and
when we find components with big saving potentials then D&D has to free some capacity and work on
it. Of course, only when it makes sense.”
“The project is still on-going but it doesn’t happen that much anymore.” (About Paver2014)
“D&D should always be open for new ideas coming from the suppliers. For some commodities the
suppliers have more know-how than our own D&D department. Of course, we are always open for
ideas and new material and where we can make things cheaper and better. This is also our job to get
this idea from the supplier and transfer it to D&D.”
Supplier base
“We have a very big supplier base. End of 2014 it was almost 300 suppliers for production parts. To
be honest, when I go through this list I would say 100 of these suppliers I have never heard their
names and have no idea what they deliver. Now, we are working on splitting up this base.”
“The wish is to use only one distributor and kick out all these small suppliers that we don’t need their
input, that don’t have a key know-how, but these products can’t be bought from the other [existing]
suppliers.”
“The whole department is segmented in commodities.”
“We have one important segmentation that is the list of the critical suppliers.”
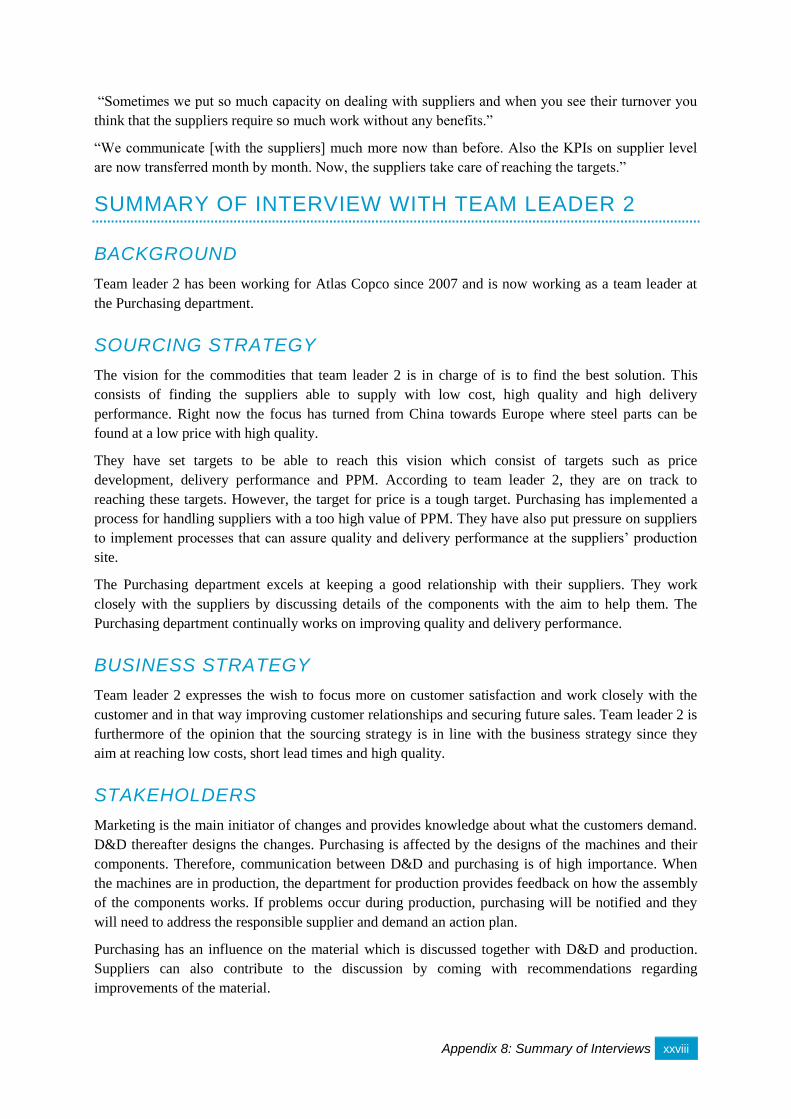
Appendix 8: Summary of Interviews xxviii
“Sometimes we put so much capacity on dealing with suppliers and when you see their turnover you
think that the suppliers require so much work without any benefits.”
“We communicate [with the suppliers] much more now than before. Also the KPIs on supplier level
are now transferred month by month. Now, the suppliers take care of reaching the targets.”
SUMMARY OF INTERVIEW WITH TEAM LEADER 2
BACKGROUND
Team leader 2 has been working for Atlas Copco since 2007 and is now working as a team leader at
the Purchasing department.
SOURCING STRATEGY
The vision for the commodities that team leader 2 is in charge of is to find the best solution. This
consists of finding the suppliers able to supply with low cost, high quality and high delivery
performance. Right now the focus has turned from China towards Europe where steel parts can be
found at a low price with high quality.
They have set targets to be able to reach this vision which consist of targets such as price
development, delivery performance and PPM. According to team leader 2, they are on track to
reaching these targets. However, the target for price is a tough target. Purchasing has implemented a
process for handling suppliers with a too high value of PPM. They have also put pressure on suppliers
to implement processes that can assure quality and delivery performance at the suppliers’ production
site.
The Purchasing department excels at keeping a good relationship with their suppliers. They work
closely with the suppliers by discussing details of the components with the aim to help them. The
Purchasing department continually works on improving quality and delivery performance.
BUSINESS STRATEGY
Team leader 2 expresses the wish to focus more on customer satisfaction and work closely with the
customer and in that way improving customer relationships and securing future sales. Team leader 2 is
furthermore of the opinion that the sourcing strategy is in line with the business strategy since they
aim at reaching low costs, short lead times and high quality.
STAKEHOLDERS
Marketing is the main initiator of changes and provides knowledge about what the customers demand.
D&D thereafter designs the changes. Purchasing is affected by the designs of the machines and their
components. Therefore, communication between D&D and purchasing is of high importance. When
the machines are in production, the department for production provides feedback on how the assembly
of the components works. If problems occur during production, purchasing will be notified and they
will need to address the responsible supplier and demand an action plan.
Purchasing has an influence on the material which is discussed together with D&D and production.
Suppliers can also contribute to the discussion by coming with recommendations regarding
improvements of the material.
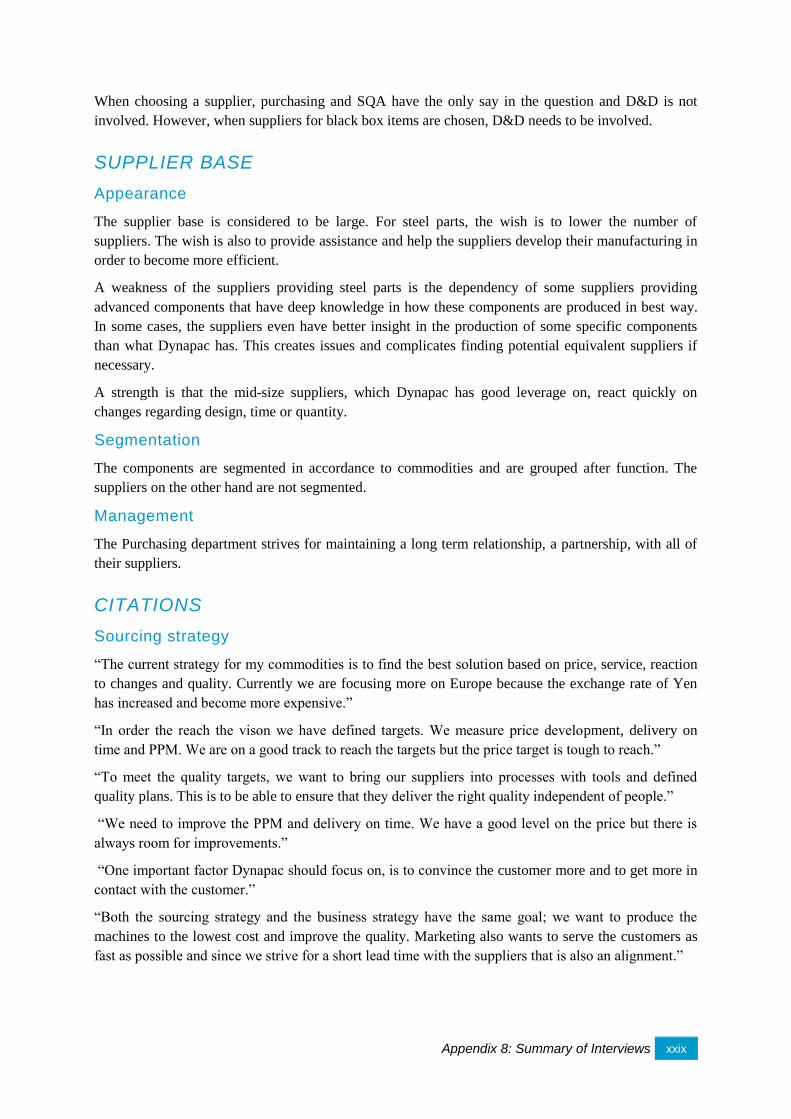
Appendix 8: Summary of Interviews xxix
When choosing a supplier, purchasing and SQA have the only say in the question and D&D is not
involved. However, when suppliers for black box items are chosen, D&D needs to be involved.
SUPPLIER BASE
Appearance
The supplier base is considered to be large. For steel parts, the wish is to lower the number of
suppliers. The wish is also to provide assistance and help the suppliers develop their manufacturing in
order to become more efficient.
A weakness of the suppliers providing steel parts is the dependency of some suppliers providing
advanced components that have deep knowledge in how these components are produced in best way.
In some cases, the suppliers even have better insight in the production of some specific components
than what Dynapac has. This creates issues and complicates finding potential equivalent suppliers if
necessary.
A strength is that the mid-size suppliers, which Dynapac has good leverage on, react quickly on
changes regarding design, time or quantity.
Segmentation
The components are segmented in accordance to commodities and are grouped after function. The
suppliers on the other hand are not segmented.
Management
The Purchasing department strives for maintaining a long term relationship, a partnership, with all of
their suppliers.
CITATIONS
Sourcing strategy
“The current strategy for my commodities is to find the best solution based on price, service, reaction
to changes and quality. Currently we are focusing more on Europe because the exchange rate of Yen
has increased and become more expensive.”
“In order the reach the vison we have defined targets. We measure price development, delivery on
time and PPM. We are on a good track to reach the targets but the price target is tough to reach.”
“To meet the quality targets, we want to bring our suppliers into processes with tools and defined
quality plans. This is to be able to ensure that they deliver the right quality independent of people.”
“We need to improve the PPM and delivery on time. We have a good level on the price but there is
always room for improvements.”
“One important factor Dynapac should focus on, is to convince the customer more and to get more in
contact with the customer.”
“Both the sourcing strategy and the business strategy have the same goal; we want to produce the
machines to the lowest cost and improve the quality. Marketing also wants to serve the customers as
fast as possible and since we strive for a short lead time with the suppliers that is also an alignment.”
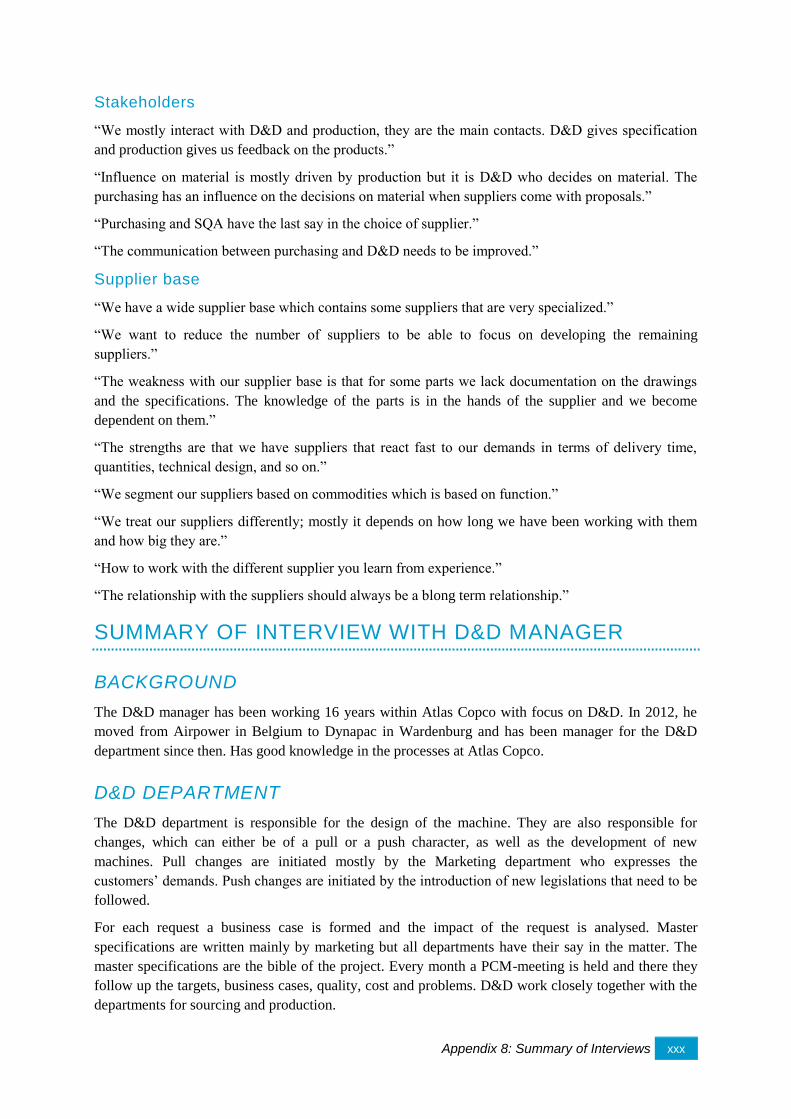
Appendix 8: Summary of Interviews xxx
Stakeholders
“We mostly interact with D&D and production, they are the main contacts. D&D gives specification
and production gives us feedback on the products.”
“Influence on material is mostly driven by production but it is D&D who decides on material. The
purchasing has an influence on the decisions on material when suppliers come with proposals.”
“Purchasing and SQA have the last say in the choice of supplier.”
“The communication between purchasing and D&D needs to be improved.”
Supplier base
“We have a wide supplier base which contains some suppliers that are very specialized.”
“We want to reduce the number of suppliers to be able to focus on developing the remaining
suppliers.”
“The weakness with our supplier base is that for some parts we lack documentation on the drawings
and the specifications. The knowledge of the parts is in the hands of the supplier and we become
dependent on them.”
“The strengths are that we have suppliers that react fast to our demands in terms of delivery time,
quantities, technical design, and so on.”
“We segment our suppliers based on commodities which is based on function.”
“We treat our suppliers differently; mostly it depends on how long we have been working with them
and how big they are.”
“How to work with the different supplier you learn from experience.”
“The relationship with the suppliers should always be a blong term relationship.”
SUMMARY OF INTERVIEW WITH D&D MANAGER
BACKGROUND
The D&D manager has been working 16 years within Atlas Copco with focus on D&D. In 2012, he
moved from Airpower in Belgium to Dynapac in Wardenburg and has been manager for the D&D
department since then. Has good knowledge in the processes at Atlas Copco.
D&D DEPARTMENT
The D&D department is responsible for the design of the machine. They are also responsible for
changes, which can either be of a pull or a push character, as well as the development of new
machines. Pull changes are initiated mostly by the Marketing department who expresses the
customers’ demands. Push changes are initiated by the introduction of new legislations that need to be
followed.
For each request a business case is formed and the impact of the request is analysed. Master
specifications are written mainly by marketing but all departments have their say in the matter. The
master specifications are the bible of the project. Every month a PCM-meeting is held and there they
follow up the targets, business cases, quality, cost and problems. D&D work closely together with the
departments for sourcing and production.
Appendix 8: Summary of Interviews xxxi
D&D starts by making the drawings of the machine. First, the drawing is in 3D and before the
drawings are transferred to 2D, a preview together with people from all of the departments is held.
This is called a virtual design. The design needs to be approved by all affected departments before it is
transferred to 2D drawings. Before the drawings are frozen, D&D go to the sourcing department to
make sure that the components can be found and thereafter sourcing needs to approve the drawings.
To avoid iterations they like to do it the first time right. D&D also goes to production and SQA for
approval. They need two to four signatures before the drawings can be released. Then the components
can be bought and the machine can be built.
The D&D department is project-driven and maintenance-driven. At this moment the D&D department
works on 5 to 6 big projects and is at over capacity. Additionally, they also have maintenance projects.
When the D&D is on over capacity they can outsource resources by hiring Atlas Copco consultants
from a bureau in India called Semtec.
Every Tuesday there is a CCB-meeting (change board) where everybody comes with the reason why
they need to change something. The approved changes need to be implemented where D&D has one of
the roles. A complete implementation of a change can last up to six months where D&D only takes
part in the first stages.
ECR (engineering change request) → ECN (engineering change notification)
SOURCING DEPARTMENT
D&D chooses suitable material for the machine based on their experience and knowledge. The
sourcing seldom has opinions regarding the material. The relationship between sourcing and D&D
needs to be improved and a stronger team feeling should be pursued. The management therefore
encourages and pushes the employees to interact with each other through calling or talking in person
when a problem occurs instead of emailing.
D&D considers the target of purchasing, to reduce the number of suppliers, to be a good target and
believes that standardization is a good and possible solution. Currently the D&D department is
working on finding standardizations and before designing a new component they need to ensure that
no already existing component can be reused.
CITATIONS
“In a paver we have around 1700 different parts.”
“We are not involved in the decision of the suppliers. The decision regarding suppliers of black box
items is a strategic upfront decision, a management decision, and therefore not an engineering
decision.”
“The relationship between D&D and purchasing needs to be improved.”
“My personal attitude is, if I have a problem I call or go and talk to them in person instead of
emailing. We do it together and I feel we need to improve and get a stronger team feeling - I help you,
you help me.”
“This is not just a problem here at Dynapac it appears in almost every company.”
“The commitment is different if we get a personal contact, therefore both the purchasing manager and
I are pushing our people to get a more personal contact between us to create a better team feeling “
Appendix 8: Summary of Interviews xxxii
“It is personal driven. The problem is that the most common personality at the D&D department is
introvert. It’s improving, but we need to “massage” our employees and push them to get a stronger
personal connection.”
“Our approach is to reuse components before designing new once and the vision is to use more
standardization.”
“Before everybody in the D&D could choose freely from a catalogue for the parts they needed, this
resulted in a huge amount of products and sometimes they even were similar. For example, we had
four different part numbers for the same component. Furthermore, Dynapac has been acquired from
many different companies and every company wants to use their standard components which of course
also contributed to the large product base.”
“We are making a list of all used components at the different Dynapac production companies. Not to
help sourcing but to help our customers by using more of the same parts across the Dynapac group.
The result is that the customer can use a spare part to a product independently from which production
unit the product has been manufactured at.”
The goal of purchasing, to reduce the number of suppliers, is good. But it is important to not reduce
too much, so the competition becomes too low.”
“The strength is that we work more up front and think about the cost impact in the planning phase
which is something we do well. The weakness is the communication and interaction between the
departments.”
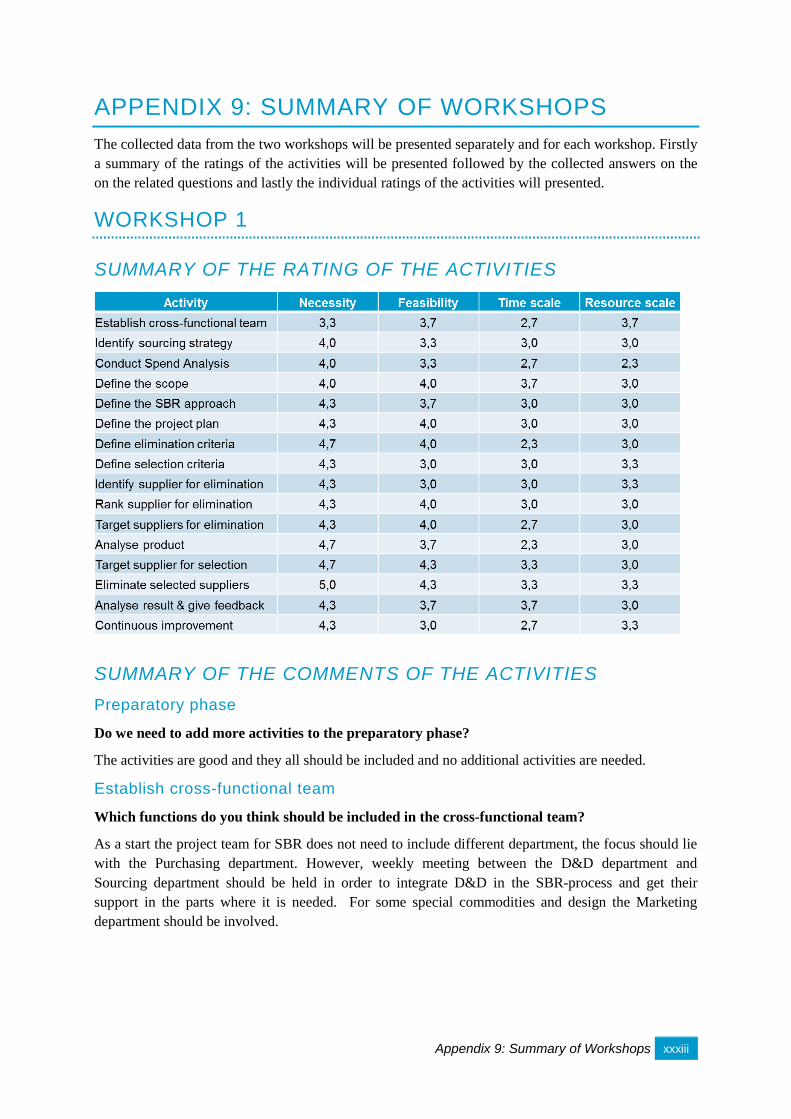
Appendix 9: Summary of Workshops xxxiii
APPENDIX 9: SUMMARY OF WORKSHOPS
The collected data from the two workshops will be presented separately and for each workshop. Firstly
a summary of the ratings of the activities will be presented followed by the collected answers on the
on the related questions and lastly the individual ratings of the activities will presented.
WORKSHOP 1
SUMMARY OF THE RATING OF THE ACTIVITIES
SUMMARY OF THE COMMENTS OF THE ACTIVITIES
Preparatory phase
Do we need to add more activities to the preparatory phase?
The activities are good and they all should be included and no additional activities are needed.
Establish cross-functional team
Which functions do you think should be included in the cross-functional team?
As a start the project team for SBR does not need to include different department, the focus should lie
with the Purchasing department. However, weekly meeting between the D&D department and
Sourcing department should be held in order to integrate D&D in the SBR-process and get their
support in the parts where it is needed. For some special commodities and design the Marketing
department should be involved.
Appendix 9: Summary of Workshops xxxiv
Define the scope
Which areas of the supplier base do you think can be of interest?
Indirect material is not interesting to look in terms of SBR, the most interesting area for SBR is direct
material. Concerning direct material it is most interesting to focus on are: C-material (components
with a high volume but low cost), Steel components (B-, C-material). The other commodities can be
hard to apply SBR on.
Define the SBR approach
Which approaches do you think are possible to perform at Dynapac?
The order of the approaches should be the following:
1. Systematic elimination, this because it is the easiest approach and a good way to start to
process and to reduce the number of suppliers.
2. Standardization, here help from the D&D department is needed. This is also is in line with
their current work to try to find opportunities for standardization of components and to reuse
as many components as possible.
3. Tiering, this approach should be investigated if the above approaches do not work. This
approach do not applies for all components for example not for steel component and black box
items. Currently we are investigating a supplier in Wilhelmshaven to provide this service for
some of our components.
Framework development phase
Do we need to add more activities to the frame work developing phase?
Many steps seem to be very similar and almost the same an idea can be to combined some of the steps
in order to make the process easier to understand. For example can identification, ranking and target
be combined to one step.
Define elimination criteria
Which elimination criteria do you think are suitable for Dynapac to use?
Turnover and amount of parts (forecast), latest PPM, supplier risk (bankruptcy, stability), delivery
performance.
Are some criteria more or less important than others?
The criteria which are considered to be more of importance are presented in the order where the most
important criteria is presented first.
Turnover and amount of parts – easy to reduce
Delivery performance and PPM
Supplier risk
Appendix 9: Summary of Workshops xxxv
Define selection critieria
Which selection criteria do you think are suitable for Dynapac to use?
Price, PPM, delivery performance, type of delivery kamban or not, amount of problems, (turnover)
Are some criteria more or less important than others?
The criteria which are considered to be more of importance are presented in the order where the most
important criteria is presented first.
- Price
- Delivery performance and PPM
- Amount of problems
- Turnover
Rank suppliers for elimination
How do you think the suppliers should be ranked to suit Dynapac?
They should be ranked after the following criteria: turnover, parts, forecast, poor delivery performance
and PPM mostly they are ranked at turnover and parts.
Implementation phase
Do we need to add more activities to the implementation phase?
The activities are good and they all should be included in the phase and no additional activities are
needed.
Target suppliers for selection
How do you think the suppliers should be selected?
By ending out Enquiries (RFQ) to suppliers and thereafter analyse the different offers. The supplier
also needs to send a sample which must be checked, if the sample is ok the supplier can be approved.
Eliminate selected suppliers
How do you think suppliers should be eliminated?
Usually, the supplier knows that they are going to be eliminated based on the forecasts and no ordering
income. Before a supplier is going to be eliminated they should be in contacted from us, either by
email, a call or on a meeting where they are given an explanation to why there are eliminated. It is
important to remember to make a good ending with the supplier because we might come back to them
or they will still supply spare parts.
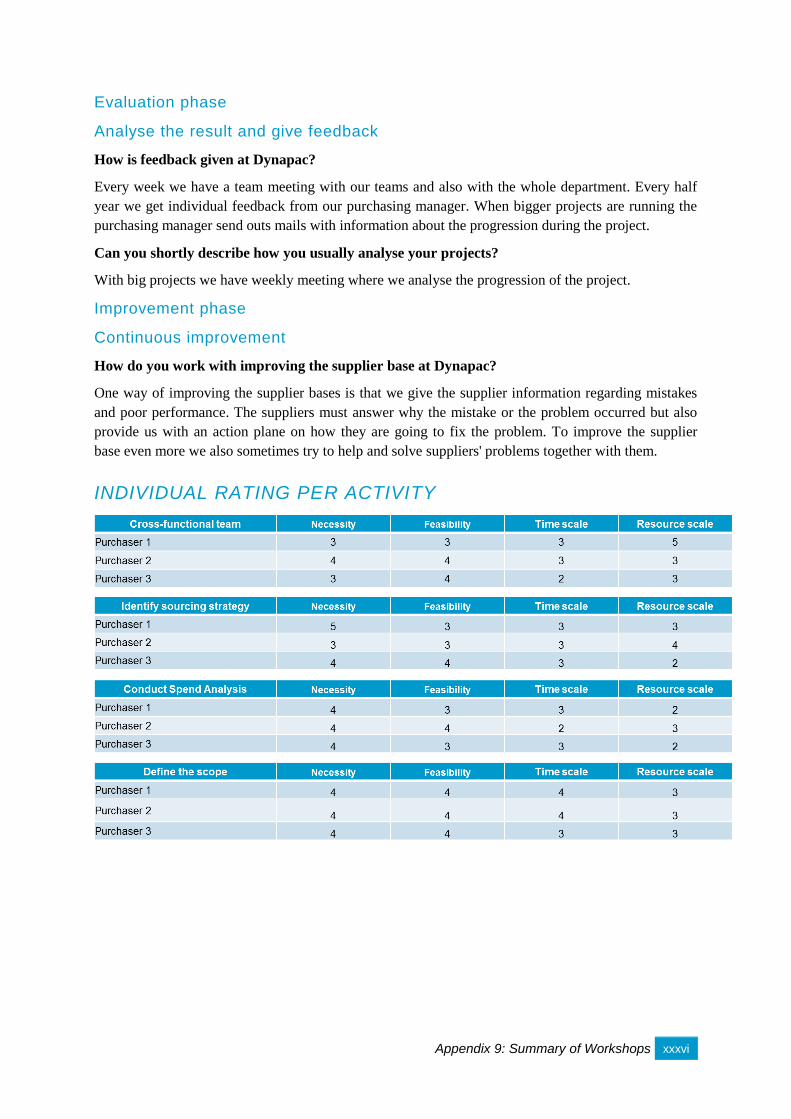
Appendix 9: Summary of Workshops xxxvi
Evaluation phase
Analyse the result and give feedback
How is feedback given at Dynapac?
Every week we have a team meeting with our teams and also with the whole department. Every half
year we get individual feedback from our purchasing manager. When bigger projects are running the
purchasing manager send outs mails with information about the progression during the project.
Can you shortly describe how you usually analyse your projects?
With big projects we have weekly meeting where we analyse the progression of the project.
Improvement phase
Continuous improvement
How do you work with improving the supplier base at Dynapac?
One way of improving the supplier bases is that we give the supplier information regarding mistakes
and poor performance. The suppliers must answer why the mistake or the problem occurred but also
provide us with an action plane on how they are going to fix the problem. To improve the supplier
base even more we also sometimes try to help and solve suppliers' problems together with them.
INDIVIDUAL RATING PER ACTIVITY
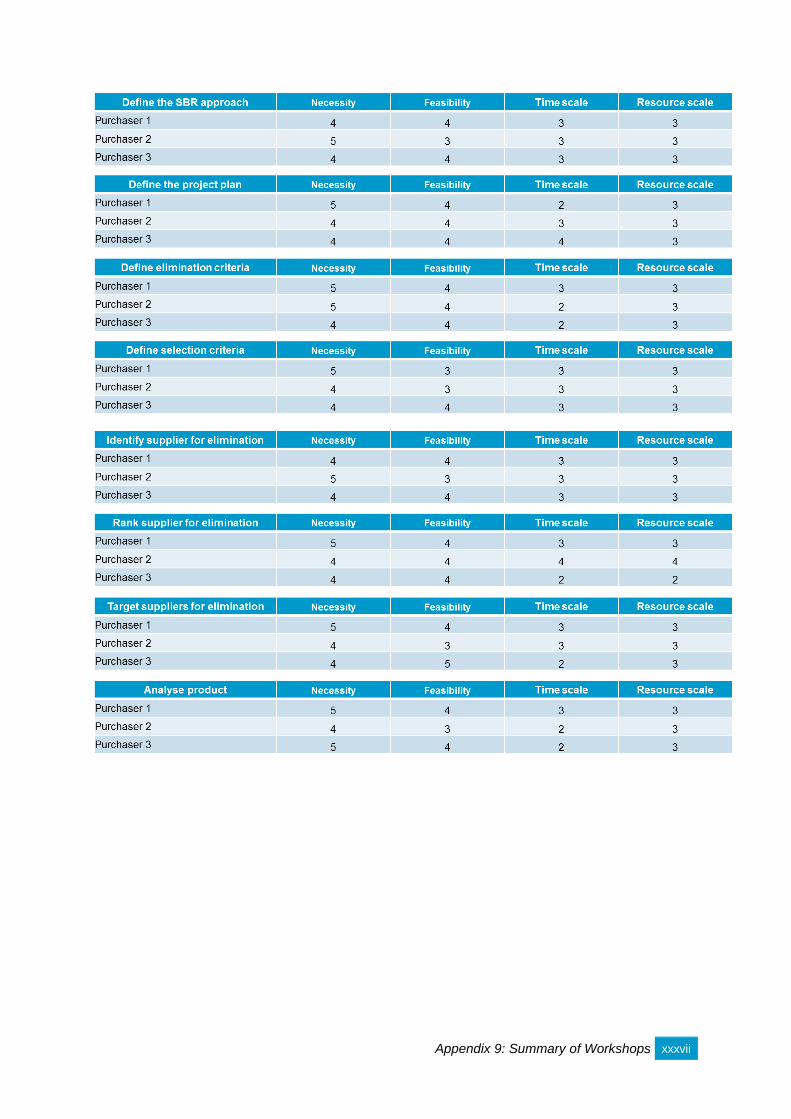
Appendix 9: Summary of Workshops xxxvii
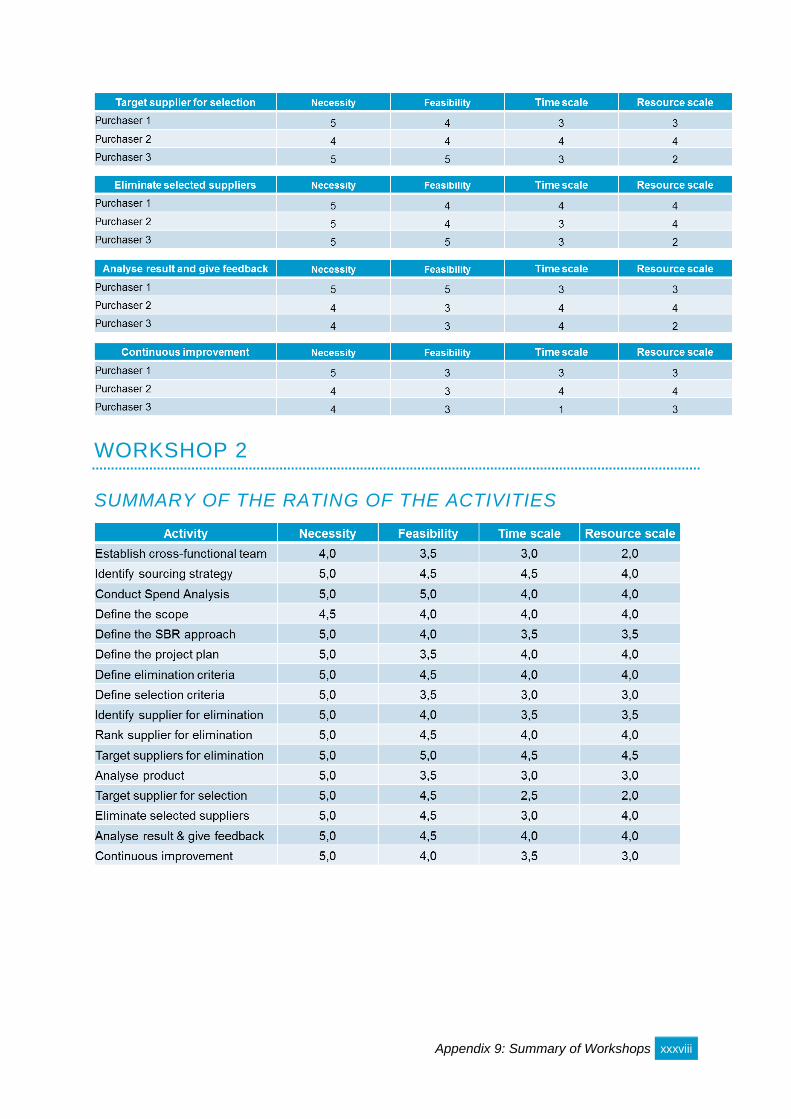
Appendix 9: Summary of Workshops xxxviii
WORKSHOP 2
SUMMARY OF THE RATING OF THE ACTIVITIES
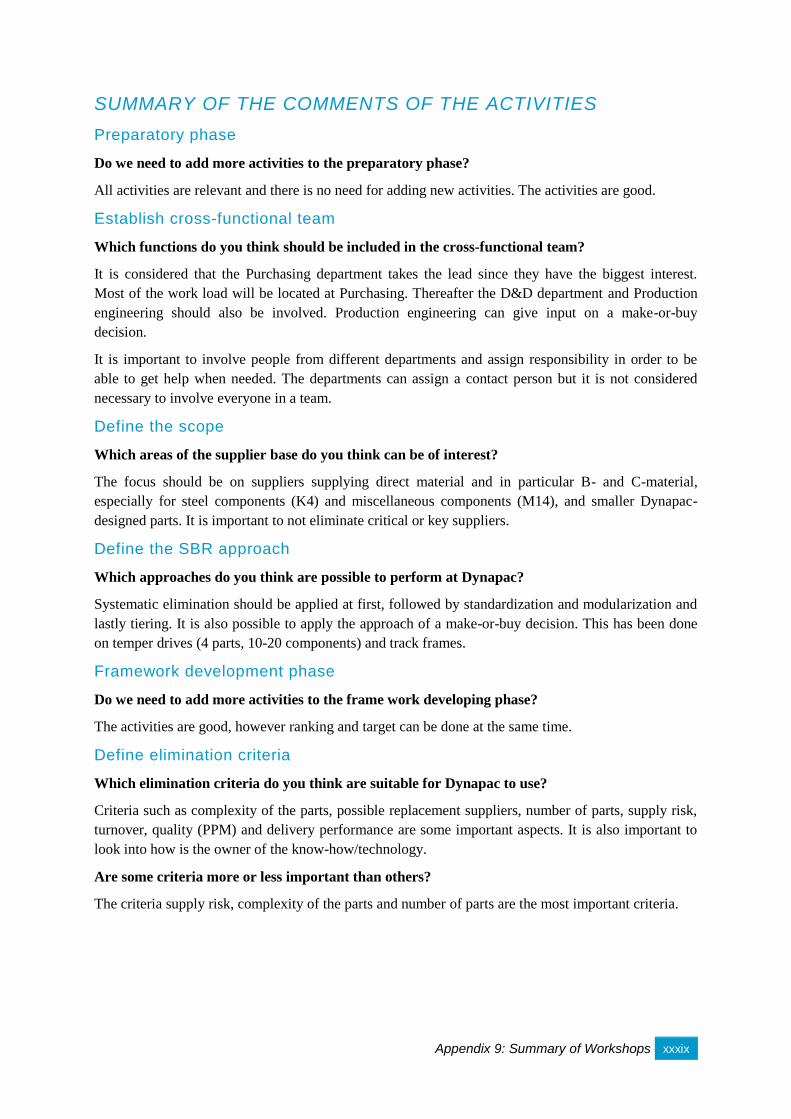
Appendix 9: Summary of Workshops xxxix
SUMMARY OF THE COMMENTS OF THE ACTIVITIES
Preparatory phase
Do we need to add more activities to the preparatory phase?
All activities are relevant and there is no need for adding new activities. The activities are good.
Establish cross-functional team
Which functions do you think should be included in the cross-functional team?
It is considered that the Purchasing department takes the lead since they have the biggest interest.
Most of the work load will be located at Purchasing. Thereafter the D&D department and Production
engineering should also be involved. Production engineering can give input on a make-or-buy
decision.
It is important to involve people from different departments and assign responsibility in order to be
able to get help when needed. The departments can assign a contact person but it is not considered
necessary to involve everyone in a team.
Define the scope
Which areas of the supplier base do you think can be of interest?
The focus should be on suppliers supplying direct material and in particular B- and C-material,
especially for steel components (K4) and miscellaneous components (M14), and smaller Dynapac-
designed parts. It is important to not eliminate critical or key suppliers.
Define the SBR approach
Which approaches do you think are possible to perform at Dynapac?
Systematic elimination should be applied at first, followed by standardization and modularization and
lastly tiering. It is also possible to apply the approach of a make-or-buy decision. This has been done
on temper drives (4 parts, 10-20 components) and track frames.
Framework development phase
Do we need to add more activities to the frame work developing phase?
The activities are good, however ranking and target can be done at the same time.
Define elimination criteria
Which elimination criteria do you think are suitable for Dynapac to use?
Criteria such as complexity of the parts, possible replacement suppliers, number of parts, supply risk,
turnover, quality (PPM) and delivery performance are some important aspects. It is also important to
look into how is the owner of the know-how/technology.
Are some criteria more or less important than others?
The criteria supply risk, complexity of the parts and number of parts are the most important criteria.
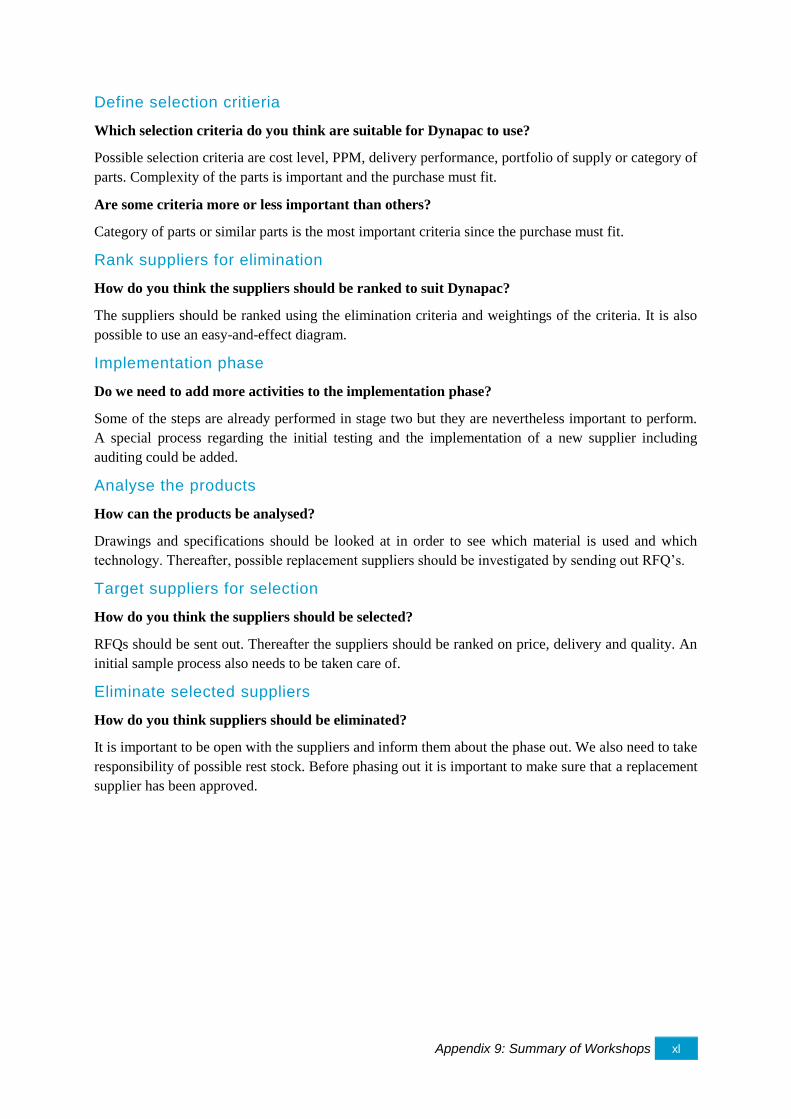
Appendix 9: Summary of Workshops xl
Define selection critieria
Which selection criteria do you think are suitable for Dynapac to use?
Possible selection criteria are cost level, PPM, delivery performance, portfolio of supply or category of
parts. Complexity of the parts is important and the purchase must fit.
Are some criteria more or less important than others?
Category of parts or similar parts is the most important criteria since the purchase must fit.
Rank suppliers for elimination
How do you think the suppliers should be ranked to suit Dynapac?
The suppliers should be ranked using the elimination criteria and weightings of the criteria. It is also
possible to use an easy-and-effect diagram.
Implementation phase
Do we need to add more activities to the implementation phase?
Some of the steps are already performed in stage two but they are nevertheless important to perform.
A special process regarding the initial testing and the implementation of a new supplier including
auditing could be added.
Analyse the products
How can the products be analysed?
Drawings and specifications should be looked at in order to see which material is used and which
technology. Thereafter, possible replacement suppliers should be investigated by sending out RFQ’s.
Target suppliers for selection
How do you think the suppliers should be selected?
RFQs should be sent out. Thereafter the suppliers should be ranked on price, delivery and quality. An
initial sample process also needs to be taken care of.
Eliminate selected suppliers
How do you think suppliers should be eliminated?
It is important to be open with the suppliers and inform them about the phase out. We also need to take
responsibility of possible rest stock. Before phasing out it is important to make sure that a replacement
supplier has been approved.
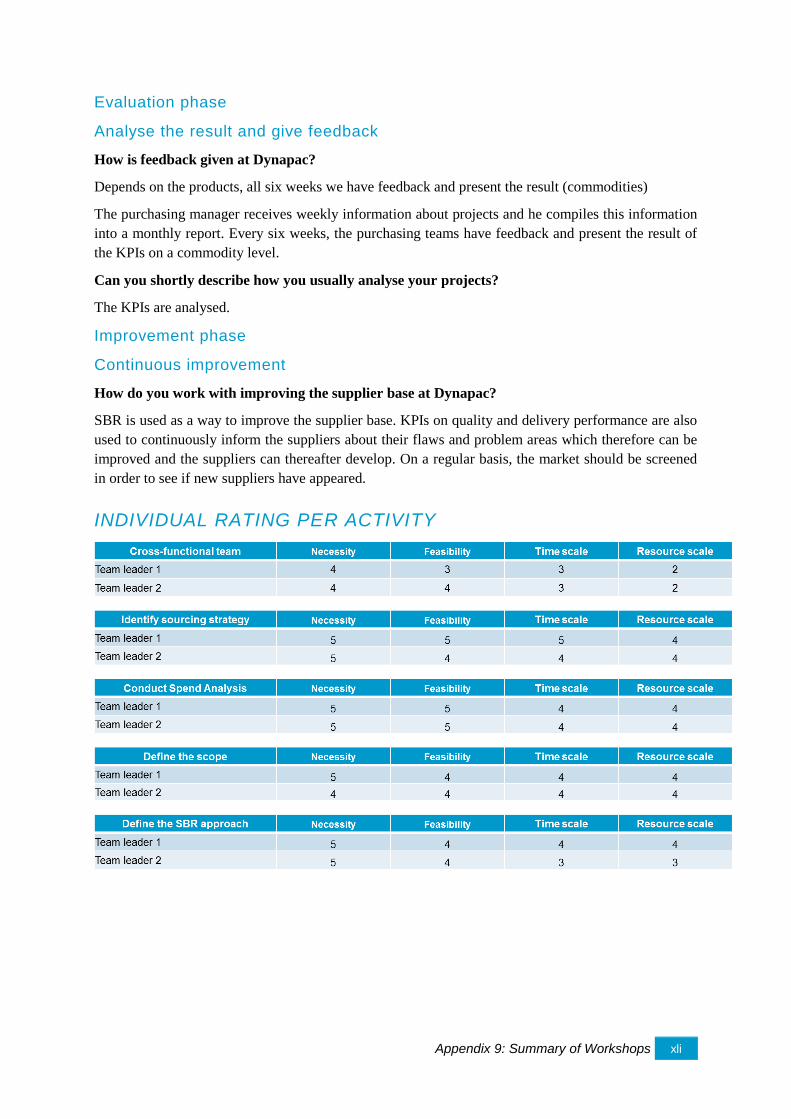
Appendix 9: Summary of Workshops xli
Evaluation phase
Analyse the result and give feedback
How is feedback given at Dynapac?
Depends on the products, all six weeks we have feedback and present the result (commodities)
The purchasing manager receives weekly information about projects and he compiles this information
into a monthly report. Every six weeks, the purchasing teams have feedback and present the result of
the KPIs on a commodity level.
Can you shortly describe how you usually analyse your projects?
The KPIs are analysed.
Improvement phase
Continuous improvement
How do you work with improving the supplier base at Dynapac?
SBR is used as a way to improve the supplier base. KPIs on quality and delivery performance are also
used to continuously inform the suppliers about their flaws and problem areas which therefore can be
improved and the suppliers can thereafter develop. On a regular basis, the market should be screened
in order to see if new suppliers have appeared.
INDIVIDUAL RATING PER ACTIVITY
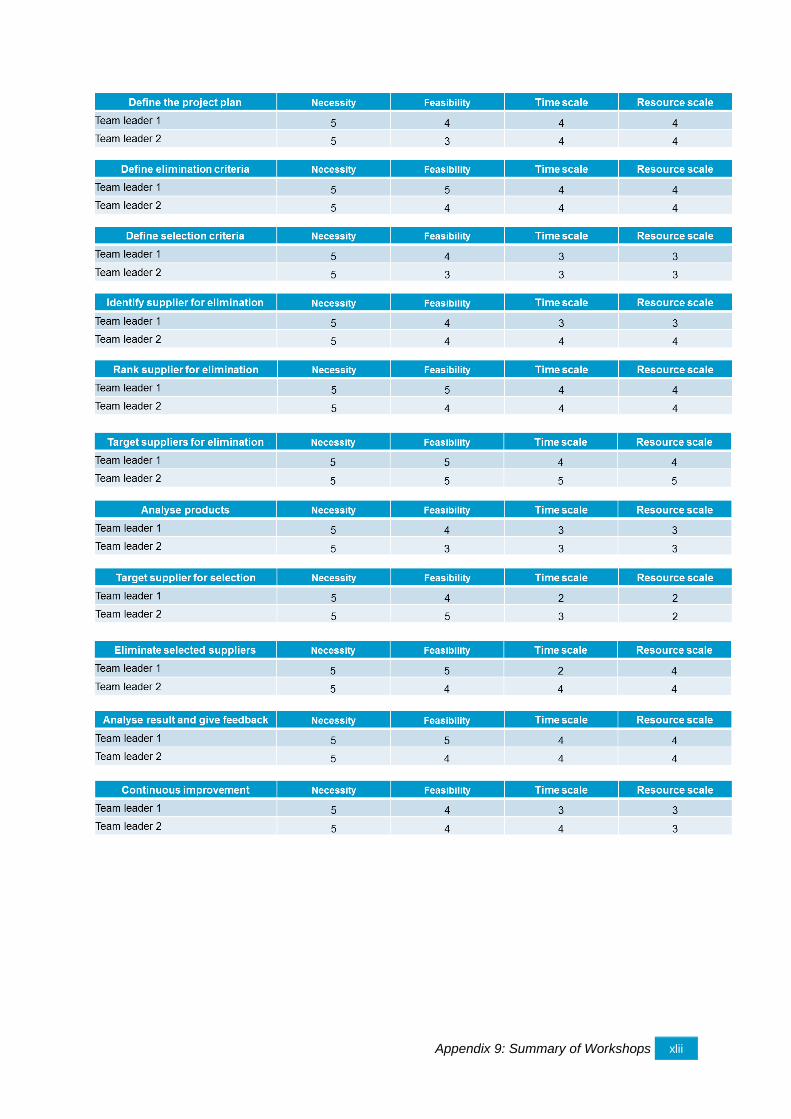
Appendix 9: Summary of Workshops xlii
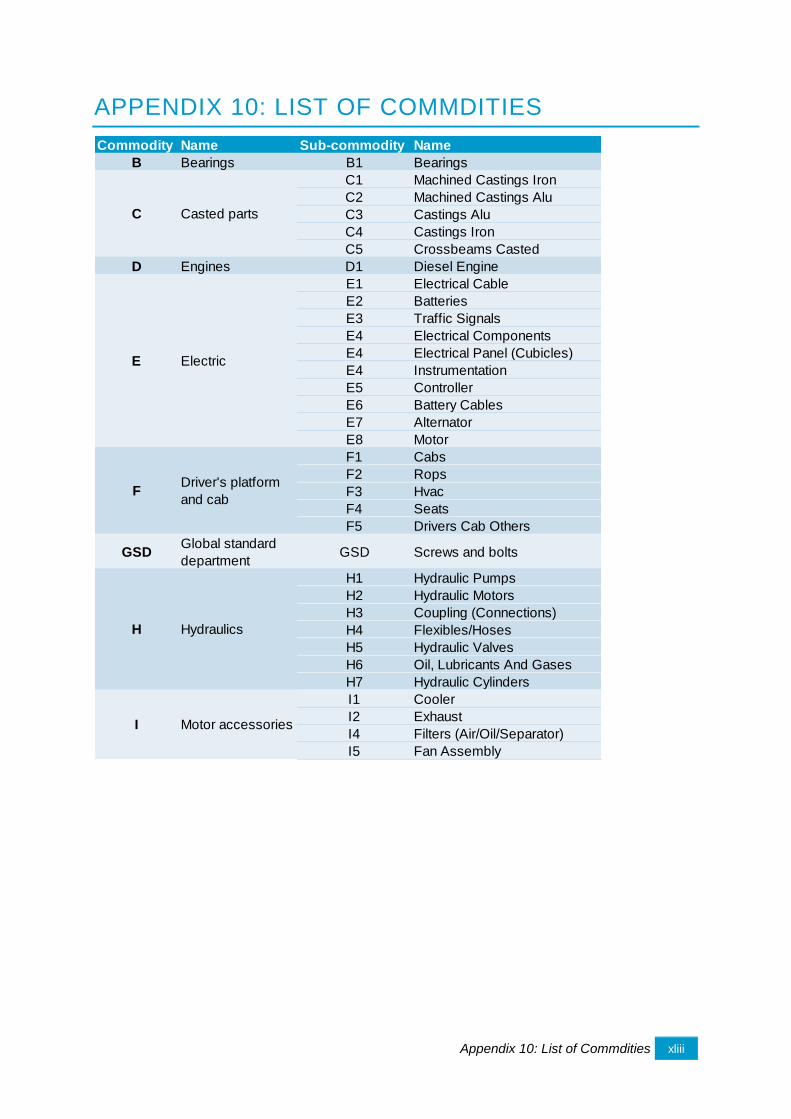
Appendix 10: List of Commdities xliii
APPENDIX 10: LIST OF COMMDITIES
Commodity Name Sub-commodity Name
B Bearings B1 Bearings
C1 Machined Castings Iron
C2 Machined Castings Alu
C3 Castings Alu
C4 Castings Iron
C5 Crossbeams Casted
D Engines D1 Diesel Engine
E1 Electrical Cable
E2 Batteries
E3 Traffic Signals
E4 Electrical Components
E4 Electrical Panel (Cubicles)
E4 Instrumentation
E5 Controller
E6 Battery Cables
E7 Alternator
E8 Motor
F1 Cabs
F2 Rops
F3 Hvac
F4 Seats
F5 Drivers Cab Others
GSDGlobal standard
departmentGSD Screws and bolts
H1 Hydraulic Pumps
H2 Hydraulic Motors
H3 Coupling (Connections)
H4 Flexibles/Hoses
H5 Hydraulic Valves
H6 Oil, Lubricants And Gases
H7 Hydraulic Cylinders
I1 Cooler
I2 Exhaust
I4 Filters (Air/Oil/Separator)
I5 Fan Assembly
Hydraulics
I Motor accessories
C
E
F
Casted parts
Electric
Driver's platform
and cab
H
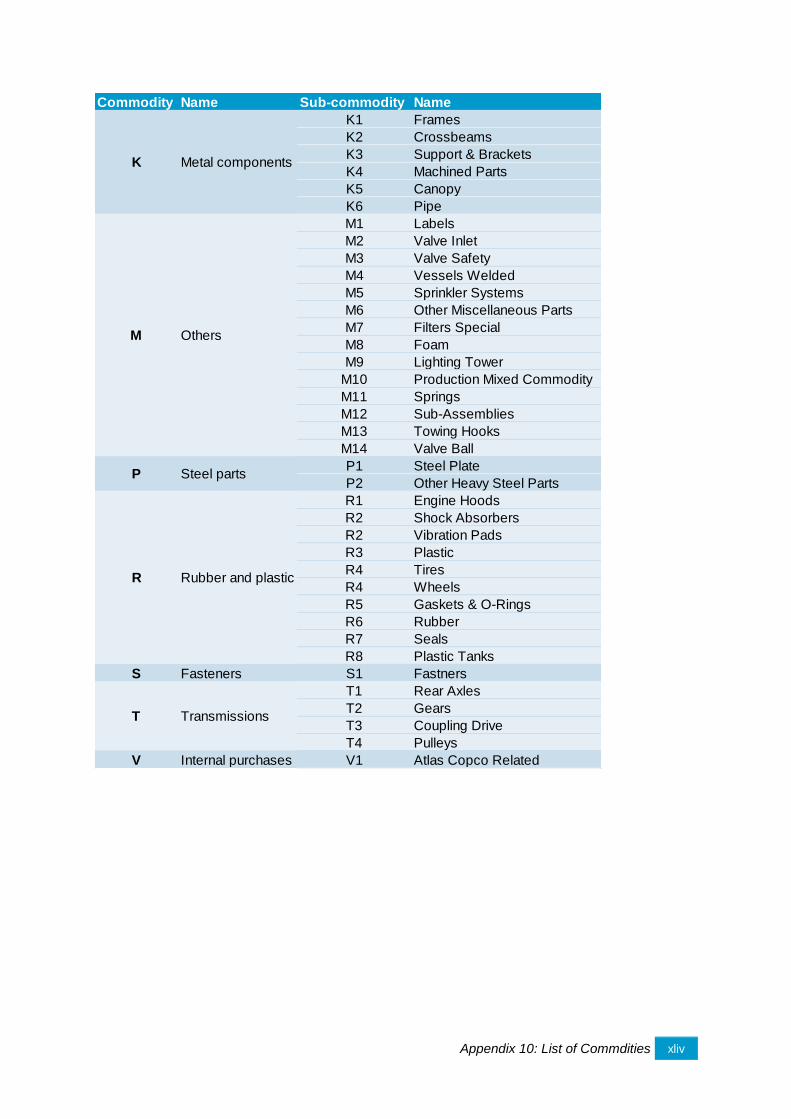
Appendix 10: List of Commdities xliv
Commodity Name Sub-commodity Name
K1 Frames
K2 Crossbeams
K3 Support & Brackets
K4 Machined Parts
K5 Canopy
K6 Pipe
M1 Labels
M2 Valve Inlet
M3 Valve Safety
M4 Vessels Welded
M5 Sprinkler Systems
M6 Other Miscellaneous Parts
M7 Filters Special
M8 Foam
M9 Lighting Tower
M10 Production Mixed Commodity
M11 Springs
M12 Sub-Assemblies
M13 Towing Hooks
M14 Valve Ball
P1 Steel Plate
P2 Other Heavy Steel Parts
R1 Engine Hoods
R2 Shock Absorbers
R2 Vibration Pads
R3 Plastic
R4 Tires
R4 Wheels
R5 Gaskets & O-Rings
R6 Rubber
R7 Seals
R8 Plastic Tanks
S Fasteners S1 Fastners
T1 Rear Axles
T2 Gears
T3 Coupling Drive
T4 Pulleys
V Internal purchases V1 Atlas Copco Related
R Rubber and plastic
T Transmissions
P Steel parts
Metal components
OthersM
K
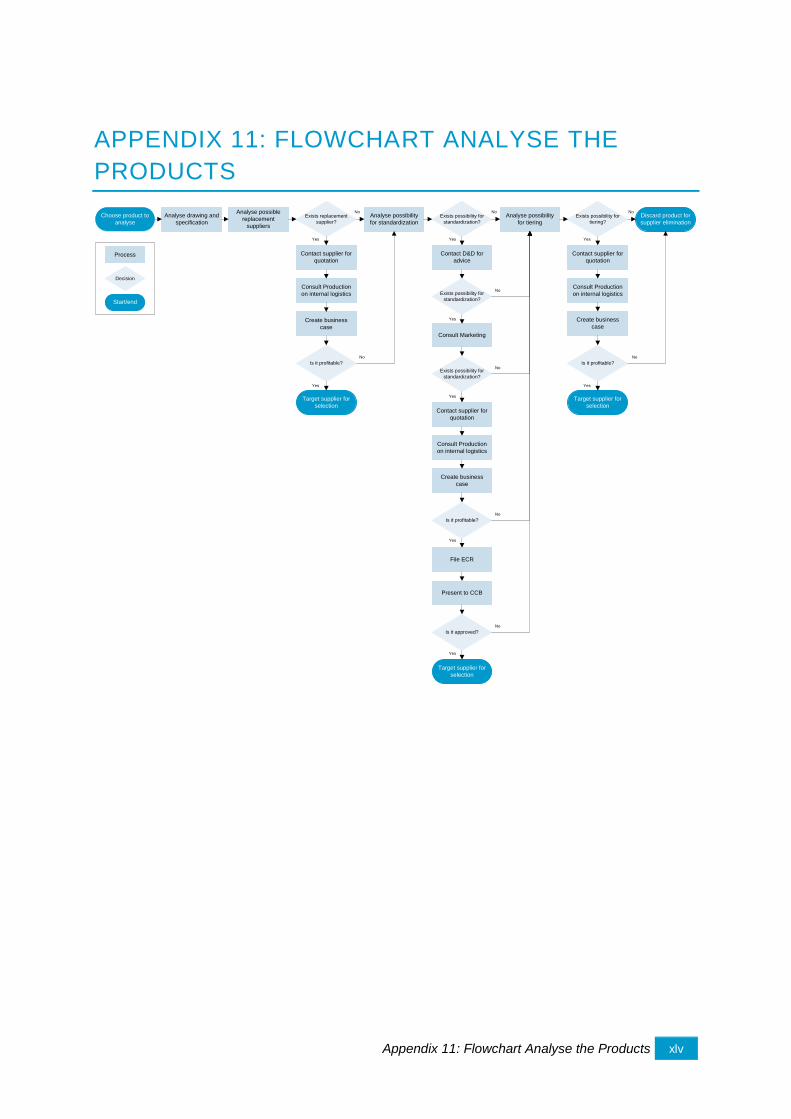
Appendix 11: Flowchart Analyse the Products xlv
APPENDIX 11: FLOWCHART ANALYSE THE
PRODUCTS
Analyse drawing and
specificationExists replacement
supplier?
Analyse possible
replacement
suppliers
Analyse possibility
for standardization
Analyse possibility
for tiering
Choose product to
analyseExists possibility for
standardization?
Exists possibility for
tiering?
Discard product for
supplier elimination
Contact supplier for
quotation
Create business
case
Is it profitable?
Target supplier for
selection
Consult Production
on internal logistics
Contact D&D for
advice
Exists possibility for
standardization?
File ECR
Create business
case
Is it approved?
Target supplier for
selection
Consult Marketing
Exists possibility for
standardization?
Present to CCB
Is it profitable?
Contact supplier for
quotation
Consult Production
on internal logistics
Contact supplier for
quotation
Create business
case
Is it profitable?
Target supplier for
selection
Consult Production
on internal logistics
Yes
No
Yes
No
Yes
No
Yes
No
Yes
No
Yes
No
Yes Yes
No No
Yes
No
Decision
Start/end
Process
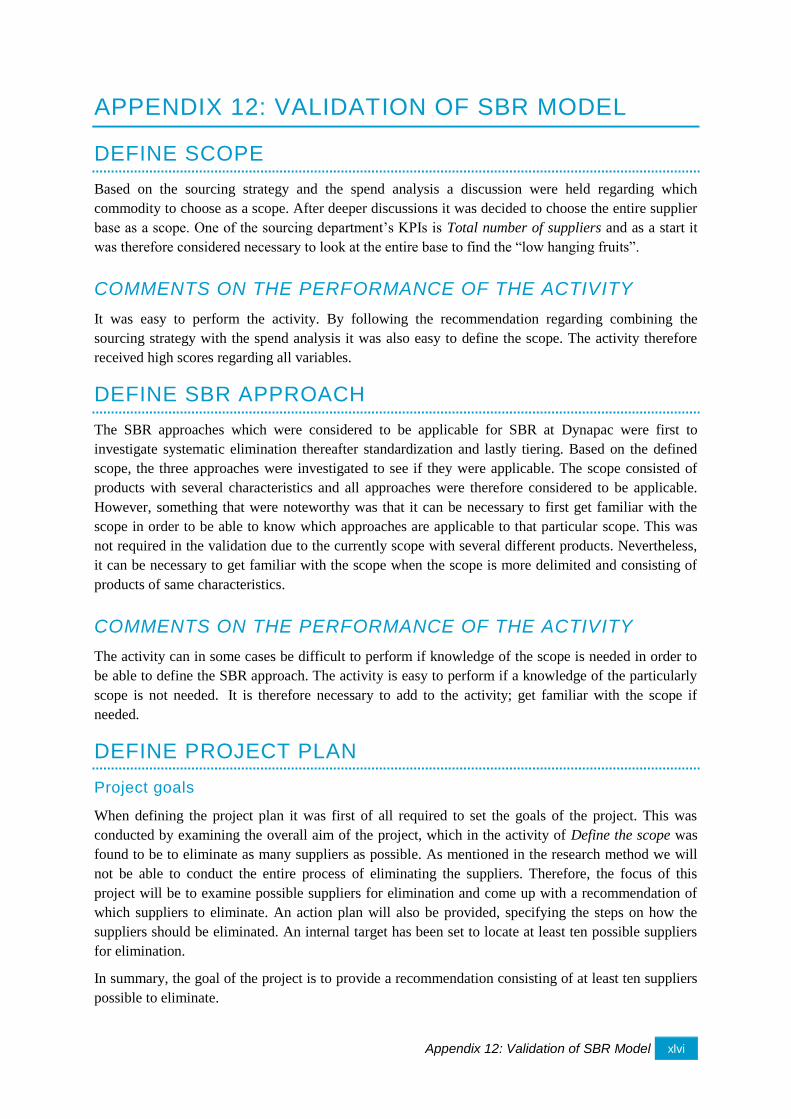
Appendix 12: Validation of SBR Model xlvi
APPENDIX 12: VALIDATION OF SBR MODEL
DEFINE SCOPE
Based on the sourcing strategy and the spend analysis a discussion were held regarding which
commodity to choose as a scope. After deeper discussions it was decided to choose the entire supplier
base as a scope. One of the sourcing department’s KPIs is Total number of suppliers and as a start it
was therefore considered necessary to look at the entire base to find the “low hanging fruits”.
COMMENTS ON THE PERFORMANCE OF THE ACTIVITY
It was easy to perform the activity. By following the recommendation regarding combining the
sourcing strategy with the spend analysis it was also easy to define the scope. The activity therefore
received high scores regarding all variables.
DEFINE SBR APPROACH
The SBR approaches which were considered to be applicable for SBR at Dynapac were first to
investigate systematic elimination thereafter standardization and lastly tiering. Based on the defined
scope, the three approaches were investigated to see if they were applicable. The scope consisted of
products with several characteristics and all approaches were therefore considered to be applicable.
However, something that were noteworthy was that it can be necessary to first get familiar with the
scope in order to be able to know which approaches are applicable to that particular scope. This was
not required in the validation due to the currently scope with several different products. Nevertheless,
it can be necessary to get familiar with the scope when the scope is more delimited and consisting of
products of same characteristics.
COMMENTS ON THE PERFORMANCE OF THE ACTIVITY
The activity can in some cases be difficult to perform if knowledge of the scope is needed in order to
be able to define the SBR approach. The activity is easy to perform if a knowledge of the particularly
scope is not needed. It is therefore necessary to add to the activity; get familiar with the scope if
needed.
DEFINE PROJECT PLAN
Project goals
When defining the project plan it was first of all required to set the goals of the project. This was
conducted by examining the overall aim of the project, which in the activity of Define the scope was
found to be to eliminate as many suppliers as possible. As mentioned in the research method we will
not be able to conduct the entire process of eliminating the suppliers. Therefore, the focus of this
project will be to examine possible suppliers for elimination and come up with a recommendation of
which suppliers to eliminate. An action plan will also be provided, specifying the steps on how the
suppliers should be eliminated. An internal target has been set to locate at least ten possible suppliers
for elimination.
In summary, the goal of the project is to provide a recommendation consisting of at least ten suppliers
possible to eliminate.
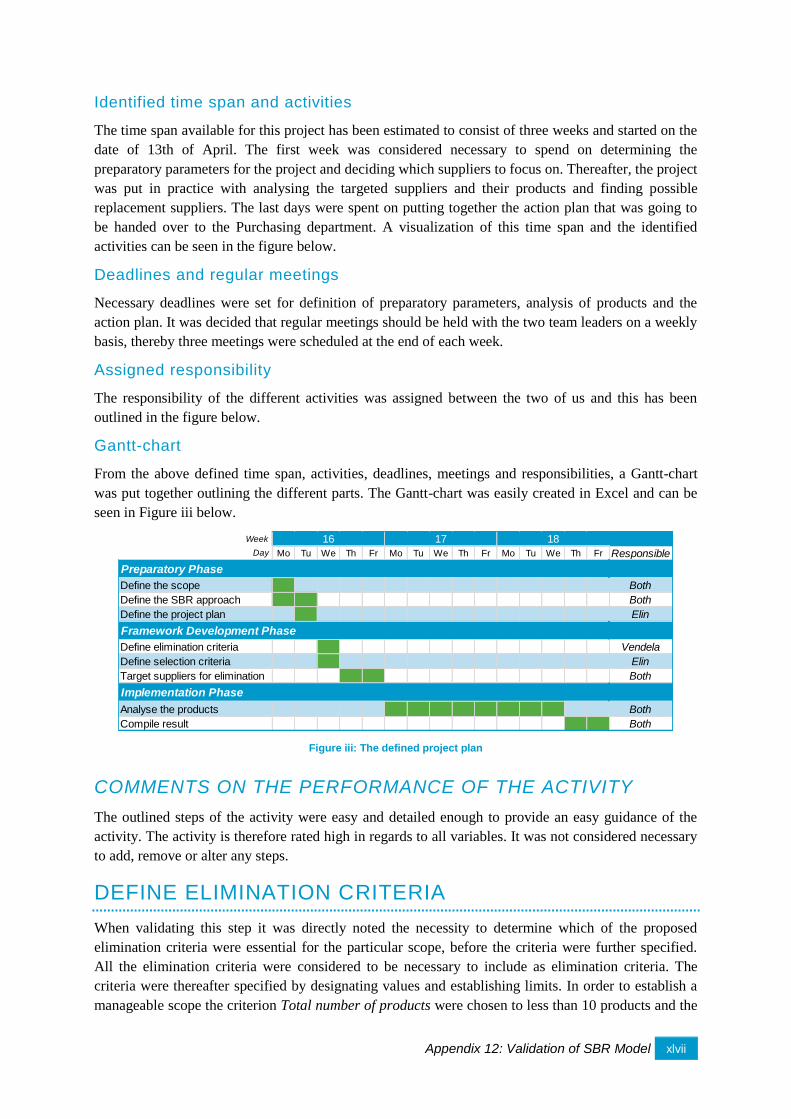
Appendix 12: Validation of SBR Model xlvii
Identified time span and activities
The time span available for this project has been estimated to consist of three weeks and started on the
date of 13th of April. The first week was considered necessary to spend on determining the
preparatory parameters for the project and deciding which suppliers to focus on. Thereafter, the project
was put in practice with analysing the targeted suppliers and their products and finding possible
replacement suppliers. The last days were spent on putting together the action plan that was going to
be handed over to the Purchasing department. A visualization of this time span and the identified
activities can be seen in the figure below.
Deadlines and regular meetings
Necessary deadlines were set for definition of preparatory parameters, analysis of products and the
action plan. It was decided that regular meetings should be held with the two team leaders on a weekly
basis, thereby three meetings were scheduled at the end of each week.
Assigned responsibility
The responsibility of the different activities was assigned between the two of us and this has been
outlined in the figure below.
Gantt-chart
From the above defined time span, activities, deadlines, meetings and responsibilities, a Gantt-chart
was put together outlining the different parts. The Gantt-chart was easily created in Excel and can be
seen in Figure iii below.
Figure iii: The defined project plan
COMMENTS ON THE PERFORMANCE OF THE ACTIVITY
The outlined steps of the activity were easy and detailed enough to provide an easy guidance of the
activity. The activity is therefore rated high in regards to all variables. It was not considered necessary
to add, remove or alter any steps.
DEFINE ELIMINATION CRITERIA
When validating this step it was directly noted the necessity to determine which of the proposed
elimination criteria were essential for the particular scope, before the criteria were further specified.
All the elimination criteria were considered to be necessary to include as elimination criteria. The
criteria were thereafter specified by designating values and establishing limits. In order to establish a
manageable scope the criterion Total number of products were chosen to less than 10 products and the
Week
Day Mo Tu We Th Fr Mo Tu We Th Fr Mo Tu We Th Fr Responsible
Define the scope Both
Define the SBR approach Both
Define the project plan Elin
Define elimination criteria Vendela
Define selection criteria Elin
Target suppliers for elimination Both
Analyse the products Both
Compile result Both
16 17
Implementation Phase
Framework Development Phase
18
Preparatory Phase
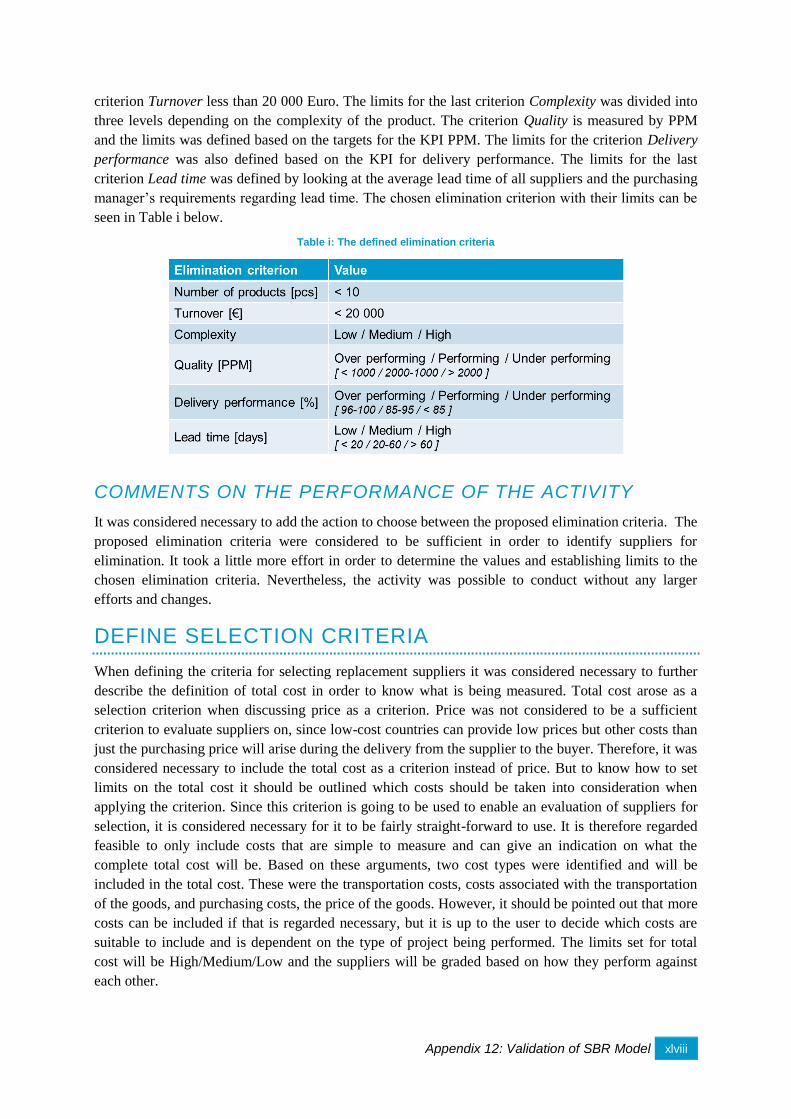
Appendix 12: Validation of SBR Model xlviii
criterion Turnover less than 20 000 Euro. The limits for the last criterion Complexity was divided into
three levels depending on the complexity of the product. The criterion Quality is measured by PPM
and the limits was defined based on the targets for the KPI PPM. The limits for the criterion Delivery
performance was also defined based on the KPI for delivery performance. The limits for the last
criterion Lead time was defined by looking at the average lead time of all suppliers and the purchasing
manager’s requirements regarding lead time. The chosen elimination criterion with their limits can be
seen in Table i below.
Table i: The defined elimination criteria
COMMENTS ON THE PERFORMANCE OF THE ACTIVITY
It was considered necessary to add the action to choose between the proposed elimination criteria. The
proposed elimination criteria were considered to be sufficient in order to identify suppliers for
elimination. It took a little more effort in order to determine the values and establishing limits to the
chosen elimination criteria. Nevertheless, the activity was possible to conduct without any larger
efforts and changes.
DEFINE SELECTION CRITERIA
When defining the criteria for selecting replacement suppliers it was considered necessary to further
describe the definition of total cost in order to know what is being measured. Total cost arose as a
selection criterion when discussing price as a criterion. Price was not considered to be a sufficient
criterion to evaluate suppliers on, since low-cost countries can provide low prices but other costs than
just the purchasing price will arise during the delivery from the supplier to the buyer. Therefore, it was
considered necessary to include the total cost as a criterion instead of price. But to know how to set
limits on the total cost it should be outlined which costs should be taken into consideration when
applying the criterion. Since this criterion is going to be used to enable an evaluation of suppliers for
selection, it is considered necessary for it to be fairly straight-forward to use. It is therefore regarded
feasible to only include costs that are simple to measure and can give an indication on what the
complete total cost will be. Based on these arguments, two cost types were identified and will be
included in the total cost. These were the transportation costs, costs associated with the transportation
of the goods, and purchasing costs, the price of the goods. However, it should be pointed out that more
costs can be included if that is regarded necessary, but it is up to the user to decide which costs are
suitable to include and is dependent on the type of project being performed. The limits set for total
cost will be High/Medium/Low and the suppliers will be graded based on how they perform against
each other.
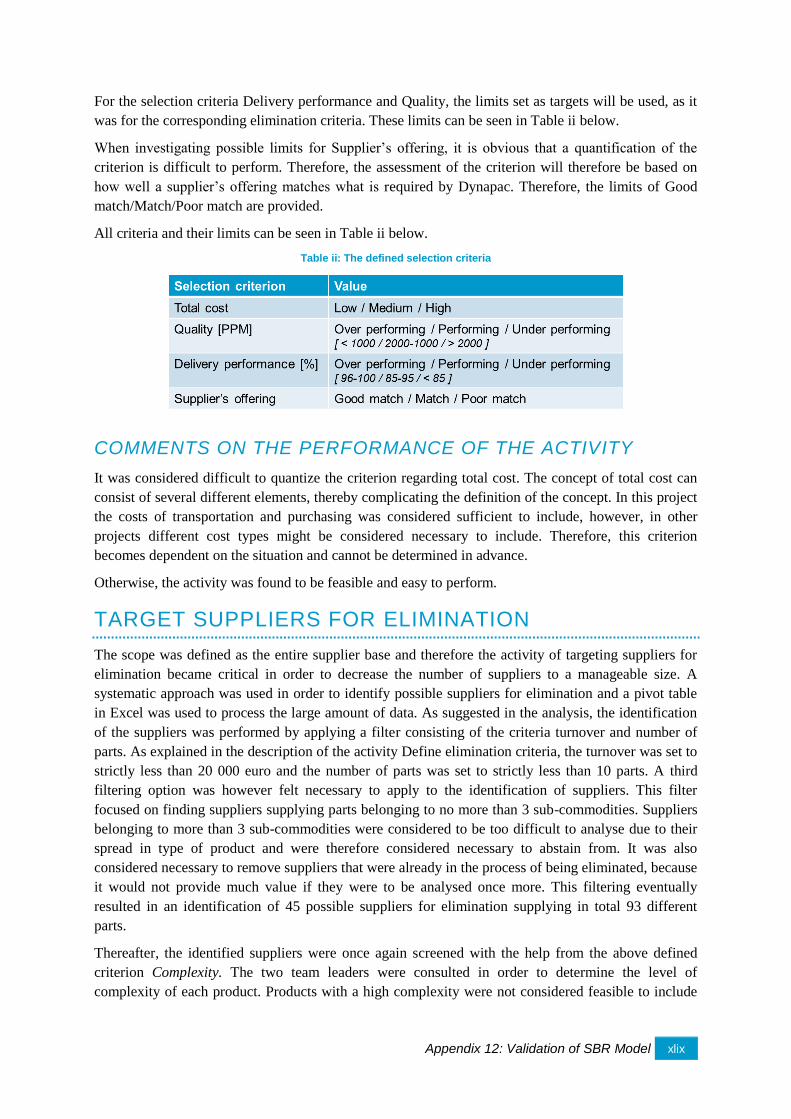
Appendix 12: Validation of SBR Model xlix
For the selection criteria Delivery performance and Quality, the limits set as targets will be used, as it
was for the corresponding elimination criteria. These limits can be seen in Table ii below.
When investigating possible limits for Supplier’s offering, it is obvious that a quantification of the
criterion is difficult to perform. Therefore, the assessment of the criterion will therefore be based on
how well a supplier’s offering matches what is required by Dynapac. Therefore, the limits of Good
match/Match/Poor match are provided.
All criteria and their limits can be seen in Table ii below.
Table ii: The defined selection criteria
COMMENTS ON THE PERFORMANCE OF THE ACTIVITY
It was considered difficult to quantize the criterion regarding total cost. The concept of total cost can
consist of several different elements, thereby complicating the definition of the concept. In this project
the costs of transportation and purchasing was considered sufficient to include, however, in other
projects different cost types might be considered necessary to include. Therefore, this criterion
becomes dependent on the situation and cannot be determined in advance.
Otherwise, the activity was found to be feasible and easy to perform.
TARGET SUPPLIERS FOR ELIMINATION
The scope was defined as the entire supplier base and therefore the activity of targeting suppliers for
elimination became critical in order to decrease the number of suppliers to a manageable size. A
systematic approach was used in order to identify possible suppliers for elimination and a pivot table
in Excel was used to process the large amount of data. As suggested in the analysis, the identification
of the suppliers was performed by applying a filter consisting of the criteria turnover and number of
parts. As explained in the description of the activity Define elimination criteria, the turnover was set to
strictly less than 20 000 euro and the number of parts was set to strictly less than 10 parts. A third
filtering option was however felt necessary to apply to the identification of suppliers. This filter
focused on finding suppliers supplying parts belonging to no more than 3 sub-commodities. Suppliers
belonging to more than 3 sub-commodities were considered to be too difficult to analyse due to their
spread in type of product and were therefore considered necessary to abstain from. It was also
considered necessary to remove suppliers that were already in the process of being eliminated, because
it would not provide much value if they were to be analysed once more. This filtering eventually
resulted in an identification of 45 possible suppliers for elimination supplying in total 93 different
parts.
Thereafter, the identified suppliers were once again screened with the help from the above defined
criterion Complexity. The two team leaders were consulted in order to determine the level of
complexity of each product. Products with a high complexity were not considered feasible to include
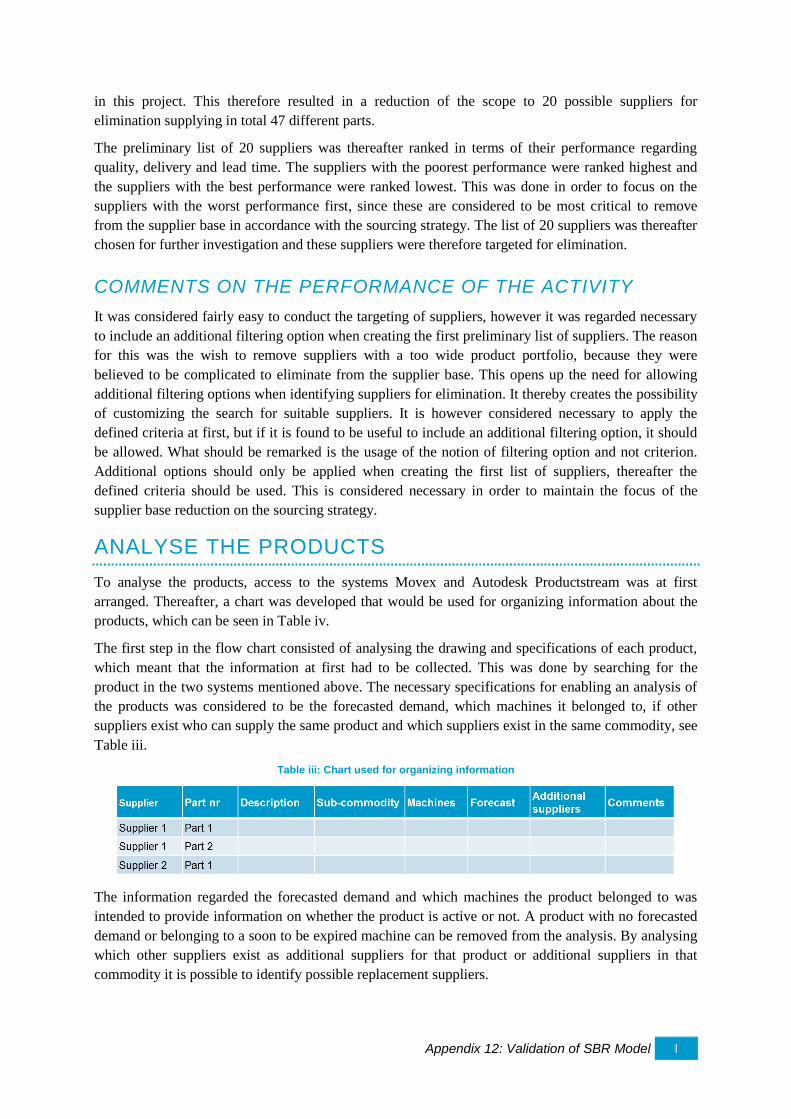
Appendix 12: Validation of SBR Model l
in this project. This therefore resulted in a reduction of the scope to 20 possible suppliers for
elimination supplying in total 47 different parts.
The preliminary list of 20 suppliers was thereafter ranked in terms of their performance regarding
quality, delivery and lead time. The suppliers with the poorest performance were ranked highest and
the suppliers with the best performance were ranked lowest. This was done in order to focus on the
suppliers with the worst performance first, since these are considered to be most critical to remove
from the supplier base in accordance with the sourcing strategy. The list of 20 suppliers was thereafter
chosen for further investigation and these suppliers were therefore targeted for elimination.
COMMENTS ON THE PERFORMANCE OF THE ACTIVITY
It was considered fairly easy to conduct the targeting of suppliers, however it was regarded necessary
to include an additional filtering option when creating the first preliminary list of suppliers. The reason
for this was the wish to remove suppliers with a too wide product portfolio, because they were
believed to be complicated to eliminate from the supplier base. This opens up the need for allowing
additional filtering options when identifying suppliers for elimination. It thereby creates the possibility
of customizing the search for suitable suppliers. It is however considered necessary to apply the
defined criteria at first, but if it is found to be useful to include an additional filtering option, it should
be allowed. What should be remarked is the usage of the notion of filtering option and not criterion.
Additional options should only be applied when creating the first list of suppliers, thereafter the
defined criteria should be used. This is considered necessary in order to maintain the focus of the
supplier base reduction on the sourcing strategy.
ANALYSE THE PRODUCTS
To analyse the products, access to the systems Movex and Autodesk Productstream was at first
arranged. Thereafter, a chart was developed that would be used for organizing information about the
products, which can be seen in Table iv.
The first step in the flow chart consisted of analysing the drawing and specifications of each product,
which meant that the information at first had to be collected. This was done by searching for the
product in the two systems mentioned above. The necessary specifications for enabling an analysis of
the products was considered to be the forecasted demand, which machines it belonged to, if other
suppliers exist who can supply the same product and which suppliers exist in the same commodity, see
Table iii.
Table iii: Chart used for organizing information
The information regarded the forecasted demand and which machines the product belonged to was
intended to provide information on whether the product is active or not. A product with no forecasted
demand or belonging to a soon to be expired machine can be removed from the analysis. By analysing
which other suppliers exist as additional suppliers for that product or additional suppliers in that
commodity it is possible to identify possible replacement suppliers.
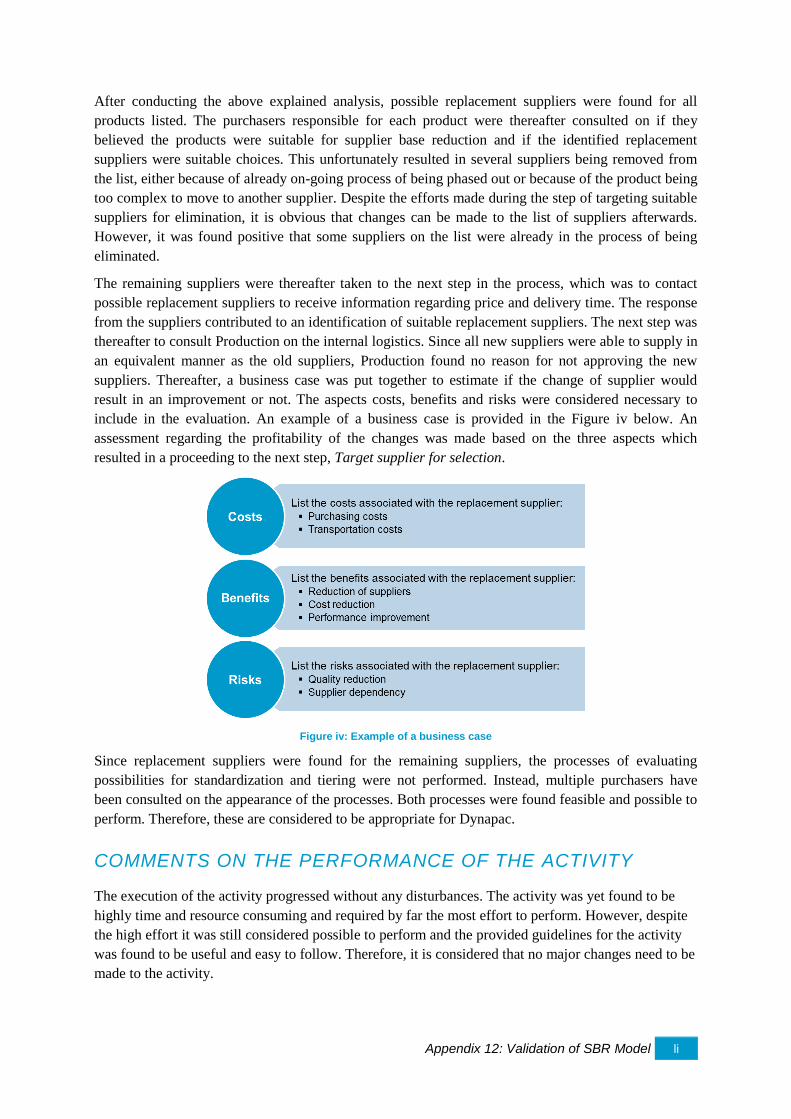
Appendix 12: Validation of SBR Model li
After conducting the above explained analysis, possible replacement suppliers were found for all
products listed. The purchasers responsible for each product were thereafter consulted on if they
believed the products were suitable for supplier base reduction and if the identified replacement
suppliers were suitable choices. This unfortunately resulted in several suppliers being removed from
the list, either because of already on-going process of being phased out or because of the product being
too complex to move to another supplier. Despite the efforts made during the step of targeting suitable
suppliers for elimination, it is obvious that changes can be made to the list of suppliers afterwards.
However, it was found positive that some suppliers on the list were already in the process of being
eliminated.
The remaining suppliers were thereafter taken to the next step in the process, which was to contact
possible replacement suppliers to receive information regarding price and delivery time. The response
from the suppliers contributed to an identification of suitable replacement suppliers. The next step was
thereafter to consult Production on the internal logistics. Since all new suppliers were able to supply in
an equivalent manner as the old suppliers, Production found no reason for not approving the new
suppliers. Thereafter, a business case was put together to estimate if the change of supplier would
result in an improvement or not. The aspects costs, benefits and risks were considered necessary to
include in the evaluation. An example of a business case is provided in the Figure iv below. An
assessment regarding the profitability of the changes was made based on the three aspects which
resulted in a proceeding to the next step, Target supplier for selection.
Figure iv: Example of a business case
Since replacement suppliers were found for the remaining suppliers, the processes of evaluating
possibilities for standardization and tiering were not performed. Instead, multiple purchasers have
been consulted on the appearance of the processes. Both processes were found feasible and possible to
perform. Therefore, these are considered to be appropriate for Dynapac.
COMMENTS ON THE PERFORMANCE OF THE ACTIVITY
The execution of the activity progressed without any disturbances. The activity was yet found to be
highly time and resource consuming and required by far the most effort to perform. However, despite
the high effort it was still considered possible to perform and the provided guidelines for the activity
was found to be useful and easy to follow. Therefore, it is considered that no major changes need to be
made to the activity.
Appendix 13: The Methodology lii
APPENDIX 13: THE METHODOLOGY
SUPPLIER BASE REDUCTION
WHAT IS SUPPLIER BASE REDUCTION?
The concept supplier base reduction, SBR, refers to the reduction of the number of existing suppliers
within the supplier base. Advanced sourcing strategies, such as close and long term supplier
relationships and supplier development, are recent trends within purchasing and will soon be seen as
standard strategies. However, these strategies require a close interaction between the buyer and
supplier which is simply not feasible with a too large supplier base. To solve this matter, supplier base
reduction has been proven to be an efficient strategy and has attracted significant research interest in
recent years.
WHAT CAN BE GAINED FROM SBR?
The necessity of reducing the supplier base has been highlighted by many researchers and they argue
that companies can achieve various beneficial outcomes, such as reduced purchasing price and
transaction costs, and increased control, supplier responsiveness and supplier innovation using a
limited number of suppliers. The reduced supplier base means closer and long term relationships can
be established with fewer suppliers who then play a critical role, contributing to new product design,
significantly reducing costs and constantly improving quality.
WHAT IS NEEDED TO SUCCEED WITH SBR?
To enable a successful implementation of supplier base reduction, companies need to consider a
number of important elements. Critical success factors for supplier base reduction are a good and well-
functioning information system, key management support, a cross-functional team, and win-win
relationships for the buyer and the supplier.
HOW SHOULD SBR BE PERFORMED?
A methodology consisting of 14 activities corresponding to 5 different phases has been developed and
provides a thorough description on how to conduct supplier base reduction. The full methodology can
be seen in Figure v below and each activity will be presented and described in detail in the upcoming
sections.
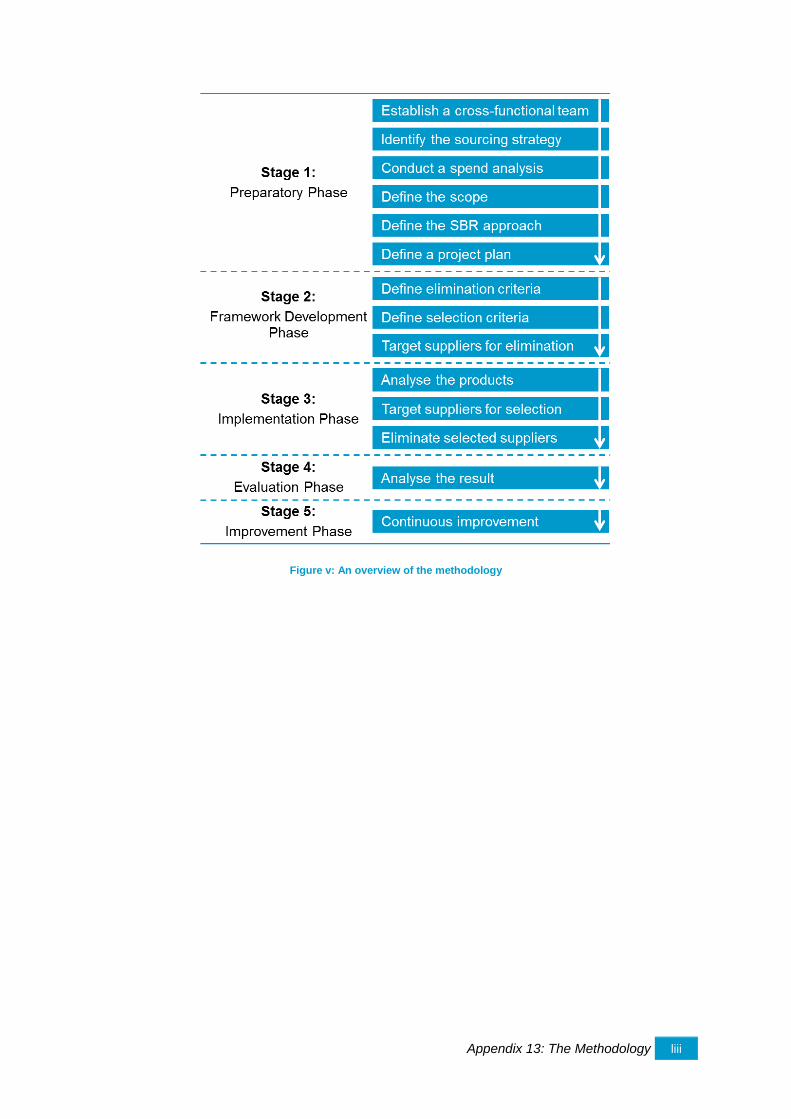
Appendix 13: The Methodology liii
Figure v: An overview of the methodology
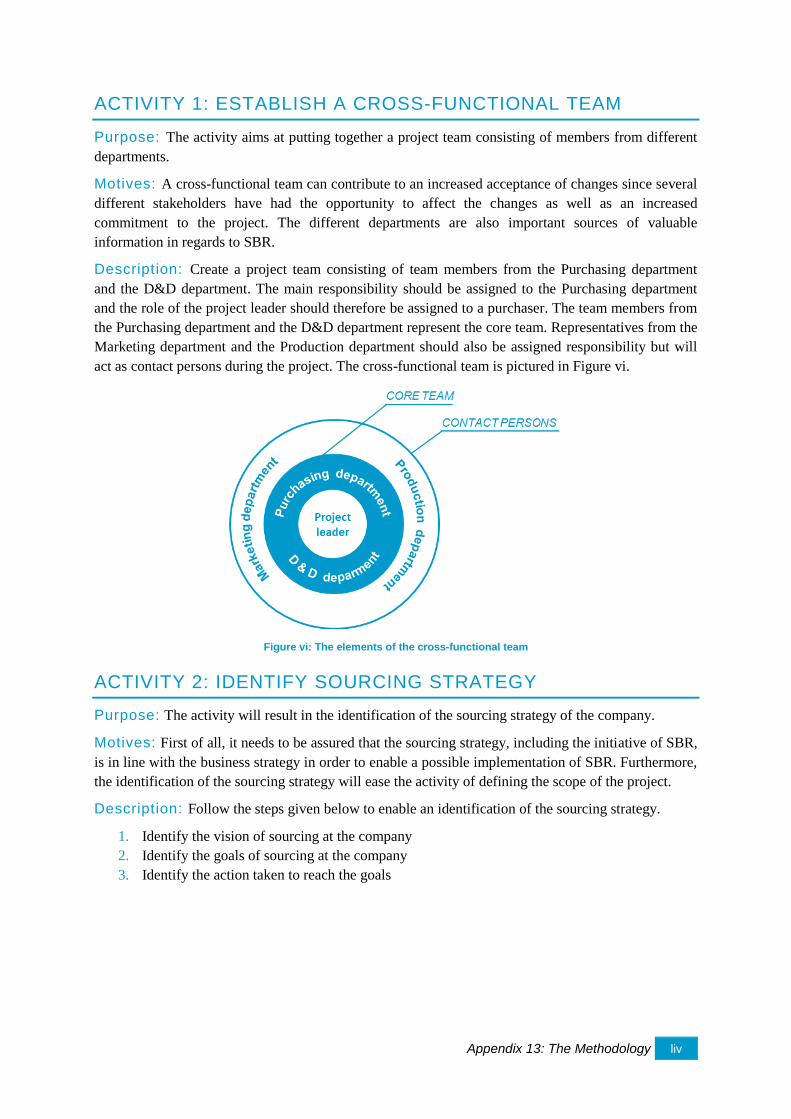
Appendix 13: The Methodology liv
ACTIVITY 1: ESTABLISH A CROSS-FUNCTIONAL TEAM
Purpose: The activity aims at putting together a project team consisting of members from different
departments.
Motives: A cross-functional team can contribute to an increased acceptance of changes since several
different stakeholders have had the opportunity to affect the changes as well as an increased
commitment to the project. The different departments are also important sources of valuable
information in regards to SBR.
Description: Create a project team consisting of team members from the Purchasing department
and the D&D department. The main responsibility should be assigned to the Purchasing department
and the role of the project leader should therefore be assigned to a purchaser. The team members from
the Purchasing department and the D&D department represent the core team. Representatives from the
Marketing department and the Production department should also be assigned responsibility but will
act as contact persons during the project. The cross-functional team is pictured in Figure vi.
Figure vi: The elements of the cross-functional team
ACTIVITY 2: IDENTIFY SOURCING STRATEGY
Purpose: The activity will result in the identification of the sourcing strategy of the company.
Motives: First of all, it needs to be assured that the sourcing strategy, including the initiative of SBR,
is in line with the business strategy in order to enable a possible implementation of SBR. Furthermore,
the identification of the sourcing strategy will ease the activity of defining the scope of the project.
Description: Follow the steps given below to enable an identification of the sourcing strategy.
1. Identify the vision of sourcing at the company
2. Identify the goals of sourcing at the company
3. Identify the action taken to reach the goals
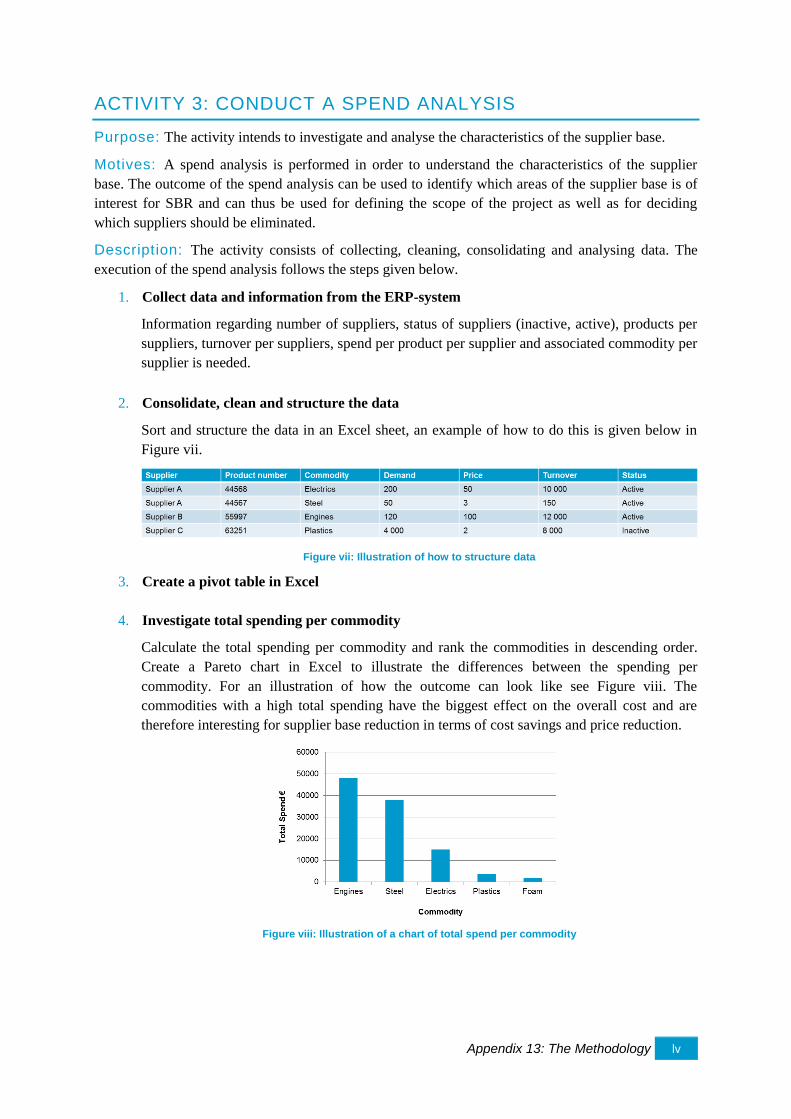
Appendix 13: The Methodology lv
ACTIVITY 3: CONDUCT A SPEND ANALYSIS
Purpose: The activity intends to investigate and analyse the characteristics of the supplier base.
Motives: A spend analysis is performed in order to understand the characteristics of the supplier
base. The outcome of the spend analysis can be used to identify which areas of the supplier base is of
interest for SBR and can thus be used for defining the scope of the project as well as for deciding
which suppliers should be eliminated.
Description: The activity consists of collecting, cleaning, consolidating and analysing data. The
execution of the spend analysis follows the steps given below.
1. Collect data and information from the ERP-system
Information regarding number of suppliers, status of suppliers (inactive, active), products per
suppliers, turnover per suppliers, spend per product per supplier and associated commodity per
supplier is needed.
2. Consolidate, clean and structure the data
Sort and structure the data in an Excel sheet, an example of how to do this is given below in
Figure vii.
Figure vii: Illustration of how to structure data
3. Create a pivot table in Excel
4. Investigate total spending per commodity
Calculate the total spending per commodity and rank the commodities in descending order.
Create a Pareto chart in Excel to illustrate the differences between the spending per
commodity. For an illustration of how the outcome can look like see Figure viii. The
commodities with a high total spending have the biggest effect on the overall cost and are
therefore interesting for supplier base reduction in terms of cost savings and price reduction.
Figure viii: Illustration of a chart of total spend per commodity
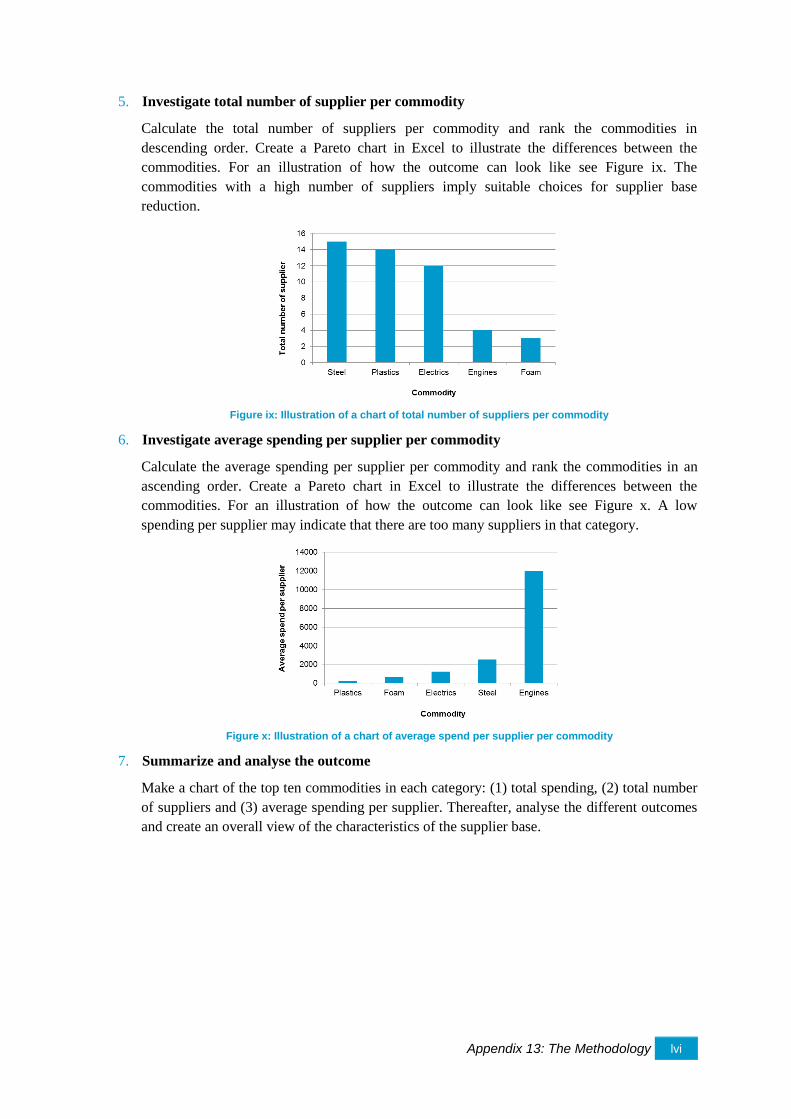
Appendix 13: The Methodology lvi
5. Investigate total number of supplier per commodity
Calculate the total number of suppliers per commodity and rank the commodities in
descending order. Create a Pareto chart in Excel to illustrate the differences between the
commodities. For an illustration of how the outcome can look like see Figure ix. The
commodities with a high number of suppliers imply suitable choices for supplier base
reduction.
Figure ix: Illustration of a chart of total number of suppliers per commodity
6. Investigate average spending per supplier per commodity
Calculate the average spending per supplier per commodity and rank the commodities in an ascending order. Create a Pareto chart in Excel to illustrate the differences between the
commodities. For an illustration of how the outcome can look like see Figure x. A low
spending per supplier may indicate that there are too many suppliers in that category.
Figure x: Illustration of a chart of average spend per supplier per commodity
7. Summarize and analyse the outcome
Make a chart of the top ten commodities in each category: (1) total spending, (2) total number
of suppliers and (3) average spending per supplier. Thereafter, analyse the different outcomes
and create an overall view of the characteristics of the supplier base.
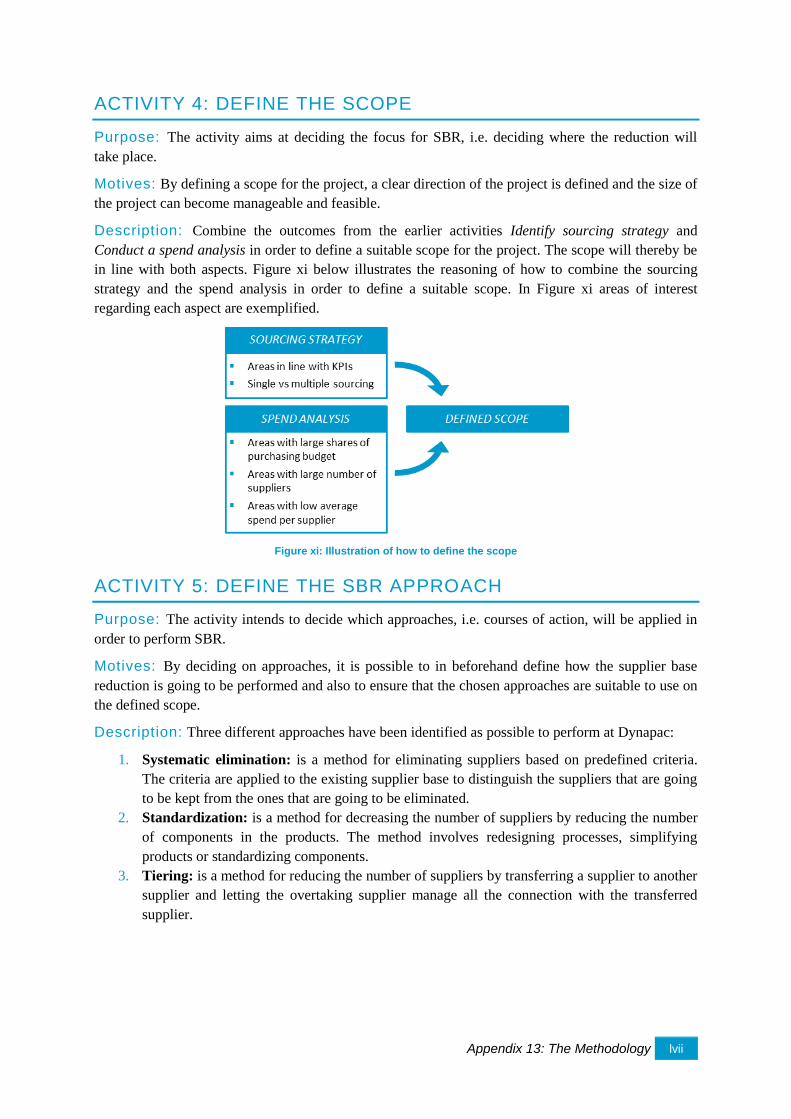
Appendix 13: The Methodology lvii
ACTIVITY 4: DEFINE THE SCOPE
Purpose: The activity aims at deciding the focus for SBR, i.e. deciding where the reduction will
take place.
Motives: By defining a scope for the project, a clear direction of the project is defined and the size of
the project can become manageable and feasible.
Description: Combine the outcomes from the earlier activities Identify sourcing strategy and
Conduct a spend analysis in order to define a suitable scope for the project. The scope will thereby be
in line with both aspects. Figure xi below illustrates the reasoning of how to combine the sourcing
strategy and the spend analysis in order to define a suitable scope. In Figure xi areas of interest
regarding each aspect are exemplified.
Figure xi: Illustration of how to define the scope
ACTIVITY 5: DEFINE THE SBR APPROACH
Purpose: The activity intends to decide which approaches, i.e. courses of action, will be applied in
order to perform SBR.
Motives: By deciding on approaches, it is possible to in beforehand define how the supplier base
reduction is going to be performed and also to ensure that the chosen approaches are suitable to use on
the defined scope.
Description: Three different approaches have been identified as possible to perform at Dynapac:
1. Systematic elimination: is a method for eliminating suppliers based on predefined criteria.
The criteria are applied to the existing supplier base to distinguish the suppliers that are going
to be kept from the ones that are going to be eliminated.
2. Standardization: is a method for decreasing the number of suppliers by reducing the number
of components in the products. The method involves redesigning processes, simplifying
products or standardizing components.
3. Tiering: is a method for reducing the number of suppliers by transferring a supplier to another
supplier and letting the overtaking supplier manage all the connection with the transferred
supplier.
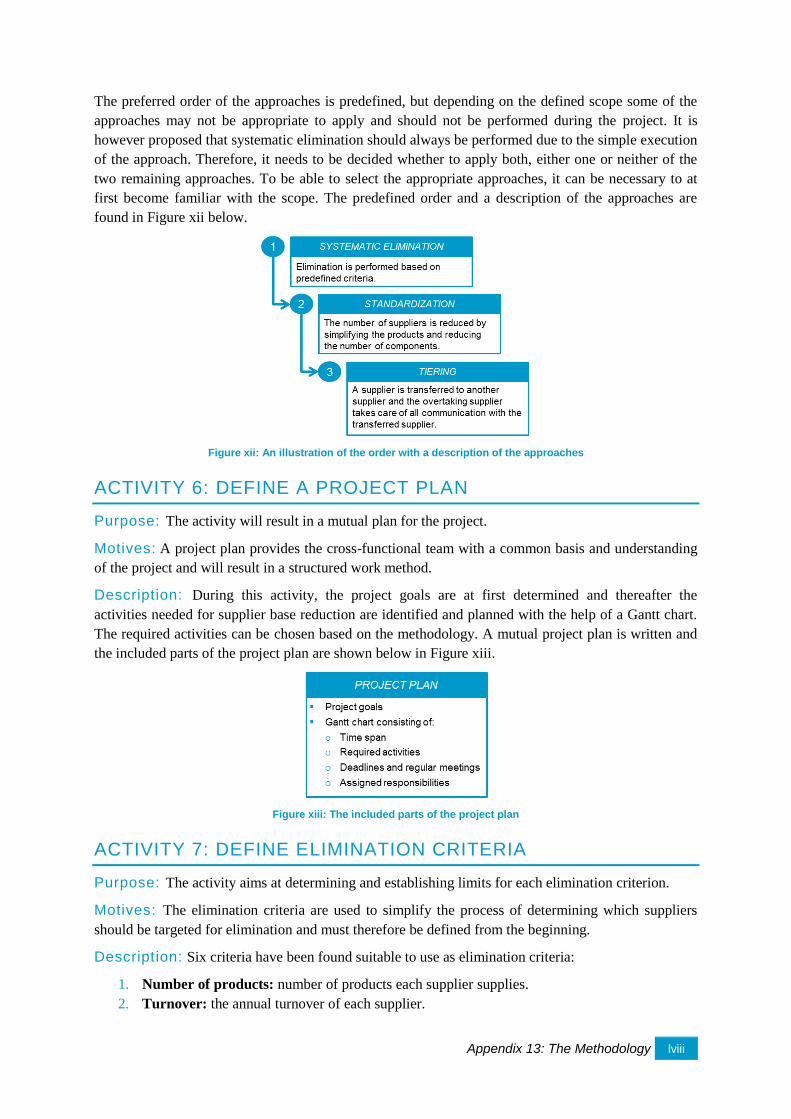
Appendix 13: The Methodology lviii
The preferred order of the approaches is predefined, but depending on the defined scope some of the
approaches may not be appropriate to apply and should not be performed during the project. It is
however proposed that systematic elimination should always be performed due to the simple execution
of the approach. Therefore, it needs to be decided whether to apply both, either one or neither of the
two remaining approaches. To be able to select the appropriate approaches, it can be necessary to at
first become familiar with the scope. The predefined order and a description of the approaches are
found in Figure xii below.
Figure xii: An illustration of the order with a description of the approaches
ACTIVITY 6: DEFINE A PROJECT PLAN
Purpose: The activity will result in a mutual plan for the project.
Motives: A project plan provides the cross-functional team with a common basis and understanding
of the project and will result in a structured work method.
Description: During this activity, the project goals are at first determined and thereafter the
activities needed for supplier base reduction are identified and planned with the help of a Gantt chart.
The required activities can be chosen based on the methodology. A mutual project plan is written and
the included parts of the project plan are shown below in Figure xiii.
Figure xiii: The included parts of the project plan
ACTIVITY 7: DEFINE ELIMINATION CRITERIA
Purpose: The activity aims at determining and establishing limits for each elimination criterion.
Motives: The elimination criteria are used to simplify the process of determining which suppliers
should be targeted for elimination and must therefore be defined from the beginning.
Description: Six criteria have been found suitable to use as elimination criteria:
1. Number of products: number of products each supplier supplies.
2. Turnover: the annual turnover of each supplier.
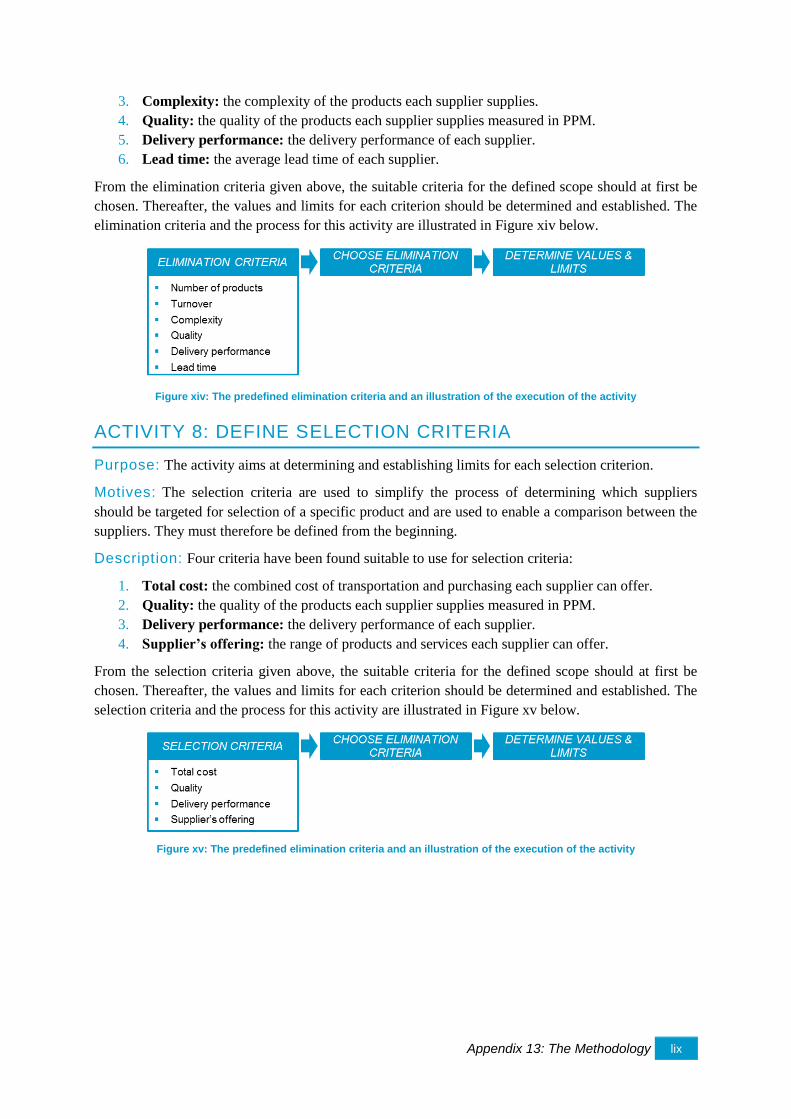
Appendix 13: The Methodology lix
3. Complexity: the complexity of the products each supplier supplies.
4. Quality: the quality of the products each supplier supplies measured in PPM.
5. Delivery performance: the delivery performance of each supplier.
6. Lead time: the average lead time of each supplier.
From the elimination criteria given above, the suitable criteria for the defined scope should at first be
chosen. Thereafter, the values and limits for each criterion should be determined and established. The
elimination criteria and the process for this activity are illustrated in Figure xiv below.
Figure xiv: The predefined elimination criteria and an illustration of the execution of the activity
ACTIVITY 8: DEFINE SELECTION CRITERIA
Purpose: The activity aims at determining and establishing limits for each selection criterion.
Motives: The selection criteria are used to simplify the process of determining which suppliers
should be targeted for selection of a specific product and are used to enable a comparison between the
suppliers. They must therefore be defined from the beginning.
Description: Four criteria have been found suitable to use for selection criteria:
1. Total cost: the combined cost of transportation and purchasing each supplier can offer.
2. Quality: the quality of the products each supplier supplies measured in PPM.
3. Delivery performance: the delivery performance of each supplier.
4. Supplier’s offering: the range of products and services each supplier can offer.
From the selection criteria given above, the suitable criteria for the defined scope should at first be
chosen. Thereafter, the values and limits for each criterion should be determined and established. The
selection criteria and the process for this activity are illustrated in Figure xv below.
Figure xv: The predefined elimination criteria and an illustration of the execution of the activity
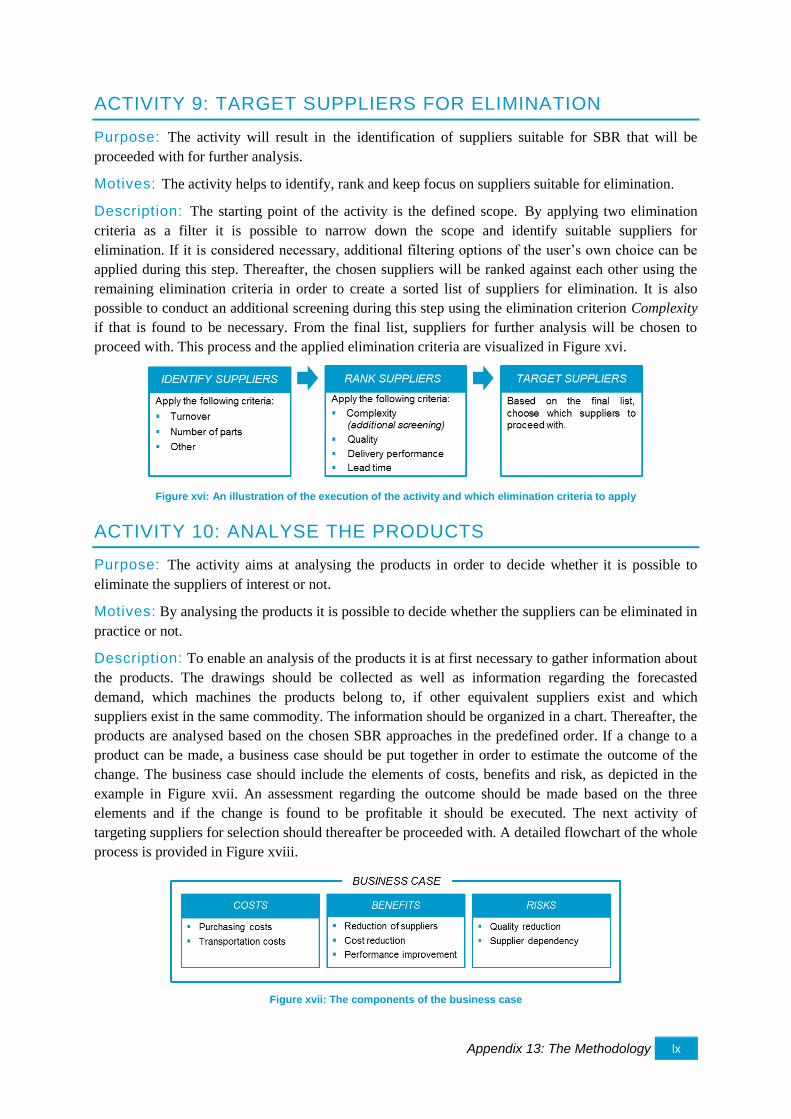
Appendix 13: The Methodology lx
ACTIVITY 9: TARGET SUPPLIERS FOR ELIMINATION
Purpose: The activity will result in the identification of suppliers suitable for SBR that will be
proceeded with for further analysis.
Motives: The activity helps to identify, rank and keep focus on suppliers suitable for elimination.
Description: The starting point of the activity is the defined scope. By applying two elimination
criteria as a filter it is possible to narrow down the scope and identify suitable suppliers for
elimination. If it is considered necessary, additional filtering options of the user’s own choice can be
applied during this step. Thereafter, the chosen suppliers will be ranked against each other using the
remaining elimination criteria in order to create a sorted list of suppliers for elimination. It is also
possible to conduct an additional screening during this step using the elimination criterion Complexity
if that is found to be necessary. From the final list, suppliers for further analysis will be chosen to
proceed with. This process and the applied elimination criteria are visualized in Figure xvi.
Figure xvi: An illustration of the execution of the activity and which elimination criteria to apply
ACTIVITY 10: ANALYSE THE PRODUCTS
Purpose: The activity aims at analysing the products in order to decide whether it is possible to
eliminate the suppliers of interest or not.
Motives: By analysing the products it is possible to decide whether the suppliers can be eliminated in
practice or not.
Description: To enable an analysis of the products it is at first necessary to gather information about
the products. The drawings should be collected as well as information regarding the forecasted
demand, which machines the products belong to, if other equivalent suppliers exist and which
suppliers exist in the same commodity. The information should be organized in a chart. Thereafter, the
products are analysed based on the chosen SBR approaches in the predefined order. If a change to a
product can be made, a business case should be put together in order to estimate the outcome of the
change. The business case should include the elements of costs, benefits and risk, as depicted in the
example in Figure xvii. An assessment regarding the outcome should be made based on the three
elements and if the change is found to be profitable it should be executed. The next activity of
targeting suppliers for selection should thereafter be proceeded with. A detailed flowchart of the whole
process is provided in Figure xviii.
Figure xvii: The components of the business case
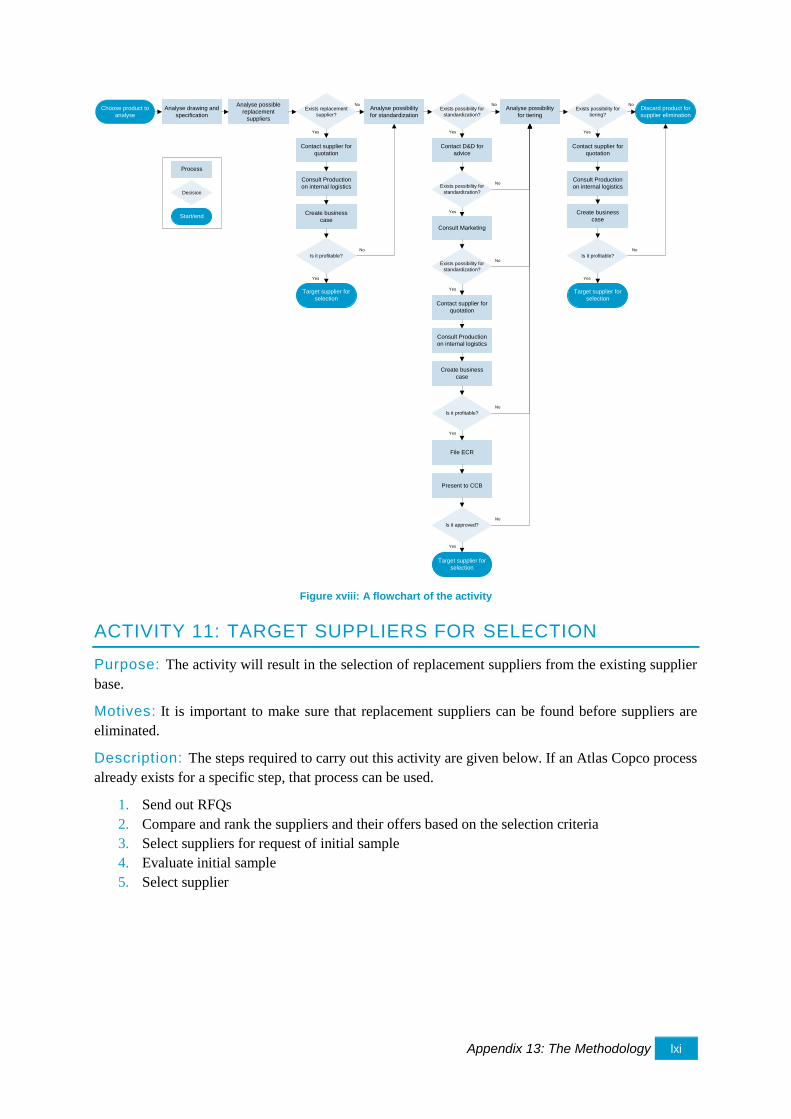
Appendix 13: The Methodology lxi
Figure xviii: A flowchart of the activity
ACTIVITY 11: TARGET SUPPLIERS FOR SELECTION
Purpose: The activity will result in the selection of replacement suppliers from the existing supplier
base.
Motives: It is important to make sure that replacement suppliers can be found before suppliers are
eliminated.
Description: The steps required to carry out this activity are given below. If an Atlas Copco process
already exists for a specific step, that process can be used.
1. Send out RFQs
2. Compare and rank the suppliers and their offers based on the selection criteria
3. Select suppliers for request of initial sample
4. Evaluate initial sample
5. Select supplier
Analyse drawing and
specificationExists replacement
supplier?
Analyse possible
replacement
suppliers
Analyse possibility
for standardization
Analyse possibility
for tiering
Choose product to
analyseExists possibility for
standardization?
Exists possibility for
tiering?
Discard product for
supplier elimination
Contact supplier for
quotation
Create business
case
Is it profitable?
Target supplier for
selection
Consult Production
on internal logistics
Contact D&D for
advice
Exists possibility for
standardization?
File ECR
Create business
case
Is it approved?
Target supplier for
selection
Consult Marketing
Exists possibility for
standardization?
Present to CCB
Is it profitable?
Contact supplier for
quotation
Consult Production
on internal logistics
Contact supplier for
quotation
Create business
case
Is it profitable?
Target supplier for
selection
Consult Production
on internal logistics
Yes
No
Yes
No
Yes
No
Yes
No
Yes
No
Yes
No
Yes Yes
No No
Yes
No
Decision
Start/end
Process
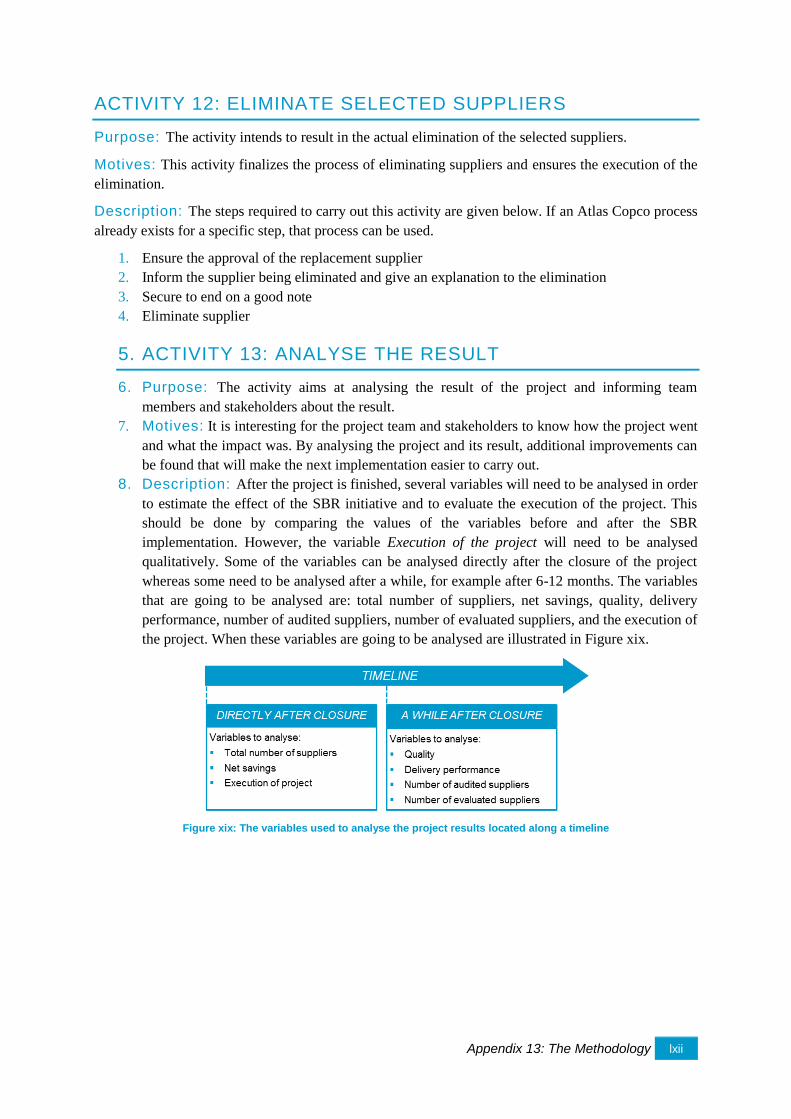
Appendix 13: The Methodology lxii
ACTIVITY 12: ELIMINATE SELECTED SUPPLIERS
Purpose: The activity intends to result in the actual elimination of the selected suppliers.
Motives: This activity finalizes the process of eliminating suppliers and ensures the execution of the
elimination.
Description: The steps required to carry out this activity are given below. If an Atlas Copco process
already exists for a specific step, that process can be used.
1. Ensure the approval of the replacement supplier
2. Inform the supplier being eliminated and give an explanation to the elimination
3. Secure to end on a good note
4. Eliminate supplier
5. ACTIVITY 13: ANALYSE THE RESULT
6. Purpose: The activity aims at analysing the result of the project and informing team
members and stakeholders about the result.
7. Motives: It is interesting for the project team and stakeholders to know how the project went
and what the impact was. By analysing the project and its result, additional improvements can
be found that will make the next implementation easier to carry out.
8. Description: After the project is finished, several variables will need to be analysed in order
to estimate the effect of the SBR initiative and to evaluate the execution of the project. This
should be done by comparing the values of the variables before and after the SBR
implementation. However, the variable Execution of the project will need to be analysed
qualitatively. Some of the variables can be analysed directly after the closure of the project
whereas some need to be analysed after a while, for example after 6-12 months. The variables
that are going to be analysed are: total number of suppliers, net savings, quality, delivery
performance, number of audited suppliers, number of evaluated suppliers, and the execution of
the project. When these variables are going to be analysed are illustrated in Figure xix.
Figure xix: The variables used to analyse the project results located along a timeline
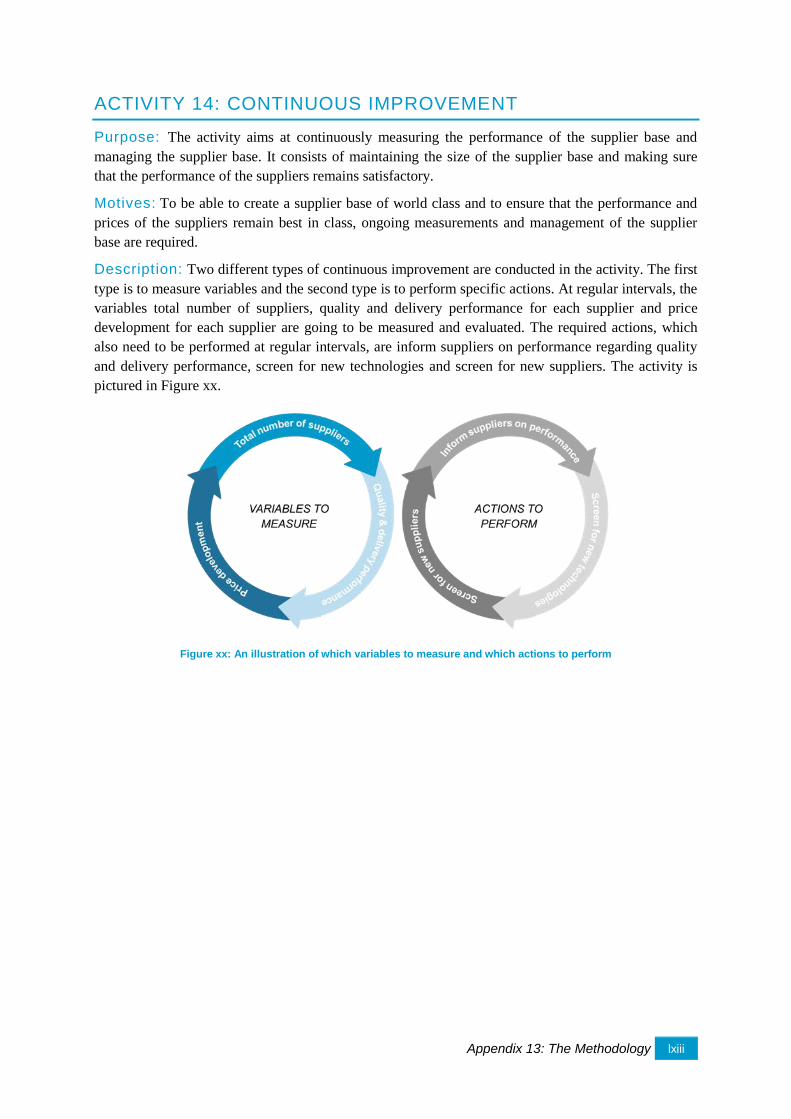
Appendix 13: The Methodology lxiii
ACTIVITY 14: CONTINUOUS IMPROVEMENT
Purpose: The activity aims at continuously measuring the performance of the supplier base and
managing the supplier base. It consists of maintaining the size of the supplier base and making sure
that the performance of the suppliers remains satisfactory.
Motives: To be able to create a supplier base of world class and to ensure that the performance and
prices of the suppliers remain best in class, ongoing measurements and management of the supplier
base are required.
Description: Two different types of continuous improvement are conducted in the activity. The first
type is to measure variables and the second type is to perform specific actions. At regular intervals, the
variables total number of suppliers, quality and delivery performance for each supplier and price
development for each supplier are going to be measured and evaluated. The required actions, which
also need to be performed at regular intervals, are inform suppliers on performance regarding quality
and delivery performance, screen for new technologies and screen for new suppliers. The activity is
pictured in Figure xx.
Figure xx: An illustration of which variables to measure and which actions to perform