Embed Size (px)
Citation preview
1
1
Developing a GIS-Based Software for Estimating Nitrate Fate and Transport in Surficial Aquifers: from Septic Systems
to Surface Water Bodies
November 5th, 2010
Presentation at the Department of Health
Picture from USGS Scientific Investigations Report 2008–5220
2
Project Team Members• Contract Manager:
– Rick Hicks (FDEP) ([email protected])• Principal Investigators:
– Ming Ye (FSU) ([email protected])– Paul Lee (FDEP) ([email protected])
• Graduate Students:– Fernando Rios (FSU)– Raoul Fernendes (FSU)
• Post-doc:– Liying Wang (FSU)
• No-Cost Collaborators:– Hal David (USGS)– Tingting Zhao, Amy Chan-Hilton, Joel Kostka (FSU)

2
3
Presentation Outlines
• Project overview (Hicks)
• Project background, motivations, and objectives (Lee)
• Development of groundwater flow and nitrate fate and transport models (Ye)
• Development of GIS-based software and demonstration (Rios)
• Future research (Ye)
4
Project Overview

3
5
Project Overview: Tasks and Timetable
××Task 7: Final project report, software documentation and training
××××Task 6: Apply the developed tool to a selected site to facilitate DEP nitrate estimation and management
××Task 5: Develop ArcGIS-based package for environmental management
××Task 4: Develop ArcGIS-based package for nitrate fate and transport model (completed)
××Task 3: Develop ArcGIS plug-in package for groundwater flowmodeling (completed)
××××Task 2: Incorporate lab measurements and field observationsinto model implementation and calibration
×Task 1: Develop a simplified conceptual model of nitrate fate and transport in shallow groundwater aquifer (completed)
43214321Quarter
Year 2Year 1Year
Duration: 10/1/2009 – 9/30/2011
6
Project Background, Motivations, and Objectives
4
7
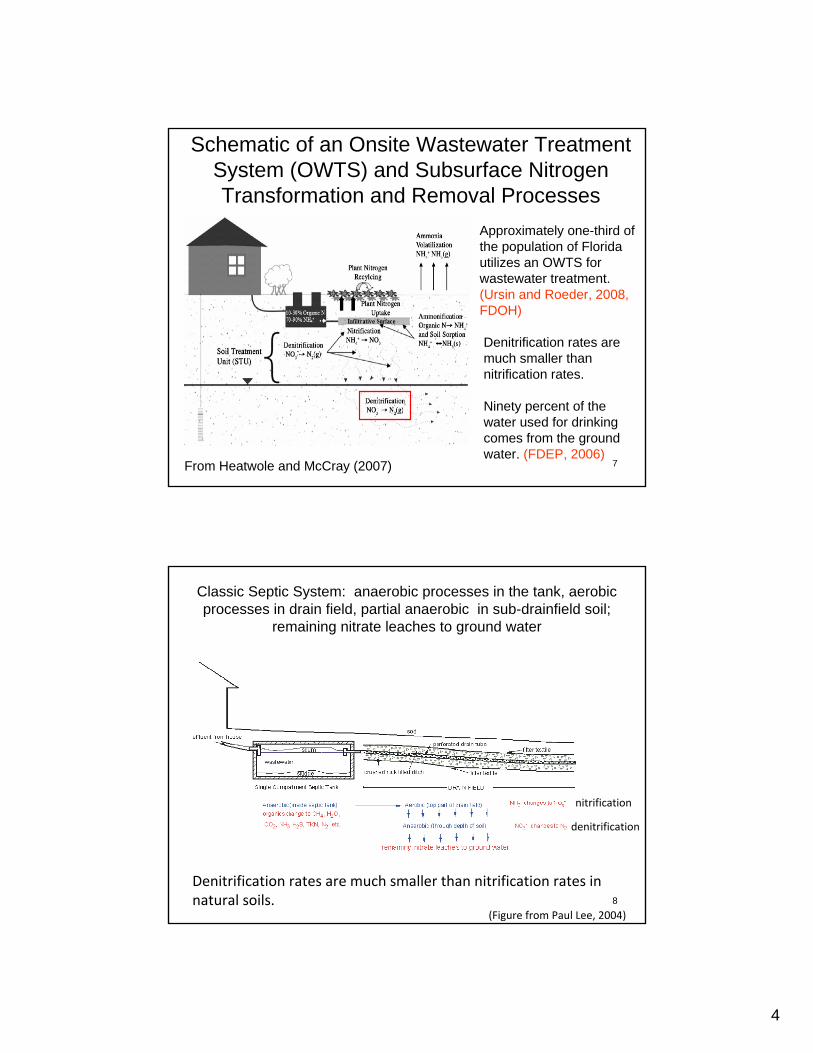
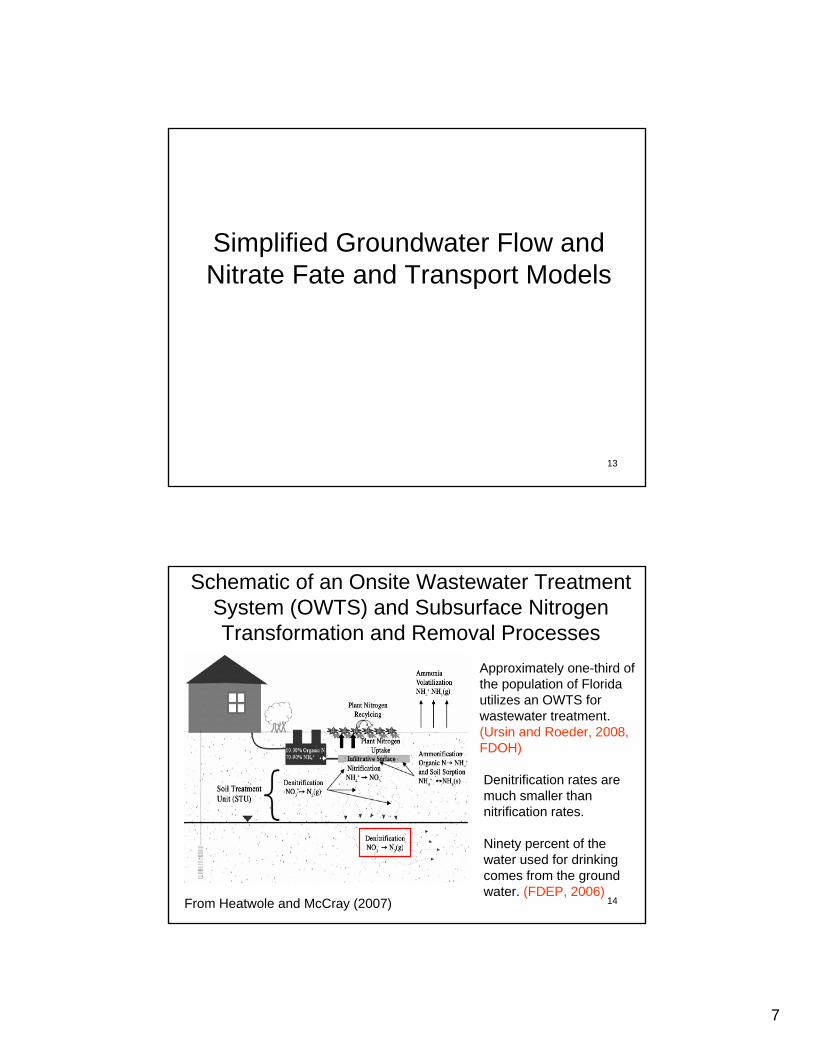
Schematic of an Onsite Wastewater Treatment System (OWTS) and Subsurface Nitrogen Transformation and Removal Processes
From Heatwole and McCray (2007)
Approximately one-third of the population of Florida utilizes an OWTS for wastewater treatment.(Ursin and Roeder, 2008, FDOH)
Denitrification rates are much smaller than nitrification rates.
Ninety percent of the water used for drinking comes from the ground water. (FDEP, 2006)
8
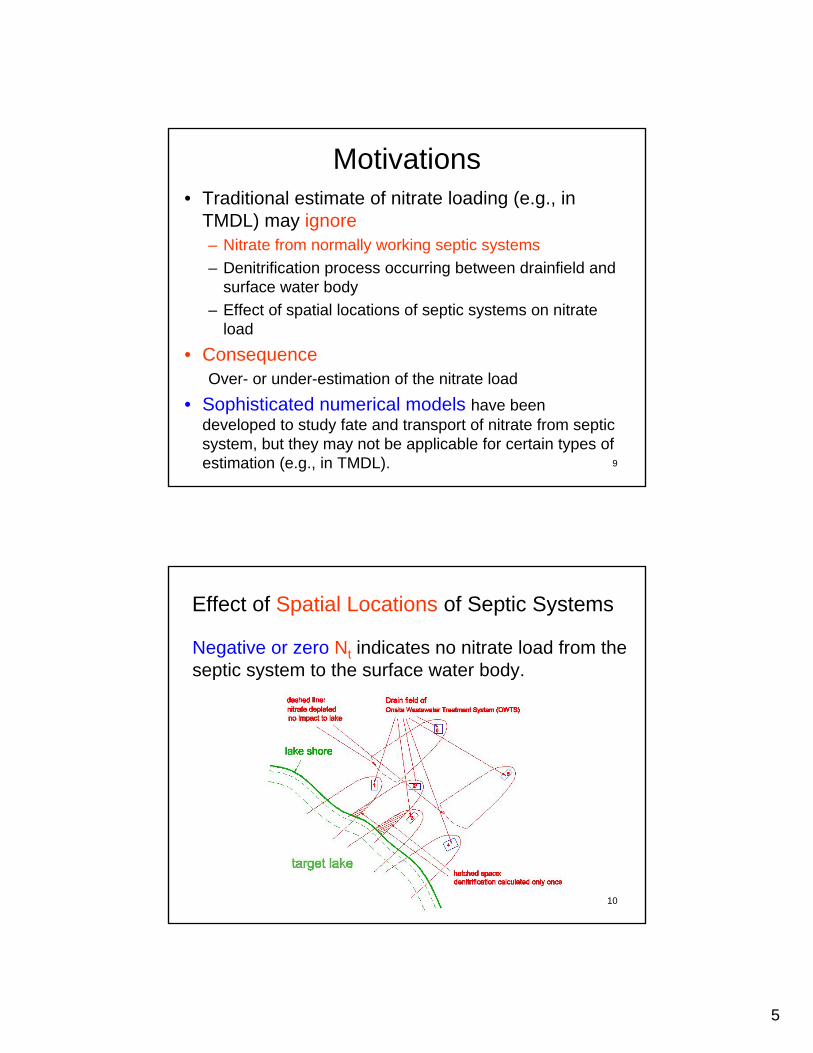
Classic Septic System: anaerobic processes in the tank, aerobicprocesses in drain field, partial anaerobic in sub-drainfield soil;
remaining nitrate leaches to ground water
nitrification
denitrification
Denitrification rates are much smaller than nitrification rates in natural soils.
(Figure from Paul Lee, 2004)
5
9
Motivations• Traditional estimate of nitrate loading (e.g., in
TMDL) may ignore– Nitrate from normally working septic systems
– Denitrification process occurring between drainfield and surface water body
– Effect of spatial locations of septic systems on nitrate load
• ConsequenceOver- or under-estimation of the nitrate load
• Sophisticated numerical models have been developed to study fate and transport of nitrate from septic system, but they may not be applicable for certain types of estimation (e.g., in TMDL).
10
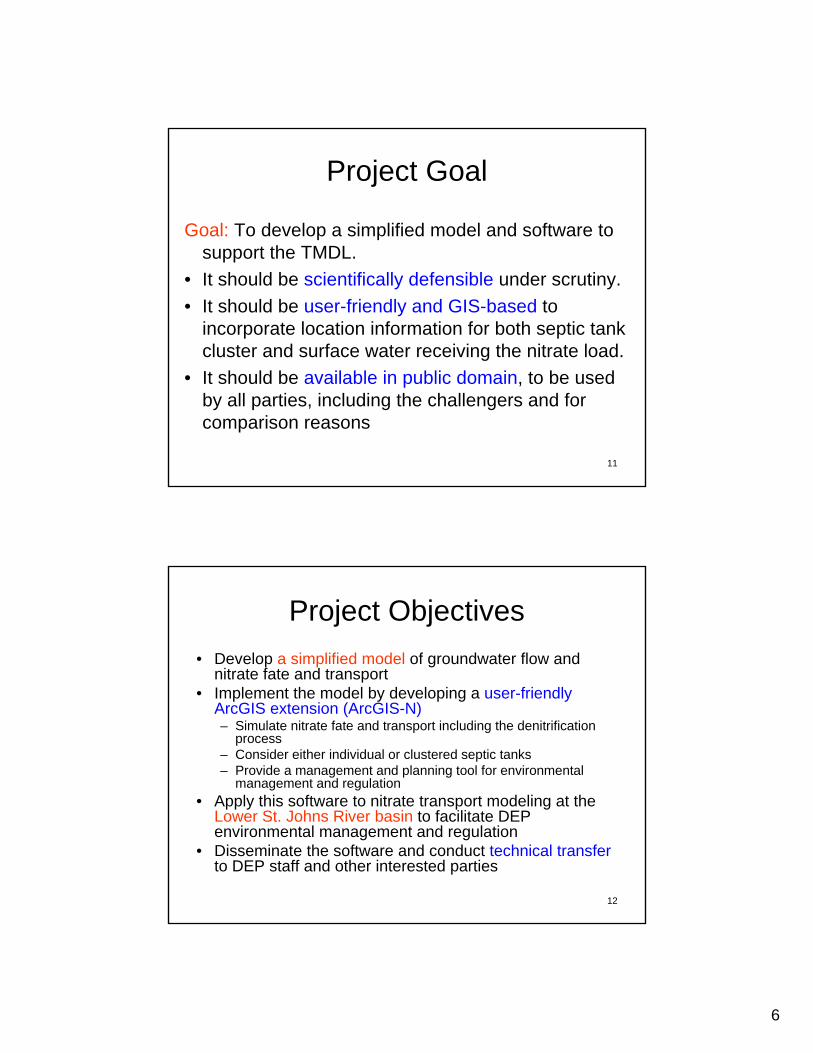
Effect of Spatial Locations of Septic Systems
Negative or zero Nt indicates no nitrate load from the septic system to the surface water body.
6
11
Project Goal
Goal: To develop a simplified model and software to support the TMDL.
• It should be scientifically defensible under scrutiny.
• It should be user-friendly and GIS-based to incorporate location information for both septic tank cluster and surface water receiving the nitrate load.
• It should be available in public domain, to be used by all parties, including the challengers and for comparison reasons
12
Project Objectives
• Develop a simplified model of groundwater flow and nitrate fate and transport
• Implement the model by developing a user-friendly ArcGIS extension (ArcGIS-N)– Simulate nitrate fate and transport including the denitrification
process– Consider either individual or clustered septic tanks– Provide a management and planning tool for environmental
management and regulation
• Apply this software to nitrate transport modeling at the Lower St. Johns River basin to facilitate DEP environmental management and regulation
• Disseminate the software and conduct technical transferto DEP staff and other interested parties
7
13
Simplified Groundwater Flow and Nitrate Fate and Transport Models
14
Schematic of an Onsite Wastewater Treatment System (OWTS) and Subsurface Nitrogen Transformation and Removal Processes
From Heatwole and McCray (2007)
Approximately one-third of the population of Florida utilizes an OWTS for wastewater treatment.(Ursin and Roeder, 2008, FDOH)
Denitrification rates are much smaller than nitrification rates.
Ninety percent of the water used for drinking comes from the ground water. (FDEP, 2006)
8
15
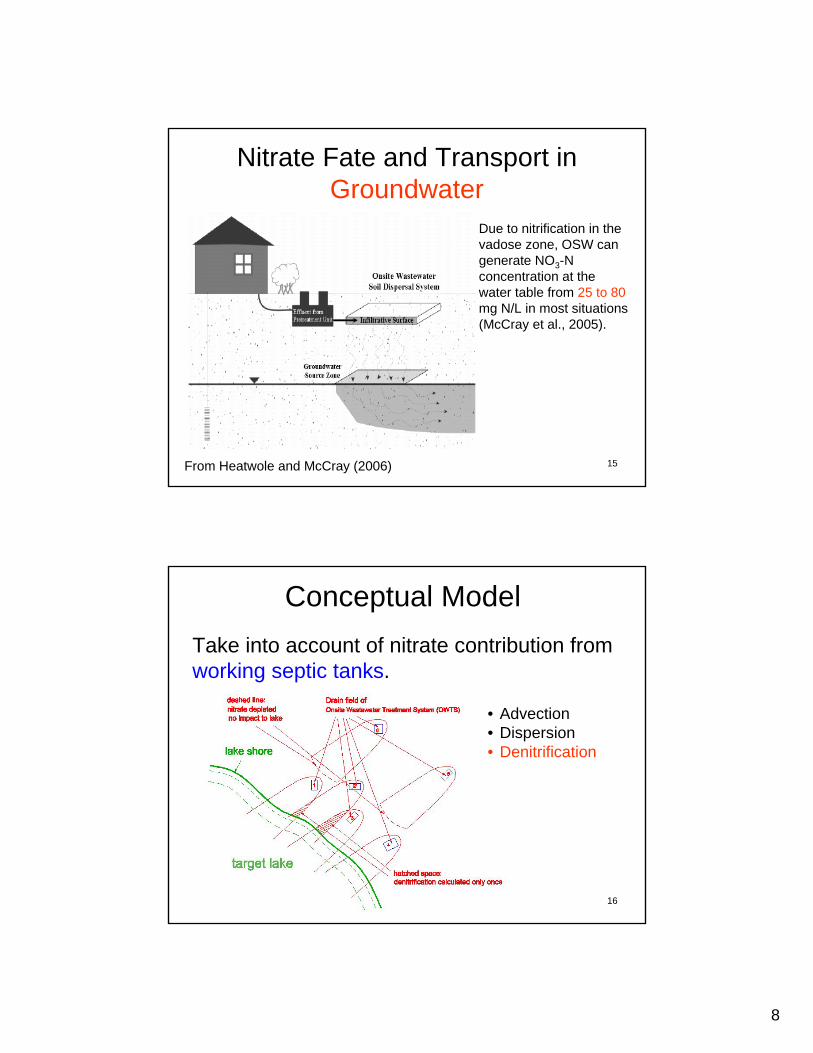
Nitrate Fate and Transport in Groundwater
From Heatwole and McCray (2006)
Due to nitrification in the vadose zone, OSW can generate NO3-N concentration at the water table from 25 to 80mg N/L in most situations (McCray et al., 2005).
16
Conceptual Model
Take into account of nitrate contribution from working septic tanks.
• Advection• Dispersion• Denitrification
9
17
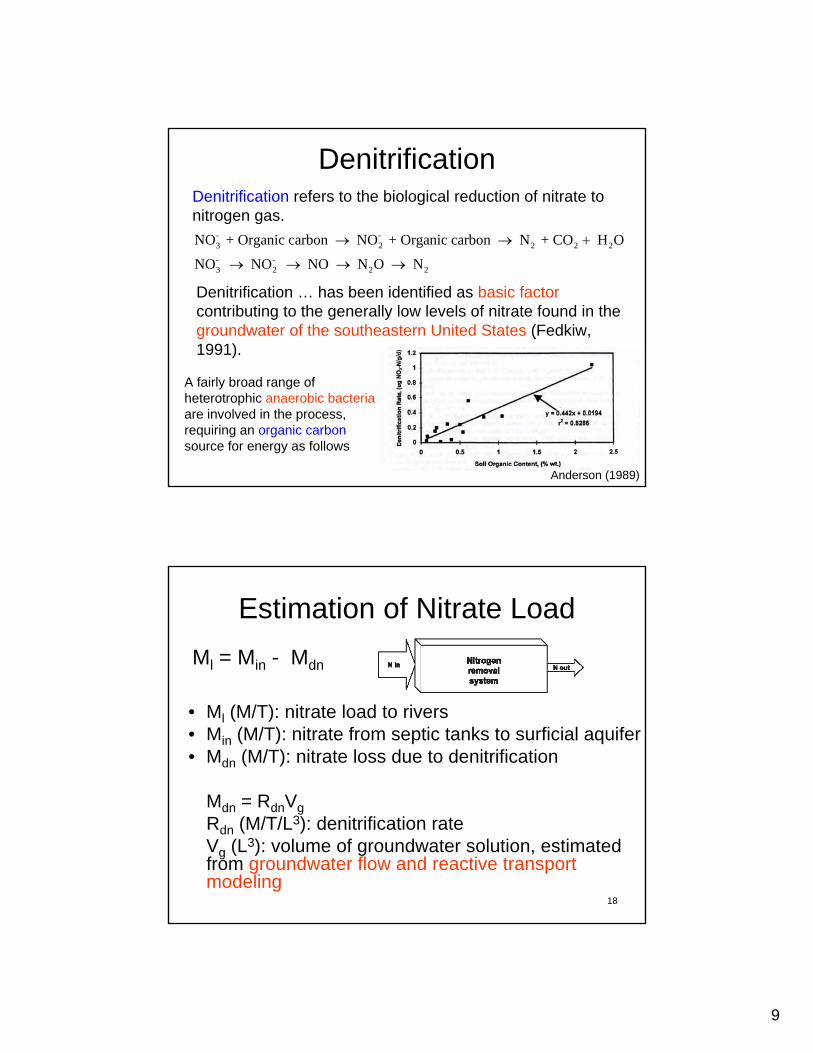
Denitrification
Denitrification … has been identified as basic factorcontributing to the generally low levels of nitrate found in thegroundwater of the southeastern United States (Fedkiw, 1991).
Denitrification refers to the biological reduction of nitrate to nitrogen gas.
- -3 2 2 2 2
- -3 2 2 2
NO + Organic carbon NO + Organic carbon N + CO H O
NO NO NO N O N
A fairly broad range of heterotrophic anaerobic bacteriaare involved in the process, requiring an organic carbonsource for energy as follows
Anderson (1989)
18
Estimation of Nitrate Load
• Ml (M/T): nitrate load to rivers• Min (M/T): nitrate from septic tanks to surficial aquifer• Mdn (M/T): nitrate loss due to denitrification
Mdn = RdnVg
Rdn (M/T/L3): denitrification rate Vg (L3): volume of groundwater solution, estimated from groundwater flow and reactive transport modeling
Ml = Min - Mdn
10
19
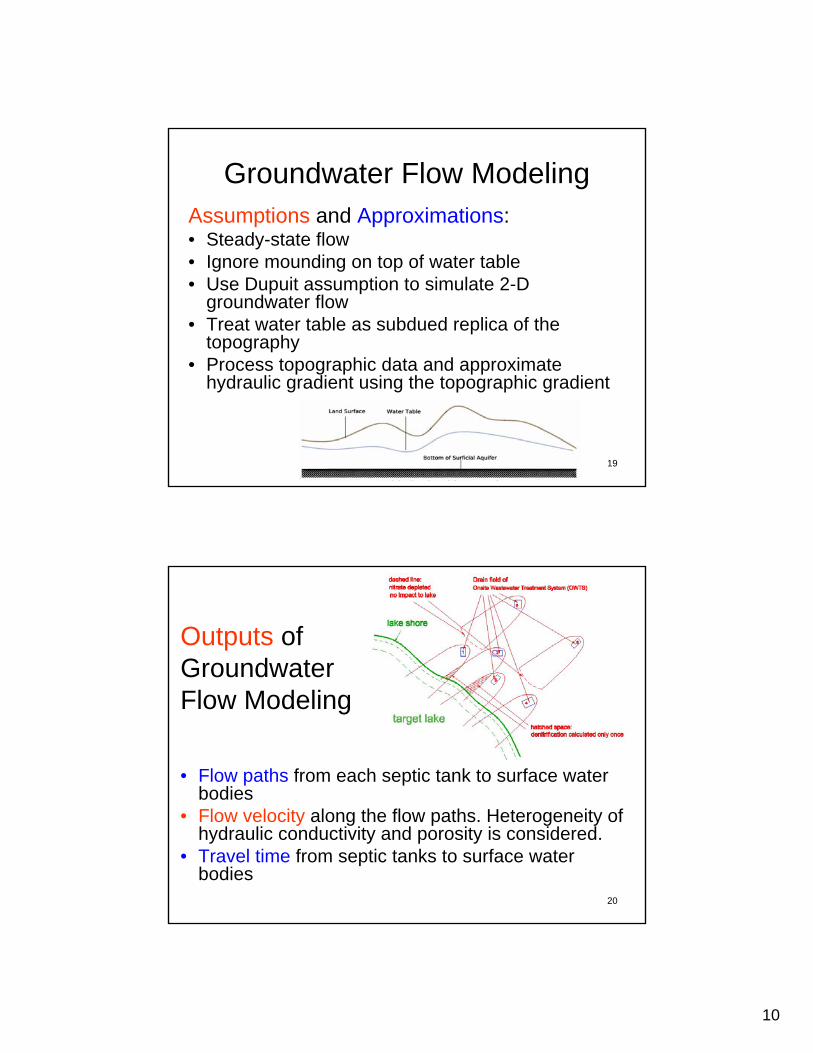
Groundwater Flow ModelingAssumptions and Approximations:• Steady-state flow• Ignore mounding on top of water table• Use Dupuit assumption to simulate 2-D
groundwater flow• Treat water table as subdued replica of the
topography• Process topographic data and approximate
hydraulic gradient using the topographic gradient
20
Outputs of Groundwater Flow Modeling
• Flow paths from each septic tank to surface water bodies
• Flow velocity along the flow paths. Heterogeneity of hydraulic conductivity and porosity is considered.
• Travel time from septic tanks to surface water bodies
11
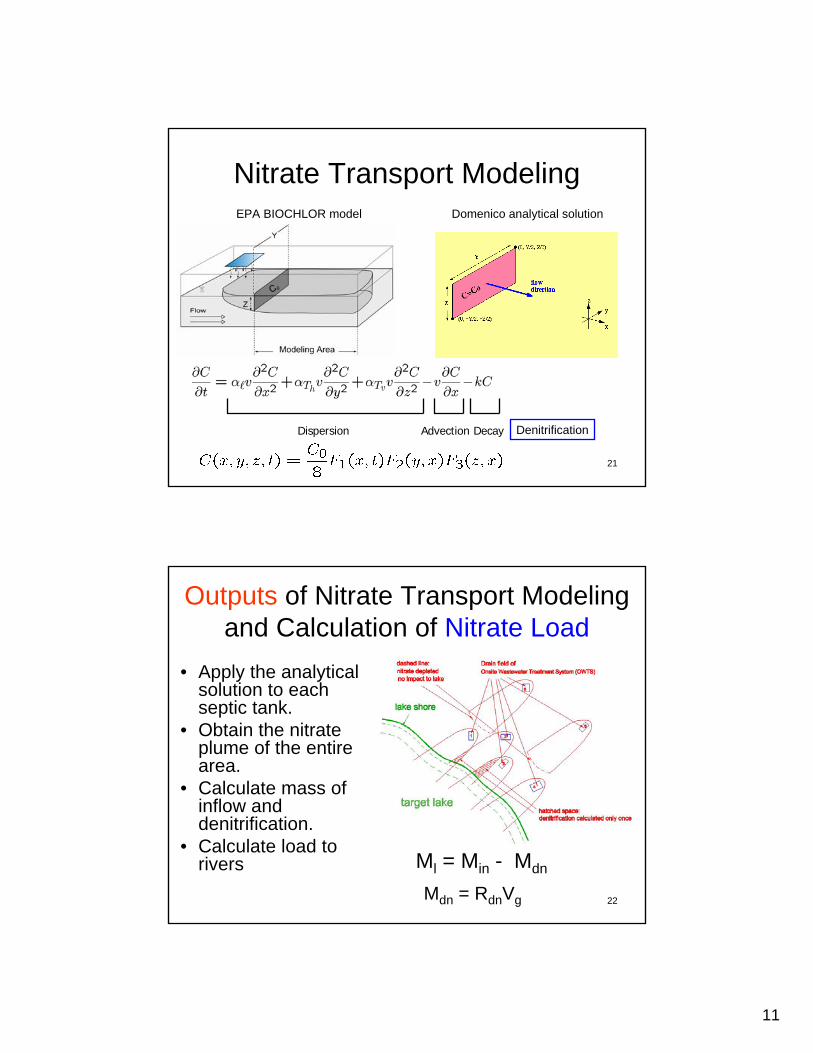
21
Nitrate Transport ModelingEPA BIOCHLOR model
Dispersion Advection Decay
Domenico analytical solution
Denitrification
22
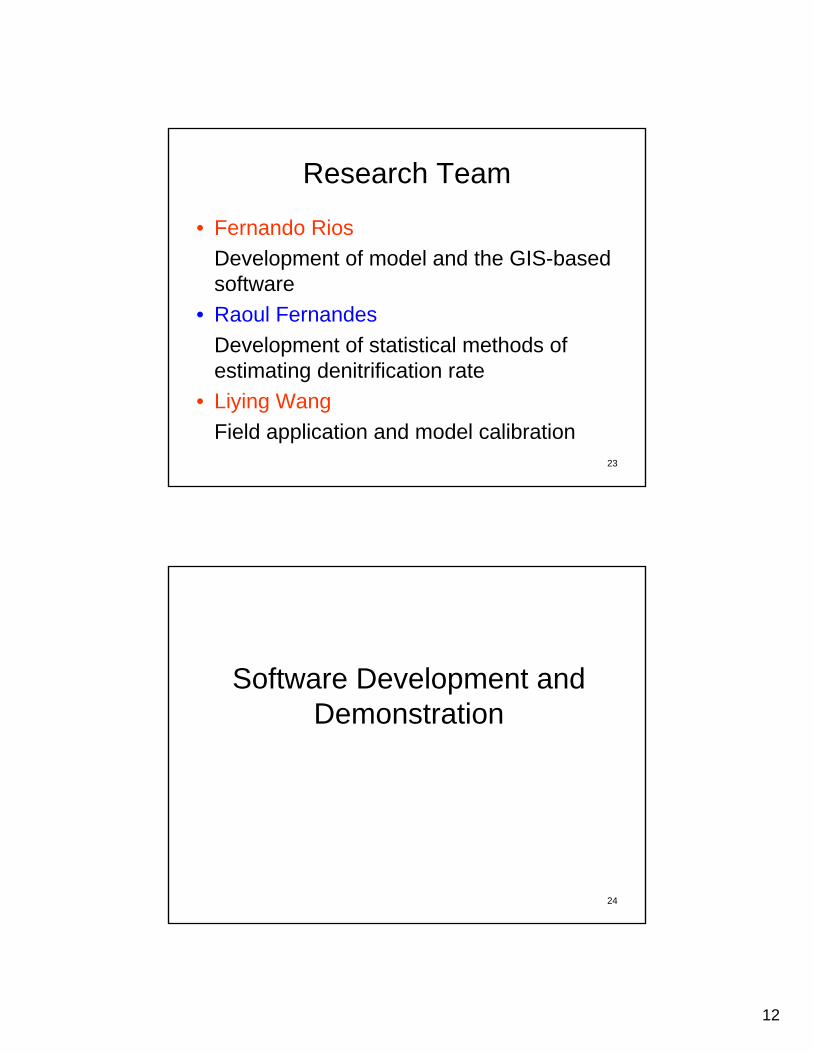
Outputs of Nitrate Transport Modelingand Calculation of Nitrate Load
• Apply the analytical solution to each septic tank.
• Obtain the nitrate plume of the entire area.
• Calculate mass of inflow and denitrification.
• Calculate load to rivers
Mdn = RdnVg
Ml = Min - Mdn
12
23
Research Team
• Fernando Rios
Development of model and the GIS-based software
• Raoul Fernandes
Development of statistical methods of estimating denitrification rate
• Liying Wang
Field application and model calibration
24
Software Development and Demonstration
13
25
Development of the ArcGIS Extension• All the development is within a GIS, including pre-
processing, post-processing, and computation.
• We developed a user-friendly interface using Visual Basic.– The .NET framework is used to expedite development.
• The software development is for ArcGIS 9.3. – The software can be updated with newer version of
ArcGIS.
• Final product is a installation file that installs the ArcGIS extension on PC.
26
Development of the ArcGIS Extension
• Modules – Groundwater Flow
– Transport
– Denitrification
• Details of model/software verification and validation are referred to the draft manual.
14
27
Future Research
28
Future Work
• Model/software verification and validation• Field data collection and compilation
– Parameters (e.g., hydraulic conductivity, effective porosity, dispersivity)
– Field conditions related to denitrification (e.g., OC and soil texture)
– Field observations (hydraulic heads, flow rate, and nitrate load and concentrations)
• Model calibration to match model simulations to field observations
• Software dissemination and technical transfer and training
15
29
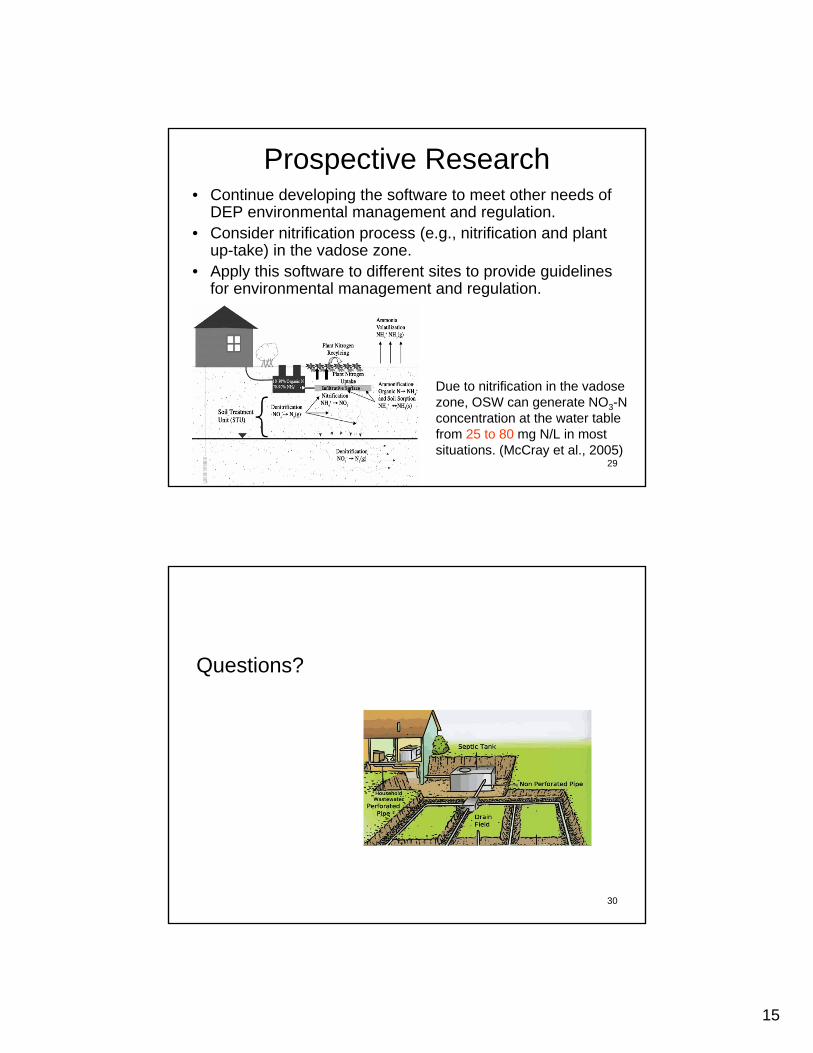
Prospective Research• Continue developing the software to meet other needs of
DEP environmental management and regulation. • Consider nitrification process (e.g., nitrification and plant
up-take) in the vadose zone.• Apply this software to different sites to provide guidelines
for environmental management and regulation.
Due to nitrification in the vadose zone, OSW can generate NO3-N concentration at the water table from 25 to 80 mg N/L in most situations. (McCray et al., 2005)
30
Questions?