Embed Size (px)
Citation preview

Developing a Comprehensive State-wide
Evaluation for PBSHeather Peshak George, Ph.D.
Donald K. Kincaid, Ed.D.
2
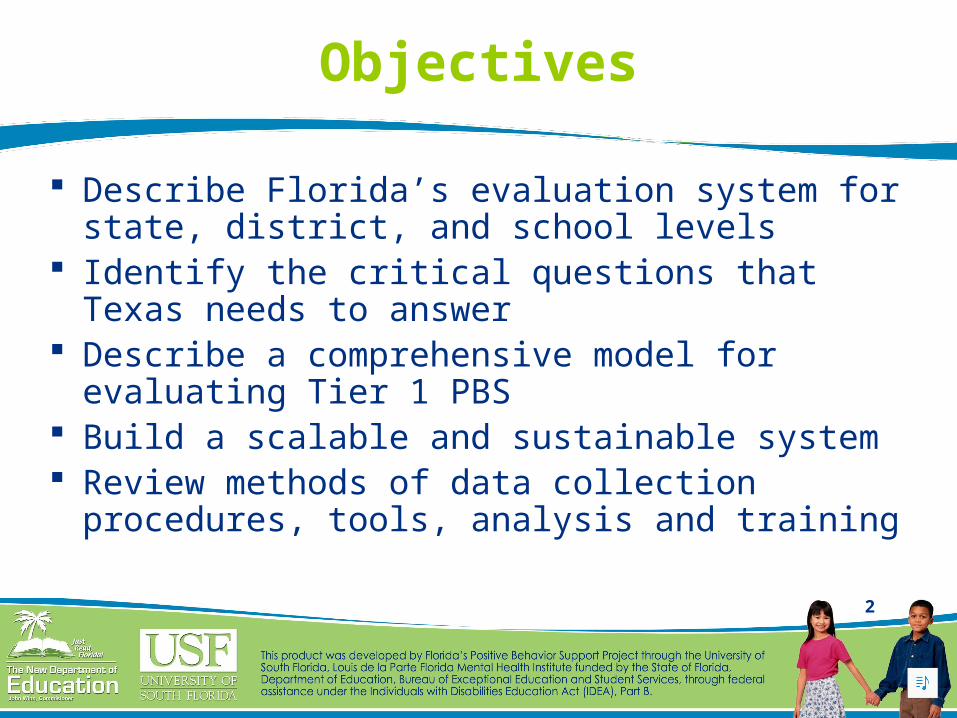
Objectives
Describe Florida’s evaluation system for state, district, and school levels
Identify the critical questions that Texas needs to answer
Describe a comprehensive model for evaluating Tier 1 PBS
Build a scalable and sustainable system Review methods of data collection
procedures, tools, analysis and training
3
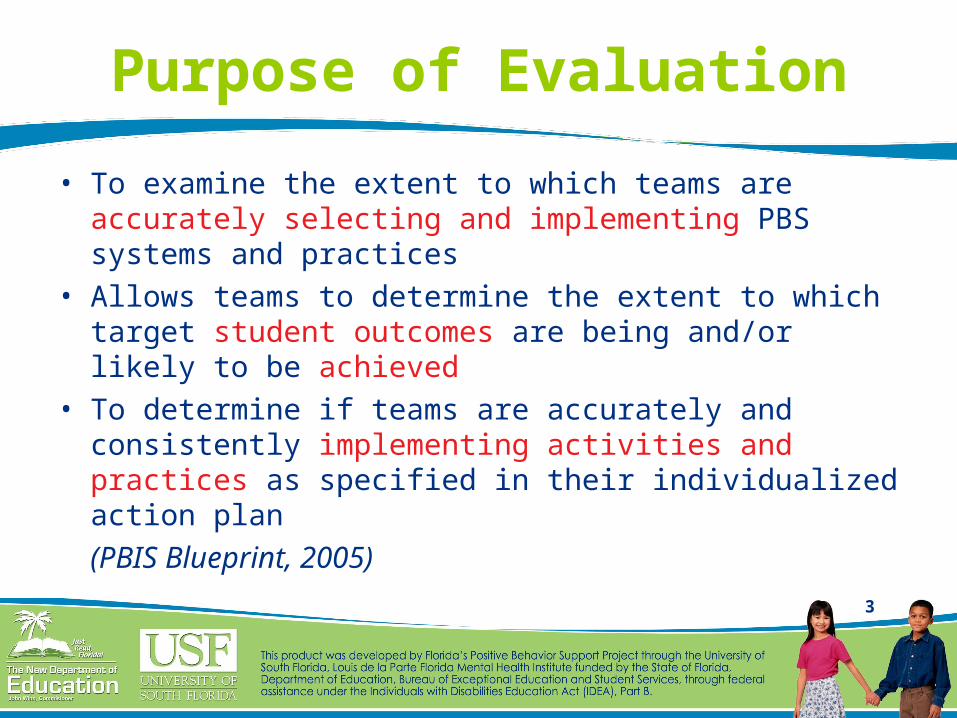
Purpose of Evaluation
• To examine the extent to which teams are accurately selecting and implementing PBS systems and practices
• Allows teams to determine the extent to which target student outcomes are being and/or likely to be achieved
• To determine if teams are accurately and consistently implementing activities and practices as specified in their individualized action plan
(PBIS Blueprint, 2005)
4
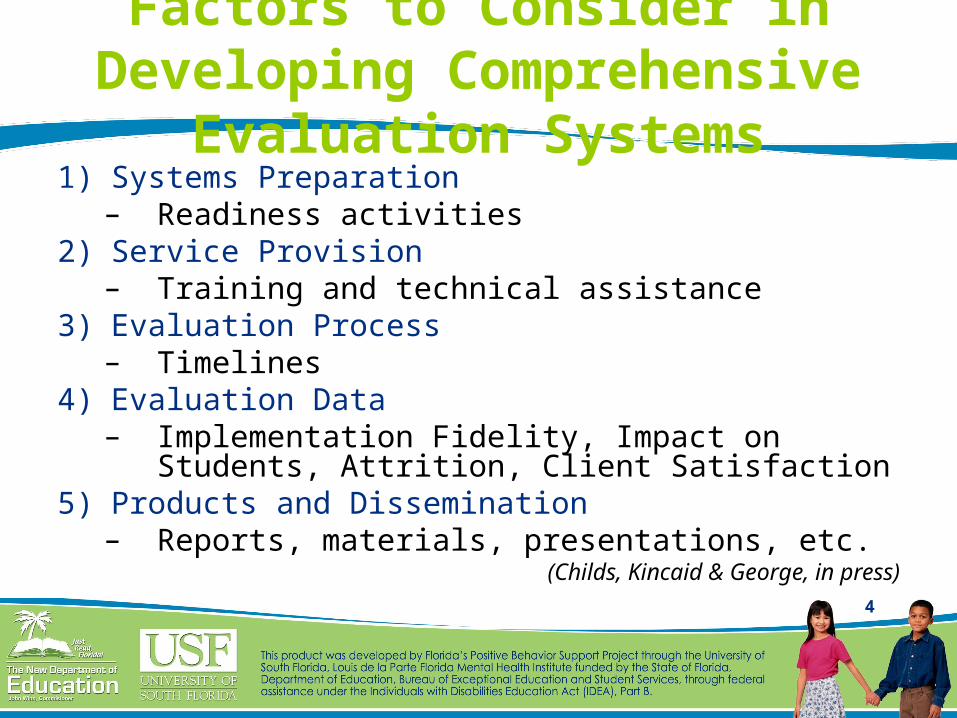
Factors to Consider in Developing Comprehensive
Evaluation Systems1) Systems Preparation
– Readiness activities2) Service Provision
– Training and technical assistance3) Evaluation Process
– Timelines4) Evaluation Data
– Implementation Fidelity, Impact on Students, Attrition, Client Satisfaction
5) Products and Dissemination– Reports, materials, presentations, etc.
(Childs, Kincaid & George, in press)

5
What Questions Does Texas Need to Answer?
6
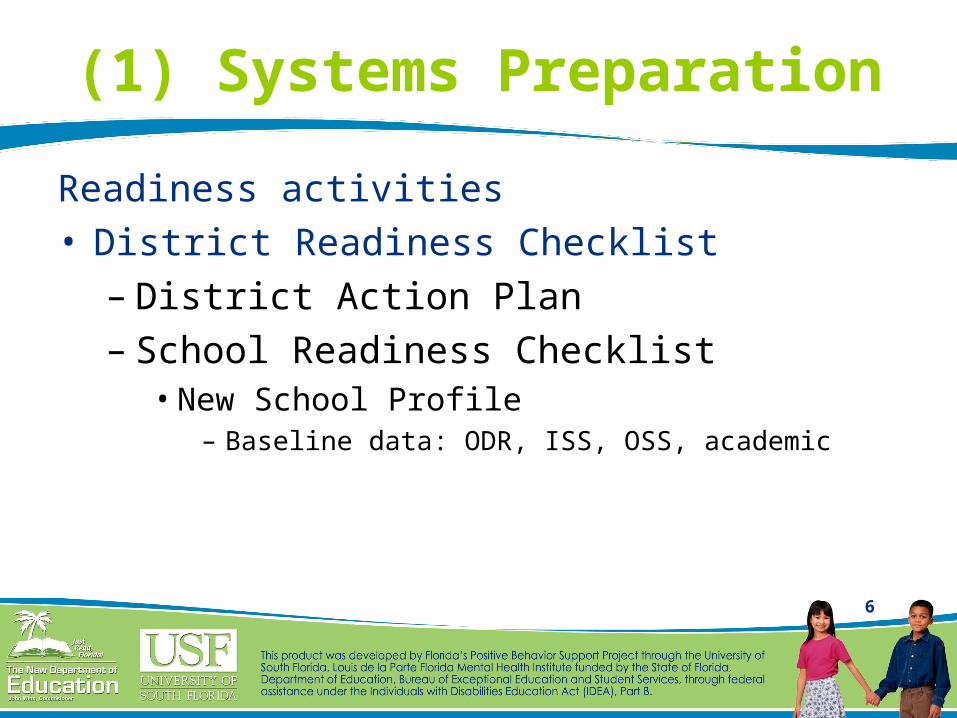
(1) Systems Preparation
Readiness activities• District Readiness Checklist
– District Action Plan– School Readiness Checklist
• New School Profile– Baseline data: ODR, ISS, OSS, academic
7
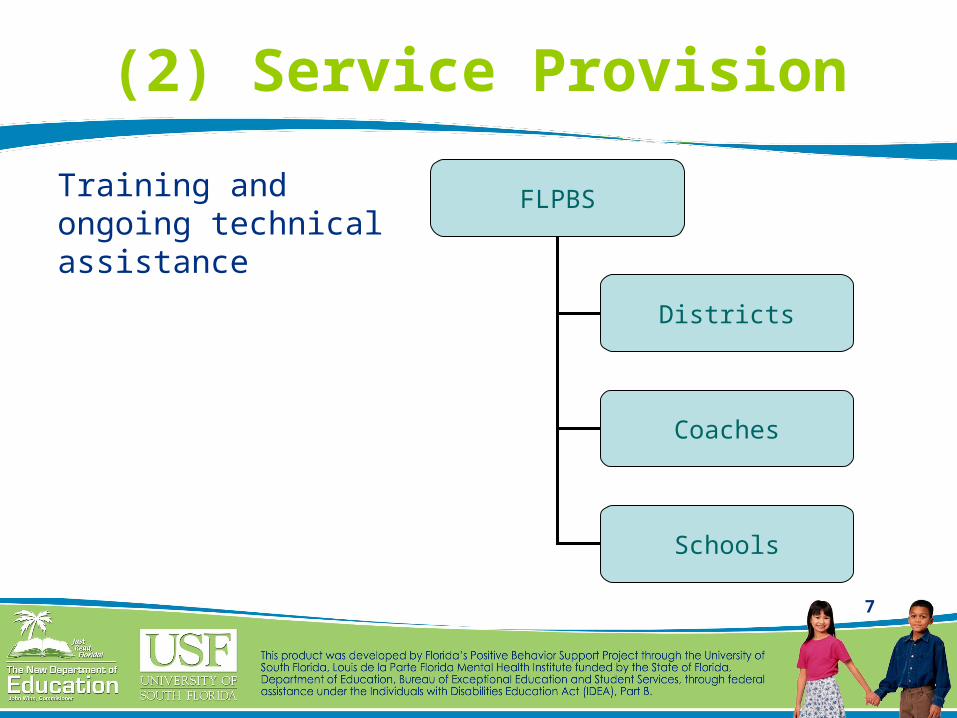
(2) Service Provision
Training and ongoing technical assistance
FLPBS
Districts
Coaches
Schools
8
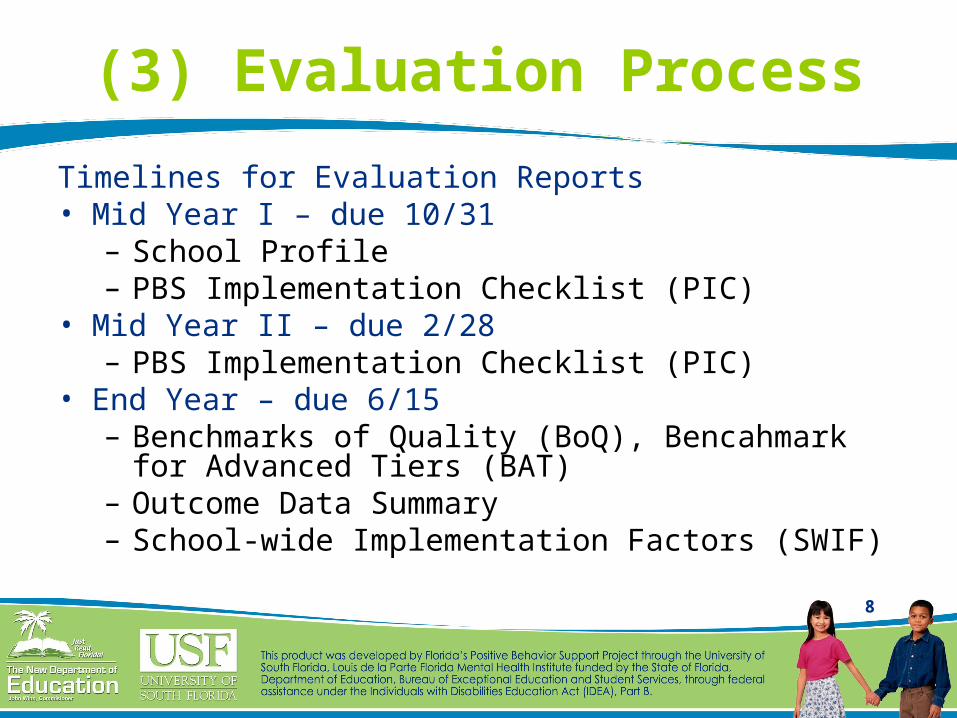
(3) Evaluation Process
Timelines for Evaluation Reports• Mid Year I – due 10/31
– School Profile– PBS Implementation Checklist (PIC)
• Mid Year II – due 2/28– PBS Implementation Checklist (PIC)
• End Year – due 6/15– Benchmarks of Quality (BoQ), Bencahmark for
Advanced Tiers (BAT)– Outcome Data Summary– School-wide Implementation Factors (SWIF)
9
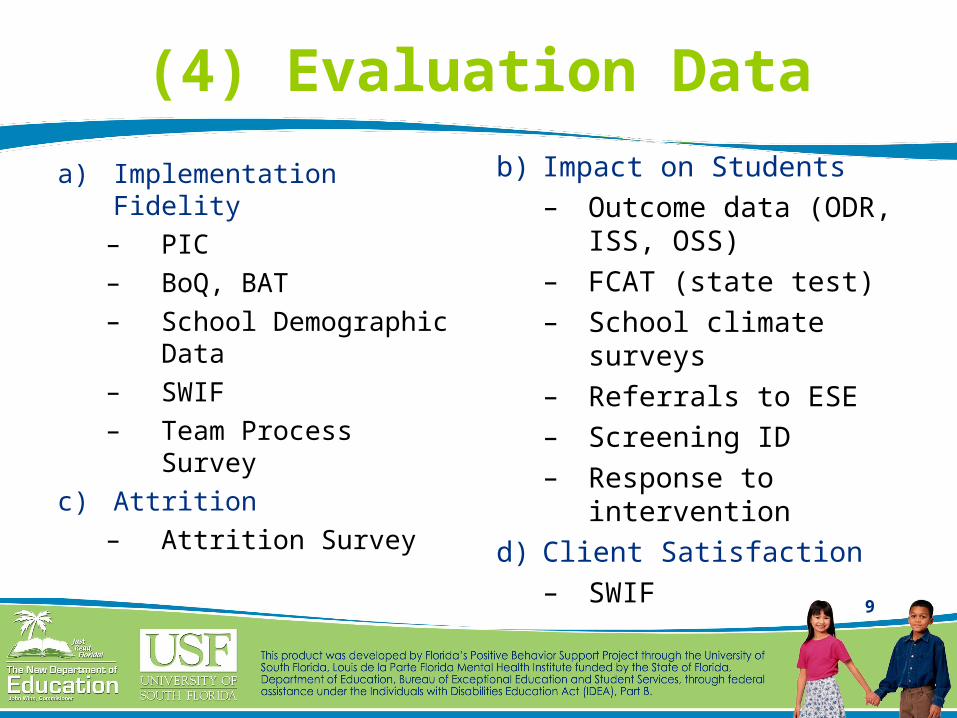
(4) Evaluation Data
a) Implementation Fidelity– PIC– BoQ, BAT– School Demographic
Data – SWIF– Team Process Survey
c) Attrition– Attrition Survey
b) Impact on Students– Outcome data (ODR,
ISS, OSS)
– FCAT (state test)
– School climate surveys
– Referrals to ESE
– Screening ID
– Response to intervention
d) Client Satisfaction– SWIF
10
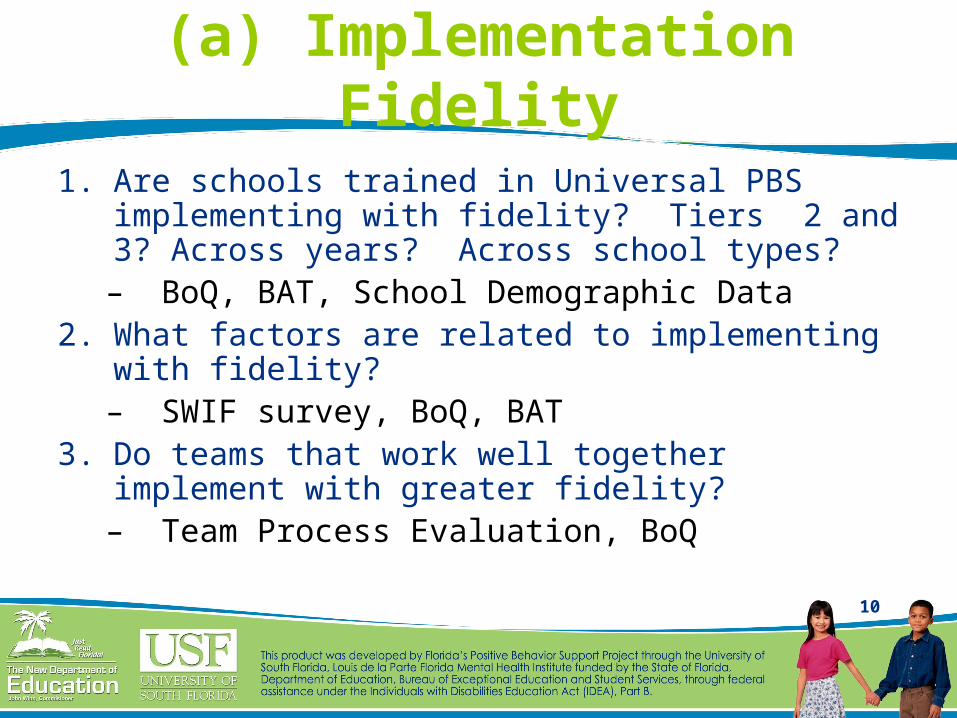
(a) Implementation Fidelity
1. Are schools trained in Universal PBS implementing with fidelity? Tiers 2 and 3? Across years? Across school types?– BoQ, BAT, School Demographic Data
2. What factors are related to implementing with fidelity? – SWIF survey, BoQ, BAT
3. Do teams that work well together implement with greater fidelity?– Team Process Evaluation, BoQ
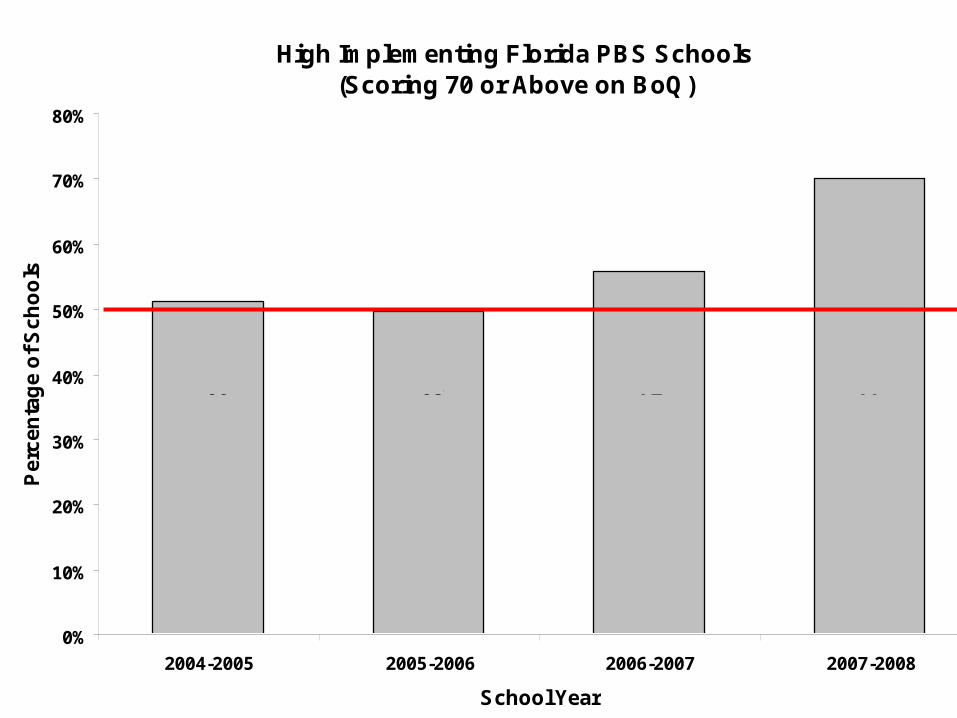
High Implementing Florida PBS Schools(Scoring 70 or Above on BoQ)
0%
10%
20%
30%
40%
50%
60%
70%
80%
2004-2005 2005-2006 2006-2007 2007-2008
School Year
Pe
rce
nta
ge
of
Sc
ho
ols
Average Score
Average Score
Average Score
Average Score
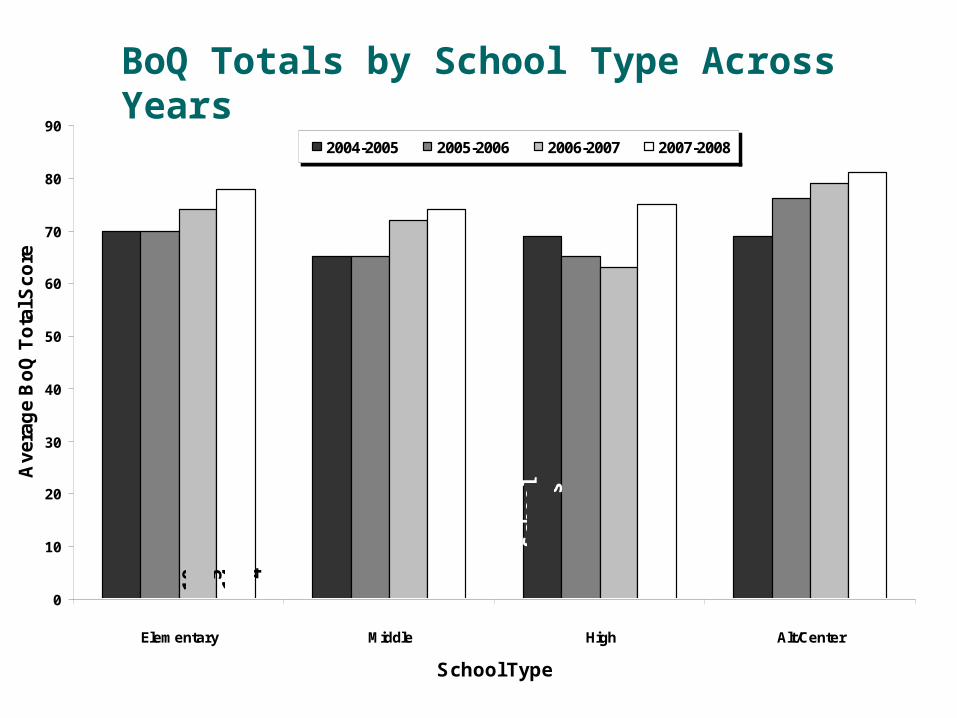
66 68 72 77
0
10
20
30
40
50
60
70
80
90
Elementary Middle High Alt/Center
School Type
Av
era
ge
Bo
Q T
ota
l Sc
ore
2004-2005 2005-2006 2006-2007 2007-2008
52
Sc
ho
ols
78
Sc
ho
ols
10 5
Sc
ho
ols
40
Sc
ho
ols
56
Sc
ho
ols
58
Sc
ho
ols
10
Sc
ho
ol s
14
Sc
ho
ols
17
Sc
ho
ols
27
Sc
ho
ols
27
Sc
ho
ols
31
Sc
ho
ols
14 4
Sc
ho
ols
60
Sc
ho
ols
17
Sc
ho
ols
32
Sc
ho
ols
BoQ Totals by School Type Across Years
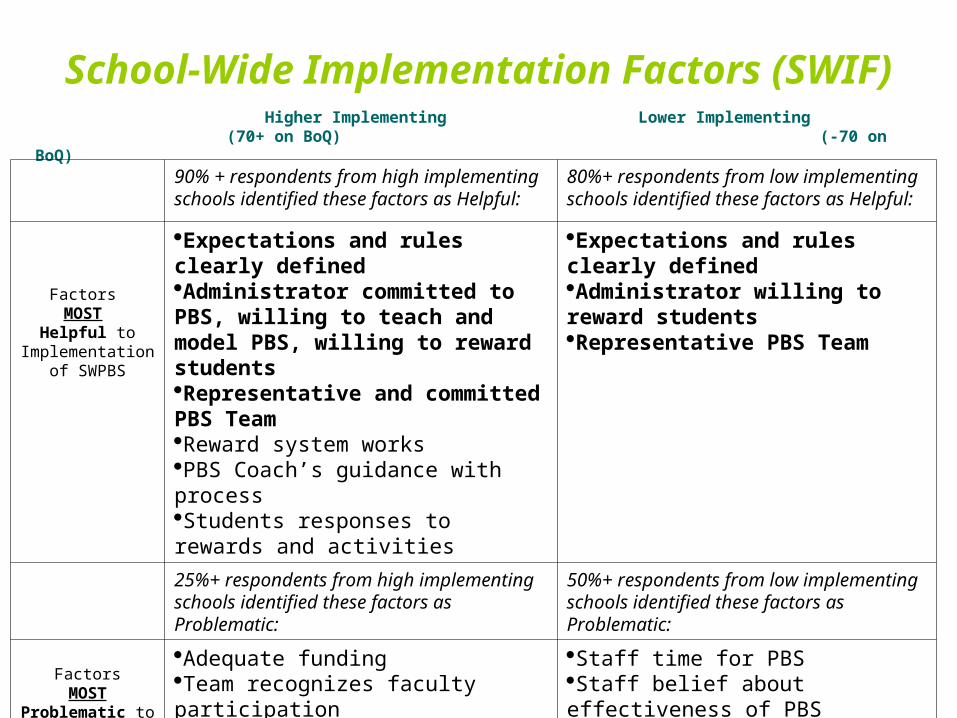
School-Wide Implementation Factors (SWIF) Higher Implementing Lower
Implementing(70+ on BoQ) (-70 on
BoQ)90% + respondents from high implementing schools identified these factors as Helpful:
80%+ respondents from low implementing schools identified these factors as Helpful:
Factors MOST
Helpful to Implementation of
SWPBS
Expectations and rules clearly definedAdministrator committed to PBS, willing to teach and model PBS, willing to reward studentsRepresentative and committed PBS TeamReward system worksPBS Coach’s guidance with processStudents responses to rewards and activities
Expectations and rules clearly definedAdministrator willing to reward studentsRepresentative PBS Team
25%+ respondents from high implementing schools identified these factors as Problematic:
50%+ respondents from low implementing schools identified these factors as Problematic:
FactorsMOST
Problematic to Implementation of
SWPBS
Adequate fundingTeam recognizes faculty participationStaff stability from year to yearStudent stability from year to year
Staff time for PBSStaff belief about effectiveness of PBSStaff philosophyStaff consistency in teachingStaff consistency in discipline procedures
14
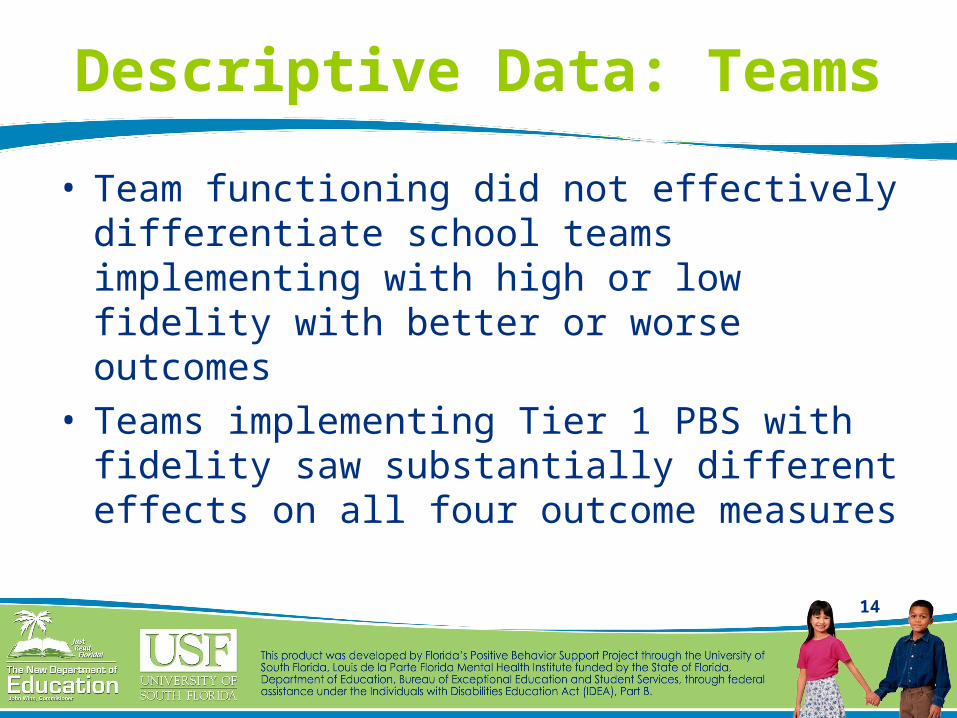
Descriptive Data: Teams
• Team functioning did not effectively differentiate school teams implementing with high or low fidelity with better or worse outcomes
• Teams implementing Tier 1 PBS with fidelity saw substantially different effects on all four outcome measures
15
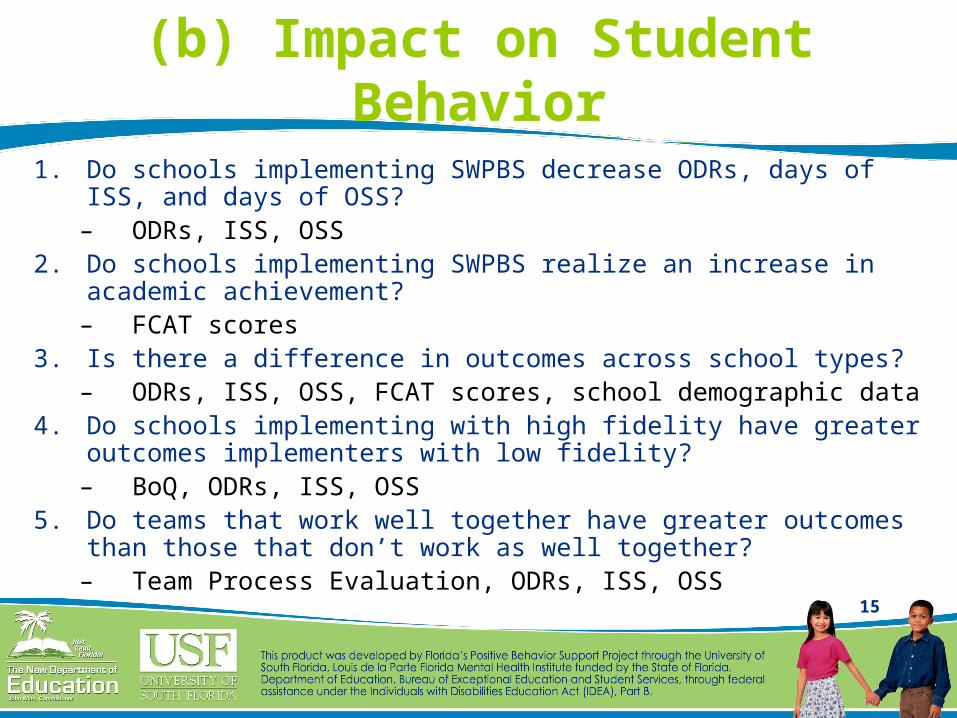
(b) Impact on Student Behavior
1. Do schools implementing SWPBS decrease ODRs, days of ISS, and days of OSS?
– ODRs, ISS, OSS2. Do schools implementing SWPBS realize an increase in
academic achievement?– FCAT scores
3. Is there a difference in outcomes across school types?– ODRs, ISS, OSS, FCAT scores, school demographic data
4. Do schools implementing with high fidelity have greater outcomes implementers with low fidelity?
– BoQ, ODRs, ISS, OSS5. Do teams that work well together have greater outcomes
than those that don’t work as well together?– Team Process Evaluation, ODRs, ISS, OSS
16
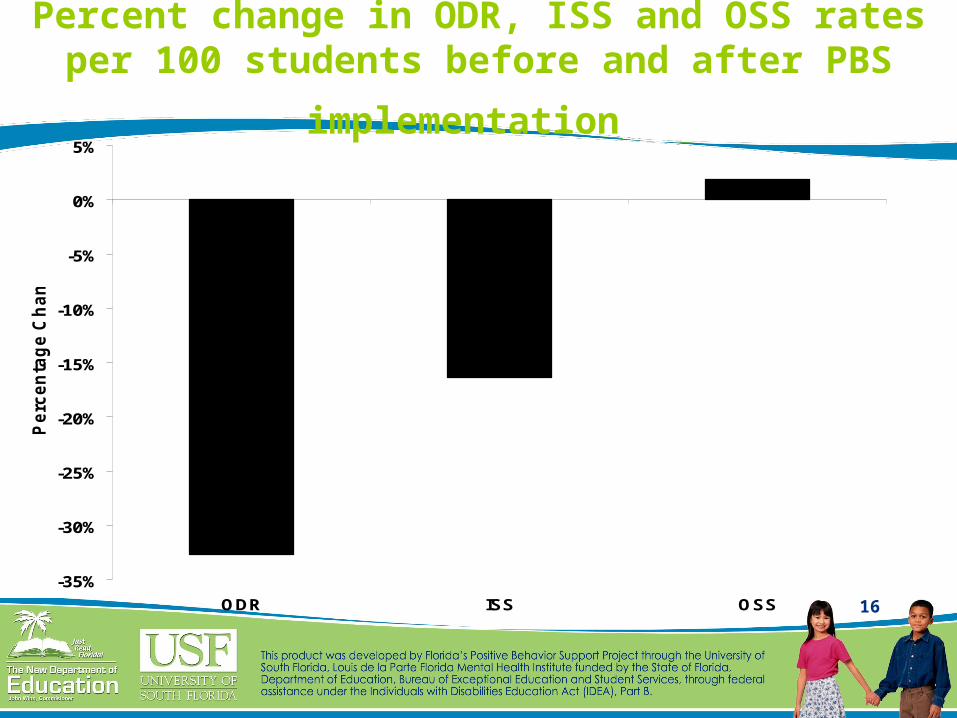
Percent change in ODR, ISS and OSS rates per 100 students before and after PBS
implementation
-35%
-30%
-25%
-20%
-15%
-10%
-5%
0%
5%
ODR ISS OSS
Pe
rce
nta
ge
Ch
an
ge
SD= 101.28 SD= 41.53
SD= 39.50
N = 50
N = 60
N = 61
17
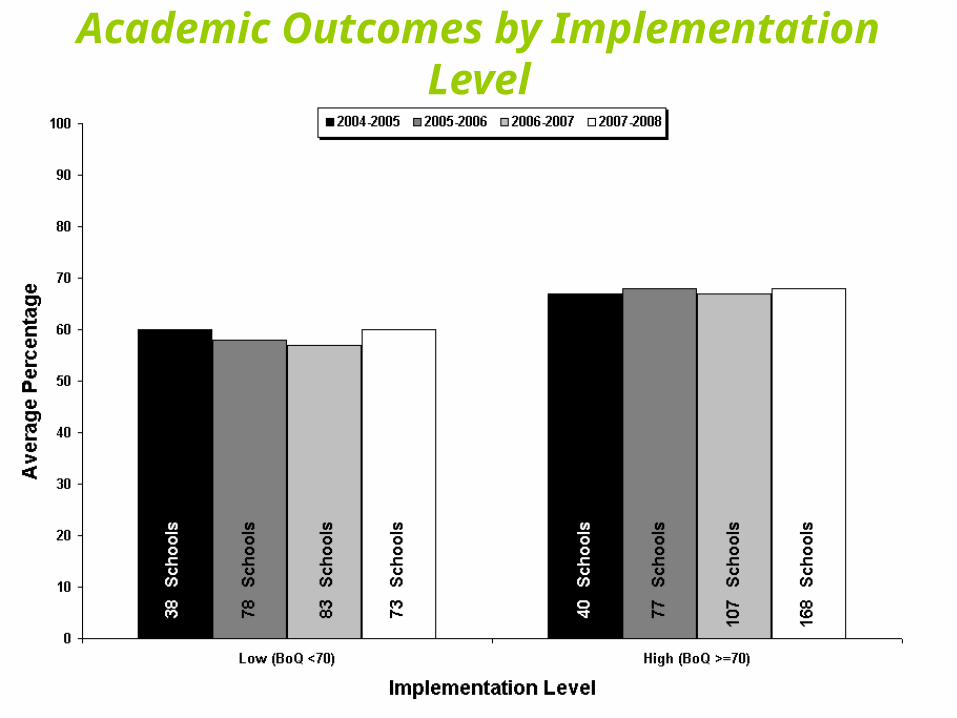
Academic Outcomes by Implementation Level
18
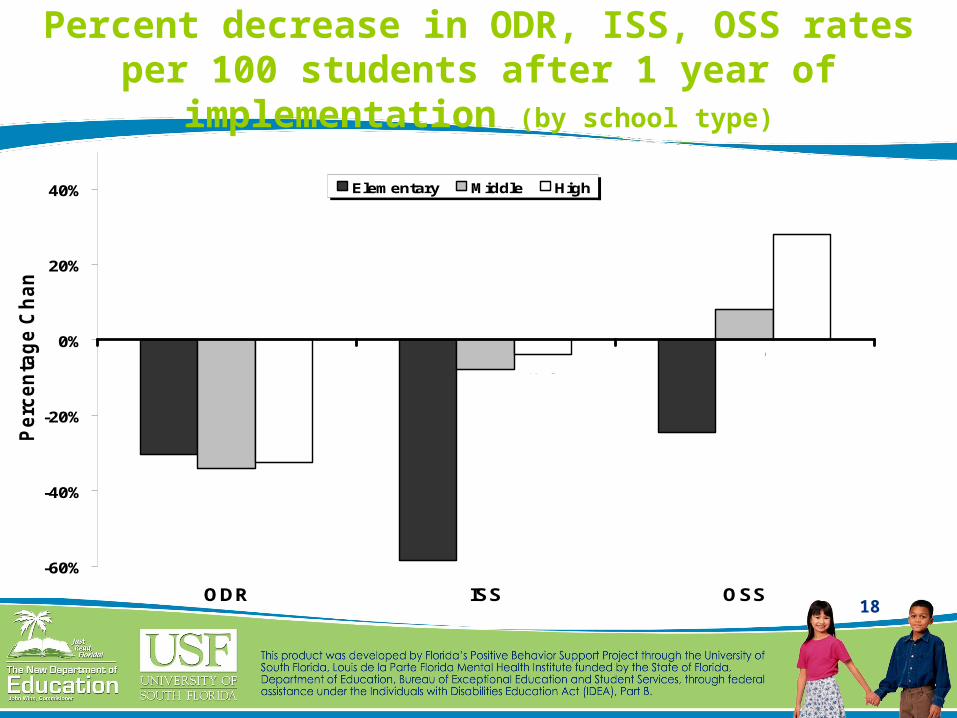
Percent decrease in ODR, ISS, OSS rates per 100 students after 1 year of implementation
(by school type)
-60%
-40%
-20%
0%
20%
40%
ODR ISS OSS
Pe
rce
nta
ge
Ch
an
ge
Elementary Middle High
SD=
53.76
SD=
162.48
SD=
98.60
SD=
40.83
SD=
44.51
SD=
40.85
SD=
17.37
N= 20 N= 5
N= 37N=15 N= 9
N= 27
N= 20N 3
N= 35
SD=
59.55
SD=
53.18
19
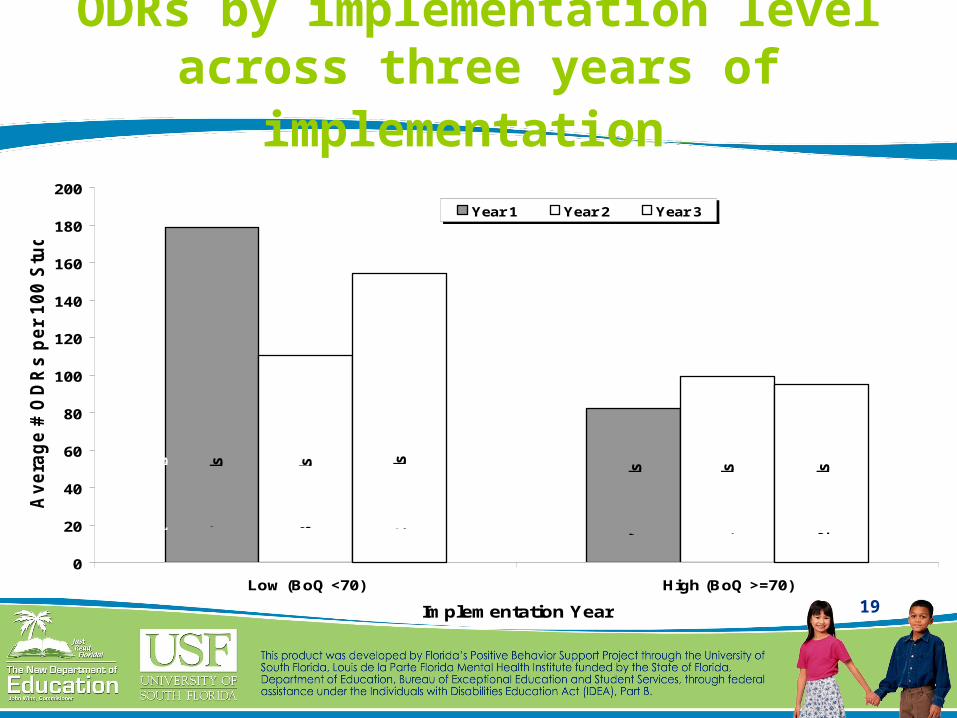
ODRs by implementation level across three years of
implementation
0
20
40
60
80
100
120
140
160
180
200
Low (BoQ <70) High (BoQ >=70)
Implementation Year
Ave
rag
e #
OD
Rs
pe
r 1
00
Stu
de
nts Year 1 Year 2 Year 3
17
Sc
ho
ols
17
Sc
ho
ols
21
Sc
ho
ols
13
Sc
ho
ols
22
Sc
ho
ols
11
1S
ch
oo
ls
12
Sc
ho
ols
20
(c) Attrition
1. Why do schools discontinue implementation of SWPBS?– Attrition Survey
21
(d) Consumer Satisfaction
1. Are our consumers satisfied with the training, technical assistance, products and support received?– SWIF survey – District Coordinators survey– Training evaluation
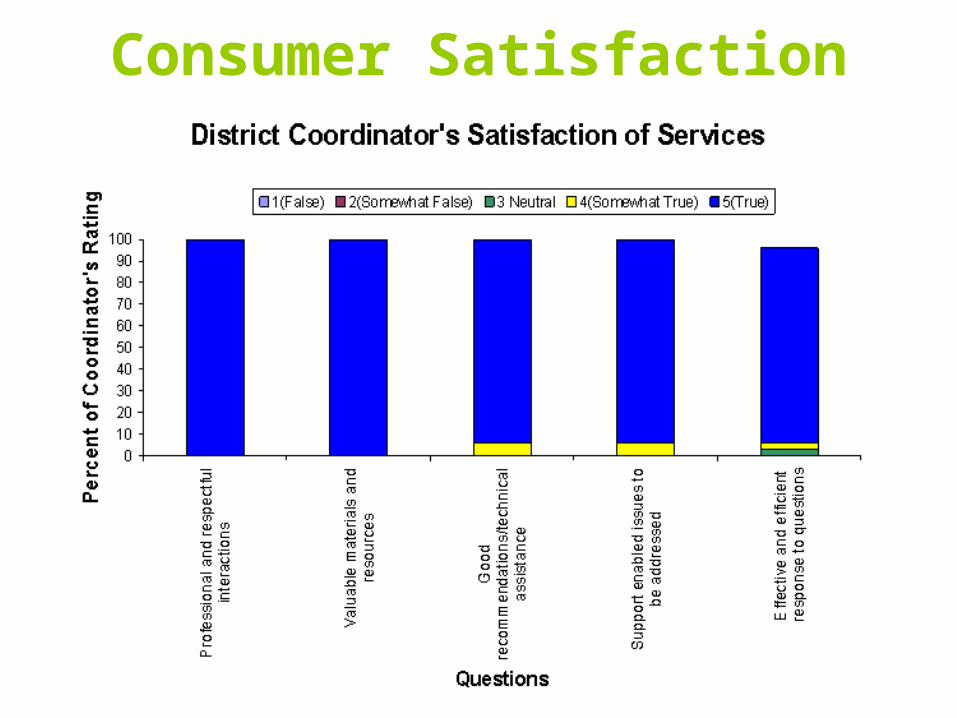
Consumer Satisfaction
23
(5) Products and Dissemination
• Annual Reports• Revisions to Training• Revisions to Technical Assistance process• Dissemination activities:
– National, state, district, school levels• Revisions to Website• On-line Training Modules
24
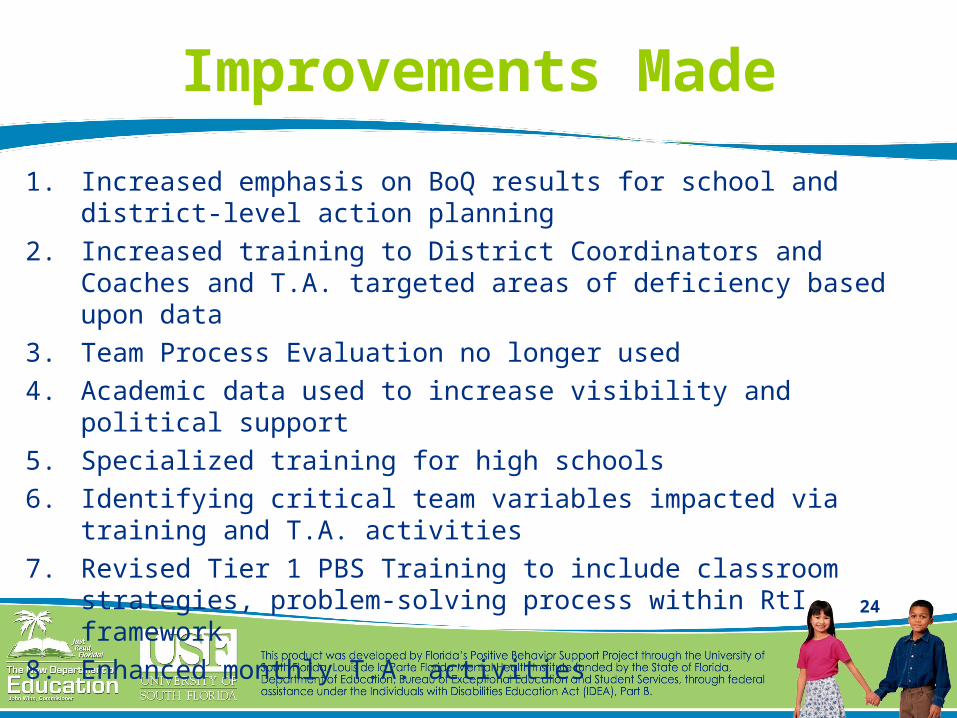
Improvements Made
1. Increased emphasis on BoQ results for school and district-level action planning
2. Increased training to District Coordinators and Coaches and T.A. targeted areas of deficiency based upon data
3. Team Process Evaluation no longer used4. Academic data used to increase visibility and political support5. Specialized training for high schools6. Identifying critical team variables impacted via training and T.A.
activities7. Revised Tier 1 PBS Training to include classroom strategies,
problem-solving process within RtI framework8. Enhanced monthly T.A. activities
25
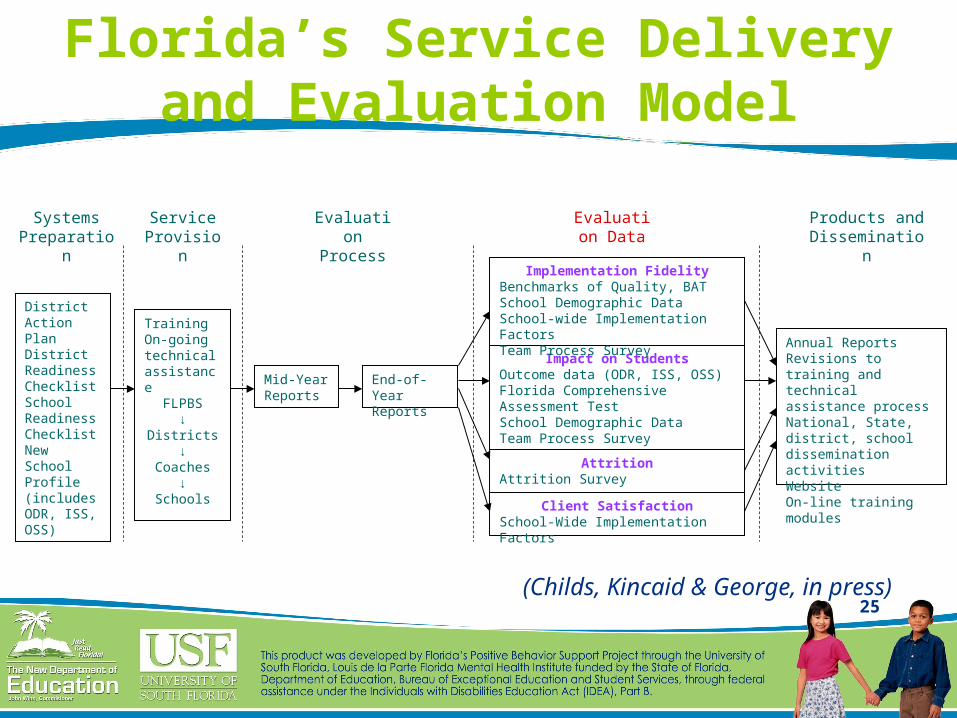
Florida’s Service Deliveryand Evaluation Model
District Action PlanDistrict Readiness ChecklistSchoolReadinessChecklistNew School Profile (includes ODR, ISS, OSS)
TrainingOn-going technical assistance
FLPBS↓
Districts↓
Coaches↓
Schools
Mid-YearReports
End-of-YearReports
Impact on StudentsOutcome data (ODR, ISS, OSS)Florida Comprehensive Assessment TestSchool Demographic DataTeam Process Survey
Implementation FidelityBenchmarks of Quality, BATSchool Demographic DataSchool-wide Implementation FactorsTeam Process Survey
AttritionAttrition Survey
Client SatisfactionSchool-Wide Implementation Factors
Annual ReportsRevisions to training and technical assistance processNational, State, district, school dissemination activitiesWebsiteOn-line training modules
Systems Preparation
Service Provision
Evaluation Process
Evaluation Data
Products and Dissemination
(Childs, Kincaid & George, in press)
26
In Summary…
1. Know what you want to know2. Compare fidelity of implementation with
outcomes – presents a strong case for implementing PBS with fidelity
3. Additional sources of data can assist a state in determining if PBS process (tiers 1-3) is working, but also why or why not it is working
4. Address state, district, school systems issues that may impact implementation success
27
Resources
• Childs, K., Kincaid, D., & George, H.P. (in press). A Model for Statewide Evaluation of a Universal Positive behavior Support Initiative. Journal of Positive Behavior Interventions.
• George, H.P. & Kincaid, D. (2008). Building District-wide Capacity for Positive Behavior Support. Journal of Positive Behavioral Interventions, 10(1), 20-32.
• Cohen, R., Kincaid, D., & Childs, K. (2007). Measuring School-Wide Positive Behavior Support Implementation: Development and Validation of the Benchmarks of Quality (BoQ). Journal of Positive Behavior Interventions.

28
Contact
Heather Peshak George, Ph.D.Co-PI, Co-Director & PBIS Research Partner
Phone: (813) 974-6440
Fax: (813) 974-6115
Email: [email protected]
Website: http://flpbs.fmhi.usf.edu