Embed Size (px)
Citation preview
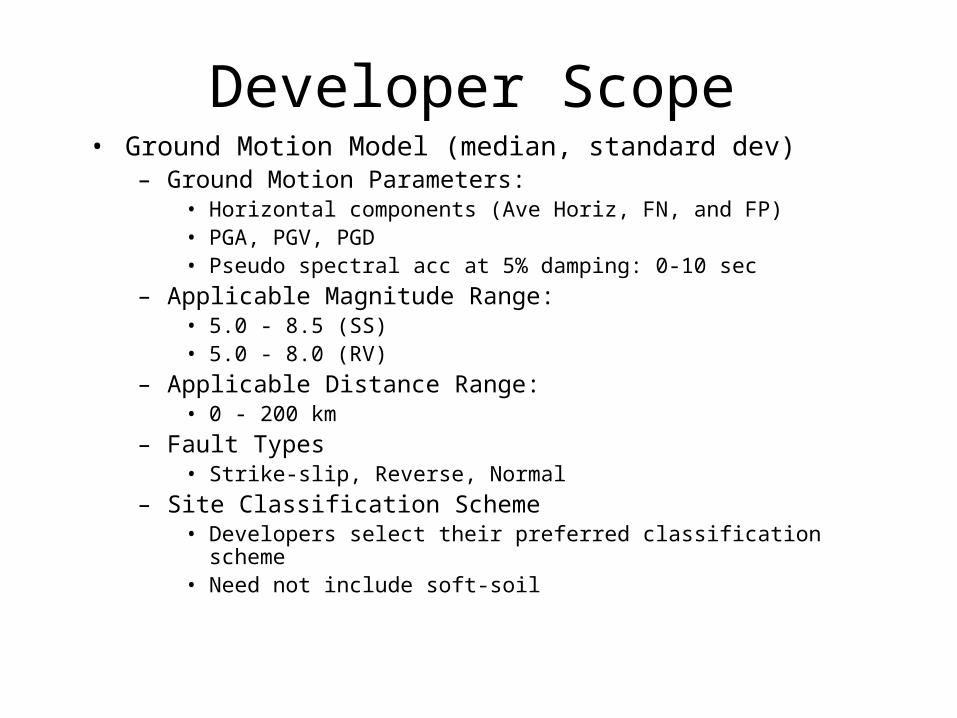
Developer Scope• Ground Motion Model (median, standard dev)
– Ground Motion Parameters:• Horizontal components (Ave Horiz, FN, and FP)• PGA, PGV, PGD• Pseudo spectral acc at 5% damping: 0-10 sec
– Applicable Magnitude Range:• 5.0 - 8.5 (SS)• 5.0 - 8.0 (RV)
– Applicable Distance Range:• 0 - 200 km
– Fault Types• Strike-slip, Reverse, Normal
– Site Classification Scheme• Developers select their preferred classification scheme• Need not include soft-soil

Key Data Set Issues
A&S C&B C&Y
Chi-Chi MS yes yes yes
Chi-Chi AS yes no yes
Koceali & Duzce
yes yes yes
Ducze Lamont Sta
yes no no
Dist Range 0-100 0-60 0-300
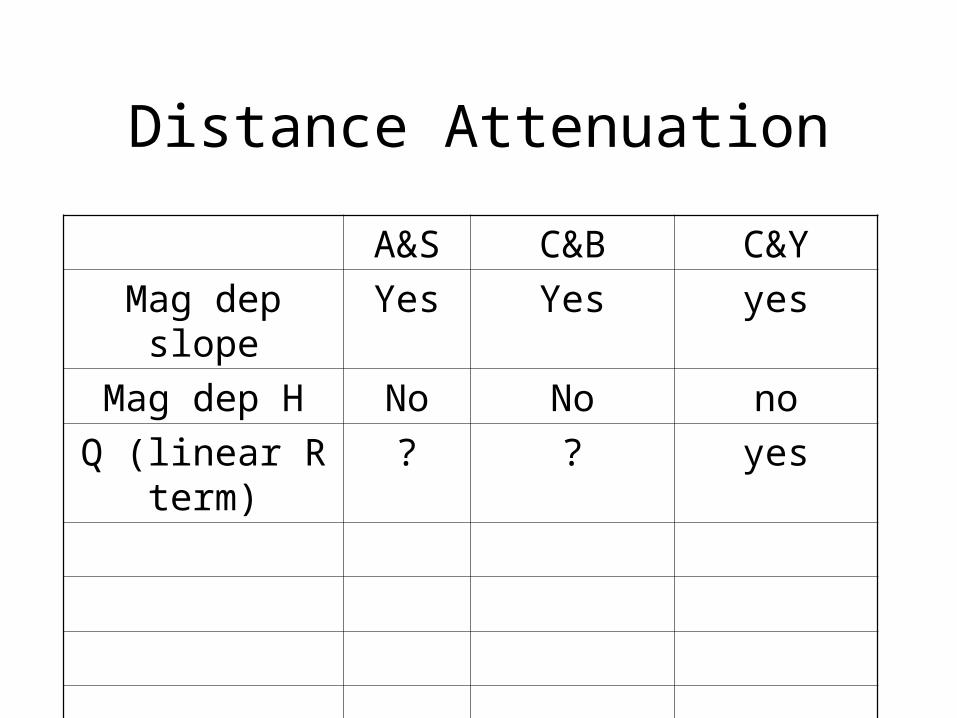
Distance Attenuation
A&S C&B C&Y
Mag dep slope Yes Yes yes
Mag dep H No No no
Q (linear R term) ? ? yes

Site TermsA&S C&B C&Y
Vs30 Yes Yes yes
Soil category No No no
Z1.0 yes
Z1.5 ? Yes yes
Empirical non-linear
No ? yes
Model driven non-linear
Yes ? no
Basin response ? ? ?

Source Parameter Models
A&S C&B C&Y
Oversaturation with mag No Yes (M1) no
Aspect ratio Yes Yes (M2) Yes (M2)
Style-of-faulting Yes Yes yes
Dip No / ? Yes ?
Hypo depth ? ? yes
HW/FW Planned Planned planned
Static stress drop no
Shallow slip No No no

Aleatory Variability
A&S C&B C&Y
Inter-event and intra-
event terms
Yes Yes Yes
Mag dependence
Yes Yes Yes
Distance dependence
? No no

Key Issues
• Oversaturation– Is it due to the aspect ratio, or the magnitude?
• Use of Aspect ratio– Are aspect ratios used in NGA consistent with
aspect ratios currently used in hazard analyses?– Correlation with style-of-faulting
• Dependence on dip– Is this dip effects or a regional effect?
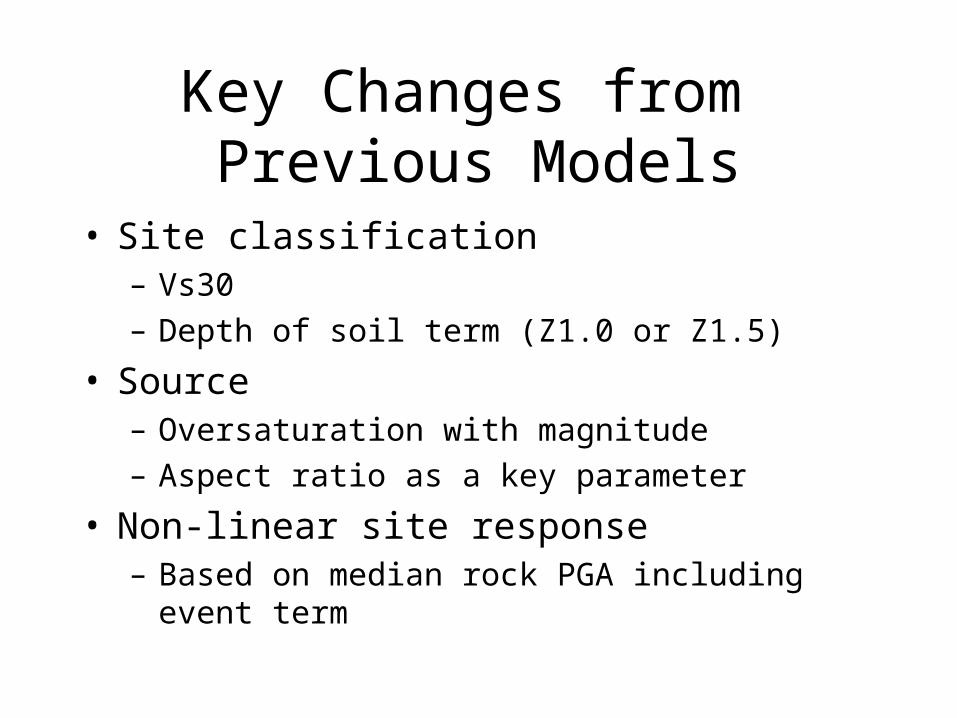
Key Changes from Previous Models
• Site classification– Vs30
– Depth of soil term (Z1.0 or Z1.5)
• Source– Oversaturation with magnitude
– Aspect ratio as a key parameter
• Non-linear site response– Based on median rock PGA including event term
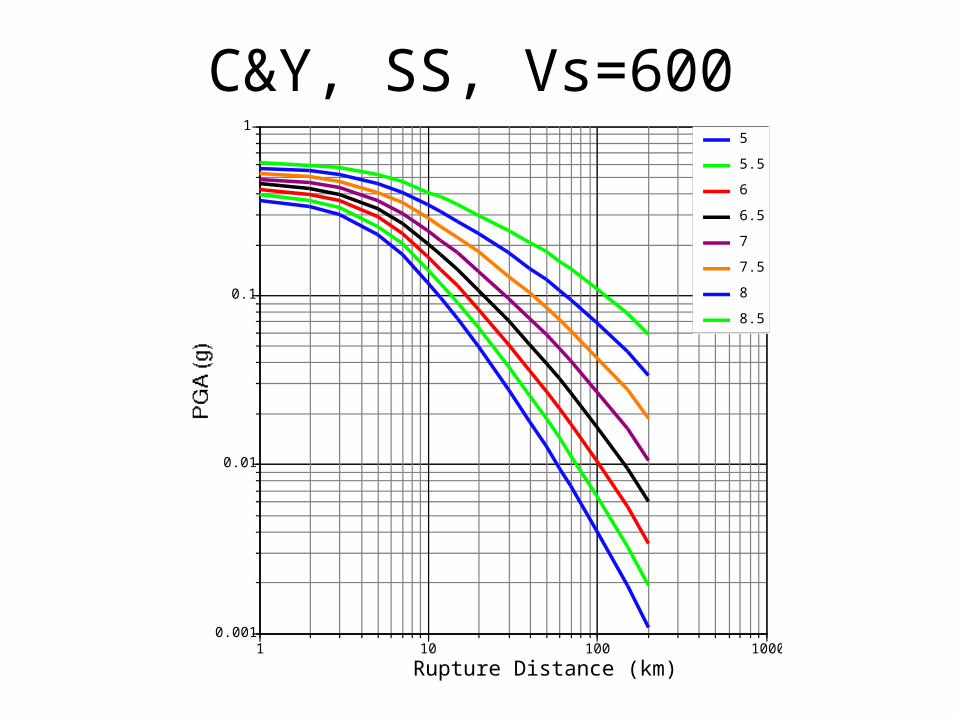
C&Y, SS, Vs=600
0.001
0.01
0.1
1
1 10 100 1000
Rupture Distance (km)
5
5.5
6
6.5
7
7.5
8
8.5

C&B (M1) SS, Vs=600
0.001
0.01
0.1
1
1 10 100 1000
Rupture Distance (km)
5
5.5
6
6.5
7
7.5
8
8.5
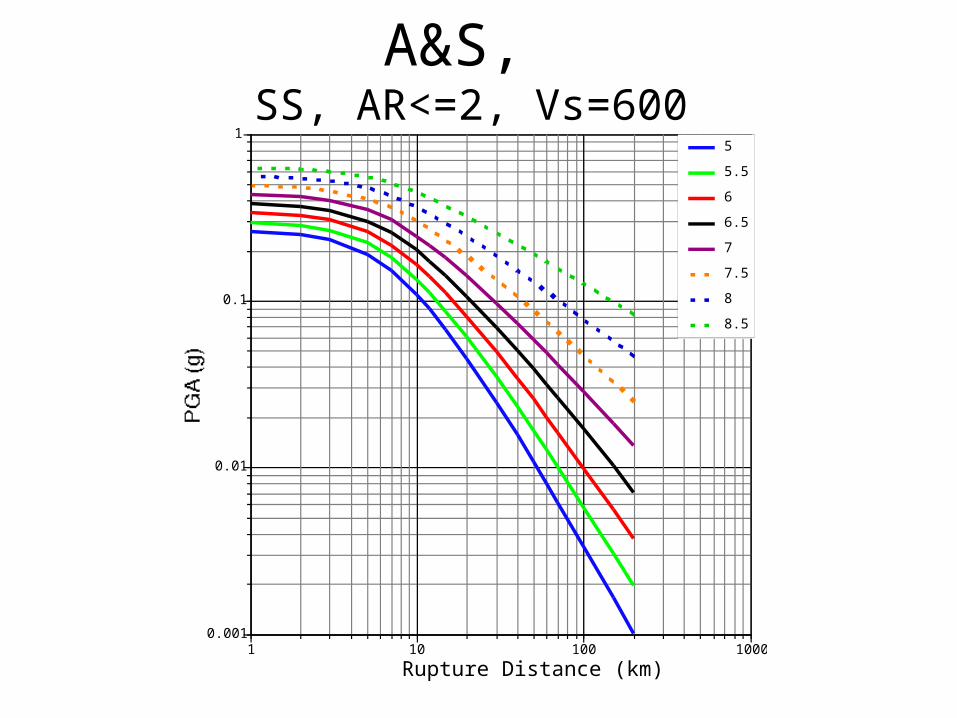
A&S, SS, AR<=2, Vs=600
0.001
0.01
0.1
1
1 10 100 1000
Rupture Distance (km)
5
5.5
6
6.5
7
7.5
8
8.5
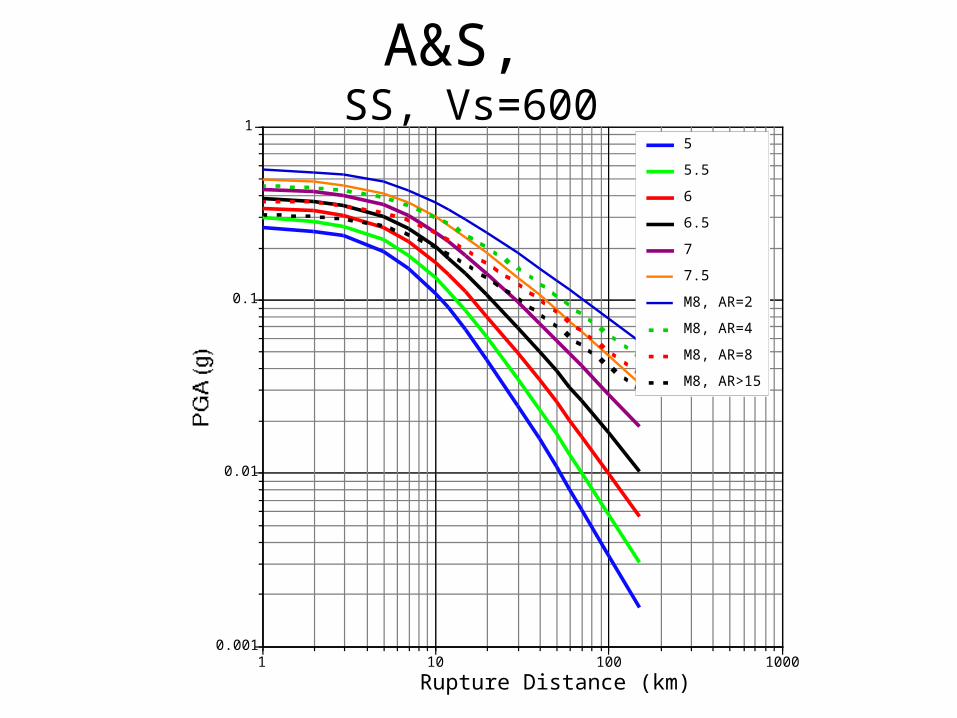
A&S, SS, Vs=600
0.001
0.01
0.1
1
1 10 100 1000
Rupture Distance (km)
5
5.5
6
6.5
7
7.5
M8, AR=2
M8, AR=4
M8, AR=8
M8, AR>15
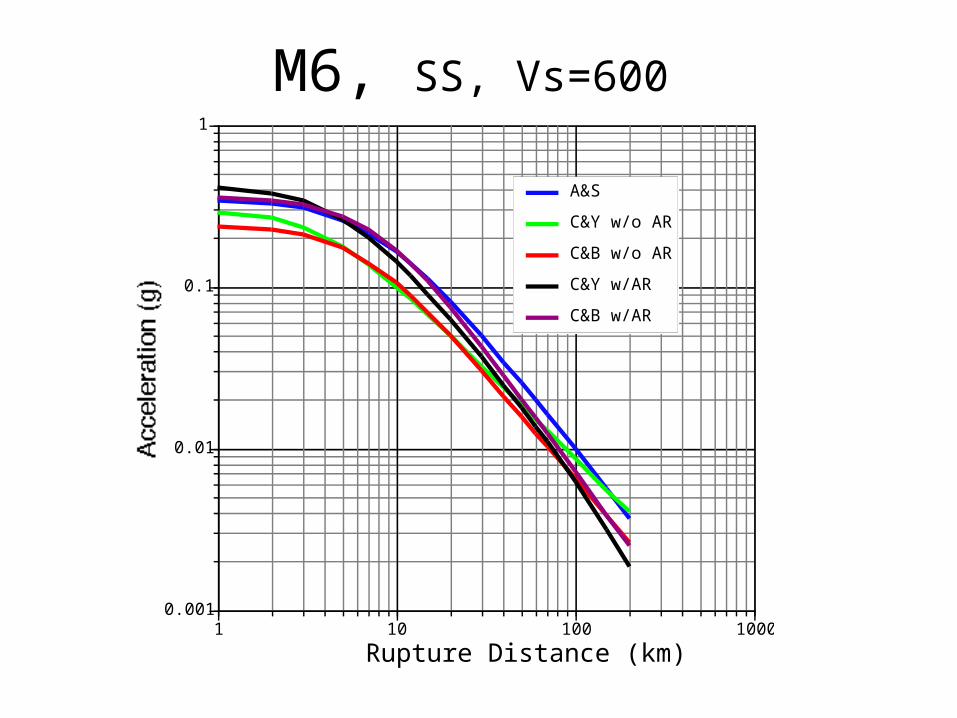
M6, SS, Vs=600
0.001
0.01
0.1
1
1 10 100 1000
Rupture Distance (km)
A&S
C&Y w/o AR
C&B w/o AR
C&Y w/AR
C&B w/AR
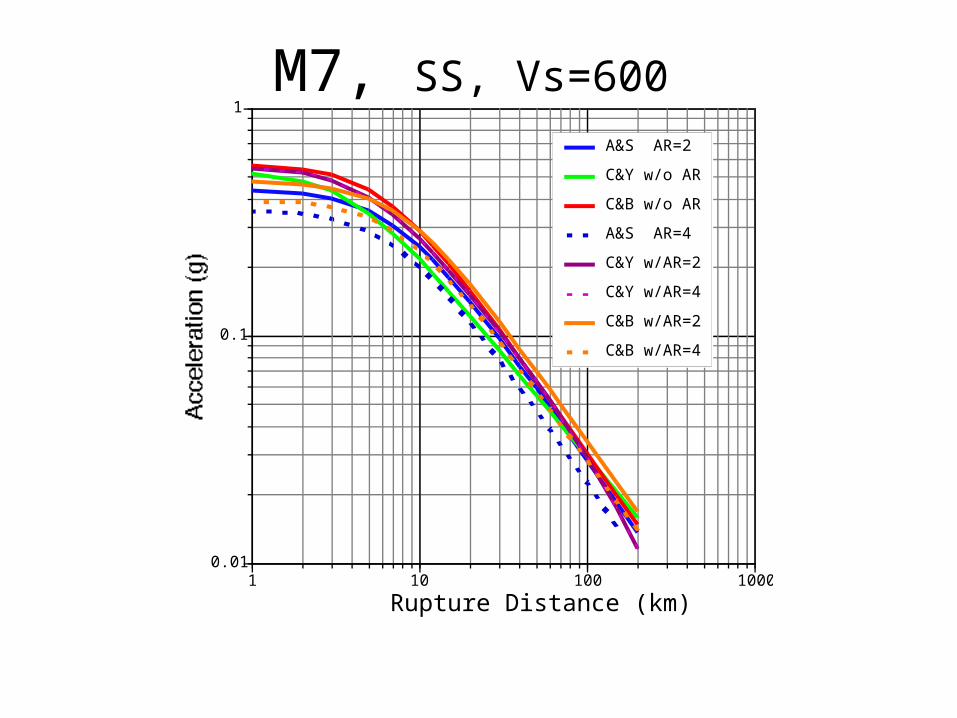
M7, SS, Vs=600
0.01
0.1
1
1 10 100 1000
Rupture Distance (km)
A&S AR=2
C&Y w/o AR
C&B w/o AR
A&S AR=4
C&Y w/AR=2
C&Y w/AR=4
C&B w/AR=2
C&B w/AR=4

M8, SS, Vs=600
0.01
0.1
1
1 10 100 1000
Rupture Distance (km)
A&S AR=8
C&Y w/o AR
C&B w/o AR
A&S AR=16
C&Y w/AR=8
C&Y w/AR=16
C&B w/AR=8
C&B w/AR=16

T=1 sec
Vs=600C&Y w/o AR
0.0001
0.001
0.01
0.1
1
1 10 100 1000
Rupture Distance (km)
5
5.5
6
6.5
7
7.5
8
8.5

T=1 sec
SSVs=600C&B w/o AR
0.0001
0.001
0.01
0.1
1
1 10 100 1000
Rupture Distance (km)
5
5.5
6
6.5
7
7.5
8
8.5
T=1 sec
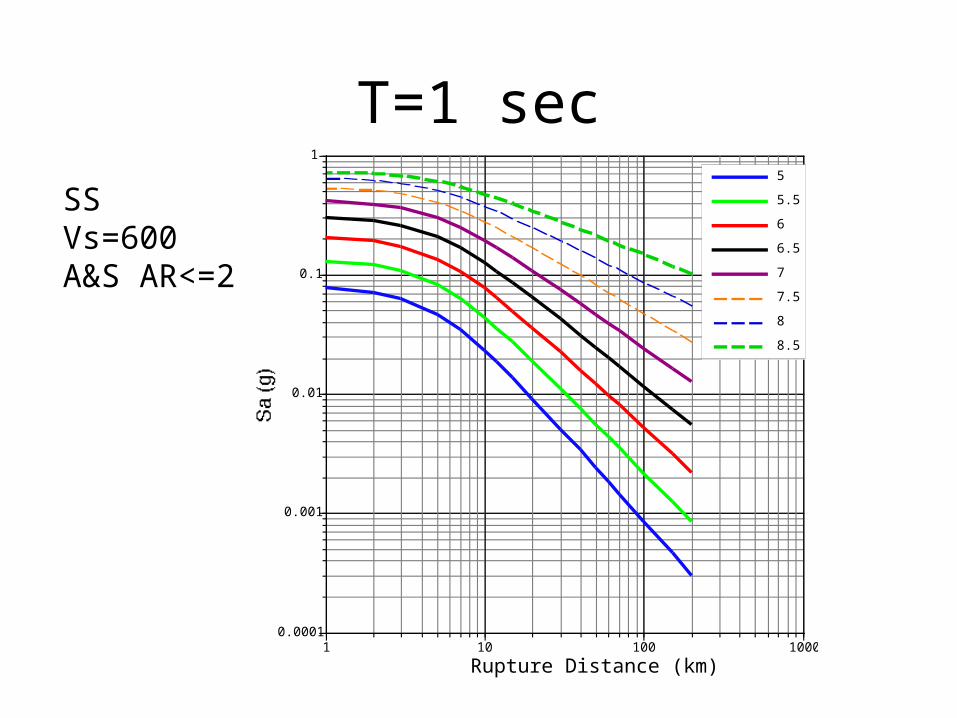
SSVs=600A&S AR<=2
0.0001
0.001
0.01
0.1
1
1 10 100 1000
Rupture Distance (km)
5
5.5
6
6.5
7
7.5
8
8.5

T=1 sec
SSVs=600A&S
0.0001
0.001
0.01
0.1
1
1 10 100 1000
Rupture Distance (km)
5
5.5
6
6.5
7
7.5
M8 AS=2
M8 AS=4
M8 AS=8
M8 AS=16
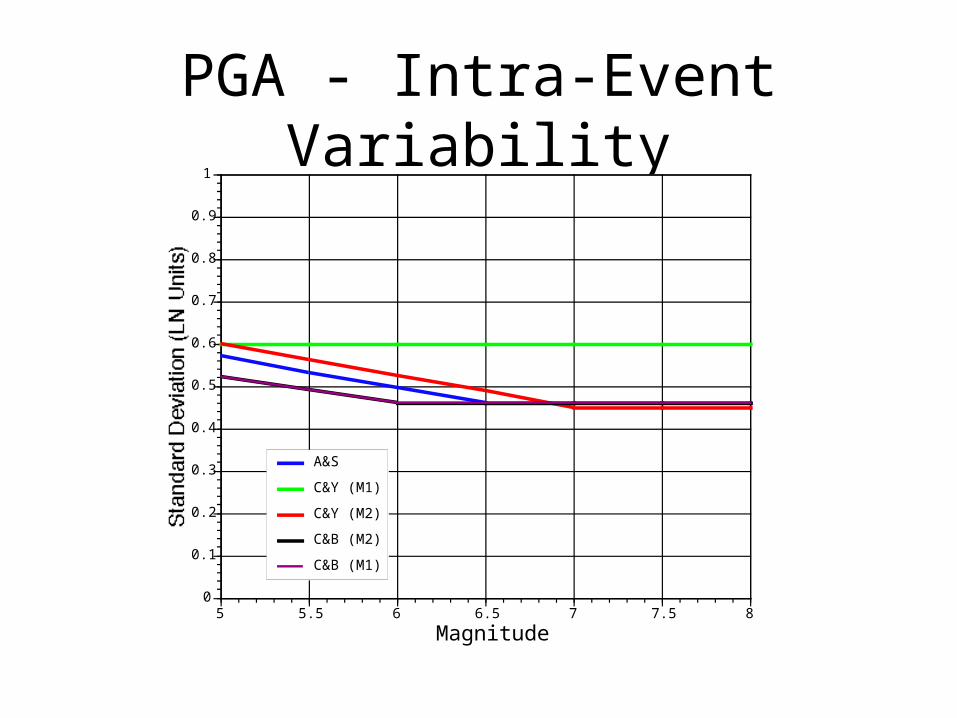
PGA - Intra-Event Variability
0
0.1
0.2
0.3
0.4
0.5
0.6
0.7
0.8
0.9
1
5 5.5 6 6.5 7 7.5 8
Magnitude
A&S
C&Y (M1)
C&Y (M2)
C&B (M2)
C&B (M1)
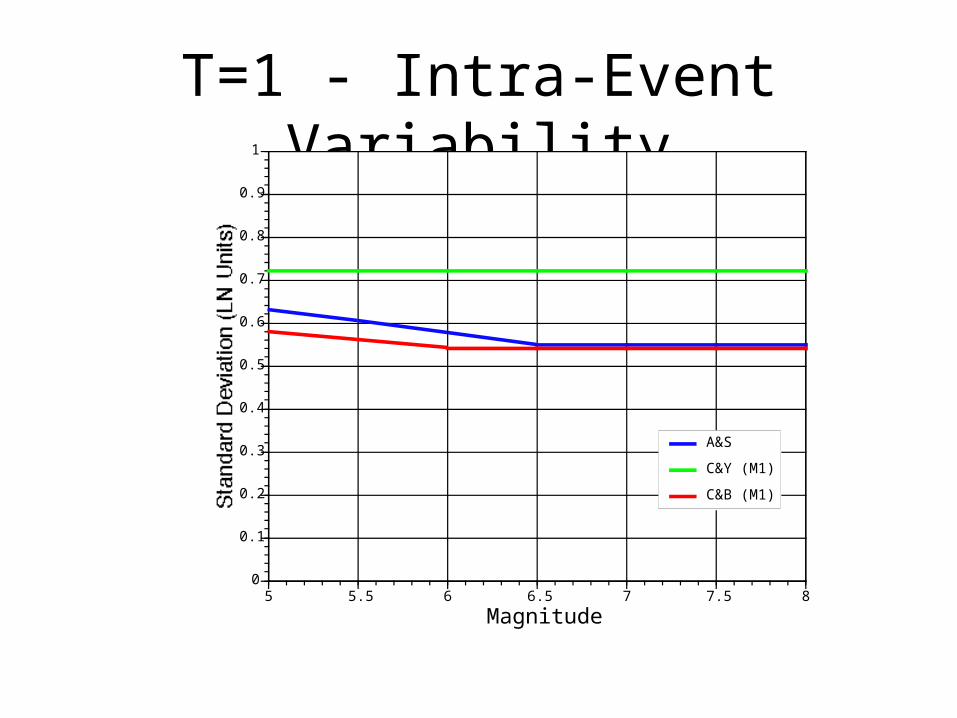
T=1 - Intra-Event Variability
0
0.1
0.2
0.3
0.4
0.5
0.6
0.7
0.8
0.9
1
5 5.5 6 6.5 7 7.5 8
Magnitude
A&S
C&Y (M1)
C&B (M1)
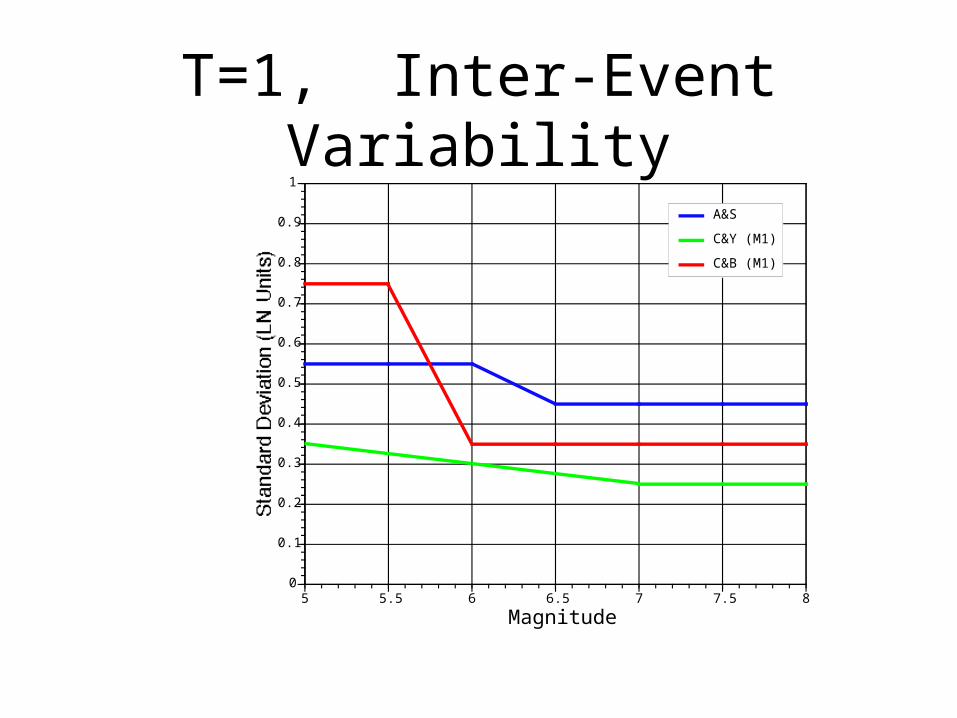
T=1, Inter-Event Variability
0
0.1
0.2
0.3
0.4
0.5
0.6
0.7
0.8
0.9
1
5 5.5 6 6.5 7 7.5 8
Magnitude
A&S
C&Y (M1)
C&B (M1)
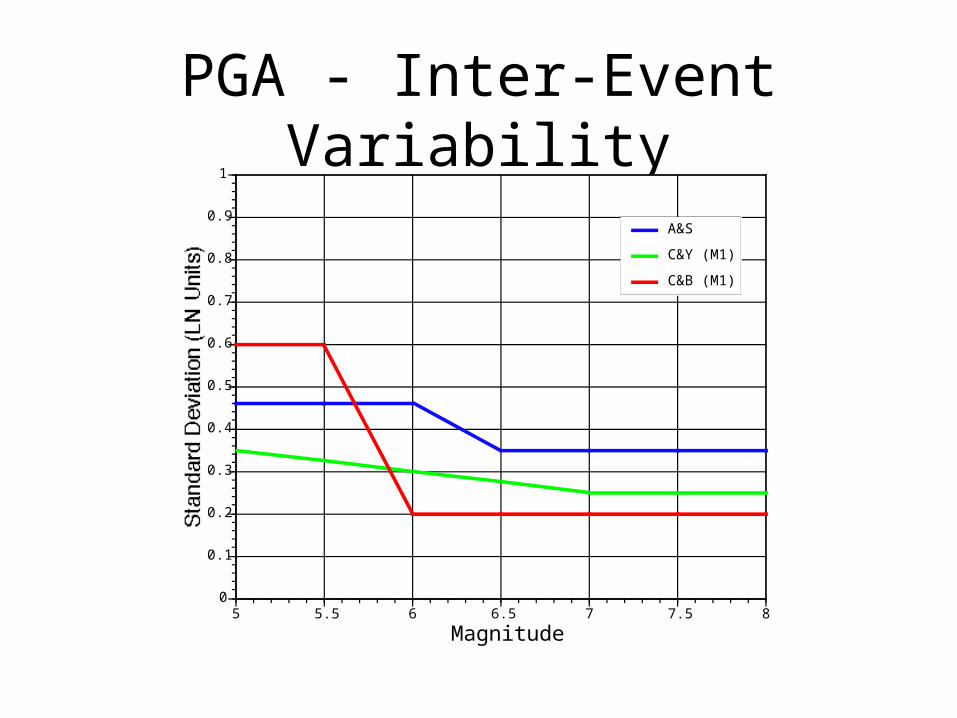
PGA - Inter-Event Variability
0
0.1
0.2
0.3
0.4
0.5
0.6
0.7
0.8
0.9
1
5 5.5 6 6.5 7 7.5 8
Magnitude
A&S
C&Y (M1)
C&B (M1)

PGA Hazard
Vs=600
Site near HaywardFault (2 km)
0.0001
0.001
0.01
0.1
0 0.2 0.4 0.6 0.8 1 1.2 1.4 1.6 1.8 2
PGA (g)
A&S (2004)
C&Y (2004) w/o AR
C&Y (2004) w/AR
C&B (2004) w/o AR
C&B (2004) w/AR
BJF97
A&S97
C&B (2003) Generic Rock
Sadigh et al (1997)

T=1 sec Hazard
Vs=600
Site near HaywardFault (2 km)
0.0001
0.001
0.01
0.1
0 0.2 0.4 0.6 0.8 1 1.2 1.4 1.6 1.8 2
PGA (g)
A&S (2004)
C&Y (2004) w/AR
C&Y (2004) w/o AR
C&B (2004) w/AR
C&B (2004) w/o AR
BJF97
A&S97
C&B (2003) Generic Rock
Sadigh et al (1997)

PGA Hazard
Vs=600
Site near San AndreasFault (2 km)
0.0001
0.001
0.01
0.1
0 0.2 0.4 0.6 0.8 1 1.2 1.4 1.6 1.8 2
PGA (g)
A&S (2004)
C&Y (2004) w/AR
C&Y (2004) w/o AR
C&B (2004) w/AR
C&B (2004) w/o AR
BJF97
A&S97
C&B (2003) Generic Rock
Sadigh et al (1997)

T=1 Sec, Hazard
Vs=600
Site near San AndreasFault (2 km)
0.0001
0.001
0.01
0.1
0 0.2 0.4 0.6 0.8 1 1.2 1.4 1.6 1.8 2
PGA (g)
A&S (2004)
C&Y (2004) w/AR
C&Y (2004) w/o AR
C&B (2004) w/AR
C&B (2004) w/o AR
BJF97
A&S97
C&B (2003) Generic Rock
Sadigh et al (1997)

Site Amplification for PGA(EPRI model)
0
0.5
1
1.5
2
2.5
3
0.01 0.1 1 10
PGA for Vs=1100 m/s (g)
200 m/s
300 m/s
400 m/s
500 m/s
700 m/s
900 m/s
1100 m/s
1500 m/s
2000 m/s

Site Amplification for PGA(Pen Range model)
0
0.5
1
1.5
2
2.5
0.01 0.1 1 10
PGA for Vs=1100 m/s (g)
200 m/s
300 m/s
400 m/s
500 m/s
700 m/s
900 m/s
1100 m/s
1500 m/s
2000 m/s
PEN RANGE

Site Amplification for PGA
0
0.5
1
1.5
2
2.5
3
0.01 0.1 1 10
PGA for Vs=1100 m/s (g)
200 m/s - EPRI
300 m/s - EPRI
700 m/s - EPRI
200 m/s - Pen range
300 m/s - Pen Range
700 m/s - Pen Range
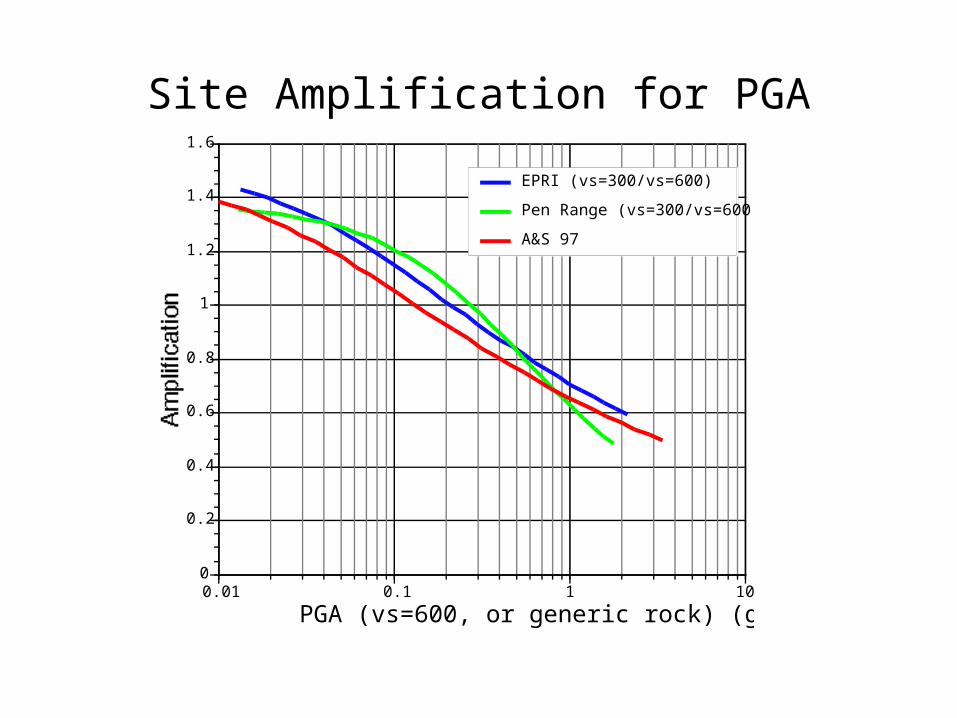
Site Amplification for PGA
0
0.2
0.4
0.6
0.8
1
1.2
1.4
1.6
0.01 0.1 1 10
PGA (vs=600, or generic rock) (g)
EPRI (vs=300/vs=600)
Pen Range (vs=300/vs=600)
A&S 97
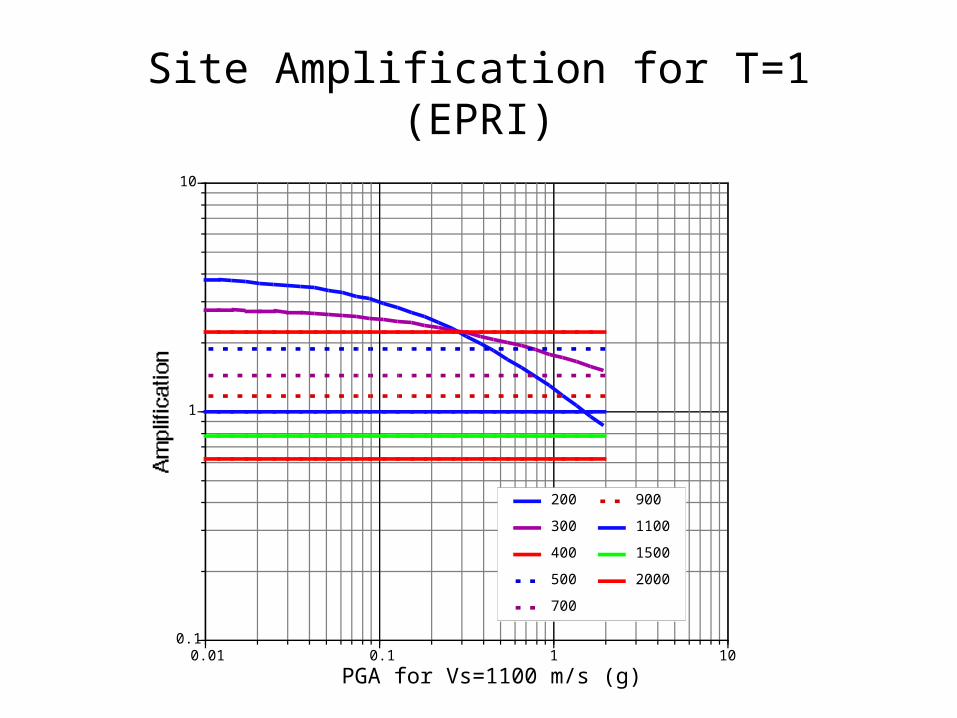
Site Amplification for T=1(EPRI)
0.1
1
10
0.01 0.1 1 10
PGA for Vs=1100 m/s (g)
200
300
400
500
700
900
1100
1500
2000
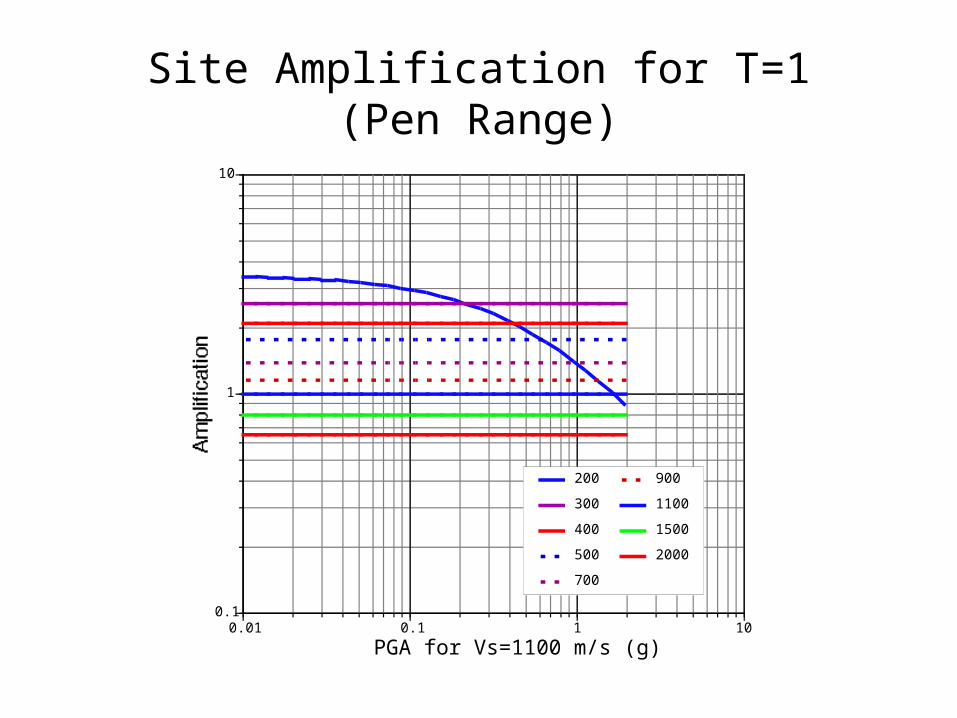
Site Amplification for T=1(Pen Range)
0.1
1
10
0.01 0.1 1 10
PGA for Vs=1100 m/s (g)
200
300
400
500
700
900
1100
1500
2000
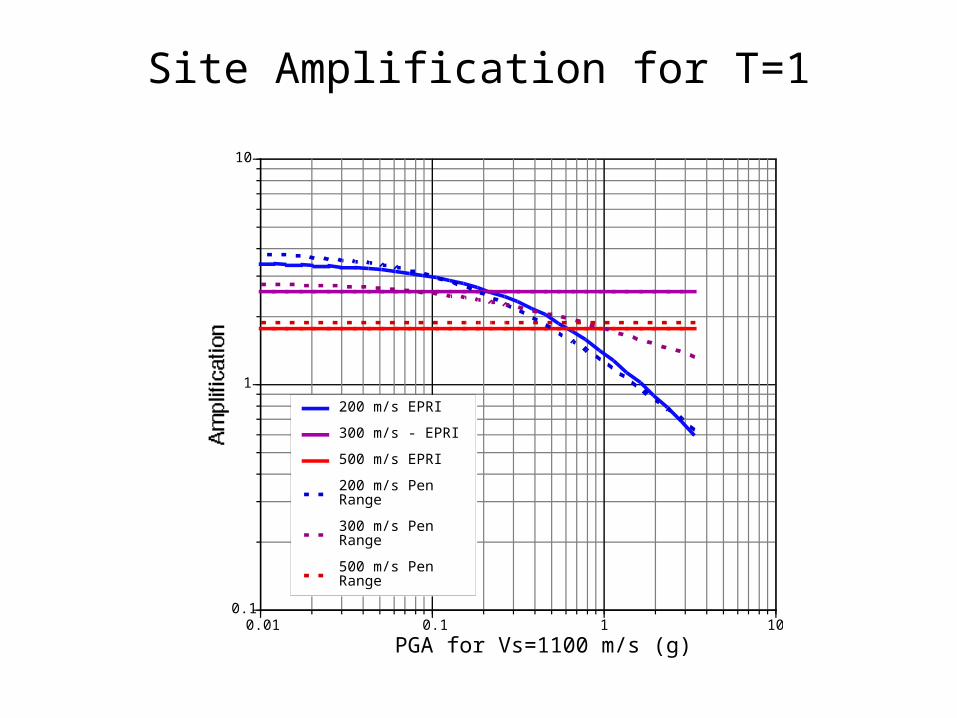
Site Amplification for T=1
0.1
1
10
0.01 0.1 1 10
PGA for Vs=1100 m/s (g)
200 m/s EPRI
300 m/s - EPRI
500 m/s EPRI
200 m/s Pen Range
300 m/s Pen Range
500 m/s Pen Range