Embed Size (px)
Citation preview

MAUSAM, 68, 4 (October 2017), 633-642
551.577.61 (540.27)
(633)
Devastating rainstorm of June-2013 in Uttarakhand
SURINDER KAUR and P. K. GUPTA
India Meteorological Department, New Delhi – 110 003, India
(Received 26 August 2016, Accepted 11 April 2017)
e mail : [email protected]
सार – उत्तiराखंड तराख्त2तपनी त्तpलाख तृ िiत ृ तृखरा ताख़ तररातूस्तं लाीतृ तपन तें त ताखiखत ।ै तउत्तiराखंड तराख्त2तररातउस ृ त सनखसत ृ तराख्त2ोंतें त15-18तासी, 2013त ृ तदौराखीतूखराीतस तपत्त2धिकृतूखराीतर्खा त ईै। तससतiसाखी तर्खा तृखतें ैत्तरतससिला त ।ैत्त2ोंकि इृतसस त ृ तराैतस तू ् ताख़ ,तूस्तं लाी,तैाखराोंतृ तसडखत2खतें ताखीें खलात दतृ तषतििiत ईै। तससतपरधिकत ृ त दौराखीतउत्तiराखंड त राख्त2तररातउस ृ त सनखसत ृ त राख्त2ोंता।स :-त ैें खपलातप्रद श,तैररा2ख खतररातनडाखातें तू तपत्त2धिकृतूखराीतर्खा त( ृत दीतें त24.5तस .ें .तस तपधिकृ)त ृ तसखpतूखराीतर्खा त ृ तैोी तृ तररानो ा तदाा तृ तग। तउत्तiराखंड तृखतपधिकृखडशतूखगत रतै त्तiरात ैें खला2 तषति ्र तें त iखत ।ै त ाख़ तस त ापी त ृ त िला तैखस्ोिलाृतसडरापीखंडत ृ त ूपनतें तालातूड खरा तृराीखतससृखत ृतउनख2त ।ै तैखस्ोिलाृतसडरापीखंडत ृ ताीखी तृ त2ोाीखत रडतड ाखसिी डगत ृ तिला तड ाखसीत्त कें ा तृखत ृलाीतipखताख़ त ृ तड ाखसीतस तसडाडधिकiतें ौिलाृताखीृखररा2ोंतृोत ृिलाiतृराीखतप्रें ईं त ।ै ड जखसीतiसाखीतृखत ृलाीतृराी त ृ त िला तउीतसू तषति ्र ोंत2खतउस ृ त सनखसत ृ तषति ्र ोंताैखाँतूखराीतiसाखी तर्खा तृ तघ ीखतघ i त ।ैतउीृखतवरश्तला ् तकि इृ2खतग2खत ।ै तससतशोकतन्र तें तवर्तiतiतषति ्र तें त ईै।तससतiसाखी तर्खा तररातपन्त2तूखराीतiसाखी तर्खा तृखतउसतषति ्र तें तैखस्किलाृतसडरापीखंडत ृ तड जखसीतiसाखीतृखतनरराृलाीतृराी त ृ तउद्द श्त2तस तवरश्तला ् तकि इृ2खतग2खत ।ै तासीत2013तें त ईै।तससतiसाखी तर्खा तृ तiईलाीखतसिiैखसतें तससस तनैला त28-30तिसiम्तारा,त1924तें तलाैंस खउीतें त ईै।तूखराीतiसाखी तर्खा तस तृ तग।त ।ै तसीृ तनरा्तनरातiईलाीखतस त2ैतनiखतपलाखतकि इृतासीत2013तें त ईै।तiसाखी तर्खा तृ तें ख्र खतिसiम्तारात1924तें तलाैंस खउीतें त ईै।तर्खा तस त्त2खदखतp ताोत1त दीतृ तपरधिकतें त5000तरगा तकि इृ.ें .तें तp तााकि इृतDADत ृ त ृलाीत ृ तपीईसखराततिसiम्तारात1924तें तदोतररातi ीत दीोंतृ तपरधिकतें त ईै।तiसाखी तर्खा तृ तें ख्र खतासीत2013तृ तiसाखी तर्खा तस तृखा तपधिकृतp तररात2ैत20,000तरगा तकि इृ.ें .त ृ तषति ्र तें तp त
ABSTRACT. The state of Uttarakhand is prone to floods and landslides due to its topographic location. The state
of Uttarakhand and neighbouring states experienced heavy to very heavy rainfall during 15-18 June, 2013. The analysis of this rainstorm is important because it caused severe floods, landslides, loss of thousands of lives, property etc. During
this period, many stations reported very heavy rainfall with a few extremely heavy rainfall (more than 24.5 cm in a day)
in Uttarakhand and also in the neighbouring states of Himachal Pradesh, Haryana and Punjab. Most part of the state of Uttarakhand lies in the Greater Himalayan region. For safety from floods, one of the methods is to store water in
hydraulic structures. For planning and designing of hydraulic structures, the estimation of design storm is the primary and
the basic input for the computation of design flood. In the estimation of design storm, all the heavy rainstorms occurred over or near the area have to be analysed. In this paper, this rainstorm and other heavy rainstorms over a wide area has
been analysed for the purpose of computation of Design storm estimates of hydraulic structures in that area. The
rainstorm of June 2013 is compared with the earlier historical heaviest rainstorm of 28th to 30th September, 1924 at Lansdowne and it is observed that the rainstorm of June 2013 has contributed more rainfall than the rainstorm of
September 1924 rainstorm for an area up to 5000 km2 for 1-day duration, while the DAD estimates for two day and three
duration of rainstorm of September 1924 are higher than the rainstorm of June 2013 for area up to 20,000 km2.
Key words – Rainstorm, Heavy rainfall, Uttarakhand, PMP, GIS.
1. Introduction
The state of Uttarakhand lies in the northern part of
India and most part of the state lies in the Greater
Himalayan region. The region is renowned for its natural
beauty, as well as pilgrimage sites which dot the upper
reaches of the hills. Millions of pilgrims visited the
famous worship places namely, Kedarnath, Badrinath,
Gangotri, Yamunotri and Hemkund Sahib every year.
Uttarakhand has a total area of 53,484 km², 93% of area is
covered by mountains and 64% is covered by forest. It is
geographically fragile and highly eco-sensitive and hence
prone to natural disasters including floods and landslides
in almost every monsoon season. Two largest rivers,
Ganges and Yamuna, originate in the glaciers of
Uttarakhand, where they are fed by myriad lakes, glacial
634 MAUSAM, 68, 4 (October 2017)
TABLE 1
Station wise 1-day highest recorded Rainfall along with date (upto 2012)
S.
No. Station Name District Name
1-Day highest
recorded rainfall (mm)
Date S.
No. Station Name District Name
1-Day highest
recorded rainfall (mm)
Date
1. Almora Almora 223 29 Sep 1924 30. P. Nagar A Nainital 193 19 Aug 2003
2. Chaubattia Almora 120 15 Sep 1972 31. Ramnagar Nainital 291 14 Oct 1985
3. Ranikhet Almora 351 16 Jun 1970 32. Rudrapur Nainital 307 25 Jul 1907
4. Badrinath Chamoli 121 4 Jul 1958 33. Bironkhol PauriGarhwal 255 29 Sep 1924
5. Chamoli Chamoli 120 11 Aug 1983 34. Kotdwara PauriGarhwal 274 23 Aug 1922
6. Ghangaria Chamoli 136 25 Dec 1985 35. Landsdown PauriGarhwal 323 29 Sep 1924
7. Joshimath Chamoli 273 21 Jul 1970 36. Pauri PauriGarhwal 309 5 Aug 1982
8. Karnaprayag Chamoli 250 10 May 1971 37. Srinagar PauriGarhwal 135 29 Sep 1924
9. Lokapa Chamoli 158 23 Mar 1967 38. Deoprayag Tehri-Garhwal 216 9 Oct 1956
10. Okhimath Chamoli 208 8 Aug 1925 39. Dhanolti Tehri-Garhwal 188 17 Jul 1972
11. Rudraprayag Chamoli 300 20 May 2005 40. Keertinagar Tehri-Garhwal 311 31 May 1971
12. Tapoban Chamoli 191 27 Jul 1952 41. Mukhim Tehri-Garhwal 450 5 Sep 1995
13. Bhogpur Dehra Dun 307 17 Aug 1921 42. Narendranagar Tehri-Garhwal 272 31 Jul 1955
14. Dehra Dun Dehra Dun 487 25 Jul 1966 43. Tehri Tehri-Garhwal 195 12 Dec 1957
15. Mussoorie Dehra Dun 317 5 Aug 1964 44. Tehri-Garhwal Tehri-Garhwal 151 9 Oct 1956
16. Hardwar Hardwar 356 13 Aug 1910 45. Barkote Uttar-Kashi 152 25 Sep 1988
17. Roorkee Hardwar 258 15 Sep 1957 46. Bhatwari Uttar-Kashi 300 15 Jul 1985
18. Bazpur Nainital 299 21 Jul 1954 47. Dunda Uttar-Kashi 150 14 Aug 1982
19. Gadarpur Nainital 274 5 Jul 1950 48. Maneri(G) Uttar-Kashi 350 22 Jan 1985
20. Haldwani Nainital 413 11 Jul 1970 49. Naitwar Uttar-Kashi 210 10 Feb 1986
21. Kaladhungi Nainital 413 10 Jul 1970 50. Purola Uttar-Kashi 127 17 Oct 1998
22. Kashipur Nainital 315 2 Oct 1954 51. Uttar Kashi Uttar-Kashi 150 20 Aug 1988
23. Kathgodam Nainital 283 12 Jul 1949 52. Ambari Dehra Dun 318 2 Aug 1907
24. Khatima Nainital 406 15 Sep 1972 53. Chakrata Kalsi Dehra Dun 229 4 Feb 1926
25. Kilpuri Nainital 285 19 Jun 1916 54. Dakpathar Dehra Dun 485 20 May 1986
26. Mukteshwar Nainital 255 18 Sep 1914 55. Haripur Dehra Dun 265 3 Aug 2001
27. Nagla Nainital 326 20 Sep 1922 56. Koti Dehra Dun 215 20 Jul 1982
28. Nainital Nainital 399 24 Aug 1927 57. Tiuni Dehra Dun 122 27 Jun 2001
29. Pantnagar Nainital 203 5 Jul 1988 58. Rajgarhi Uttar-Kashi 370 28 May 1971
melts and streams. In the monsoon season 2013, there was
an exceptional disaster occurred in Uttarakhand associated
with widespread heavy rainfall. The description of this
event is mentioned in the Monsoon report 2013 of IMD
(2014). The onset of monsoon in the state was relatively
early, resulting in heavy to very heavy rainfall in and
around the state from 15th
to 18th
June 2013. Various
factors, namely prolonged and wide spread heavy rains,
high melting rate of glaciers during the period and snow
fall prior to rainfall in the region had resulted in
abnormally high discharge in all major rivers in the state.
Heavy rainfall events are not rare in this region but during
this period devastating floods were occurred which
caused thousands of deaths and destruction to property. In
KAUR and GUPTA : DEVASTATING RAINSTORM OF JUNE-2013 IN UTTARAKHAND 635
Fig. 1. 1-day highest rainfall (mm) of stations in Uttarakhand
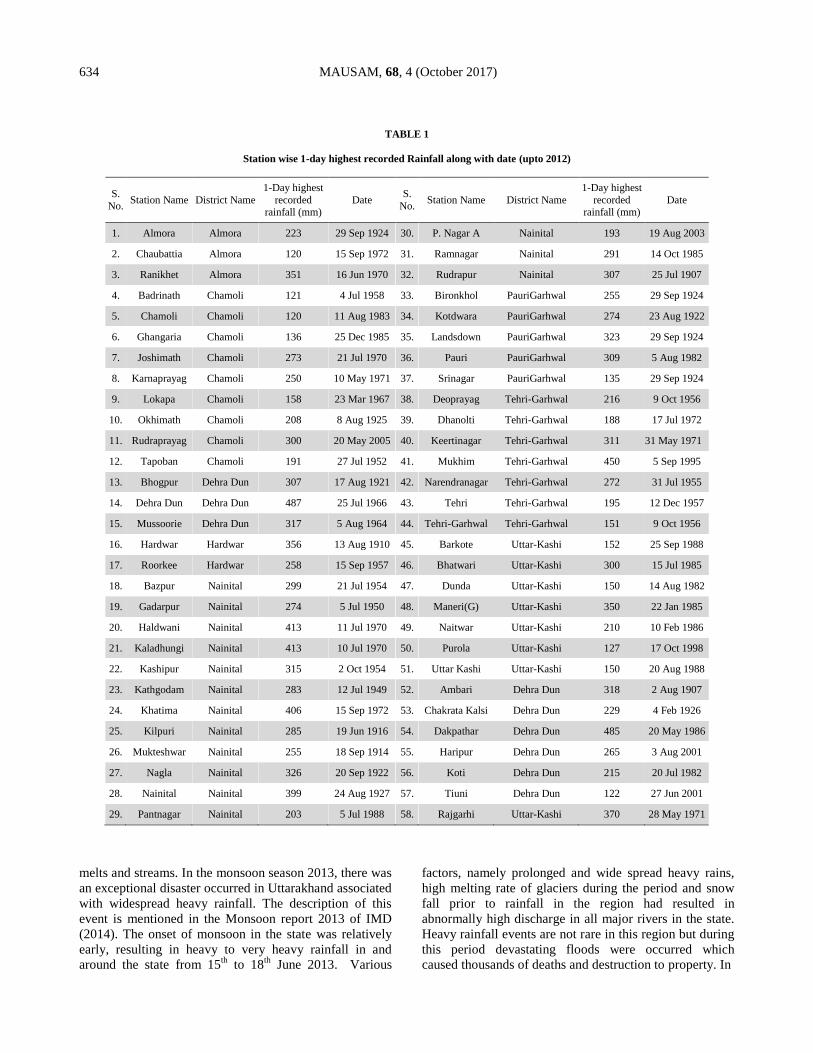
Fig. 2. Synoptic charts for 14th & 15th June, 2013
addition to rainfall, the local anthropogenic factors like
deforestation, slope cutting, construction in river bank etc.
also contributed in the devastating flood peaks. Such
activities are largely related to extensive and growing
pilgrimage and tourist in the state.
The hydraulic structures like dam etc. also provide
safety against floods. In the June 2013 rainstorm, the
Tehri dam actually observed the flood wave of Bhagirathi
river, a tributary of Ganga, on 16th
June, thereby
mitigating downstream flood damage. For safety from
floods, more structures can be constructed and for the
designing of new hydraulic structures or for reviewing
existing structures, the design storm estimates are required
to compute the contribution of floods from the catchment
areas above that structure to minimise the risk.The design
storm estimates consist of highest rain depth magnitudes
in the form of standard project storms (SPS) and probable
maximum precipitation (PMP) from the analysis of severe
rainstorms, and the time distribution. Dube et al. (2005)
have listed the extreme weather events over India in the
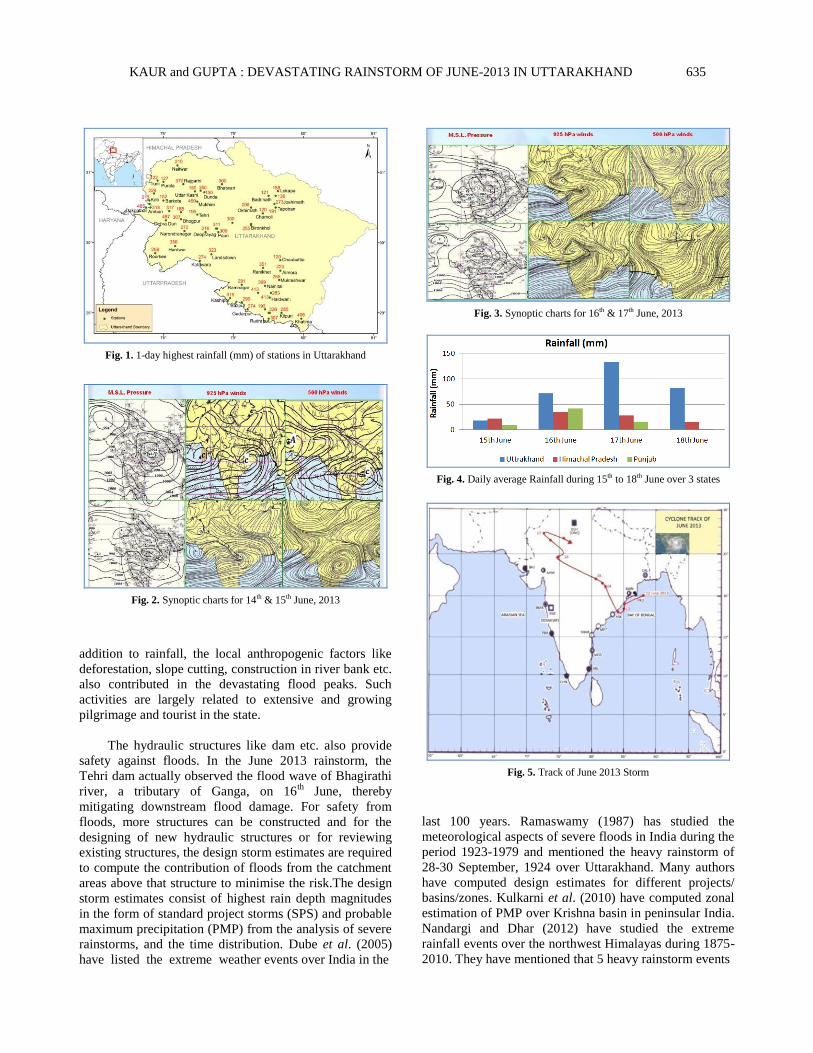
Fig. 3. Synoptic charts for 16th & 17th June, 2013
Fig. 4. Daily average Rainfall during 15th to 18th June over 3 states
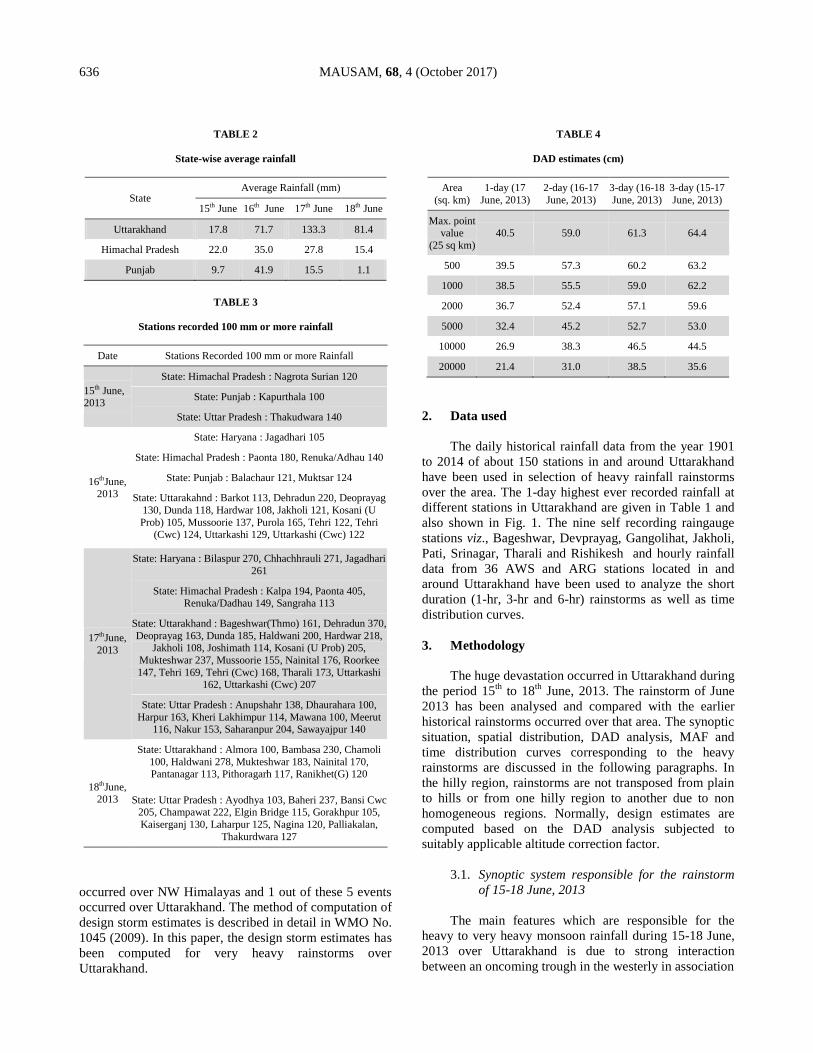
Fig. 5. Track of June 2013 Storm
last 100 years. Ramaswamy (1987) has studied the
meteorological aspects of severe floods in India during the
period 1923-1979 and mentioned the heavy rainstorm of
28-30 September, 1924 over Uttarakhand. Many authors
have computed design estimates for different projects/
basins/zones. Kulkarni et al. (2010) have computed zonal
estimation of PMP over Krishna basin in peninsular India.
Nandargi and Dhar (2012) have studied the extreme
rainfall events over the northwest Himalayas during 1875-
2010. They have mentioned that 5 heavy rainstorm events
636 MAUSAM, 68, 4 (October 2017)
TABLE 2
State-wise average rainfall
State Average Rainfall (mm)
15th June 16th June 17th June 18th June
Uttarakhand 17.8 71.7 133.3 81.4
Himachal Pradesh 22.0 35.0 27.8 15.4
Punjab 9.7 41.9 15.5 1.1
TABLE 3
Stations recorded 100 mm or more rainfall
Date Stations Recorded 100 mm or more Rainfall
15th June, 2013
State: Himachal Pradesh : Nagrota Surian 120
State: Punjab : Kapurthala 100
State: Uttar Pradesh : Thakudwara 140
16thJune, 2013
State: Haryana : Jagadhari 105
State: Himachal Pradesh : Paonta 180, Renuka/Adhau 140
State: Punjab : Balachaur 121, Muktsar 124
State: Uttarakahnd : Barkot 113, Dehradun 220, Deoprayag
130, Dunda 118, Hardwar 108, Jakholi 121, Kosani (U
Prob) 105, Mussoorie 137, Purola 165, Tehri 122, Tehri
(Cwc) 124, Uttarkashi 129, Uttarkashi (Cwc) 122
17thJune,
2013
State: Haryana : Bilaspur 270, Chhachhrauli 271, Jagadhari
261
State: Himachal Pradesh : Kalpa 194, Paonta 405, Renuka/Dadhau 149, Sangraha 113
State: Uttarakhand : Bageshwar(Thmo) 161, Dehradun 370,
Deoprayag 163, Dunda 185, Haldwani 200, Hardwar 218, Jakholi 108, Joshimath 114, Kosani (U Prob) 205,
Mukteshwar 237, Mussoorie 155, Nainital 176, Roorkee
147, Tehri 169, Tehri (Cwc) 168, Tharali 173, Uttarkashi 162, Uttarkashi (Cwc) 207
State: Uttar Pradesh : Anupshahr 138, Dhaurahara 100,
Harpur 163, Kheri Lakhimpur 114, Mawana 100, Meerut 116, Nakur 153, Saharanpur 204, Sawayajpur 140
18thJune, 2013
State: Uttarakhand : Almora 100, Bambasa 230, Chamoli
100, Haldwani 278, Mukteshwar 183, Nainital 170, Pantanagar 113, Pithoragarh 117, Ranikhet(G) 120
State: Uttar Pradesh : Ayodhya 103, Baheri 237, Bansi Cwc 205, Champawat 222, Elgin Bridge 115, Gorakhpur 105,
Kaiserganj 130, Laharpur 125, Nagina 120, Palliakalan,
Thakurdwara 127
occurred over NW Himalayas and 1 out of these 5 events
occurred over Uttarakhand. The method of computation of
design storm estimates is described in detail in WMO No.
1045 (2009). In this paper, the design storm estimates has
been computed for very heavy rainstorms over
Uttarakhand.
TABLE 4
DAD estimates (cm)
Area
(sq. km)
1-day (17
June, 2013)
2-day (16-17
June, 2013)
3-day (16-18
June, 2013)
3-day (15-17
June, 2013)
Max. point value
(25 sq km)
40.5 59.0 61.3 64.4
500 39.5 57.3 60.2 63.2
1000 38.5 55.5 59.0 62.2
2000 36.7 52.4 57.1 59.6
5000 32.4 45.2 52.7 53.0
10000 26.9 38.3 46.5 44.5
20000 21.4 31.0 38.5 35.6
2. Data used
The daily historical rainfall data from the year 1901
to 2014 of about 150 stations in and around Uttarakhand
have been used in selection of heavy rainfall rainstorms
over the area. The 1-day highest ever recorded rainfall at
different stations in Uttarakhand are given in Table 1 and
also shown in Fig. 1. The nine self recording raingauge
stations viz., Bageshwar, Devprayag, Gangolihat, Jakholi,
Pati, Srinagar, Tharali and Rishikesh and hourly rainfall
data from 36 AWS and ARG stations located in and
around Uttarakhand have been used to analyze the short
duration (1-hr, 3-hr and 6-hr) rainstorms as well as time
distribution curves.
3. Methodology
The huge devastation occurred in Uttarakhand during
the period 15th
to 18th
June, 2013. The rainstorm of June
2013 has been analysed and compared with the earlier
historical rainstorms occurred over that area. The synoptic
situation, spatial distribution, DAD analysis, MAF and
time distribution curves corresponding to the heavy
rainstorms are discussed in the following paragraphs. In
the hilly region, rainstorms are not transposed from plain
to hills or from one hilly region to another due to non
homogeneous regions. Normally, design estimates are
computed based on the DAD analysis subjected to
suitably applicable altitude correction factor.
3.1. Synoptic system responsible for the rainstorm
of 15-18 June, 2013
The main features which are responsible for the
heavy to very heavy monsoon rainfall during 15-18 June,
2013 over Uttarakhand is due to strong interaction
between an oncoming trough in the westerly in association
KAUR and GUPTA : DEVASTATING RAINSTORM OF JUNE-2013 IN UTTARAKHAND 637
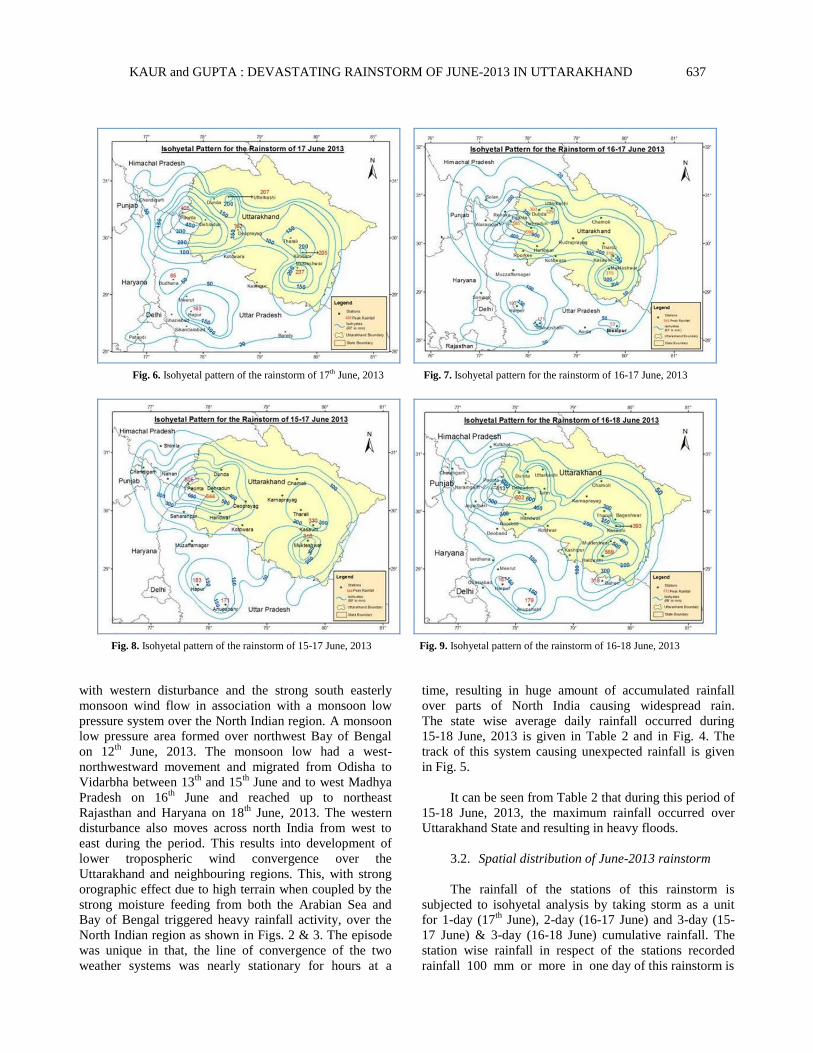
Fig. 6. Isohyetal pattern of the rainstorm of 17th June, 2013 Fig. 7. Isohyetal pattern for the rainstorm of 16-17 June, 2013
Fig. 8. Isohyetal pattern of the rainstorm of 15-17 June, 2013 Fig. 9. Isohyetal pattern of the rainstorm of 16-18 June, 2013
with western disturbance and the strong south easterly
monsoon wind flow in association with a monsoon low
pressure system over the North Indian region. A monsoon
low pressure area formed over northwest Bay of Bengal
on 12th
June, 2013. The monsoon low had a west-
northwestward movement and migrated from Odisha to
Vidarbha between 13th
and 15th
June and to west Madhya
Pradesh on 16th
June and reached up to northeast
Rajasthan and Haryana on 18th
June, 2013. The western
disturbance also moves across north India from west to
east during the period. This results into development of
lower tropospheric wind convergence over the
Uttarakhand and neighbouring regions. This, with strong
orographic effect due to high terrain when coupled by the
strong moisture feeding from both the Arabian Sea and
Bay of Bengal triggered heavy rainfall activity, over the
North Indian region as shown in Figs. 2 & 3. The episode
was unique in that, the line of convergence of the two
weather systems was nearly stationary for hours at a
time, resulting in huge amount of accumulated rainfall
over parts of North India causing widespread rain.
The state wise average daily rainfall occurred during
15-18 June, 2013 is given in Table 2 and in Fig. 4. The
track of this system causing unexpected rainfall is given
in Fig. 5.
It can be seen from Table 2 that during this period of
15-18 June, 2013, the maximum rainfall occurred over
Uttarakhand State and resulting in heavy floods.
3.2. Spatial distribution of June-2013 rainstorm
The rainfall of the stations of this rainstorm is
subjected to isohyetal analysis by taking storm as a unit
for 1-day (17th
June), 2-day (16-17 June) and 3-day (15-
17 June) & 3-day (16-18 June) cumulative rainfall. The
station wise rainfall in respect of the stations recorded
rainfall 100 mm or more in one day of this rainstorm is
638 MAUSAM, 68, 4 (October 2017)
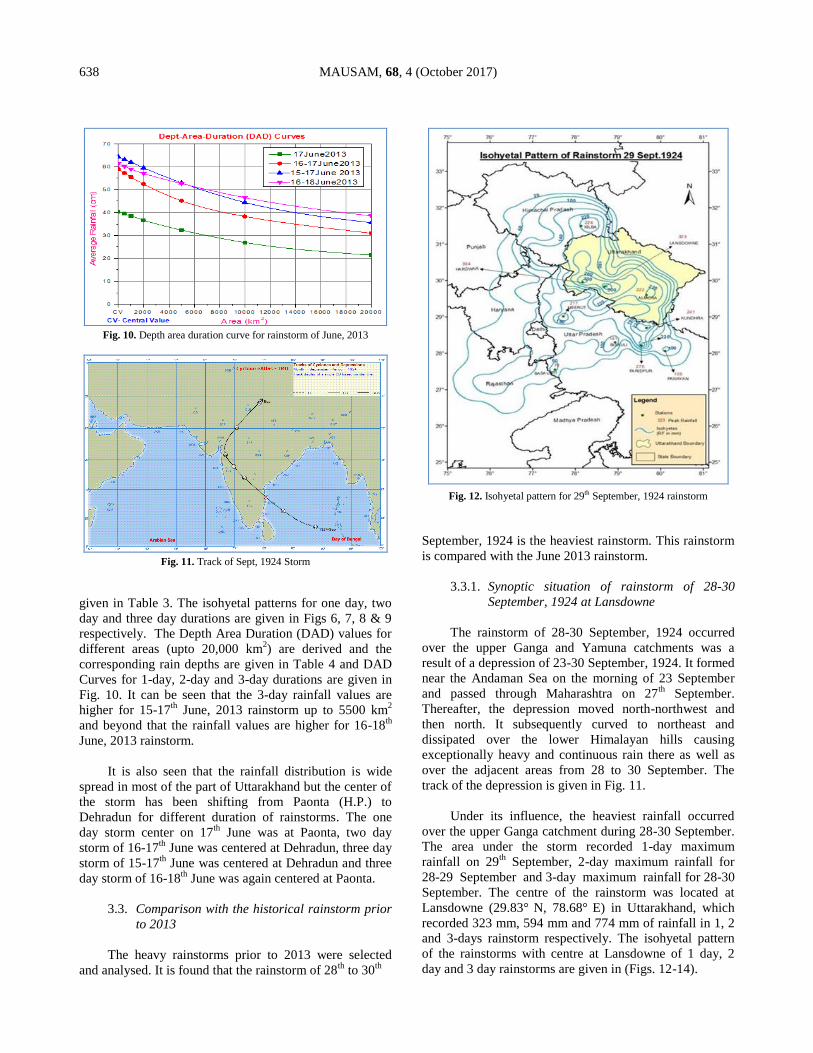
Fig. 10. Depth area duration curve for rainstorm of June, 2013
Fig. 11. Track of Sept, 1924 Storm
given in Table 3. The isohyetal patterns for one day, two
day and three day durations are given in Figs 6, 7, 8 & 9
respectively. The Depth Area Duration (DAD) values for
different areas (upto 20,000 km2) are derived and the
corresponding rain depths are given in Table 4 and DAD
Curves for 1-day, 2-day and 3-day durations are given in
Fig. 10. It can be seen that the 3-day rainfall values are
higher for 15-17th
June, 2013 rainstorm up to 5500 km2
and beyond that the rainfall values are higher for 16-18th
June, 2013 rainstorm.
It is also seen that the rainfall distribution is wide
spread in most of the part of Uttarakhand but the center of
the storm has been shifting from Paonta (H.P.) to
Dehradun for different duration of rainstorms. The one
day storm center on 17th
June was at Paonta, two day
storm of 16-17th
June was centered at Dehradun, three day
storm of 15-17th
June was centered at Dehradun and three
day storm of 16-18th
June was again centered at Paonta.
3.3. Comparison with the historical rainstorm prior
to 2013
The heavy rainstorms prior to 2013 were selected
and analysed. It is found that the rainstorm of 28th
to 30th
Fig. 12. Isohyetal pattern for 29th September, 1924 rainstorm
September, 1924 is the heaviest rainstorm. This rainstorm
is compared with the June 2013 rainstorm.
3.3.1. Synoptic situation of rainstorm of 28-30
September, 1924 at Lansdowne
The rainstorm of 28-30 September, 1924 occurred
over the upper Ganga and Yamuna catchments was a
result of a depression of 23-30 September, 1924. It formed
near the Andaman Sea on the morning of 23 September
and passed through Maharashtra on 27th
September.
Thereafter, the depression moved north-northwest and
then north. It subsequently curved to northeast and
dissipated over the lower Himalayan hills causing
exceptionally heavy and continuous rain there as well as
over the adjacent areas from 28 to 30 September. The
track of the depression is given in Fig. 11.
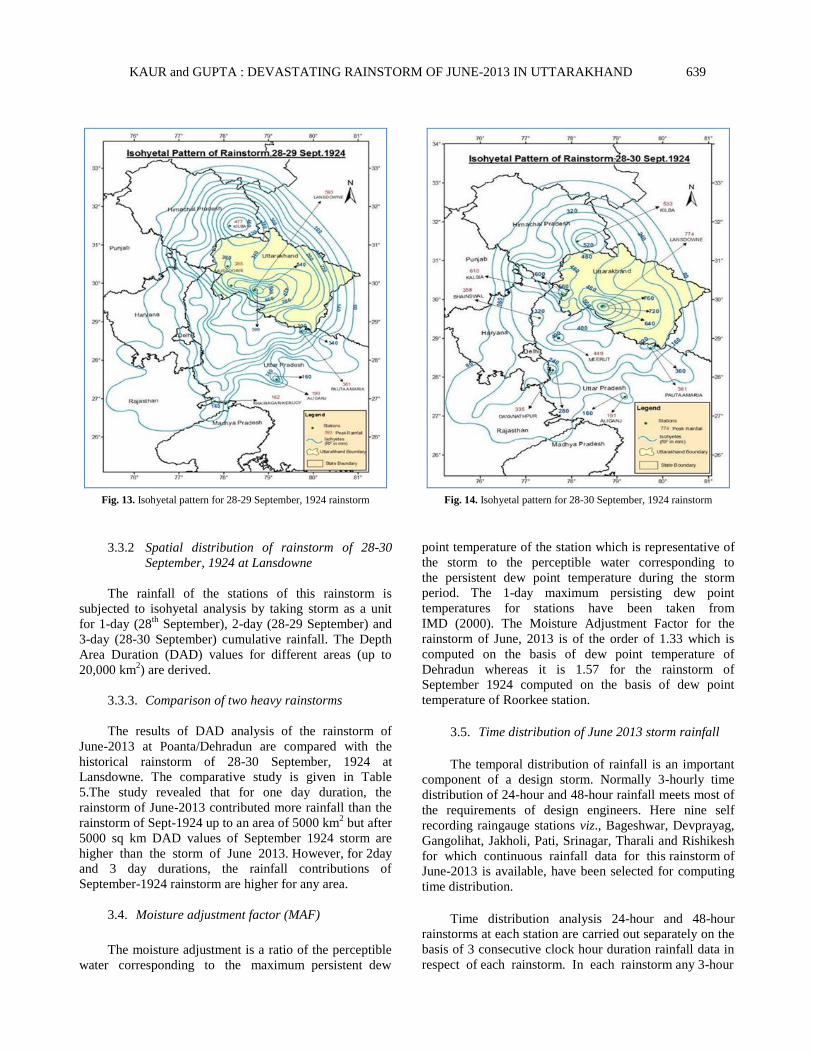
Under its influence, the heaviest rainfall occurred
over the upper Ganga catchment during 28-30 September.
The area under the storm recorded 1-day maximum
rainfall on 29th
September, 2-day maximum rainfall for
28-29 September and 3-day maximum rainfall for 28-30
September. The centre of the rainstorm was located at
Lansdowne (29.83° N, 78.68°
E) in Uttarakhand, which
recorded 323 mm, 594 mm and 774 mm of rainfall in 1, 2
and 3-days rainstorm respectively. The isohyetal pattern
of the rainstorms with centre at Lansdowne of 1 day, 2
day and 3 day rainstorms are given in (Figs. 12-14).
KAUR and GUPTA : DEVASTATING RAINSTORM OF JUNE-2013 IN UTTARAKHAND 639
Fig. 13. Isohyetal pattern for 28-29 September, 1924 rainstorm
3.3.2 Spatial distribution of rainstorm of 28-30
September, 1924 at Lansdowne
The rainfall of the stations of this rainstorm is
subjected to isohyetal analysis by taking storm as a unit
for 1-day (28th
September), 2-day (28-29 September) and
3-day (28-30 September) cumulative rainfall. The Depth
Area Duration (DAD) values for different areas (up to
20,000 km2) are derived.
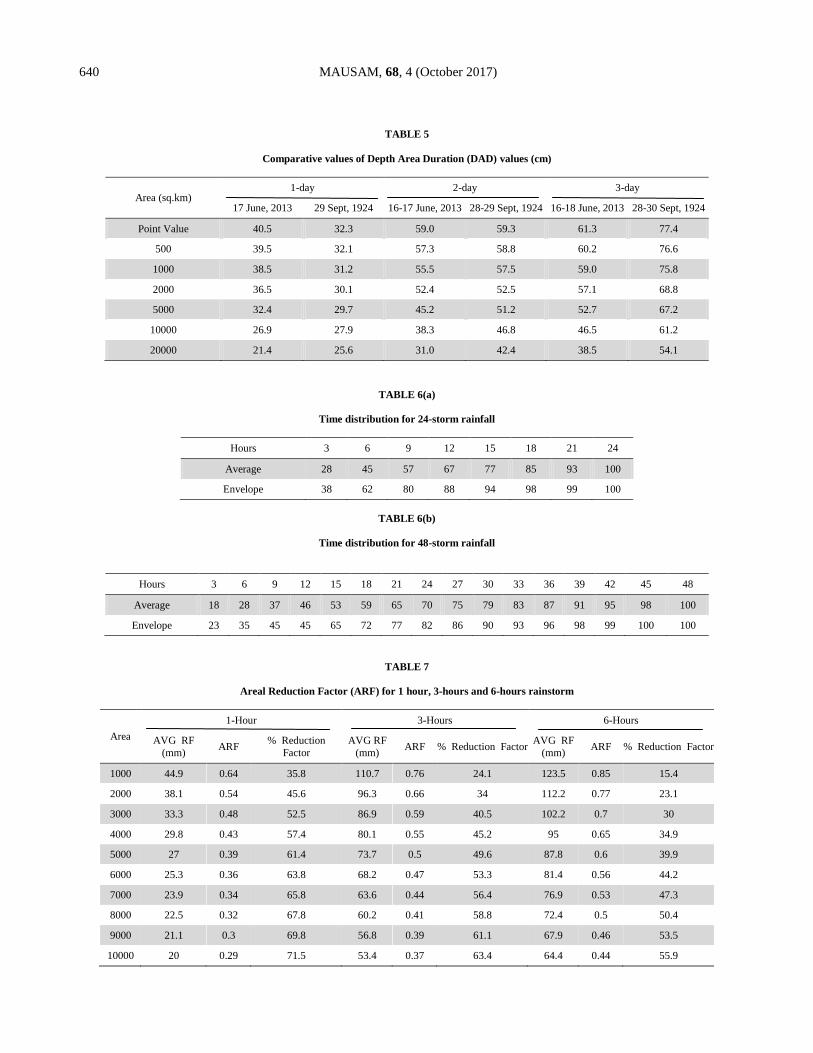
3.3.3. Comparison of two heavy rainstorms
The results of DAD analysis of the rainstorm of
June-2013 at Poanta/Dehradun are compared with the
historical rainstorm of 28-30 September, 1924 at
Lansdowne. The comparative study is given in Table
5.The study revealed that for one day duration, the
rainstorm of June-2013 contributed more rainfall than the
rainstorm of Sept-1924 up to an area of 5000 km2 but after
5000 sq km DAD values of September 1924 storm are
higher than the storm of June 2013. However, for 2day
and 3 day durations, the rainfall contributions of
September-1924 rainstorm are higher for any area.
3.4. Moisture adjustment factor (MAF)
The moisture adjustment is a ratio of the perceptible
water corresponding to the maximum persistent dew
Fig. 14. Isohyetal pattern for 28-30 September, 1924 rainstorm
point temperature of the station which is representative of
the storm to the perceptible water corresponding to
the persistent dew point temperature during the storm
period. The 1-day maximum persisting dew point
temperatures for stations have been taken from
IMD (2000). The Moisture Adjustment Factor for the
rainstorm of June, 2013 is of the order of 1.33 which is
computed on the basis of dew point temperature of
Dehradun whereas it is 1.57 for the rainstorm of
September 1924 computed on the basis of dew point
temperature of Roorkee station.
3.5. Time distribution of June 2013 storm rainfall
The temporal distribution of rainfall is an important
component of a design storm. Normally 3-hourly time
distribution of 24-hour and 48-hour rainfall meets most of
the requirements of design engineers. Here nine self
recording raingauge stations viz., Bageshwar, Devprayag,
Gangolihat, Jakholi, Pati, Srinagar, Tharali and Rishikesh
for which continuous rainfall data for this rainstorm of
June-2013 is available, have been selected for computing
time distribution.
Time distribution analysis 24-hour and 48-hour
rainstorms at each station are carried out separately on the
basis of 3 consecutive clock hour duration rainfall data in
respect of each rainstorm. In each rainstorm any 3-hour
640 MAUSAM, 68, 4 (October 2017)
TABLE 5
Comparative values of Depth Area Duration (DAD) values (cm)
Area (sq.km) 1-day 2-day 3-day
17 June, 2013 29 Sept, 1924 16-17 June, 2013 28-29 Sept, 1924 16-18 June, 2013 28-30 Sept, 1924
Point Value 40.5 32.3 59.0 59.3 61.3 77.4
500 39.5 32.1 57.3 58.8 60.2 76.6
1000 38.5 31.2 55.5 57.5 59.0 75.8
2000 36.5 30.1 52.4 52.5 57.1 68.8
5000 32.4 29.7 45.2 51.2 52.7 67.2
10000 26.9 27.9 38.3 46.8 46.5 61.2
20000 21.4 25.6 31.0 42.4 38.5 54.1
TABLE 6(a)
Time distribution for 24-storm rainfall
Hours 3 6 9 12 15 18 21 24
Average 28 45 57 67 77 85 93 100
Envelope 38 62 80 88 94 98 99 100
TABLE 6(b)
Time distribution for 48-storm rainfall
Hours 3 6 9 12 15 18 21 24 27 30 33 36 39 42 45 48
Average 18 28 37 46 53 59 65 70 75 79 83 87 91 95 98 100
Envelope 23 35 45 45 65 72 77 82 86 90 93 96 98 99 100 100
TABLE 7
Areal Reduction Factor (ARF) for 1 hour, 3-hours and 6-hours rainstorm
Area
1-Hour 3-Hours 6-Hours
AVG RF
(mm) ARF
% Reduction
Factor
AVG RF
(mm) ARF % Reduction Factor
AVG RF
(mm) ARF % Reduction Factor
1000 44.9 0.64 35.8 110.7 0.76 24.1 123.5 0.85 15.4
2000 38.1 0.54 45.6 96.3 0.66 34 112.2 0.77 23.1
3000 33.3 0.48 52.5 86.9 0.59 40.5 102.2 0.7 30
4000 29.8 0.43 57.4 80.1 0.55 45.2 95 0.65 34.9
5000 27 0.39 61.4 73.7 0.5 49.6 87.8 0.6 39.9
6000 25.3 0.36 63.8 68.2 0.47 53.3 81.4 0.56 44.2
7000 23.9 0.34 65.8 63.6 0.44 56.4 76.9 0.53 47.3
8000 22.5 0.32 67.8 60.2 0.41 58.8 72.4 0.5 50.4
9000 21.1 0.3 69.8 56.8 0.39 61.1 67.9 0.46 53.5
10000 20 0.29 71.5 53.4 0.37 63.4 64.4 0.44 55.9
KAUR and GUPTA : DEVASTATING RAINSTORM OF JUNE-2013 IN UTTARAKHAND 641
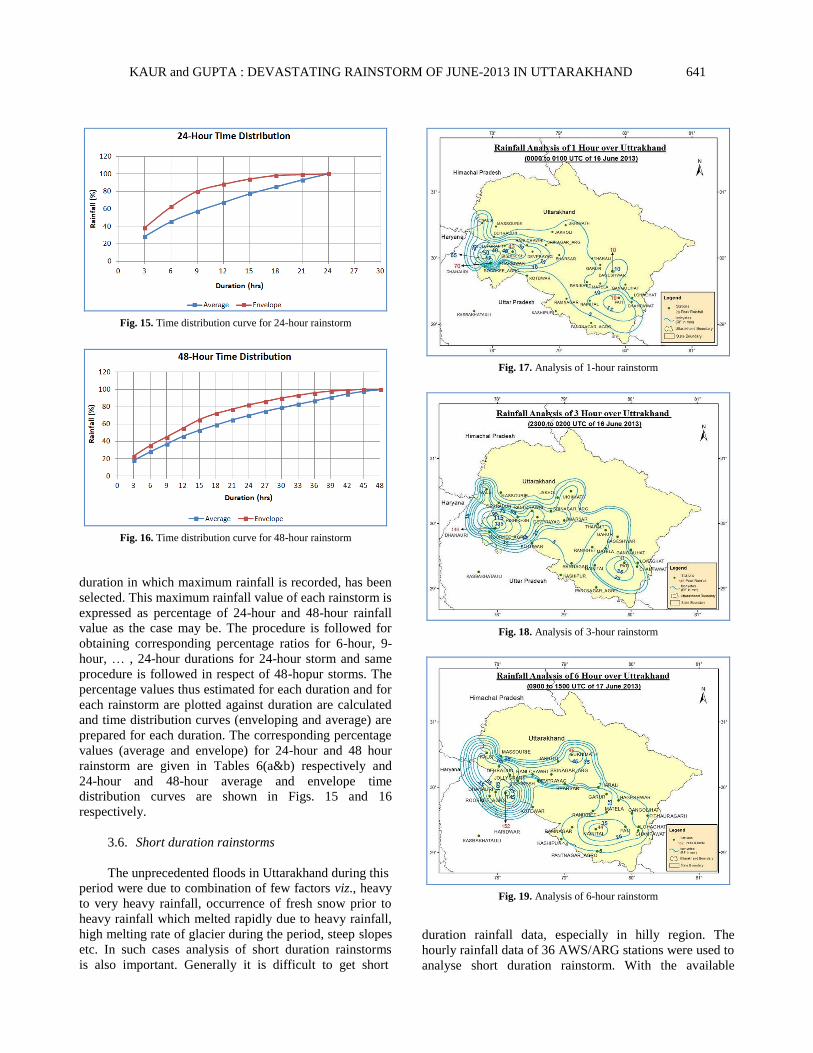
Fig. 15. Time distribution curve for 24-hour rainstorm
Fig. 16. Time distribution curve for 48-hour rainstorm
duration in which maximum rainfall is recorded, has been
selected. This maximum rainfall value of each rainstorm is
expressed as percentage of 24-hour and 48-hour rainfall
value as the case may be. The procedure is followed for
obtaining corresponding percentage ratios for 6-hour, 9-
hour, … , 24-hour durations for 24-hour storm and same
procedure is followed in respect of 48-hopur storms. The
percentage values thus estimated for each duration and for
each rainstorm are plotted against duration are calculated
and time distribution curves (enveloping and average) are
prepared for each duration. The corresponding percentage
values (average and envelope) for 24-hour and 48 hour
rainstorm are given in Tables 6(a&b) respectively and
24-hour and 48-hour average and envelope time
distribution curves are shown in Figs. 15 and 16
respectively.
3.6. Short duration rainstorms
The unprecedented floods in Uttarakhand during this
period were due to combination of few factors viz., heavy
to very heavy rainfall, occurrence of fresh snow prior to
heavy rainfall which melted rapidly due to heavy rainfall,
high melting rate of glacier during the period, steep slopes
etc. In such cases analysis of short duration rainstorms
is also important. Generally it is difficult to get short
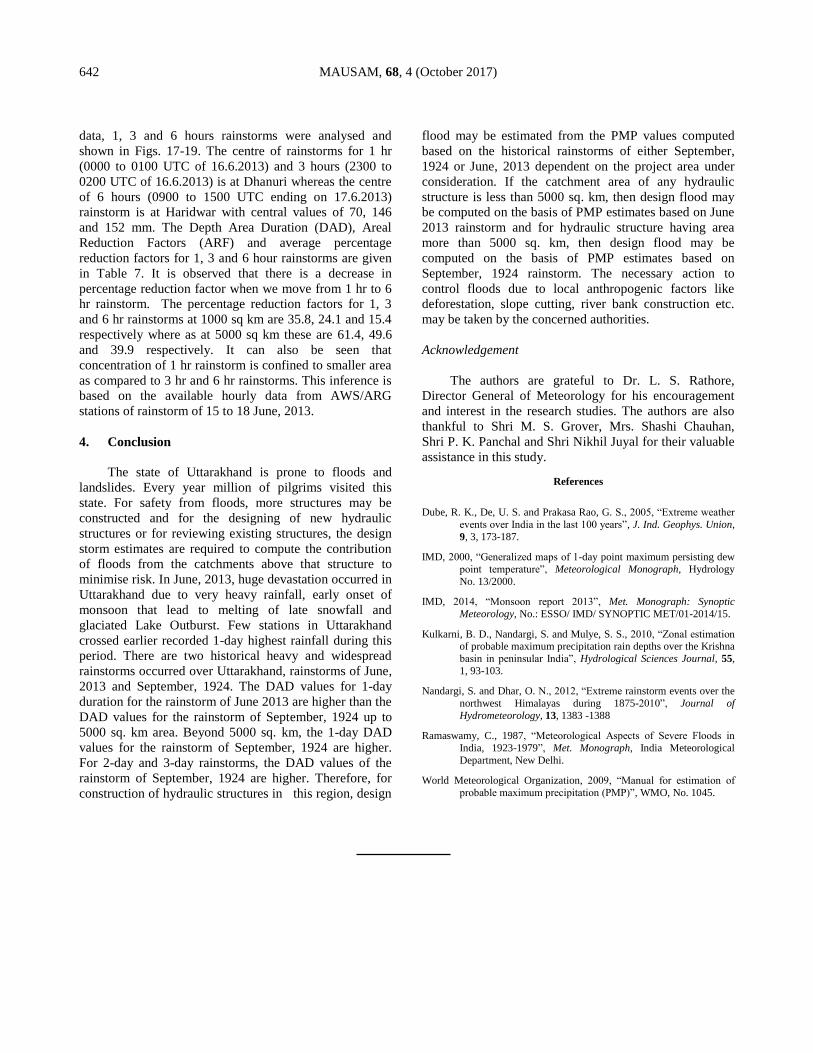
Fig. 17. Analysis of 1-hour rainstorm
Fig. 18. Analysis of 3-hour rainstorm
Fig. 19. Analysis of 6-hour rainstorm
duration rainfall data, especially in hilly region. The
hourly rainfall data of 36 AWS/ARG stations were used to
analyse short duration rainstorm. With the available
642 MAUSAM, 68, 4 (October 2017)
data, 1, 3 and 6 hours rainstorms were analysed and
shown in Figs. 17-19. The centre of rainstorms for 1 hr
(0000 to 0100 UTC of 16.6.2013) and 3 hours (2300 to
0200 UTC of 16.6.2013) is at Dhanuri whereas the centre
of 6 hours (0900 to 1500 UTC ending on 17.6.2013)
rainstorm is at Haridwar with central values of 70, 146
and 152 mm. The Depth Area Duration (DAD), Areal
Reduction Factors (ARF) and average percentage
reduction factors for 1, 3 and 6 hour rainstorms are given
in Table 7. It is observed that there is a decrease in
percentage reduction factor when we move from 1 hr to 6
hr rainstorm. The percentage reduction factors for 1, 3
and 6 hr rainstorms at 1000 sq km are 35.8, 24.1 and 15.4
respectively where as at 5000 sq km these are 61.4, 49.6
and 39.9 respectively. It can also be seen that
concentration of 1 hr rainstorm is confined to smaller area
as compared to 3 hr and 6 hr rainstorms. This inference is
based on the available hourly data from AWS/ARG
stations of rainstorm of 15 to 18 June, 2013.
4. Conclusion
The state of Uttarakhand is prone to floods and
landslides. Every year million of pilgrims visited this
state. For safety from floods, more structures may be
constructed and for the designing of new hydraulic
structures or for reviewing existing structures, the design
storm estimates are required to compute the contribution
of floods from the catchments above that structure to
minimise risk. In June, 2013, huge devastation occurred in
Uttarakhand due to very heavy rainfall, early onset of
monsoon that lead to melting of late snowfall and
glaciated Lake Outburst. Few stations in Uttarakhand
crossed earlier recorded 1-day highest rainfall during this
period. There are two historical heavy and widespread
rainstorms occurred over Uttarakhand, rainstorms of June,
2013 and September, 1924. The DAD values for 1-day
duration for the rainstorm of June 2013 are higher than the
DAD values for the rainstorm of September, 1924 up to
5000 sq. km area. Beyond 5000 sq. km, the 1-day DAD
values for the rainstorm of September, 1924 are higher.
For 2-day and 3-day rainstorms, the DAD values of the
rainstorm of September, 1924 are higher. Therefore, for
construction of hydraulic structures in this region, design
flood may be estimated from the PMP values computed
based on the historical rainstorms of either September,
1924 or June, 2013 dependent on the project area under
consideration. If the catchment area of any hydraulic
structure is less than 5000 sq. km, then design flood may
be computed on the basis of PMP estimates based on June
2013 rainstorm and for hydraulic structure having area
more than 5000 sq. km, then design flood may be
computed on the basis of PMP estimates based on
September, 1924 rainstorm. The necessary action to
control floods due to local anthropogenic factors like
deforestation, slope cutting, river bank construction etc.
may be taken by the concerned authorities.
Acknowledgement
The authors are grateful to Dr. L. S. Rathore,
Director General of Meteorology for his encouragement
and interest in the research studies. The authors are also
thankful to Shri M. S. Grover, Mrs. Shashi Chauhan,
Shri P. K. Panchal and Shri Nikhil Juyal for their valuable
assistance in this study.
References
Dube, R. K., De, U. S. and Prakasa Rao, G. S., 2005, “Extreme weather
events over India in the last 100 years”, J. Ind. Geophys. Union,
9, 3, 173-187.
IMD, 2000, “Generalized maps of 1-day point maximum persisting dew
point temperature”, Meteorological Monograph, Hydrology
No. 13/2000.
IMD, 2014, “Monsoon report 2013”, Met. Monograph: Synoptic
Meteorology, No.: ESSO/ IMD/ SYNOPTIC MET/01-2014/15.
Kulkarni, B. D., Nandargi, S. and Mulye, S. S., 2010, “Zonal estimation of probable maximum precipitation rain depths over the Krishna
basin in peninsular India”, Hydrological Sciences Journal, 55,
1, 93-103.
Nandargi, S. and Dhar, O. N., 2012, “Extreme rainstorm events over the
northwest Himalayas during 1875-2010”, Journal of
Hydrometeorology, 13, 1383 -1388
Ramaswamy, C., 1987, “Meteorological Aspects of Severe Floods in
India, 1923-1979”, Met. Monograph, India Meteorological
Department, New Delhi.
World Meteorological Organization, 2009, “Manual for estimation of
probable maximum precipitation (PMP)”, WMO, No. 1045.