Embed Size (px)
Citation preview

1 1
Deutsche Wohnen AG
» 9M 2016 results
Conference Call, 15 November 2016

2
9M 2016 results 1
» Agenda
Investment update & Outlook 2
3 Q&A

3
» 9M 2016 results

4
» Financial highlights 9M 2016
1) Based on weighted average shares outstanding (9M 2016: 337.44m; 9M 2015: 315.27m); 2) Adjusted for one-off effects excluding disposals; 3) Corporate expenses annualized divided by avg. units in
period; 4) based on 337.5m shares outstanding
Operational development
In EUR m 9M 2016 YoY
NOI letting 414.6 +15.1%
NOI margin 78.8% +2.6ppt
Like-for-like rental growth 3.2% +0.1ppt
Vacancy rate 1.8% -0.3ppt
NOI nursing 13.7 +14.2%
FFO contribution 10.4 +13.0%
Occupancy rate 98.7% +2.2ppt
Earnings from disposals 46.4 -23.7%
Gross margin privatization 40% -1ppt
Gross margin inst. sales 12% +4ppt
Free cash flow impact 255.1 -37.5%
ICR 5.7x +1.5x
KPIs
In EUR m 9M 2016 YoY
FFO I (after minorities) 301.4 +31.8%
in EUR/ share1) 0.89 +21.9%
FFO I margin 57.3% +9.0ppt
FFO II (after minorities) 347.8 +20.1%
in EUR/ share1) 1.03 +12.0%
Adj. EBITDA (excl. disposals) 2) 405.0 +18.6%
Adj. EBITDA margin 77.0% +4.8ppt
Cost ratio 10.0% -1.6ppt
Cost per unit3) (in EUR) 435 -14.0%
In EUR m 9M 2016 YTD
EPRA NAV per share (undiluted)4) 25.10 9.1%
LTV 41.7% +3.7ppt

5
Strategic cluster Residential
units
% of total
measured by
fair value
In-place rent1)
30/09/2016
EUR/sqm/month
Rent potential2)
30/09/2016
in %
Vacancy
30/09/2016
in %
Fair value
30/09/2016
EUR/sqm
Multiple
in-place
rent
Multiple
market
rent
Strategic core and growth
regions
154,343 98.5% 6.07 22% 1.7% 1,396 19.1 15.6
Core+ 134,996 89.6% 6.15 25% 1.7% 1,458 19.7 15.8
Core 19,347 8.9% 5.56 13% 1.9% 983 14.8 13.3
Non-core 3,931 1.5% 5.21 n/a 5.1% 761 12.6 10.8
Total 158,274 100% 6.05 21% 1.8% 1,379 19.0 15.5
Thereof Greater Berlin 110,776 72.9% 6.04 25% 1.7% 1,459 20.2 15.9
» Portfolio update 9M 2016 – attractive reversionary potential
Further rent potential in Core+ regions of unchanged ~25%
Vacancy rate in Core+ portfolio declined by 20bps over 12 months to c. 1.7%
1) Contractually owed rent from rented apartments divided by rented area; 2) Unrestricted residential units (letting portfolio); rent potential = new-letting rent compared to in-place rent (letting portfolio);
Attractive spread between in-place and market rent multiples of c. 4x offer further potential for NAV growth

6
» Strong like-for-like development in Berlin
1) Contractually owed rent from rented apartments divided by rented area; 2) Excluding non-core and properties held for sale/ privatization
Like-for-like
30/09/2016
Residential units
number
In-place rent1)
30/09/2016
EUR/sqm/month
In-place rent1)
30/09/2015
EUR/sqm/month
Change
y-o-y
Vacancy
30/09/2016
in %
Vacancy
30/09/2015
in %
Change
y-o-y
Core+ 123,344 6.11 5.91 3.5% 1.5% 1.6% -0.1pp
Greater Berlin 102,995 6.04 5.82 3.8% 1.5% 1.7% -0.2pp
Rhine-Main 8,457 7.48 7.31 2.3% 1.5% 1.3% +0.2pp
Mannheim/Ludwigshafen 4,762 5.73 5.67 1.0% 0.6% 1.1% -0.5pp
Rhineland 4,474 6.01 5.86 2.5% 1.0% 1.2% -0.2pp
Dresden 2,656 5.29 5.16 2.5% 2.6% 2.3% +0.3pp
Core 13,787 5.55 5.47 1.4% 1.9% 2.3% -0.4pp
Hanover / Brunswick 8,100 5.61 5.53 1.4% 1.8% 2.0% -0.2pp
Core cities eastern Germany 4,559 5.45 5.38 1.2% 2.0% 2.8% -0.8pp
Kiel / Lübeck 1,128 5.44 5.35 1.7% 2.0% 3.4% -1.4pp
Total Letting portfolio2) 137,131 6.05 5.86 3.2% 1.5% 1.7% -0.2pp
Total 142,241 6.03 5.85 3.2% 1.8% 1.8% -
Strong like-for-like vacancy reduction by 40bps also in Core regions to 1.9%
Strong like-for-like rental growth in Core+ (3.5%) and in particular in Berlin (3.8%)
Like-for-like vacancy in Core+ letting portfolio at 1.5% - portfolio fully rented out

in EUR m 9M 2016 9M 2015
Rental income 526.1 473.1
Non-recoverable expenses (6.2) (9.4)
Rental loss (4.8) (4.6)
Maintenance (64.4) (58.9)
Others (6.0) (7.2)
Earnings from Residential Property
Management 444.7 393.0
Personnel, general and administrative expenses (30.1) (32.7)
Net Operating Income (NOI) 414.6 360.3
NOI margin 78.8% 76.2%
NOI in EUR / sqm / month 4.69 4.40
» Strong earnings and cash contributions from letting
7
Significant improvement of NOI margin
in EUR m 9M 2016 9M 2015
Net operating income (NOI) 414.6 360.3
Cash interest expenses (76.0) (93.6)
Cash flow from portfolio after cash interest
expenses 338.6 266.7
Cash flow margin 64.4% 56.4%
Improved NOI margin driven by rental growth combined with efficient management of operational costs
3.0% 2.1%
12.4% 12.2%
1.5% 1.1%
6.9% 5.7%
9M-2015 9M-2016
Non-rec. exp.& rent loss Maintenance Other Personnel
23.8%
Significant reduction of operational cost items
(in % of rental income)
76.2%
78.8%
9M-2015 9M-2016
21.2% -2.6pp

» Growing prices as demonstrated by disposal business
8
Disposals
Privatization Institutional sales Total
with closing in 9M 2016 9M 2015 9M 2016 9M 2015 9M 2016 9M 2015
No. of units 1,061 1,479 2,544 6,951 3,605 8,430
Proceeds (EUR m) 125.5 145.8 175.5 447.1 301.0 592.9
Book value 89.9 103.2 156.5 413.5 246.4 516.7
Price in EUR per sqm 1,538 1,384 961 942 n/a n/a
Earnings (EUR m) 28.7 33.8 17.7 27.0 46.4 60.8
Gross margin 40% 41% 12% 8% 22% 15%
Cash flow impact (EUR m) 111.7 83.7 143.4 324.7 255.1 408.4
Disposal business contributed cash flows of EUR 255m in 9M 2016
Institutional sales: consisted predominantly of a Berlin city-border portfolio with 900 units and further ~900
units in Merseburg
Privatization: Disposal of below-average quality at continued attractive margins; privatizations in Berlin
moving towards EUR 2,000 per sqm

» High profitability from nursing “operations” and “assets”
9
Operations (in EUR m) 9M 2016 9M 2015
Total income 52.4 49.9
Total expenses (47.1) (45.9)
EBITDA operations 5.3 4.0
EBITDA margin 10.1% 8.0%
Lease expenses1) 9.7 9.6
EBITDAR 15.0 13.6
EBITDAR margin 28.6% 27.3%
in EUR m 9M 2016 9M 2015
Nursing 41.5 39.7
Living 4.9 4.6
Other 6.0 5.6
in EUR m 9M 2016 9M 2015
Staff (26.7) (25.2)
Rent / lease (9.7) (9.6)
Other (10.7) (11.1)
Assets (in EUR m) 9M 2016 9M 2015
Lease income1) 8.9 8.3
Total expenses (0.5) (0.3)
EBITDA assets 8.4 8.0
Operations & Assets (in EUR m) 9M 2016 9M 2015
Total EBITDA 13.7 12.0
Interest expenses2) (3.3) (2.8)
FFO I contribution 10.4 9.2
Includes fee payable to operational partner of EUR
1.5m for 9M 2015 and EUR 2m for 9M 2016
Set out in the consolidated group financial statements
as “Earnings from nursing and assisted living”
EBITDAR margin of 28.6% or 1.5x lease revenues proof points for operational excellence
1) The delta between lease expenses (operations) and lease income assets derives from one nursing facility which is only operated but not owned by Deutsche Wohnen group
2) Including proportional interest cost due to minority stake in operations;

» Strong operating performance of the nursing business
10
59.9 68.2 67.2 ~70
2013 2014 2015 9M 2016(annualized)
Revenues (EURm)
96.1% 96.1% 97.2% 98.7%
31/12/2013 31/12/2014 31/12/2015 30/09/2016
3) EBITDAR = EBITDA before rents;
Strong revenue growth
Nursing is a staff-intense business
High occupancy rate is a good proof point for
operational excellence
Attractive EBITDAR margins
Occupancy rate
Major expense items (9M 2016) in % of total revenue EBITDAR margin operating business
51%
19%
9%
3% 12%
Personal Rents Utilities &Maintenance
Interestexpense
Other
3)
1) Rents for internally operated facilities are consolidated on group accounting
level; 2) Incl. housekeeping supplies, laundry, catering, other
1) 2)
27.8% 28.1% 27.0%
28.7%
2013 2014 2015 9M 2016
German occupancy rate: ̴ 85%

» Nursing homes - portfolio overview
11
# of places
Region Facilities
#
Nursing
#
Assisted
living
#
Total
#
Area
(sqm)
Occupancy
rate
Fair Value
(30/06/2016)
Greater Berlin 12 1,072 370 1,442 84,250 98.0%
Saxony 7 436 39 475 21,836 99.4%
Lower Saxony 1 131 - 131 5,427 98.7%
Total 20 1,639 409 2,048 111,513 98.4% 161.4m
Existing nursing business: Assets and operating business1)
# of places
Region Facilities
#
Nursing
#
Assisted
living
#
Total
#
Area
(sqm) WALT
Purchase
price
Bavaria 7 999 - 999 41,193 12.3
North-Rhine Westphalia 5 721 187 908 46,117 13.9
Lower Saxony 4 661 - 661 24,460 11.2
Rhineland-Palatinate 4 409 208 617 29,276 14.0
Baden-Württemberg 5 557 16 573 24,216 13.9
Other 3 374 - 374 14,324 9.0
Total 28 3,721 411 4,132 179,586 12.6 420.5m
Recent Pegasus acquisition: Assets only2)
1) Katharinenhof manages 20 facilities, thereof Deutsche Wohnen owns 19 facilities; 2) Relates to recently acquired assets (Pegasus portfolio)
Kath
ari
ne
nh
of
Oth
er
op
era
tors
Total 48 5,360 820 6,180 291,099 n/a n/a

in EUR m 9M 2016 9M 2015
Earnings from Residential Property Management 444.7 393.0
Earnings from Disposals 46.4 60.8
Earnings from Nursing and Assisted Living 13.7 12.0
Segment contribution margin 504.8 465.8
Corporate expenses (52.4) (54.8)
Other operating expenses/income (1.0) (34.5)
EBITDA 451.4 376.5
One-offs 0.0 25.7
adj. EBITDA (incl. disposals) 451.4 402.2
Earnings from Disposals (46.4) (60.8)
adj. EBITDA (excl. disposals) 405.0 341.4
» Significant step up in EBITDA margin
12
Development of cost ratio
Development of adj. EBITDA margin
Adj. EBITDA margin up by 4.8pp (excl. disposals) driven by improvement of NOI and reduction of corporate
expenses
72.2%
77.0%
85.0% 85.8%
9M 2015 9M 2016
adj. EBITDA Margin (excl. disposals) adj. EBITDA Margin (incl. disposals)
11.6%
10.0%
9M 2015 9M 2016
Cost Ratio (corporate expenses divided by gross rental income)

» Operational improvements, acquisitions and lower interest expenses drive FFO growth
13
1) Based on weighted average shares outstanding (9M 2016: 337.44m; 9M 2015: 315.27m); 2) Based on FFO I guidance of at least EUR 380m and 337.5m shares outstanding
in EUR m 9M 2016 9M 2015
EBITDA (adjusted) 451.4 402.2
Earnings from Disposals (46.4) (60.8)
At equity valuation 1.5 1.5
Interest expense/ income (78.6) (94.4)
Income taxes (21.3) (14.0)
Minorities (5.2) (5.8)
FFO I 301.4 228.7
Earnings from Disposals 46.4 60.8
FFO II 347.8 289.5
FFO I per share in EUR1) 0.89 0.73
FFO II per share in EUR1) 1.03 0.92
FFO I per share increased by 22% yoy
0.73 0.89
0.19 0.14
9M 2015 9M 2016
FFO I Earnings from disposals
+ 22%
FFO per share development in EUR
1.03 0.92
Dividend expected to increase by 35% to EUR ~0.73 per share for 20162)
Diluted FFO I of EUR 0.83 per share pro forma
conversion of in-the money convertible bonds

17.86
23.01 25.10
31/12/2014 31/12/2015 30/09/2016
in EUR m 30/09/2016 31/12/2015
Equity (before non-controlling interests) 7,062.5 6,653.5
Fair values of derivative financial
instruments 60.0 44.8
Deferred taxes (net) 1,349.5 1,064.1
EPRA NAV (undiluted) 8,472.0 7,762.4
Shares outstanding (in m) 337.5 337.4
EPRA NAV per share in EUR
(undiluted) 25.10 23.01
Effects of exercise of convertibles 1,097.41) 952.1
EPRA NAV (diluted) 9,569.4 8,714.5
Shares diluted (in m) 370.8 370.2
EPRA NAV per share in EUR (diluted) 25.81 23.54
Goodwill GSW (535.1) (535.1)
Shares outstanding (in m) 337.5 337.4
Adj. NAV per share (undiluted) 23.52 21.42
» Steady increase of EPRA NAV per share
14
EPRA NAV per share (undiluted) in EUR
+ 29%
+ 9%
1) Current strike price: 17.45 EUR and 21.01 EUR correspond to ~33.4m shares
Development of LTV
51.0%
38.0% 41.7%
31/12/2014 31/12/2015 30/09/2016

» Conservative long term capital structure with 1.6% interest costs
15
Rating A- / A3; stable outlook
LTV 41.7%
ICR1) 5.7x
Ø maturity 8.5 years
% secured bank debt 74%
% unsecured debt 26%
Ø interest cost 1.6% (~84% hedged)
Key financial
principles
LTV: 35-40%
fully flexible regarding secured or
unsecured financing
6 12 19 68
272 357
791 865 157
787 722 497
250 400
500
2016 2017 2018 2019 2020 2021 2022 2023 2024 2025 2026 ≥ 2027
Balanced maturity profile with no significant debt maturities in the next 4 years3)
Bank debt Corporate bond Convertible bonds
1) adjusted EBITDA/ interest expenses, 2) Excluding changes in valuation of financial instruments, 3) based on notional amounts
Low leverage, long maturities and best in class rating
Flexible financing approach to optimize financing costs
No significant maturities until and including 2019
Convertible bonds accounted 100% as debt
Base case LTV 2016 <40% expected2)
Target LTV range: 35-40%

16
» Investment update & outlook

17
» More than EUR 7bn value potential for Deutsche Wohnen with at least EUR 2.2bn value uplift expected for total year 2016
Value potential (EUR bn, incl. capex)1)
13.5
3.01)
4.52) 21.0
Current FV(9M 2016)
Short-/mid-termyield
compression
Rent potential(incl. capexprogram)
Potential FV
In-place rent multipliers (entire portfolio)
Transactional evidence in Berlin for average quality
assets points towards:
25-30x in place rent multipliers
Prices per sqm EUR >2,000
Further significant yield compression in Deutsche
Wohnen’s Core+ portfolio expected
c. EUR 3bn fair value step-up of in the short to
medium term expected
At least EUR 1.5bn expected by year end 2016
Identified EUR 180m rent potential - including the
contribution from the capex program - offers a
further fair value potential of EUR c. 4.5bn
Based on today’s parameters DW’s portfolio should
be valued at c. EUR 21bn in the longer term
19.1x 23.5x 25.0x ~23.5x
Long-term capital value growth of c. EUR 6bn (excl. capitalized investments) expected to translate into
c. 70% NAV growth or c. EUR 18 per share
Driven by yield compression in particular in Berlin a further revaluation of the portfolio of at least EUR
2.2bn expected for 2016 (thereof EUR 0.7bn already realized at H1 2016)
1) Based on current annual rents of EUR 700m x 4.4 multiple spread 2) Based on annual Rent potential of EUR 180m x 25.0 multiple

18
Source: Emerging Trends in Real Estate ® - Europe 2017
Residential price per sqm (existing stock)
Source: CBRE reports, empirica
Top City ranking in real estate survey 2017
Rank City Rents Capital Values
1 Berlin
2 Hamburg
3 Frankfurt
4 Dublin
5 Munich
17 Paris
27 London
» Long-term Berlin has huge catch up potential compared to other German and European metropolitan areas
Price levels in Berlin - Deutsche Wohnen book values in particular - are significantly below German and
other west European areas, offering huge catch-up potential
Replacement cost including land are currently at around 3,000 EUR/ sqm (2 x book values)
Berlins attractiveness as dynamic Top European investment place underlined by recent surveys
1,460
2,000
2,700
5,000
2,600 2,900
4,100
0
1000
2000
3000
4000
5000
60008,000 8,500

19
» Investments in best micro locations within Core+ regions as accelerator for rental and value growth
Quality1)
Location
cluster Units
Targeted
capex
EUR m
Pre
capex
Post
capex
● Hot Spot ~13,000 ~450 3.9 1.9
● Growth ~14,500 ~500 3.8 1.9
● Stable ~2,500 ~70 4.1 2.0
Total1) ~30,000 ~1,000 3.9 1.9
Note: excluding new construction
1) Scale for technical building condition: 1=new construction, 2=fully modernised existing stock, 3=average quality, 4=short term investment need, >5=significant capex backlog
1. Rent potential 2. Value potential
Pre
capex
Post
capex
Pre capex
EUR/sqm
Targeted capex
EUR/sqm
Mid term market
expectation
EUR/sqm
29% 65% 1,580 ~640 3,500
23% 44% 1,410 ~640 3,000
24% 32% 1,000 ~490 2,400
26% 52% 1,440 ~630 3,200
Focus on best micro locations, predominately in hot spot and growth areas within Core+ regions - quality as
precondition to drive rental and thereby value growth
Based on detailed portfolio analysis significant step-up of existing capex program from EUR 400m (17,000 units)
to EUR 1,000m (30,0000 units), scheduled to be executed by 2021
Investments of c. EUR 550m for pro-active refurbishments and c. EUR 450m for modernizations to upgrade the
quality of the product underpin the comprehensive investment approach
Value enhancing capex measures of EUR 450m can be directly charged to the tenant, translating into an
attractive yield on cost of 7-8%
Significant investment of EUR 630 per sqm leads to fully modernized investment stock post capex
Rent potential will increase from EUR 120m to EUR180m post capex – doubling of reversionary potential to c.
50% for the investment portfolio
Significant fair value uplift on top of capitalized investments of c. EUR 1,100 per sqm expected (>50% margin on
fair value uplift)

20
New construction predominantly located in Berlin and
Frankfurt am Main
Expected NOI-yield of 5% (FFO yield ~8% overall1))
Significant value creation contribution of EUR ~1,500 per
sqm translating into ROI of ~60%
~10,000 units planned mid to long-term (mainly in the Berlin
region and on existing land bank)
1) LTV of 50% on invest assumed
Value creation (EUR per sqm)
2,500
1,500
4,000
Constructioncosts
Value creation /step-up
Expected FV
Rent potential of c. EUR 25m mid-term and c. EUR 100m p.a. long-term from new construction
New construction pipeline
Location cluster
Units
Total
investment
(EUR m)
Construction
costs
(per sqm)
Market value
(per sqm)
Market rent
(per sqm/month)
Rent
(EUR m)
Rent
multiple
on cost
Market
value
multiple
New construction 1,800 380 2,500 4,000 12.0 21 17x 28x
Roof extensions/addition 400 70 2,400 4,300 13.0 4 15x 27x
Total mid-term (by 2020) 2,200 450 2,500 4,000 12.2 25 17x 28x
Mid to long-term pipeline ~10,000 ~2,000 ~100
» New construction pipeline – capitalizing on land bank

21
Res
ide
nti
al
1) Current EBITDA contribution of nursing business, pro forma for the recently announced Pegasus acquisition, amounts to c. 7%
» Bolt-on acquisitions: Focus on selected value enhancing acquisitions but at lower pace compared to past years
Nu
rsin
g
Attractive pipeline of additional smaller bolt-on acquisitions in residential and nursing of c. EUR 200m
No attractive acquisition opportunities in the listed
segment
Acquisition of quality portfolios with strong anchor in
Core+ markets, however more challenging as expected
development largely reflected in price considerations of
sellers
Capital allocation decisions currently biased towards
internal growth - targeted capex measures allow
Deutsche Wohnen to capture value upside margin itself
EUR 40bn nursing market expected to grow
significantly in coming years with estimated additional
300,000 beds required by 2030
Focus on acquisition of assets, preferably in
combination with operations to enhance yields
Adherence to strict acquisition criteria – good location
for nursing property ≠ good location for residential
property
Contribution of nursing business not expected to
exceed c. 15% of group EBITDA in the medium term1)
Attractive bolt-on acquisitions of c. 640 units in Core+
regions for c. EUR 100m or EUR 2,000 per sqm
High quality, fully refurbished portfolio with attractive
rent levels
Acquisition of Pegasus portfolio with c. 4,100
places for c. EUR 420m or gross yield of 6.5%
High quality facilities in good locations
predominantly in Western Germany
22
» Executive summary: Key strategic priorities to accelerate rental and value growth
Focus Highlights
Investments
existing stock
Improve quality for top locations to
crystallize rent and value growth
Core+, in particular Berlin
Capex program increased to EUR 1bn
for 30,000 units by 2021
Reversionary potential post capex
doubled from c. 25% to 50%
>50% margin on fair value uplift
1
Investments
new construction
Redensification / addition of floors on
top of existing buildings
Monetization of existing land bank
2,200 units for close to EUR 0.5bn
investment volume by 2020
ROI ~60% based on construction costs
Another c. 10,000 units realizable in
the long-term
2
Bolt-on
acquisitions
Nursing assets, ideally in combination
with operations
High-quality residential portfolios with
strong anchor in Core+
Successful acquisition of Pegasus
portfolio with RoCE >6%
3

23
» NAV guidance increased for 2016
1) Without acquisitions and opportunistic portfolio disposal as well as excluding changes in goodwill impairment and valuation of financial instruments, based on current number of outstanding shares
2) Pro forma acquisitions
2015 9M 2016 Guidance 20161)
Comments
Old New
EPRA NAV per
share (undiluted) 23.01 25.10 >26 ~30
Based on transactional evidence at least EUR 2.2bn
expected to be realized for 2016 (EUR 0.7bn already
realized with H1 2016)
Excluding changes in goodwill impairment and
valuation of financial instruments and convertible
bonds
FFO I
(in EUR m) 303 301.4 >380 >380
Excluding recently acquired nursing portfolio with
transfer in Q4 2016/Q1 2017 (Pegasus)
Acquisition expected to contribute c. EUR 23m (annual
run rate)
Dividend per
share 0.54 n/a 0.73 0.73
Based on 65% pay-out ratio of FFO I and 337.5m
shares outstanding
LTV 43%2) 41.7% <40% <40%
LTV target range reduced from 35-45% to 35-40%
Commitment to leverage discipline in light of asset
appreciation

24
» Q&A

25
» Appendix 1 – nursing segment presentation

» Overview of German nursing market
Care dependent people by age groups
Overview of market segments
<1% 1.2% 1.9% 4.1%
9.8%
21.0%
46.2%
3.3%
0
5
10
15
20
25
30
35
40
45
50
0-<55 55-<60 60-<65 65-<70 75-<80 80-<85 >85 Total
2.6m care dependent people
1.86m (71%)
outpatient care
0.76m (29%)
inpatient care
thereof 1.25m provided
by relatives
0.62m by ambulant
nursing services
c.13,000 nursing
facilities
Source: Federal Statistical Office 2015, BBSR (2015), Georg Consulting (2016)
The likelihood of requiring professional care significantly increases above the age of 75
Germany is the biggest nursing market in Europe with c. EUR 40bn annual spend, of which c. EUR 28bn
inpatient and EUR 12bn outpatient nursing care
Presently c. 2.6m care dependent people in Germany, of which c. 764,000 or c. 30% permanently live in one
of c. 13,000 nursing facilities with nearly 900,000 beds
Source: Federal Statistical Office 2013
26

» Key demographic trends in Germany
27
Source: Federal Statistical Office, 2015
2013
2030E
2060E
5%
15%
80%
8%
20%
72%
13%
20%
67%
Increasing share of age groups 65+ and 80+
Ageing population leads to increasing demand
for nursing homes
0–64 65–79 80+
23%
28%
33%
Nursing care market driven by (irreversible)
demographic trends - increasing demand for social,
medical and nursing services
Main reasons for aging German population are:
Decreasing birth rates
Ageing of former baby boomer generations
Increasing life expectancy
Until 2030 the age group >80 years is expected to
increase by more than 60%
Approx. 8% of the German population will be >80
years in 2030
Increased demand for specialized facilities to serve
e.g. Alzheimer’s disease / dementia
The requirement for professional service structures in
nursing care are further boosted by ongoing trends:
Increasing mobility
Bigger distance between family members
Higher share of employment of all family members Age groups:

» Outlook for German nursing market
28
By 2030, an estimated additional 800,000 people will be in need of care compared to 2015
Estimated number of people
in need of care (m)
Source: Destatis and Terranus Research
The market for nursing homes remains a growth market with estimated 300,000 additional beds required by
2030, which will require significant capital investments in the market
2.1
2.4 2.6
2.9
3.2 3.4
2005 2010 2015E 2020E 2025E 2030E
Forecast for inpatient care
(# of beds in m)
Source: D&S Healthcare
0,0
0,2
0,4
0,6
0,8
1,0
1,2
1999
2001
2003
2005
2007
2009
2011
2013
2020E
2030E
Number of care-dependents Consensus forecast
Probability of need of care
by age group (%)
Source: Destatis and Terranus Research
0
10
20
30
40
50
60
70
65–70 70–75 75–80 80–85 85–90 >90
Pro
babili
ty o
f need o
f care
(%
)
Male Female
Age groups

» Forecast - required additional nursing home beds by federal state
29
Good location for nursing property ≠ good location for residential property
Source: Federal Statistical Office 2015, Georg Consulting (2016)
In all federal states and in almost all urban districts strong demand for additional nursing homes beds
≥ 2,000 – <6,000 ≥ 6,000 – <10,000 ≥ 10,000 – <16,000 ≥ 16,000 – <40,000 ≥ 40,000 – <50,000
Schleswig-Holstein
16,357 Mecklenburg-
West Pomerania
6,882
Brandenburg
11,224
Berlin
15,991
Saxony-Anhalt
7,591
Saxony
13,322
Thuringia
7,039
Bavaria
48,597 Baden-Württemberg
41,630
Saarland
2,565
Rhineland-
Palatinate
13,130
Hesse
20,014
North
Rhine-Westphalia
47,906
Lower Saxony
34,401
Bremen
2,038
Hamburg
5,566
Schleswig-Holstein
23,403 Mecklenburg-
West Pomerania
12,308
Brandenburg
19,744
Berlin
26,177
Saxony-Anhalt
13,916
Saxony
23,777
Thuringia
13,257
Bavaria
76,776 Baden-Württemberg
65,944
Saarland
5,060
Rhineland-
Palatinate
22,885
Hesse
36,085
North
Rhine-Westphalia
89,539
Lower Saxony
57,431
Bremen
3,720
Hamburg
9,495
≥ 3,000 – <10,000 ≥ 10,000 – <16,000 ≥ 16,000 – <25,000 ≥ 25,000 – <60,000 ≥ 60,000 – <90,000
∑= 293,336 ∑= 498,817
Additional demand for care beds by 2030
(constant nursing home ratio 2013)¹
Additional demand for care beds by 2030
(nursing home ratio 2013 +5%)²
Number of care beds: Number of care beds:
1) Scenario assumes constant proportion of the number of people in need of care to the number of nursing homes as in 2013 (basic ratio); 2) Scenario assumes 5 percentage-point increase in in the
number of people in need of care compared to 2013

Nursing home operators split by type (# of beds)
» Market structure – nursing home operators
30
Top private operators (by # of beds)
Source: Savills: Nursing homes market Germany 2016 (August 2016)
Source: Federal Statistical Office in Germany 2013
54%
5%
41%
Non-profit operators
Public operators
Private operators
Operator # of
facilities # of beds
Market
share (%)
Occupancy
(%)
Korian 228 24,775 3.1% 86.8%
Pro Seniore 97 13,101 1.6% 81.1%
Alloheim 124 12,169 1.5% 88.3%
Orpea / Silver Care 129 10,979 1.4% 91.6%
Kursana 96 9,241 1.2% 91.0%
Vitanas 58 7,582 0.9% 88.8%
Azurit 76 7,031 0.9% 83.7%
Nursing home operator market is very fragmented
Top ten private operators only account for c. 13%
of overall market (measured by number of beds)
Non-profit and public operators manage c. 60%
Many small (family) operators, often with less
than 10 facilities and capex backlog
Occupancy levels vary widely across operators and
regions
Average occupancy rate of only c. 85%
Free capacity in many instances does not fulfil
today’s standards for nursing homes
(i.e.: free capacity ≠ available capacity)
Significant consolidation trend among private
operators in recent years
3 of the top 5 operators are international
companies (France: Korian and Orpea; USA:
Alloheim/Carlyle)
Consolidation is expected to continue and to
accelerate professionalism (and therewith
profitability) of overall sector
Private operators increase their capacity the fastest
(by acquisition or greenfield projects); growth of
non-profit operators limited by funding constraints

» Market structure – nursing home properties
31
Nursing homes yield spread significantly
above other asset classes
0
200
400
600
800
2011 2012 2013 2014 2015 H1-2016
(EU
Rm
)
Increasing transaction volumes
in nursing home property market
Source: Savills, 2016
Source: CBRE 2016
Nursing home property market accounts for c. 1-3%
of overall commercial real estate transaction
volume
Nursing home properties offer attractive yields at
low risk:
Fundamentals for niche sector remain strong
and promising for the long-term
Transaction prices are still demonstrating
significant yield premiums to comparable asset
classes
Nursing market offers value catch-up potential
from widening of spread vs. other asset classes
Very limited number of insolvencies in past years
underscore low risk profile of sector
Transaction volumes increased significantly over
past years and 2016 pointing towards a record year
Professional investors represented largest
purchaser group over last years
Key limiting factor of further increased transaction
volumes is scarcity of supply despite positive macro
outlook
3,5
4,5
5,5
6,5
7,5
2011 2012 2013 2014 2015 Q3-2016
Nursing homes yield spread to 10y Bund
Berlin residential
Nursing homes
Prime office Germany

» Overview of regulatory environment in Germany (1/2)
32
Source: Knight Frank Research, 2014
Source: Knight Frank Research, 2014
60% 25%
15% Nursing services costs
Accomodation & catering costs
Investment costs
55% 45%
Residents (pension, savings) orsocial welfare
Care Funds (Pflegekassen)
Standard daily cost breakdown of nursing homes
Funding of nursing home costs
Germany is one of few countries which requires all
citizens to have either public or private long-term
care insurance
Care Funds (Pflegekassen) provide a cost cover
for care related services to the operator, based
on the level of patient care necessary
Care Funds supported by mandatory social
insurance as provided by care insurance law1)
Funded at a contribution rate of 2.35% of gross
salary increasing by 0.2% as of 2017
(childless employees pay an additional
contribution of 0.25%)
Until December 2016 there are 3 levels of care;
starting from 2017 there will be 5 levels with
increased funding of higher dependent people
In addition to national regulation, there are different
regional legislations on fit-out standards, multi-
occupancy ratios minimum room measurement and
employee skills (not homogeneous)
Average Payment Breakdown
Germany has one of the most stable funding systems for long-term care in Europe with currently
c. EUR 7bn funding surplus
1) Pflegeversicherungsgesetz

» Overview of regulatory environment in Germany (2/2)
33
New homes
authorization
No formal permission (except for building laws) required to set up new nursing homes
Operators entitled to enter into new supply contract with Care Funds (Pflegekassen) as soon
as structural requirements for operating a nursing home are met
Quality
requirements
Independent operators (MDK1)) check process structure and performance quality
Frequency of quality assurance audits of outpatient and inpatient care has historically
increased
Mandatory publication of MDK quality reports of each nursing home planned through latest
regulatory initiatives to increase transparency
Pricing &
financing
Prices for nursing care services strictly regulated and negotiated with authorities and revised
every 1-2 years, usually above cost inflation
Total cost for a nursing home place is funded by the respective resident, care fund and, if
required, social welfare (depending on residents' income)
Vast majority of nursing services costs is financed by care fund; level of reimbursements
are defined by laws, depending on level of care required
Accommodation & catering as well as investment costs are , in principle, financed by
resident (or social welfare system); investment rates are set freely for resident not
receiving public aid
Operators are free to generate additional revenues from secondary services, financed by
respective resident
1) MDK – German Health Insurance Medical Service

» Deutsche Wohnen nursing business at a glance
34
Legal structure of DW nursing business
Operating management via Katharinenhof brand
Above industry average quality of services as
demonstrated by very good ratings granted by MDK1)
Assisted living facilities offer rental apartments to senior
citizens along with an extensive range of services
Full inpatient nursing care promotes an active lifestyle
for patients in exalted quality
Outpatient care services offer assistance and care for
the elderly in their households
Since almost 20 years Deutsche Wohnen plays an active role in the area of nursing and assisted living
Family office
(partner)
Nursing homes (properties)
(partnership)
100% 49% 51%
Lease
agreement
Beginning of 2015, the operational business of
Katharinenhof was transferred into a partnership
structure
Deutsche Wohnen has a 49% stake; fully
consolidated
51% partner is a family office
Currently 20 facilities with more than 2,000 beds
are managed by the Katharinenhof partnership
Deutsche Wohnen 100% owns 19 facilities of the
Katharinenhof properties with a fair value of
c. EUR 161m
In August 2016, Deutsche Wohnen acquired 28
facilities with more than 4,100 beds, thus
expanding its holdings in this segment significantly
The acquisition makes Deutsche Wohnen one of
the leading providers in Germany of high-quality
residential and nursing facilities for elderly people
MDK scores are between 1.0-1.2 corresponding to an overall industry ranking of 3rd place

» Portfolio details pro forma recent acquisition
35
Assets & Operations versus Assets only
Distribution by year of construction
Distribution by operators
Distribution by type of lease agreement
=> Largest private operators serve as lead covenants => Large share of facilities owned and operated
=> Relatively new facilities with little to no capex backlog => Secured cash flows with limited investment needs for
outsourced operations
40%
15%
35%
10%
Assets & Operations
Assets only - WALT <10years
Assets only - WALT 10-15 years
Assets only - WALT >15years
11%
40% 49%
Pre 1990
1990-2000
Post 2000
46%
42%
8% 4%
Pro-Seniore
Katharinenhof (DW Group)
Korian (Phoenix & CasaReha)
Cura
40%
45%
15% Assets & Operations
Triple net lease agreements
Double net leaseagreements

» Portfolio images (1/2)
36
Uferpalais
Im Schlossgarten Wolkenstein
Uferpalais

» Portfolio images (2/2)
37
Heinrich-Lassen
Wilsdruff
Am Lunapark
Uferpalais
Wilsdruff Wilsdruff

» Competitive strength and strategy
38
Further expansion
via M&A and/or
greenfield projects
Fragmented market with promising fundamental outlook offers room for consolidation
Attractive yield spread compared to comparable asset classes
Focus on acquisition of real estate properties, preferably in combination with operational
management to enhance yields
Adherence to strict acquisition criteria focussing on quality, market positioning and expected
value upside
Significant
contribution to
profitability
Overall contribution of nursing business not to exceed c. 15% of group EBITDA in the medium
term
Significant internal
growth potential
Accelerate internal growth by further specialization of facilities on dependency needs
(e.g. dementia)
Enhancement of product offering (combination of outpatient care and day-care with existing
nursing facilities)
Active management of care levels to enhance profitability mix
Key competitive
advantages
Long-lasting expertise on both, the asset as well as operational side as demonstrated by best
in class occupancy ratios for self managed facilities
Proven track record for successful integration of acquired business (e.g. Lebenswerk 2012 and
Uferpalais 2013)
Low cost of funding

39
Object of
purchase
28 nursing (c. 3,700 places) and
assisted living facilities (c. 400
places) with 180k sqm
Only assets acquired, not the
operating business
Pricing & deal
structure
Purchase price: EUR 420m
6.5% gross yield
Asset deal
Lease
revenues EUR 27.3m p.a.
Margins
(run rate) Expected EBITDA margin of
c. 95%
WALT Weighted average lease term of c.
13 years (c. 24 years including
extension option)
Expected
closing Q4 2016 – Q1 2017
Facilities of high quality in good locations
predominantly in West Germany
Good market positioning from a price/ performance
perspective
More than 75% of buildings constructed after 2000
Well-known operators with proven track record and
high credit-worthiness as lead covenant
Mature operations with avg. occupancy of 87%, in
line with German average
Among top 10 operators in Germany
Approx. 80% of lease agreements structured as triple
net contracts incl. indexation
Contracts provide for defined investments to be
undertaken by lessee to maintain quality of assets
during lease term
No material capex backlog
All but one lease contracts linked to German CPI
Executed on communicated strategy to grow nursing and assisted living business – attractive add-on
business with high earnings contribution at low risk profile
» Overview of “Pegasus” acquisition (1/2)

» Overview of “Pegasus” acquisition (2/2)
40
Pro Seniore Residenz (Kempten, Bavaria) Pro Seniore Residenz (Oberau, Bavaria)
Pro Seniore Residenz (Radolfzell, Baden-Württemberg) Sozialkonzept Cäcilienhof (Garbsen, Lower Saxony)

» Successful Pegasus acquisition will drive earnings growth further
41
EBITDA contribution of nursing business (EUR m)
Total Existing portfolio Pegasus Acqusition
Spalte2 9M-2016 Annualized Spalte1
~17
~26 ~ 43
Existing portfolio Pegasus acquisition Pro-forma EBITDA
contribution
FFO I contribution of nursing business (EUR m)
Total Existing portfolio Pegasus Acqusition
Spalte1 9M-2016 Annualized Spalte2
~23 ~36
Existing portfolio Pegasus acquisition Pro-forma FFO I
contribution
~13
13.7 10.4
FFO I contribution of EUR ~36m (annual run rate) expected, translating into an FFO I yield of c. 10% based
on Deutsche Wohnen’s capital structure with c. 40% LTV
Expected EBITDA contribution including acquired nursing portfolio of EUR ~43m (annual run rate),
translating into of RoCE of c. 7%
42
» Appendix – general section

43
» Focused and increasing investments into the portfolio
1) Based on the quarterly average area
9M 2016 9M 2015
EUR m EUR m
Maintenance
(expensed through p&l) 64.4 58.9
Modernization
(capitalized on balance sheet) 83.5 55.6
Total 147.9 114.5
Total EUR/ sqm1) 20.09 16.77
Capitalization rate 56.5% 48.6%
9.59 9.45 ~10
6.92 10.53
15-20
FY-2014 FY-2015 FY-2016e
19.98 16.51
25-30
8.83 8.63 8.75
5.23 8.14 11.34
9M-2014 9M-2015 9M-2016
Maintenance in EUR/sqm Modernization in EUR/sqm
Capex & maintenance per sqm
16.77
14.06
20.09
Maintenance and capex will increase in the course of the year to
EUR 25-30 per sqm

» Bridge from adjusted EBITDA to profit
44
1) Adjusted for Valuation of SWAPs and convertible bonds; 2) Based on weighted average shares outstanding (9M-16: 337.44m; 9M-15: 315.27m)
in EUR m 9M 2016 9M 2015
EBITDA (adjusted) 451.4 402.2
Depreciation (4.6) (4.1)
At equity valuation 1.5 1.5
Financial result (net)1) (88.5) (96.8)
EBT (adjusted) 359.8 302.8
Valuation properties 731.3 705.0
One-offs (6.4) (83.4)
Valuation SWAP and convertible bonds (155.2) (139.0)
EBT 929.5 785.4
Current taxes (21.3) (21.0)
Deferred taxes (269.8) (242.7)
Profit 638.4 521.7
Profit attributable to the shareholders of
the parent company 618.2 500.2
Earnings per share2) 1.83 1.59
in EUR m 9M 2016 9M 2015
Interest expenses (79.3) (94.9)
In % of rents ~15% ~20%
Non-cash interest expenses (9.9) (2.5)
Interest income 0.7 0.6
Financial result (net) (88.5) (96.8)
Thereof EUR (10.9m) from valuation of derivatives and
EUR (144.3) m from convertible bonds

in EUR m 30/09/2016 31/12/2015
Investment properties 13,481.7 11,859.1
Other non-current assets 630.7 614.3
Deferred tax assets 346.4 325.5
Non current assets 14,458.8 12,798.9
Land and buildings held for sale 381.3 66.9
Trade receivables 20.5 13.4
Other current assets 127.5 159.3
Cash and cash equivalents 277.8 661.6
Current assets 807.1 901.2
Total assets 15,265.9 13,700.1
» Summary balance sheet
45
in EUR m 30/09/2016 31/12/2015
Total equity 7,315.5 6,872.0
Financial liabilities 4,466.7 3,780.4
Convertibles 1,109.2 965.4
Bonds 497.4 498.3
Tax liabilities 54.4 37.5
Deferred tax liabilities 1,396.4 1,110.2
Derivatives 60.0 44.8
Other liabilities 366.3 391.5
Total liabilities 7,950.4 6,828.1
Total equity and liabilities 15,265.9 13,700.1
Assets Equity and Liabilities
Investment properties represent ~88% of total assets
Strong balance sheet structure offering comfort throughout market cycles
> 3,000
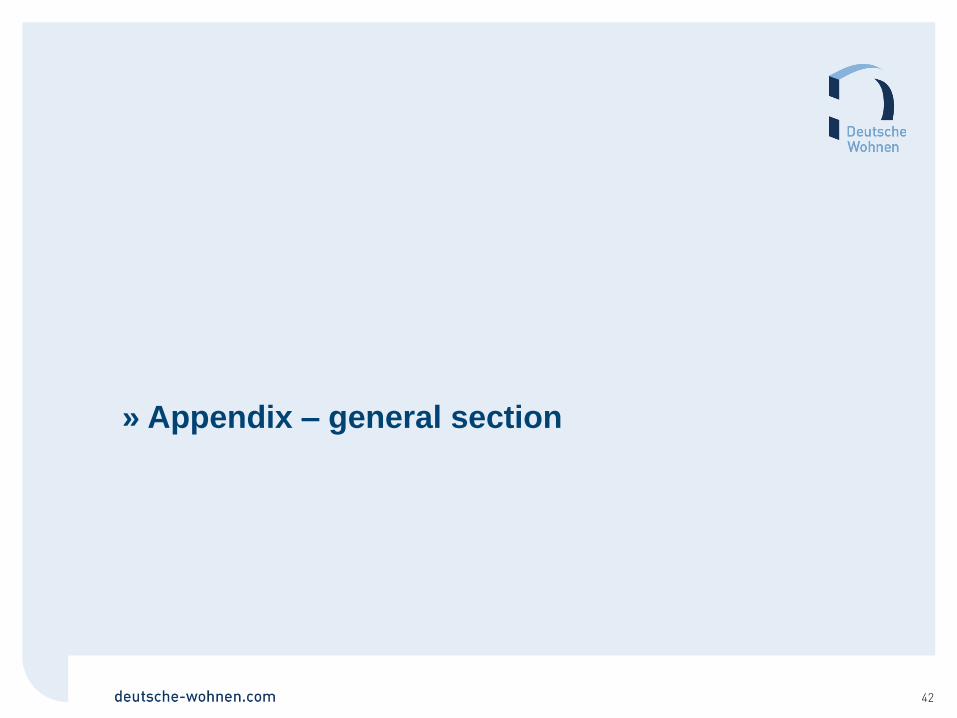
» THE BERLIN-PORTFOLIO AT A GLANCE
46
# units in-place rent (EUR/m²) vacancy > 5,000 >10,000
Reinickendorf
# 9,365 5.99 1.7%
Pankow
# 9,205 6.47 1.7%
Mitte
# 3,338 6.11 1.1%
Spandau
# 13,689 5.87 1.7%
Charlottenburg-Wilmersdorf
# 7,684 6.76 2.1%
Steglitz-Zehlendorf
# 10,927 6.42 1.9%
Tempelhof-Schöneberg
# 5,147 6.04 2.6%
Treptow-Köpenick
# 4,678 6.37 1.4%
Marzahn-Hellersdorf
# 14,875 5.35 1.1%
Lichtenberg
# 8,718 6.04 1.4%
Friedrichshain-Kreuzberg
# 7,766 5.96 2.2%
Neukölln
# 11,444 5.94 1.3%
>8,000
City of Berlin # 106,836 6.04 1.7%
Greater Berlin
# 110,776 6.04 1.7%

47
This presentation contains forward-looking statements including assumptions, opinions and views of Deutsche
Wohnen or quoted from third party sources. Various known and unknown risks, uncertainties and other factors
could cause actual results, financial positions, the development or the performance of Deutsche Wohnen to differ
materially from the estimations expressed or implied herein. Deutsche Wohnen does not guarantee that the
assumptions underlying such forward-looking statements are free from errors nor do they accept any responsibility
for the future accuracy of the opinions expressed in this presentation or the actual occurrence of the forecasted
developments. No representation or warranty (expressed or implied) is made as to, and no reliance should be
placed on, any information, including projections, estimates, targets and opinions, contained herein, and no liability
whatsoever is accepted as to any errors, omissions or misstatements contained herein, and accordingly, none of
Deutsche Wohnen AG or any of its affiliates (including subsidiary undertakings) or any of such person’s officers,
directors or employees accepts any liability whatsoever arising directly or indirectly from the use of this document.
Deutsche Wohnen does not undertake any obligation to publicly release any revisions to these forward-looking
statements to reflect events or circumstances after the date of this presentation.
» Disclaimer

Deutsche Wohnen AG
Registered Office
Pfaffenwiese 300
65929 Frankfurt/ Main
Berlin Office
Mecklenburgische Straße 57
14197 Berlin
Phone: +49 30 897 86 5413
Fax: +49 30 897 86 5419
© 2016 Deutsche Wohnen AG

![Scene SCE CAT #: LED . Surface DATE: PROJECT: TYPE€¦ · Scene SCE LED . Surface 538.5 [21.2] 602.1 [23.7] 538.5 [21.2] 241.0 [9.5] 602.1 [23.7] 301.0 [11.9] 569 [22.4] 1142.0 [45.0]](https://img.pdfslide.us/doc/110x75/5f033b387e708231d4082fa3/scene-sce-cat-led-surface-date-project-scene-sce-led-surface-5385-212.jpg)