Embed Size (px)
Citation preview

Deutsche Bank
Deutsche Bank – Q2 2017 Results
27 July 2017
Q2 2017 Results
27 July 2017
Deutsche Bank
Investor Relations
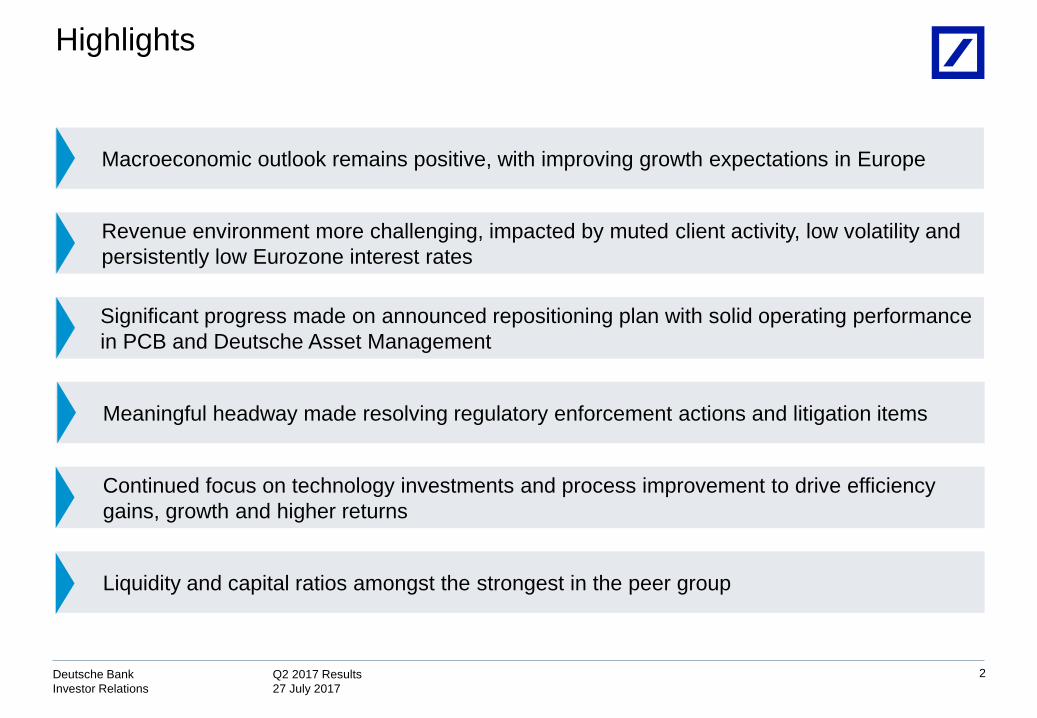
Highlights
2
Revenue environment more challenging, impacted by muted client activity, low volatility and
persistently low Eurozone interest rates
Macroeconomic outlook remains positive, with improving growth expectations in Europe
Significant progress made on announced repositioning plan with solid operating performance
in PCB and Deutsche Asset Management
Meaningful headway made resolving regulatory enforcement actions and litigation items
Continued focus on technology investments and process improvement to drive efficiency
gains, growth and higher returns
Liquidity and capital ratios amongst the strongest in the peer group

Q2 2017 Results
27 July 2017
Deutsche Bank
Investor Relations
€ bn, unless otherwise stated
Group financial summary
3
Q2 2017 Q2 2016 H1 2017 H1 2016Q2 2017 vs.
Q2 2016
H1 2017 vs.
H1 2016
Net revenues 6.6 7.4 14.0 15.5 (10)% (10)%
Provision for credit losses (0.1) (0.3) (0.2) (0.6) (70)% (62)%
Noninterest expenses (5.7) (6.7) (12.0) (13.9) (15)% (13)%
therein: Adjusted costs (1) (5.6) (6.0) (12.0) (12.7) (6)% (6)%
Restructuring and severance (0.1) (0.2) (0.1) (0.5) (54)% (75)%
Litigation 0.0 (0.1) 0.1 (0.3) n.m. n.m.
Impairments (2) (0.0) (0.3) (0.0) (0.3) (98)% (98)%
Income before income taxes 0.8 0.4 1.7 1.0 102% 72%
Net income / loss 0.5 0.0 1.0 0.3 n.m. n.m.
Post-tax return on average tangible shareholders’ equity 3.2% 0.1% 3.8% 0.9% 3.0 ppt 2.9 ppt
Post-tax return on average shareholders’ equity 2.7% 0.1% 3.2% 0.7% 2.6 ppt 2.5 ppt
Cost / income ratio 86.4% 91.0% 86.3% 90.0% (4.6)ppt (3.7)ppt
30 Jun 2017 30 Jun 2016 31 Mar 201730 Jun 2017 vs.
30 Jun 2016
30 Jun 2017 vs.
31 Mar 2017
Risk-weighted assets (CRR/CRD4, fully loaded) 355 402 358 (12)% (1)%
Common Equity Tier 1 capital (CRR/CRD4, fully loaded) (4) 50 44 42 15% 19%
Leverage exposure (CRD4) 1,443 1,415 1,369 2% 5%
Total assets IFRS 1,569 1,803 1,565 (13)% 0%
Tangible book value per share (in €) 27.24 33.38 32.00 (18)% (15)%
CET1 ratio (CRR/CRD4, fully loaded) / pro-forma (4) 14.1% 10.8% 11.8% / 14.1% 3.3 ppt 2.3 ppt
CET1 ratio (CRR/CRD4, phase-in) / pro-forma (4) 14.9% 12.2% 12.6% / 14.8% 2.7 ppt 2.3 ppt
Leverage ratio (fully loaded) / pro-forma (4) 3.8% 3.4% 3.4% / 4.0% 0.4 ppt 0.4 ppt
Profit & Loss
Metrics
Resources
Note: Figures may not sum due to rounding differences
(1) Total noninterest expenses excluding restructuring and severance, litigation, impairment of goodwill and other intangibles, policyholder benefits and claims. Please refer to the
reconciliation on slide 23 or in the financial data supplement
(2) Impairments refer to impairments of goodwill and other intangibles
(3) Q1 2017 Common Equity Tier 1 (CET1) capital revised down based on ECB guidance to reflect 100% dividend accrual and therefore no contribution from interim profits
(4) Q1 and Q2 2017 pro-forma CET1 capital, CET1 capital ratios and leverage ratios including € 8bn gross proceeds from the capital raise completed in early April. Deltas compare prior
periods with Q2 2017 pro-forma figures. See the interim report for further details
(3)

Q2 2017 Results
27 July 2017
Deutsche Bank
Investor Relations
4
228
86352
256
361
CLPDVA
(514)
Disposals
(48)
NCOU
295
Business
segments
(565)
Net income
H1 2016
Net income
H1 2017
1,041
Tax Net FX
effect
Non
operating
costs
999
272
367
Adjusted
costs
630
C&A
(680)
(348)
(332)
Revenue items € (1.5)bn
Total delta incl.
FX effects
FX effects
(2)
(3)
100 38 (3) 0 3 93 13 (0) (15)
(465) 333 (51) (514) (677) 724 1,012 352 71
Restructuring and SeveranceLitigation
Impairments
Expense items € 1.6bn
Excluding FX effects(1)
H1 2017 Net income trends € m
Pre-tax items
Other C&AOwn credit
Note: Figures may not sum due to rounding differences
(1) To exclude the FX effects the prior year figures were recalculated using the corresponding current year’s monthly FX rates
(2) Includes revenues from CIB, PCB and Deutsche AM. Excludes the impact of DVA (H1 2016 € 191m and H1 2017 € (323)m). Excludes the impact of disposals HuaXia Bank (H1 2016 €
(118)m net valuation), PCS (H1 2016 € 96m and H1 2017 € 20m), Abbey (H1 2016 € 146m and H1 2017 € 0.5m) and Asset Management India (H1 2016 € 56m)
(3) Includes impact from Policyholder benefits and claims (H1 2016 € (111)m) and the impact of disposals described in footnote 2 above

Q2 2017 Results
27 July 2017
Deutsche Bank
Investor Relations
Noninterest expenses€ bn
5
— Noninterest expenses of € 5.7bn were 14% (€
0.9bn) lower than FX-adjusted Q2 2016
— Adjusted costs declined by 5% (€ 0.3bn)
reflecting cost management efforts, run-down of
NCOU and disposals in 2016
— Q2 2016 included a € 0.3bn goodwill impairment
— Small net release of litigation reserves in Q2
2017
— Restructuring and severance € 0.1bn lower than
Q2 2016
Note: Figures may not sum due to rounding differences
(1) Total noninterest expenses excluding restructuring and severance, litigation, impairment of goodwill and other intangibles and policyholder benefits and claims
(2) To exclude the FX effects the prior year figures were recalculated using the corresponding current year's monthly FX rates
Impairments
/ Policyholder
benefits and claims
5.6
Q2 2017
5.7
Litigation
Restructuring and
severance
(14)% / €(0.9)
0.4
Q2 2016
ex FX(2)
(0.0)
0.0
Q1 2017
6.3
0.0
(0.0)
0.1
6.3
Adjusted
costs(1)
0.10.2
0.30.1
6.6
0.2
6.7
6.06.0
Q2 2016
as reported

Q2 2017 Results
27 July 2017
Deutsche Bank
Investor Relations
Adjusted costs(1)
€ m
6
Note: Figures may not sum due to rounding differences.
(1) Total noninterest expense excluding restructuring and severance, litigation, impairment of goodwill and other intangibles and policyholder benefits and claims
(2) To exclude the FX effects the prior year figures were recalculated using the corresponding current year's monthly FX rates
(3) Includes furniture and equipment
(4) Includes deposit protection guarantee schemes
(5) Internal full time equivalents at period end
Q2 2017Q2 2016
ex FX(2)YoY Q1 2017 QoQ
Compensation and
benefits2,890 2,906 (1)% 3,104 (7)%
IT costs 927 961 (4)% 933 (1)%
Professional service
fees431 551 (22)% 419 3%
Occupancy(3) 449 451 (0)% 449 (0)%
Bank levy(4) 85 49 73% 600 (86)%
Other 859 1,041 (17)% 830 3%
Adjusted costs 5,641 5,958 (5)% 6,336 (11)%
Headcount(5) 96,652 101,307 (5)% 98,177 (2)%
— Compensation and benefits costs broadly flat. Lower salary
expense partially offset by higher accruals for variable
compensation
— IT costs down 4% with higher depreciation for self developed
software more than offset by lower costs for external IT
development and maintenance services
— Professional service fees down 22% mainly driven by lower
business consulting
— Bank levy and deposit protection costs increased due to one-
time refunds in Q2 2016
— Other costs were down 17% on NCOU closure, disposals and
cost management measures
— Headcount down by 4,656 in the past 12 months, and 1,525 in
Q2 2017

Q2 2017 Results
27 July 2017
Deutsche Bank
Investor Relations
Common Equity Tier 1 Capital and Risk-weighted assets (RWA)CRD4, fully loaded unless otherwise stated, € bn
7
Note: Figures may not sum due to rounding differences
(1) Q1 2017 CET1 capital revised down based on recent ECB guidance to reflect 100% dividend accrual and therefore no contribution from interim profits
(2) Dividend accrual based on ECB guidance on recognition of interim profits in CET1 capital, i.e. based on the 100% payout ratio as the highest of dividend calculated in accordance with
internal dividend policy, dividend based on the average payout ratio over the past three years and dividend based on the previous year’s payout ratio (100% for 2016)
(3) € 0.6bn other, including € 0.2bn reversal of DVA/FVO losses in CET1 capital, € 0.2bn actuarial gains and pensions and € 0.1bn lower deductions from additional valuation adjustments
and expected loss shortfall
(4) Q2 2017 CET1 capital and capital ratios pro-forma, including € 8bn gross proceeds from the capital raise completed in early April. Please refer to the interim report for ratios excluding
the capital raise and further details
— Q2 2017 CET1 capital at € 50.1bn, including € 8bn gross
proceeds from the capital raise and € 0.2bn from
reversal of 10% threshold deduction for DTA
— Q2 2017 RWA significantly impacted by USD weakening
— Excluding FX, RWA increased by € 4bn:
— € 3bn higher credit risk RWA primarily due to
counterparty credit risk model change in CIB and
PCB business growth
— € 1bn market risk RWA increase from higher
securitization inventory and slightly increased
Stressed VaR levels
— € 1bn uptick in operational risk RWA mainly from
loss history updates
CET1 ratio, phase-in
CET1 ratio, fully loaded
14.9%
14.1%
13
0
PCB
0
(6)
CIB30 Mar
2017
358
355
FX EffectC&A 30 Jun
2017
DeAM
CET1
RWA
11.8%
12.6%
(0.7)
Other(3)Net
Income
31 Mar
2017(1)
Capital
raise
0.2
8.2
30 Jun
2017(4)
42.2
(0.1)
Equity
Comp
50.1
(0.6)
8.0
FX Effect
0.60.4
Dividend
accrual &
AT1 coupon(2)

Q2 2017 Results
27 July 2017
Deutsche Bank
Investor Relations
LeverageCRD4, fully loaded unless otherwise stated, € bn
8
— Leverage exposure up € 73bn, including FX effect of € (45)bn.
FX neutral increase is € 119bn
— Drivers of QoQ increase are a change to the reporting of
pending settlements € 64bn and growth in cash € 52bn
— ECB provided new guidance requiring pending
settlements to be reported on a gross basis in line with
the IFRS accounting value. Previously, DB reported
pending settlements on a net basis comparable with US
GAAP broker dealer and draft CRR2 rules. Under CRR2
DB expects to revert back to a net reporting basis
— Cash increase as a result of capital raise proceeds and
deposit inflows31 Mar 2017 30 Jun 2017
QoQ
ex-FX(5)
Of which
pending
settlements(4)
CIB 979 1,079 134 63
PCB 342 346 6 0
AM 3 3 0 0
C&A 44 15 (21) 0
Total 1,369 1,443 119 64
Leverage ratio, fully loaded
Leverage ratio, phase-in
3.8%(2)
4.2%
Note: Figures may not sum due to rounding differences
(1) Q1 2017 T1 capital revised down based on recent ECB guidance to reflect 100% dividend accrual and therefore no contribution from interim profits
(2) Based on fully loaded pro-forma Tier 1 Capital of € 54.7bn, which includes € 4.6bn of Additional Tier 1 Capital
(3) Q2 2017 leverage ratio pro-forma including € 8bn gross proceeds from the capital raise completed in early April. Please refer to the interim report for ratios excluding the capital raise
and further details
(4) Impact from reporting unsettled regular-way asset purchases and sales on gross basis in line with the IFRS accounting value starting Q2 2017
(5) QoQ change including the impact of FX of € 73bn, of which € 99bn CIB, € 4bn PCB, € 0bn AM, € (29)bn C&A
31 Mar
2017
1,369
30 Jun
2017(3)
Other
64
252
Pending
settlements(4)
FX
effect
1,443
Cash
(45)
3.4%(1)
3.9%(1)
Leverage exposure

Q2 2017 Results
27 July 2017
Deutsche Bank
Investor Relations
9
Segment results

Q2 2017 Results
27 July 2017
Deutsche Bank
Investor Relations
10
— New structure combines the former “Global Markets” and
“Corporate & Investment Banking” segments
— New CIB comprises Sales & Trading, Global Transaction
Banking, Origination and Advisory and Financing businesses
— Financing includes:
— Certain activities previously reported in ‘Sales &
Trading debt and other products’ and Loan products
— Generally more stable revenues where the business
objective is to hold assets rather than originate to sell
or manage in the trading book
Note: Figures may not sum due to rounding differences
(1) Trade Finance & Cash Management Corporates, Institutional Cash & Securities Services
(2) Loan products & other
(3) Other mostly reflects DVA
15%
31%
15%
16%
27%
Origination &
Advisory
Debt S&T
Equity S&T
Global
Transaction
Banking
Origination &
Advisory
Financing
FIC S&T
Equity S&T
Old CIB/GM New CIBQ2 2017 as % of
total CIB
(4)%(8)%
15%
47%
16%
3%
27%
Other (GM)(3) Other (CIB)(3)
Corporate & Investment Bank (CIB)Q2 2017 revenues, € m
56%
44%
Loan products(2)
Global
Transaction
Banking(1)

Q2 2017 Results
27 July 2017
Deutsche Bank
Investor Relations
Income before income taxes Financial overview
Q2 2017 Q2 2016 YoY H1 2017 H1 2016 YoY
Net revenues 3,618 4,321 (16)% 8,026 8,960 (10)%
Prov. for credit losses (56) (155) (64)% (113) (305) (63)%
Noninterest expenses (3,000) (3,705) (19)% (6,642) (7,461) (11)%
Adjusted costs (2,992) (3,169) (6)% (6,600) (6,808) (3)%
CIR 83% 86% (3)ppt 83% 83% (1)ppt
IBIT 543 460 18% 1,249 1,170 7%
RWA (1) 242 255 (5)% 242 255 (5)%
Post-tax RoE (2) 3.2% 3.1% 0 ppt 3.9% 3.9% (0)ppt
Post-tax RoTE (3) 3.5% 3.4% 0 ppt 4.2% 4.2% (0)ppt
2016 2017
DVA
202 (11) 47 (212) (219) (104) 191 (323)
Restructuring and severance
(186) (109) (66) (31) (61) (80) (294) (141)
Litigation_alt
68 (141) (342) (192) 27 78 (73) 105
Impairments
0 (285) 0 0 0 (6) (285) (6)
2016 2017
710
460
970
(432)
706
543
1,170 1,249
Q1 Q2 Q3 Q4 Q1 Q2 H1 H1
11
Note: Figures may not sum due to rounding differences
(1) Fully loaded, in € bn
(2) Based on average allocated shareholders’ equity
(3) Based on average allocated tangible shareholders’ equity
― Q2 2017 IBIT increased 18% YoY as lower non interest expenses
and credit losses more than offset the decline in revenues
― Q2 2017 revenues were down 14% excluding the impact of DVA
― Provisions for credit losses were lower YoY mainly due to
broad-based improvement in credit performance
― Noninterest expenses declined 19% YoY due to a goodwill
impairment in the prior year period and lower litigation provisions.
Adjusted costs declined 6% YoY
― RWA decreased 5% YoY reflecting de-risking and FX movements,
partially offset by higher operational risk RWA and the impact of the
NCOU asset transfers
Corporate & Investment Bank (CIB)€ m

Q2 2017 Results
27 July 2017
Deutsche Bank
Investor Relations
Revenues Q2 2017 YoY revenue drivers
Global Transaction Banking
Origination & Advisory
Financing
2016 20172016 2017
509 606 621 556 657 563
1,116 1,220
Q1 Q2 Q3 Q4 Q1 Q2 H1 H1
(7)%
1,101 1,104 1,130 1,085 1,041 975
2,2052,015
Q1 Q2 Q3 Q4 Q1 Q2 H1 H1
(12)%
581 582 574 618 555 554
1,163 1,109
Q1 Q2 Q3 Q4 Q1 Q2 H1 H1
(5)%
12
CIB business unit revenues and YoY drivers€ m
― GTB revenues were impacted by a change in the method and
allocation for funding costs implemented in Q2 2017
― Cash management revenues were slightly lower, as recent US
dollar interest rate increases offset the negative impact of client and
product perimeter reductions in 2016
― Trade revenues were lower driven by margin pressure
― Trust, Agency and Securities Services were essentially flat, as lower
transaction volumes due to client and country exits were partly
offset by US dollar interest rate increases
― Debt Origination revenues were 24% lower YoY compared to a
strong prior year quarter reflecting lower client activity in the US
― Equity Origination revenues were 7% lower YoY reflecting a slow
down in industry volumes after a very strong Q1 2017
― Advisory revenues were 91% higher compared to a weak prior year
quarter
― Financing revenues were 5% lower YoY with good performance
across asset-based lending and commercial real estate offset by
lower investment grade lending revenues
Q2 2017 Results
27 July 2017
Deutsche Bank
Investor Relations
Revenues Q2 2017 YoY revenue drivers
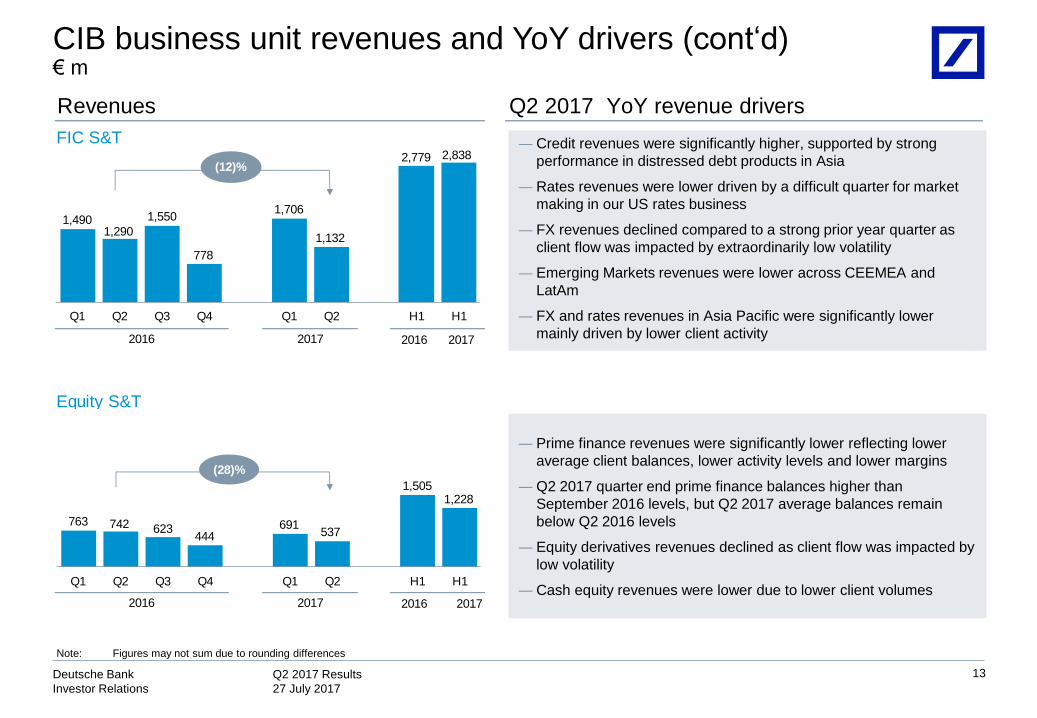
FIC S&T
2016 2017
Equity S&T
2016 2017
2016 2017
2016 2017
763 742 623444
691537
1,5051,228
Q1 Q2 Q3 Q4 Q1 Q2 H1 H1
(28)%
1,4901,290
1,550
778
1,706
1,132
2,779 2,838
Q1 Q2 Q3 Q4 Q1 Q2 H1 H1
(12)%
13
CIB business unit revenues and YoY drivers (cont‘d)€ m
― Credit revenues were significantly higher, supported by strong
performance in distressed debt products in Asia
― Rates revenues were lower driven by a difficult quarter for market
making in our US rates business
― FX revenues declined compared to a strong prior year quarter as
client flow was impacted by extraordinarily low volatility
― Emerging Markets revenues were lower across CEEMEA and
LatAm
― FX and rates revenues in Asia Pacific were significantly lower
mainly driven by lower client activity
― Prime finance revenues were significantly lower reflecting lower
average client balances, lower activity levels and lower margins
― Q2 2017 quarter end prime finance balances higher than
September 2016 levels, but Q2 2017 average balances remain
below Q2 2016 levels
― Equity derivatives revenues declined as client flow was impacted by
low volatility
― Cash equity revenues were lower due to lower client volumes
Note: Figures may not sum due to rounding differences

Q2 2017 Results
27 July 2017
Deutsche Bank
Investor Relations
Income before income taxes Financial overview
Q2 2017 Q2 2016 YoY H1 2017 H1 2016 YoY
Net revenues 2,558 2,764 (7)% 5,261 5,362 (2)%
Prov. for credit losses (22) (101) (78)% (100) (179) (44)%
Noninterest expenses (2,226) (2,296) (3)% (4,452) (4,631) (4)%
Adjusted costs (2,169) (2,171) (0)% (4,434) (4,428) 0%
CIR 87% 83% 4 ppt 85% 86% (2)ppt
IBIT 310 367 (15)% 710 552 29%
Invested assets (1) 500 552 (10)% 500 552 (10)%
Post-tax RoE (2) 5.5% 7.0% (2)ppt 6.5% 5.2% 1 ppt
Post-tax RoTE (3) 6.3% 8.1% (2)ppt 7.5% 6.1% 1 ppt
2016 2017
Restructuring and severance
(71) (70) 1 (66) 36 (9) (141) 27
Litigation
(8) (55) 4 3 3 (48) (63) (45)
Hua Xia Bank IBIT
(124) 5 (21) 756 (0) (1) (119) (1)
Memo: Private Client Services (PCS) revenues
48 48 81 (16) 18 2 96 20
2016 2017
184
367
187
700
400
310
552
710
Q1 Q2 Q3 Q4 Q1 Q2 H1 H1
14
Private & Commercial Bank (PCB)€ m
Note: Figures may not sum due to rounding differences
(1) In € bn; comparison with Q2 2016 impacted by PCS deconsolidation effect of € (37)bn in Q3 2016
(2) Based on average allocated shareholders’ equity
(3) Based on average allocated tangible shareholders’ equity
― Q2 2017 IBIT fell 15% YoY mainly driven by the absence of gains on
the sale of VISA Europe shares in Q2 2016 (€ 192m)
― Excluding this impact and the reduced revenue base after the sale of
the PCS unit in Q3 2016, Q2 2017 revenues were broadly flat despite
the continued negative impact from low interest rates
― Provision for credit losses benefited from releases and selective
portfolio sales in a continued benign economic environment
― Noninterest expenses declined driven by lower restructuring and
severance charges, lower cost base after the PCS sale and reduced
headcount
― In line with implementation plans, 177 out of 188 branches closed in
PCC Germany

Q2 2017 Results
27 July 2017
Deutsche Bank
Investor Relations
Revenues Q2 2017 YoY revenue drivers
Private & Commercial Clients(1)
(PCC)
Postbank
Wealth Management
2016 20172016 2017
861 903 779 824 771 726
1,7641,498
Q1 Q2 Q3 Q4 Q1 Q2 H1 H1
(20)%
1,363 1,365 1,264 1,228 1,298 1,305
2,7282,603
Q1 Q2 Q3 Q4 Q1 Q2 H1 H1
(4)%
498 490 497 396634 526
988 1,159
Q1 Q2 Q3 Q4 Q1 Q2 H1 H1
7%
15
PCB business unit revenues and YoY drivers€ m
(1) Excludes revenues from Hua Xia Bank: Q1 2016 € (124)m, Q2 2016 € 6m, Q3 2016 € (20)m, Q4 2016 € 756m and H1 2016 € (118)m
― Revenues down 4% mainly due to the impact from the Q2 2016
VISA Europe share sale of € 88m partially offset by a small gain
on sale in the recent quarter
― Excluding these items, revenues were flat: impact of low interest
rate environment on deposit products largely mitigated across
other product categories including higher fee income from
investment products
― Revenues down 20% due to the termination of legacy Trust
Preferred Securities with an impact of € (118)m and the non-
recurrence of the Q2 2016 gain from VISA Europe sale of € 104m
― Excluding these effects, operating revenues increased driven by
loan products and higher fee income from current accounts and
investment products
― Revenues up 7% benefiting from € 135m impact from the workout
of legacy positions in Sal. Oppenheim (benefit partially reflected in
net interest income), which more than offset the PCS
deconsolidation effect
― Excluding these items, revenues below prior year mainly due to
lower net interest income reflecting a lower deposit base and the
impact of selective loan sales

Q2 2017 Results
27 July 2017
Deutsche Bank
Investor Relations
Income before income taxes Financial overview
Q2 2017 Q2 2016 YoY H1 2017 H1 2016 YoY
Net revenues ex Abbey
Life gross-up (1) 676 634 7% 1,283 1,281 0%
Prov. for credit losses 0 (0) n.m. 0 (1) n.m.
Noninterest expenses ex
Abbey Life gross-up (2)(442) (461) (4)% (868) (945) (8)%
Adjusted costs (438) (427) 3% (861) (887) (3)%
CIR (3) 65% 76% (11)ppt 68% 76% (9)ppt
IBIT 234 170 38% 414 331 25%
Invested assets (4) 711 719 (1)% 711 719 (1)%
Net new money (4) 6 (9) n.m. 11 (20) n.m.
Post-tax RoE (5) 13.5% 7.6% 6 ppt 11.7% 7.4% 4 ppt
2016 2017 Post-tax RoTE (6) 62.3% 46.2% 16 ppt 57.1% 43.1% 14 ppt
Restructuring and severance
(23) (34) (9) (2) (4) (4) (58) (8)
Litigation_alt
(1) (0) 0 1 1 (0) (1) 1
Impairments
0 0 0 (1,021) 0 0 0 0
2016 2017
161 170214
(754)
180234
331414
Q1 Q2 Q3 Q4 Q1 Q2 H1 H1
1,021
€ m
Deutsche Asset Management
16
Impairments
― Q2 2017 IBIT increased 38% YoY on higher revenues and lower
costs
― Revenues rose 7% YoY (ex. Abbey Life gross-up) led by higher
Alternatives performance fees and higher management fees
reflecting improved market conditions
― Non-interest expenses (ex. Abbey Life gross-up) down 4% YoY
driven by lower restructuring and severance. Adjusted costs rose 3%
YoY on higher compensation expense
― Net new asset inflows of € 5.7bn driven by Passive and Active,
especially in Germany, partly offset by outflows in the Americas
mostly from liquidity productsNote: Figures may not sum due to rounding differences
(1) Net revenues ex mark to market movements on policyholder positions in Abbey Life. Reported revenues: Q2 2017 € 676m, Q2 2016 € 705m, H1 2017 € 1,283m, and H1 2016 €1,395m
(2) Noninterest expenses ex policyholder positions in Abbey Life. Reported noninterest expenses: Q2 2017 € (442)m, Q2 2016 € (535)m, H1 2017 € (868)m and H1 2016 €(1,063)m
(3) Cost income ratio (CIR) is calculated based on reported revenues and reported noninterest expenses
(4) In €bn
(5) Based on average allocated shareholders’ equity
(6) Based on average allocated tangible shareholders’ equity

Q2 2017 Results
27 July 2017
Deutsche Bank
Investor Relations
Income before income taxes Financial overview
Q2 2017 Q2 2016 YoY H1 2017 H1 2016 YoY
IBIT (265) 42 n.m. (672) 99 n.m.
of which :
V&T differences(1) (3) 71 n.m. (190) 243 n.m.
CTA realisation(2) / loss
on sale(164) (10) n.m. (167) (10) n.m.
Funding and liquidity 20 (9) n.m. (96) 1 n.m.
Remaining (118) (10) n.m. (219) (135) 63%
2016 2017
Litigation_alt
(5) 72 0 (49) (0) (4) 67 (4)
20172016
57 42
(215)
(425)(407)
(265)
99
(672)
Q1 Q2 Q3 Q4 Q1 Q2 H1 H1
Consolidation & Adjustments (C&A)€ m
17
Note: Figures may not sum due to rounding differences
(1) Valuation and Timing (V&T) reflects the mismatch in revenue from financial instruments accounted for at amortized cost (non-mark-to-market) under IFRS that are economically hedged
with derivatives that are accounted for on a mark-to-market basis. In addition, it includes own credit risk related valuation effects of the group’s own debt measured at fair value
(2) CTA: Currency translation adjustment
― Q2 2017 loss in C&A includes € 164m of realized currency
translation adjustments and the loss on sale related to the disposal
of Deutsche Bank’s subsidiaries in Argentina and Uruguay
― V&T differences include approximately € 75m of charges for the
tightening of DB’s own credit spreads, offset by gains on interest
related items
― Funding and liquidity represents the residual after allocation of
treasury costs to the businesses
― Remaining includes a number of items including the taxable
equivalent gross-up on municipal bond holdings and some fees
associated with the rights offering. The YoY change is largely
related to an insurance recovery of € 73m realized in Q2 2016

Q2 2017 Results
27 July 2017
Deutsche Bank
Investor Relations
Outlook 2017
18
Improving economic outlook in Europe coupled with low volatility and persistent low interest
rates
Prior guidance on restructuring unchanged – increased expense likely in H2 2017
Continue to manage adjusted costs towards € ~22bn 2018 target
Litigation remains difficult to forecast but expected to be higher in H2 2017
Credit loss provisions likely to increase in the second half after an unusually low
H1 2017

Q2 2017 Results
27 July 2017
Deutsche Bank
Investor Relations
19
Appendix

Q2 2017 Results
27 July 2017
Deutsche Bank
Investor Relations
Appendix: Table of Contents
20
26P&L details
36CRD4 – Leverage Exposure and Risk Weighted Assets
37Loan book
38Impaired loans
39Value-at-Risk
Invested assets 40
Headcount 42

Q2 2017 Results
27 July 2017
Deutsche Bank
Investor Relations
Litigation update€ bn
21
Litigation reserves Contingent liabilities
— Further progress in resolving legacy matters:
• BSA/AML settlement reached with the Fed
• RMBS-Maryland AG settlement finalized
— Decrease due to settlement payments for major matters
— EUR 0.3bn of the remaining reserves reflect already achieved
settlements or settlement-in-principle
— Includes possible obligations where an estimate can be made
and outflow is more than remote but less than probable for
significant matters
— Decrease mainly driven by reclassifications to reserves and
corresponding cancellations of contingent liabilities
3.2
2.5
31 Mar 2017 30 Jun 2017
2.4
1.8
31 Mar 2017 30 Jun 2017

Q2 2017 Results
27 July 2017
Deutsche Bank
Investor Relations
Provision for credit losses€ m
22
2017
Note: Figures may not sum due to rounding differences. Provisions credit losses in the Consolidation & Adjustments and Deutsche Asset Management segments are not shown on this chart
but are included in the DB Group totals
(1) Provision for credit losses annualized as a % of total loan book
2016
150 155208
303
78101
102
158
78
5657
75
31
0.05%
0.30%
0.15%
0.10%
0.20%
0.25%
0.00%
0.35%
Q3
327
0.13%
0.33%
492
Q4
304
5
133
0.26%
Q1 Q2
259
0.28%
Q2
22
Q1
0.11%
0.28%
17
79
CIBNon-Core Operations Unit PCBCost of risk DB Group(1)
Q2 2017 Results
27 July 2017
Deutsche Bank
Investor Relations
23
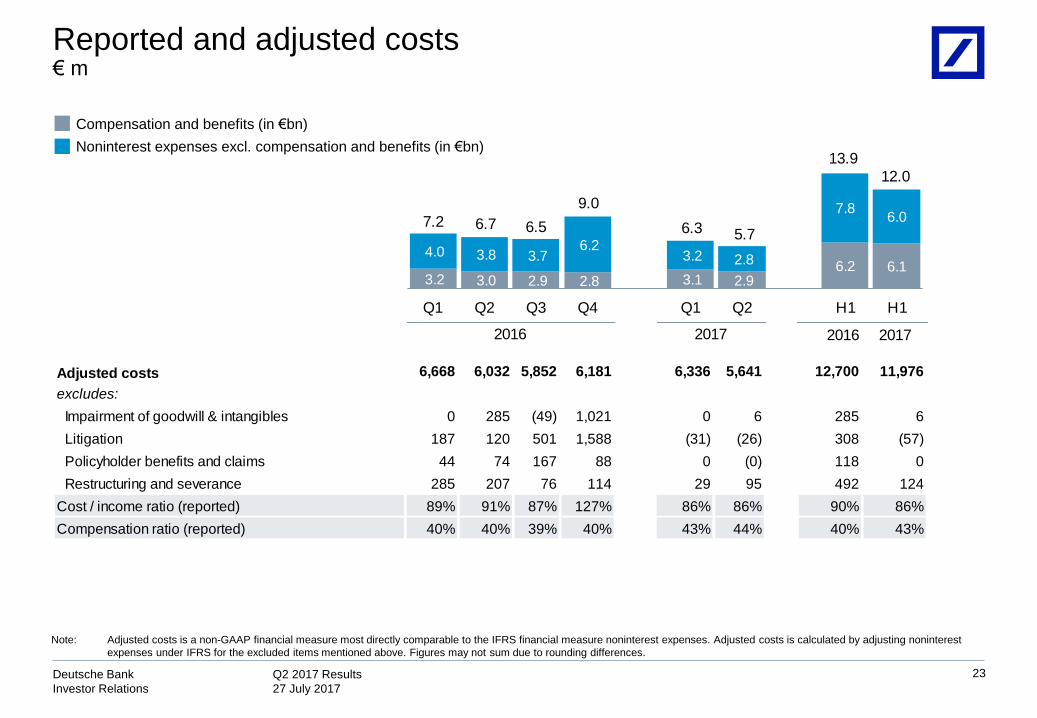
Reported and adjusted costs€ m
Note: Adjusted costs is a non-GAAP financial measure most directly comparable to the IFRS financial measure noninterest expenses. Adjusted costs is calculated by adjusting noninterest
expenses under IFRS for the excluded items mentioned above. Figures may not sum due to rounding differences.
2016 2017
Adjusted costs 6,668 6,032 5,852 6,181 6,336 5,641 12,700 11,976
excludes:
Impairment of goodwill & intangibles 0 285 (49) 1,021 0 6 285 6
Litigation 187 120 501 1,588 (31) (26) 308 (57)
Policyholder benefits and claims 44 74 167 88 0 (0) 118 0
Restructuring and severance 285 207 76 114 29 95 492 124
Cost / income ratio (reported) 89% 91% 87% 127% 86% 86% 90% 86%
Compensation ratio (reported) 40% 40% 39% 40% 43% 44% 40% 43%
2016 2017
3.2 3.0 2.9 2.8 3.1 2.9 6.2 6.1
4.0 3.8 3.7 6.2
3.2 2.8
7.86.07.2 6.7 6.5
9.0
6.3 5.7
13.9
12.0
Q1 Q2 Q3 Q4 Q1 Q2 H1 H1
Compensation and benefits (in €bn)
Noninterest expenses excl. compensation and benefits (in €bn)

Q2 2017 Results
27 July 2017
Deutsche Bank
Investor Relations
Net Interest Income sensitivityHypothetical +100bps parallel shift impact by business line and major currency, € bn
Note: All estimates are based on a static balance sheet, excluding trading positions & Deutsche AM and at constant exchange rates. The parallel yield curve shift by +100 basis points
assumes an immediate increase of all interest rate tenors and no additional management action. Short term is calculated based on applying the shock only to tenors up to and
including 3 months. The delta NII shown is the difference between projected NII in the scenario with shifted rates vs unchanged rates. Figures do not include MtM/OCI effects on
centrally managed positions not eligible for hedge accounting.
EU
RU
SD
1.2
0.8
0.4
0.6
≤ 3
M>
3M
0.60.7
0.8
≤ 3
M>
3M
1.5
0.9
0.6
≤ 3
M>
3M
0.3
0.2
0.10.2
0.1
≤ 3
M>
3M
0.4
0.3
0.10.3
0.1
PCB CIB Group
0.7 0.8 1.5
24
PCB CIB Group
1.0 0.9 1.9
First year Second year
Total (EUR
+ USD)

Q2 2017 Results
27 July 2017
Deutsche Bank
Investor Relations
Indicative currency mixGroup net revenues / noninterest expenses, Q2 2017, %
(1) Other primarily includes Singapore Dollar, Indian Rupee, Hong Kong Dollar and Swiss Franc
25
EUR
GBP
USD
Other(1)
Net revenues
14% 15%
26% 20%
57% 48%
17%3%
— The information presented has been
classified based primarily on the currency
of the Group’s office in which the
revenues or non interest expenses are
recorded
Total noninterest expenses

Q2 2017 Results
27 July 2017
Deutsche Bank
Investor Relations
Q2 2017
IBIT DVA and own credit
spreadsRestructuring and severance Litigation Impairments Adjusted IBIT
CIB 543 (104) (80) 78 (6) 655
PCB 310 0 (9) (48) 0 367
Deutsche AM 234 0 (4) (0) 0 238
C&A (265) (75) (1) (4) 0 (184)
NCOU - - - - - -
Group 822 (179) (95) 26 (6) 1,075
Q2 2016
IBIT DVA and own credit
spreadsRestructuring and severance Litigation Impairments Adjusted IBIT
CIB 460 (11) (109) (141) (285) 1,006
PCB 367 0 (70) (55) 0 492
Deutsche AM 170 0 (34) (0) 0 204
C&A 42 (32) 7 72 0 (6)
NCOU (632) 0 (1) 5 0 (635)
Group 408 (43) (207) (120) (285) 1,063
€ m
IBIT detail
26
Note: Figures may not sum due to rounding differences

Q2 2017 Results
27 July 2017
Deutsche Bank
Investor Relations
H1 2017
IBIT DVA and own credit
spreadsRestructuring and severance Litigation Impairments Adjusted IBIT
CIB 1,249 (323) (141) 105 (6) 1,613
PCB 710 0 27 (45) 0 728
Deutsche AM 414 0 (8) 1 0 421
C&A (672) (190) (1) (4) 0 (476)
NCOU - - - - - -
Group 1,701 (513) (124) 57 (6) 2,286
H1 2016
IBIT DVA and own credit
spreadsRestructuring and severance Litigation Impairments Adjusted IBIT
CIB 1,170 191 (294) (73) (285) 1,632
PCB 552 0 (141) (63) 0 755
Deutsche AM 331 0 (58) (1) 0 389
C&A 99 142 8 67 0 (118)
NCOU (1,165) 0 (7) (238) 0 (920)
Group 987 333 (492) (308) (285) 1,739
€ m
IBIT detail
27
Note: Figures may not sum due to rounding differences

Q2 2017 Results
27 July 2017
Deutsche Bank
Investor Relations
€ m, unless otherwise stated
Post-tax RoTE
28
Note: Post-tax return on average tangible shareholders’ equity is calculated as net income (loss) attributable to Deutsche Bank shareholders as a percentage of average tangible
shareholders’ equity. Net income (loss) attributable to Deutsche Bank shareholders is defined as net income (loss) excluding post-tax income (loss) attributable to noncontrolling
interests. At the Group this level reflects the reported effective tax rate for the Group, which was 43% for the three months ended June 30, 2017 and 95% for the prior year’s comparative
period. The tax rate was 39% for the six months ended June 30, 2017 and 74% for the prior year’s comparative period
(1) For the post-tax return on average shareholders’ equity and average tangible shareholders’ equity of the segments, the applied tax rates were 33% for all reported periods in 2017 and
35% for all reported periods in 2016
Q2 2017 Q2 2016 Q2 2017 Q2 2016 Q2 2017 Q2 2016 Q2 2017 Q2 2016 Q2 2017 Q2 2016 Q2 2017 Q2 2016
IBIT 543 460 310 367 234 170 - (632) (265) 42 822 408
Taxes (1) 179 159 102 127 77 59 - (219) (2) 261 357 388
Net income 364 301 208 240 157 111 - (413) (263) (219) 466 20
Noncontrolling interest 0 0 0 0 0 0 - 0 (19) (2) (19) (2)
Net income DB shareholders 364 301 208 240 157 111 - (413) (281) (221) 447 18
Average allocated shareholder's equity 45,190 38,556 15,228 13,632 4,649 5,813 - 4,023 (54) (12) 65,013 62,011
Average goodwill and other intangibles 3,242 2,811 2,090 1,834 3,644 4,851 - 542 (44) (37) 8,930 10,001
Average allocated tangible shareholders' equity 41,948 35,745 13,139 11,797 1,005 962 - 3,482 (10) 25 56,082 52,011
Post-tax RoE (in %) 3.2 3.1 5.5 7.0 13.5 7.6 - n.m. n.m. n.m. 2.7 0.1
Post-tax RoTE (in %) 3.5 3.4 6.3 8.1 62.3 46.2 - n.m. n.m. n.m. 3.2 0.1
H1 2017 H1 2016 H1 2017 H1 2016 H1 2017 H1 2016 H1 2017 H1 2016 H1 2017 H1 2016 H1 2017 H1 2016
IBIT 1,249 1,170 710 552 414 331 - (1,165) (672) 99 1,701 987
Taxes (1) 412 405 234 191 137 115 - (403) (123) 424 660 731
Net income 837 765 476 361 277 216 - (762) (549) (324) 1,041 256
Noncontrolling interest 0 0 0 0 0 0 - 0 (23) (24) (23) (24)
Net income DB shareholders 837 765 476 361 277 216 - (762) (572) (349) 1,018 232
Average allocated shareholder's equity 43,055 38,923 14,684 13,832 4,720 5,864 - 3,776 314 (3) 62,773 62,393
Average goodwill and other intangibles 3,275 2,738 2,072 1,943 3,748 4,859 - 563 (150) (67) 8,945 10,036
Average allocated tangible shareholders' equity 39,780 36,186 12,612 11,889 972 1,005 - 3,212 464 65 53,828 52,357
Post-tax RoE (in %) 3.9 3.9 6.5 5.2 11.7 7.4 - n.m. n.m. n.m. 3.2 0.7
Post-tax RoTE (in %) 4.2 4.2 7.5 6.1 57.1 43.1 - n.m. n.m. n.m. 3.8 0.9
C&A GroupCIB PCB Deutsche AM NCOU
Q2 2017 Results
27 July 2017
Deutsche Bank
Investor Relations
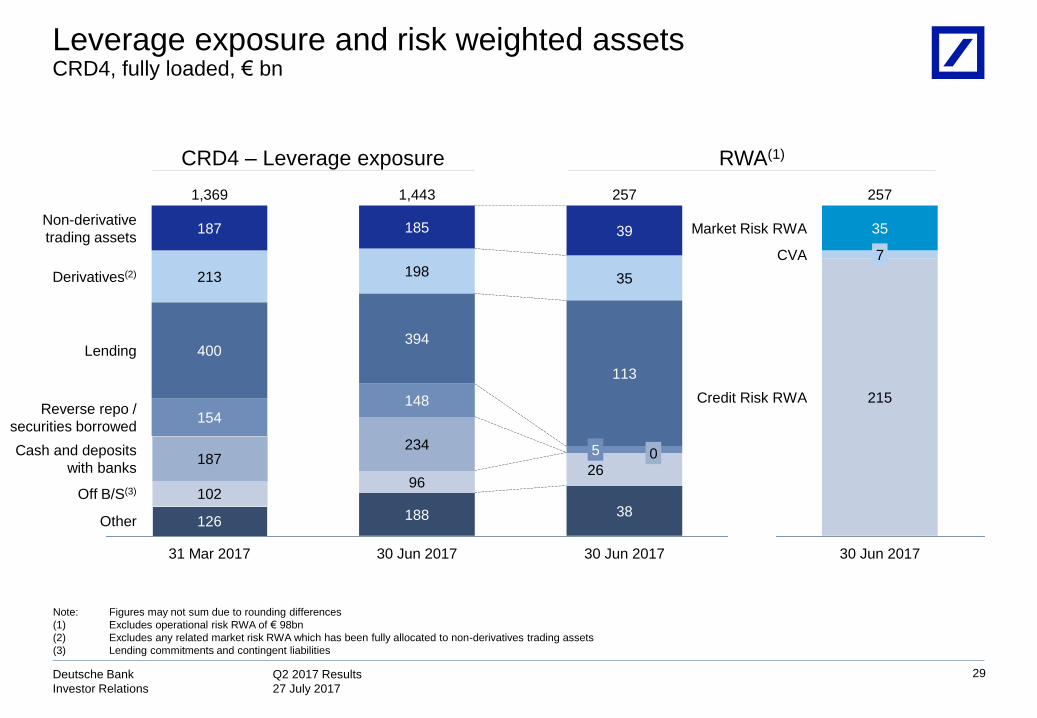
Leverage exposure and risk weighted assetsCRD4, fully loaded, € bn
29
6464
Note: Figures may not sum due to rounding differences
(1) Excludes operational risk RWA of € 98bn
(2) Excludes any related market risk RWA which has been fully allocated to non-derivatives trading assets
(3) Lending commitments and contingent liabilities
Credit Risk RWA
CVA
Market Risk RWA
30 Jun 2017
257
215
7
35
257
38
2605
113
35
39
30 Jun 2017
1,443
188
96
234
148
394
198
31 Mar 2017
1,369
126
102
187
154
400
213
187Non-derivative
trading assets
30 Jun 2017
185
Derivatives(2)
Lending
Reverse repo /
securities borrowed
Cash and deposits
with banks
Other
Off B/S(3)
CRD4 – Leverage exposure RWA(1)

Q2 2017 Results
27 July 2017
Deutsche Bank
Investor Relations
30
Loan book€ bn
Note: Loan amounts are gross of allowances for loan losses. Figures may not sum due to rounding differences.
2016 2017
104 105 105 105
43 44 43 40
119 119 120 119
154 158 154145
NCOU
PB
WM
PCC
CIB
31-Dec
413
3
30-Sep
428
5
30-Jun
433
6
31-Mar
429
8
121 121
106105
3940
137147
30-Jun
403414
31-Mar

Q2 2017 Results
27 July 2017
Deutsche Bank
Investor Relations
Impaired loans(1)
Period-end, € bn
31
Note: Figures may not sum due to rounding differences
(1) IFRS impaired loans include loans which are individually impaired under IFRS, i.e. for which a specific loan loss allowance has been established, as well as loans collectively assessed
for impairment which have been put on nonaccrual status
(2) Total on-balance sheet allowances divided by IFRS impaired loans (excluding collateral); total on-balance sheet allowances include allowances for all loans individually impaired or
collectively assessed
(3) Impaired loans in % of total loan book
2016 2017
61% 61% 61% 61%
1.60%
0.80%
1.20%
1.40%
0.60%
1.00%
1.80%
2.00%
2.20%
2.40%
0.40%
0.20%
0.00%
3.5
1.3
Q1
7.6
3.0
3.6
2.9
Q2
6.9
4.0
Q4Q3
0.8
2.4
3.6
1.6
7.5
2.8
3.6
1.1
2.8
3.8
7.4
Q1
7.4
6.7
Q2
2.6
Impaired loan ratio Deutsche Bank Group(3) CIBPCBNon-Core Operations Unit
64% 64% 62% 63%
58% 61% 61% 61%
62% 59%
63% 60%
61% 59%
Cov. Ratio Group(2)
Cov. Ratio CIB
Cov. Ratio PCB

Q2 2017 Results
27 July 2017
Deutsche Bank
Investor Relations
Value-at-RiskDB Group, 99%, 1 day, € m unless otherwise stated
32
(1) Stressed Value-at-Risk is calculated on the same portfolio as VaR but uses a historical market data from a period of significant financial stress (i.e. characterized by high volatilities and
extreme price movements)
Average VaR
Stressed VaR(1)
2Q2016 2Q2017
37 28
89 77
32
83
3Q2016
27
78
4Q2016 1Q2017
32
76
€ 2.0bn € 1.7bnSales & Trading revenues
20
40
60
80
100
120
140
160
180

Q2 2017 Results
27 July 2017
Deutsche Bank
Investor Relations
Invested Assets / Client Assets – PCB€ bn
Note: Figures may not sum due to rounding differences
(1) Assets under Administration include assets over which DB provides non investment services such as custody, risk management, administration and reporting (including execution only
brokerage) as well as current accounts / non-investment deposits
(2) Regional view is based on a client view
(3) Q3 2016 decline includes PCS deconsolidation impact of € (37)bn (affects both PCB and WM)
33
FY2015 Q1 2016 2Q 2016 Q3 2016 (3) Q4 2016 Q1 2017 Q2 2017
Invested Assets 578 553 552 510 496 504 500
Assets under Administration (1)188 187 194 189 194 198 201
Client Assets 766 739 746 698 690 702 701
Breakdown of Invested Assets 578 553 552 510 496 504 500
Private & Commercial Clients (PCC) 213 205 204 205 207 213 213
therein: PCC Germany 144 138 138 138 141 145 146
therein: PCC International 69 67 67 67 66 67 67
Postbank 75 74 72 72 72 72 72
Wealth Management (WM) (2)290 274 276 233 216 219 215
therein: Americas 88 80 82 41 35 34 31
therein: Asia-Pacific 51 49 49 50 45 48 47
therein: EMEA ex GY 65 61 60 56 50 48 48
therein: Germany 87 84 86 86 85 89 90
Breakdown of Client Assets 766 739 746 698 690 702 701
Private & Commercial Clients (PCC) 282 273 275 276 278 285 289
therein: PCC Germany 194 188 190 190 194 199 203
therein: PCC International 88 85 85 85 84 86 86
Postbank 110 110 110 110 112 113 113
Wealth Management (WM) (2)374 357 361 312 300 304 299
therein: Americas 119 111 113 66 62 61 57
therein: Asia-Pacific 51 49 49 50 45 48 47
therein: EMEA ex GY 73 70 68 62 58 56 55
therein: Germany 131 127 131 134 135 140 140
Net new money - Invested Assets 4 (5) (3) (10) (24) 2 3
Private & Commercial Clients (PCC) (1) (2) 0 (3) (3) 2 2
Postbank 1 (1) (1) (0) (0) (1) (0)
Wealth Management (WM) 5 (3) (2) (7) (21) 1 1

Q2 2017 Results
27 July 2017
Deutsche Bank
Investor Relations
Invested Assets / Client Assets – AM€ bn
34
Note: Figures may not sum due to rounding differences
(1) Assets under Administration include assets over which DB provides non-investment services such as custody, risk management, administration and reporting
Q4 2016 decline includes
Abbey Life
deconsolidation impact
FY 2015 Q1 2016 Q2 2016 Q3 2016 Q4 2016 Q1 2017 Q2 2017
Invested Assets 744 711 719 715 706 723 711
Assets under Administration (1) 54 57 63 65 68 67 62
Client Assets 798 768 782 780 774 790 772
Breakdown of Invested Assets 744 711 719 715 706 723 711
Regional
therein: Americas 233 215 216 205 210 212 197
therein: Asia-Pacific 42 38 41 42 38 41 39
therein: EMEA ex GY 195 189 188 188 179 184 180
therein: Germany 274 270 274 279 279 286 295
Client View
therein: Retail 333 301 312 310 316 327 320
therein: Institutional 411 410 408 404 390 396 391
Net New Money - Invested Assets 18 (12) (9) (8) (13) 5 6
Regional
therein: Americas (1) (10) (6) (8) (7) 2 (4)
therein: Asia-Pacific 1 0 0 1 (0) 2 0
therein: EMEA ex GY 9 (3) (3) (2) (5) 1 1
therein: Germany 8 2 (0) (0) (1) (0) 9
Client View
therein: Retail 32 (6) (8) (6) (8) 3 3
therein: Institutional (14) (6) (1) (2) (4) 2 2

Q2 2017 Results
27 July 2017
Deutsche Bank
Investor Relations
Full-time equivalents, at period end
Group headcount
35
30 Jun 2016 30 Sep 2016 31 Dec 2016 31 Mar 2017 30 Jun 2017
30 Jun 2017
vs.
31 Mar 2017
CIB 16,715 17,192 17,068 16,628 16,196 (432)
PCB 45,986 45,297 44,435 44,052 43,533 (518)
Deutsche AM 3,836 3,870 3,849 3,785 3,760 (24)
NCOU 132 117 116 - - -
Infrastructure 34,638 34,638 34,276 33,713 33,162 (551)
Total 101,307 101,115 99,744 98,177 96,652 (1,525)
Note: Certain Infrastructure functions previously reported under Consolidation & Adjustments, reflected in our business segments on an allocated basis, have been integrated more closely
into our business divisions. All prior period comparisons have been restated accordingly.

Q2 2017 Results
27 July 2017
Deutsche Bank
Investor Relations
This presentation contains forward-looking statements. Forward-looking statements are statements that are not historical
facts; they include statements about our beliefs and expectations and the assumptions underlying them. These
statements are based on plans, estimates and projections as they are currently available to the management of Deutsche
Bank. Forward-looking statements therefore speak only as of the date they are made, and we undertake no obligation to
update publicly any of them in light of new information or future events.
By their very nature, forward-looking statements involve risks and uncertainties. A number of important factors could
therefore cause actual results to differ materially from those contained in any forward-looking statement. Such factors
include the conditions in the financial markets in Germany, in Europe, in the United States and elsewhere from which we
derive a substantial portion of our revenues and in which we hold a substantial portion of our assets, the development of
asset prices and market volatility, potential defaults of borrowers or trading counterparties, the implementation of our
strategic initiatives, the reliability of our risk management policies, procedures and methods, and other risks referenced in
our filings with the U.S. Securities and Exchange Commission. Such factors are described in detail in our SEC Form
20-F of 20 March 2017 under the heading “Risk Factors.” Copies of this document are readily available upon request or
can be downloaded from www.db.com/ir.
This presentation also contains non-IFRS financial measures. For a reconciliation to directly comparable figures reported
under IFRS, to the extent such reconciliation is not provided in this presentation, refer to the Q2 2017 Financial Data
Supplement, which is accompanying this presentation and available at www.db.com/ir.
36
Cautionary statements