Embed Size (px)
Citation preview
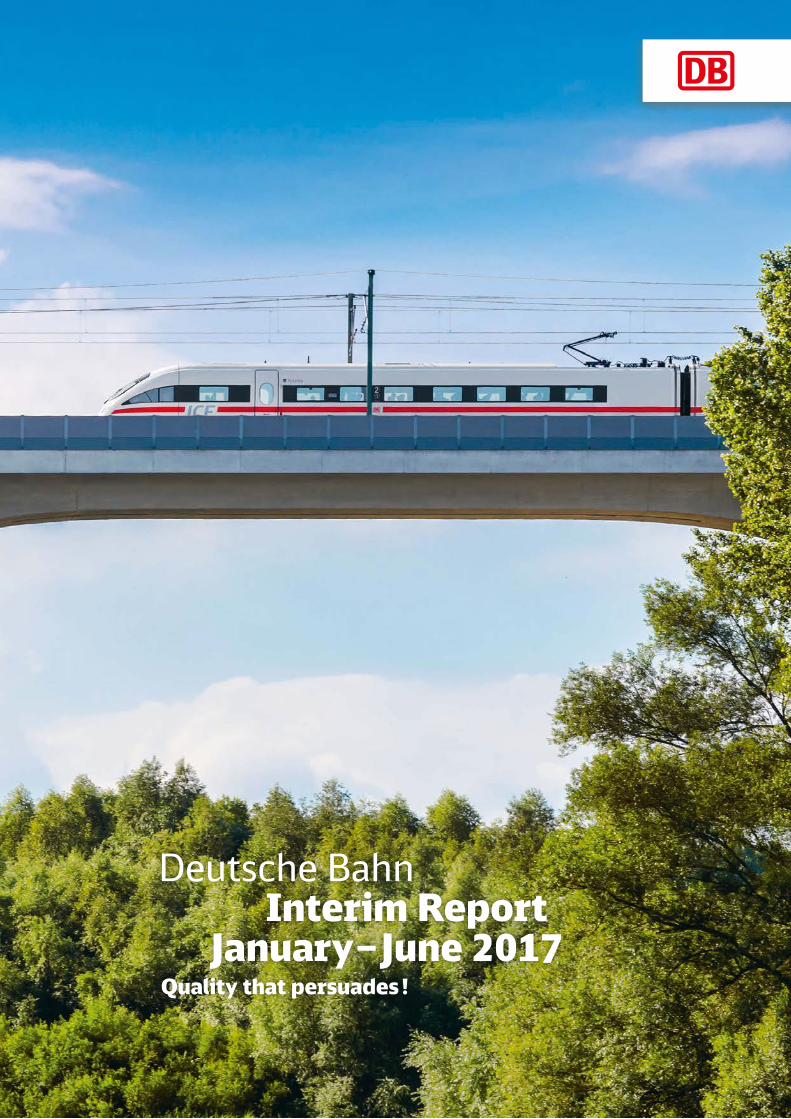
Deutsche Bahn Interim Report January – June 2017 Quality that persuades !
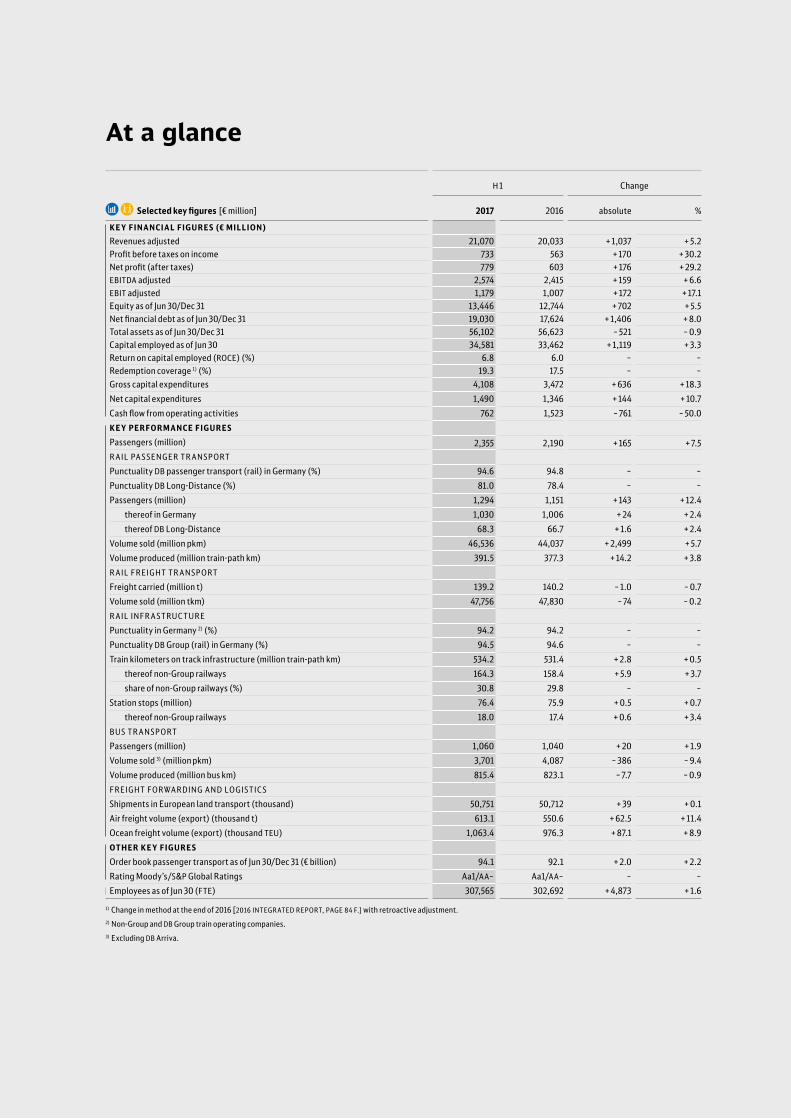
Æ † Selected key figures [€ million]
H 1 Change
2017 2016 absolute %
KEY FINANCIAL FIGUR E S (€ MILLION)Revenues adjusted 21,070 20,033 + 1,037 + 5.2Profit before taxes on income 733 563 + 170 + 30.2Net profit (after taxes) 779 603 + 176 + 29.2EBITDA adjusted 2,574 2,415 + 159 + 6.6EBIT adjusted 1,179 1,007 + 172 + 17.1Equity as of Jun 30/Dec 31 13,446 12,744 + 702 + 5.5Net financial debt as of Jun 30/Dec 31 19,030 17,624 + 1,406 + 8.0Total assets as of Jun 30/Dec 31 56,102 56,623 – 521 – 0.9Capital employed as of Jun 30 34,581 33,462 + 1,119 + 3.3Return on capital employed (ROCE) (%) 6.8 6.0 – –Redemption coverage 1) (%) 19.3 17.5 – –Gross capital expenditures 4,108 3,472 + 636 + 18.3Net capital expenditures 1,490 1,346 + 144 + 10.7Cash flow from operating activities 762 1,523 – 761 – 50.0
KEY PER FOR MAN CE FIGUR E SPassengers (million) 2,355 2,190 + 165 + 7.5R AIL PA S SENGER TR ANSP ORTPunctuality DB passenger transport (rail) in Germany (%) 94.6 94.8 – –Punctuality DB Long-Distance (%) 81.0 78.4 – –Passengers (million) 1,294 1,151 + 143 + 12.4 thereof in Germany 1,030 1,006 + 24 + 2.4 thereof DB Long-Distance 68.3 66.7 + 1.6 + 2.4Volume sold (million pkm) 46,536 44,037 + 2,499 + 5.7Volume produced (million train-path km) 391.5 377.3 + 14.2 + 3.8R AIL FR EIGHT TR ANSP ORTFreight carried (million t) 139.2 140.2 – 1.0 – 0.7Volume sold (million tkm) 47,756 47,830 – 74 – 0.2R AIL INFR A STRUC TUR EPunctuality in Germany 2) (%) 94.2 94.2 – –Punctuality DB Group (rail) in Germany (%) 94.5 94.6 – –Train kilometers on track infrastructure (million train-path km) 534.2 531.4 + 2.8 + 0.5 thereof non-Group railways 164.3 158.4 + 5.9 + 3.7 share of non-Group railways (%) 30.8 29.8 – –Station stops (million) 76.4 75.9 + 0.5 + 0.7 thereof non-Group railways 18.0 17.4 + 0.6 + 3.4BUS TR ANSP ORTPassengers (million) 1,060 1,040 + 20 + 1.9Volume sold 3) (million pkm) 3,701 4,087 – 386 – 9.4Volume produced (million bus km) 815.4 823.1 – 7.7 – 0.9FR EIGHT FORWAR DING AND LO GISTIC SShipments in European land transport (thousand) 50,751 50,712 + 39 + 0.1Air freight volume (export) (thousand t) 613.1 550.6 + 62.5 + 11.4Ocean freight volume (export) (thousand TEU) 1,063.4 976.3 + 87.1 + 8.9
OTHER KEY FIGUR E SOrder book passenger transport as of Jun 30/Dec 31 (€ billion) 94.1 92.1 + 2.0 + 2.2Rating Moody’s /S&P Global Ratings Aa1/AA– Aa1/AA– – –
Employees as of Jun 30 (FTE) 307,565 302,692 + 4,873 + 1.61) Change in method at the end of 2016 [2016 INTEGR ATED REPORT, PAGE 84 F.] with retroactive adjustment. 2) Non-Group and DB Group train operating companies.3) Excluding DB Arriva.
At a glance

Environmentaldimension
Eco-pioneerSocial
dimensionTop employer
Economic dimension
Profitable quality leader
DB2020+ strategy
Our customers benefit from first-class and environmentally friendly mobility and logistics solutions driven by dedicated employees and digital expertise.
WE DRIVE PROGRESS AND SHAPE THE FUTURE
Culture of qualityOperational excellence and customer focus
Digital expertiseInnovative solutions in our core and new businesses
High performanceShared responsibility and strong performance
Contents 1 Chairmanʼs letter
2 Interim Group management report (unaudited)
2 Overview 2 DB Group 5 Business and overall conditions 12 Profitable quality leader 21 Top employer 23 Eco-pioneer 25 Development of business units 47 Additional information 48 Opportunity and risk report 48 Events after the balance sheet date 49 Outlook
52 Consolidated interim financial statements (unaudited)
52 Consolidated statement of income 53 Consolidated balance sheet 54 Consolidated statement of cash flows 55 Consolidated statement
of changes in equity 56 Segment information according
to segments 58 Notes to the consolidated
interim financial statements
U5 Contact information and financial calendar
≈ Cover image: VDE 8 – ICE on the Scherkondetal bridge
In 1991, after the reunification of Germany, the Fed-eral Government created the German unification transport project no. 8 (Verkehrsprojekt Deutsche Einheit; VDE) in order to improve transport connec-tions by rail between east and west and between north and south. The new expansion line, approxi-mately 500 km long, between Nuremberg, Erfurt, Leipzig/Halle and Berlin will be fully operational on December 10, 2017. The new high-speed line provides a competitive and environmentally sound alter-native to travel by road and plane Berlin – Munich in under four hours – the service offered by DB Group from De cember 2017 will make traveling easier and more comfortable, directly benefiting about 17 mil-lion people in Germany.

¥ E
CO
-PIO
NE
ER
¿ P
RO
FIT
AB
LE Q
UA
LIT
Y L
EA
DE
R†
TO
P E
MP
LOY
ER
Dear ladies and gentlemen,
Deutsche Bahn continued to become more attractive in the first half of 2017. The successes achieved in our R A I LWAY O F T H E F U T U R E quality program are becoming increasingly visible. In the first half of 2017, more than 68 million passengers used our long-dis-tance trains – more than ever before in a first half-year.
Revenues and profits also developed positively. Rev-enues of € 21.1 billion and adjusted EBIT of € 1.2 bil-lion are evidence of our success. Revenues increased by 5.2 percent, and EBIT was up by an impressive 17.1 percent. We are particularly pleased that improve-ments were achieved broadly across our business units, and in particular our international activities DB Arriva, DB Cargo, and DB Schenker.
For this reason, we have been more ambitious in for-mulating our forecast for the 2017 financial year. We intend to increase revenues to over € 42.5 billion and achieve an EBIT of at least € 2.2 billion. This is € 1 bil-lion more revenues and € 100 million more EBIT than previously achieved.
We are also on the right path in terms of punctuality. In long-distance transport, we achieved an aver age punctuality of 81.0 percent in the first half of 2017. This is 2.6 percentage points more than in the first half of 2016. In regional transport, punctuality re-mained stable at the high level of 93.2 percent. Over- all, however, we are still not satisfied with the devel-op ment of our punctuality. More effort is needed in this area to allow us to provide even better and more reliable service to our customers.
Conclusion: The numbers confirm that we are on the right path – our R AILWAY OF THE FUTURE program is succeeding. We have the wind in
our favor, but mentally we have not yet taken off. We have made achievements in some areas, but in others, we still face challenges. We must continue working in these areas with discipline and focus – keeping in mind the objective of making DB Group a bit better every day.
We are investing, where improvements are noticeable for the customer. € 5.5 billion are being spent on the modernization and maintenance of stations – more than ever before.
A fundamental step forward for our customers is the commissioning of the new ICE high-speed connection Berlin – Munich and the parallel occurring introduc-tion of the ICE 4 in December 2017.
We are also continuing to make progress in digitaliza-tion. We are working with start-ups and technology partners to develop new business models. The aim here, too, is to further improve quality and service for our customers.
One thing is clear: we are on the right path, but not yet at the finish. We will do everything we can to main tain the positive momentum and continue the upward trend. This is what drives us. This is our ambi-tion. Because in the interest of our customers the focus in 2017 will be no less than: Quality that persuades!
Sincerely yours,
Dr. Richard LutzCEO and Chairman of the Management Board of Deutsche Bahn AG
“The numbers confirm that we are on the right path – our
Railway of the Future program is succeeding.”
CHAIRMANʼS LETTER

≈ Changes in the executive bodies
≈ Changes in the Management BoardThe appointment of Dr. Rüdiger Grube as a member of the Management Board of DB AG was rescinded by mutual agreement with effect from January 30, 2017.
At the meeting of March 22, 2017, the Supervisory Board appointed Dr. Richard Lutz as a member of the Management Board of DB AG for another term of five years, through March 21, 2022, and appointed him Chief Executive Officer (CEO).
Also at the meeting of March 22, 2017, the Supervisory Board appointed Berthold Huber and Ronald Pofalla as members of the Management Board for another term of five years, also through March 21, 2022.
≈ Changes in the Supervisory BoardIn the context of her appointment as Federal Minister of Economics and Energy, Brigitte Zypries resigned from the Supervisory Board of DB AG with effect from January 26,
2017. Parliamentary State Secretary Uwe Beckmeyer (Federal Ministry of Economics and Energy, BMWi) was appointed as her successor to the Supervisory Board of DB AG with effect from March 3, 2017.
Fred Nowka resigned his Supervisory Board mandate with effect from April 30, 2017. Falk Sobek of the District Court of Charlottenburg was appointed as his successor to the Supervisory Board of DB AG with effect from May 12, 2017.
≈ Implementation of capital increase
At the end of June 2017, the Budget Committee released the second half of the planned DB AG equity increase by € 1 bil-lion. The unblocking was subject to the condition that the pro rata resources of the performance and financing agree-ment (Leistungs- und Finanzierungsvereinbarung; LuFV) II for 2016 were fully implemented in accordance with the terms of agreement.
DB Group
Overview
Interim Group management report (unaudited)
New Chief Executive Officer named
Strategy DB2020+ sets the right focus
Railway of the Future improves quality and performance
Railway of the Future program successful
Financial indicators with clearly positive development
Good development in noise reduction and air quality control
≈ ¿ Profitable quality leader
◊ Punctuality data positive compared to 2016.
◊ Passenger record in long-distance transport.
◊ Revenues and EBIT improve significantly.
≈ † Top employer ◊ Number of employees
increased further. ◊ New employer branding
campaign started. ◊ Two regional Railway
of the Future workshops carried out.
≈ ¥ Eco-pioneer ◊ Development of a new
climate protection target in cooperation with the science-based targets initiative.
◊ DB Cargo achieves good progress in noise reduction.
◊ DB Regional operates largest bus fleet with Euro VI emissions standard.
2
Deutsche Bahn Group – Interim Report January – June 2017 INTERIM GROUP MANAGEMENT REPORT
≈ Implementation DB2020+ strategy
The orientation of DB Group associated with DB 2020+ sets the right priorities to make the Group fit for the future. This is also reflected in the economic results. We are work- ing on the issues that will help us to both optimize our core business and take advantage of international growth opportunities.
Within the framework of R AILWAY OF THE FUTURE , we have eliminated major annoyances for the railway in Germany and for our customers as well as significantly improved the quality of our services. This applies, among other things, to punctuality, passenger information and the cleanliness of stations. The focus now is on stabilization by creating suitable structural frameworks.
We have also made significant progress in digitali zation. With the appointment of a Chief Digital Officer, the found ing of DB Digital Ventures GmbH and the devel opment of the Group-wide ACCELERATORS BEYOND1435 Π[WWW.BEYOND 1435.COM] with our partner PLUG AND PLAY Π[ W W W. A XEL SPRINGER PLUG AND
PL AY.COM], we have put our digital ecosystem firmly in place. As part of our digitalization strategy, we have for mulated areas of action based on technology trends for our digital activities and developed roadmaps for their implementation.
After having successfully implemented a number of Group programs, we are working on new and further devel-oped Group programs on topics with which we would like to take another step towards the future.
◊ We will significantly increase the reliability, flexibility and the transport capacity of rail with the Railway Auto-ma tion Group program (Automatisierung Bahn betrieb; ABB).
◊ With the Group program Smart Cities, we will develop new, intelligent mobility, logistics and station concepts for urban areas.
◊ With the Group program Non-European Operations (NEO), we intend to exploit business opportunities in the railway business outside Europe, particularly in the Middle East and the Asia-Pacific region, and bring our DB network and expertise to bear on the railway business here.
The focus now is on the implementation of these topics. In the railway in Germany, we need to work more forcefully, especially in our three strategic areas of action: quality, digital expertise and high performance.
We want to offer products and services which convince our customers: reliable, high quality and safe – always and everywhere. The basis for this is operational excellence in all our processes.
We want to generate enthusiasm through digital services, the highest level of performance in automated rail opera-tions and a tailor-made portfolio for our customers – based on mobility and logistics platforms.
In order to reach our targets, we need a high-perfor-mance foundation. To this end, we are working on a culture and leadership that motivates our employees to achieve the highest levels of performance, while at the same time building up competencies in the organization, especially in the direction of digitalization and process excellence.
We will also improve the control logic of DB Group in order to work more forcefully. Besides the railway in Ger-many, we want to focus even more on growth opportunities in our international business.
≈ Implementation of Railway of the Future
“Eliminating annoyances” was the target we had set our-selves for 2016 with R AILWAY OF THE FUTURE – this has been achieved in most divisions. In 2017, the focus is on stabilizing the positive developments.
≈ Punctuality improved We still have our target in view for 2017 of 81% punctual long- distance trains, and are on track. We will achieve this, for example, through PLANSTART [2016 INTEGR ATED REP ORT, PAGE 1 4 F.]. This helps ensure the more punctual departure of our long-distance trains. As of 2018, we aim to ensure that 90% of all long-distance trains depart the stations in ques-tion on time, compared with 76% as scheduled in 2016. In addition, the focus of PlanStart is being systematically ex pand ed, for example by looking at other stations and stopping trains.
Systematically cutting vegetation will further reduce the impact of trees that fall on the rail network during storms and help prevent delays.
≈ Improvement of availability of elevators and escalators
The ELEVATOR S AND E SC AL ATOR S AT STATIONS [2016 INTEGR ATED
R EP O RT, PAG E 1 8 F.] have automatically reported disruptions since 2016. All 3,100 conveyor systems are equipped with a module for remote monitoring, which transmits distur-bances digitally and in real time to the operations centers. This system makes it possible for us to commission and carry out repairs faster.
!!!
3
DB GROUPOVERVIEW / DB GROUP
≈ Passenger information improved ◊ The wagon orientation is correctly displayed for almost
100% of all ICE trains. IC trains will be the focus in the second half of 2017.
◊ Information on track changes is displayed 90% correctly in the top 10 stations, so we are still below the target value (97%). Improvement measures have been initi-ated. At the top 50 stations, our 87% accuracy exceeded our target (85%).
◊ The so-called static delay forecast for long-distance transport achieved a stable prediction accuracy of 85%. To further improve the result, we are working with T-Systems on a dynamic forecast based on a big-data approach.
◊ Further development of the passenger information plat-form. This platform bundles together all the relevant passenger information input data from the train oper-ating companies and infrastructure.
≈ New Competence Centers established We have set up three Competence Centers (CC) to fulfill our quality promise over the long term.
Competence Center for Operational ExcellenceThe Competence Center for Operational Excellence (OPEX) addresses quality and efficiency improvements in the rail- way in Germany and pursues a zero-error principle in this respect. It targets quality improvement, strict customer orientation and profitability in the production processes.
◊ An important step towards achieving the goal of “zero errors” in the rail system is the establishment of a new instrument for increasing punctuality – the so-called lost units. The advantage over the current control over delay minutes is that lost units focus on all punctuality errors and less so on the duration of the delay.
◊ In maintenance, an OPEX program will be rolled out in two waves in 2017; others will follow. The first wave, “16 Flagship Sites,” was launched in February. In early Au -gust, the second wave will start with 23 additional sites.
◊ In May 2017, the OPEX core module “Bauen im Verbund” (BiV) was launched at DB Netze Track. The objective here is to coordinate construction activities to a greater extent across the business units in order to further min-imize the impact on punctuality. External train oper-ating companies are involved via the “Construction Site Management Round Table.”
Competence Center for DigitalizationIn addition to the development of the digitalization strat- egy, the CC is also working on the development of digital products.
◊ The start-up support in DB MINDBOX Œ [ W W W.DBMINDB OX.
COM] was expanded: for example with the new program BEYOND1 4 35 Œ [ W W W.BEYO ND1 4 35.COM], one of the worldʼs leading innovation platforms.
◊ WHAT 3WORDS Œ [ W W W.WHAT 3WOR D S.COM], a global address and location service, is a new start-up affiliated com-pany under the umbrella of DB Digital Ventures.
◊ A Group-wide intrapreneurship program was developed for our employees, which gives them the necessary free- dom and provides comprehensive support to launch as a start-up under the umbrella of DB Digital Ventures and to realize new products relating to mobility and logistics.
Competence Center for TransformationSince the beginning of the year, the CC has been supporting the quality and digitalization efforts of DB Group and the business units by establishing concepts to improve the performance and increase the motivation of the workforce.
The core task of the CC is to enable/drive the digital and conventional transformation of the entire organization in the interest of our customers.
≈ Railway of the Future conference continued
The 2016 Railway of the Future conference, in which 1,000 people were trained as Railway of the Future multipliers, will continue in a new format in 2017. The multipliers exchange information in five Railway of the Future action workshops and are inspiring further colleagues for R AILWAY OF THE FUTURE .
≈ Dialog forums on Railway of the Future carried out
In May 2016, the first Railway of the Future dialog forum took place with some competing railways. After that forum, there was criticism from the industry that the R AILWAY OF THE FUTURE program was mainly geared to DB Group and tended to exclude the competitors. We are taking this into account by organizing the Quality and Punctuality dialog forum twice a year. The first one was held in June 2017. At these forums, recommendations were taken up and it was made clear that many of the Railway of the Future measures contribute to better quality and punctuality, which verifiably benefit the entire industry. It was also agreed to include suggestions from the participants for fur-ther implementation. The participants of the event gave a very positive welcome to this kind of direct exchange.
4
Deutsche Bahn Group – Interim Report January – June 2017 INTERIM GROUP MANAGEMENT REPORT

The developments as described below are partly based on provisional data or data not relating to the same time period, as complete information relating to developments over the first half of 2017 was not yet fully available at the time this report was prepared.
≈ Economic environment
≈ Assessment of the economic climate by the Management Board
◊ Stronger trade growth is strengthening global transport demand, particularly on intra-Asian routes and the routes to and from Asia.
◊ The economic environment, which is especially im por tant for the logistics activities of DB Group, has improved, particularly in Germany and Europe.
◊ The structural change caused by the energy transition of the German economy is having different effects on modes of transport.
◊ The labor market recovery and rising incomes in Europe provide support for mobility demand in our markets.
◊ The respective state policy frameworks, which vary greatly in Europe, have a significant impact on compe-tition and market development in the more regulated passenger transport markets.
≈ Rising global investments strengthen world trade
The global economy regained momentum at the start of the year. The main reason for this is the faster-growing in -vestments. In addition to government investments in China, the recovery of global commodity prices is also contributing to the growth of demand for capital goods in commodity exporting countries.
Stronger global investments are also the main reason behind growth of trade and production in Europe. Under-pinned by improved global demand and a stable domestic economy, overall economic growth in the eurozone acceler-ated somewhat at the beginning of the year. Private house-holds are benefiting from the ongoing recovery on the labor market.
In Germany, the dampening effect of resurgent inflation on private spending is somewhat stronger than in other coun-tries of the eurozone. In terms of overall economic growth, however, this is offset by rising investments. In Great Britain, however, growth slowed further at the beginning of the year. The sharp rise in inflation following the Brexit deci-sion is noticeably dampening consumer spending by private households. However, in accordance with our expectations, the British economy avoided slipping into recession.
≈ Energy markets in motion The central hedging policy of DB Group is based on the prin ciple of minimizing energy price fluctuations. Our activ-ities are therefore not exposed to the full impact of changes in market prices.
Delayed reduction of the oil oversupply
Brent crude oil [USD/bbl]H 1
2017 2016
Change
absolute %
Average price 52.7 45.1 +7.6 +16.9Highest price 58.4 57.9 – –Lowest price 44.4 27.1 – –Year-end price 47.9 56.8 – 8.9 –15.7
Source: Thomson Reuters
Oil prices fluctuated in a relatively narrow range, with a slight decline in the first half of 2017. However, the average price was about 17% above the previous yearʼs level. Despite OPEC efforts to counteract this and growing de mand in India and China, production and inventories remain at a high level, limiting the price increase trends of the previous year because the reduction in OPEC production has been offset by other countries (especially the US).
Business and overall conditionsEconomic environment improved
World trade strengthened through investments
Burdens from the regulatory environment
5
DB GROUP / BUSInESS AnD OvERAll COnDITIOnS
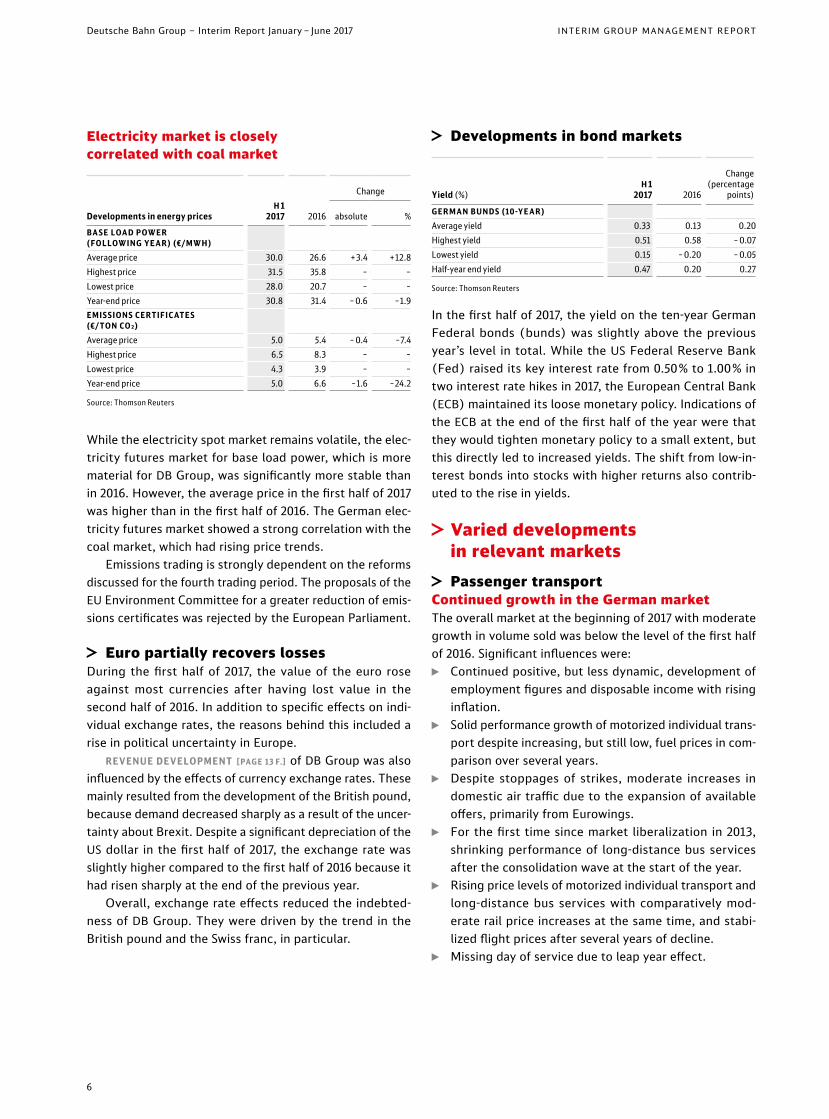
Electricity market is closely correlated with coal market
Developments in energy pricesH 1
2017 2016
Change
absolute %BA SE LOAD P OWER (FOLLOWING YE AR) (€ /MWH)Average price 30.0 26.6 + 3.4 +12.8Highest price 31.5 35.8 – –Lowest price 28.0 20.7 – –Year-end price 30.8 31.4 – 0.6 –1.9EMI S SION S CERTIFIC ATE S (€ / TON CO₂)Average price 5.0 5.4 – 0.4 –7.4Highest price 6.5 8.3 – –Lowest price 4.3 3.9 – –Year-end price 5.0 6.6 –1.6 –24.2
Source: Thomson Reuters
While the electricity spot market remains volatile, the elec-tricity futures market for base load power, which is more material for DB Group, was significantly more stable than in 2016. However, the average price in the first half of 2017 was higher than in the first half of 2016. The German elec-tricity futures market showed a strong correlation with the coal market, which had rising price trends.
Emissions trading is strongly dependent on the reforms discussed for the fourth trading period. The proposals of the EU Environment Committee for a greater reduction of emis-sions certificates was rejected by the European Parliament.
≈ Euro partially recovers lossesDuring the first half of 2017, the value of the euro rose against most currencies after having lost value in the second half of 2016. In addition to specific effects on indi-vidual exchange rates, the reasons behind this included a rise in political uncertainty in Europe.
REVENUE DEVELOPMENT [PAGE 1 3 F.] of DB Group was also influenced by the effects of currency exchange rates. These mainly resulted from the development of the British pound, because demand decreased sharply as a result of the uncer-tainty about Brexit. Despite a significant depreciation of the US dollar in the first half of 2017, the exchange rate was slightly higher compared to the first half of 2016 because it had risen sharply at the end of the previous year.
Overall, exchange rate effects reduced the indebted-ness of DB Group. They were driven by the trend in the British pound and the Swiss franc, in particular.
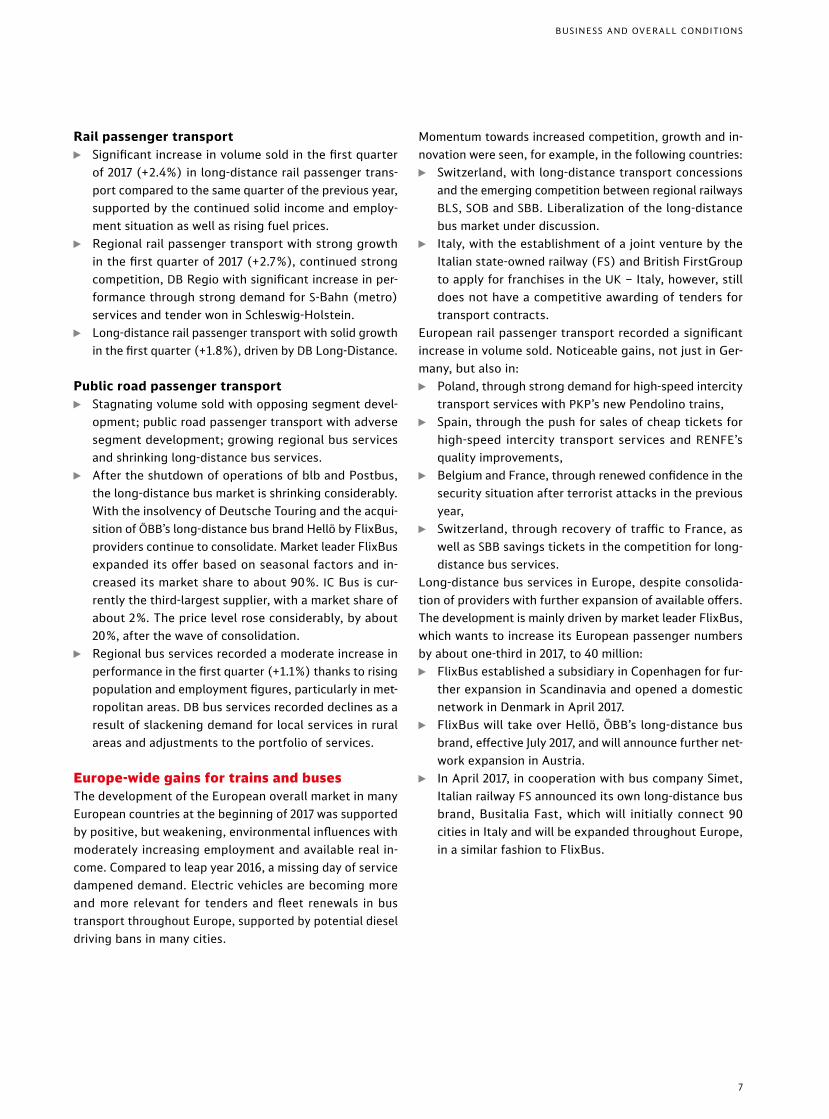
≈ Developments in bond markets
Yield (%)H 1
2017 2016
Change (percentage
points)
GER MAN BUND S (10 -YE AR)Average yield 0.33 0.13 0.20Highest yield 0.51 0.58 – 0.07Lowest yield 0.15 – 0.20 – 0.05Half-year end yield 0.47 0.20 0.27
Source: Thomson Reuters
In the first half of 2017, the yield on the ten-year German Federal bonds (bunds) was slightly above the previous yearʼs level in total. While the US Federal Reserve Bank (Fed) raised its key interest rate from 0.50% to 1.00% in two interest rate hikes in 2017, the European Central Bank (ECB) maintained its loose monetary policy. Indications of the ECB at the end of the first half of the year were that they would tighten monetary policy to a small extent, but this directly led to increased yields. The shift from low-in-terest bonds into stocks with higher returns also contrib-uted to the rise in yields.
≈ Varied developments in relevant markets
≈ Passenger transportContinued growth in the German marketThe overall market at the beginning of 2017 with moderate growth in volume sold was below the level of the first half of 2016. Significant influences were:
◊ Continued positive, but less dynamic, development of employment figures and disposable income with rising inflation.
◊ Solid performance growth of motorized individual trans-port despite increasing, but still low, fuel prices in com-parison over several years.
◊ Despite stoppages of strikes, moderate increases in domestic air traffic due to the expansion of available offers, primarily from Eurowings.
◊ For the first time since market liberalization in 2013, shrinking performance of long-distance bus services after the consolidation wave at the start of the year.
◊ Rising price levels of motorized individual transport and long-distance bus services with comparatively mod-erate rail price increases at the same time, and stabi-lized flight prices after several years of decline.
◊ Missing day of service due to leap year effect.
6
Deutsche Bahn Group – Interim Report January – June 2017 INTERIM GROUP MANAGEMENT REPORT
Rail passenger transport ◊ Significant increase in volume sold in the first quarter
of 2017 (+2.4%) in long-distance rail passenger trans-port compared to the same quarter of the previous year, supported by the continued solid income and employ-ment situation as well as rising fuel prices.
◊ Regional rail passenger transport with strong growth in the first quarter of 2017 (+2.7%), continued strong competition, DB Regio with significant increase in per-formance through strong demand for S-Bahn (metro) services and tender won in Schleswig-Holstein.
◊ long-distance rail passenger transport with solid growth in the first quarter (+1.8%), driven by DB long-Distance.
Public road passenger transport ◊ Stagnating volume sold with opposing segment devel-
opment; public road passenger transport with adverse segment development; growing regional bus services and shrinking long-distance bus services.
◊ After the shutdown of operations of blb and Postbus, the long-distance bus market is shrinking considerably. With the insolvency of Deutsche Touring and the acqui-sition of ÖBBʼs long-distance bus brand Hellö by FlixBus, providers continue to consolidate. Market leader FlixBus expanded its offer based on seasonal factors and in -creas ed its market share to about 90%. IC Bus is cur-rently the third-largest supplier, with a market share of about 2%. The price level rose considerably, by about 20%, after the wave of consolidation.
◊ Regional bus services recorded a moderate increase in performance in the first quarter (+1.1%) thanks to rising population and employment figures, particularly in met-ropolitan areas. DB bus services recorded declines as a result of slackening demand for local services in rural areas and adjustments to the portfolio of services.
Europe-wide gains for trains and busesThe development of the European overall market in many European countries at the beginning of 2017 was support ed by positive, but weakening, environmental influences with moderately increasing employment and available real in -come. Compared to leap year 2016, a missing day of service dampened demand. Electric vehicles are becoming more and more relevant for tenders and fleet renewals in bus transport throughout Europe, supported by potential diesel driving bans in many cities.
Momentum towards increased competition, growth and in -no vation were seen, for example, in the following countries:
◊ Switzerland, with long-distance transport concessions and the emerging competition between regional railways BlS, SOB and SBB. liberalization of the long-distance bus market under discussion.
◊ Italy, with the establishment of a joint venture by the Italian state-owned railway (FS) and British FirstGroup to apply for franchises in the UK – Italy, however, still does not have a competitive awarding of tenders for transport contracts.
European rail passenger transport recorded a significant increase in volume sold. noticeable gains, not just in Ger-many, but also in:
◊ Poland, through strong demand for high-speed intercity transport services with PKPʼs new Pendolino trains,
◊ Spain, through the push for sales of cheap tickets for high- speed intercity transport services and REnFEʼs quality improvements,
◊ Belgium and France, through renewed confidence in the security situation after terrorist attacks in the previous year,
◊ Switzerland, through recovery of traffic to France, as well as SBB savings tickets in the competition for long- distance bus services.
long-distance bus services in Europe, despite consolida-tion of providers with further expansion of available offers. The development is mainly driven by market leader FlixBus, which wants to increase its European passenger numbers by about one-third in 2017, to 40 million:
◊ FlixBus established a subsidiary in Copenhagen for fur-ther expansion in Scandinavia and opened a domestic network in Denmark in April 2017.
◊ FlixBus will take over Hellö, ÖBBʼs long-distance bus brand, effective July 2017, and will announce further net-work expansion in Austria.
◊ In April 2017, in cooperation with bus company Simet, Italian railway FS announced its own long-distance bus brand, Busitalia Fast, which will initially connect 90 cities in Italy and will be expanded throughout Europe, in a similar fashion to FlixBus.
!!!
7
BUSInESS AnD OvERAll COnDITIOnS
≈ Freight transport and logisticsGerman freight transportBy our own calculations, the strong overall market growth in the first quarter of 2017 compared to the first quarter of 2016 of the previous year is exaggerated by a working-day effect of three additional business days. The performance increase continued to be driven mainly by road freight traffic:
◊ Robust economic effects from trade and domestic demand.
◊ non-cyclical special items such as severe weather, low water, closure or conversion of coal-fired power plants and quality losses dampen development, mainly by rail and inland waterways.
◊ Price and competitive pressure remain high both among and between the various modes of transport.
◊ In inland waterway transport, the weak development of the previous year continued in the first quarter of 2017. low water levels in the area of previous records, which caused a decline in performance by almost a quarter by February, as well as the suspension in March of shipping on the Danube, the Main and the Main-Danube Canal due to extensive maintenance and repair work on locks drove traffic down by almost 13%.
Rail ◊ In the first quarter of 2017, rail freight volume sold rose
by almost 3%. However, taking into account the positive working day effect of the Easter holiday, the plus must be considered on a relative basis and is likely to have weakened considerably in April.
◊ The development is also dampened by significantly neg-ative special items. As a result, in connection with the significant amount of construction activities and severe weather damage, operations were impaired nationwide.
◊ While on the one hand the performance development of DB Cargo benefited primarily from strong impulses from the steel industry, on the other hand the portfolio adjustments of the energy producers had a negative effect through the closure of coal-fired power plants and the conversion from coal to gas. In addition, serious quality losses led to noticeable intramodal and inter-modal shifts.
◊ After strong growth of a solid 15% in the first quarter of 2016, the increase of the non-Group railways was some-what weaker by March 2017. Development was mainly slowed by traffic losses to DB Group in the paper sector, below-average participation in the positive develop-ments in steel, and declines in the chemicals, coal and goods sectors.
Road ◊ By our own calculations, increase in volume sold of
about 4.5% by May 2017. ◊ According to the toll statistics issued by the German
Federal Agency for Freight Transport, in road perfor-mance development an increase in trucks registered in German of 2% contrasted with an increase of more than 8% in trucks from abroad. Of these, trucks from Poland, Croatia, Romania, Bulgaria, lithuania and Slovenia con-tinued to record above-average performance. vehicles from non-EU countries also recorded strong growth.
◊ Continued strong momentum from the construction industry, foreign trade and positive consumer sentiment.
◊ Despite rising diesel costs in the first months of 2017, road transport continues to profit from still low diesel price levels compared to previous years. On the spot market, transport prices in the first quarter declined noticeably.
European rail freight transport market above previous year’s levelYear on year, volume sold in European rail freight transport (EU 28, Switzerland and norway) rose in the first quarter of 2017 by about 5%, with positive impacts coming particu-larly from growth in Germany, Poland, Great Britain, Austria and Sweden. The performance increase is supported by the revival of production and foreign trade. Positive momentum was generated here mainly from transport through the ARA ports (Antwerp, Rotterdam and Amsterdam). Combined transport is the growth driver of rail freight transport.
After double-digit declines in the last two years, volume sold of rail freight transport in Great Britain rose again. Based on the very positive development in metal, building materials and intermodal transport, the first quarter of 2017 recorded a strong increase of almost 5% compared to the same period of the previous year. The decline in coal trans-port continues, but has slowed significantly. Consequently, DB Cargo UK recorded slight growth in the first half of 2017. The leading market position was maintained.
After stagnating in 2016, rail freight transport perfor-mance in Poland rose by 6% in the first quarter of 2017. The positive development was supported by an increase in steel and ore transports. Intermodal transport increased by almost 32%. DB Cargo Polska developed in line with the market in the first half of 2017. In particular, the automotive and intermodal transport markets performed positively.
8
Deutsche Bahn Group – Interim Report January – June 2017 INTERIM GROUP MANAGEMENT REPORT

After the decline by about 5% in rail freight traffic in France in the previous year, the volume sold development stabi-lized at the beginning of 2017. The demand is supported by the positive development in the metal and consumer goods industry. Euro Cargo Rail (ECR) under performed the market.
Growth in European land transportAfter getting off to a modest start, volumes in the Euro-pean land transport market experienced a significant pos-itive development starting in March 2017. Up until May 2017, the overall market developed positively.
Price trends have not yet benefited significantly from the increased demand. Consequently, the price level in the first few months of the year – also influenced by the still low diesel price – was at a low level. For the second quarter of 2017, indicators suggest a slight recovery in the price level.
The market situation is also reflected at DB Schenker. Shipment volumes and revenues rose significantly in the core business in the first half of 2017 (load transport and general cargo).
Strong development in air freightThe global air freight market developed by May 2017, well above the same period in the previous year, at 6%. This development is mainly driven by a capacity bottleneck in ocean freight, which has caused loaders to increasingly change their modes of transport.
Trade routes between Asia and the US and from Europe to Asia were particularly affected.
According to the scarce cargo space, air freight rates developed at a consistently high level of about 6% above the level of the same period in the previous year since the beginning of 2017.
DB Schenker recorded growth in volume of 11.4% in the first half of 2017.
Continued growth in ocean freightWith growth of about 3% through April 2017, global ocean freight performed well in the first half of 2017. This positive development is mainly driven by the intra-Asian trade route as well as by trade routes from Asia to other regions.
Currently, improved utilization of capacity can be seen with the effect of a recovery in rates. The consolidation of shipping companies into large alliances in the ocean freight market is continuing.
DB Schenker recorded growth in volume of 8.9% in the first half of 2017.
Persisting momentum in contract logisticsIn the market for contract logistics, the growth rate con-tinued in the first half of 2017. Growth momentum remains strong, particularly in Asia. Demand for dedicated indus-trial and automotive solutions improved slightly.
DB Schenker achieved revenues adjusted for exchange rate effects of 5.7% in the first half of 2017.
≈ Increasing demand for rail infrastructureDemand for train-paths increased in the first half of 2017 as demand in passenger regional transport and freight trans-port rose. Growth in regional rail passenger transport is mainly driven by the increase in regionalization funds. The increased sales volume in freight transport is primarily based on the positive development of combined transport. Infrastructure demand was largely stable in long-distance rail passenger transport.
In the first half of 2017, the number of regional rail pas-senger transport station stops was 0.7% higher than in the first half of 2016. non-Group railways further increased their share by winning regional tenders.
!!!
≈ Developments in the political environment
≈ Regulatory and transport policy topics in Germany
Review of station pricing system continuesSince April 2017, two procedures have been in place to approve the 2018 station price list presented by DB Sta-tion&Service AG as well as the preliminary review of the corresponding fee policies. The focus of the two proce-dures is on the changes in the pricing system, which were required because of the new fee regulations under the Rail way Regulation Act (Eisenbahnregulierungsgesetz; ERegG), which came into force in September 2016. This applies, in particular, to the provisions of Article 37 of the ERegG, which contain strict guidelines for determining the station prices in regional rail passenger transport. The BnetzA concluded the preliminary review procedure for fee policies in May 2017 and did not object to it. The Federal agency also launched a subsequent investigation into indi-vidual fee policies. Currently, the process is still ongoing. Completion of this process and the fee approval process is expected in October 2017.
In May 2017, the BnetzA concluded the procedure opened in February 2016 for the review of the cost base of the 2014 station price list, without any material complaints.
9
BUSInESS AnD OvERAll COnDITIOnS
Decision on the 2018 train-path pricing system By the decision of February 6, 2017, the BnetzA approved the fees and fee policies for the new DB netz AG train-path pricing system for the 2017/2018 schedule. The decision contained modifications to a few of the fee applications. DB netz AG on the one hand, and DB Regio AG and DB Fern- verkehr AG on the other, brought a lawsuit and re quest ed an interim injunction. In June 2017, all three companies filed a complaint with the Appellate Administrative Court in Münster against the rejection of applications for interim injunctions by the competent Administrative Court in Cologne of May 2017.
Review procedure according to new incentive regulation Under the new incentive regulation framework under the ERegG, the BnetzA must set a price ceiling for train-path usage fees for the first regulatory period (2019 until 2023). In the first process step, the so-called initial basis of the overall costs must be approved for this purpose. DB netz AG had determined this on the basis of the base years 2014 until 2016, until the first year of the regulatory period and submitted for approval to the regulatory authorities in April 2017. By decision of June 28, 2017, the BnetzA set the initial level for the overall costs below the requested value. The reduction is mainly due to reductions in cost of capital and secondary costs as well as reductions in carryforwards. DB netz AG is checking the decision and will, if necessary, file an appeal.
Decision on the contract violation proceedings of the EU CommissionOn June 28, 2017, the European Court of Justice (ECJ) issued its judgment on the contract violation proceedings by the European Commission against Germany to confirm potential breaches of European railway law. The Commis-sion had brought a lawsuit against Germany at the end of 2014 and made four accusations, which included profit transfer within DB Group, the accounts of the infrastruc-ture operators, the use of access charges by DB netz, and the separate designation of public subsidies for public trans port services at DB Regio. The ECJ largely rejected the Commissionʼs arguments. It is only with a view to the ex -ternal disclosures of the accounts that the ECJ establishes a contract violation. At the time of the lawsuit, the Federal Republic of Germany had not undertaken all the necessary measures to ensure that the accounts system would ensure
compliance with the ban on the transfer of public funds for the operation of rail infrastructure to transport services. For the implementation of the judgment, we must bear in mind that the current legal framework has undergone sig-nificant further development by the ERegG, among others.
≈ Regulatory and transport policy topics in Europe
EU supports German transport projectsWithin the framework of the Connecting Europe facility, on June 23, 2017, the Commission proposed a total of
€ 2.7 billion for 152 Central European transport projects. The se lected measures in Germany include low-noise braking systems, especially for freight trains, or the use of the ERTMS (European Rail Traffic Management System) on major European freight transport corridors. A project to build up a fast-charging network for electric vehicles in Ger-many and other EU countries was also selected. Requests from DB Cargo in the amount of € 10 million were taken into account. These include the conversion of freight cars to low-noise brake shoes, the ERTMS conversion of locomo-tives as well as the hybridization of the 294 series. The proposal must still be approved formally and officially adopted by the Commission at the end of July 2017.
Regulatory changes in ItalyThere have been a number of important regulatory changes in Italy which, among other things, are intended to foster competition and ensure a stable financial framework. In ad - dition, investments in infrastructure and the local transport fleet were announced. The rules for opening up the market and better public financing are beneficial for DB Arriva Italy.
≈ Further development of the traffic and regulatory framework
Higher EEG surchargeThe Renewable Energy Sources Act (Erneuerbare-Energien- Gesetz; EEG) of 2017 stipulates an EEG levy on railways for traction current amounting to 20% of the full EEG surcharge as part of the “special equalization scheme.” In 2017, the EEG surcharge increased by 0.526 cents/kWh compared to the previous year to 6.88 cents/kWh. This resulted in an in crease of the EEG rate for traction current to 1.376 cents/kWh.
10
Deutsche Bahn Group – Interim Report January – June 2017 INTERIM GROUP MANAGEMENT REPORT
New legislation for bus services in the UKThe new legislation on bus services in the UK (Bus Services Act) was passed in April 2017. This could allow some UK cities to introduce bus franchising, as is already the case in Greater london. There could be potential opportunities to support patronage growth through greater collaboration with local authorities.
Follow-on regulation governing equalization payments for level crossingsThe equalization payments made by the Federal Govern-ment for level crossings offset half of the costs incurred for operating and maintaining the crossings used by both rail and road vehicles. The payments will run until the end of 2017 on the basis of European (EEC) regulation 1192/69, which has been in force since 1969. Following the consoli-dation of existing EU legislation as part of the fourth rail- way package, appropriate connection regulations at Federal level will be necessary from 2018.
Prohibition on the operation of loud freight cars approved The law banning the operation of loud freight cars envis-ages a complete ban on the use of loud freight cars starting with the 2020/2021 working timetable. In addition, the law provides for certain exceptions and exemptions: for ex -ample, the use of loud cars, based on case-by-case examina-tion by the infrastructure operator. This requires that, by specifying a reduced speed, the noise emitted by a train with loud freight cars is not louder than that emitted by a train with refitted cars. The exception is restricted to non- scheduled transport.
Master plan for rail freight transport presentedOn June 23, 2017, Federal Transport Minister Alexander Dobrindt presented the “Master Plan for Rail Freight” as part of a cross-industry initiative. The master plan proposes concrete measures for sustainably strengthening rail freight transport by 2030. The plan is made up of ten measures that include both entrepreneurial and political tasks to im prove the competitiveness of rail freight. The planned reduction in the train-path pricing is of special note. The negotiations between the Federal Government and DB netz AG for the implementation of this project should be completed by the end of 2017. In addition, the master plan includes the con-struction of test field in Munich for the automation of train formation as well as a capital expenditure program for the modernization of rail freight transport.
Network Modernization Act adoptedThe new network Modernization Act provides, among other things, for the restructuring of the so-called avoided grid charges. For the determination of avoided grid charges for locally controllable systems, and consequently also for the traction current plants, the calculation basis is frozen at the 2016 level. In addition, certain cost components, such as offshore connection costs, are factored out. The changes will be effective in 2018.
Regulations on automated drivingOn March 30, 2017, the German Bundestag adopted regula-tions for driving vehicles with highly and fully automated driving systems. The law makes it clear that the operation of motor vehicles using highly and fully automated driving systems is permitted “in accordance with its intended pur-pose.” If, for example, the automated driving system is only designed for use on highways, the vehicle may not be used on other roads. The law also regulates liability issues.
New regulations on road traffic On May 31, 2017, the Commission presented its recommen-dations on the “Europe on the Move” strategy. The purpose of this strategy is to further regulate market access and social conditions in road freight traffic. The application of minimum wage laws to truck drivers, stricter regulations on driving and rest periods, and simplified cabotage regula-tions are intended to improve road safety, combat illegal employment and ensure appropriate conditions for workers. A further focus is on proposals for fairer, more environmen-tally friendly and standardized toll collection in the EU. Additional proposals, including on market access for long- distance buses, on emissions standards for passenger vehi-cles, and, for the first time, for heavy commercial vehicles, are planned for the coming 12 months.
11
BUSInESS AnD OvERAll COnDITIOnS
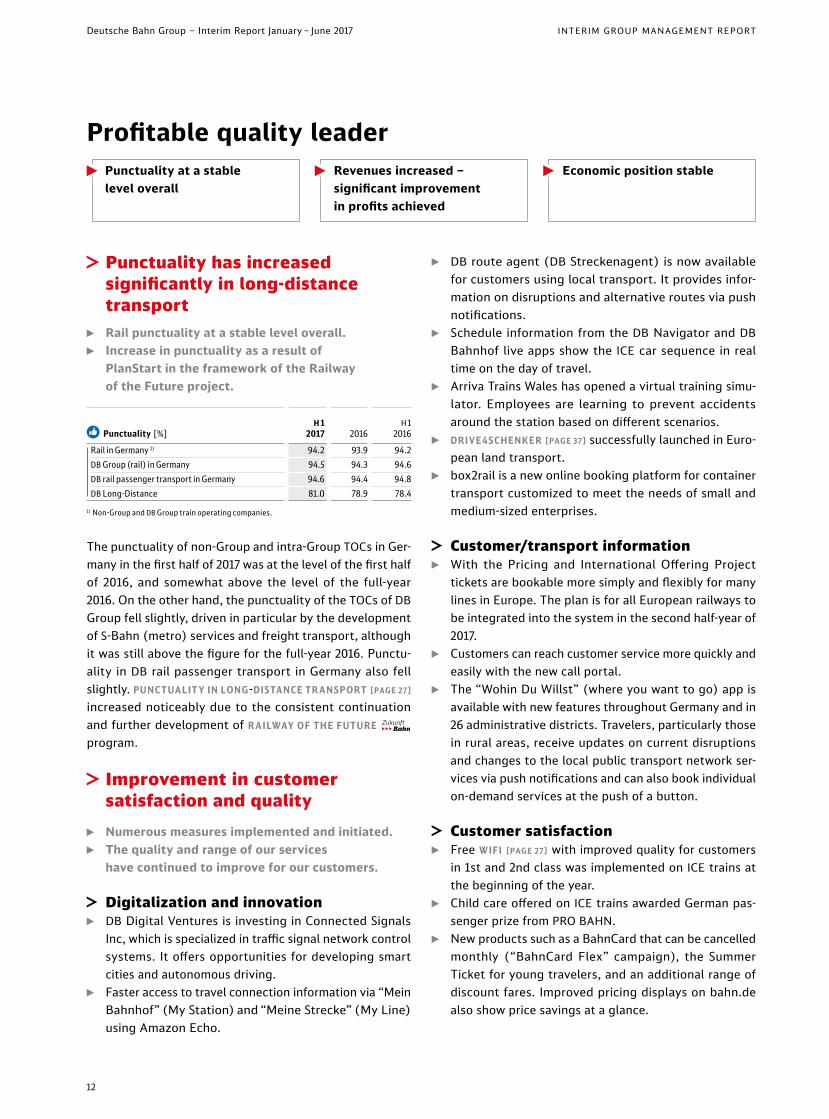
≈ Punctuality has increased significantly in long-distance transport
◊ Rail punctuality at a stable level overall. ◊ Increase in punctuality as a result of
PlanStart in the framework of the Railway of the Future project.
¿ Punctuality [%]H 1
2017 2016H 1
2016
Rail in Germany 1) 94.2 93.9 94.2DB Group (rail) in Germany 94.5 94.3 94.6DB rail passenger transport in Germany 94.6 94.4 94.8DB Long-Distance 81.0 78.9 78.4
1) Non-Group and DB Group train operating companies.
The punctuality of non-Group and intra-Group TOCs in Ger-many in the first half of 2017 was at the level of the first half of 2016, and somewhat above the level of the full-year 2016. On the other hand, the punctuality of the TOCs of DB Group fell slightly, driven in particular by the development of S-Bahn (metro) services and freight transport, although it was still above the figure for the full-year 2016. Punctu-ality in DB rail passenger transport in Germany also fell slightly. PUNC TUALIT Y IN LONG -DISTANCE TR ANSPORT [PAGE 2 7 ] increased noticeably due to the consistent continuation and further development of R AILWAY OF THE FUTURE program.
≈ Improvement in customer satisfaction and quality
◊ Numerous measures implemented and initiated. ◊ The quality and range of our services
have continued to improve for our customers.
≈ Digitalization and innovation ◊ DB Digital Ventures is investing in Connected Signals
Inc, which is specialized in traffic signal network control systems. It offers opportunities for developing smart cities and autonomous driving.
◊ Faster access to travel connection information via “Mein Bahnhof” (My Station) and “Meine Strecke” (My Line)using Amazon Echo.
◊ DB route agent (DB Streckenagent) is now available for customers using local transport. It provides infor -ma tion on disruptions and alternative routes via push notifications.
◊ Schedule information from the DB Navigator and DB Bahnhof live apps show the ICE car sequence in real time on the day of travel.
◊ Arriva Trains Wales has opened a virtual training simu-lator. Employees are learning to prevent accidents around the station based on different scenarios.
◊ DRIVE 4 SCHENKER [PAGE 3 7 ] successfully launched in Euro-pean land transport.
◊ box2rail is a new online booking platform for container transport customized to meet the needs of small and medium-sized enterprises.
≈ Customer/transport information ◊ With the Pricing and International Offering Project
tickets are bookable more simply and flexibly for many lines in Europe. The plan is for all European railways to be integrated into the system in the second half-year of 2017.
◊ Customers can reach customer service more quickly and easily with the new call portal.
◊ The “Wohin Du Willst” (where you want to go) app is available with new features throughout Germany and in 26 administrative districts. Travelers, particularly those in rural areas, receive updates on current disruptions and changes to the local public transport network ser-vices via push notifications and can also book individual on-demand services at the push of a button.
≈ Customer satisfaction ◊ Free WIFI [PAGE 2 7 ] with improved quality for customers
in 1st and 2nd class was implemented on ICE trains at the beginning of the year.
◊ Child care offered on ICE trains awarded German pas-senger prize from PRO BAHN.
◊ New products such as a BahnCard that can be cancelled monthly (“BahnCard Flex” campaign), the Summer Ticket for young travelers, and an additional range of discount fares. Improved pricing displays on bahn.de also show price savings at a glance.
Profitable quality leaderPunctuality at a stable level overall
Revenues increased – significant improvement in profits achieved
Economic position stable
12
Deutsche Bahn Group – Interim Report January – June 2017 INTERIM GROUP MANAGEMENT REPORT

≈ Positive economic position
≈ Improved profit situation ◊ Revenue development clearly positive. ◊ Operating profit with strong growth. ◊ Net financial debt increased. ◊ Key value management figures improved.
No major restrictions in comparability to H 1 2016Trends in expenses and income in the first half of 2017 were not materially affected by CHANGE S IN THE SCOPE OF CONSOLIDATION [PAGE 58 F.].
Significant increase in revenuesRevenue development was very positive in the first half of 2017, and was even better on a comparable basis. The positive operating development was supported in par ti c - ular by DB Schenker, DB Arriva, DB Long-Distance and DB Netze Track. Negative exchange rate effects primarily from the DEVELOPMENT OF THE BRITISH P OUND [PAGE 6] had a debilitating effect.
◊ Regional transport customers have been able to provide real-time feedback on selected lines since April. Custo- mer satisfaction with regional train services is regularly queried with system Railmate, which is already well- established for ICE services.
≈ Product quality ◊ The ICE P ORTAL [PAG E 2 7 ] has been offering entertain -
ment and information services extended by films and series since the end of March.
◊ DB Regional is testing free WiFi in some regions togeth- er with the public transport authorities. The aim is to have WiFi installed on most of the fleet by 2020 in close co operation with the public transport authorities.
◊ Since early 2017, it has been possible to reserve seats on selected regional transport lines for single journeys when purchasing network tickets and tickets from vend- ing machines. Continuous service expansion planned for further lines and sales channels.
◊ The DB Lounge concept has been revised. The pilot project is being presented in Nuremberg in July 2017.
◊ A new platform waiting room at Wolfsburg central sta-tion. Armrests on bench seats with USB ports. Digital dis play panels for traveler information are being piloted.
◊ Pilot project for reporting dirt in Berlin, Hanover and Hamburg via WhatsApp message. This will be expanded to over 80 major stations across Germany following test phase.
≈ Punctuality ◊ Expansion of PL ANSTART [2016 INTEGR ATED R EP ORT, PAGE 1 4 F.
AND 101] to further stations. ◊ Punctuality teams are aiming at improving punctuality
in regional transport. More than 500 individual mea-sures have been developed so far, and a larger number of these have already been implemented.
◊ A management center has been set up to optimize con-struction planning and minimize the impact on current operations.
◊ Expansion of preventive maintenance of switches through roll-out of DIGITAL REMOTE DIAGNOSTICS SYSTEM (DIAGNOSTIC S PL ATFORM DIANA) [PAGE 4 0].
◊ Increased punctuality by exploiting the opportunities of digitalization:
≈ Optimized predictive maintenance through WAYSIDE MONITORING [PAGE 4 0].
≈ TechLOK records, processes and displays the sen- sor data from the DB Cargo traction unit fleet and provides indications of potential failures before these occur.
≈ Use of 3D printing to produce spare parts for points liable to failure. Minimization of faults in advance and increased availability of trains.
≈ Interlinked mobility ◊ DB Mitfahrer (ride sharing) app extended to a further
five Federal states. ◊ In cooperation with Lidl, we have been offering a free-
floating system integrated into the Call-a-Bike system that provides 3,500 rental bicycles throughout Berlin since March.
≈ Safety ◊ About 7,000 cameras will be in operation at about 1,000
stations by the end of 2017. There are about 28,000 cam-eras installed on trains in the regional and metro trans-port network. Together with the Federal Government of Germany, we are investing € 85 million on upgrading and expanding video technology facilities. The program received a further € 10 million in 2017.
◊ Increased use of patrol dogs in the future. There should be at least 30 patrol dog handlers on duty at major sta-tions by 2019; currently they are ten.
◊ Bodycams tested for 8,800 operating hours are aimed at protecting employees from attacks in Berlin and Cologne. Positive test results have reinforced our com-mitment to fit security personnel with bodycams at focal points.
13
PROFITABLE qUALITy LEADER
◊ The special items in the first half of 2017 resulted from revenue discounts for previous years.
◊ Effects from changes in the scope of consolidation re late to DB Schenker (€ 13 million) and DB Arriva (€ 16 million).
◊ Effects of EXCHANGE R ATE CHANGES [PAGE 6] were attribut-able to DB Arriva (€ –175 million), DB Schenker (€ +10 mil-lion) and DB Cargo (€ –14 million).
◊ The R EVENUE DEVELOPMENT OF THE BUSINE S S UNIT S [PAG E
2 5 FF.] was overwhelmingly positive in the first half of 2017. ◊ Revenues increased even more strongly on a compa-
rable basis (adjusted for special items, exchange rate changes and changes in the scope of consolidation).
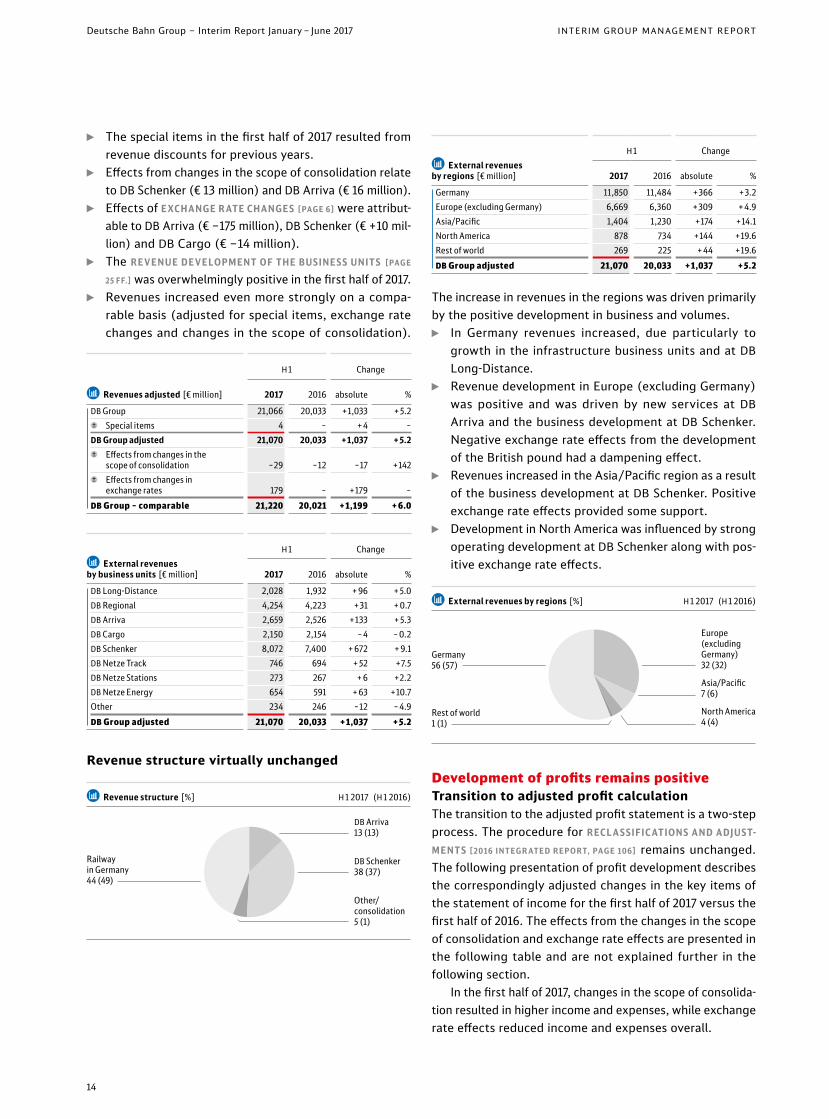
Æ Revenues adjusted [€ million]
H 1 Change
2017 2016 absolute %
DB Group 21,066 20,033 +1,033 + 5.2 Special items 4 – + 4 –
DB Group adjusted 21,070 20,033 +1,037 + 5.2 Effects from changes in the
scope of consolidation –29 –12 –17 +142 Effects from changes in
exchange rates 179 – +179 –DB Group – comparable 21,220 20,021 + 1,199 + 6.0
Æ External revenues by business units [€ million]
H 1 Change
2017 2016 absolute %
DB Long-Distance 2,028 1,932 + 96 + 5.0DB Regional 4,254 4,223 + 31 + 0.7DB Arriva 2,659 2,526 +133 + 5.3DB Cargo 2,150 2,154 – 4 – 0.2DB Schenker 8,072 7,400 + 672 + 9.1DB Netze Track 746 694 + 52 +7.5DB Netze Stations 273 267 + 6 +2.2DB Netze Energy 654 591 + 63 +10.7Other 234 246 –12 – 4.9DB Group adjusted 21,070 20,033 + 1,037 + 5.2
Revenue structure virtually unchanged
Æ Revenue structure [%] H 1 2017 (H 1 2016)
Railway in Germany 44 (49)
DB Arriva 13 (13)
DB Schenker 38 (37)
Other/ consolidation 5 (1)
Æ External revenues by regions [€ million]
H 1 Change
2017 2016 absolute %
Germany 11,850 11,484 + 366 + 3.2Europe (excluding Germany) 6,669 6,360 + 309 + 4.9Asia/Pacific 1,404 1,230 +174 +14.1North America 878 734 +144 +19.6Rest of world 269 225 + 44 +19.6DB Group adjusted 21,070 20,033 + 1,037 + 5.2
The increase in revenues in the regions was driven primarily by the positive development in business and volumes.
◊ In Germany revenues increased, due particularly to growth in the infrastructure business units and at DB Long-Distance.
◊ Revenue development in Europe (excluding Germany) was positive and was driven by new services at DB Arriva and the business development at DB Schenker. Negative exchange rate effects from the development of the British pound had a dampening effect.
◊ Revenues increased in the Asia/Pacific region as a result of the business development at DB Schenker. Positive exchange rate effects provided some support.
◊ Development in North America was influenced by strong operating development at DB Schenker along with pos-itive exchange rate effects.
Æ External revenues by regions [%] H 1 2017 (H 1 2016)
Development of profits remains positiveTransition to adjusted profit calculationThe transition to the adjusted profit statement is a two-step process. The procedure for RECL A S SIFIC ATIONS AND ADJUST-MENT S [ 20 16 IN TEG R ATED R EP O RT, PAG E 10 6] remains unchanged. The following presentation of profit development describes the correspondingly adjusted changes in the key items of the statement of income for the first half of 2017 versus the first half of 2016. The effects from the changes in the scope of consolidation and exchange rate effects are presented in the following table and are not explained further in the following section.
In the first half of 2017, changes in the scope of consolida-tion resulted in higher income and expenses, while exchange rate effects reduced income and expenses overall.
Germany 56 (57)
Rest of world 1 (1)
Europe (excluding Germany) 32 (32)
Asia/Pacific 7 (6)
North America 4 (4)
14
Deutsche Bahn Group – Interim Report January – June 2017 INTERIM GROUP MANAGEMENT REPORT
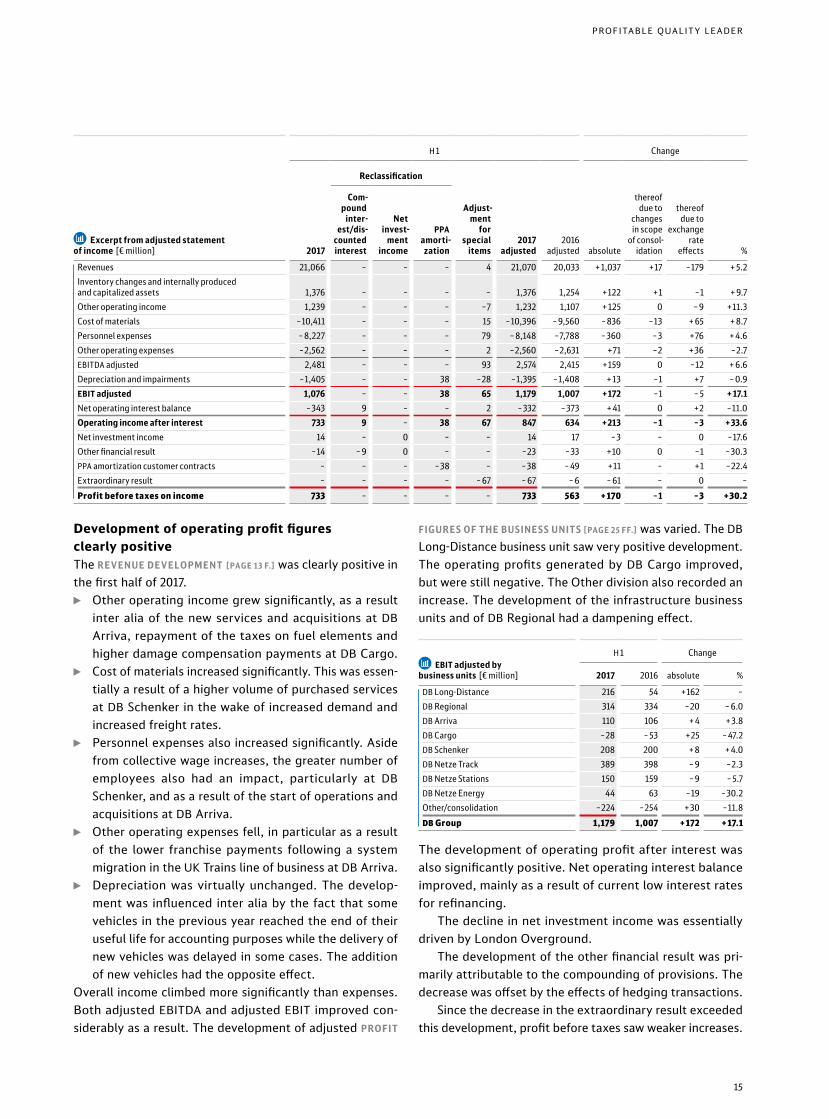
Development of operating profit figures clearly positiveThe REVENUE DEVELOPMENT [PAGE 1 3 F.] was clearly positive in the first half of 2017.
◊ Other operating income grew significantly, as a result inter alia of the new services and acquisitions at DB Arriva, repayment of the taxes on fuel elements and higher damage compensation payments at DB Cargo.
◊ Cost of materials increased significantly. This was essen-tially a result of a higher volume of purchased services at DB Schenker in the wake of increased demand and increased freight rates.
◊ Personnel expenses also increased significantly. Aside from collective wage increases, the greater number of employees also had an impact, particularly at DB Schenker, and as a result of the start of operations and acquisitions at DB Arriva.
◊ Other operating expenses fell, in particular as a result of the lower franchise payments following a system migration in the UK Trains line of business at DB Arriva.
◊ Depreciation was virtually unchanged. The develop-ment was influenced inter alia by the fact that some vehicles in the previous year reached the end of their useful life for accounting purposes while the delivery of new vehicles was delayed in some cases. The addition of new vehicles had the opposite effect.
Overall income climbed more significantly than expenses. Both adjusted EBITDA and adjusted EBIT improved con-siderably as a result. The development of adjusted PROFIT
FIGURES OF THE BUSINES S UNITS [PAGE 2 5 FF.] was varied. The DB Long-Distance business unit saw very positive development. The operating profits generated by DB Cargo improved, but were still negative. The Other division also recorded an increase. The development of the infrastructure business units and of DB Regional had a dampening effect.
Æ EBIT adjusted by business units [€ million]
H 1 Change
2017 2016 absolute %
DB Long-Distance 216 54 +162 –DB Regional 314 334 –20 – 6.0DB Arriva 110 106 + 4 + 3.8DB Cargo –28 – 53 +25 – 47.2DB Schenker 208 200 + 8 + 4.0DB Netze Track 389 398 – 9 –2.3DB Netze Stations 150 159 – 9 – 5.7DB Netze Energy 44 63 –19 –30.2Other/consolidation –224 –254 + 30 –11.8DB Group 1,179 1,007 + 172 + 17.1
The development of operating profit after interest was also significantly positive. Net operating interest balance improved, mainly as a result of current low interest rates for refinancing.
The decline in net investment income was essentially driven by London Overground.
The development of the other financial result was pri-marily attributable to the compounding of provisions. The decrease was offset by the effects of hedging transactions.
Since the decrease in the extraordinary result exceeded this development, profit before taxes saw weaker increases.
Æ Excerpt from adjusted statement of income [€ million]
H 1 Change
2017
Reclassification
Adjust- ment
for special
items2017
adjusted2016
adjusted absolute
thereof due to
changes in scope
of consol- idation
thereof due to
exchange rate
effects %
Com- pound
inter- est/dis-
counted interest
Netinvest-
ment income
PPA amorti- zation
Revenues 21,066 – – – 4 21,070 20,033 + 1,037 +17 –179 + 5.2Inventory changes and internally produced and capitalized assets 1,376 – – – – 1,376 1,254 +122 +1 –1 + 9.7Other operating income 1,239 – – – –7 1,232 1,107 + 125 0 – 9 +11.3Cost of materials –10,411 – – – 15 –10,396 – 9,560 – 836 –13 + 65 + 8.7Personnel expenses – 8,227 – – – 79 – 8,148 –7,788 –360 –3 +76 + 4.6Other operating expenses –2,562 – – – 2 –2,560 –2,631 +71 –2 + 36 –2.7EBITDA adjusted 2,481 – – – 93 2,574 2,415 +159 0 –12 + 6.6Depreciation and impairments –1,405 – – 38 –28 –1,395 –1,408 + 13 –1 +7 – 0.9EBIT adjusted 1,076 – – 38 65 1,179 1,007 +172 –1 – 5 + 17.1Net operating interest balance –343 9 – – 2 –332 –373 + 41 0 +2 –11.0Operating income after interest 733 9 – 38 67 847 634 +213 –1 –3 + 33.6Net investment income 14 – 0 – – 14 17 –3 – 0 –17.6Other financial result –14 – 9 0 – – –23 –33 +10 0 –1 –30.3PPA amortization customer contracts – – – –38 – –38 – 49 +11 – +1 –22.4Extraordinary result – – – – – 67 – 67 – 6 – 61 – 0 –Profit before taxes on income 733 – – – – 733 563 + 170 –1 –3 + 30.2
15
PROFITABLE qUALITy LEADER

Extraordinary charges increased slightly
Æ Extraordinary result [€ million]
H 1
2017
thereof affect-
ing EBIT 2016
thereof affecting
EBIT
DB Long-Distance – – – –DB Regional 28 28 – –DB Arriva 0 0 –3 –3DB Cargo –1 –1 0 0DB Schenker –1 –1 – –DB Netze Track –3 –3 –3 –3DB Netze Stations –3 –3 –1 –1DB Netze Energy –15 –15 – –Other/consolidation 1) –72 –72 1 2DB Group – 67 – 67 – 6 – 5
The extraordinary result saw weaker development in the first half of 2017 and is comprised of the following special items:
◊ Effects from appreciation of vehicles at DB Regional ◊ Effects associated with the financing of Germany’s
nuclear phase-out at DB Netze Energy ◊ Expenses from the formation of provisions for em -
ployee contractual obligations in the Other divisionThe extraordinary result in the first half of 2016 is comprised of the following special items:
◊ Expenses for provisions for civil proceedings related to infrastructure fees at DB Netze Track and DB Netze Stations
◊ Expenses relating to the reversal of hedging transactions at DB Arriva
Profit after taxes improved significantly
Æ Excerpt from statement of income [€ million]
H 1 Change
2017 2016 absolute % Profit before taxes on income 733 563 +170 + 30.2
Taxes on income 46 40 + 6 + 5.0 Actual income taxes – 82 – 88 + 6 – 6.8 Deferred tax expenses 128 128 – –Net profit (after taxes) 779 603 + 176 + 29.2 DB AG shareholders 766 591 +175 +29.6 Minority interests 13 12 +1 + 8.3
The significant improvement in profits before taxes was also evident in the profit after taxes. The impact of the rise in the positive income tax position based on a low level was not material here.
The net profit attributable to the shareholders of DB AG along with minority interests saw positive development in the first half of 2017.
≈ Stable financial situation ◊ Financial management unchanged. ◊ Ratings stable. ◊ Three bonds issued.
In addition to aiming for a sustained rise in enterprise value, DB Group’s financial management focuses on maintaining a capital structure that will ensure excellent credit ratings. Please see VALUE MANAGEMENT [PAGE 1 7 F.] for detailed infor-mation on the key figures used: redemption coverage, gearing and net financial debt/EBITDA.
There were no changes to DB Groupʼs FINANCIAL MAN -AGEMENT SYSTEM [2016 INTEGR ATED R EP ORT, PAGE 1 10] in the first half of 2017. The process that was launched to relocate the registered office of Deutsche Bahn Finance B.V. (DB Finance), Amsterdam/the Netherlands to Germany should be completed in the second half of 2017.
DB Group has a long-term European debt issuance pro-gram available in the amount of € 25 billion. A total of THREE BONDS WERE IS SUED VIA DB FINANCE IN THE FIR ST HALF OF 201 7 [PAG E 1 7 ], with the funds from the GBP bond most recently issued only received in July 2017. One bond for
€ 500 million was redeemed. Absolute utilization of the European debt issuance program increased slightly by
€ 0.1 billion as of June 30, 2017 compared with the end of the previous year. The degree of utilization as of June 30, 2017 is 79% (as of December 31, 2016: 78%).
We also launched an Australian debt issuance program (Kangaroo Program) for AUD 5 billion in the first half of 2017 in order to be able to respond to investor demand in the Asia/Pacific region. This program has not yet been utilized.
A multi-currency multi-issuer commercial paper pro-gram with a volume of € 2 billion remains available in the area of short-term debt financing, which like the end of the previous year had not been utilized as of June 30, 2017.
As of June 30, 2017, we also had guaranteed unutilized credit facilities of € 2.0 billion (as of December 31, 2016: € 2.0 billion), with a remaining term of between 1.0 and 2.0 years as well as further guaranteed unutilized credit facili-ties of € 0.1 billion (as of December 31, 2016: € 0.1 billion).
In addition, credit facilities of € 2.2 billion for the oper-ating business were available as of June 30, 2017 (as of December 31, 2016: € 2.2 billion). These credit facilities, which are made available to our subsidiaries around the world, include provisions for financing working capital as well as sureties for payment.
No major finance lease transactions were concluded in the first half of 2017.
16
Deutsche Bahn Group – Interim Report January – June 2017 INTERIM GROUP MANAGEMENT REPORT
Ratings stable
Ratings DB AG
First issued
Lastcon-
firmed
Current ratings
Short- term
Long- term Outlook
S & P Global RatingsMay 16,
2000Jul 15, 2016 A–1+ AA– stable
Moody’sMay 16,
2000Sep 28,
2015 P–1 Aa1 stable
The creditworthiness of DB Group is constantly monitored and assessed by the rating agencies S&P Global Ratings (S&P) and Moody’s. Both agencies published updated assessments on DB AG in the first half-year of 2017 and left the ratings and outlook unchanged.
Please see our investor relations Web site for additional information on the subject of R ATINGS Π[ W W W.DB.DE/R ATING - E]
and the complete analysis of DB AG by the rating agencies.
Three bonds issued
ISIN IssuerCur-
rencyVolume
(million) Coupon
(%)Matu-
rityTerm
(years)
XS1566135098DB
Finance NOK 700 2.490February
2032 15
XS1626600040DB
Finance EUR 500 1.500Decem-
ber 2032 15.5
XS1640854144 1)DB
Finance GBP 300 1.375July
2025 81) Funds received on July 2017.
In the first half-year of 2017, we issued three bonds with a total volume of € 0.9 billion through DB Finance. The cash inflow from the GBP bond most recently issued was only received in July 2017. The funds were raised to refinance due liabilities, and for capital expenditures.
◊ A NOK 700 million (€ 79 million) private placement among institutional investors in Norway. The proceeds were swapped into euros.
◊ A public bond for € 500 million that represents our longest bond issued in euros so far at 15.5 years. The demand arose predominantly from Germany, France and Great Britain.
◊ A further public bond for GBP 300 million (€ 341 mil-lion). The proceeds were swapped into euros. The demand arose in particular from Great Britain.
≈ Key value management figures improved ◊ Development of operating profits promotes
ROCE and redemption coverage. ◊ Equity and EBITDA drive improvements in gearing
and/or net financial debt/EBITDA.
ROCE increased
Æ ROCE [€ million]
H 1 Change
2017 2016 absolute %
EBIT adjusted 1) 1,179 1,007 +172 +17.1 Capital employed as of Jun 30 34,581 33,462 +1,119 + 3.3
ROCE (%) 6.8 6.0 – –Target value (%) ≥ 9.0 ≥ 9.0 – –
1) Figures extrapolated to the full year for calculation purposes.
The ROCE improved in the first half of 2017. This was the result of a significant improvement in adjusted EBIT in con-junction with a proportionately smaller increase in capital employed. The increase in capital employed was predomi-nantly attributable to an increase in receivables and other assets.
Key debt ratios improvedRedemption coverage improved
Æ Redemption coverage 1) [€ million]
H 1 Change
2017 2016 absolute %
EBITDA adjusted 2) 2,574 2,415 +159 + 6.6 Net operating interest 2) –332 –373 + 41 –11.0 Depreciable portion of lease rates 2) 522 497 +25 + 5.0 Original tax expenses 2) – 82 – 88 + 6 – 6.8
Operating cash flow after taxes 2,682 2,450 +232 + 9.5Net financial debt as of Jun 30 19,030 18,159 + 871 + 4.8
Present value operate leases as of Jun 30 4,798 4,874 –76 –1.6
Adjusted net financial debt as of Jun 30 23,828 23,033 +795 + 3.5
Pension obligations as of Jun 30 3,947 4,895 – 948 –19.4 Adjusted net debt as of Jun 30 27,775 27,928 –153 – 0.5
Redemption coverage (%) 19.3 17.5 – –Target value (%) ≥ 25.0 ≥ 25.0 – –
1) Change in method as of year end 2016 [2016 INTEGR ATED REPORT, PAGE 84 F.] retroactively adjusted.
2) Figures extrapolated to the full year for calculation purposes.
The redemption coverage improved as of June 30, 2017 driven by a significant increase in the operating cash flow after taxes. The slight decrease in adjusted net debt also provided some support. The fall in PEN SION OBLIG ATION S [PAGE 20] as a result of interest rates made itself felt here.
17
PROFITABLE qUALITy LEADER

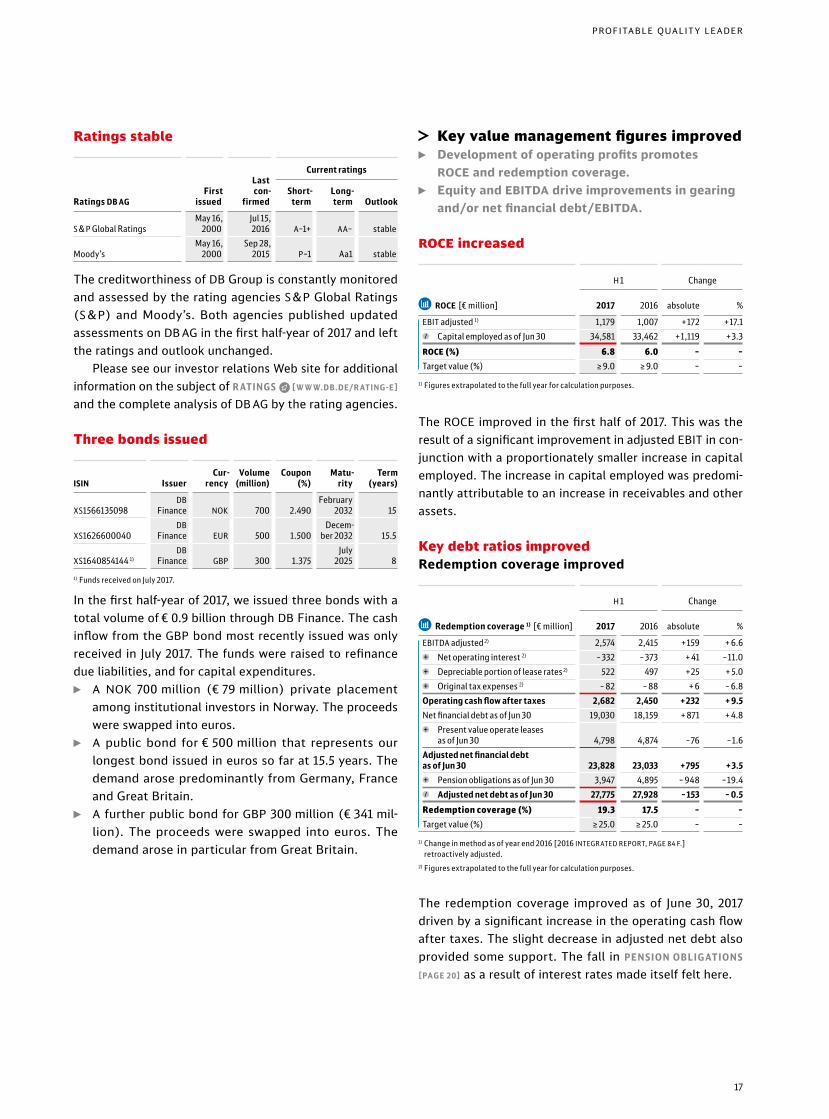
Gearing slightly improved
Æ Gearing as of Jun 30 [€ million] 2017 2016
Change
absolute %
Net financial debt 19,030 18,159 + 871 + 4.8 Equity 13,446 12,060 +1,386 +11.5
Gearing (%) 142 151 – –Target value (%) 100 100 – –
Gearing improved slightly as of June 30, 2017, but remains above the target value of 100%. The significant increase in EQUIT Y [PAGE 20] was the driver for this.
Net financial debt/EBITDA improved
Æ Net financial debt/EBITDA [€ million]
H 1 Change
2017 2016 absolute %
Net financial debt as of Jun 30 19,030 18,159 + 871 + 4.8 EBITDA adjusted 1) 2,574 2,415 +159 + 6.6
Net financial debt / EBITDA (multiple) 3.7 3.8 – –Target value (%) ≤ 2.5 ≤ 2.5 – –
1) Figures extrapolated to calculate the key figure for the full year
The key figure net financial debt/EBITDA improved slightly in the first half of 2017. The increase in net financial debt was overcompensated by improved adjusted EBITDA.
≈ Cash and cash equivalents significantly lower
Æ Summary statement of cash flows [€ million]
H 1 Change
2017 2016 absolute %
Cash flow from business operations 762 1,523 –761 – 50.0Cash flow from investing activities –1,496 –1,310 –186 +14.2Cash flow from financing activities –773 – 999 +226 –22.6Net change in cash and cash equivalents –1,544 – 832 –712 + 85.6Cash and cash equivalents as of Jun 30/Dec 31 2,906 4,450 –1,544 –34.7
◊ Negative working capital effects played a crucial role in the significant decline in cash flow from ordinary busi-ness operations. The payment arising as a result of the DISPOSAL FUND AC T [PAGE 4 5] was one of the factors that had an impact here. The positive development of profit before taxes, depreciation and interest (€ +64 million) compensated for this slightly.
◊ Cash outflow from investing activities increased. This was essentially the result of higher payments for net capital expenditures (€ +150 million). Payments for the repayment of investment grants also increased (€ +29 million).
◊ The cash outflow from financing activities fell driven by the lower dividend payments (€ –250 million). A higher cash inflow from the BOND I S SUE S [PAG E 1 7 ] (€ +82 mil-lion) along with lower cash outflows for repayments of finance leasing obligations (€ –34 million) provided some support here. By contrast, the cash inflow in particular fell from raising loans (€ –143 million).
◊ As of June 30, 2017, DB Group held significantly fewer cash and cash equivalents compared with the end of the previous year as scheduled.
≈ Asset situation stable ◊ Net financial debt increased. ◊ Capital expenditures increased significantly. ◊ Improvement in the equity ratio.
Net financial debt increased
Æ Net financial debt [€ million]Jun 30,
2017Dec 31,
2016
Change
absolute %
Interest-free loans 992 1,172 –180 –15.4Finance lease liabilities 520 533 –13 –2.4Other financial debt 20,715 20,776 – 62 – 0.3 thereof bonds 19,674 19,740 – 66 – 0.3Financial debt 22,227 22,481 –254 –1.1
Cash and cash equivalents and receivables from financing –3,045 – 4,584 +1,539 –33.6
Effects from currency hedges –152 –273 +121 – 44.3Net financial debt 19,030 17,624 + 1,406 + 8.0
◊ Within financial debt, interest-free loans and finance lease liabilities declined due to continuous repayments.
◊ Other financial debt was significantly shaped by the development of the bond portfolio. Over the year so far, new BONDS [PAGE 1 7 ] were issued with cash inflows in the first half of 2017 of € 0.6 billion, and one bond was redeemed with a countervalue of € 0.5 billion. In addi-tion, the bond portfolio decreased as of June 30, 2016 due to exchange rate effects (€ –0.2 billion). The develop-ment of the BRITISH POUND [PAGE 6] and the Swiss franc in particular resulted in lower debt.
◊ Since our foreign currency-denominated bonds are, with very few exceptions, hedged against currency fluctua-tions by corresponding derivatives, exchange rate effects are offset by the corresponding opposite position of the hedge. The effects from currency hedges relating to the hedged exchange rate at the time of issuance declined as compared with December 31, 2016.
18
Deutsche Bahn Group – Interim Report January – June 2017 INTERIM GROUP MANAGEMENT REPORT
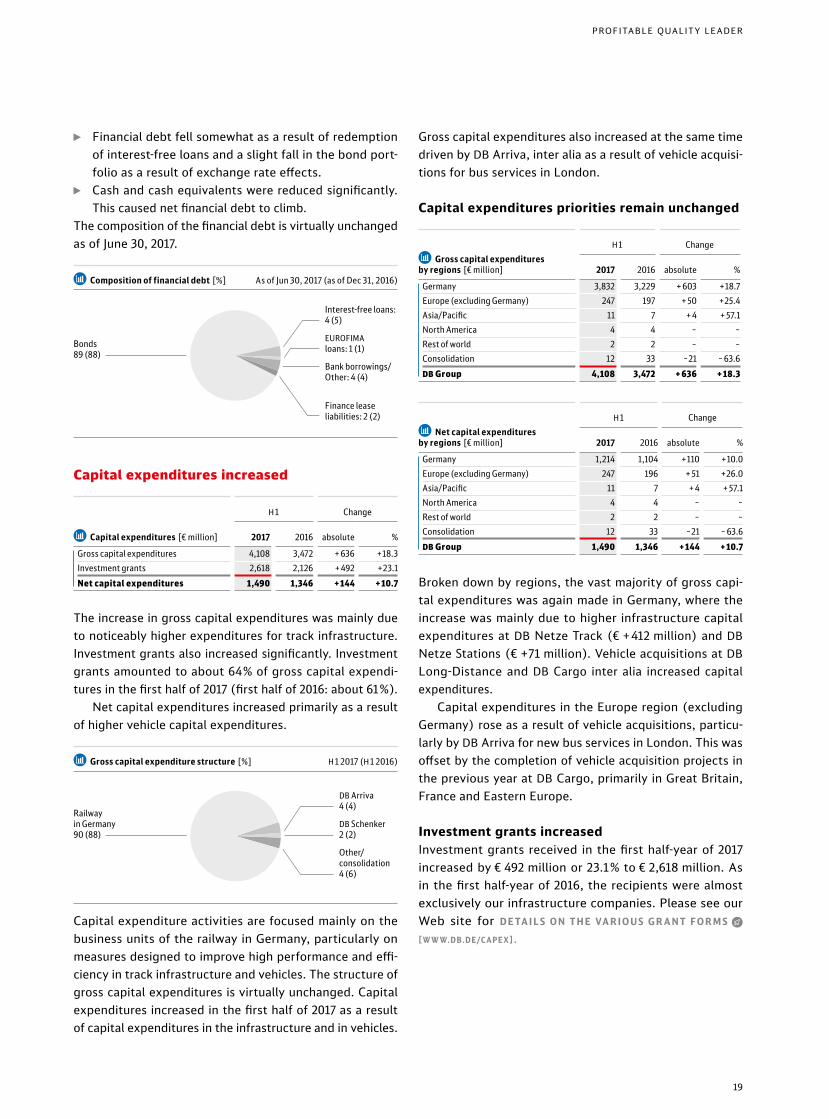
◊ Financial debt fell somewhat as a result of redemption of interest-free loans and a slight fall in the bond port-folio as a result of exchange rate effects.
◊ Cash and cash equivalents were reduced significantly. This caused net financial debt to climb.
The composition of the financial debt is virtually unchanged as of June 30, 2017.
Æ Composition of financial debt [%] As of Jun 30, 2017 (as of Dec 31, 2016)
Capital expenditures increased
Æ Capital expenditures [€ million]
H 1 Change
2017 2016 absolute %
Gross capital expenditures 4,108 3,472 + 636 +18.3Investment grants 2,618 2,126 + 492 +23.1Net capital expenditures 1,490 1,346 + 144 + 10.7
The increase in gross capital expenditures was mainly due to noticeably higher expenditures for track infrastructure. Investment grants also increased significantly. Investment grants amounted to about 64% of gross capital expendi-tures in the first half of 2017 (first half of 2016: about 61%).
Net capital expenditures increased primarily as a result of higher vehicle capital expenditures.
Æ Gross capital expenditure structure [%] H 1 2017 (H 1 2016)
Capital expenditure activities are focused mainly on the business units of the railway in Germany, particularly on measures designed to improve high performance and effi-ciency in track infrastructure and vehicles. The structure of gross capital expenditures is virtually unchanged. Capital expenditures increased in the first half of 2017 as a result of capital expenditures in the infrastructure and in vehicles.
Gross capital expenditures also increased at the same time driven by DB Arriva, inter alia as a result of vehicle acquisi-tions for bus services in London.
Capital expenditures priorities remain unchanged
Æ Gross capital expenditures by regions [€ million]
H 1 Change
2017 2016 absolute %
Germany 3,832 3,229 + 603 +18.7Europe (excluding Germany) 247 197 + 50 +25.4Asia/Pacific 11 7 + 4 + 57.1North America 4 4 – –Rest of world 2 2 – –Consolidation 12 33 –21 – 63.6DB Group 4,108 3,472 + 636 + 18.3
Æ Net capital expenditures by regions [€ million]
H 1 Change
2017 2016 absolute %
Germany 1,214 1,104 +110 +10.0Europe (excluding Germany) 247 196 + 51 +26.0Asia/Pacific 11 7 + 4 + 57.1North America 4 4 – –Rest of world 2 2 – –Consolidation 12 33 –21 – 63.6DB Group 1,490 1,346 + 144 + 10.7
Broken down by regions, the vast majority of gross capi- tal expenditures was again made in Germany, where the in crease was mainly due to higher infrastructure capital ex penditures at DB Netze Track (€ +412 million) and DB Netze Stations (€ +71 million). Vehicle acquisitions at DB Long-Distance and DB Cargo inter alia increased capital expenditures.
Capital expenditures in the Europe region (excluding Germany) rose as a result of vehicle acquisitions, particu-larly by DB Arriva for new bus services in London. This was offset by the completion of vehicle acquisition projects in the previous year at DB Cargo, primarily in Great Britain, France and Eastern Europe.
Investment grants increasedInvestment grants received in the first half-year of 2017 increased by € 492 million or 23.1% to € 2,618 million. As in the first half-year of 2016, the recipients were almost exclusively our infrastructure companies. Please see our Web site for D E TA I L S O N T H E VA R I O U S G R A N T F O R M S Œ
[ W W W.DB.DE /C APE X].
Bonds 89 (88)
Interest-free loans: 4 (5)
EUROFIMA loans: 1 (1)
Bank borrowings/Other: 4 (4)
Finance lease liabilities: 2 (2)
DB Arriva 4 (4)
DB Schenker 2 (2)
Other/ consolidation 4 (6)
Railway in Germany 90 (88)
19
PROFITABLE qUALITy LEADER
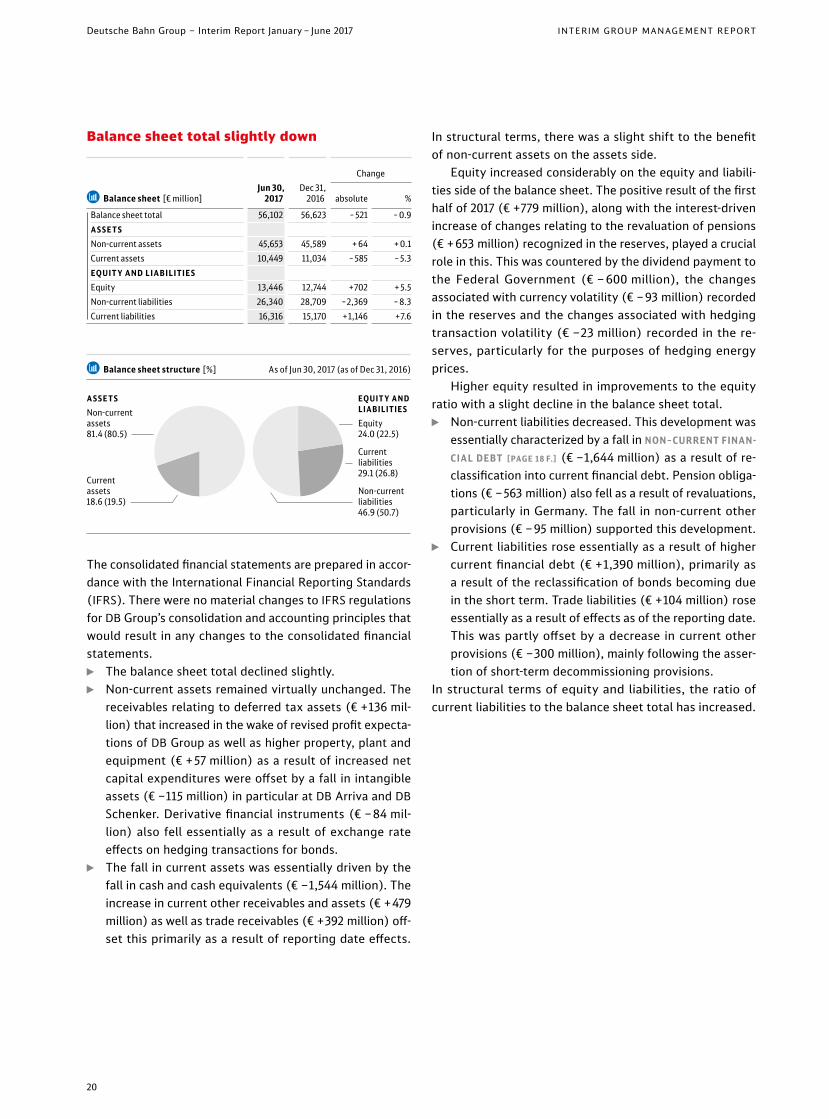
Balance sheet total slightly down
Æ Balance sheet [€ million]Jun 30,
2017Dec 31,
2016
Change
absolute %
Balance sheet total 56,102 56,623 – 521 – 0.9A S SET SNon-current assets 45,653 45,589 + 64 + 0.1Current assets 10,449 11,034 – 585 – 5.3EQ UIT Y AND LIABILITIE SEquity 13,446 12,744 +702 + 5.5Non-current liabilities 26,340 28,709 –2,369 – 8.3Current liabilities 16,316 15,170 +1,146 +7.6
Æ Balance sheet structure [%] As of Jun 30, 2017 (as of Dec 31, 2016)
The consolidated financial statements are prepared in accor-dance with the International Financial Reporting Standards (IFRS). There were no material changes to IFRS regulations for DB Group’s consolidation and accounting principles that would result in any changes to the consolidated financial statements.
◊ The balance sheet total declined slightly. ◊ Non-current assets remained virtually unchanged. The
receivables relating to deferred tax assets (€ +136 mil-lion) that increased in the wake of revised profit expecta- tions of DB Group as well as higher property, plant and equipment (€ +57 million) as a result of increased net capital expenditures were offset by a fall in intangible assets (€ –115 million) in particular at DB Arriva and DB Schenker. Derivative financial instruments (€ –84 mil-lion) also fell essentially as a result of exchange rate effects on hedging transactions for bonds.
◊ The fall in current assets was essentially driven by the fall in cash and cash equivalents (€ –1,544 million). The in crease in current other receivables and assets (€ +479 mil lion) as well as trade receivables (€ +392 mil lion) off-set this primarily as a result of reporting date effects.
In structural terms, there was a slight shift to the benefit of non-current assets on the assets side.
Equity increased considerably on the equity and liabili-ties side of the balance sheet. The positive result of the first half of 2017 (€ +779 million), along with the interest-driven increase of changes relating to the revaluation of pensions (€ +653 million) recognized in the reserves, played a crucial role in this. This was countered by the dividend payment to the Federal Government (€ – 600 million), the changes associated with currency volatility (€ –93 million) recorded in the reserves and the changes associated with hedging transaction volatility (€ –23 million) recorded in the re- serves, particularly for the purposes of hedging energy prices.
Higher equity resulted in improvements to the equity ratio with a slight decline in the balance sheet total.
◊ Non-current liabilities decreased. This development was essentially characterized by a fall in NON–CURRENT FINAN-CIAL DEBT [PAGE 1 8 F.] (€ –1,644 million) as a result of re-classification into current financial debt. Pension obliga-tions (€ –563 million) also fell as a result of revaluations, particularly in Germany. The fall in non-current other provisions (€ –95 million) supported this development.
◊ Current liabilities rose essentially as a result of higher current financial debt (€ +1,390 million), primarily as a result of the reclassification of bonds becoming due in the short term. Trade liabilities (€ +104 million) rose essentially as a result of effects as of the reporting date. This was partly offset by a decrease in current other provisions (€ –300 million), mainly following the asser-tion of short-term decommissioning provisions.
In structural terms of equity and liabilities, the ratio of current liabilities to the balance sheet total has increased.
A S SET SNon-current assets 81.4 (80.5)
Current assets 18.6 (19.5)
EQ UIT Y AND LIABILITIE SEquity 24.0 (22.5)
Current liabilities 29.1 (26.8)
Non-current liabilities 46.9 (50.7)
20
Deutsche Bahn Group – Interim Report January – June 2017 INTERIM GROUP MANAGEMENT REPORT
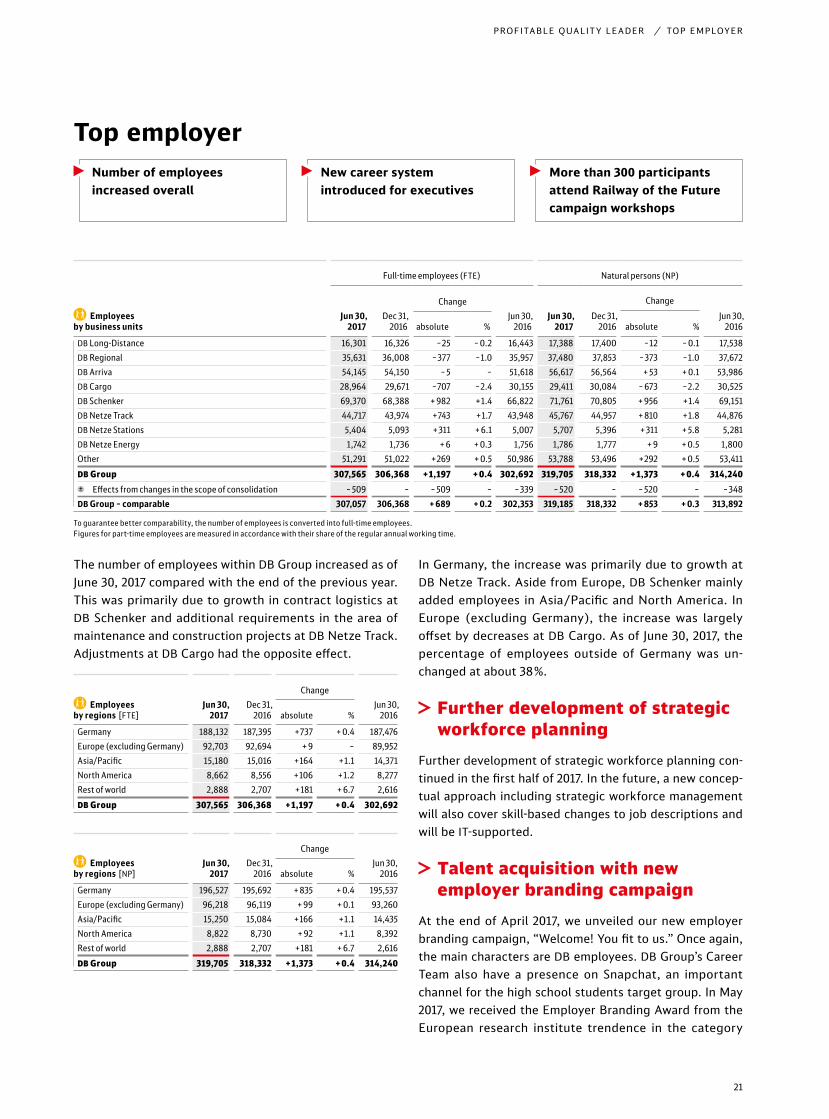
Top employerNumber of employees increased overall
New career system introduced for executives
More than 300 participants attend Railway of the Future campaign workshops
The number of employees within DB Group increased as of June 30, 2017 compared with the end of the previous year. This was primarily due to growth in contract logistics at DB Schenker and additional requirements in the area of maintenance and construction projects at DB Netze Track. Adjustments at DB Cargo had the opposite effect.
† Employees by regions [FTE]
Jun 30, 2017
Dec 31, 2016
ChangeJun 30,
2016absolute %
Germany 188,132 187,395 +737 + 0.4 187,476Europe (excluding Germany) 92,703 92,694 + 9 – 89,952Asia/Pacific 15,180 15,016 +164 +1.1 14,371North America 8,662 8,556 +106 +1.2 8,277Rest of world 2,888 2,707 +181 + 6.7 2,616DB Group 307,565 306,368 + 1,197 + 0.4 302,692
† Employees by regions [NP]
Jun 30, 2017
Dec 31, 2016
ChangeJun 30,
2016absolute %
Germany 196,527 195,692 + 835 + 0.4 195,537Europe (excluding Germany) 96,218 96,119 + 99 + 0.1 93,260Asia/Pacific 15,250 15,084 +166 +1.1 14,435North America 8,822 8,730 + 92 +1.1 8,392Rest of world 2,888 2,707 +181 + 6.7 2,616DB Group 319,705 318,332 + 1,373 + 0.4 314,240
In Germany, the increase was primarily due to growth at DB Netze Track. Aside from Europe, DB Schenker mainly added employees in Asia/Pacific and North America. In Europe (excluding Germany), the increase was largely offset by decreases at DB Cargo. As of June 30, 2017, the percentage of employees outside of Germany was un changed at about 38%.
≈ Further development of strategic workforce planning
Further development of strategic workforce planning continued in the first half of 2017. In the future, a new conceptual approach including strategic workforce management will also cover skillbased changes to job descriptions and will be ITsupported.
≈ Talent acquisition with new employer branding campaign
At the end of April 2017, we unveiled our new employer branding campaign, “Welcome! You fit to us.” Once again, the main characters are DB employees. DB Group’s Career Team also have a presence on Snapchat, an important channel for the high school students target group. In May 2017, we received the Employer Branding Award from the European research institute trendence in the category
† Employees by business units
Full-time employees (FTE) Natural persons (NP)
Jun 30, 2017
Dec 31, 2016
ChangeJun 30,
2016Jun 30,
2017Dec 31,
2016
ChangeJun 30,
2016absolute %absolute %
DB Long-Distance 16,301 16,326 –25 – 0.2 16,443 17,388 17,400 –12 – 0.1 17,538DB Regional 35,631 36,008 –377 –1.0 35,957 37,480 37,853 –373 –1.0 37,672DB Arriva 54,145 54,150 – 5 – 51,618 56,617 56,564 + 53 + 0.1 53,986DB Cargo 28,964 29,671 –707 –2.4 30,155 29,411 30,084 – 673 –2.2 30,525DB Schenker 69,370 68,388 + 982 +1.4 66,822 71,761 70,805 + 956 +1.4 69,151DB Netze Track 44,717 43,974 +743 +1.7 43,948 45,767 44,957 + 810 +1.8 44,876DB Netze Stations 5,404 5,093 + 311 + 6.1 5,007 5,707 5,396 + 311 + 5.8 5,281DB Netze Energy 1,742 1,736 + 6 + 0.3 1,756 1,786 1,777 + 9 + 0.5 1,800Other 51,291 51,022 +269 + 0.5 50,986 53,788 53,496 +292 + 0.5 53,411DB Group 307,565 306,368 + 1,197 + 0.4 302,692 319,705 318,332 + 1,373 + 0.4 314,240
Effects from changes in the scope of consolidation – 509 – – 509 – –339 – 520 – – 520 – –348DB Group – comparable 307,057 306,368 + 689 + 0.2 302,353 319,185 318,332 + 853 + 0.3 313,892
To guarantee better comparability, the number of employees is converted into full-time employees. Figures for part-time employees are measured in accordance with their share of the regular annual working time.
21
PROFITABLE QUALITY LEADER / TOP EMPLOYER
“Best Employer Branding for High School Students.” We received the international “European Excellence Award in HR 2017” in the “Digitalization” category for our use of virtual reality in recruiting. The first target group results for employer rankings show that we are on a good path to achieve our top employer target for this year. In the students target group, we achieved a ranking of 15 among engineering students, 28 among IT students and 38 among students of economics – thereby improving our ranking among each of these target groups.
We have successfully established and expanded recruit ing events with our recruiting days and candidate castings. At the end of 2017, we will also introduce new recruiting software in Germany which will be used worldwide in every business unit.
≈ Personnel development continues
The career system for the top management level was introduced in the first half of 2017. It promotes a broad range of experience for executives and greater movement within the management team.
After a successful pilot project, the DB leadership role model will form the basis for staffing and diagnostic procedures. Its practical feasibility has been confirmed by the specialist division and Executive Support.
Further development and consolidation of the competence model for employees and executives with collective bargaining agreements were initiated at the employee level. The competence road map developed in crossbusinessunit workshops has already been validated by the Group’s Personnel Development Committee.
Preparation of the 2017 tablet rollout for trainees in their first year of apprenticeship as railway employees in operational service and as businessmen for traffic services, as well as a practical trial in commercial and technical vocational training, were initiated.
≈ Strengthening the corporate culture
Two regional R AILWAY OF THE FUTURE C AMPAIGN WORK SHOP S [PAGE 4] were held during the first half of 2017. More than 300 participants worked on solutions to implement the Railway of the Future onsite.
In February 2017, around 180 female executives met at the second International DB Group Female Managers’ Conference in accordance with “Women. Leading. Transformation.”
One of the goals of the conference was to encourage women within DB Group to network with each other and to increase the visibility of women with potential for leadership roles.
DB Group participated in the 5th German Diversity Day along with companies in the “Diversity in Business” forum. In Berlin, Frankfurt am Main, and Hamburg, diversity movie nights were held entitled “Diversity – Now Let’s Watch Together!”
In May, there was a particular focus on the mentoring program “Career with Children.” The program with 17 participants that started in 2015 came to an end, while the third round began for 18 new participants. “Career with Children” supports employees in the successful career de vel opment before, during and after parental leave, thereby helping to strengthen the balance between work and family life within DB Group.
≈ Working conditions optimized
The agreement with the Railway and Transport Workers Union (Eisenbahn und Verkehrsgewerkschaft; EVG) and the German Train Drivers’ Union (Gewerkschaft Deutscher Lokomotivführer; GDL) to raise scale wages by 2.5% as of April 1, 2017 was implemented, along with the agreed improvements for young professionals, such as increases in apprenticeship pay, rental allowance and company pension.
In addition, an agreement was reached with the unions under which each employee had until June 30, 2017 to choose among three models: a 2.62% pay increase, a reduction in working hours of one hour per week or six additional days of vacation. The model chosen will apply beginning in January 2018. A total of 56% of employees chose additional vacation, 41% chose the pay increase and 3% chose the re duction in working hours. The active response rate was 70%.
A new collective bargaining agreement, Work 4.0 EVG 2016, was concluded with the EVG. It mainly covers the satisfaction of individual requirements for a selfdetermined place of work, rules governing oncall duty, including the introduction of performancebased pay, how to handle changes in job descriptions and participation in productivity gains.
DB Group’s agreement with GDL will improve personal planning certainty, such as term of notice for days off and shifts, rules intended to standardize the allocation of work ing hours, and an evaluation of pilot projects on scheduling shifts and time off. In addition, the wage structure for train drivers was addressed in a new collective bargaining agreement while the wage structure for train attendants and catering staff was further developed effective April 2018.
!!!
22
Deutsche Bahn Group – Interim Report January – June 2017 INTERIM GROUP MANAGEMENT REPORT
DB Group joins international Science-Based Targets initiative
36,500 freight cars operated by DB Cargo in Germany refitted with whisper brakes
DB Regional operates 1,500 buses that meet the Euro VI emissions standard
≈ Responsibility to protect climate
DB Group takes its climate protection responsibility seriously and sets challenging targets to steadily reduce its greenhouse gas emissions. By 2020, we will reduce specific greenhouse gas emissions from our worldwide transport services by 30% compared to 2006.
≈ Accession to the Science-Based Targets initiative
In March, DB Group became the first mobility company in Germany to join the international ScienceBased Targets initiative (SBT) launched by the CDP rating agency, the UN Global Compact, the World Resources Institute and the World Wide Fund for Nature (WWF). Companies from across the world have come together under this initiative to calculate their climateprotection targets on a scientific basis, focus ing on the internationally agreed target of 2°C.
≈ Proof of contribution to climate protection on business trips
Business clients of DB Group received their annual “bahn.business environment certificate” during the first half of 2017. The company’s contribution to climate protection through the use of DB LongDistance transport is shown in the certificate and is used by clients to calculate their own carbon footprint. All in all, around 4.4 billion longdistance pkm traveled emissionsfree were certified for bahn.business customers in 2016 – an increase of around 300 million pkm over the 2015 level.
≈ Energy-saving measures at DB Regional In 2016, DB Regional rail rolled out measures designed to help drivers adopt energysaving driving techniques. In addition, technical measures to improve energy consumption by rolling stock were identified in the first half of 2017. For example, increasing electrodynamic brake power to increase brake energy recovery, improving airconditioning control and optimizing shutdown. The measures will be implemented gradually beginning in mid2017.
≈ Platooning and autonomous drivingIn May, DB Schenker signed a CO O PER ATI O N AG R EEMENT WITH MAN [PAGE 3 7 ] to test electronically linked platoons of trucks separated only by short driving distances. Platooning can reduce fuel consumption by up to 10%, thereby making it possible to achieve a reduction in CO₂ emissions. In the future, DB Regional will use selfdriving buses to make a contribution toward consistent environmentally friendly mobility chains. At the end of 2017, the first pilot run of a selfdriving bus on public streets will begin in Bad Birnbach. Moreover, the bus will operate ex clusively on electric power, thereby emitting less pollution.
≈ Noise reduction measures
DB Group also intends to play a leading role in noise reduction. In order to noticeably relieve residents near railway tracks, we will halve our rail transport noise by 2020, compared to 2000. Revision of the overall concept for the noise remediation program to the current, lower limit of 57 dB(A) is on schedule and will likely be completed in the spring of 2018.
≈ Making good progress on refitting freight cars
At the end of June, around 36,500 freight cars (out of DB Cargo’s active fleet of around 64,000 freight cars in Germa ny) were rolling on quiet brake shoes. By the end of 2017, the number should grow to around 40,000. Plans call for the vehicle fleet to be completely quiet by the end of 2020.
≈ Financing agreement for noise abatement in the Middle Rhine Valley
Following the signing of separate financing agreements in March 2017 between the Federal Government, the states of RhinelandPalatinate and Hesse, and DB Group, the way is now clear formally, as well, to improve noise abatement in the Middle Rhine Valley. Overall, just under € 73 million will go into additional noise reduction projects on both sides of the Rhine through 2021 and beyond. Among other things, this will involve the use of rail dampers and noise protection walls. About 50 noise abatement measures will further reduce rail transport noise in the Middle Rhine Valley. The initial measures will be implemented this year.
Eco-pioneer
23
ECOPIONEERTOP EMPLOYER / ECOPIONEER
≈ Recycling rate is at a high level
In order to conserve natural resources, we have set a target of achieving a 95% recycling rate by 2020, which we have already exceeded. In addition, we are using more and more recycled materials and increasing the service life of our vehicles, for example by REDE SIGNING THE ICE 3 [PAGE 2 7 ].
≈ Saving paper with mobile ticketsIn the first half of 2017, 6.6 million tickets were booked on mobile devices. On average, that is equal to about 36,000 reservations per day, and an increase of 60%. By using mobile instead of printed tickets, our customers saved 32.3 tons of paper during this time period.
≈ Air quality control
Keeping emissions of pollutants as low as possible is im port ant to us, because they can be hazardous to health and can harm people. Therefore, for years, we have been reduc ing emissions of pollutants through the use of modern vehicles.
≈ Use of Euro VI busesThe demands on our buses are high: DB Regional Bus operates 1,500 buses with the most uptodate emissions standard, Euro VI, representing 17% of its bus fleet. We therefore have the biggest fleet in Germany that complies with this strict emissions standard. To indicate its environmentally friendly stance, Südwestbus has a greenpainted bus dubbed the “Green Frog,” which has been operating as an environmental ambassador in the region since May.
≈ Nature conservation
Many protected animals and plants have settled on railway lines or in unused buildings, as these can serve as ideal habitats. Our goal is to protect them, both in operations and planning and in the construction and maintenance of railway installations.
≈ Commitment to endangered species“Bees on the Rail” is the name of the project in which we identified potential sites for bee colonies within our real estate portfolio. Since October 2016, we have made these sites available to private beekeepers. So far, more than 1,600 beekeepers have applied. Altogether, 500 sites have already been made available to them. On May 22 the “International Biodiversity Day,” one of the first sites, was presented to the public in BerlinSchöneberg. In addition, we are committed to the preservation of sand lizards, smooth snakes, bats, cranes, kestrels, great bustards and wild horses.
≈ Other topics
≈ Fair-trade-certified coffee and fund-raising campaign on ICE and IC trains
In April, we started serving only fairtradecertified hot beverages on our ICE and IC trains. In addition, the on board bistro offers a 20 cent discount on any hot beverage if the passenger supplies his or her own reusable travel mug – the environmentally friendly alternative to a paper cup.
As part of the new annual campaign in the onboard restaurant, during which food bloggers develop recipes every two months for the dishes featured during the campaign, the fundraising campaign will continue to contrib ute 10 cents from every dish sold to Bergwaldprojekt e. V. The association is committed to protecting and preserving forested areas in Germany. During the last campaign, which ran from January 2016 to March 2017, a total amount of about € 32,600 was donated.
≈ 21st Environmental Forum held Every year, DB Environment invites association representatives to take part in an open dialog. The Environmental Forum (formerly Environment and Transport Workshop) was held in Berlin for the 21st time. In workshops and panel discussions, DB Management Board members Ronald Pofalla and Berthold Huber, as well as Sylvia Lier, Chairwoman of DB Connect’s general management team and Dr. Jürgen Wilder, Chairman of the Management Board of DB Cargo, answered questions from the association representatives. The environmental policy spokespersons for parliamentary groups in the German Bundestag and representatives of the logistics industry also held discussions at the Bremen Representation.
≈ Partnership with Essen, the European Green Capital 2017
As part of our aspiration to be an ecopioneer, we are the official mobility and logistics services provider for “Essen, the European Green Capital 2017.” Along with DB Schenker, we are supporting the Green Capital of Europe as premium sponsor. As a result, two “City Trees” have been erected at Essen’s central station. The two walls, on which special moss cultures have been planted, filter out as much particulate matter and nitrogen oxide from the air as 550 trees in the city would do.
24
Deutsche Bahn Group – Interim Report January – June 2017 INTERIM GROUP MANAGEMENT REPORT

Development of business unitsPositive development at DB Long-Distance
Burdens from factor cost increases in Germany
International business is driving revenue development
Æ Revenues adjusted [€ million]
Total revenues External revenues
H 1 Change H 1 Change
2017 2016 absolute % 2017 2016 absolute %
DB Long-Distance 2,107 2,006 + 101 + 5.0 2,028 1,932 + 96 + 5.0DB Regional 4,304 4,280 + 24 + 0.6 4,254 4,223 + 31 + 0.7DB Arriva 2,662 2,529 + 133 + 5.3 2,659 2,526 + 133 + 5.3DB Cargo 2,306 2,312 – 6 – 0.3 2,150 2,154 – 4 – 0.2DB Schenker 8,103 7,431 + 672 + 9.0 8,072 7,400 + 672 + 9.1DB Netze Track 2,652 2,601 + 51 +2.0 746 694 + 52 +7.5DB Netze Stations 635 623 +12 +1.9 273 267 + 6 +2.2DB Netze Energy 1,416 1,391 +25 +1.8 654 591 + 63 +10.7Other 2,154 2,058 + 96 + 4.7 234 246 – 12 – 4.9Consolidation – 5,269 – 5,198 – 71 +1.4 – – – –DB Group 21,070 20,033 + 1,037 + 5.2 21,070 20,033 + 1,037 + 5.2
Æ Operating profit figures [€ million]
EBIT adjusted EBITDA adjusted
H 1 Change H 1 Change
2017 2016 absolute % 2017 2016 absolute %
DB Long-Distance 216 54 +162 – 328 184 +144 +78.3DB Regional 314 334 – 20 – 6.0 634 651 – 17 – 2.6DB Arriva 110 106 + 4 + 3.8 238 232 + 6 +2.6DB Cargo – 28 – 53 + 25 – 47.2 82 39 + 43 +110DB Schenker 208 200 + 8 + 4.0 305 294 +11 + 3.7DB Netze Track 389 398 – 9 – 2.3 815 838 – 23 – 2.7DB Netze Stations 150 159 – 9 – 5.7 217 227 – 10 – 4.4DB Netze Energy 44 63 – 19 – 30.2 79 98 – 19 – 19.4Other/consolidation – 224 – 254 + 30 – 11.8 – 124 – 148 +24 – 16.2DB Group 1,179 1,007 + 172 + 17.1 2,574 2,415 + 159 + 6.6Margin (%) 5.6 5.0 – – 12.2 12.1 – –
Æ Capital expenditures [€ million]
Gross capital expenditures Net capital expenditures
H 1 Change H 1 Change
2017 2016 absolute % 2017 2016 absolute %
DB Long-Distance 215 156 + 59 + 37.8 215 156 + 59 + 37.8DB Regional 164 137 +27 +19.7 134 135 – 1 – 0.7DB Arriva 184 127 + 57 + 44.9 184 127 + 57 + 44.9DB Cargo 110 52 + 58 +112 108 50 + 58 +116DB Schenker 76 72 + 4 + 5.6 76 72 + 4 + 5.6DB Netze Track 2,907 2,495 + 412 +16.5 525 515 +10 +1.9DB Netze Stations 253 182 +71 + 39.0 80 69 +11 +15.9DB Netze Energy 48 49 – 1 –2.0 17 20 – 3 – 15.0Other/consolidation 151 202 – 51 – 25.2 151 202 – 51 – 25.2DB Group 4,108 3,472 + 636 + 18.3 1,490 1,346 + 144 + 10.7 thereof investment grants 2,618 2,126 + 492 + 3.1 – – – –
OVERVIEW OF BUSINESS UNITS
25
ECO-PIONEER / DEVElOPmENT OF BUSINESS UNITS
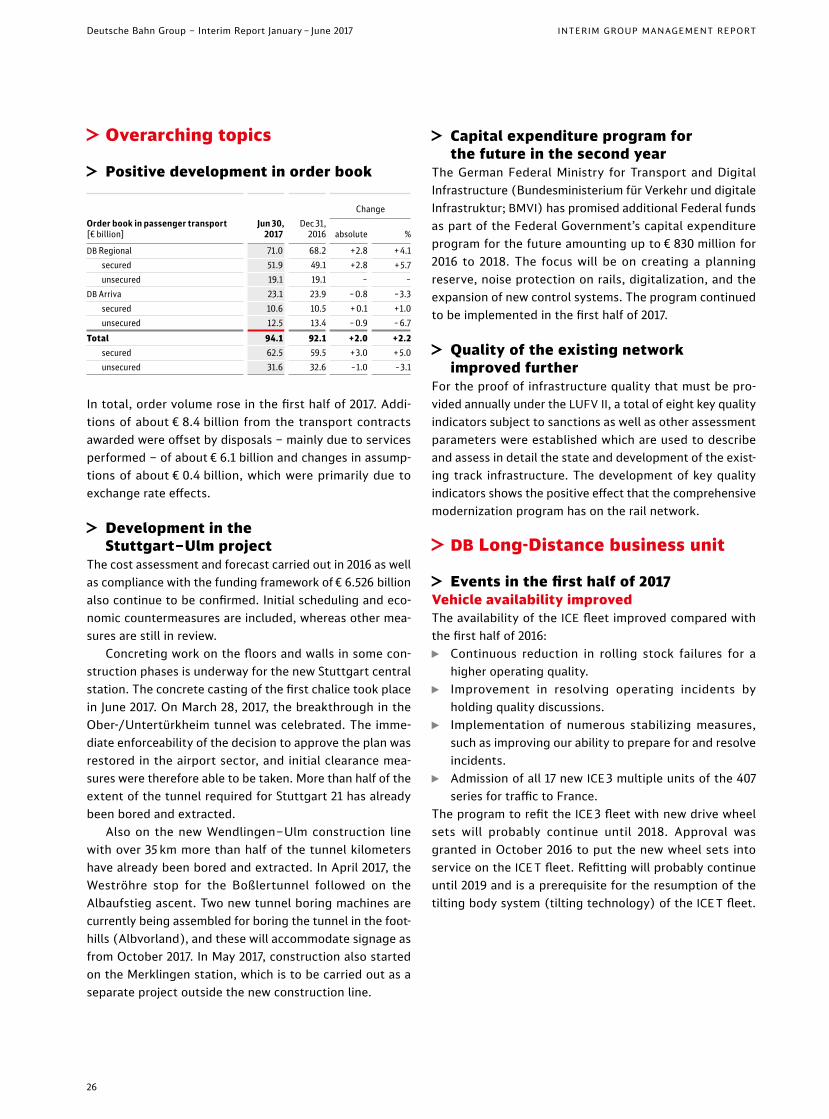
≈ Overarching topics
≈ Positive development in order book
Order book in passenger transport [€ billion]
Jun 30, 2017
Dec 31, 2016
Change
absolute %
DB Regional 71.0 68.2 +2.8 + 4.1 secured 51.9 49.1 +2.8 + 5.7 unsecured 19.1 19.1 – –DB Arriva 23.1 23.9 – 0.8 –3.3 secured 10.6 10.5 + 0.1 +1.0 unsecured 12.5 13.4 – 0.9 – 6.7Total 94.1 92.1 + 2.0 + 2.2 secured 62.5 59.5 + 3.0 + 5.0 unsecured 31.6 32.6 –1.0 –3.1
In total, order volume rose in the first half of 2017. Addi-tions of about € 8.4 billion from the transport contracts awarded were offset by disposals – mainly due to services performed – of about € 6.1 billion and changes in assump-tions of about € 0.4 billion, which were primarily due to exchange rate effects.
≈ Development in the Stuttgart – Ulm project
The cost assessment and forecast carried out in 2016 as well as compliance with the funding framework of € 6.526 billion also continue to be confirmed. Initial scheduling and eco-nom ic countermeasures are included, whereas other mea-sures are still in review.
Concreting work on the floors and walls in some con-struction phases is underway for the new Stuttgart central station. The concrete casting of the first chalice took place in June 2017. On march 28, 2017, the breakthrough in the Ober-/Untertürkheim tunnel was celebrated. The imme-diate enforceability of the decision to approve the plan was restored in the airport sector, and initial clearance mea-sures were therefore able to be taken. more than half of the extent of the tunnel required for Stuttgart 21 has already been bored and extracted.
Also on the new Wendlingen – Ulm construction line with over 35 km more than half of the tunnel kilometers have already been bored and extracted. In April 2017, the Weströhre stop for the Boßlertunnel followed on the Albaufstieg ascent. Two new tunnel boring machines are currently being assembled for boring the tunnel in the foot-hills (Albvorland), and these will accommodate signage as from October 2017. In may 2017, construction also started on the merklingen station, which is to be carried out as a separate project outside the new construction line.
≈ Capital expenditure program for the future in the second year
The German Federal ministry for Transport and Digital Infrastructure (Bundesministerium für Verkehr und digitale Infrastruktur; BmVI) has promised additional Federal funds as part of the Federal Government’s capital expendi ture program for the future amounting up to € 830 million for 2016 to 2018. The focus will be on creating a planning re serve, noise protection on rails, digitalization, and the expansion of new control systems. The program continued to be implemented in the first half of 2017.
≈ Quality of the existing network improved further
For the proof of infrastructure quality that must be pro-vided annually under the lUFV II, a total of eight key quality indicators subject to sanctions as well as other assessment parameters were established which are used to describe and assess in detail the state and development of the ex ist- ing track infrastructure. The development of key quality indicators shows the positive effect that the comprehensive modernization program has on the rail network.
≈ DB Long-Distance business unit
≈ Events in the first half of 2017Vehicle availability improvedThe availability of the ICE fleet improved compared with the first half of 2016:
◊ Continuous reduction in rolling stock failures for a higher operating quality.
◊ Improvement in resolving operating incidents by holding quality discussions.
◊ Implementation of numerous stabilizing measures, such as improving our ability to prepare for and resolve incidents.
◊ Admission of all 17 new ICE 3 multiple units of the 407 series for traffic to France.
The program to refit the ICE 3 fleet with new drive wheel sets will probably continue until 2018. Approval was granted in October 2016 to put the new wheel sets into service on the ICE T fleet. Refitting will probably continue until 2019 and is a prerequisite for the resumption of the tilting body system (tilting technology) of the ICE T fleet.
26
Deutsche Bahn Group – Interim Report January – June 2017 INTERIM GROUP MANAGEMENT REPORT
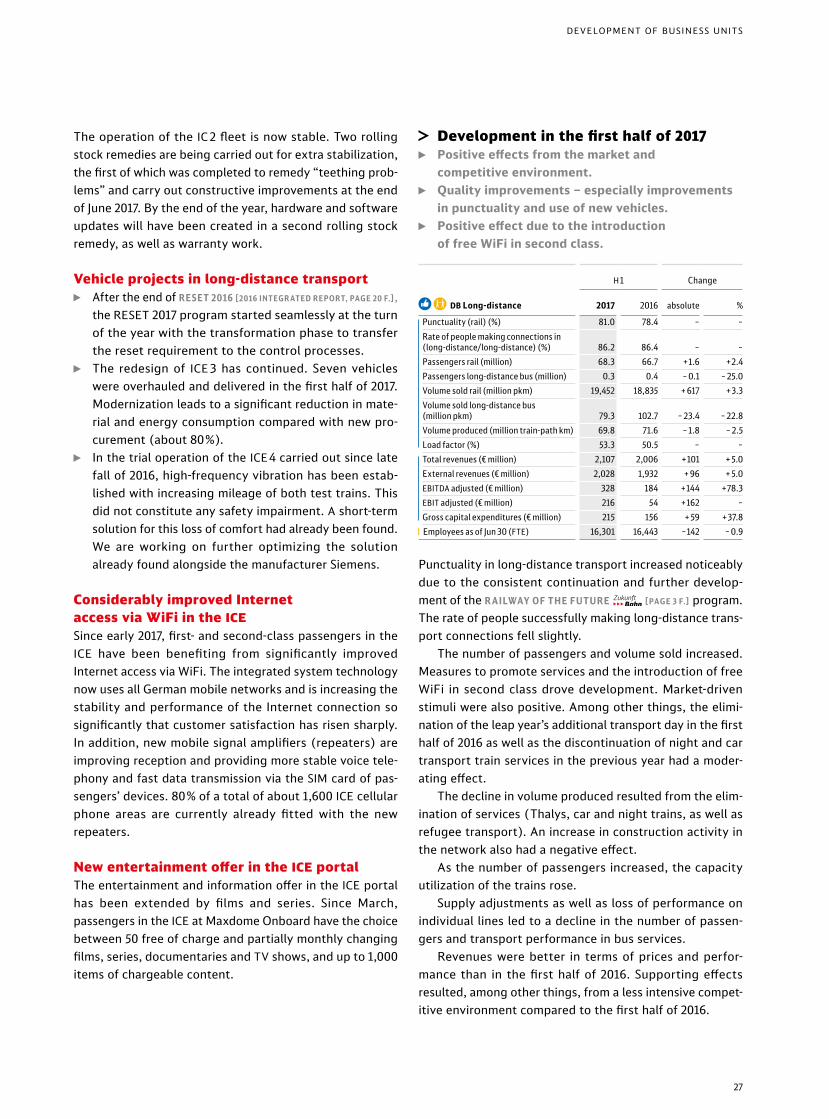
The operation of the IC 2 fleet is now stable. Two rolling stock remedies are being carried out for extra stabilization, the first of which was completed to remedy “teething prob-lems” and carry out constructive improvements at the end of June 2017. By the end of the year, hardware and software updates will have been created in a second rolling stock remedy, as well as warranty work.
Vehicle projects in long-distance transport ◊ After the end of RESET 2016 [2016 INTEGR ATED REP ORT, PAGE 20 F.],
the RESET 2017 program started seamlessly at the turn of the year with the transformation phase to transfer the reset requirement to the control processes.
◊ The redesign of ICE 3 has continued. Seven vehicles were overhauled and delivered in the first half of 2017. modernization leads to a significant reduction in mate-rial and energy consumption compared with new pro-curement (about 80%).
◊ In the trial operation of the ICE 4 carried out since late fall of 2016, high-frequency vibration has been estab-lished with increasing mileage of both test trains. This did not constitute any safety impairment. A short-term solution for this loss of comfort had already been found. We are working on further optimizing the solution already found alongside the manufacturer Siemens.
Considerably improved Internet access via WiFi in the ICESince early 2017, first- and second-class passengers in the ICE have been benefiting from significantly improved Internet access via WiFi. The integrated system technology now uses all German mobile networks and is increasing the stability and performance of the Internet connection so significantly that customer satisfaction has risen sharply. In addition, new mobile signal amplifiers (repeaters) are improving reception and providing more stable voice tele-phony and fast data transmission via the SIm card of pas-sengers’ devices. 80% of a total of about 1,600 ICE cellular phone areas are currently already fitted with the new repeaters.
New entertainment offer in the ICE portalThe entertainment and information offer in the ICE portal has been extended by films and series. Since march, passengers in the ICE at maxdome Onboard have the choice between 50 free of charge and partially monthly changing films, series, documentaries and TV shows, and up to 1,000 items of chargeable content.
≈ Development in the first half of 2017 ◊ Positive effects from the market and
competitive environment. ◊ Quality improvements – especially improvements
in punctuality and use of new vehicles. ◊ Positive effect due to the introduction
of free WiFi in second class.
¿ † DB Long-distance
H 1 Change
2017 2016 absolute %
Punctuality (rail) (%) 81.0 78.4 – –Rate of people making connections in (long-distance/long-distance) (%) 86.2 86.4 – –Passengers rail (million) 68.3 66.7 +1.6 +2.4Passengers long-distance bus (million) 0.3 0.4 – 0.1 – 25.0Volume sold rail (million pkm) 19,452 18,835 + 617 + 3.3Volume sold long-distance bus (million pkm) 79.3 102.7 – 23.4 – 22.8Volume produced (million train-path km) 69.8 71.6 – 1.8 – 2.5Load factor (%) 53.3 50.5 – –
Total revenues (€ million) 2,107 2,006 +101 + 5.0External revenues (€ million) 2,028 1,932 + 96 + 5.0EBITDA adjusted (€ million) 328 184 +144 +78.3EBIT adjusted (€ million) 216 54 +162 –Gross capital expenditures (€ million) 215 156 + 59 + 37.8
| Employees as of Jun 30 (FTE) 16,301 16,443 –142 – 0.9
Punctuality in long-distance transport increased noticeably due to the consistent continuation and further develop-ment of the R AILWAY OF THE FUTURE [PAGE 3 F.] program. The rate of people successfully making long-distance trans-port connections fell slightly.
The number of passengers and volume sold increased. measures to promote services and the introduction of free WiFi in second class drove development. market-driven stimuli were also positive. Among other things, the elimi-nation of the leap year’s additional transport day in the first half of 2016 as well as the discontinuation of night and car transport train services in the previous year had a moder-ating effect.
The decline in volume produced resulted from the elim-ination of services (Thalys, car and night trains, as well as refugee transport). An increase in construction activ ity in the network also had a negative effect.
As the number of passengers increased, the capacity utilization of the trains rose.
Supply adjustments as well as loss of performance on individual lines led to a decline in the number of passen-gers and transport performance in bus services.
Revenues were better in terms of prices and perfor-mance than in the first half of 2016. Supporting effects resulted, among other things, from a less intensive compet-itive environment compared to the first half of 2016.
27
DEVElOPmENT OF BUSINESS UNITS
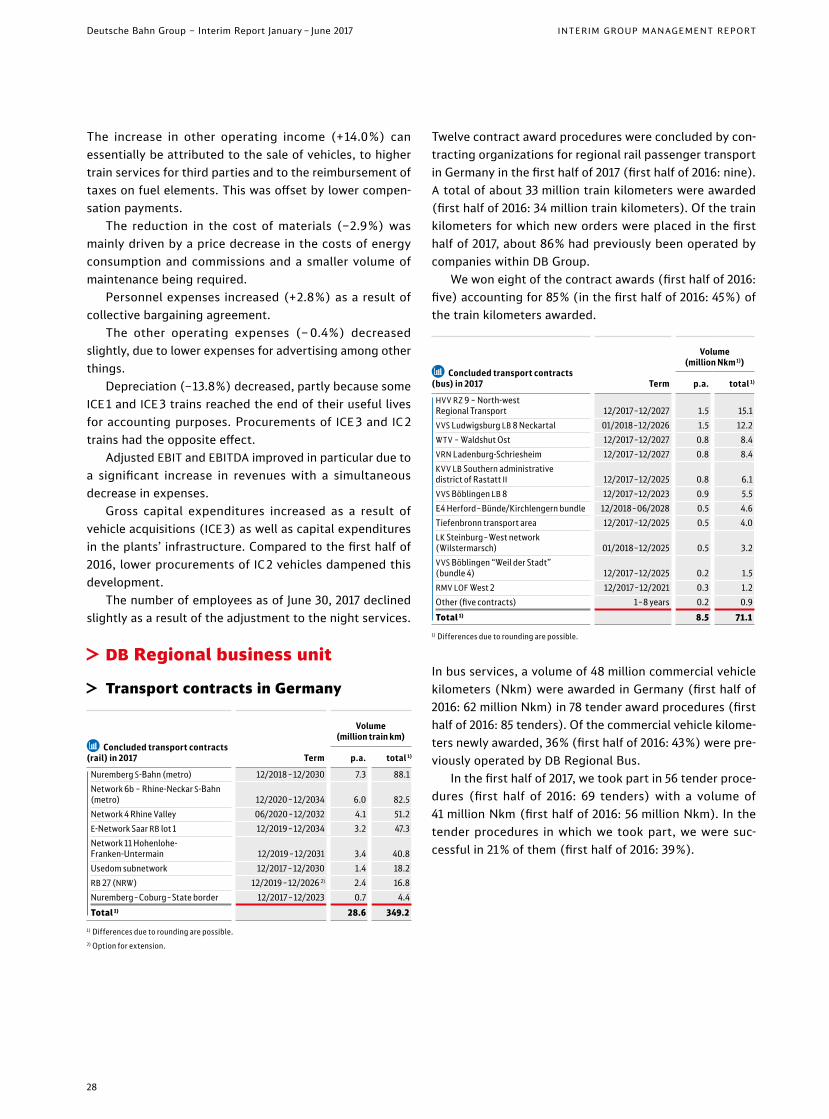
The increase in other operating income (+14.0%) can essentially be attributed to the sale of vehicles, to higher train services for third parties and to the reimbursement of taxes on fuel elements. This was offset by lower compen-sation payments.
The reduction in the cost of materials (–2.9%) was mainly driven by a price decrease in the costs of energy consumption and commissions and a smaller volume of maintenance being required.
Personnel expenses increased (+2.8%) as a result of collective bargaining agreement.
The other operating expenses (– 0.4%) decreased slightly, due to lower expenses for advertising among other things.
Depreciation (–13.8%) decreased, partly because some ICE 1 and ICE 3 trains reached the end of their useful lives for accounting purposes. Procurements of ICE 3 and IC 2 trains had the opposite effect.
Adjusted EBIT and EBITDA improved in particular due to a significant increase in revenues with a simultaneous decrease in expenses.
Gross capital expenditures increased as a result of vehicle acquisitions (ICE 3) as well as capital expenditures in the plants’ infrastructure. Compared to the first half of 2016, lower procurements of IC 2 vehicles dampened this development.
The number of employees as of June 30, 2017 declined slightly as a result of the adjustment to the night services.
≈ DB Regional business unit
≈ Transport contracts in Germany
Æ Concluded transport contracts (rail) in 2017 Term
Volume (million train km)
p.a. total 1)
Nuremberg S-Bahn (metro) 12/2018 – 12/2030 7.3 88.1Network 6b – Rhine-Neckar S-Bahn (metro) 12/2020 – 12/2034 6.0 82.5Network 4 Rhine Valley 06/2020 – 12/2032 4.1 51.2E-Network Saar RB lot 1 12/2019 – 12/2034 3.2 47.3Network 11 Hohenlohe- Franken-Untermain 12/2019 – 12/2031 3.4 40.8Usedom subnetwork 12/2017 – 12/2030 1.4 18.2RB 27 (NRW) 12/2019 – 12/2026 2) 2.4 16.8Nuremberg – Coburg – State border 12/2017 – 12/2023 0.7 4.4Total 1) 28.6 349.2
1) Differences due to rounding are possible.2) Option for extension.
Twelve contract award procedures were concluded by con-tracting organizations for regional rail passenger transport in Germany in the first half of 2017 (first half of 2016: nine). A total of about 33 million train kilometers were awarded (first half of 2016: 34 million train kilometers). Of the train kilometers for which new orders were placed in the first half of 2017, about 86% had previously been operated by companies within DB Group.
We won eight of the contract awards (first half of 2016: five) accounting for 85% (in the first half of 2016: 45%) of the train kilometers awarded.
Æ Concluded transport contracts (bus) in 2017 Term
Volume (million Nkm 1))
p.a. total 1)
HVV RZ 9 – North-west Regional Transport 12/2017 – 12/2027 1.5 15.1VVS Ludwigsburg LB 8 Neckartal 01/2018 – 12/2026 1.5 12.2WTV – Waldshut Ost 12/2017 – 12/2027 0.8 8.4VRN Ladenburg-Schriesheim 12/2017 – 12/2027 0.8 8.4KVV LB Southern administrative district of Rastatt II 12/2017 – 12/2025 0.8 6.1VVS Böblingen LB 8 12/2017 – 12/2023 0.9 5.5E4 Herford – Bünde/Kirchlengern bundle 12/2018 – 06/2028 0.5 4.6Tiefenbronn transport area 12/2017 – 12/2025 0.5 4.0LK Steinburg – West network (Wilstermarsch) 01/2018 – 12/2025 0.5 3.2VVS Böblingen “Weil der Stadt” (bundle 4) 12/2017 – 12/2025 0.2 1.5RMV LOF West 2 12/2017 – 12/2021 0.3 1.2Other (five contracts) 1 – 8 years 0.2 0.9Total 1) 8.5 71.1
1) Differences due to rounding are possible.
In bus services, a volume of 48 million commercial vehicle kilometers (Nkm) were awarded in Germany (first half of 2016: 62 million Nkm) in 78 tender award procedures (first half of 2016: 85 tenders). Of the commercial vehicle kilome-ters newly awarded, 36% (first half of 2016: 43%) were pre-viously operated by DB Regional Bus.
In the first half of 2017, we took part in 56 tender proce-dures (first half of 2016: 69 tenders) with a volume of 41 million Nkm (first half of 2016: 56 million Nkm). In the tender procedures in which we took part, we were suc-cessful in 21% of them (first half of 2016: 39%).
28
Deutsche Bahn Group – Interim Report January – June 2017 INTERIM GROUP MANAGEMENT REPORT
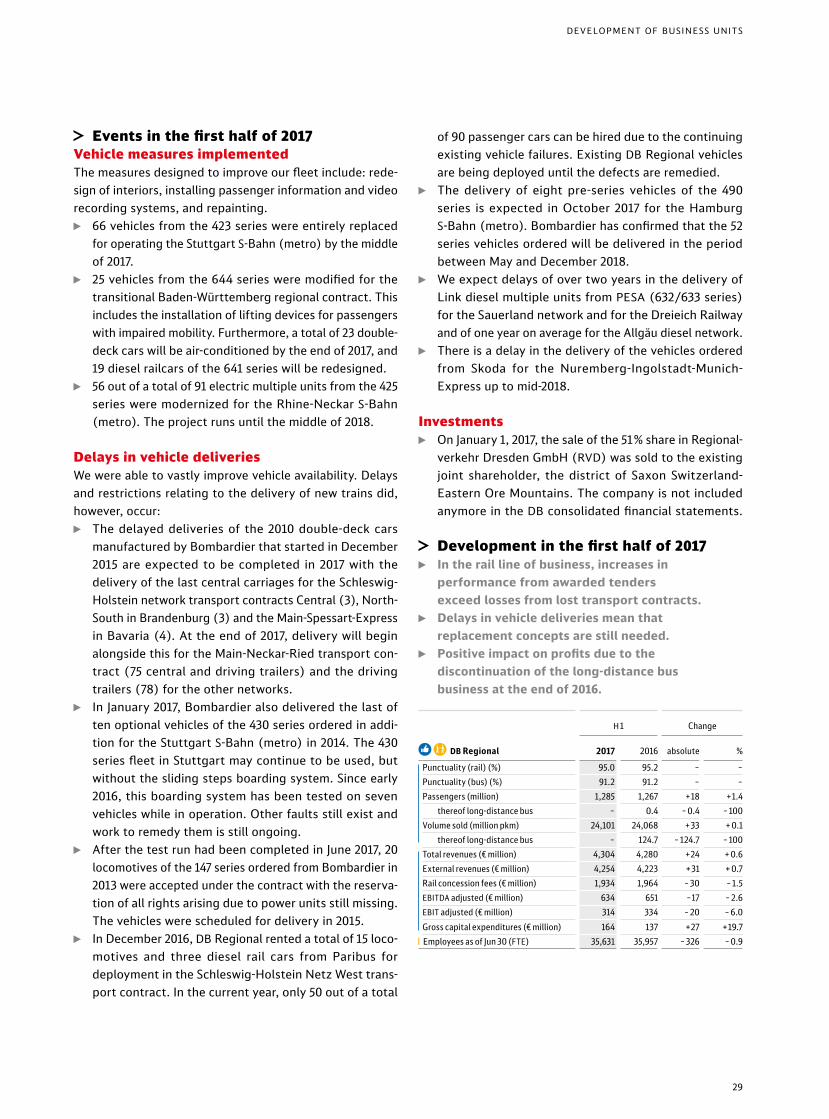
≈ Events in the first half of 2017Vehicle measures implementedThe measures designed to improve our fleet include: rede-sign of interiors, installing passenger information and video recording systems, and repainting.
◊ 66 vehicles from the 423 series were entirely replaced for operating the Stuttgart S-Bahn (metro) by the middle of 2017.
◊ 25 vehicles from the 644 series were modified for the transitional Baden-Württemberg regional contract. This includes the installation of lifting devices for passengers with impaired mobility. Furthermore, a total of 23 double- deck cars will be air-conditioned by the end of 2017, and 19 diesel railcars of the 641 series will be redesigned.
◊ 56 out of a total of 91 electric multiple units from the 425 series were modernized for the Rhine-Neckar S-Bahn (metro). The project runs until the middle of 2018.
Delays in vehicle deliveries We were able to vastly improve vehicle availability. Delays and restrictions relating to the delivery of new trains did, however, occur:
◊ The delayed deliveries of the 2010 double-deck cars manufactured by Bombardier that started in December 2015 are expected to be completed in 2017 with the delivery of the last central carriages for the Schleswig- Holstein network transport contracts Central (3), North- South in Brandenburg (3) and the main-Spessart- Express in Bavaria (4). At the end of 2017, delivery will begin alongside this for the main-Neckar-Ried transport con-tract (75 central and driving trailers) and the driving trailers (78) for the other networks.
◊ In January 2017, Bombardier also delivered the last of ten optional vehicles of the 430 series ordered in addi-tion for the Stuttgart S-Bahn (metro) in 2014. The 430 series fleet in Stuttgart may continue to be used, but without the sliding steps boarding system. Since early 2016, this boarding system has been tested on seven vehicles while in operation. Other faults still exist and work to remedy them is still ongoing.
◊ After the test run had been completed in June 2017, 20 locomotives of the 147 series ordered from Bombardier in 2013 were accepted under the contract with the reser va- tion of all rights arising due to power units still missing. The vehicles were scheduled for delivery in 2015.
◊ In December 2016, DB Regional rented a total of 15 loco-motives and three diesel rail cars from Paribus for deployment in the Schleswig-Holstein Netz West trans-port contract. In the current year, only 50 out of a total
of 90 passenger cars can be hired due to the continuing existing vehicle failures. Existing DB Regional vehicles are being deployed until the defects are remedied.
◊ The delivery of eight pre-series vehicles of the 490 series is expected in October 2017 for the Hamburg S-Bahn (metro). Bombardier has confirmed that the 52 series vehicles ordered will be delivered in the period between may and December 2018.
◊ We expect delays of over two years in the delivery of link diesel multiple units from PESA (632/633 series) for the Sauerland network and for the Dreieich Railway and of one year on average for the Allgäu diesel network.
◊ There is a delay in the delivery of the vehicles ordered from Skoda for the Nuremberg-Ingolstadt-munich- Express up to mid-2018.
Investments ◊ On January 1, 2017, the sale of the 51% share in Regional-
verkehr Dresden GmbH (RVD) was sold to the existing joint shareholder, the district of Saxon Switzerland- Eastern Ore mountains. The company is not included anymore in the DB consolidated financial statements.
≈ Development in the first half of 2017 ◊ In the rail line of business, increases in
performance from awarded tenders exceed losses from lost transport contracts.
◊ Delays in vehicle deliveries mean that replacement concepts are still needed.
◊ Positive impact on profits due to the discontinuation of the long-distance bus business at the end of 2016.
¿ † DB Regional
H 1 Change
2017 2016 absolute %
Punctuality (rail) (%) 95.0 95.2 – –Punctuality (bus) (%) 91.2 91.2 – –Passengers (million) 1,285 1,267 +18 +1.4 thereof long-distance bus – 0.4 – 0.4 – 100Volume sold (million pkm) 24,101 24,068 + 33 + 0.1 thereof long-distance bus – 124.7 – 124.7 – 100
Total revenues (€ million) 4,304 4,280 +24 + 0.6External revenues (€ million) 4,254 4,223 + 31 + 0.7Rail concession fees (€ million) 1,934 1,964 – 30 – 1.5EBITDA adjusted (€ million) 634 651 –17 – 2.6EBIT adjusted (€ million) 314 334 – 20 – 6.0Gross capital expenditures (€ million) 164 137 +27 +19.7
| Employees as of Jun 30 (FTE) 35,631 35,957 – 326 – 0.9
29
DEVElOPmENT OF BUSINESS UNITS
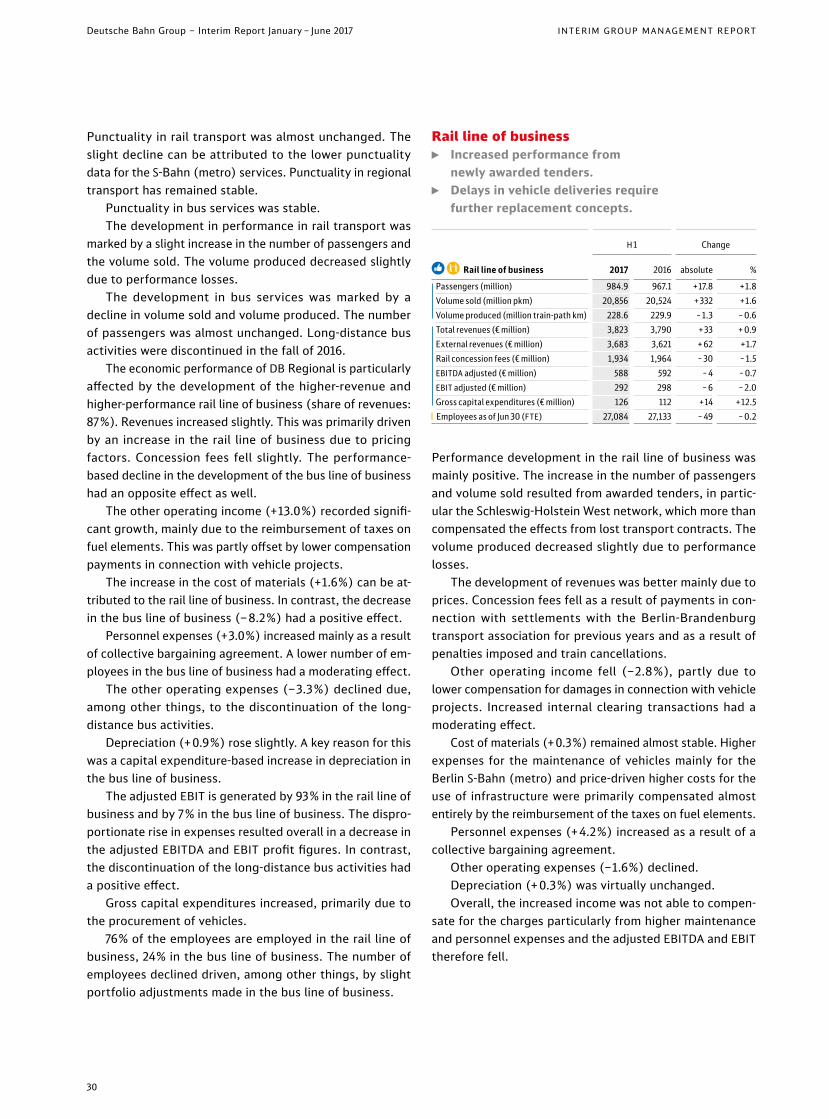
Punctuality in rail transport was almost unchanged. The slight decline can be attributed to the lower punctuality data for the S-Bahn (metro) services. Punctuality in regional transport has remained stable.
Punctuality in bus services was stable.The development in performance in rail transport was
marked by a slight increase in the number of passengers and the volume sold. The volume produced decreased slightly due to performance losses.
The development in bus services was marked by a decline in volume sold and volume produced. The number of passengers was almost unchanged. long-distance bus activities were discontinued in the fall of 2016.
The economic performance of DB Regional is particularly affected by the development of the higher-revenue and higher-performance rail line of business (share of revenues: 87%). Revenues increased slightly. This was primarily driven by an increase in the rail line of business due to pricing factors. Concession fees fell slightly. The performance- based decline in the development of the bus line of business had an opposite effect as well.
The other operating income (+13.0%) recorded signifi-cant growth, mainly due to the reimbursement of taxes on fuel elements. This was partly offset by lower compensation payments in connection with vehicle projects.
The increase in the cost of materials (+1.6%) can be at -tribut ed to the rail line of business. In contrast, the decrease in the bus line of business (–8.2%) had a positive effect.
Personnel expenses (+3.0%) increased mainly as a result of collective bargaining agreement. A lower number of em -ployees in the bus line of business had a moderating effect.
The other operating expenses (–3.3%) declined due, among other things, to the discontinuation of the long- distance bus activities.
Depreciation (+0.9%) rose slightly. A key reason for this was a capital expenditure-based increase in depreciation in the bus line of business.
The adjusted EBIT is generated by 93% in the rail line of business and by 7% in the bus line of business. The dispro-portionate rise in expenses resulted overall in a decrease in the adjusted EBITDA and EBIT profit figures. In contrast, the discontinuation of the long-distance bus activities had a positive effect.
Gross capital expenditures increased, primarily due to the procurement of vehicles.
76% of the employees are employed in the rail line of business, 24% in the bus line of business. The number of employees declined driven, among other things, by slight portfolio adjustments made in the bus line of business.
Rail line of business ◊ Increased performance from
newly awarded tenders. ◊ Delays in vehicle deliveries require
further replacement concepts.
¿ † Rail line of business
H 1 Change
2017 2016 absolute %
Passengers (million) 984.9 967.1 +17.8 +1.8Volume sold (million pkm) 20,856 20,524 + 332 +1.6Volume produced (million train-path km) 228.6 229.9 – 1.3 – 0.6
Total revenues (€ million) 3,823 3,790 + 33 + 0.9External revenues (€ million) 3,683 3,621 + 62 +1.7Rail concession fees (€ million) 1,934 1,964 – 30 – 1.5EBITDA adjusted (€ million) 588 592 – 4 – 0.7EBIT adjusted (€ million) 292 298 – 6 – 2.0Gross capital expenditures (€ million) 126 112 +14 +12.5
| Employees as of Jun 30 (FTE) 27,084 27,133 – 49 – 0.2
Performance development in the rail line of business was mainly positive. The increase in the number of passengers and volume sold resulted from awarded tenders, in partic-ular the Schleswig-Holstein West network, which more than compensated the effects from lost transport contracts. The volume produced decreased slightly due to performance losses.
The development of revenues was better mainly due to prices. Concession fees fell as a result of payments in con-nection with settlements with the Berlin-Brandenburg transport association for previous years and as a result of penalties imposed and train cancellations.
Other operating income fell (–2.8%), partly due to lower compensation for damages in connection with vehicle projects. Increased internal clearing transactions had a moderating effect.
Cost of materials (+0.3%) remained almost stable. Higher expenses for the maintenance of vehicles mainly for the Berlin S-Bahn (metro) and price-driven higher costs for the use of infrastructure were primarily compensated almost entirely by the reimbursement of the taxes on fuel elements.
Personnel expenses (+4.2%) increased as a result of a collective bargaining agreement.
Other operating expenses (–1.6%) declined.Depreciation (+0.3%) was virtually unchanged.Overall, the increased income was not able to compen-
sate for the charges particularly from higher maintenance and personnel expenses and the adjusted EBITDA and EBIT therefore fell.
30
Deutsche Bahn Group – Interim Report January – June 2017 INTERIM GROUP MANAGEMENT REPORT

Gross capital expenditures rose due to vehicle procurements. Significantly higher investment grants for vehi cles, particu-larly in connection with the Stuttgart S-Bahn (metro) trans -port contract resulted in a decline in net capital expenditures.
The number of employees was almost unchanged.
Bus line of business ◊ Portfolio adjustments made. ◊ Positive impact on profits due to the discontinuation
of the long-distance bus business in the fall of 2016.
¿ † Bus line of business
H 1 Change
2017 2016 absolute %
Passengers (million) 299.7 299.6 + 0.1 – thereof long-distance bus – 0.4 – 0.4 – 100Volume sold (million pkm) 3,244 3,544 – 300 – 8.5 thereof long-distance bus – 124.7 – 124.7 – 100Volume produced (million bus km) 253.8 284.8 – 31.0 – 10.9
Total revenues (€ million) 613 650 – 37 – 5.7External revenues (€ million) 571 602 – 31 – 5.1EBITDA adjusted (€ million) 46 58 –12 – 20.7EBIT adjusted (€ million) 22 35 – 13 – 37.1Gross capital expenditures (€ million) 38 25 +13 + 52.0
| Employees as of Jun 30 (FTE) 8,546 8,824 – 277 –3.1
Development in the bus line of business was marked by a decline in volume sold and volume produced as a result of the discontinuation of the long-distance bus business in the fall of 2016, of portfolio adjustments in the Eastern region and of transport contracts not being extended in Hesse. The number of passengers was at the level of the first half of 2016. The positive development in the central region had a compensating effect.
Portfolio adjustments, among other things, also had an impact on the development of revenues, which was weaker as a whole.
The other operating income (+4.2%) rose, partly due to higher compensation payments for damage.
The cost of materials (–8.1%) declined, mainly as a result of portfolio adjustments, the discontinuation of long-dis-tance bus activities, and a reduced volume of purchased contractor services as a result of performance losses.
Personnel expenses (–1.0%) also fell as a result of port- folio adjustments. Offsetting effects from the growth in fares and transport services obtained had a moderating effect.
The other operating expenses (+19.6%) increased as a result of a new line of business allocation. This was com-pensated for by the discontinuation of long-distance bus activities.
The higher depreciation (+4.3%) resulted, among other things, from a capital expenditure-based increase in prop-erty, plant and equipment.
It was only possible to offset the decline in income partly with lower burdens on the expenses side. Adjusted EBITDA and EBIT fell accordingly. In contrast, the discontinuation of the long-distance bus activities had a positive effect.
Due to extensive vehicle procurements for new transport services obtained, gross capital expenditures increased significantly.
The number of employees fell as a result of portfolio adjustments. New deployments for transport services were partly compensated for by this.
≈ DB Arriva business unit
≈ Events in the first half of 2017Awarded transport contracts
Æ Concluded transport contracts (rail) in 2017 Term
Volume (million train km)
p.a. total 1)
Sweden Pågatåg 12/2018 – 12/2026 12.1 96.8
The NetherlandsAchterhoek- Rivierenland 2) 12/2020 – 12/2025 3.7 18.5
Total 1) 15.8 115.31) Differences due to rounding are possible. 2) Extension of the existing contract.
Æ Concluded transport contracts (bus) in 2017 Term
Volume (million bus km)
p.a. total 1)
Great BritainLondon (19 routes) 5 years each 21.8 109.2
Czech Republic
Sumpersko, Zabrezsko, Mohel-nicko (Olomoucky region (Central Moravia)) 01/2018 – 01/2028 4.7 47.5
The NetherlandsAchterhoek- Rivierenland 2) 12/2020 – 12/2025 9.0 45.0
Czech Republic
Prostejovsko north west (Olomoucky region (Central Moravia)) 01/2018 – 01/2028 2.4 24.4
Czech Republic
Olomoucko north east (Olomoucky region (Central Moravia)) 01/2018 – 01/2028 1.8 18.2
Czech Republic
Litovelsko (Olomoucky region (Central Moravia)) 01/2018 – 01/2028 1.7 17.1
Czech Republic
Prerovsko north (Olomoucky region (Central Moravia)) 01/2018 – 01/2028 1.6 16.2
Czech Republic
Hranicko (Olo-moucky region (Central Moravia)) 01/2018 – 01/2028 1.5 15.2
Great BritainLondon (five separate lines) 2) 2 years each 5.5 11.1
Other 3) 1 – 10 years 17.9 41.2Total 1) 67.9 345.1
1) Differences due to rounding are possible.2) Extension of the existing contract.3) Including extension of the existing contract.
31
DEVElOPmENT OF BUSINESS UNITS
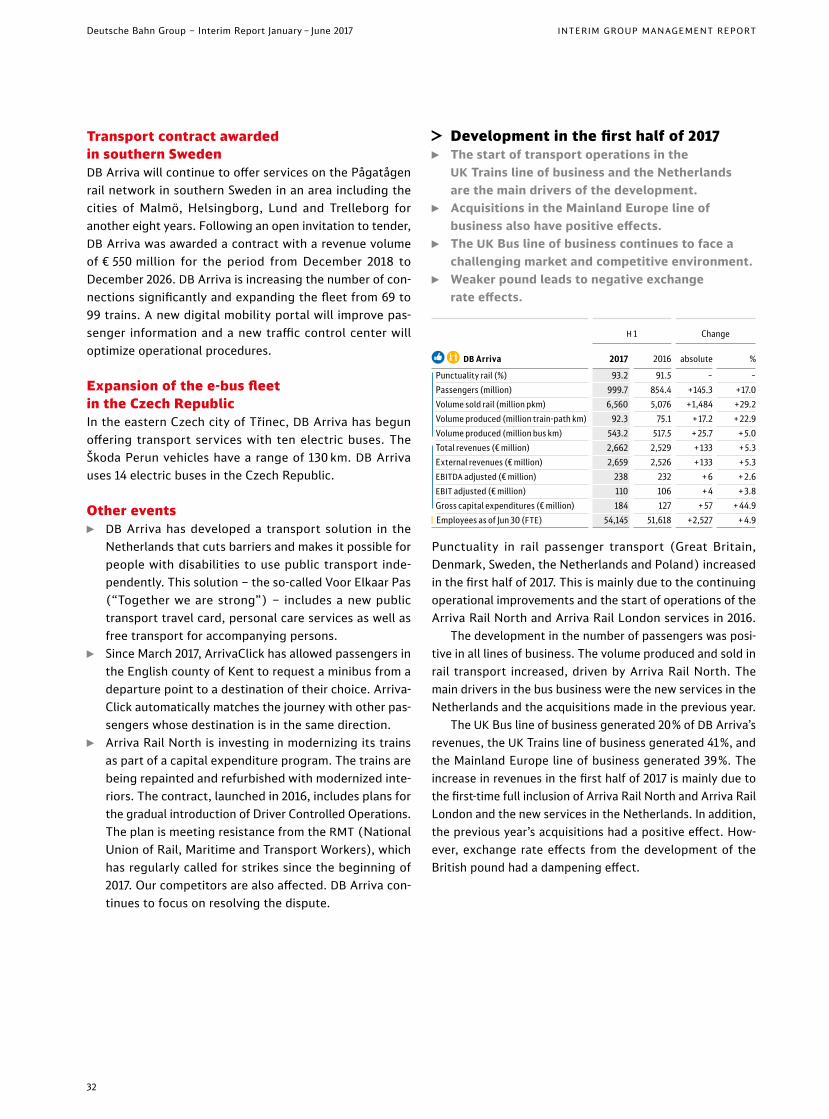
Transport contract awarded in southern SwedenDB Arriva will continue to offer services on the Pågatågen rail network in southern Sweden in an area including the cities of Malmö, Helsingborg, Lund and Trelleborg for another eight years. Following an open invitation to tender, DB Arriva was awarded a contract with a revenue volume of € 550 million for the period from December 2018 to December 2026. DB Arriva is increasing the number of con-nections significantly and expanding the fleet from 69 to 99 trains. A new digital mobility portal will improve pas-senger information and a new traffic control center will optimize operational procedures.
Expansion of the e-bus fleet in the Czech Republic In the eastern Czech city of Třinec, DB Arriva has begun offering transport services with ten electric buses. The Škoda Perun vehicles have a range of 130 km. DB Arriva uses 14 electric buses in the Czech Republic.
Other events ◊ DB Arriva has developed a transport solution in the
Netherlands that cuts barriers and makes it possible for people with disabilities to use public transport inde-pendently. This solution – the so-called Voor Elkaar Pas (“Together we are strong”) – includes a new public transport travel card, personal care services as well as free transport for accompanying persons.
◊ Since March 2017, ArrivaClick has allowed passengers in the English county of Kent to request a minibus from a departure point to a destination of their choice. Arriva-Click automatically matches the journey with other pas-sengers whose destination is in the same direction.
◊ Arriva Rail North is investing in modernizing its trains as part of a capital expenditure program. The trains are being repainted and refurbished with modernized inte-riors. The contract, launched in 2016, includes plans for the gradual introduction of Driver Controlled Operations. The plan is meeting resistance from the RMT (National Union of Rail, Maritime and Transport Workers), which has regularly called for strikes since the beginning of 2017. Our competitors are also affected. DB Arriva con-tinues to focus on resolving the dispute.
≈ Development in the first half of 2017 ◊ The start of transport operations in the
UK Trains line of business and the Netherlands are the main drivers of the development.
◊ Acquisitions in the Mainland Europe line of business also have positive effects.
◊ The UK Bus line of business continues to face a challenging market and competitive environment.
◊ Weaker pound leads to negative exchange rate effects.
¿ † DB Arriva
H 1 Change
2017 2016 absolute %
Punctuality rail (%) 93.2 91.5 – –Passengers (million) 999.7 854.4 +145.3 +17.0Volume sold rail (million pkm) 6,560 5,076 +1,484 +29.2Volume produced (million train-path km) 92.3 75.1 + 17.2 + 22.9Volume produced (million bus km) 543.2 517.5 + 25.7 + 5.0
Total revenues (€ million) 2,662 2,529 + 133 + 5.3External revenues (€ million) 2,659 2,526 + 133 + 5.3EBITDA adjusted (€ million) 238 232 + 6 + 2.6EBIT adjusted (€ million) 110 106 + 4 + 3.8Gross capital expenditures (€ million) 184 127 + 57 + 44.9
| Employees as of Jun 30 (FTE) 54,145 51,618 +2,527 + 4.9
Punctuality in rail passenger transport (Great Britain, Denmark, Sweden, the Netherlands and Poland) increased in the first half of 2017. This is mainly due to the continuing operational improvements and the start of operations of the Arriva Rail North and Arriva Rail London services in 2016.
The development in the number of passengers was posi-tive in all lines of business. The volume produced and sold in rail transport increased, driven by Arriva Rail North. The main drivers in the bus business were the new services in the Netherlands and the acquisitions made in the previous year.
The UK Bus line of business generated 20% of DB Arrivaʼs revenues, the UK Trains line of business generated 41%, and the Mainland Europe line of business generated 39%. The increase in revenues in the first half of 2017 is mainly due to the first-time full inclusion of Arriva Rail North and Arriva Rail London and the new services in the Netherlands. In addition, the previous yearʼs acquisitions had a positive effect. How-ever, exchange rate effects from the development of the British pound had a dampening effect.
32
Deutsche Bahn Group – Interim Report January – June 2017 INTERIM GROUP MANAGEMENT REPORT
The development of other operating income (+44.9%) was primarily influenced by new services and the acquisitions in the previous year. Exchange rate effects, in contrast, had a dampening impact.
Cost of materials (+14.3%) and personnel expenses (+12.8%) increased. This was mainly due to the expansion of services. The development of personnel expenses was also negatively impacted by the one-off effect in connec-tion with pension adjustments, which had the effect of reducing costs in the first half of 2016. To some degree, exchange rate effects had the effect of reducing costs both in material and personnel expenses.
The decline in other operating expenses (–13.3%) was mainly the result of lower franchise payments due to fran-chise changes in UK Trains and exchange rate effects.
Overall, the operational profit figures of adjusted EBIT and adjusted EBITDA rose slightly. The first-time full inclu-sion of routes started in UK Trains and the Netherlands in the previous year, acquisitions made in the previous year, and the operating development at UK Trains and Mainland Europe had a positive effect. The absence of one-off effects from the first half-year of 2016 and exchange rate effects had a dampening impact.
Gross capital expenditures increased significantly in the year under review. This was primarily due to vehicles procured in connection with transport contracts awarded in London in the previous year and elsewhere in UK Bus to support service delivery improvements. In addition, scheduled capital expenditures for existing transport con-tracts at Mainland Europe had a positive effect. Exchange rate effects had a dampening impact.
DB Arriva employs 30% of its employees in the UK Bus line of business, 23% in the UK Trains line of business and 46% in the Mainland Europe line of business. The number of employees increased driven by the commencement of new operations and acquisitions.
UK Bus line of business ◊ The market and competitive environment
continues to be challenging. ◊ Extensive countermeasures initiated. ◊ Weaker pound leads to negative exchange
rate effects.
¿ † UK Bus line of business
H 1 Change
2017 2016 absolute %
Passengers (million) 350.0 343.0 +7.0 +2.0Volume produced (million bus km) 180.4 182.6 – 2.2 – 1.2
Total revenues (€ million) 546 620 – 74 – 11.9External revenues (€ million) 545 616 – 71 – 11.5EBITDA adjusted (€ million) 69 81 – 12 – 14.8EBIT adjusted (€ million) 32 39 – 7 – 17.9Gross capital expenditures (€ million) 76 21 + 55 –
| Employees as of Jun 30 (FTE) 16,349 16,789 – 440 – 2.6
The increase in the number of passengers was primarily due to contract changes in London. The volume produced, on the other hand, decreased as a result of a network review in the regions partially offset by contract changes in London.
Negative exchange rate effects and lower revenues in the non-core business, including the cessation of patient transport contracts, were partially offset by the newly in -tro duced transport routes in London.
Cost of materials decreased (–18.2%), mainly as a result of exchange rate effects and fewer vehicle purchases in the non-core business.
Personnel expenses declined (–8.1%) due to exchange rate effects.
Adjusted EBITDA and adjusted EBIT decreased primarily due to negative exchange rate effects and the challenging market environment.
Vehicle acquisitions in connection with the transport con- tracts awarded in London in the previous year as well as mea- sures to improve services in the regions outside of London resulted in a significant increase in capital expenditures.
The number of employees declined, largely due to the cessation of patient transport contracts in the previous year.
!!!
33
DEVELOPMENT OF BUSINESS UNITS

UK Trains line of business ◊ The commencement of operations in the
previous year is driving the development. ◊ Weaker pound leads to negative exchange
rate effects.
¿ † UK Trains line of business
H 1 Change
2017 2016 absolute %
Passengers (million) 206.3 92.3 +114.0 +124Volume sold (million pkm) 5,375 3,931 +1,444 + 36.7Volume produced (million train-path km) 64.5 45.7 + 18.8 + 41.1
Total revenues (€ million) 1,103 985 + 118 + 12.0External revenues (€ million) 1,086 969 + 117 + 12.1EBITDA adjusted (€ million) 31 35 – 4 – 11.4EBIT adjusted (€ million) 16 20 – 4 – 20.0Gross capital expenditures (€ million) 21 25 – 4 – 16.0
| Employees as of Jun 30 (FTE) 12,509 11,172 + 1,337 + 12.0
In the first half of 2017, performance development in UK rail transport improved significantly, mainly due to the commencement of operations of Arriva Rail North and Arriva Rail London in the previous year.
Revenue development was also positive as a result, par-tially offset by significant negative exchange rate effects.
Cost of materials (+22.5%) and personnel expenses (+53.8%) were also significantly higher due to the com-mencement of the new operations, while exchange rates had a dampening effect. The development of personnel expenses was also negatively impacted by the one-off effect in connection with pension adjustments, which had the effect of reducing expenses in the first half of 2016.
Adjusted EBITDA and EBIT decreased. This was primarily due to the one-off effect in connection with pension adjust-ments and negative exchange rate effects.
The number of employees significantly increased as a result of the impact of new operations of Arriva Rail North and Arriva Rail London.
Mainland Europe line of business ◊ The commencement of transport
operations in the Netherlands is the main driver of the development.
◊ Positive effects also from acquisitions.
¿ † Mainland Europe line of business
H 1 Change
2017 2016 absolute %
Passengers rail (million) 58.2 51.9 + 6.3 +12.1Passengers bus (million) 385.2 367.2 +18.0 + 4.9Volume sold rail (million pkm) 1,185 1,145 + 40 + 3.5Volume produced (million train-path km) 27.8 29.4 – 1.6 – 5.4Volume produced (million bus km) 362.8 334.8 + 28.0 + 8.4
Total revenues (€ million) 1,071 978 + 93 + 9.5External revenues (€ million) 1,028 940 + 88 + 9.4EBITDA adjusted (€ million) 146 137 + 9 + 6.6EBIT adjusted (€ million) 71 66 + 5 + 7.6Gross capital expenditures (€ million) 76 69 + 7 + 10.1
| Employees as of Jun 30 (FTE) 24,946 23,412 + 1,534 + 6.6
Performance development in the Mainland Europe line of business was positive mainly as a result of newly com-menced services in the Netherlands (Limburg and ZOWAD) in December 2016. In bus transport, the previous yearʼs acquisitions in Italy, Spain and the Czech Republic had a positive effect.
Revenue development was also positive mainly driven by the commencement of operations in the Netherlands and the previous yearʼs acquisitions. A portfolio change in Denmark had a small dampening effect in revenue.
The commencement of operations and acquisitions of the previous year also increased cost of materials (+20.8%) and personnel expenses (+8.8%). The portfolio changes in Denmark had a small positive effect.
Adjusted EBITDA and adjusted EBIT increased due to improved performance in the Netherlands and acquisitions in the previous year.
Gross capital expenditures increased primarily due to sched uled capital expenditures for existing transport contracts.
The number of employees also increased mainly due to the commencement of operations in the Netherlands and acquisitions in the previous year. Portfolio changes had an adverse effect.
34
Deutsche Bahn Group – Interim Report January – June 2017 INTERIM GROUP MANAGEMENT REPORT
≈ DB Cargo business unit
≈ Events in the first half of 2017Partner in the Lean and Green initiativeDB Cargo takes a stand on even more environmental protection on railways. All participating companies of the non-profit initiative Lean and Green undertake to reduce their greenhouse gas emissions in logistics processes by 20% in five years.
Other events ◊ Since February, DB Cargo has been providing a daily
connection between the Belgian industrial region of Antwerp and the Ruhr region as well as the Rhine-Neckar region with DBantwerp-rhine-shuttle. This ser-vice reduces transit times and increases transport capacity and flexibility for customers.
◊ In cooperation with several freight railways, DB Cargo successfully carried out the first direct rail transport from China to Great Britain in January. In 18 days, it covered a distance of 12,000 km in Asia and Europe and was twice as fast as transport by sea and more cost- effective than transport by air. Trains should be running regularly over the medium term.
◊ DB Cargo and ScandFibre Logistics (SFL) have increased their transport contract to 1.2 million tons per year up to 2019 from Sweden to Continental and Southeastern Europe. There are also approximately 12,000 wagon-loads traveling in the opposite direction to Sweden.
≈ Development in the first half of 2017 ◊ Positive stimuli from the market and
competitive environment in Germany. ◊ Positive development of steel transport
in Great Britain and Germany. ◊ Restructuring promoted in France
and Great Britain.
¿ † DB Cargo
H 1 Change
2017 2016 absolute %
Punctuality (%) 73.8 75.7 – –Freight carried (million t) 139.2 140.2 –1.0 – 0.7Volume sold (million tkm) 47,756 47,830 –74 – 0.2Volume produced (million train-path km) 89.1 90.4 –1.3 –1.4Capacity utilization (t per train) 535.7 529.1 + 6.6 +1.2
Total revenues (€ million) 2,306 2,312 – 6 – 0.3External revenues (€ million) 2,150 2,154 – 4 – 0.2EBITDA adjusted (€ million) 82 39 + 43 +110EBIT adjusted (€ million) –28 – 53 +25 – 47.2EBIT margin (adjusted) (%) –1.2 –2.3 – –Gross capital expenditures (€ million) 110 52 + 58 +112
| Employees as of Jun 30 (FTE) 28,964 30,155 –1,191 –3.9
Punctuality has declined mainly due to development in Germany, as a result of operating difficulties when intro-ducing a new production system and due to storms when simultaneously increasing transport volume.
Performance development had declined primarily due to negative development in Western Europe. The volume of freight carried and sold fell slightly. Utilization per train increased slightly due to measures to increase efficiency. The positive development of performance in Central Europe compensated for this to some extent.
82% of revenues are generated in Central Europe, 13% in Western Europe and 5% in Eastern Europe. Revenues were almost unchanged. Performance-based increases, especially in Central Europe (increased steel and military transport in Germany), were offset by negative exchange rate effects and decreases in revenues in Western Europe.
Other operating income (+16.3%) also recorded a sig-nificant increase, including that based on compensation payments for vehicles delivered late in Germany, growth in the sidings business in Southeastern Europe, and on the Italian Government’s subsidy payments for DB Cargo Italia. In Western Europe, negative currency effects and the oper-ating development in France, among other things, had a moderating effect.
Cost of materials (+1.3%) rose slightly as a result of higher transport services purchased in Central Europe and Eastern Europe and higher expenses for locomotive main-tenance in Germany. Furthermore, the costs of infrastruc-ture utilization were higher in Great Britain. The reimburse-ment of taxes on fuel elements in Germany and exchange rate effects had compensated for this.
Personnel expenses (–1.4%) were declining, mainly due to exchange rate-related changes and due to a lower num ber of employees. Fare adjustments had the opposite effect.
Other operating expenses (–10.6%) fell mainly due to the activation of IT development costs in Germany, cost reductions at ECR and exchange rate effects.
Depreciation (+20.9%) rose significantly driven in par-ticular by the activation of IT development costs and the acquisition of the utilization right covering locomotive capacities in Germany.
Overall, the income rose somewhat more sharply than expenses, and the adjusted EBITDA and EBIT therefore improved. The EBIT margin also improved. The develop-ment was driven by Central Europe whereas Western Europe had a moderating effect.
Gross capital expenditures rose as a result of develop-ment in Central Europe. In contrast, capital expenditures fell in Western Europe and Eastern Europe.
35
DEvELOPmENT OF BUSINESS UNITS
A total of 65% of employees are employed in Central Europe, 16% in Western Europe, and 14% in Eastern Europe. The decline can be attributed to development in Central Europe and Western Europe.
≈ Central Europe ◊ Positive market and competitive environment. ◊ Additional transport services in Italy
and Scandinavia. ◊ Limitations in the quality of services in Germany.
¿ † Central Europe
H 1 Change
2017 2016 absolute %
Freight carried (million t) 126.5 124.9 +1.6 +1.3Volume sold (million tkm) 38,721 38,579 +142 + 0.4Volume produced (million train-path km) 71.3 72.0 – 0.7 –1.0
Total revenues (€ million) 2,465 2,429 + 36 +1.5External revenues (€ million) 1,764 1,741 +23 +1.3EBITDA adjusted (€ million) 111 61 + 50 + 82.0EBIT adjusted (€ million) 34 3 + 31 –Gross capital expenditures (€ million) 91 23 + 68 –
| Employees as of Jun 30 (FTE) 18,757 19,682 – 925 – 4.7
Performance development in Central Europe was positive. An improved market and competitive environment were particularly notable here, as was higher crude steel produc-tion in Germany. Transport services were also increasing in Italy at the same time.
The increase in revenues was largely driven by the in -creased performance in Italy and Scandinavia, an improved market and competitive environment, and the increase in crude steel production in Germany.
Other operating income (+4.4%) increased, mainly due to higher compensation payments for damages arising from vehicle projects and subsidies in Italy.
Cost of materials (+0.9%) increased as a result of higher transport services purchased and higher expenses for loco-motive maintenance (additional ultrasound tests and wheel set changes). Lower energy costs had a moderating effect.
Personnel expenses (+1.0%) increased slightly as a result of collective bargaining agreements. This was coun-teracted by the lower number of employees.
Adjusted EBITDA and EBIT improved, driven in particular by the increase in revenues.
Gross capital expenditures increased significantly due to the activation of IT development costs and higher capital expenditures in locomotives and freight cars.
The number of employees had fallen mainly due to restructuring measures and natural fluctuation and changes within the Group in Germany.
≈ Western Europe ◊ Restructuring measures in Great Britain
and France. ◊ Quality limitations at ECR. ◊ Positive development in steel transport
in Great Britain.
¿ † Western Europe
H 1 Change
2017 2016 absolute %
Freight carried (million t) 29.2 31.7 –2.5 –7.9Volume sold (million tkm) 6,831 6,964 –133 –1.9Volume produced (million train-path km) 13.9 14.3 – 0.4 –2.8
Total revenues (€ million) 353 393 – 40 –10.2External revenues (€ million) 288 321 –33 –10.3EBITDA adjusted (€ million) 3 11 – 8 –72.7EBIT adjusted (€ million) –24 –16 – 8 + 50.0Gross capital expenditures (€ million) 18 27 – 9 –33.3
| Employees as of Jun 30 (FTE) 4,694 5,198 – 504 – 9.7
In Western Europe freight carried, volume sold and volume produced fell, partly considerably. A rise in steel transport in Great Britain was more than offset by significant declines in performance in France as a result of quality limitations.
Revenues decreased considerably in the wake of perfor-mance development and exchange rate effects.
Other operating income (–26.0%) fell due to lower trans- port services in France and lower internal rental income for locomotives.
The decline in cost of materials (–9.6%) was due to ex change rate effects and significantly lower services purchased.
Personnel expenses decreased (–14.6%), mainly due to the adjustment in the number of employees in Great Britain and France in line with business conditions. Exchange rate effects also had a positive impact.
Depreciation remained unchanged. The lower revenues were only partly compensated for
by lower expenses, and the adjusted EBITDA and EBIT there- fore declined.
Gross capital expenditures were significantly lower. This resulted, among other things, from delayed maintenance work on diesel locomotives in France and from capital expenditures not yet made in Great Britain.
The number of employees declined following adjust-ment to the business conditions in Great Britain and France.
!!! !!!
36
Deutsche Bahn Group – Interim Report January – June 2017 INTERIM GROUP MANAGEMENT REPORT
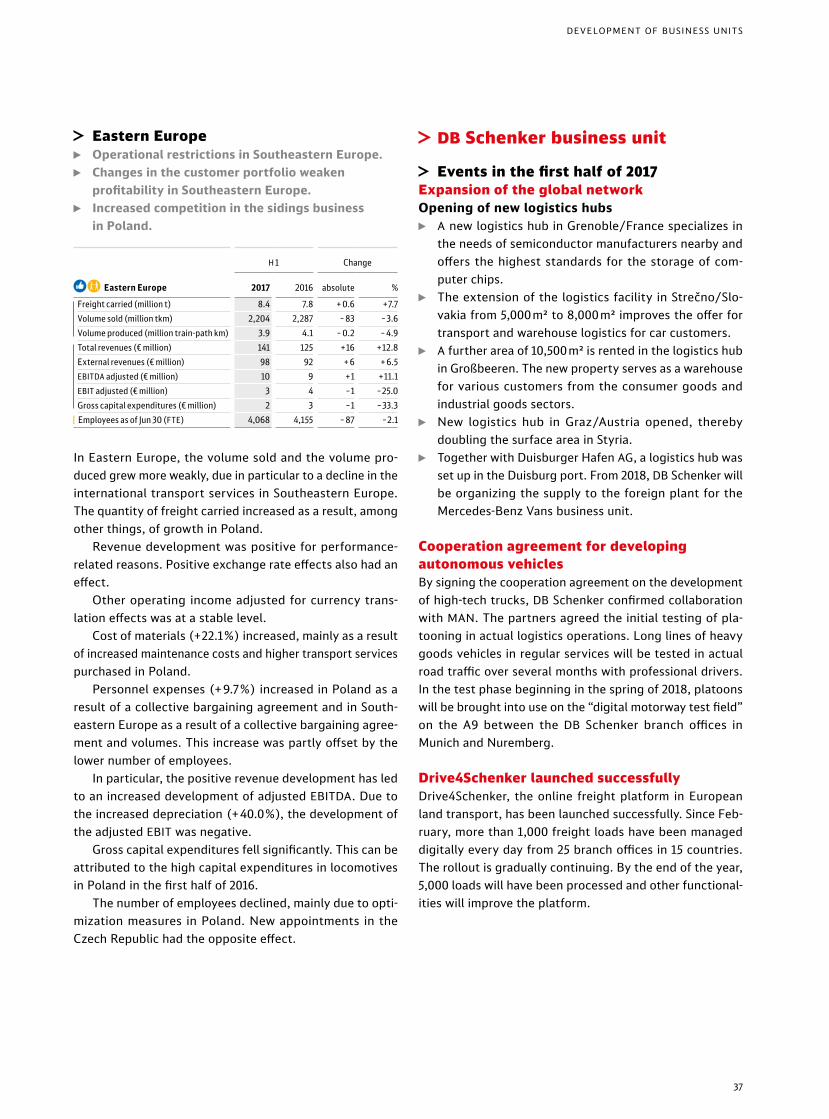
≈ Eastern Europe ◊ Operational restrictions in Southeastern Europe. ◊ Changes in the customer portfolio weaken
profitability in Southeastern Europe. ◊ Increased competition in the sidings business
in Poland.
¿ † Eastern Europe
H 1 Change
2017 2016 absolute %
Freight carried (million t) 8.4 7.8 + 0.6 +7.7Volume sold (million tkm) 2,204 2,287 – 83 –3.6Volume produced (million train-path km) 3.9 4.1 – 0.2 – 4.9
Total revenues (€ million) 141 125 +16 +12.8External revenues (€ million) 98 92 + 6 + 6.5EBITDA adjusted (€ million) 10 9 +1 +11.1EBIT adjusted (€ million) 3 4 –1 –25.0Gross capital expenditures (€ million) 2 3 –1 –33.3
| Employees as of Jun 30 (FTE) 4,068 4,155 – 87 –2.1
In Eastern Europe, the volume sold and the volume pro-duced grew more weakly, due in particular to a decline in the international transport services in Southeastern Europe. The quantity of freight carried increased as a result, among other things, of growth in Poland.
Revenue development was positive for performance- related reasons. Positive exchange rate effects also had an effect.
Other operating income adjusted for currency trans-lation effects was at a stable level.
Cost of materials (+22.1%) increased, mainly as a result of increased maintenance costs and higher transport services purchased in Poland.
Personnel expenses (+9.7%) increased in Poland as a result of a collective bargaining agreement and in South-eastern Europe as a result of a collective bargaining agree-ment and volumes. This increase was partly offset by the lower number of employees.
In particular, the positive revenue development has led to an increased development of adjusted EBITDA. Due to the increased depreciation (+40.0%), the development of the adjusted EBIT was negative.
Gross capital expenditures fell significantly. This can be attributed to the high capital expenditures in locomotives in Poland in the first half of 2016.
The number of employees declined, mainly due to opti-mization measures in Poland. New appointments in the Czech Republic had the opposite effect.
≈ DB Schenker business unit
≈ Events in the first half of 2017Expansion of the global networkOpening of new logistics hubs
◊ A new logistics hub in Grenoble/France specializes in the needs of semiconductor manufacturers nearby and offers the highest standards for the storage of com-puter chips.
◊ The extension of the logistics facility in Strečno/Slo-vakia from 5,000 m² to 8,000 m² improves the offer for transport and warehouse logistics for car customers.
◊ A further area of 10,500 m² is rented in the logistics hub in Großbeeren. The new property serves as a warehouse for various customers from the consumer goods and industrial goods sectors.
◊ New logistics hub in Graz/Austria opened, thereby doubling the surface area in Styria.
◊ Together with Duisburger Hafen AG, a logistics hub was set up in the Duisburg port. From 2018, DB Schenker will be organizing the supply to the foreign plant for the mercedes-Benz vans business unit.
Cooperation agreement for developing autonomous vehiclesBy signing the cooperation agreement on the development of high-tech trucks, DB Schenker confirmed collaboration with mAN. The partners agreed the initial testing of pla-tooning in actual logistics operations. Long lines of heavy goods vehicles in regular services will be tested in actual road traffic over several months with professional drivers. In the test phase beginning in the spring of 2018, platoons will be brought into use on the “digital motorway test field” on the A9 between the DB Schenker branch offices in munich and Nuremberg.
Drive4Schenker launched successfullyDrive4Schenker, the online freight platform in European land transport, has been launched successfully. Since Feb-ruary, more than 1,000 freight loads have been managed digitally every day from 25 branch offices in 15 countries. The rollout is gradually continuing. By the end of the year, 5,000 loads will have been processed and other functional-ities will improve the platform.
37
DEvELOPmENT OF BUSINESS UNITS
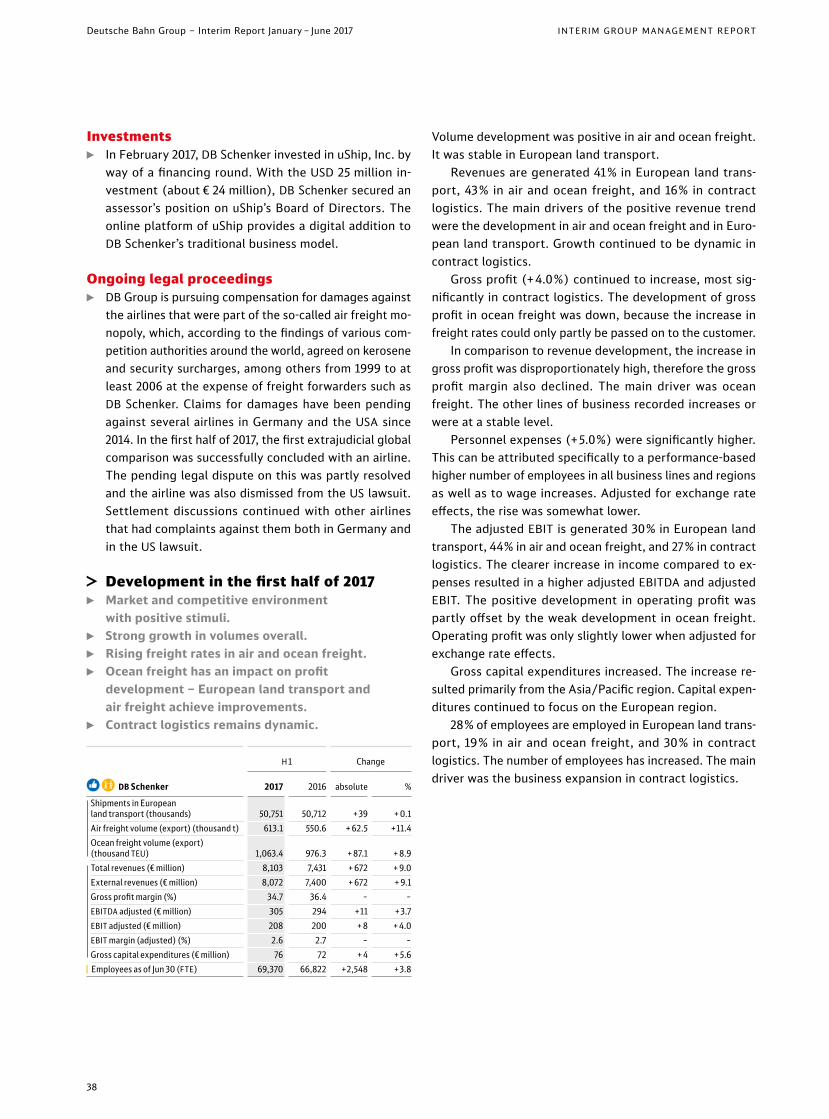
Investments ◊ In February 2017, DB Schenker invested in uShip, Inc. by
way of a financing round. With the USD 25 million in-vestment (about € 24 million), DB Schenker secured an assessor’s position on uShip’s Board of Directors. The online platform of uShip provides a digital addition to DB Schenker’s traditional business model.
Ongoing legal proceedings ◊ DB Group is pursuing compensation for damages against
the airlines that were part of the so-called air freight mo -nop oly, which, according to the findings of various com-petition authorities around the world, agreed on kerosene and security surcharges, among others from 1999 to at least 2006 at the expense of freight forwarders such as DB Schenker. Claims for damages have been pending against several airlines in Germany and the USA since 2014. In the first half of 2017, the first extrajudicial global comparison was successfully concluded with an airline. The pending legal dispute on this was partly resolved and the airline was also dismissed from the US lawsuit. Settlement discussions continued with other airlines that had complaints against them both in Germany and in the US lawsuit.
≈ Development in the first half of 2017 ◊ Market and competitive environment
with positive stimuli. ◊ Strong growth in volumes overall. ◊ Rising freight rates in air and ocean freight. ◊ Ocean freight has an impact on profit
development – European land transport and air freight achieve improvements.
◊ Contract logistics remains dynamic.
¿ † DB Schenker
H 1 Change
2017 2016 absolute %
Shipments in European land transport (thousands) 50,751 50,712 + 39 + 0.1Air freight volume (export) (thousand t) 613.1 550.6 + 62.5 +11.4Ocean freight volume (export) (thousand TEU) 1,063.4 976.3 + 87.1 + 8.9
Total revenues (€ million) 8,103 7,431 + 672 + 9.0External revenues (€ million) 8,072 7,400 + 672 + 9.1Gross profit margin (%) 34.7 36.4 – –EBITDA adjusted (€ million) 305 294 +11 + 3.7EBIT adjusted (€ million) 208 200 + 8 + 4.0EBIT margin (adjusted) (%) 2.6 2.7 – –Gross capital expenditures (€ million) 76 72 + 4 + 5.6
| Employees as of Jun 30 (FTE) 69,370 66,822 +2,548 + 3.8
volume development was positive in air and ocean freight. It was stable in European land transport.
Revenues are generated 41% in European land trans-port, 43% in air and ocean freight, and 16% in contract logistics. The main drivers of the positive revenue trend were the development in air and ocean freight and in Euro-pean land transport. Growth continued to be dynamic in contract logistics.
Gross profit (+4.0%) continued to increase, most sig-nificantly in contract logistics. The development of gross profit in ocean freight was down, because the increase in freight rates could only partly be passed on to the customer.
In comparison to revenue development, the increase in gross profit was disproportionately high, therefore the gross profit margin also declined. The main driver was ocean freight. The other lines of business recorded increases or were at a stable level.
Personnel expenses (+5.0%) were significantly higher. This can be attributed specifically to a performance-based higher number of employees in all business lines and regions as well as to wage increases. Adjusted for exchange rate effects, the rise was somewhat lower.
The adjusted EBIT is generated 30% in European land transport, 44% in air and ocean freight, and 27% in contract logistics. The clearer increase in income compared to ex -penses resulted in a higher adjusted EBITDA and adjusted EBIT. The positive development in operating profit was partly offset by the weak development in ocean freight. Operating profit was only slightly lower when adjusted for exchange rate effects.
Gross capital expenditures increased. The increase re-sult ed primarily from the Asia/Pacific region. Capital expen- ditures continued to focus on the European region.
28% of employees are employed in European land trans-port, 19% in air and ocean freight, and 30% in contract logistics. The number of employees has increased. The main driver was the business expansion in contract logistics.
38
Deutsche Bahn Group – Interim Report January – June 2017 INTERIM GROUP MANAGEMENT REPORT

≈ European land transport line of business ◊ Within the system and direct transport areas, the
focus is on international transport services. ◊ Drive4Schenker implementation is progressing. ◊ Europe-wide cost-reduction initiatives launched.
¿ † European land transport
H 1 Change
2017 2016 absolute %
Shipments in European land transport (thousands) 50,751 50,712 + 39 + 0.1
Total revenues (€ million) 3,326 3,226 +100 + 3.1External revenues (€ million) 3,299 3,197 +102 + 3.2EBITDA adjusted (€ million) 96 91 + 5 + 5.5EBIT adjusted (€ million) 62 58 + 4 + 6.9
| Employees as of Jun 30 (FTE) 19,661 19,437 +224 +1.2
In a market environment which was marked by growing demand, volume development in European land transport was stable. A decline in the parcel business (–6.3%) was entirely compensated by higher volumes for bulk (+2.7%) and in particular for direct transport (+7.3%).
Despite the stable shipping volume, the development in revenues was better due to growth in bulk and direct transport.
Cost of materials increased. This was the result in par-ticular of bulk and direct transport.
Personnel expenses rose due to volume and price.The development of the adjusted EBITDA and EBIT was
better as a result of good business development. The number of employees has increased as a result of
business development.
≈ Air and ocean freight line of business ◊ Significant effects due to freight rate development. ◊ Focus in ocean freight on efforts to optimize
capacity utilization, costs and purchase prices. ◊ Focus in air freight on broadening the
customer base and improving the cargo mix.
¿ † Air and ocean freight
H 1 Change
2017 2016 absolute %
Air freight volume (export) (thousand t) 613.1 550.6 + 62.5 +11.4Ocean freight volume (export) (thousand TEU) 1,063.4 976.3 + 87.1 + 8.9
Total revenues (€ million) 3,476 2,988 + 488 +16.3External revenues (€ million) 3,473 2,986 + 487 +16.3EBITDA adjusted (€ million) 98 106 – 8 –7.5EBIT adjusted (€ million) 91 99 – 8 – 8.1
| Employees as of Jun 30 (FTE) 13,163 13,104 + 59 + 0.5
Performance development in air and ocean freight was very pleasing:
◊ volumes increased significantly in air freight. The largest relative growth was accounted for by trans-Pacific ser-vices and the routes from Asia to Europe. In addition, the volume of transatlantic and Asian traffic, among others, and the routes from and to Latin America have clearly been developing positively.
◊ The ocean freight volume also increased significantly. Here in particular, growth on the trans-Pacific and intra-Asian routes and on routes between Asia and Europe had an impact. Transport services from and to Latin America and on the transatlantic routes also contrib-uted to growth.
Revenue development was also positive in both air and ocean freight. The main drivers of revenue development were freight rate development and positive volume development.
Cost of materials also rose according to volume and freight rate development.
Personnel expenses rose due to volume and price.The adjusted EBITDA and EBIT profit and loss declined as
a result of increased ocean freight rates. Air freight improved. The number of employees increased slightly.
≈ Contract logistics/SCM line of business ◊ Good business development in
the existing and new customer base. ◊ Further capacity expansion.
¿ † Contract logistics/SCM
H 1 Change
2017 2016 absolute %
Total revenues (€ million) 1,301 1,218 + 83 + 6.8External revenues (€ million) 1,300 1,218 + 82 + 6.7EBITDA adjusted (€ million) 79 70 + 9 +12.9EBIT adjusted (€ million) 56 43 +13 + 30.2
| Employees as of Jun 30 (FTE) 20,572 19,012 +1,560 + 8.2
Revenue development in the contract logistics/SCm line of business remained very positive. The good business devel-opment made itself noticeable here in the existing and new customer base. Total and external revenues accordingly developed positively.
With the expansion in business, the cost of materials also increased due to the higher number of employees and personnel expenses.
The development of adjusted EBITDA and EBIT was better as a result of good business development.
The dynamic business development was also reflected in an increase in the number of employees.
39
DEvELOPmENT OF BUSINESS UNITS

≈ DB Netze Track business unit
≈ Events in the first half of 2017Digital construction planning becomes reality Since the BMVI made about € 20 million available to us in 2016 to test Building Information Modeling (BIM) in 13 complex, large-scale infrastructure projects, intensive preparations are underway for the transition from conven-tional planning to BIM. Pilot projects include sections of the Rhine Valley Rail (Rheintalbahn, Karlsruhe ‒ Basel), the Emmerich ‒ Oberhausen expansion line, the Rhine-Ruhr- Express and the rail connection to the fixed link across the Fehmarn Belt. BIM will also be used for railway bridge renovations.
Progress in standardizing maintenance In order to improve rail infrastructure quality, we take ad van tage of digitalization opportunities for maintaining the rail network.
Within the framework of the standardization of produc-tion system maintenance (Standardisierung Produktions-system Instandhaltung; SPI), the scheduling and feedback process of operational maintenance have been standard-ized and digitalized company-wide. The stage 1 rollout was completed on schedule; nationwide, all maintenance operations are now digital. SPI stage 2 started in 2017. The focus here is on standardizing and improving workflows and processes, especially work preparation and execution. The pilot locations are the operations and maintenance sites in Frankfurt and Würzburg; nationwide rollout is planned for October.
Group pushes ahead with digitalization of command and control technologyAs part of a total of four pre-series production projects, we are continuing to press ahead with the digitalization of command and control technology (Leit- und Sicherungs-technik; LTS), thereby laying the technical foundation for nationwide coverage with the European Train Control System (ETCS) Level 2 and implementation of the opera-tional control strategy. The technical platform for this will be a modular signal tower with standardized interfaces (digital signal tower; DSTW) specified by DB Netze Track and an integrated operating station. Communications will be carried over an IP network specially developed to satisfy specific railway requirements, taking into account rail infra-structure safety requirements.
For us, the standardized LTS platform represents the basis for a later site rollout, which, over the long term, should replace the fragmented production system com-prised of the most divergent generations of technology.
Wayside monitoring systems in operation Wayside monitoring takes advantage of digitalization by enabling predictive maintenance. The goal is to improve rail system quality while lowering maintenance costs by recog-nizing potential irregularities at an early stage so that mal-functions can be avoided. To that end, wayside moni toring checks the condition of rolling stock in day-to-day oper-ations, virtually as it passes by. For acoustic diagnostics, microphones on the tracks record train noises. If the results deviate from the norm, vehicle maintenance is activated long before any defect in the train can arise. The trial run of the video-based diagnostics was launched in 2017.
Rollout of point machine diagnostics on trackIn order to optimize the availability of switches, a digital remote diagnostic system is used to detect potential faults before they can occur. The diagnostics platform DIANA gives maintenance an indication of a possible fault, allowing preventive measures to be taken. In the future, this should make it possible to reduce drive-related switch defects by up to 50%. By mid-2017, more than 9,000 switches had been equipped with actuating current diagnostic systems. Pre-dictive maintenance via the DIANA diagnostics platform will gradually be expanded to include other components.
New emergency technology in useDB Netze Track is carrying out large-scale modernization of its machinery and vehicle fleet (for example, emergency technology, measurement technology, and track mainte-nance vehicles). About € 650 million will be invested in this effort between 2015 and 2024. Emergency cranes and rescue trains are important components of this capital expenditures initiative. By 2019, all old vehicles using emergency technology will be replaced at a cost of about
€ 150 million. In 2017, for example, a new rescue train was placed into service at the Würzburg site.
Requirement plan implementation agreement definitively negotiated Along with BMVI, we have made important progress to- ward speeding up the implementation of major projects. The requirement plan implementation agreement (Be- darfs planumsetzungsvereinbarung; BUV) scheduled to go into effect on January 1, 2018 is a new model for the Federal Government to finance new track infrastructure construc-tion and expansion projects. In the future, new plans and results of early public participation will be presented once a year to the Bundestag in order to improve involvement by political leaders. The current plan lump sum will be abol-ished. Instead, in the future the Federal Government will subsidize total project costs, while DB Group will cover the
40
Deutsche Bahn Group – Interim Report January – June 2017 INTERIM GROUP MANAGEMENT REPORT

economically viable share of the project portfolio. Planning support from the Federal Railway Authority (Eisenbahn- Bundesamt; EBA) will increase and noncompliance with commissioning dates will be penalized.
Progress with regard to new construction and expansion measuresFull opening of German unification transport project no. 8 on trackCommercial operation of VDE 8 on the new construction line Ebensfeld ‒ Erfurt will commence on December 10, 2017. In passenger transport, this will reduce the Munich ‒ Berlin travel time to under four hours. By the time this is placed into service, portions of the expansion line Ebensfeld ‒ Nuremberg will also be expanded to four tracks. On the new construction line Ebensfeld ‒ Erfurt, as well as on the new construction line Erfurt ‒ Halle/Leipzig that was placed into service in 2015, the newest version of the European Train Control System (ETCS) will be used. On an approxi-mately 12 km section of the hub in Halle, construction is underway on bridges, track, station, marshaling yard and signal tower technology. Extensive construction work is also taking place at the Leipzig hub and on feeder lines.
Progress on the rail connection to the fixed link across the Fehmarn BeltThe project is in the design and approval planning stage. Section-by-section submission of the approval documents to the EBA should begin by the fall of 2017. Hearings of the parties involved are currently being held as part of the plan approval procedure for the belt tunnel being planned by the Danish project company. At the present time, the Fehmarn Belt Tunnel is not expected to start operations before 2028. The Belt crossing and the rail link will also involve renovating the Fehmarn Sound crossing. The bases for scenario analyses are currently being worked out.
Construction begins on second main S-Bahn (metro) line in MunichThe symbolic start of construction on the project took place on April 5, 2017. The initial preparatory construction work is currently underway at the central station and at Marien- hof. Planning approval has been received for all sections; however, some lawsuits regarding the eastern section are still pending. Based on the initial calls for tenders, and as part of an inquiry into whether costing was done properly, the cost planning has been revised. As a result, total costs were set at € 3.84 billion, including a risk buffer. A group of ex perts deployed by the Free State of Bavaria has reviewed,
validated and confirmed that costing was done appropri - a tely. The Federal Government recommended the inclusion in category A of the Municipal Transport Financing Act (Ge meindeverkehrsfinanzierungsgesetz; GVFG) program.
Expansion of the Cologne S-Bahn (metro) on targetCore elements for the elimination of the bottleneck in the high-traffic major rail hub in Cologne are the expansion of the S-Bahn (metro) main line (Cologne Convention Center/Deutz ‒ central station ‒ Cologne Hansaring) and the use of modernized, more powerful command and control technol ogy. The expansion of both S-Bahn (metro) lines is part of an overall concept, consisting of 15 infrastructure measures, which is designed to effectively take pressure off the Cologne hub. The project is currently in the pre- planning phase; the first track layout designs are being developed and will be coordinated with the affected stakeholders at an early stage. For the S13, the expansion from Troisdorf to Bonn-Oberkassel, work is progressing according to schedule.
Work begins on Emmerich ‒ Oberhausen expansion lineOn January 20, 2017, work began on the Emmerich ‒ Ober-hausen expansion line. The first plan approval decision was announced in October 2015. All 12 plan approval proce-dures (PFVs) have been disclosed; to date, ten public hear-ings have been held. The plan approval decisions are now expected, one after another, for the individual sections. In March 2017, a joint solution was reached by the seven neighboring communities, the state of North Rhine-West-phalia, the Federal Government and DB Group re garding the uniform rescue concept. Next, the rescue concept will be included in the ongoing plan approval procedures.
Construction of Rhine-Ruhr-Express officially beginsConstruction on the Rhine-Ruhr-Express (RRX) project officially began in Cologne on March 8, 2017 with the plan approval procedure. This first section was commissioned on May 22, 2017. However, additional sections for which construction permits have not yet been obtained will have to be expanded in order to absorb the initial increase in traffic. For reasons relating to customer tolerance, expan-sion within the heavily overloaded Rhine-Ruhr region will be possible only at a gradual pace, each time obtaining a construction permit while maintaining uninterrupted service. The RRX is one of the pilot projects of BIM [PAGE 4 0].
41
DEVELOPMENT OF BUSINESS UNITS
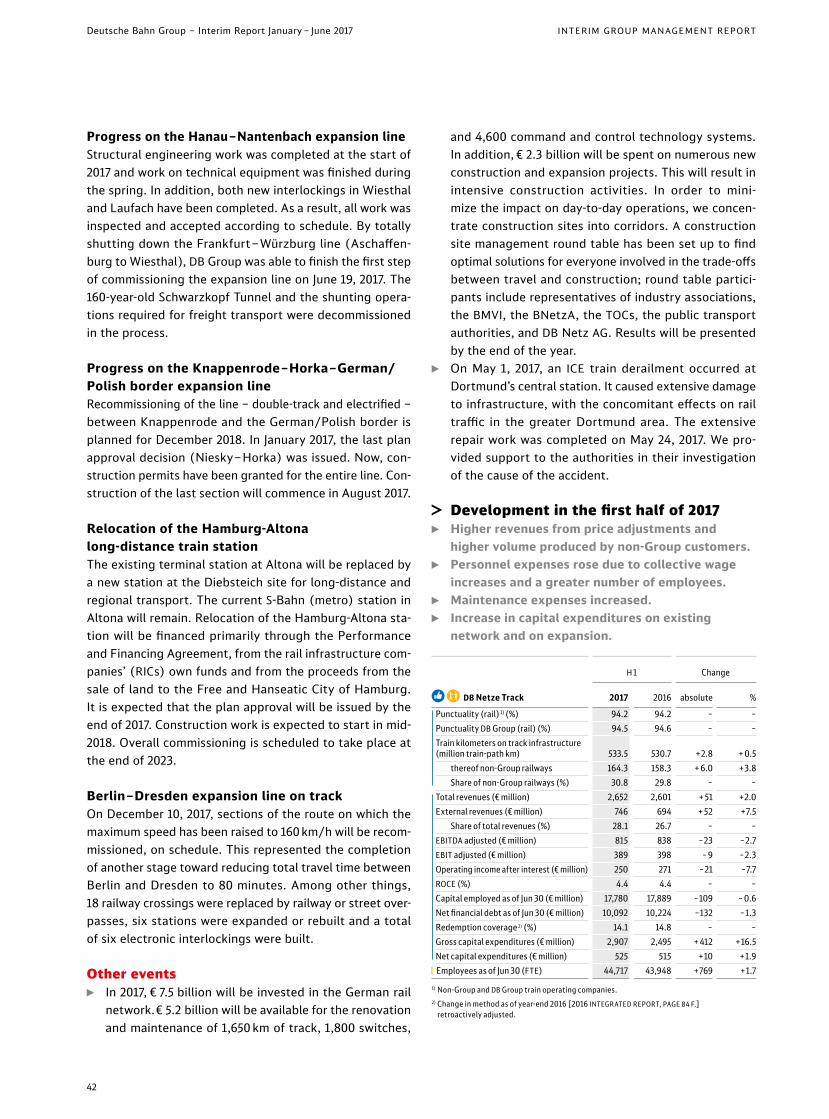
Progress on the Hanau ‒ Nantenbach expansion lineStructural engineering work was completed at the start of 2017 and work on technical equipment was finished during the spring. In addition, both new interlockings in Wiesthal and Laufach have been completed. As a result, all work was inspected and accepted according to schedule. By totally shutting down the Frankfurt ‒ Würzburg line (Aschaffen-burg to Wiesthal), DB Group was able to finish the first step of commissioning the expansion line on June 19, 2017. The 160-year-old Schwarzkopf Tunnel and the shunting opera-tions required for freight transport were decommissioned in the process.
Progress on the Knappenrode ‒ Horka ‒ German/Polish border expansion lineRecommissioning of the line – double-track and electrified – between Knappenrode and the German/Polish border is planned for December 2018. In January 2017, the last plan approval decision (Niesky ‒ Horka) was issued. Now, con-struction permits have been granted for the entire line. Con- struction of the last section will commence in August 2017.
Relocation of the Hamburg-Altona long-distance train station The existing terminal station at Altona will be replaced by a new station at the Diebsteich site for long-distance and regional transport. The current S-Bahn (metro) station in Altona will remain. Relocation of the Hamburg-Altona sta-tion will be financed primarily through the Performance and Financing Agreement, from the rail infrastructure com-panies’ (RICs) own funds and from the proceeds from the sale of land to the Free and Hanseatic City of Hamburg. It is expected that the plan approval will be issued by the end of 2017. Construction work is expected to start in mid-2018. Overall commissioning is scheduled to take place at the end of 2023.
Berlin ‒ Dresden expansion line on track On December 10, 2017, sections of the route on which the maximum speed has been raised to 160 km/h will be recom-missioned, on schedule. This represented the completion of another stage toward reducing total travel time between Berlin and Dresden to 80 minutes. Among other things, 18 railway crossings were replaced by railway or street over-passes, six stations were expanded or rebuilt and a total of six electronic interlockings were built.
Other events ◊ In 2017, € 7.5 billion will be invested in the German rail
network. € 5.2 billion will be available for the renovation and maintenance of 1,650 km of track, 1,800 switches,
and 4,600 command and control technology systems. In addition, € 2.3 billion will be spent on numerous new construction and expansion projects. This will result in intensive construction activities. In order to mini - mize the impact on day-to-day operations, we concen-trate construction sites into corridors. A construction site management round table has been set up to find optimal solutions for everyone involved in the trade-offs between travel and construction; round table partici-pants include representatives of industry associations, the BMVI, the BNetzA, the TOCs, the public transport authorities, and DB Netz AG. Results will be presented by the end of the year.
◊ On May 1, 2017, an ICE train derailment occurred at Dortmund’s central station. It caused extensive damage to infrastructure, with the concomitant effects on rail traffic in the greater Dortmund area. The extensive repair work was completed on May 24, 2017. We pro-vided support to the authorities in their investigation of the cause of the accident.
≈ Development in the first half of 2017 ◊ Higher revenues from price adjustments and
higher volume produced by non-Group customers. ◊ Personnel expenses rose due to collective wage
increases and a greater number of employees. ◊ Maintenance expenses increased. ◊ Increase in capital expenditures on existing
network and on expansion.
¿ † DB Netze Track
H 1 Change
2017 2016 absolute %
Punctuality (rail) 1) (%) 94.2 94.2 – –Punctuality DB Group (rail) (%) 94.5 94.6 – –Train kilometers on track infrastructure (million train-path km) 533.5 530.7 +2.8 + 0.5 thereof non-Group railways 164.3 158.3 + 6.0 + 3.8 Share of non-Group railways (%) 30.8 29.8 – –
Total revenues (€ million) 2,652 2,601 + 51 +2.0External revenues (€ million) 746 694 + 52 +7.5 Share of total revenues (%) 28.1 26.7 – –EBITDA adjusted (€ million) 815 838 –23 –2.7EBIT adjusted (€ million) 389 398 – 9 –2.3Operating income after interest (€ million) 250 271 –21 –7.7ROCE (%) 4.4 4.4 – –Capital employed as of Jun 30 (€ million) 17,780 17,889 –109 – 0.6Net financial debt as of Jun 30 (€ million) 10,092 10,224 –132 –1.3Redemption coverage 2) (%) 14.1 14.8 – –Gross capital expenditures (€ million) 2,907 2,495 + 412 +16.5Net capital expenditures (€ million) 525 515 +10 +1.9
| Employees as of Jun 30 (FTE) 44,717 43,948 +769 +1.71) Non-Group and DB Group train operating companies.2) Change in method as of year-end 2016 [2016 INTEGR ATED REPORT, PAGE 84 F.]
retroactively adjusted.
42
Deutsche Bahn Group – Interim Report January – June 2017 INTERIM GROUP MANAGEMENT REPORT

Punctuality of non-Group and DB Group TOCs in Germany remained unchanged, while the punctuality of TOCs within DB Group decreased slightly.
Train kilometers on track infrastructure increased due to higher demand from non-Group customers, especially from freight transport, but also from regional transport. The decrease in demand from internal long-distance and freight transport customers had a dampening effect.
Total revenues increased, primarily because of price ad -justments and increases in demand by non-Group railways.
Other operating income increased (+3.4%), mainly because of a change in the revenues recognized in the Swiss business unit and higher income from the refund of expenses for third-party facilities, compensation for dam-ages and refund of expenses.
The cost of materials rose (+2.7%) due to higher ex -pen ses for maintenance and winter snow and ice removal services.
The increase in personnel expenses (+6.6%) was pri-marily attributable to wage adjustments and the higher number of employees.
Among other things, other operating expenses rose (+2.1%) because of higher expenses from grants for third-party facilities, compensation for damages, expert opin-ions, and consulting and rents. Lower expenses from dis-posal of property, plant and equipment had the opposite effect.
Depreciation decreased (–3.2%) due to a lower level of property, plant and equipment.
Overall, driven by personnel and maintenance expenses, expenses exceeded the positive earnings trend, meaning the adjusted profit figures EBITDA and EBIT declined.
Higher interest expenses – mainly related to litigation risk – caused the operating interest balance to deteriorate. As a result, operating income after interest decreased even further.
The weaker profit development was offset by a slight decrease in capital employed, leaving ROCE unchanged.
Net financial debt decreased, mainly due to lower fixed assets and net working capital.
The development in operating profit led to a decrease in redemption coverage.
Gross capital expenditures increased due to higher vol-umes of capital expenditures for new construction and expansion projects and for the existing network. Net capi- tal expenditures increased slightly.
The number of employees rose slightly, mainly due to increases to cover existing and future staffing require-ments, especially in the maintenance and construction proj- ect areas.
≈ DB Netze Stations business unit
≈ Events in the first half of 2017Quality initiative continues As part of the R AILWAY OF THE FUTURE [PAGE 3 F.], fur-ther train station quality improvements were made.
In Hamburg, the S-Bahn (metro) stations Jungfernstieg and Stadthausbrücke kicked off a € 48 million capital expen-diture program to modernize the S-Bahn (metro) network’s tunnel stations. Construction in the tunnel stations will be carried out in accordance with the lean-construction prin-ciple. Here, the focus will be on proactively controlling pro-cesses, in order to minimize variances in the performance of individual stages of the work and to ensure a consistent production flow.
Moreover, work continued on revitalizing transit sta-tions to improve their appearance in areas that are rele-vant to customers. Revitalization encompasses a broad, individual spectrum of renovations, up to and including modernization efforts, such as the use of lighting, new paint, updates to façades and decluttering. In the first half of 2017, work was carried out at the Augsburg, Duisburg, Hagen, Hamburg-Altona, Hamm, Cologne Convention Cen-ter Deutz, Munich and Osnabrück stations.
To ensure the continuity of the cleaning initiative, we pilot-tested a new cleaning concept at selected stations. One component is a permanent presence of cleaning staff at the top 83 stations. Implementation of the cleaning con-cept began on July 1, 2017. Initially, all top stations, high-speed stations, and mid-sized stations will be conver ted. Altogether, this will involve about 700 stations. Then, by the end of the year, the about 4,600 regional stations will follow.
Other events ◊ On March 24, 2017, the City of Düsseldorf and DB Group
signed the master agreement for the “Düsseldorf Cen-tral Station Area Master Plan.”
◊ Station Food has opened its first two stores at the Karlsruhe and Munich central stations. The goal is to develop and operate modern, attractive catering con-cepts in stations, with particular emphasis on healthy food produced in a sustainable manner.
◊ 77% of passenger stations are now handicapped-acces-sible; this covers 82% of all passengers. On average, accessibility is improved at 100 stations each year.
43
DEVELOPMENT OF BUSINESS UNITS

◊ On June 24, 2017, the new concourse building was opened at the Münster central station. The concourse hall offers three floors and 8,000 m² of services and shopping, as well as office and administrative space. Including the work carried out in 2013, capital expenditures totaled about € 76 million.
≈ Development in the first half of 2017 ◊ Increased demand from new traffic and
increased schedule frequencies. ◊ Rental revenues are driven by price and
margin effects. ◊ Higher expenses for Railway of the Future
and personnel burden performance. ◊ Group presses ahead with measures to further
reduce energy consumption.
¿ † DB Netze Stations
H 1 Change
2017 2016 absolute %
Facility quality (grade) 2.91 2.94 – –Station stops (million) 74.8 74.3 + 0.5 + 0.7 thereof non-Group railways 17.9 17.3 + 0.6 + 3.5
Total revenues (€ million) 635 623 +12 +1.9 thereof station revenues 424 413 +11 +2.7 thereof rental and leasing revenues 206 203 + 3 +1.5External revenues (€ million) 273 267 + 6 +2.2EBITDA adjusted (€ million) 217 227 –10 – 4.4EBIT adjusted (€ million) 150 159 – 9 – 5.7ROCE (%) 10.5 11.3 – –Capital employed as of Jun 30 (€ million) 2,859 2,829 + 30 +1.1Net financial debt as of Jun 30 (€ million) 1,215 1,175 + 40 + 3.4Redemption coverage 1) (%) 27.5 31.7 – –Gross capital expenditures (€ million) 253 182 +71 + 39.0Net capital expenditures (€ million) 80 69 +11 +15.9
| Employees as of Jun 30 (FTE) 5,404 5,007 + 397 +7.91) Change in method as of year-end 2016 [2016 INTEGRATED REPORT, PAGE 84 F.]
retroactively adjusted.
The quality of the facilities at passenger stations remained at a good level.
The number of station stops rose slightly, mainly due to increased schedule frequencies and additional traffic in regional transport. In particular, the higher demand was driven by non-Group railways.
The rise in revenues is attributable to higher station revenues as a result of volume and prices as well as higher revenues from rental and leasing. The development of ex -ternal revenues reflects the growing market share of non-Group railways.
Other operating income increased substantially (+24.6%), primarily due to seasonally higher construction cost sub-sidies and higher insurance and compensation benefits, as well as sales of concourse buildings.
The increase in the cost of materials (+7.5%) was mainly attributable to higher expenses relating to the Railway of the Future, seasonal effects on maintenance measures and additional expenses for personnel services.
Personnel expenses also increased significantly (+10.8%), mainly due to the higher number of employees and, to a lesser extent, wage increases.
Depreciation declined slightly (–1.5%). Overall, higher income was unable to offset the increase
in expenses, which was driven primarily by higher mainte-nance expenses; the operating profit figures deteriorated as a result.
The weaker EBIT development and a slight increase in capital employed led to a noticeable decline in ROCE.
Net financial debt increased, mainly as a result of higher net capital expenditures.
The profit-related decrease in operating cash flow and higher financial debt caused redemption coverage to decrease.
The higher capital expenditures were focused primarily on renovating existing stations.
The number of employees rose due to the increase in personnel in the areas of station maintenance, construction management, and facilities management. Development of business at Station Food GmbH, which was founded in the previous year, also had an impact.
≈ DB Netze Energy business unit
≈ Events in the first half of 2017Entry into retail businessAt the end of June, DB Netze Energy also began selling electricity to private households. For more than a decade, we have been supplying industry, trade and commerce be -yond the TOCs. By entering the retail business, DB Netze Energy has taken the final step toward becoming a full- service provider. DB Netze Energy distributes only green electricity that is certified with the ok-power label.
44
Deutsche Bahn Group – Interim Report January – June 2017 INTERIM GROUP MANAGEMENT REPORT

Nuclear fuel tax is unconstitutional In a decision dated June 7, 2017, the German Federal Consti-tutional Court ruled that the Nuclear Fuel Tax Act (Kern-brennstoffsteuergesetz; KernbrStG) is void with retroactive effect, declaring that the Federal Government does not have legislative power to impose the tax. Overall, the Federal Government has collected about € 6.3 billion from the nuclear fuel tax. In the absence of a valid legal basis, pay-ments made must be refunded to operators. The Federal Ministry of Finance (Bundesministerium der Finanzen; BMF) already disbursed a partial amount to operators in June.
DB Netze Energy received a repayment of about
€ 120 million and will refund to its customers the payments received in connection with the nuclear fuel tax.
Impact of the Nuclear Waste Disposal Fund Act In 2015, the Federal Government set up a commission to review financing for the phase-out of nuclear energy (Kom-mission zur Überprüfung der Finanzierung des Kernener-gieausstiegs; KFK). The commission’s recommendations were implemented by the Law on Restructuring Responsi-bility for Nuclear Waste Disposal, which entered into force on June 16, 2017. Nuclear power plant operators (E.ON, RWE, EnBW and Vattenfall) will continue to be responsible for decommissioning and dismantling the plants. The Fed-eral Government is assuming responsibility for the interim and final storage of radioactive waste and has established a public fund for this purpose. The nuclear power plant operators must transfer to this fund the provisions they have already set aside, plus a lump-sum risk premium of about 35%.
Because of its corporate shareholding in the Neckar-westheim nuclear power plant, DB AG had a payment obli-gation of about € 400 million, which it has already satisfied.
Access to traction current grid developed furtherBack in 2014, DB Netze Energy became the first RIC in Europe to deregulate traction current supply completely, making it possible for TOCs to choose alternative energy suppliers. Many TOCs avail themselves of this option. Lib-eralizing traction current supply requires introducing a variety of new contractual relationships and business pro-cesses which are largely automated and digital. In order to allocate the traction units involved in the new change pro-cesses to the respective traction unit owners and traction unit users, to match them with the contractually selected electricity providers, and to handle the accounting and billing for the quantities of electric power consumed pre-cisely down to the minute, complex IT systems are required.
The business processes and IT systems for access to the traction current grid therefore continue to be readjusted in close coordination with market partners and the Federal Network Agency.
Development in the first half of 2017 ◊ EBIT lower due to elimination of one-off effect. ◊ Reduction in selling prices due to
better purchasing conditions. ◊ Expansion of the stationary energy business.
¿ † DB Netze Energy
H 1 Change
2017 2016 absolute %
Supply reliability 1) (%) 99.99 99.99 – –Traction current (16.7 Hz and direct current) (GWh) 4,283 4,378 – 95 –2.2Traction current pass-through (16.7 Hz) (GWh) 999.6 755.4 +244.2 + 32.3Stationary energy (50 Hz and 16.7 Hz) (GWh) 9,813 8,532 +1,281 +15.0Diesel fuel (million l) 218.1 217.7 + 0.4 + 0.2
Total revenues (€ million) 1,416 1,391 +25 +1.8External revenues (€ million) 654 591 + 63 +10.7EBITDA adjusted (€ million) 79 98 –19 –19.4EBIT adjusted (€ million) 44 63 –19 –30.2ROCE (%) 9.4 12.9 – –Capital employed as of Jun 30 (€ million) 947 978 –31 –3.2Net financial debt as of Jun 30 (€ million) 445 254 +191 +75.2Redemption coverage 2) (%) 24.7 41.8 – –Gross capital expenditures (€ million) 48 49 –1 –2.0Net capital expenditures (€ million) 17 20 –3 –15.0
| Employees as of Jun 30 (FTE) 1,742 1,756 –14 – 0.81) Preliminary figures (not rounded).2) Change in method as of year-end 2016 [2016 INTEGRATED REPORT, PAGE 84 F.]
retroactively adjusted.
The high level of supply reliability was maintained. Sales of traction current declined. This was primarily due
to lower demand from intra-Group customers, in particular losses of tenders at DB Regional and energy-saving proj-ects at DB Long-Distance.
The traction current volumes passed through on behalf of non-Group customers increased significantly due to the switchover by some customers from full electricity supply to pass-through. In stationary energy, the sales volume for non-Group customers continues to increase substantially. This is attributable both to an expansion of business with existing industrial customers and an increase in volume in the portfolio optimization segment.
Demand for diesel fuels remained almost unchanged.
45
DEVELOPMENT OF BUSINESS UNITS
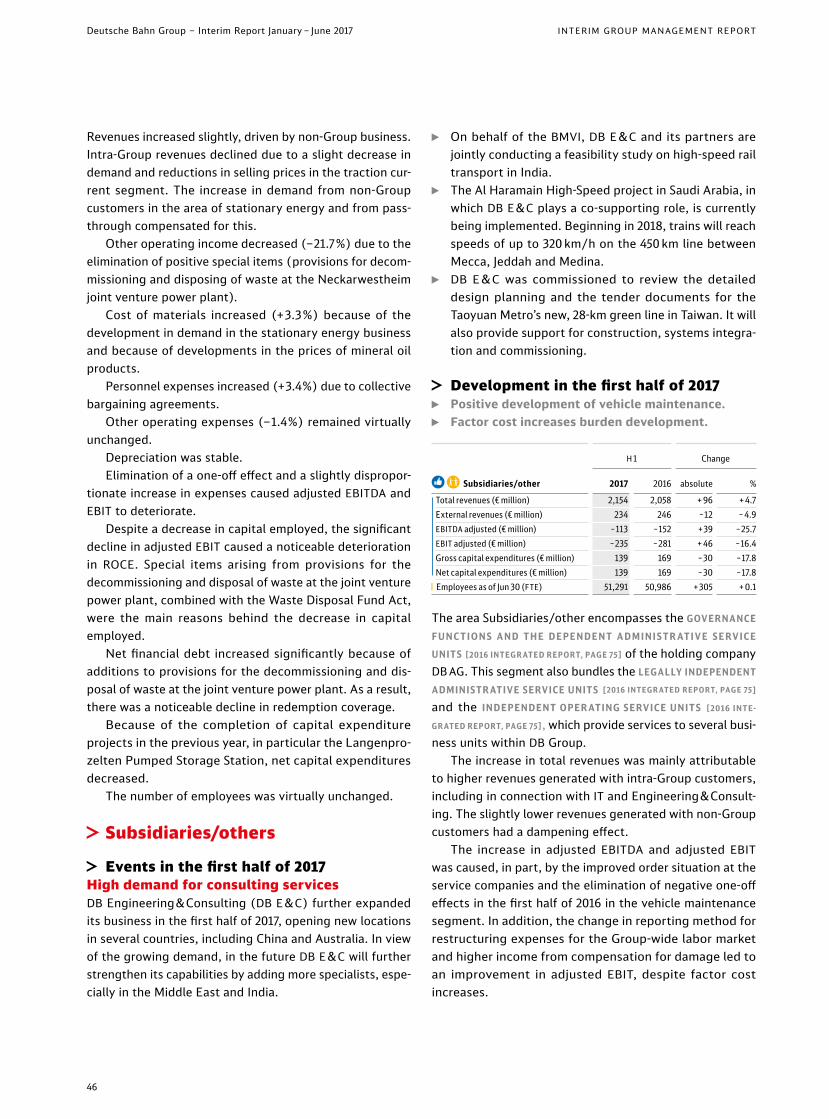
Revenues increased slightly, driven by non-Group business. Intra-Group revenues declined due to a slight decrease in demand and reductions in selling prices in the traction cur-rent segment. The increase in demand from non-Group customers in the area of stationary energy and from pass-through compensated for this.
Other operating income decreased (–21.7%) due to the elimination of positive special items (provisions for decom-missioning and disposing of waste at the Neckarwestheim joint venture power plant).
Cost of materials increased (+3.3%) because of the development in demand in the stationary energy business and because of developments in the prices of mineral oil products.
Personnel expenses increased (+3.4%) due to collective bargaining agreements.
Other operating expenses (–1.4%) remained virtually unchanged.
Depreciation was stable. Elimination of a one-off effect and a slightly dispropor-
tionate increase in expenses caused adjusted EBITDA and EBIT to deteriorate.
Despite a decrease in capital employed, the significant decline in adjusted EBIT caused a noticeable deterioration in ROCE. Special items arising from provisions for the decommissioning and disposal of waste at the joint venture power plant, combined with the Waste Disposal Fund Act, were the main reasons behind the decrease in capital employed.
Net financial debt increased significantly because of additions to provisions for the decommissioning and dis-posal of waste at the joint venture power plant. As a result, there was a noticeable decline in redemption coverage.
Because of the completion of capital expenditure projects in the previous year, in particular the Langenpro-zelten Pumped Storage Station, net capital expenditures decreased.
The number of employees was virtually unchanged.
≈ Subsidiaries/others
≈ Events in the first half of 2017High demand for consulting services DB Engineering&Consulting (DB E&C) further expanded its business in the first half of 2017, opening new locations in several countries, including China and Australia. In view of the growing demand, in the future DB E&C will further strengthen its capabilities by adding more specialists, espe-cially in the Middle East and India.
◊ On behalf of the BMVI, DB E&C and its partners are jointly conducting a feasibility study on high-speed rail transport in India.
◊ The Al Haramain High-Speed project in Saudi Arabia, in which DB E&C plays a co-supporting role, is currently being implemented. Beginning in 2018, trains will reach speeds of up to 320 km/h on the 450 km line between Mecca, Jeddah and Medina.
◊ DB E&C was commissioned to review the detailed design planning and the tender documents for the Taoyuan Metro’s new, 28-km green line in Taiwan. It will also provide support for construction, systems integra-tion and commissioning.
≈ Development in the first half of 2017 ◊ Positive development of vehicle maintenance. ◊ Factor cost increases burden development.
¿ † Subsidiaries / other
H 1 Change
2017 2016 absolute %
Total revenues (€ million) 2,154 2,058 + 96 + 4.7External revenues (€ million) 234 246 –12 – 4.9EBITDA adjusted (€ million) –113 –152 + 39 –25.7EBIT adjusted (€ million) –235 –281 + 46 –16.4Gross capital expenditures (€ million) 139 169 –30 –17.8Net capital expenditures (€ million) 139 169 –30 –17.8
| Employees as of Jun 30 (FTE) 51,291 50,986 + 305 + 0.1
The area Subsidiaries/other encompasses the GOVERNANCE F U N C T I O N S A N D T H E D E P E N D E N T A D M I N I S T R AT I V E S E RV I C E UNIT S [2016 INTEGR ATED R EP ORT, PAGE 75] of the holding company DB AG. This segment also bundles the LEGALLY INDEPENDENT ADMINISTR ATIVE SERVICE UNIT S [2016 INTEG R ATED R EP O RT, PAG E 75] and the IND EPEND ENT O PER ATIN G SERVI CE UNIT S [ 2 0 1 6 I N T E-
GR ATED REP ORT, PAGE 75], which provide services to several busi-ness units within DB Group.
The increase in total revenues was mainly attributable to higher revenues generated with intra-Group customers, including in connection with IT and Engineering&Consult- ing. The slightly lower revenues generated with non-Group customers had a dampening effect.
The increase in adjusted EBITDA and adjusted EBIT was caused, in part, by the improved order situation at the service companies and the elimination of negative one-off effects in the first half of 2016 in the vehicle maintenance segment. In addition, the change in reporting method for restructuring expenses for the Group-wide labor market and higher income from compensation for damage led to an improvement in adjusted EBIT, despite factor cost increases.
46
Deutsche Bahn Group – Interim Report January – June 2017 INTERIM GROUP MANAGEMENT REPORT

≈ Significant contract awards (including framework contracts)
◊ Framework contracts for the biggest projects in civil engineering maintenance services across Germany have been concluded for the next four years (total volume: about € 100 million).
◊ For the disposal of about 6 million tons of gravel and soil, framework contracts amounting to about € 90 mil-lion per year were concluded nationwide.
◊ The existing spare parts contracts for the maintenance of signal towers were extended through the end of 2017 (total volume: about € 75 million).
◊ In order to ensure supply reliability in the small-scale business of surveying engineers, a nationwide frame-work contract for “surveying services” with a call-off volume of about € 60 million was concluded with 21 sur-veying offices.
◊ A framework contract through 2018 was concluded for signal-guided line equipment with ETCS (L1LS) (total volume: about € 60 million).
◊ A framework contract for geotechnical services was concluded for the performance of short-term geotech-nical inquiries (total volume of about € 40 million).
◊ A framework contract for track planning services has been concluded for four years (total volume: about
€ 40 million). ◊ As part of the expansion and electrification of the Knap-
penrode – Horka – German/Polish border line, a contract of about € 37 million was awarded for the Section BA 2.3, Niesky – Horka.
◊ The start of construction of the Homburger Damm dou-ble-track line (structural engineering part 1, a contract volume of about € 15 million) marks the beginning of the larger “Rhine Main+” project with a volume of about
€ 12 billion. The project is one of the BIM pilot projects.
≈ Rolling stock and rolling stock spare parts
◊ As part of the long-distance transport offensive, a con-tract for the production of 25 IC 2 trains was awarded.
◊ A contract with a total value of about € 300 million for the production of a total of 39 electric multiple units for the network 4 “Rhine Valley” was awarded.
◊ Contracts to produce 26 electric multiple units for the lines RE 8 (Koblenz – Mönchengladbach) and RB 33 (Essen – Aachen/Heinsberg) with a value totaling about
€ 161 million were awarded. ◊ A contract with a value of about € 153 million for the
production of a total of 27 electric multiple units for the Nuremberg S-Bahn (metro) network was awarded.
◊ A contract with a value of about € 142 million for the production of a total of 25 electric multiple units for the E-network Saar RB was awarded.
≈ General requirements and services ◊ DB Group is shifting to Microsoftʼs cloud-based Office
365 solution. A contract with a volume of € 110 million has been concluded for a period of five years.
◊ A nationwide contract for maintenance services and spare parts was concluded for about 3,600 elevators and esca-lators. The contract term is a maximum of eight years with four suppliers (total volume of about € 59 million).
≈ Other topics
≈ Claims against truck cartelDB Group is reviewing claims against the truck cartel. From 1997 to 2011, the manufacturers DAF, Daimler, Iveco, MAN, Scania and Volvo/Renault formed a cartel and colluded on prices, among other things.
≈ WannaCry cyber attackAccording to Europol, at least 200,000 computer systems in 150 countries were victims of the global cyber attack WannaCry on May 12, 2017 – this included DB Group. At DB Group, the attack mainly affected ticket machines and display boards in stations. Train traffic and the security of customers and customer data were never at risk. Immedi-ately after the occurrence of WannaCry, a crisis committee was set up to correct the technical failures and prevent it from continuing to spread. The Cyber Security @ DB project aims to improve IT security and governance throughout DB Group.
Additional informationVarious tenders related to infrastructure projects
Vehicle orders due to new transport contracts
Cyber Security @ DB to improve IT security and governance
47
DEVELOPMENT OF BUSINESS UNITS / ADDITIONAL INFORMATION
Opportunity and risk reportNo material changes in opportunity and risk management
Additional bond issued
Risks for EBIT development in 2017 unchanged
“Smart City” partnership agreed with the city of Hamburg
Risk portfolio unchanged without any risks to DB Group as a going concern
DB Arriva wins transport contract
≈ Fourth bond issued in 2017
On July 11, 2017, we issued a privately placed bond through DB Finance with a total volume of SEK 530 million (about
€ 55 million) (maturity: 15 years; coupon of 2.2%) and swapped it to euros.
≈ Hamburg on its way to becoming a Smart City
On July 10, 2017, we signed an agreement with Hamburg on a “Smart City” partnership. The aim is to use new technol-ogies and innovative ideas (for example, on-demand shut-tles, smart lockers, cargo bikes and co-working spaces) to make public transport, stations and city logistics more con-venient and environmentally friendly for residents.
≈ Approval of Act on Collective Agreement Unity
On July 11, 2017, the German Federal Constitutional Court dismissed most of the complaints filed by several trade unions against the Act on Collective Agreement Unity. The act stipulates that, in the case of competing collective bargaining agreements in a company, only the agreement with the trade union with the most members is binding.
≈ Success in the Netherlands
In July 2017, DB Arriva won the open competition tender and will operate the regional rail services in Groningen and Friesland for another 15 years. The contract, which com-mences in December 2020, has a revenue volume of € 1.6 bil-lion and contains cross-border traffic to Lower Saxony.
Events after the balance sheet date
Our business activities are associated with risks as well as opportunities. Our business policy therefore aims to take advantage of opportunities through our opportunity man-agement system, while also actively managing those risks identified within the framework of our risk management system. There were no significant changes to DB Group’s RISK MANAGEMENT SYSTEM [2016 INTEGR ATED R EP ORT, PAGE 1 80 FF.] in the first half of 2017. Nor were there any significant changes to DB Group’s MAJOR OPPORTUNITIES AND RISK S [2016
INTEGR ATED R EP ORT, PAGE 1 8 2 FF.].The opportunities and risks analysis was performed
compared to the anticipated DEVELOPMENT OF DB GROUP IN FULL-YE AR 2017 [PAGE 50].
Compared to the estimate in the 2016 Integrated Re -port, the overall risk position is unchanged at € 0.1 billion. The remaining risks in the EBIT forecast are mostly in the
areas of economic climate, market and competition in the amount of € 0.1 billion (thereof very likely (vl): € 0.0 billion).
Compared to the estimate in the 2016 Integrated Report, the overall opportunity position is unchanged at € 0.1 bil-lion. Opportunities exist mostly in the areas of economic climate, market and competition, as well as production and technology in the amount of € 0.1 billion (thereof vl: € 0.0 billion).
Overall, this results in a balanced opportunity and risk profile for the 2017 financial year.
Our analyses of risks, countermeasures, hedging and pre- cautionary measures, together with the opinion of the Group Management Board based on the current risk assessment and our medium-term planning (MTP), indicate that there are no risks that, individually or jointly, could have an impact on the asset, financial and profit situation of DB Group and would pose a threat to the Group as a going concern.
!!!
48
Deutsche Bahn Group – Interim Report January – June 2017 INTERIM GROUP MANAGEMENT REPORT
≈ Future direction of DB Group
The future direction of DB Group is described in the 2016 INTEG R ATED R EP O RT [PAG E 1 9 0]. There were no significant changes to this in the first half of 2017.
≈ Positive development in the economic outlook
Anticipated development [%] 2016
2017 (Mar fore-
cast)
2017 (Jul fore-
cast)
GDP World +2.3 ~+2.5 ~+ 3.0World trade 1) +1.7 ~+ 3.0 ~+ 5.0GDP Eurozone +1.7 ~+1.5 ~+2.0GDP Germany +1.8 ~+1.5 ~+2.01) Trade in goods only.The data for 2016, adjusted for price and calendar effects, is based on the information and estimates available as of July 2017. Expectations for 2017 are rounded off to the nearest half percentage point.Source: Oxford Economics.
Forecasts for economic development in 2017 are based on the assumption of general stability in the geopolitical situ-ation. We have adjusted our forecasts for the economic development upward for the full-year 2017 based on the current good development compared to the 2016 Inte-grated Report. This applies in particular to world trade, even if growth is expected to weaken somewhat towards the end of the year.
The eurozone is also benefiting from increased export demand, especially from the emerging markets and Asia. In addition, the continued very low interest rates and low inflation are having a positive effect on demand. For these reasons, we assume that the upward trend will continue in the full-year 2017.
The growth of the German economy is expected to remain slightly above the eurozone average. This expecta-tion is due to an increase in new orders and a further improvement in consumer confidence.
≈ Positive expectations for relevant markets
≈ Passenger transport
Anticipated market development [%] 2016
2017 (Mar fore-
cast)
2017 (Jul fore-
cast)
German passenger transport market (based on pkm) +1.7 ~+1.0 +1.0
The data for 2016 are based on the information and estimates available as of July 2017. Expectations for 2017 are rounded off to the nearest half percentage point.
For the German passenger transport market, a moderate increase in transport performance is forecast for 2017, below the level of the previous year.
A continued increase in transport performance is also expected for the European passenger transport market. The positive general framework resulting from the con-tinued rise in employment figures and disposable income will remain in place, but the momentum is expected to weaken due to Brexit and rising fuel prices and inflation. Based on this, above-average growth is expected for rail passenger transport across Europe.
≈ Freight transport and logistics
Anticipated market development [%] 2016
2017 (Mar fore-
cast)
2017 (Jul fore-
cast)
German freight transport (based on tkm) ~+1.9 ~+1.5 ~+2.0European rail freight transport (based on tkm) ~+1.1 ~+1.0 > +1.0European land transport (based on revenues) +2.0 + 3.0 + 3.0Global air freight (based on t) +2.0 +2.0 + 5.0Global ocean freight (based on TEU) +1.3 +2.0 + 3.5Global contract logistics (based on revenues) + 4.2 + 4.0 + 4.0
The data for 2016 are based on the information and estimates available as of June 2017. Expectations for 2017 are rounded off to the nearest half percentage point.
The outlook for the German freight transport market has improved slightly:
◊ Given the continued high intensity of intermodal com-petition and the weaker boost from the steel industry assumed during the second half of the year and the negative effects of the closure/conversion of coal power plants, 2017 is expected to see only a moderate increase in performance for rail freight transport, which is some-what below previous expectations.
OutlookImproved expectations for economic development
Market development better than expected in freight transport and logistics
Outlook for key financial figures raised
49
OPPORTUNITY AND RISK REPORT / EVENTS AFTER THE BALANCE SHEET DATE / OUTLOOK
◊ After the strong rise in the first half of 2017, truck traffic will continue to record above-average development and to grow more dynamically than previously expected, given the positive economic conditions.
◊ Inland waterway transport is headed for a decline for the fourth year in a row and will not return to moderate growth, as assumed at the beginning of the year.
For the European rail freight transport market, the increase in volume sold in 2017 is expected to be slightly stronger than previously forecast. In particular, in the segments that are most relevant for rail transport, the partly considerably improved economic momentum is having a positive effect on the development of demand.
The positive development of demand in European land transport in the first half of 2017 is expected to continue unchanged in the second half of the year. Given the per-sistently positive volume development, a slight increase in the price level can be expected.
Due to the strong volume development so far and an expected positive volume development in the second half of the year, the air freight market is likely to develop sig-nificantly more positively than previously expected.
In the global ocean freight market, the expectations for the second half of the year have improved, and a much more positive volume development is expected for 2017 as a whole.
A very dynamic development is still expected for the contract logistics market.
≈ InfrastructureFor full-year 2017, we expect this to continue at the current level.
In terms of station stops, we expect a slight increase in the year-on-year comparison. The share of train stops oper-ated by non-Group railways will continue to increase.
Leasing income in stations will also show positive devel-opment and be slightly over the level of the previous year (+1.3%).
≈ Procurement marketsWe continue to expect no bottlenecks in procurement. Due to the oversupply in the oil market, no significant increase in the oil price is expected in the foreseeable future. In Germany, there will continue to be struggles over the design of the new electricity market (Electricity Market 2.0). Short-term price increases are likely to be amplified by the further expansion of renewable energies due to the limited ability to forecast them. Wholesale prices are being boosted by the dismantling of conventional capacities.
≈ Financial marketsThe stable development of the financial markets should continue in the second half of 2017. The expectations of the financial market players with regard to the prospects for the global economy have improved appreciably since the end of 2016. This trend is likely to continue through the end of the year. The improvement in the economic environment has resulted in a shift from investment capital to stock mar-kets. This development is likely to continue during the rest of the year. It is supported by higher inflation rates in large industrialized countries, which strengthen the relative attractiveness of the stock markets in comparison to other options, such as bond markets. For the above reasons, the rise in bond yields observed in the past few months is not expected to be a temporary development, but the conse-quence of a continuing normalization of the economic envi-ronment. At the same time, the demand for bonds with good credit ratings remains high by historical comparison. In particular, the ongoing geopolitical uncertainty is likely to counteract an excessive decline in prices in the bond sector later in the year.
≈ Development of DB Group
≈ Profitable quality leader
¿ Anticipated development of DB Group 2016
2017 (Mar fore-
cast)
2017 (Jul fore-
cast)
Volume sold rail passenger transport (Germany) (million pkm) 80,219 ~+1.5 % ~+2.0 %Volume sold rail freight transport (million tkm) 94,698 ~– 0.6 % ~+ 0.0 %Train kilometers on track infrastructure (million train-path km) 1,068 ~– 0.7 % ~+ 0.5 %Shipments in European land transport (thousand) 99,638 + 5–6 % ~+1.0 %Air freight volume (export) (thousand t) 1,179 ~+ 3.0 % ~+ 3.0 %Ocean freight volume (export) (thousand TEU) 2,006 ~+2.0 % ~+ 3.0 %
Customer satisfaction – passengers (SI) 76.0 ~77 ~77Punctuality DB Group (rail) in Germany (%) 94.3 ~95.0 ~95.0 thereof punctuality DB Long Distance (%) 78.9 81 81
Revenues (€ billion) 40.6 > 41.5 > 42.5EBIT adjusted (€ billion) 1.9 ≥ 2.1 ≥ 2.2ROCE (%) 5.9 ≥ 6.0 > 6.0Redemption coverage (%) 18.1 ≥ 18.5 > 18.5
On the basis of the developments to date and the current estimates for the second half of 2017, we have made adjust-ments to our expectations:
◊ We now expect volume sold in rail freight transport to be somewhat more positive.
◊ Based on the development in the first half, the train kilo- meters in track infrastructure should increase for full-year 2017 as well.
50
Deutsche Bahn Group – Interim Report January – June 2017 INTERIM GROUP MANAGEMENT REPORT
◊ The increase in European land transport shipment volume is likely to be weaker due to the development of the parcel business.
◊ In ocean freight, we now expect the development to be somewhat stronger in full-year 2017 as well.
◊ Revenues and operating profits should develop better than previously expected due to the strong develop-ment in the first half.
◊ The more positive development should also have an impact on the ROCE and the redemption coverage.
Business units
Æ Anticipated development [€ million]
Revenues adjusted EBIT adjusted
2016
2017 (Mar fore-
cast)
2017 (Jul
fore- cast) 2016
2017 (Mar fore-
cast)
2017 (Jul
fore- cast)
DB Long-Distance 4,159 q q 173 q q
DB Regional 8,653 e e 636 q w
DB Cargo 4,560 e e – 81 q q
DB Netze Track 5,228 q q 561 q q
DB Netze Stations 1,233 q q 221 q e
DB Netze Energy 2,779 w w 126 w w
DB Arriva 5,093 q q 280 q q
DB Schenker 15,128 q q 410 q q
q above previous year’s figure e at previous yearʼs level w below previous yearʼs figure
At the business unit level, our expectations are virtually unchanged. Based on the development in the first half of 2017, we now expect the development of operating profit at DB Regional and DB Netze Stations to be weaker than it has been thus far.
Anticipated capital expenditures
Æ Anticipated development [€ billion] 2016
2017 (Mar fore-
cast)
2017 (Jul fore-
cast)
Gross capital expenditures 9.5 ≥ 10.5 > 10.5Net capital expenditures 3.3 ≥ 3.5 ~4.0
We will continue our modernization course in the 2017 financial year with a high level of capital expenditures. In any case, based on the current estimates, we expect capital expenditures to be somewhat higher than forecast at the beginning of 2017.
Anticipated financial position
Æ Anticipated development [€ billion] 2016
2017 (Mar fore-
cast)
2017 (Jul fore-
cast)
Maturities 2.3 2.1 2.1Bond issues 2.1 < 2.0 < 2.0Cash and cash equivalents as of Dec 31 4.5 ~3.5 ~3.5Net financial debt as of Dec 31 17.6 < 19.0 < 19.0
Our expectations regarding the financial position for full-year 2017 are unchanged from the forecast in the 2016 Inte-grated Report.
≈ Top employer
† Anticipated development 2016
2017 (Mar fore-
cast)
2017 (Jul fore-
cast)
Employee satisfaction (SI) 3.7 – –Employer attractiveness (rank in Germany) 16 ≤ 16 ≤ 16
On the basis of the developments to date in the 2017 finan-cial year and the current estimates for the second half of 2017, we have made no adjustments to our expectations for the SOCIAL † dimension.
≈ Eco-pioneer
¥ Anticipated development 2016
2017 (Mar fore-
cast)
2017 (Jul fore-
cast)
Specific CO₂e emissions (carriers) compared to 2006 (%) –27.5 –28 –28Share of renewable energies in the DB traction current mix (%) 42 44 44Track kilometers noise remediated in total (rounded) as of Dec 31 (km) 1,600 1) 1,700 1,700Quiet freight cars in Germany as of Dec 31 32,396 ~39,000 ~39,000
1) Preliminary figure.
On the basis of the developments to date in the 2017 finan-cial year and the current estimates for the second half of 2017, we have made no adjustments to our expectations for the ENVIRONMENTAL ¥ dimension.
FORWAR D - LO OKING STATEMENT S
This management report contains statements and forecasts pertaining to the future development of DB Group, its business units and individual companies. These forecasts are estimates made based on information that was available at the current time. Actual developments and profits may diverge from the current expectations as a result of the non-materialization of the assumptions upon which our forecasts are based or the materialization of risks such as those presented in the Risk report. DB Group does not assume any obligation to update the statements made within this management report.
51
OUTLOOK

Consolidated interim financial statements (unaudited)
Consolidated statement of income
Æ [€ million]
H 1
20162017 2016Revenues 21,066 20,033 40,557Inventory changes and internally produced and capitalized assets 1,376 1,254 2,741Overall performance 22,442 21,287 43,298Other operating income 1,239 1,108 2,834Cost of materials –10,411 – 9,564 –20,101Personnel expenses – 8,227 –7,789 –15,876Depreciation and impairments –1,405 –1,457 –3,017Other operating expenses –2,562 –2,632 – 5,677Operating profit (EBIT) 1,076 953 1,461Result from investments accounted for using the equity method 14 17 33Net interest income –343 –396 –772Other financial result –14 –11 –16Financial result –343 –390 –755Profit before taxes on income 733 563 706Taxes on income 46 40 10Net profit (after taxes) 779 603 716
Net profit attributable to Shareholder of Deutsche Bahn AG 766 591 695 Minority interests 13 12 21
Earnings per share (€ per share) undiluted 1.78 1.37 1.62 diluted 1.78 1.37 1.62
≈ Reconciliation of consolidated comprehensive income
Æ [€ million]
H 1
20162017 2016Net profit (after taxes) 779 603 716
Changes due to the revaluation of defined benefit plans 670 –1,323 – 822Changes in profit items recognized directly in equity which are not reclassified to the income statement 670 –1,323 – 822 Changes resulting from currency translation – 93 – 64 – 52 Changes resulting from market valuation of securities –1 3 –1 Changes resulting from market valuation of cash flow hedges –32 188 262 Share of profit items not recognized in the income statement due to investments accounted for using the equity method – – 0Changes in profit items recognized directly in equity which are reclassified to the income statement –126 127 209Balance of profit items covered directly in equity (before taxes) 544 –1,196 – 613 Revaluation of defined benefit plans –17 101 108Changes in deferred taxes on profit items recognized directly in equity, which are not reclassified to the income statement –17 101 108 Deferred taxes relating to the change in the market valuation of securities – – 1 Deferred taxes relating to the change in the market valuation of cash flow hedges 9 –22 –34Changes in deferred taxes on profit items recognized directly in equity, which are reclassified to the income statement 9 –22 –33Balance of profit items recognized directly in equity (after taxes) 536 –1,117 – 538Comprehensive income 1,315 – 514 178Comprehensive income attributable to Shareholder of Deutsche Bahn AG 1,305 – 524 159 Minority interests 10 10 19
52
Deutsche Bahn Group – Interim Report January – June 2017 CONSOLIDATED INTERIM FINANCIAL STATEMENTS
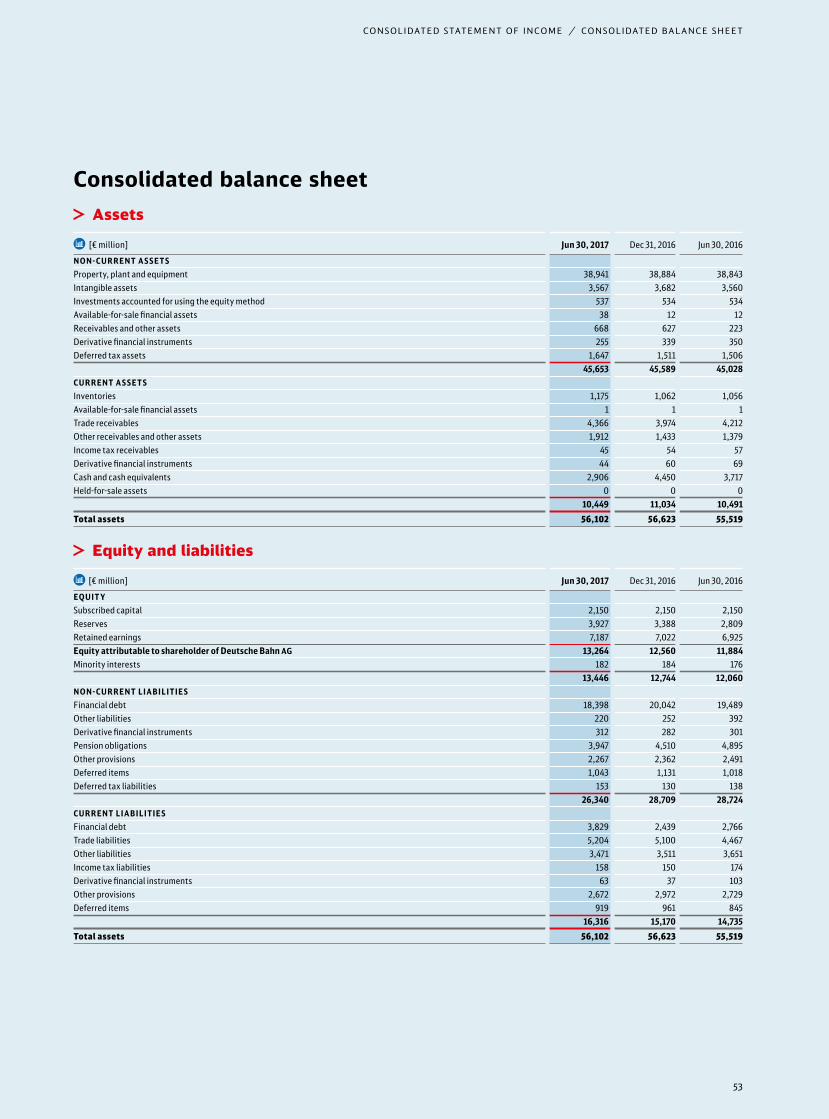
Consolidated balance sheet ≈ Assets
Æ [€ million] Jun 30, 2017 Dec 31, 2016 Jun 30, 2016NON - CUR R ENT A S SET SProperty, plant and equipment 38,941 38,884 38,843Intangible assets 3,567 3,682 3,560Investments accounted for using the equity method 537 534 534Available-for-sale financial assets 38 12 12Receivables and other assets 668 627 223Derivative financial instruments 255 339 350Deferred tax assets 1,647 1,511 1,506
45,653 45,589 45,028CUR R ENT A S SET SInventories 1,175 1,062 1,056Available-for-sale financial assets 1 1 1Trade receivables 4,366 3,974 4,212Other receivables and other assets 1,912 1,433 1,379Income tax receivables 45 54 57Derivative financial instruments 44 60 69Cash and cash equivalents 2,906 4,450 3,717Held-for-sale assets 0 0 0
10,449 11,034 10,491Total assets 56,102 56,623 55,519
≈ Equity and liabilitiesÆ [€ million] Jun 30, 2017 Dec 31, 2016 Jun 30, 2016EQ UIT YSubscribed capital 2,150 2,150 2,150Reserves 3,927 3,388 2,809Retained earnings 7,187 7,022 6,925Equity attributable to shareholder of Deutsche Bahn AG 13,264 12,560 11,884Minority interests 182 184 176
13,446 12,744 12,060NON - CUR R ENT LIABILITIE SFinancial debt 18,398 20,042 19,489Other liabilities 220 252 392Derivative financial instruments 312 282 301Pension obligations 3,947 4,510 4,895Other provisions 2,267 2,362 2,491Deferred items 1,043 1,131 1,018Deferred tax liabilities 153 130 138
26,340 28,709 28,724CUR R ENT LIABILITIE SFinancial debt 3,829 2,439 2,766Trade liabilities 5,204 5,100 4,467Other liabilities 3,471 3,511 3,651Income tax liabilities 158 150 174Derivative financial instruments 63 37 103Other provisions 2,672 2,972 2,729Deferred items 919 961 845
16,316 15,170 14,735Total assets 56,102 56,623 55,519
53
CONSOLIDATED STATEMENT OF INCOME / CONSOLIDATED BALANCE SHEET

Æ [€ million]
H 1
20162017 2016Profit before taxes on income 733 563 706Depreciation on property, plant and equipment and intangible assets 1,405 1,457 3,017Write-ups/write-downs on non-current financial assets – 0 2Result on disposal of property, plant and equipment and intangible assets –38 –30 – 89Result on disposal of financial assets 0 0 5Interest and dividend income – 41 –23 – 42Interest expense 384 420 813Foreign currency result 9 1 – 6Result of investments accounted for using the equity method –14 –17 –33Other non-cash expenses and income 512 275 1,252Changes in inventories, receivables and other assets – 967 – 696 – 900Changes in liabilities, provisions and deferred items – 861 – 40 –333Cash generated from operating activities 1,122 1,910 4,392Interest received 28 13 25Received/paid (–) dividends and capital distribution 0 0 – 8Interest paid –324 –321 – 594Paid (–)/reimbursed (+) taxes on income – 64 –79 –167Cash flow from operating activities 762 1,523 3,648
Proceeds from the disposal of property, plant and equipment and intangible assets 120 107 355Payments for capital expenditures in property, plant and equipment and intangible assets – 4,149 –3,507 – 9,115Proceeds from investment grants 2,618 2,126 6,190Payments for repaid investment grants – 56 –27 – 53Proceeds from sale of financial assets 0 0 0Payments for investments in financial assets –25 0 0Proceeds from sale of shares in consolidated companies less net cash and cash equivalents sold 2 0 0Payments for acquisition of shares in consolidated companies less net cash and cash equivalents acquired as well as payments for party of companies –7 – 9 – 42Proceeds from disposal of investments accounted for using the equity method 1 0 0Payments for additions of investments accounted for using the equity method 0 0 0Cash flow from investing activities –1,496 –1,310 –2,665
Distribution of profits to shareholder – 600 – 850 – 850Distribution of profits to minority interests –10 –11 –13Payments for finance lease transactions –34 – 68 –201Proceeds from issue of bonds 576 494 2,117Payments for redemption of bonds – 500 – 500 –1,542Payments for the redemption and repayment of interest-free loans –206 –220 –220Proceeds from borrowings and commercial paper 16 159 90Payments for the redemption of borrowings and commercial paper –15 –3 – 410Cash flow from financing activities –773 – 999 –1,029
Net changes in cash and cash equivalents –1,507 –786 – 46Cash and cash equivalents as of Jan 1 4,450 4,549 4,549Changes in cash and cash equivalents due to changes in exchange rates –37 – 46 – 53Cash and cash equivalents as of Jun 30/ Dec 31 2,906 3,717 4,450
54
Deutsche Bahn Group – Interim Report January – June 2017 CONSOLIDATED INTERIM FINANCIAL STATEMENTS
Consolidated statement of cash flows
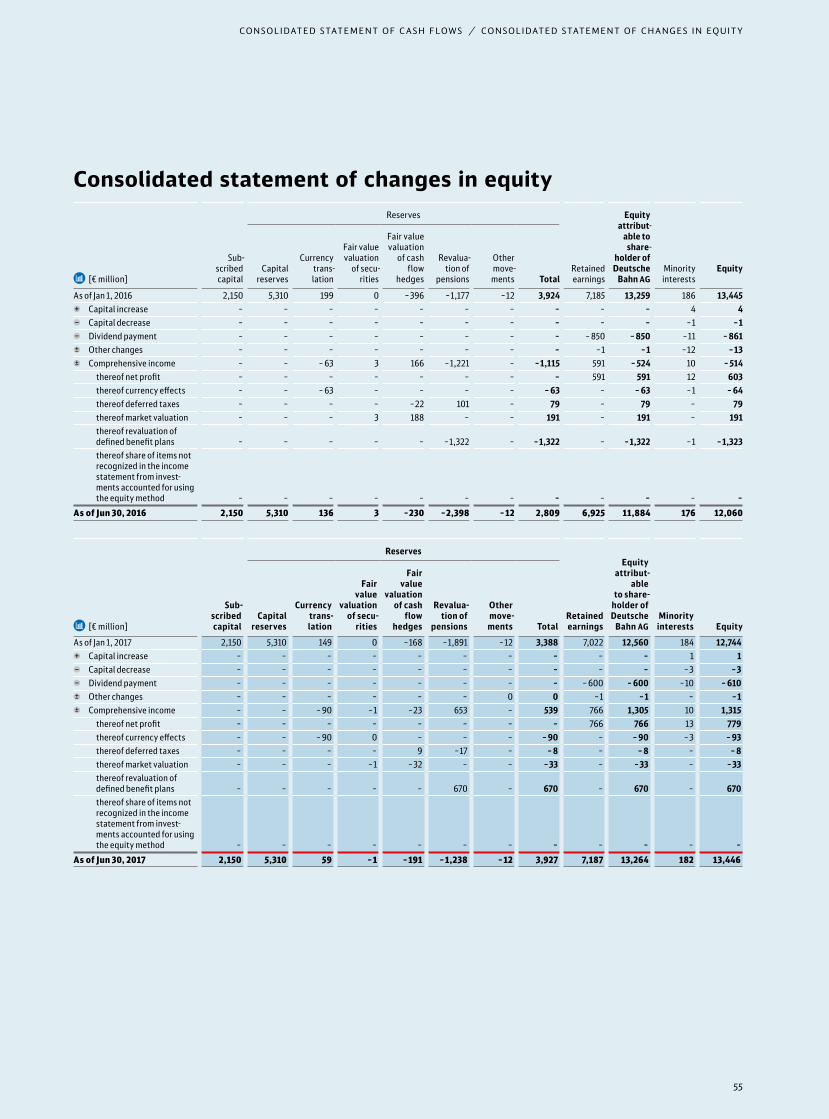
Æ [€ million]
Sub- scribedcapital
Reserves
Retainedearnings
Equityattribut-
able to share-
holder ofDeutsche
Bahn AGMinorityinterests
EquityCapital
reserves
Currencytrans- lation
Fair valuevaluation
of secu- rities
Fair valuevaluation
of cashflow
hedges
Revalua- tion of
pensions
Othermove-
ments Total
As of Jan 1, 2016 2,150 5,310 199 0 –396 –1,177 –12 3,924 7,185 13,259 186 13,445 Capital increase – – – – – – – – – – 4 4 Capital decrease – – – – – – – – – – –1 –1 Dividend payment – – – – – – – – – 850 – 850 –11 – 861 Other changes – – – – – – – – –1 –1 –12 –13 Comprehensive income – – – 63 3 166 –1,221 – –1,115 591 – 524 10 – 514
thereof net profit – – – – – – – – 591 591 12 603 thereof currency effects – – – 63 – – – – – 63 – – 63 –1 – 64 thereof deferred taxes – – – – –22 101 – 79 – 79 – 79 thereof market valuation – – – 3 188 – – 191 – 191 – 191 thereof revaluation of
defined benefit plans – – – – – –1,322 – –1,322 – –1,322 –1 –1,323 thereof share of items not
recognized in the income statement from invest-ments accounted for using the equity method – – – – – – – – – – – –
As of Jun 30, 2016 2,150 5,310 136 3 –230 –2,398 –12 2,809 6,925 11,884 176 12,060
Æ [€ million]
Sub- scribedcapital
Reserves
Retainedearnings
Equityattribut-
ableto share-
holder ofDeutsche
Bahn AGMinority
interests
EquityCapital
reserves
Currencytrans- lation
Fair value
valuationof secu-
rities
Fair value
valuationof cash
flowhedges
Revalua- tion of
pensions
Othermove-
ments TotalAs of Jan 1, 2017 2,150 5,310 149 0 –168 –1,891 –12 3,388 7,022 12,560 184 12,744
Capital increase – – – – – – – – – – 1 1 Capital decrease – – – – – – – – – – –3 –3 Dividend payment – – – – – – – – – 600 – 600 –10 – 610 Other changes – – – – – – 0 0 –1 –1 – –1 Comprehensive income – – – 90 –1 –23 653 – 539 766 1,305 10 1,315
thereof net profit – – – – – – – – 766 766 13 779 thereof currency effects – – – 90 0 – – – – 90 – – 90 –3 – 93 thereof deferred taxes – – – – 9 –17 – – 8 – – 8 – – 8 thereof market valuation – – – –1 –32 – – –33 – –33 – –33 thereof revaluation of
defined benefit plans – – – – – 670 – 670 – 670 – 670 thereof share of items not
recognized in the income statement from invest-ments accounted for using the equity method – – – – – – – – – – – –
As of Jun 30, 2017 2,150 5,310 59 –1 –191 –1,238 –12 3,927 7,187 13,264 182 13,446
55
CONSOLIDATED STATEMENT OF CASH FLOWS / CONSOLIDATED STATEMENT OF CHANGES IN EQUITY
Consolidated statement of changes in equity
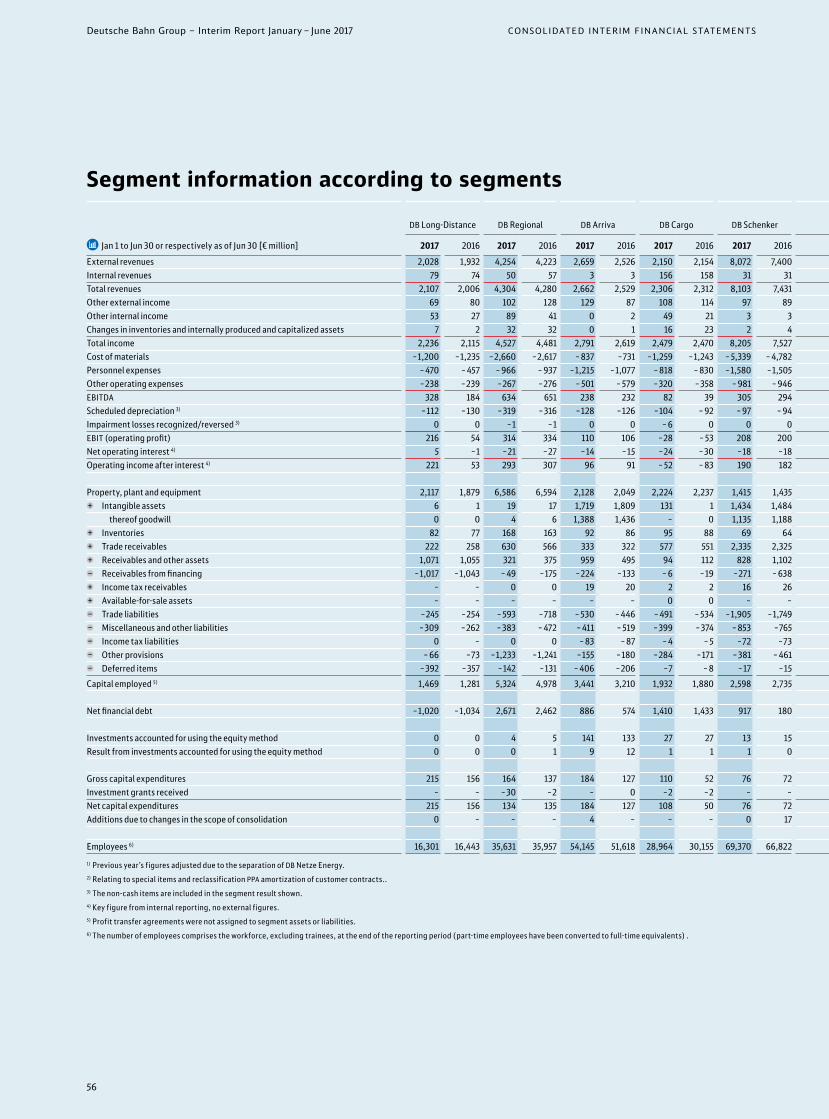
Segment information according to segments
Æ Jan 1 to Jun 30 or respectively as of Jun 30 [€ million]
DB Long-Distance
DB Regional
DB Arriva DB Cargo DB Schenker
DB Netze Track
DB Netze Stations
DB Netze Energy
Subsidiaries/Other 1)
Sum of segments Consolidation
DB Group adjusted
Reconciliation 2) DB Group
2017 2016 2017 2016 2017 2016 2017 2016 2017 2016 2017 2016 2017 2016 2017 2016 2017 2016 2017 2016 2017 2016 2017 2016 2017 2016 2017 2016External revenues 2,028 1,932 4,254 4,223 2,659 2,526 2,150 2,154 8,072 7,400 746 694 273 267 654 591 234 246 21,070 20,033 – – 21,070 20,033 – 4 0 21,066 20,033Internal revenues 79 74 50 57 3 3 156 158 31 31 1,906 1,907 362 356 762 800 1,920 1,812 5,269 5,198 – 5,269 – 5,198 – – – – – –Total revenues 2,107 2,006 4,304 4,280 2,662 2,529 2,306 2,312 8,103 7,431 2,652 2,601 635 623 1,416 1,391 2,154 2,058 26,339 25,231 – 5,269 – 5,198 21,070 20,033 – 4 – 21,066 20,033Other external income 69 80 102 128 129 87 108 114 97 89 323 325 62 50 107 9 235 225 1,232 1,107 – – 1,232 1,107 7 1 1,239 1,108Other internal income 53 27 89 41 0 2 49 21 3 3 107 91 9 8 – 88 14 492 528 714 735 –714 –735 – – – – – –Changes in inventories and internally produced and capitalized assets 7 2 32 32 0 1 16 23 2 4 415 388 19 17 9 9 433 394 933 870 443 384 1,376 1,254 – – 1,376 1,254Total income 2,236 2,115 4,527 4,481 2,791 2,619 2,479 2,470 8,205 7,527 3,497 3,405 725 698 1,444 1,423 3,314 3,205 29,218 27,943 – 5,540 – 5,549 23,678 22,394 3 1 23,681 22,395Cost of materials –1,200 –1,235 –2,660 –2,617 – 837 –731 –1,259 –1,243 – 5,339 – 4,782 – 834 – 812 –257 –239 –1,235 –1,196 –1,266 –1,210 –14,887 –14,065 4,491 4,505 –10,396 – 9,560 –15 – 4 –10,411 – 9,564Personnel expenses – 470 – 457 – 966 – 937 –1,215 –1,077 – 818 – 830 –1,580 –1,505 –1,358 –1,275 –154 –139 – 60 – 58 –1,528 –1,507 – 8,149 –7,785 1 –3 – 8,148 –7,788 –79 –1 – 8,227 –7,789Other operating expenses –238 –239 –267 –276 – 501 – 579 –320 –358 – 981 – 946 – 490 – 480 – 97 – 93 –70 –71 – 633 – 640 –3,597 –3,682 1,037 1,051 –2,560 –2,631 –2 –1 –2,562 –2,632EBITDA 328 184 634 651 238 232 82 39 305 294 815 838 217 227 79 98 –113 –152 2,585 2,411 –11 4 2,574 2,415 – 93 – 5 2,481 2,410Scheduled depreciation 3) –112 –130 –319 –316 –128 –126 –104 – 92 – 97 – 94 – 426 – 444 – 67 – 68 –35 –35 –122 –129 –1,410 –1,434 22 23 –1,388 –1,411 –38 – 49 –1,426 –1,460Impairment losses recognized/reversed 3) 0 0 –1 –1 0 0 – 6 0 0 0 0 4 0 0 0 0 0 0 –7 3 – – –7 3 28 – 21 3EBIT (operating profit) 216 54 314 334 110 106 –28 – 53 208 200 389 398 150 159 44 63 –235 –281 1,168 980 11 27 1,179 1,007 –103 – 54 1,076 953Net operating interest 4) 5 –1 –21 –27 –14 –15 –24 –30 –18 –18 –139 –127 –20 –19 –7 – 8 – 94 –128 –332 –373 – – –332 –373 – – – –Operating income after interest 4) 221 53 293 307 96 91 – 52 – 83 190 182 250 271 130 140 37 55 –329 – 409 836 607 11 27 847 634 – – – –
Property, plant and equipment 2,117 1,879 6,586 6,594 2,128 2,049 2,224 2,237 1,415 1,435 19,837 20,132 3,201 3,210 972 1,002 1,150 982 39,630 39,520 – 689 – 677 38,941 38,843 – – 38,941 38,843 Intangible assets 6 1 19 17 1,719 1,809 131 1 1,434 1,484 133 134 8 4 35 55 69 55 3,554 3,560 13 – 3,567 3,560 – – 3,567 3,560
thereof goodwill 0 0 4 6 1,388 1,436 – 0 1,135 1,188 – 0 0 0 – 0 14 13 2,541 2,643 22 – 2,563 2,643 – – 2,563 2,643 Inventories 82 77 168 163 92 86 95 88 69 64 176 161 0 – 39 18 488 417 1,209 1,074 –34 –18 1,175 1,056 – – 1,175 1,056 Trade receivables 222 258 630 566 333 322 577 551 2,335 2,325 321 316 50 26 158 293 636 674 5,262 5,331 – 896 –1,119 4,366 4,212 – – 4,366 4,212 Receivables and other assets 1,071 1,055 321 375 959 495 94 112 828 1,102 183 52 13 13 26 98 19,516 17,613 23,011 20,915 –20,431 –19,313 2,580 1,602 – – 2,580 1,602 Receivables from financing –1,017 –1,043 – 49 –175 –224 –133 – 6 –19 –271 – 638 –1 –2 0 – 160 – 52 –18,797 –16,968 –20,205 –19,030 20,066 18,929 –139 –101 – – –139 –101 Income tax receivables – – 0 0 19 20 2 2 16 26 0 0 – – 0 – 8 9 45 57 – – 45 57 – – 45 57 Available-for-sale assets – – – – – – 0 0 – – – – – – – – – – 0 0 – – 0 0 – – 0 0 Trade liabilities –245 –254 – 593 –718 – 530 – 446 – 491 – 534 –1,905 –1,749 –1,084 – 663 – 98 – 98 –286 –284 – 857 – 831 – 6,089 – 5,577 885 1,110 – 5,204 – 4,467 – – – 5,204 – 4,467 Miscellaneous and other liabilities –309 –262 –383 – 472 – 411 – 519 –399 –374 – 853 –765 – 694 – 997 –122 –129 – 88 –131 – 804 –786 – 4,063 – 4,435 372 392 –3,691 – 4,043 – – –3,691 – 4,043 Income tax liabilities 0 – 0 0 – 83 – 87 – 4 – 5 –72 –73 – – –1 –1 – – –18 –36 –178 –202 20 28 –158 –174 – – –158 –174 Other provisions – 66 –73 –1,233 –1,241 –155 –180 –284 –171 –381 – 461 –356 –366 – 55 – 53 – 66 –17 –2,322 –2,614 – 4,918 – 5,176 –21 – 44 – 4,939 – 5,220 – – – 4,939 – 5,220 Deferred items –392 –357 –142 –131 – 406 –206 –7 – 8 –17 –15 –735 – 878 –137 –143 –3 – 4 –124 –122 –1,963 –1,864 1 1 –1,962 –1,863 – – –1,962 –1,863
Capital employed 5) 1,469 1,281 5,324 4,978 3,441 3,210 1,932 1,880 2,598 2,735 17,780 17,889 2,859 2,829 947 978 –1,055 –1,607 35,295 34,173 –714 –711 34,581 33,462 – – 34,581 33,462
Net financial debt –1,020 –1,034 2,671 2,462 886 574 1,410 1,433 917 180 10,092 10,224 1,215 1,175 445 254 2,414 2,891 19,030 18,159 – – 19,030 18,159 – – 19,030 18,159
Investments accounted for using the equity method 0 0 4 5 141 133 27 27 13 15 1 1 – – 0 – 351 353 537 534 – – 537 534 – – 537 534Result from investments accounted for using the equity method 0 0 0 1 9 12 1 1 1 0 0 0 – – – – 3 3 14 17 – – 14 17 – – 14 17
Gross capital expenditures 215 156 164 137 184 127 110 52 76 72 2,907 2,495 253 182 48 49 139 169 4,096 3,439 12 33 4,108 3,472 – – 4,108 3,472Investment grants received – – –30 –2 – 0 –2 –2 – – –2,382 –1,980 –173 –113 –31 –29 0 0 –2,618 –2,126 – – –2,618 –2,126 – – –2,618 –2,126Net capital expenditures 215 156 134 135 184 127 108 50 76 72 525 515 80 69 17 20 139 169 1,478 1,313 12 33 1,490 1,346 – – 1,490 1,346Additions due to changes in the scope of consolidation 0 – – – 4 – – – 0 17 – – – – – – – – 4 17 – – 4 17 – – 4 17
Employees 6) 16,301 16,443 35,631 35,957 54,145 51,618 28,964 30,155 69,370 66,822 44,717 43,948 5,404 5,007 1,742 1,756 51,291 50,986 307,565 302,692 – – 307,565 302,692 – – 307,565 302,6921) Previous year’s figures adjusted due to the separation of DB Netze Energy.2) Relating to special items and reclassification PPA amortization of customer contracts..3) The non-cash items are included in the segment result shown.4) Key figure from internal reporting, no external figures.5) Profit transfer agreements were not assigned to segment assets or liabilities.6) The number of employees comprises the workforce, excluding trainees, at the end of the reporting period (part-time employees have been converted to full-time equivalents) .
56
Deutsche Bahn Group – Interim Report January – June 2017 CONSOLIDATED INTERIM FINANCIAL STATEMENTS
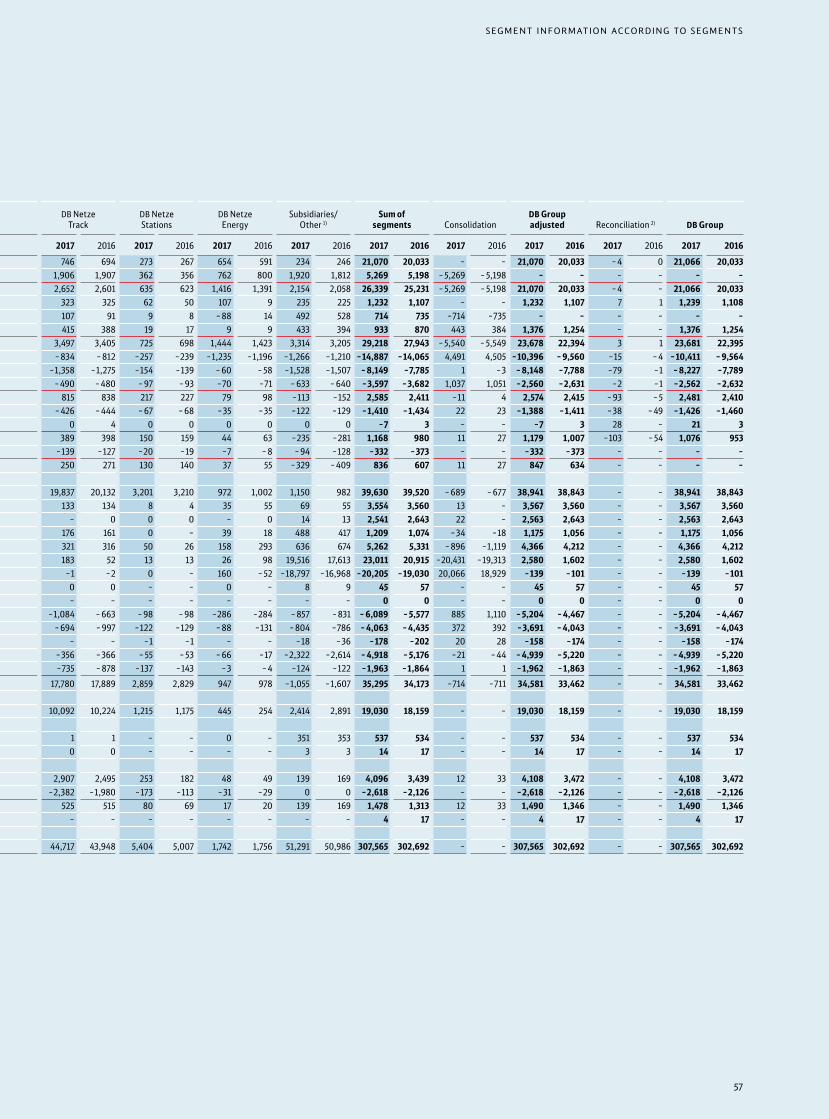
Segment information according to segments
Æ Jan 1 to Jun 30 or respectively as of Jun 30 [€ million]
DB Long-Distance
DB Regional
DB Arriva DB Cargo DB Schenker
DB Netze Track
DB Netze Stations
DB Netze Energy
Subsidiaries/Other 1)
Sum of segments Consolidation
DB Group adjusted
Reconciliation 2) DB Group
2017 2016 2017 2016 2017 2016 2017 2016 2017 2016 2017 2016 2017 2016 2017 2016 2017 2016 2017 2016 2017 2016 2017 2016 2017 2016 2017 2016External revenues 2,028 1,932 4,254 4,223 2,659 2,526 2,150 2,154 8,072 7,400 746 694 273 267 654 591 234 246 21,070 20,033 – – 21,070 20,033 – 4 0 21,066 20,033Internal revenues 79 74 50 57 3 3 156 158 31 31 1,906 1,907 362 356 762 800 1,920 1,812 5,269 5,198 – 5,269 – 5,198 – – – – – –Total revenues 2,107 2,006 4,304 4,280 2,662 2,529 2,306 2,312 8,103 7,431 2,652 2,601 635 623 1,416 1,391 2,154 2,058 26,339 25,231 – 5,269 – 5,198 21,070 20,033 – 4 – 21,066 20,033Other external income 69 80 102 128 129 87 108 114 97 89 323 325 62 50 107 9 235 225 1,232 1,107 – – 1,232 1,107 7 1 1,239 1,108Other internal income 53 27 89 41 0 2 49 21 3 3 107 91 9 8 – 88 14 492 528 714 735 –714 –735 – – – – – –Changes in inventories and internally produced and capitalized assets 7 2 32 32 0 1 16 23 2 4 415 388 19 17 9 9 433 394 933 870 443 384 1,376 1,254 – – 1,376 1,254Total income 2,236 2,115 4,527 4,481 2,791 2,619 2,479 2,470 8,205 7,527 3,497 3,405 725 698 1,444 1,423 3,314 3,205 29,218 27,943 – 5,540 – 5,549 23,678 22,394 3 1 23,681 22,395Cost of materials –1,200 –1,235 –2,660 –2,617 – 837 –731 –1,259 –1,243 – 5,339 – 4,782 – 834 – 812 –257 –239 –1,235 –1,196 –1,266 –1,210 –14,887 –14,065 4,491 4,505 –10,396 – 9,560 –15 – 4 –10,411 – 9,564Personnel expenses – 470 – 457 – 966 – 937 –1,215 –1,077 – 818 – 830 –1,580 –1,505 –1,358 –1,275 –154 –139 – 60 – 58 –1,528 –1,507 – 8,149 –7,785 1 –3 – 8,148 –7,788 –79 –1 – 8,227 –7,789Other operating expenses –238 –239 –267 –276 – 501 – 579 –320 –358 – 981 – 946 – 490 – 480 – 97 – 93 –70 –71 – 633 – 640 –3,597 –3,682 1,037 1,051 –2,560 –2,631 –2 –1 –2,562 –2,632EBITDA 328 184 634 651 238 232 82 39 305 294 815 838 217 227 79 98 –113 –152 2,585 2,411 –11 4 2,574 2,415 – 93 – 5 2,481 2,410Scheduled depreciation 3) –112 –130 –319 –316 –128 –126 –104 – 92 – 97 – 94 – 426 – 444 – 67 – 68 –35 –35 –122 –129 –1,410 –1,434 22 23 –1,388 –1,411 –38 – 49 –1,426 –1,460Impairment losses recognized/reversed 3) 0 0 –1 –1 0 0 – 6 0 0 0 0 4 0 0 0 0 0 0 –7 3 – – –7 3 28 – 21 3EBIT (operating profit) 216 54 314 334 110 106 –28 – 53 208 200 389 398 150 159 44 63 –235 –281 1,168 980 11 27 1,179 1,007 –103 – 54 1,076 953Net operating interest 4) 5 –1 –21 –27 –14 –15 –24 –30 –18 –18 –139 –127 –20 –19 –7 – 8 – 94 –128 –332 –373 – – –332 –373 – – – –Operating income after interest 4) 221 53 293 307 96 91 – 52 – 83 190 182 250 271 130 140 37 55 –329 – 409 836 607 11 27 847 634 – – – –
Property, plant and equipment 2,117 1,879 6,586 6,594 2,128 2,049 2,224 2,237 1,415 1,435 19,837 20,132 3,201 3,210 972 1,002 1,150 982 39,630 39,520 – 689 – 677 38,941 38,843 – – 38,941 38,843 Intangible assets 6 1 19 17 1,719 1,809 131 1 1,434 1,484 133 134 8 4 35 55 69 55 3,554 3,560 13 – 3,567 3,560 – – 3,567 3,560
thereof goodwill 0 0 4 6 1,388 1,436 – 0 1,135 1,188 – 0 0 0 – 0 14 13 2,541 2,643 22 – 2,563 2,643 – – 2,563 2,643 Inventories 82 77 168 163 92 86 95 88 69 64 176 161 0 – 39 18 488 417 1,209 1,074 –34 –18 1,175 1,056 – – 1,175 1,056 Trade receivables 222 258 630 566 333 322 577 551 2,335 2,325 321 316 50 26 158 293 636 674 5,262 5,331 – 896 –1,119 4,366 4,212 – – 4,366 4,212 Receivables and other assets 1,071 1,055 321 375 959 495 94 112 828 1,102 183 52 13 13 26 98 19,516 17,613 23,011 20,915 –20,431 –19,313 2,580 1,602 – – 2,580 1,602 Receivables from financing –1,017 –1,043 – 49 –175 –224 –133 – 6 –19 –271 – 638 –1 –2 0 – 160 – 52 –18,797 –16,968 –20,205 –19,030 20,066 18,929 –139 –101 – – –139 –101 Income tax receivables – – 0 0 19 20 2 2 16 26 0 0 – – 0 – 8 9 45 57 – – 45 57 – – 45 57 Available-for-sale assets – – – – – – 0 0 – – – – – – – – – – 0 0 – – 0 0 – – 0 0 Trade liabilities –245 –254 – 593 –718 – 530 – 446 – 491 – 534 –1,905 –1,749 –1,084 – 663 – 98 – 98 –286 –284 – 857 – 831 – 6,089 – 5,577 885 1,110 – 5,204 – 4,467 – – – 5,204 – 4,467 Miscellaneous and other liabilities –309 –262 –383 – 472 – 411 – 519 –399 –374 – 853 –765 – 694 – 997 –122 –129 – 88 –131 – 804 –786 – 4,063 – 4,435 372 392 –3,691 – 4,043 – – –3,691 – 4,043 Income tax liabilities 0 – 0 0 – 83 – 87 – 4 – 5 –72 –73 – – –1 –1 – – –18 –36 –178 –202 20 28 –158 –174 – – –158 –174 Other provisions – 66 –73 –1,233 –1,241 –155 –180 –284 –171 –381 – 461 –356 –366 – 55 – 53 – 66 –17 –2,322 –2,614 – 4,918 – 5,176 –21 – 44 – 4,939 – 5,220 – – – 4,939 – 5,220 Deferred items –392 –357 –142 –131 – 406 –206 –7 – 8 –17 –15 –735 – 878 –137 –143 –3 – 4 –124 –122 –1,963 –1,864 1 1 –1,962 –1,863 – – –1,962 –1,863
Capital employed 5) 1,469 1,281 5,324 4,978 3,441 3,210 1,932 1,880 2,598 2,735 17,780 17,889 2,859 2,829 947 978 –1,055 –1,607 35,295 34,173 –714 –711 34,581 33,462 – – 34,581 33,462
Net financial debt –1,020 –1,034 2,671 2,462 886 574 1,410 1,433 917 180 10,092 10,224 1,215 1,175 445 254 2,414 2,891 19,030 18,159 – – 19,030 18,159 – – 19,030 18,159
Investments accounted for using the equity method 0 0 4 5 141 133 27 27 13 15 1 1 – – 0 – 351 353 537 534 – – 537 534 – – 537 534Result from investments accounted for using the equity method 0 0 0 1 9 12 1 1 1 0 0 0 – – – – 3 3 14 17 – – 14 17 – – 14 17
Gross capital expenditures 215 156 164 137 184 127 110 52 76 72 2,907 2,495 253 182 48 49 139 169 4,096 3,439 12 33 4,108 3,472 – – 4,108 3,472Investment grants received – – –30 –2 – 0 –2 –2 – – –2,382 –1,980 –173 –113 –31 –29 0 0 –2,618 –2,126 – – –2,618 –2,126 – – –2,618 –2,126Net capital expenditures 215 156 134 135 184 127 108 50 76 72 525 515 80 69 17 20 139 169 1,478 1,313 12 33 1,490 1,346 – – 1,490 1,346Additions due to changes in the scope of consolidation 0 – – – 4 – – – 0 17 – – – – – – – – 4 17 – – 4 17 – – 4 17
Employees 6) 16,301 16,443 35,631 35,957 54,145 51,618 28,964 30,155 69,370 66,822 44,717 43,948 5,404 5,007 1,742 1,756 51,291 50,986 307,565 302,692 – – 307,565 302,692 – – 307,565 302,6921) Previous year’s figures adjusted due to the separation of DB Netze Energy.2) Relating to special items and reclassification PPA amortization of customer contracts..3) The non-cash items are included in the segment result shown.4) Key figure from internal reporting, no external figures.5) Profit transfer agreements were not assigned to segment assets or liabilities.6) The number of employees comprises the workforce, excluding trainees, at the end of the reporting period (part-time employees have been converted to full-time equivalents) .
57
SEGMENT INFORMATION ACCORDING TO SEGMENTS
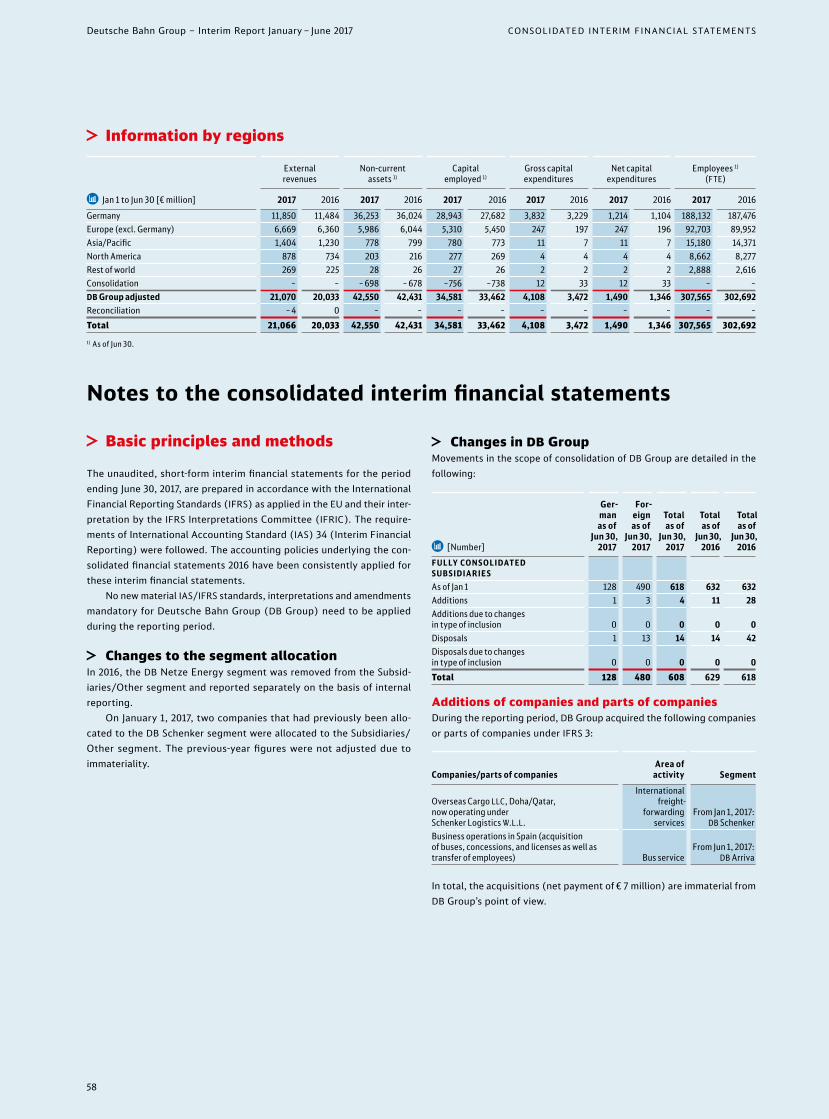
Notes to the consolidated interim financial statements
≈ Information by regions
Æ Jan 1 to Jun 30 [€ million]
External revenues
Non-current assets 1)
Capital employed 1)
Gross capital expenditures
Net capital expenditures
Employees 1) (FTE)
2017 2016 2017 2016 2017 2016 2017 2016 2017 2016 2017 2016Germany 11,850 11,484 36,253 36,024 28,943 27,682 3,832 3,229 1,214 1,104 188,132 187,476Europe (excl. Germany) 6,669 6,360 5,986 6,044 5,310 5,450 247 197 247 196 92,703 89,952Asia/Pacific 1,404 1,230 778 799 780 773 11 7 11 7 15,180 14,371North America 878 734 203 216 277 269 4 4 4 4 8,662 8,277Rest of world 269 225 28 26 27 26 2 2 2 2 2,888 2,616Consolidation – – – 698 – 678 –756 –738 12 33 12 33 – –DB Group adjusted 21,070 20,033 42,550 42,431 34,581 33,462 4,108 3,472 1,490 1,346 307,565 302,692Reconciliation – 4 0 – – – – – – – – – –Total 21,066 20,033 42,550 42,431 34,581 33,462 4,108 3,472 1,490 1,346 307,565 302,6921) As of Jun 30.
≈ Basic principles and methods
The unaudited, short-form interim financial statements for the period ending June 30, 2017, are prepared in accordance with the International Financial Reporting Standards (IFRS) as applied in the EU and their inter-pretation by the IFRS Interpretations Committee (IFRIC). The require-ments of International Accounting Standard (IAS) 34 (Interim Financial Reporting) were followed. The accounting policies underlying the con-solidated financial statements 2016 have been consistently applied for these interim financial statements.
No new material IAS/IFRS standards, interpretations and amendments mandatory for Deutsche Bahn Group (DB Group) need to be applied during the reporting period.
≈ Changes to the segment allocationIn 2016, the DB Netze Energy segment was removed from the Subsid-iaries/Other segment and reported separately on the basis of internal reporting.
On January 1, 2017, two companies that had previously been allo-cated to the DB Schenker segment were allocated to the Subsidiaries/Other segment. The previous-year figures were not adjusted due to immateriality.
≈ Changes in DB GroupMovements in the scope of consolidation of DB Group are detailed in the following:
Æ [Number]
Ger- ma n
as of Jun 30,
2017
For- eign as of
Jun 30, 2017
Total as of
Jun 30, 2017
Total as of
Jun 30, 2016
Total as of
Jun 30, 2016
FULLY CON S OLIDATED SUB SIDIAR IE SAs of Jan 1 128 490 618 632 632Additions 1 3 4 11 28Additions due to changes in type of inclusion 0 0 0 0 0Disposals 1 13 14 14 42Disposals due to changes in type of inclusion 0 0 0 0 0Total 128 480 608 629 618
Additions of companies and parts of companiesDuring the reporting period, DB Group acquired the following companies or parts of companies under IFRS 3:
Companies/parts of companiesArea of
activity Segment
Overseas Cargo LLC, Doha/Qatar, now operating under Schenker Logistics W.L.L.
International freight-
forwarding services
From Jan 1, 2017: DB Schenker
Business operations in Spain (acquisition of buses, concessions, and licenses as well as transfer of employees) Bus service
From Jun 1, 2017: DB Arriva
In total, the acquisitions (net payment of € 7 million) are immaterial from DB Groupʼs point of view.
58
Deutsche Bahn Group – Interim Report January – June 2017 CONSOLIDATED INTERIM FINANCIAL STATEMENTS

Disposals of companies and parts of companiesThe disposals from the scope of consolidation include eight mergers, five liquidations and one sale. The sale resulted in a cash inflow of € 4 million.
Effects on the consolidated statement of incomeThe following table summarizes the non-material effects on the consol-idated income statement resulting from the changes in the scope of consolidation which have taken place compared with the respective previous year period:
Æ [€ million]DB Group
H 1 2017
thereof from addi-
tions to the scope
of consoli- dation
Amounts for removals
from the scope
of consoli-dation
Revenues 21,066 29 –12Inventory changes and internally produced and capitalized assets 1,376 1 –Overall performance 22,442 30 –12Other operating income 1,239 1 –1Cost of materials –10,411 –16 3Personnel expenses – 8,227 – 9 6Scheduled depreciation and impairments –1,405 –2 1Other operating expenses –2,562 – 4 2Operating profit (EBIT) 1,076 0 –1Result of investments accounted for using the equity method 14 – –Net interest income –343 0 –Other financial result –14 0 –Financial result –343 0 0Profit before taxes on income 733 0 –1Taxes on income 46 0 –Net profit (after taxes) 779 0 –1
Of the revenues of € 29 million resulting from additions to the scope of consolidation, € 9 million are attributable to Overseas Cargo LLC (now operating under Schenker Logistics W.L.L.), Doha/Qatar, € 9 million to CSAD MHD Kladno a.s., Kladno/Czech Republic, acquired in 2016, and KD SERVIS a.s., Kladno/Czech Republic, € 6 million to SAVDA Autoservizi Valle dʼAosta S.p.A., Aosta/Italy, acquired in 2016, € 4 million to Red-head, acquired in 2016, and € 1 million to Autos Carballo, S.L., San Vicente de A Bana/Spain, acquired in 2016.
≈ Contingent receivables, liabilities and guarantee obligations
Contingent receivables amounted to € 18 million as of June 30, 2017 (as of December 31, 2016: € 17 million; as of June 30, 2016: € 20 million) and mainly comprise a claim for a refund of investment grants which had been paid; however, as of the balance sheet date, the extent and due date of the claim were not sufficiently certain.
As of the balance sheet date, no contingent receivables were recog-nized for any ongoing proceedings due to the great uncertainty sur-rounding reimbursement claims, timing and likelihood.
The contingent liabilities are broken down as follows:
Æ [€ million]Jun 30,
2017Dec 31,
2016Jun 30,
2016Contingent liabilities from issuing and transferring bills – 0 3 Guarantee obligations 30 – –Other contingent liabilities 93 95 88Total 123 95 91
Other contingent liabilities also comprise risks arising from litigation which had not been stated as provisions because the expected proba-bility of occurrence is less than 50%.
There are also contingencies of € 18 million from guarantees as of June 30, 2017 (as of December 31, 2016: € 29 million; as of June 30, 2016: € 33 million). Property, plant and equipment with carrying amounts of
€ 2 million (as of December 31, 2016: € 9 million; as of June 30, 2016: € 5 million) were also used as security for loans. The reported figure essentially relates to buses which are in use at the operating companies in the DB Arriva segment.
DB Group acts as guarantor mainly for equity participations and joint ventures, and is subject to joint and several liability for all syndicates in which it is involved.
≈ Information regarding the fair value of financial instruments
The carrying amounts of the cash and cash equivalents, trade receiv-ables and other financial assets (€ 6,075 million) approximate the fair values as of the balance sheet date.
The carrying amounts of the trade accounts, the other and miscel-laneous financial liabilities (a total of € 6,675 million) as well as the short-term financial debt approximate the fair values as of the balance sheet date.
As of June 30, 2017, € 871 million of the receivables and other assets are allocated to non-financial assets (as of December 31, 2016: € 793 mil-lion; as of June 30, 2016: € 587 million). As of June 30, 2017, € 2,220 million of the other liabilities are allocated to non-financial liabilities (as of December 31, 2016: € 2,132 million; as of June 30, 2016: € 2,170 million).
The fair value of the non-current financial debt amounted to
€ 20,018 million as of June 30, 2017 (as of December 31, 2016: € 22,089 mil-lion; as of June 30, 2016: € 21,994 million).
59
NOTES TO THE CONSOLIDATED INTERIM FINANCIAL STATEMENTS
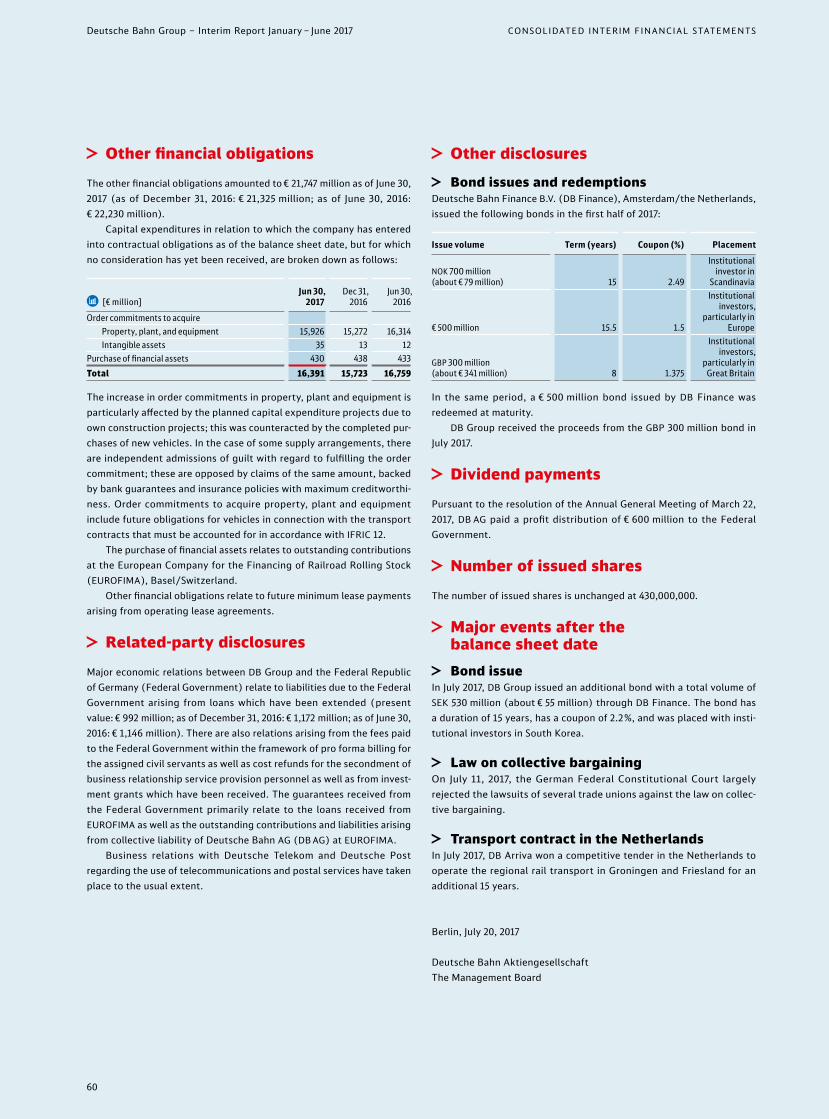
≈ Other financial obligations
The other financial obligations amounted to € 21,747 million as of June 30, 2017 (as of December 31, 2016: € 21,325 million; as of June 30, 2016: € 22,230 million).
Capital expenditures in relation to which the company has entered into contractual obligations as of the balance sheet date, but for which no consideration has yet been received, are broken down as follows:
Æ [€ million]Jun 30,
2017Dec 31,
2016Jun 30,
2016Order commitments to acquire Property, plant, and equipment 15,926 15,272 16,314 Intangible assets 35 13 12Purchase of financial assets 430 438 433Total 16,391 15,723 16,759
The increase in order commitments in property, plant and equipment is particularly affected by the planned capital expenditure projects due to own construction projects; this was counteracted by the completed pur-chases of new vehicles. In the case of some supply arrangements, there are independent admissions of guilt with regard to fulfilling the order commitment; these are opposed by claims of the same amount, backed by bank guarantees and insurance policies with maximum creditworthi-ness. Order commitments to acquire property, plant and equipment include future obligations for vehicles in connection with the transport contracts that must be accounted for in accordance with IFRIC 12.
The purchase of financial assets relates to outstanding contributions at the European Company for the Financing of Railroad Rolling Stock (EUROFIMA), Basel/Switzerland.
Other financial obligations relate to future minimum lease payments arising from operating lease agreements.
≈ Related-party disclosures
Major economic relations between DB Group and the Federal Republic of Germany (Federal Government) relate to liabilities due to the Federal Government arising from loans which have been extended (present value: € 992 million; as of December 31, 2016: € 1,172 million; as of June 30, 2016: € 1,146 million). There are also relations arising from the fees paid to the Federal Government within the framework of pro forma billing for the assigned civil servants as well as cost refunds for the secondment of business relationship service provision personnel as well as from invest-ment grants which have been received. The guarantees received from the Federal Government primarily relate to the loans received from EUROFIMA as well as the outstanding contributions and liabilities arising from collective liability of Deutsche Bahn AG (DB AG) at EUROFIMA.
Business relations with Deutsche Telekom and Deutsche Post regarding the use of telecommunications and postal services have taken place to the usual extent.
≈ Other disclosures
≈ Bond issues and redemptionsDeutsche Bahn Finance B.V. (DB Finance), Amsterdam/the Netherlands, issued the following bonds in the first half of 2017:
Issue volume Term (years) Coupon (%) Placement
NOK 700 million (about € 79 million) 15 2.49
Institutional investor in
Scandinavia
€ 500 million 15.5 1.5
Institutional investors,
particularly in Europe
GBP 300 million (about € 341 million) 8 1.375
Institutional investors,
particularly in Great Britain
In the same period, a € 500 million bond issued by DB Finance was redeemed at maturity.
DB Group received the proceeds from the GBP 300 million bond in July 2017.
≈ Dividend payments
Pursuant to the resolution of the Annual General Meeting of March 22, 2017, DB AG paid a profit distribution of € 600 million to the Federal Government.
≈ Number of issued shares
The number of issued shares is unchanged at 430,000,000.
≈ Major events after the balance sheet date
≈ Bond issueIn July 2017, DB Group issued an additional bond with a total volume of SEK 530 million (about € 55 million) through DB Finance. The bond has a duration of 15 years, has a coupon of 2.2%, and was placed with insti-tutional investors in South Korea.
≈ Law on collective bargainingOn July 11, 2017, the German Federal Constitutional Court largely rejected the lawsuits of several trade unions against the law on collec-tive bargaining.
≈ Transport contract in the NetherlandsIn July 2017, DB Arriva won a competitive tender in the Netherlands to operate the regional rail transport in Groningen and Friesland for an additional 15 years.
Berlin, July 20, 2017
Deutsche Bahn AktiengesellschaftThe Management Board
60
Deutsche Bahn Group – Interim Report January – June 2017 CONSOLIDATED INTERIM FINANCIAL STATEMENTS

≈ Contact information
≈ Investor RelationsDeutsche Bahn AGInvestor RelationsEuropaplatz 110557 Berlin GermanyPhone: +49-30-297-6 40 31Fax: +49-69-265-2 01 10E-mail: ir @ deutschebahn.comInternet: www.db.de/ir-e
This Interim Report was published on July 26, 2017 (copy deadline: July 21, 2017) and is available online at www.db.de/zb-e.
The Interim and Integrated Reports of Deutsche Bahn Group as well as the Financial Statements of Deutsche Bahn AG are published in German and English.
The Interim and Integrated Reports of Deutsche Bahn Group, the Financial Statements of Deutsche Bahn AG, the Annual Report of DB Fernverkehr AG, DB Regio AG, DB Station& Service AG and DB Netz AG, and up-to-date information are also available on the Internet.
≈ Corporate Communications Corporate publications and the Competition Report are available online or can be requested from Corporate Communications:Deutsche Bahn AGCorporate CommunicationsPotsdamer Platz 210785 Berlin GermanyPhone: +49-30-297-6 10 30Fax: +49-30-297-6 19 19E-mail: presse @ deutschebahn.comInternet: www.db.de/en/presse
≈ DB service numberOur service number +49-180-699-6633 gives you direct access to all of our telephone services. These services include our Group-wide general information, timetable information and booking of train tickets, our cus-tomer dialog, and our frequent traveler system (BahnCard).
The following charges apply: calls from the German fixed-line net-work cost 20 ct/call; calls from the German cell phone network cost 60 ct/call at most.
Leisure and business travelers can find answers to frequently asked questions and further contact details online.
≈ Our passenger transport services on social media
Our passenger transport is available on various social media channels for conversations, discussions and for service and product questions. You can find us on Face-book, Twitter and YouTube.
≈ Financial calendar
≈ March 22, 2018Annual Results Press Conference, Publication of the 2017 Integrated Report
≈ July 25, 2018Interim Results Press Conference, Publication of the Interim Report January – June 2018
Imprint ◊ Edited by: Deutsche Bahn AG, Investor Relations, Berlin ◊ Design and typesetting: Studio Delhi, Mainz ◊ Proofreading: AdverTEXT, Düsseldorf ◊ Lithography: Koch. Prepress Print Media GmbH, Wiesbaden ◊ Printing: Kunst- und Werbedruck, Bad Oeynhausen ◊ Photography and consulting: Max Lautenschläger, Berlin ◊ Photo credits: Cover page: Max Lautenschläger
◊ Page 1: Max Lautenschläger
Deutsche Bahn AG Potsdamer Platz 2
10785 Berlin Germany
www.deutschebahn.com
![financial statements - Deutsche Bahn IR...64 deutSche Bahn ag 2014 management RepoRt and financial statements fixed aSSetS Schedule Jan 1, [€ million] acquisition and manufacturing](https://img.pdfslide.us/doc/110x75/5fb014bfa85b5f71af2696a9/financial-statements-deutsche-bahn-ir-64-deutsche-bahn-ag-2014-management.jpg)