Embed Size (px)
Citation preview
Deterrence for Independent Directors and Corporate Boards: Evidence from a Natural Experiment* Rajesh ChakrabartiIndian School of Business Krishnamurthy V. Subramanian Indian School of Business
March 23, 2012 Abstract We study the effect of the personal liabilities faced/perceived by independent directors (IDs) on ID entry and exit decisions, board composition and monitoring. Since Directors and Officers insurance changes with the risk of personal liabilities, studying this question is difficult. We examine this question using an unexpected, high-profile corporate governance (CG) failure in India, which increased the risk of personal liability. We find that, in contrast to CG failures in the U.S. in 2001, IDs exited in large numbers thereby decreasing the percentage and quality of IDs on boards. On the flipside, the increased deterrence stemming from greater risk of personal liability enhanced ID monitoring.
Key Words: Board of Directors, Corporate Governance Failure, Executive Directors, Independent Directors, Internal Governance JEL Code: G34 Please address correspondence to: Krishnamurthy Subramanian Indian School of Business Gachibowli, Hyderabad, India 500032 Email: [email protected]
* We would like to thank Randall Morck for very helpful discussions since the early stage of the writing of this paper and Viral Acharya, N Chidambaram, Bhagwan Chowdhry, Sudipto Dasgupta, Fritz Foley, Radhakrishnan Gopalan, Mariassunta Giannetti, Stuart Gillan, Nandini Gupta, Steven Kaplan, John Karpoff, Sanjay Kallapur, Simi Kedia, Vikas Mehrotra, Todd Milbourn, Ron Masulis, Lilian Ng, Manju Puri, N Prabhala, Krishna Ramaswamy, Anil Shivdasani, Raghuram Rajan, Raghu Sundaram, David Yermack, Bernand Yeung, Luigi Zingales as well as conference participants at the 2011 Asian Finance Conference at the University of New South Wales, the 2011 Frontiers in Finance conference at the University of Alberta, the ISB Summer Research Workshop 2011 and the Olin School of Business Corporate Finance Conference for helpful comments and suggestions. We thank Sandeep Dhole for sharing the data on accounting manipulation. We also acknowledge able research assistance from Naresh Kotrike and Chandra Sekhar Mangipudi. All remaining errors are our responsibility.

Deterrence for Independent Directors and Corporate Boards: Evidence from a Natural Experiment March 23, 2012
Abstract We study the effect of the personal liabilities faced/perceived by independent directors (IDs) on ID entry and exit decisions, board composition and monitoring. Since Directors and Officers insurance changes with the risk of personal liabilities, studying this question is difficult. We examine this question using an unexpected, high-profile corporate governance (CG) failure in India, which increased the risk of personal liability. We find that, in contrast to CG failures in the U.S. in 2001, IDs exited in large numbers thereby decreasing the percentage and quality of IDs on boards. On the flipside, the increased deterrence stemming from greater risk of personal liability enhanced ID monitoring.
Key Words: Board of Directors, Corporate Governance Failure, Executive Directors, Independent Directors, Internal Governance JEL Code: G34

1. Introduction
“In January 2005, settlements were announced in two important cases – Enron and WorldCom. The terms of the settlements were unusual. They involved the directors of the companies making some payments out of their own pockets. Richard Breeden, former SEC chair, called these settlements a “watershed development” that will send a shudder through boardrooms across America and could change the rules of the game. While there is a substantial agreement that these developments could considerably change the rules of the game, there is considerable disagreement as to whether such a change would be positive or negative.”
- Lucian Bebchuk in Bebchuk et. al. (2006) 1
Recent developments in the U.S. have served to increase the personal liability faced/perceived by
independent directors (IDs). In line with the quote above, in Dec 2010, the FDIC authorized lawsuits
against several outside directors of failed financial institutions for simple or gross negligence.3 In fact,
according to Bainbridge (2009), “efforts to hold directors accountable for risk management failures
during the financial crisis threaten to morph into holding directors liable for bad business outcomes.”
On the one hand, the deterrence created by an increase in the risk of personal liability should engender
greater ID vigilance, reduce instances of IDs being found “asleep at the wheel” and thereby improve
the quality of monitoring by IDs. Along these lines, Steve Cutler, Director, SEC Division of
Enforcement, voiced the view that “a recurrence of the corporate abuses that led to the adoption of
Sarbanes-Oxley Act could be prevented by creating more personal accountability and deterrence (for
directors) above and beyond that covered by D&O insurance” (emphasis added).4 On the other hand,
an increase in the risk of personal liability may alter the cost-benefit trade-off faced by IDs and
possibly lower the number and quality of IDs on corporate boards and increase the cost of hiring ID
services. The net effect remains an empirical question.
The deterrence effect that the rise in personal liability seeks to achieve, however, is the product of
two components – the actual risk of a firm experiencing a problem; and the extent of personal liability
of independent directors that gets triggered in the case of the problem. Any empirical analysis of the
impact of deterrence caused by raised stakes for IDs, therefore, can only hope to look at changes
1 For details, see “Ex-WorldCom Directors to pay $18 Million from Personal Assets” and “Former Enron Directors to pay $13 Million From Personal Funds,” Corporate Accountability Report, 30(2), Jan 14, 2005. 3 See http://www.dandodiary.com/2011/08/articles/failed-banks/potential-liabilities-of-former-directors-of-failed-banks/ for example. 4 A similar argument has been made by Alan Hevesi, New York State comptroller and trustee of its Common Retirement Fund - the lead plaintiff in the WorldCom case - was quoted as saying, “(it) would be unfair and not a deterrent for future failures on the part of directors if they weren’t held personally liable. The notion that companies can commit fraud and that the directors can ignore that and be covered by insurance is just wrong.”

2
associated with a variation in the level of deterrence. As for personal liability per se investigating the
effect of an increase in it presents empirical challenges, particularly in developed markets, where
Directors and Officers (D&O) insurance protects IDs against personal liability. Empirical evidence
suggests that D&O insurance responds endogenously to differences in personal liabilities faced by
IDs. Chalmers et al. (2002) find that managers purchase D&O insurance to protect themselves against
the personal liability stemming from their opportunistic behavior. Core (1997, 2000) finds that firms
with greater litigation risk and distress probability are more likely to purchase D&O insurance. Linck
et. al. (2008) find that post the wave of corporate governance (CG) failures in 2001 and the enactment
of the Sarbanes-Oxley Act, D&O insurance premiums have doubled. Such endogenous changes in
liabilities covered by D&O insurance – both in the cross-section and time-series – makes it difficult to
assess the effects of changes in risk of personal liability engendered by any adverse event at the
firm/economy level in developed markets. There are also additional losses for IDs in the event of a
corporate crisis – reputational loss being the most obvious – that are neither covered by D&O
insurance, nor are likely to be altered by legislated changes in personal liability.
In this paper, therefore, we study the effect of an increase in the deterrence on: (i) individual ID’s
exit and entry decisions, on the one hand, and monitoring by IDs, on the other hand; and (ii)
composition of and monitoring by boards across firms in an economy; by looking at a situation when
the perceived likelihood of a corporate scandal increased without any change in the personal liability
for IDs.
We, therefore, employ a natural experiment in a key emerging market, India – a country with
scant D&O insurance – to examine the effects of an increase in the risk of personal liability. In a
national-level corporate scandal in January 2009, the promoter-chairman of the fourth largest Indian
software firm, Satyam Computers, quite unexpectedly confessed to a long-standing accounting fraud
in collusion with the firm's auditor – Price Waterhouse Coopers. Given Satyam’s stellar CG record
and reputation (with ADRs actively trading at the NASDAQ), as well as the Big Four stature of PwC
the scandal completely shook corporate India’s confidence in a key pillar of corporate governance, the
auditors, significantly shifted priors about the likelihood of the management of an Indian firm

3
indulging in such malpractices. As a result of this increase in deterrence, IDs resigned en masse from
other firms (see Figure 1).
**** Insert Figure 1 here ****
We examine the effect of this increase in deterrence for IDs on board composition, director
compensation and board monitoring in other Indian firms. We use a unique, hand-collected dataset of
individual director and board characteristics for more than 2,500 Indian publicly listed firms. Our
results are summarized as follows. We find that: (i) IDs exited in large numbers from other Indian
firms thereby reducing the percentage of IDs on boards; (ii) the drop was disproportionately more in
firms that were performing poorly or had higher accruals a priori, which is consistent with the
argument that IDs perceived risk of personal liability to be greater in such firms; (iii) the percentage
of expert IDs, as measured by their educational qualifications and professional experience, declined;
(iii) director compensation, in particular fixed compensation, increased, which suggests that the cost
of directorial services increased due to the increase in risk perceptions. We also find that the number
of board meetings held per year as well as the attendance at the board meetings increased, which is
consistent with greater vigilance by those IDs that stayed. Consistent with the firm substituting
monitoring by IDs through other channels, we find that: (i) board size increased due to the increased
appointment of executive directors (EDs), particularly those who are experts; (ii) the percentage of
firms where the CEO held the job of the board chairman as well decreased; and (iii) the percentage of
directors belonging to the promoter family decreased.
Thus, the increase in ID deterrence, boards in India shifted to a new equilibrium – an equilibrium
where the exit of IDs, particularly the expert ones, and the resultant decrease in board independence
was offset by the combination of: (i) increased monitoring by those IDs that continued on ID
positions; and (ii) substitution of ID monitoring through other channels.
Our study makes the following contributions. First, ours is the first study to examine the effect of
deterrence for IDs on the entry and exit decisions of IDs, board composition, ID remuneration and
board monitoring. In particular, we throw light on the trade-off involved in deciding the optimal level
of liability to impose on IDs by highlighting both the costs and benefits of such a move. As mentioned

4
above, many institutional investors and policymakers in the U.S. are advocating an increase in
personal liability imposed on IDs, i.e. liability that cannot be covered by D&O insurance. Given the
presence of D&O insurance contracts that currently take care of all categories of major liabilities
imposed on IDs, it may be difficult to generate this counterfactual to study the potential effects of a
policy change that increases the personal liability imposed on IDs. Fortuitously, the Indian setting
where IDs face significant personal liability – including potential criminal liability – provided the
ideal setting to conduct this counterfactual experiment. Our evidence that IDs vote with their feet post
a perceived increase in deterrence cautions against such a policy change in the U.S. At the same time,
the evidence also suggests that those IDs that decide to continue on ID positions would monitor more
diligently post an increase in personal liability.
Second, we complement prior studies by identifying using a natural experiment the effect of
penalties suffered by IDs on their subsequent labor market outcomes. Prior studies have examined the
effect of reputational penalties suffered by IDs due to an adverse event in the firms the IDs are
associated with on IDs’ labor market outcomes. These studies measure such outcomes using the
change in directorships in other firms. The adverse event examined in these studies include financial
fraud (Agrawal, Jaffe, and Karpoff (1999), Helland (2006), Fich and Shivdasani (2007)), earnings
restatement (Srinivasan, 2005), bankruptcy (Gilson, 1990), and liquidation (Harford, 2003). Any
increase or decrease in the ID positions of the involved IDs due to an adverse event results from an
inextricable mix of two factors. First, following such an event, the involved ID may reconsider the
costs and benefits of continuing as an ID on a particular firm. Second, the adverse event may lead to a
reassessment of the ID’s abilities, which make the ID potentially more or less attractive to a particular
firm depending on the firm's preference for the revealed characteristics of the ID. Given such
unobserved firm and ID characteristics that may affect the demand for the involved IDs after such an
event, it is not surprising that the evidence on the effect of such events on IDs’ labor market outcomes
diverges considerably across studies. Srinivasan (2005) and Agrawal, Jaffe, and Karpoff (1999) find
small or no changes; Gilson (1990) and Fich and Shivdasani (2007) find substantial decreases while
Helland (2006) finds substantial increases in such positions. By exploiting the natural experiment due
to the Satyam fiasco, which ensures that confounding firm-specific/director-specific factors

5
coinciding with the timing of the adverse event are absent in our setting, we are able to identify the
effect of an increase in the risks perceived by IDs on their labor market outcomes.
Third, our study documents the unadulterated, market-based response to a CG failure. Unlike the
wave of CG failures in the U.S., which was followed by the enactment of the Sarbanes-Oxley Act, the
Satyam fiasco was not followed by a regulatory response. As a result, the effects that we have studied
resulted from a pure, market-based response by firms to the externalities engendered by the Satyam
fiasco. Our results, therefore, lead us to conjecture that the changes in board composition, director
remuneration, D&O insurance premiums, etc. documented by Linck et. al. (2008) as having resulted
due to the passage of the Sarbanes-Oxley Act may have resulted nevertheless due to market-based
responses following the wave of CG failures.
Fourth, our study highlights the differential effects of a CG failure in an emerging market vis-à-
vis the developed markets due to various market failures that characterize emerging markets. The
market failure generated from the lack of adequate monitoring support to IDs (through a robust
market for corporate control or activist institutional investors) together with the legal failure stemming
from unlimited personal liability possibly accounted for IDs voting with their feet. Therefore, our
study suggests that legislative reforms that address these legal and market failures can enhance the
potency of IDs, thereby enabling to bring expert IDs on boards.
Our paper resembles closely the study by Fahlenbrach et. al. (2010), who highlight a dark side
associated with outside directors – they are likely to resign to protect their reputation or to avoid an
increase in their workload when they anticipate that the firm on whose board they sit will perform
poorly or disclose adverse news. We find evidence of a similar dark-side due to the adverse event
caused by a CG failure that increased the risks and the associated liability perceived by IDs. We also
find evidence of more vigilant monitoring by those IDs that decide to stay on boards. Apart from our
study being set in an emerging market setting, the focus of this study is different from theirs: we
examine the effect of an increase in liability perceived by IDs on boards.

6
2. Background
In this section, we provide the background information about the Satyam fiasco. We also provide
background information about the mandatory levels of board independence in India.
2.1 The corporate governance scandal at Satyam
Satyam Computer Services Limited (hereafter Satyam) was founded in 1987 by B Ramalinga
Raju, who became the firm's Chairman. Since its inception, Satyam grew rapidly into a $4 billion
enterprise. By 2008, it was the fourth largest Indian software company with operations around the
globe and reputed clients such as the World Bank, GE, etc. Satyam and its Chairman had acquired a
stellar reputation for their entrepreneurial spirit and corporate governance practices.6 The non-
executive directors on its board included academics from India and abroad such as Prof. Krishna
Palepu of Harvard Business School, the then Dean of the Indian School of Business, industry experts
such as Vinod Dham (the inventor of Pentium chips at Intel), and a former top civil servant. In short,
on the eve of its crisis, Satyam shone as one of the brightest jewels in India's corporate crown.
Satyam came under media spotlight on Dec 16th 2008 when its board unanimously approved the
acquisition of two family owned companies using its $1.2 billion cash holding. This particular
meeting was chaired by the then Dean of the Indian School of Business, who was an ID on the board.
However, the acquisitions were called off a few hours’ later when institutional investors – particularly
the foreign institutional investors in the US – resisted by labeling it a self-dealing transaction.
Three weeks later, on the morning of Jan 7th 2009, Satyam's Chairman disclosed that the firm had
been fudging its accounts for several years with the cooperation of the firm's auditor Price
Waterhouse Coopers (PWC) and that its $1.2 billion cash holding was the result of a long-drawn
6 Months before the scandal, Satyam was awarded the Golden Peacock Global Award for Excellence in Corporate Governance by The World Council for Corporate Governance. Previously, Investor Relations Global Rankings (IRGR) had rated Satyam as the company with Best Corporate Governance Practices for 2006 and 2007. Satyam's Chairman had served as the Chairman of the National Association of Software and Service Companies (NASSCOM) and had been a member of the International Advisory Panel of Malaysia's Multimedia Super Corridor. Inter alia, he was awarded the Corporate Citizen of the Year award during the Asian Business Leadership Summit held in Hong Kong in 2002, was named as the IT Man of the Year by Dataquest in 2001 and was conferred the Entrepreneur of the Year Award by Ernst & Young, India in 2000.

7
accounting fraud and was largely non-existent.7 Satyam’s shares fell by 77.47% that day and the
benchmark market indices – BSE Sensex and Nifty – fell by 7.25% and 6.18% respectively.8
Ramalinga Raju has been in police custody ever since together with two auditors from PWC.
Apart from a sustained barrage of vilification and aspersions on their competence and character in the
national and international media, Satyam’s directors have since then been subject to an intense grilling
by the Criminal Bureau of India (CBI) and the federal government's Serious Fraud Investigation
Office (SFIO). Class-action lawsuits have also been filed by U.S. investigators.9
Since IDs have to rely on the audited financial information to assess the health of the firm they are
associated with and the auditor itself colluded with the firm's insiders in perpetrating the accounting
fraud, IDs fears about the personal liabilities engendered by the hard to detect actions of unscrupulous
insiders escalated after the Satyam fiasco. In other words, if a company with such a stellar reputation
could be fudging its books in collusion with the firm's auditors, then no Indian firm could be trusted
for not indulging in such manipulation.10
2.2 Legal ambiguities in delineating outside directors’ liability
The Satyam fiasco combined with the legal ambiguities relating to the fiduciary duties of IDs in
India to increase the perceived risk of personal liability. Neither the listing standards in the Indian
stock exchanges nor The Indian Companies Act (1956): (i) differentiate the role of outside directors
vis-à-vis that of the internal (executive) directors, promoter-affiliated directors or the nominee
directors; or (ii) define the fiduciary responsibilities/ legal liability faced by IDs with any real
precision. In fact, in his interviews of Indian IDs post the Satyam fiasco, Khanna and Mathew (2010)
finds that the IDs on Indian corporate boards believed that “the current scope for ID liability was very
high and included a bona fide, non-trivial risk of criminal liability. Such liability was often arbitrarily
7 It was later revealed by Raju that the transactions proposed on Dec 16th were an attempt to close the loop on the long-standing accounting fraud. 8 The benchmark indexes fell by 4.43% and 4.19% respectively if we remove the effect of Satyam. 9 Class-action suits by shareholders are not allowed in India. 10 Prominent Indian shareholder activist Prithvi Haldea noted: “Till Satyam, independent directors used to take sitting fees and remained on the boards of 4-5 companies without proper knowledge of their functioning. But now many (independent directors) are worried that their life's reputation can be ruined overnight and they in fact not only become persona non-grata, but also invite media ridicule and government prosecution. Is the fee they earn enough for them to expose themselves to such risks, is a question many are asking?”

8
imposed and was not offset by adequate directors’ and officers’ insurance coverage.”11 Khanna and
Mathew (2010) found that “IDs desired: (i) seemingly basic protections against being served arrest
warrants based on claims of corporate malfeasance clearly outside the IDs control, such as bounced
checks and factory accidents; and (ii) clear safe harbors that would insulate them from liability for
reliance on information provided by auditors and management.” Deepak Parekh, a reputed banker and
architect of several financial sector reforms who was put in charge of Satyam after the fiasco, notes
that he was under pressure from his family to step down from the boards of several companies: "If
there is some serious accident in any of these companies, will I go to jail? I don't want to be the
chairman of a board." As well, the absence of the D&O insurance market in India implies that any
(civil) liabilities faced by IDs have to be borne personally.
2.3 An exogenous shock to the risk of personal liability perceived by IDs
The Satyam fiasco provides us with a clean, economy-wide shock that increased the risk of
personal liability perceived by IDs. The expected costs to an ID from potential personal liabilities
equals the likelihood of an adverse event in the firm the IDs associated with multiplied by the
personal liability incurred by the ID conditional on such an event. As we argued in section 2.1, IDs’
perception of the likelihood of an adverse event increased post the Satyam fiasco. Furthermore, since
personal liabilities incurred by IDs in India are non-zero (as discussed in section 2.2), the Satyam
fiasco resulted in an increase in the perceived risk of personal liability.
Other important features relating to the scandal made it a clean, economy-wide shock. First, the
scandal was completely unexpected before it happened. Since the scandal involved a firm that was
quite feted for its CG practices and was in an industry that has been the internationally recognized
“poster child” for its professionalism and competition, the Satyam failure came from a completely
unexpected quarter. As a result, we do not expect any effect on the variables of interest before the
scandal. Second, since the scandal unravelled within a short time span of three weeks, we are able to
pinpoint the precise point in time when the effects would manifest. Third, any ID exits as well as
changes in the boards of other firms are unlikely to be confounded by unobserved, firm-specific 11 Criminal liability on external directors can be brought about under clause 49 of the stock exchange listing agreement, The Indian Companies Act, 1956 and/or provisions of the Indian Penal Code that cover breach of trust, theft and cheating. Such criminal liability may trigger arrests and, potentially, convictions for directors.

9
factors coinciding with the precise time of the change since they were due to an unanticipated shock
that was external to the firms in question. Finally, though the scandal was big enough to not only rock
the Indian market on both days, regulators did not respond by enacting any new legislation or
regulation. Therefore, the event provides us a natural experiment to examine the pure, unregulated
effect of an economy-wide increase in the risk of personal liability perceived by IDs.
2.4 Mandatory board independence requirements in India
Readers also need to be aware of the mandatory requirements relating to board independence in
India. In 2000, the Securities and Exchange Board of India (SEBI) – the Indian equivalent of the SEC
– promulgated clause 49 of the stock exchange listing agreement. This was a key regulatory change
that affected the characteristics of Board of Directors in Indian listed firms. Clause 49: (i) sets out the
requirements of having IDs on corporate boards, (ii) defines independence (see the Appendix for
details), and (iii) lays out some specific duties and obligations of IDs. Under clause 49, all publicly
traded Indian firms with paid up capital above Rupees 3 crores (~US $600,000) are required to have a
board composed of at least one third as IDs. Furthermore, publicly traded firms where the Chairman
of the board is an executive of the firm are required to have a board comprised of at least 50% IDs.
While clause 49 sets out some specific duties for directors in general, it imposes the most specific
requirements for IDs who also serve on the audit committee of the board.
3. Empirical Hypotheses
We examine empirically the effect of an increase in the risk of ID liability on board composition,
director remuneration and board monitoring. These effects would manifest through the entry and exit
decisions of IDs, where they evaluate the costs and benefits of remaining an ID post the Satyam
fiasco. On the one hand, an increase in risk of liability increases the costs of being an ID and thereby
may increase IDs’ reluctance to either stay on corporate boards or join boards. On the other hand, for
those IDs that decide to stay, increased liability may make them more vigilant and thereby enhance
the quality of monitoring. We investigate both sides of this trade-off.

10
3.1 Costs and benefits of directorship positions
The prior literature argues that the benefits of ID positions are proportional to firm performance.
Ferris, Jagannathan, and Pritchard (2003) show that directors associated with firms that perform better
receive more offers for ID positions. On the flip side, directors who resign following bankruptcy filing
(Gilson (1990)) and directors of firms that restate earnings (Srinivasan (2005)) are likely to receive
relatively fewer directorships. As well, outside directors build reputation through the performance of
the companies on whose board they serve, creating opportunities for more (and more prestigious)
directorships for themselves (Fama, 1980, Fama and Jensen, 1983). Yermack (2004) shows that
outside directors receive financial rewards for good firm performance. Thus, the benefits to outside
directors are closely linked to the performance of the firms on which they serve as outside directors.
However, ID positions entail direct costs in the form of time and effort commitments, and indirect
costs such as the risk of reputational damage (Fama, 1980, Fama and Jensen, 1983) and potential legal
liability, including the risk of being arrested and sent to jail in some countries. The indirect costs are
directly proportional to the likelihood of an adverse event in the firm the IDs associated with.
3.2 Effects on board composition
A director compares the benefits associated with an ID position vis-à-vis the attendant costs when
deciding whether or not to: (i) resign from an existing ID position; or (i) take up a new ID position. As
discussed above in Section 2.2, the Satyam fiasco escalated the risk of personal liability (including the
possible loss of reputation). As a result, we expect that existing IDs would resign from their position
and some potential IDs (who would have taken up an ID position in the absence of the fiasco) would
decide not to take up the position. Since some companies enjoyed a cushion above the mandatory
level of board independence pre-crisis (as we show when we describe the summary statistics of our
sample), we expect a reduction in the percentage of IDs on Indian corporate boards.
Furthermore, IDs are far from uniform in their expertise. Given that expert IDs face
disproportionately greater costs from potential reputational damages, several expert individuals may
simply refuse such positions or exit from their existing positions. Given the fact that companies are
required to have a certain proportion of IDs on the board to fulfill clause 49 requirements, post the

11
fiasco, we expect that the average quality of IDs on the board would diminish. Furthermore, since
firms in which more IDs exited have to fill more vacant slots, such firms may have to go further down
the quality ladder when compared to firms where ID exits were lower. Therefore, we expect that the
average quality of IDs on the board would decrease disproportionately more in those firms where ID
exits were large when compared to those firms ID exits were small.
3.2.1 Cross-sectional differences based on prior firm performance & accounting manipulation
Post Jan ‘09, the perceived risk of personal ID liability increased across the economy. Since the
likelihood of an adverse event that imposes personal liability on IDs is greater in firms that are
performing poorly a priori, the costs associated with being an ID increased disproportionately more
in poorly performing firms when compared to firms that are performing well. As well, such costs are
likely to have increased disproportionately more in firms that were suspected to be indulging in
accounting manipulation. Since the benefits associated with ID positions are proportional to firm
performance, the expected benefits would be lower in a firm that is performing poorly. Therefore, we
would expect the reduction in the percentage of IDs to be disproportionately more in firms that were
performing poorly in December 2008, i.e. just a week before the Satyam fiasco and in firms that were
suspected to be indulging in accounting manipulation.
3.3 Effect on director remuneration
Finally, since an increase in the risk of personal liability perceived by IDs increases the expected
costs associated with ID positions, IDs would expect to be compensated more for assuming greater
risks. Therefore, we expect an increase in director remuneration, particularly the fixed components of
remuneration, to offset the greater risks.
3.4 Effect on monitoring by IDs
An increase in the liability perceived by IDs would make IDs more vigilant. Since the Satyam
scandal highlighted risks faced by IDs from the hard-to-detect actions of insiders, we expect IDs to
exert greater effort in minimizing the information deficit they face with respect to companies’
insiders. Since regular board meetings and attendance in these meetings are necessary (though not
necessarily sufficient) to minimizing this information deficit, we expect the number of board meetings

12
held as well as the attendance in these meetings to increase post the Satyam fiasco. Moreover, to
decrease the possibility of adverse events in the firms that the IDs are associated with, IDs may
require conflicts of interest in the board to be minimized. Since the presence of promoter directors and
executive chairman would increase conflicts of interest, we expect these to decrease as well.
3.5 Substitution of monitoring by IDs through other channels
Given the exit of IDs, particularly the experts, and the resultant loss in the monitoring function, firms
may respond in other ways to substitute for such effects. To assess the picture that resulted as a result
of the Satyam fiasco in totality, we also examine other channels through which firms try to substitute
monitoring by IDs. First, we examine the effect on board size, where the hypothesized effect is
ambiguous. This is because, on the one hand, exit of IDs would lower board size. On the other hand,
the enhanced demand for monitoring would lead to larger boards. If board size were to increase
despite the increased ID exits, this would be indicative of this substitution effect.
These hypotheses are summarized in Table 1.
**** Insert Table 1 about here ****
4. Data construction and its description
We discuss our data sources and regression variables in this section.
4.1 Board and director characteristics
Using the mandatory filings made to the Bombay Stock Exchange (BSE) by listed companies, we
hand collected a unique dataset of board and director characteristics. To generate this dataset, we
focus on those BSE listed firms that were required to comply with clause 49 of the stock exchange
listing requirements. Our sample spans five years from 2006 to 2010.
As mentioned in section 2.5, all publicly traded Indian firms with paid up capital above Rupees 3
crores (~US $600,000) are required to comply with clause 49 requirements. There are over 2600 such
firms listed at the BSE.12 These firms are the object of our study since, as part of their listing
requirements at the BSE, they are mandated to file information about: (i) all director appointments
and director exits along with the date of appointments and exits on the board; (ii) the classification of
12 This set excludes the suspended/Z Group companies, which do not have to Comply with clause 49.

13
each director on the board into “ID”, “non-executive, non-ID”, “executive director”, “promoter
director” and “nominee director”; (iii) the designation of each director on the board; and (iv) director
characteristics such as educational qualifications, professional experience etc. We hand collected this
data using information from the Directors Database (www.directorsdatabase.com).
For each individual director, we extracted the educational background and occupation. Using a
keyword search, we classified directors as experts if the director’s “educational background” returned
a business/ law degree or if the “occupation” returned lawyer, academic or government official.14
4.2 Director compensation, board size, meetings attended, etc.
We combine the above data on director and board characteristics with data from the Prowess
database maintained by the Centre for Monitoring Indian Economy, Mumbai, India (CMIE), which
contains information on firm characteristics for all publicly traded companies and many unlisted
companies in India. The Prowess database provides us information on director compensation, board
size, number of board meetings held, number of board meetings attended by each director as well as
annual financial information for each of the companies.
Our variables of interest, their definition and their sources are listed in Table 2.
**** Insert Table 2 about here ****
4.3 Descriptive statistics
The descriptive statistics for the variables used in the analysis are provided in Table 3.
**** Insert Table 3 about here ****
First, we notice that for the median firm in our sample, about 40% of the directors on the board
are independent while for the average firm about half the directors on the board are independent.
Since clause 49 requirements mandate that at least a third of the board has to be comprised of IDs, this
suggests that several firms in our sample have more IDs than legally mandated. Second, we notice
that while a majority of the IDs fall in the expert category (i.e. either possess business or law degrees
14 For a business degree, we searched: (i) “M.B.A.”/ “Masters in Business Administration”; (ii) “Post Graduate Diploma in Business Management”/ “PGDM”; (iii) “Bachelor in Commerce”/ “B.Com”; (iv) “Chartered Accountant” or “CA”; and (v) “Chartered Financial Analyst” or “CFA”. For a law degree, we searched: (i) “LL.B.”, which is the Indian equivalent of a Bachelor’s degree in Law; and (ii) “LL.M.”, which is the Indian equivalent of a Master’s degree in Law. For lawyers by profession, we searched “Legal Counsel”, “Lawyer”, “Advocate” etc. For Academics, we searched “Lecturer”, “Reader”, “Professor”, “Faculty”, “Dean”, “Vice Chancellor”, etc. For Government officials, we searched “Secretary”, “Government of India”, etc.

14
or are lawyers, academics or civil servants by profession), a small minority of EDs fall in this expert
category. Third, the board of the median (average) firm comprises of seven (eight) members. Fourth,
the board of the median (average) firm met on average six (seven) times per year during our sample
period. The boards in some firms only met once a year as seen in the minimum number of meetings
held. Fifth, we find considerable variation in the average percentage of board meetings attended by
the board members: while in some firms in a particular year the average board member attended less
than 10% of the board meetings, in some firms the directors attended all the board meetings in a
particular year. In the average as well as the median firm, a director attends every two out of three
meetings held in a year. Sixth, we find that in about 28% of the firm-years in our sample, the CEO of
the firm was also the Chairman of the board; in the median firm, however, the CEO and Chairman
roles are separated. Seventh, on average every one in five directors happens to be a promoter director.
Finally, on average promoters hold about half of the equity in Indian firms.
Figure 1 shows the number of exits by IDs per month over the time period July 2007 to July 2010.
The en masse exit of IDs immediately after the Satyam fiasco, as evidenced by the sharp increase in
ID exits in Jan 2009, in unmistakable. We also notice in Figure 1 that compared to the number of exits
per month till Dec 2008, the number of exits per month is on average greater in the period following
Jan 2009. Note that these exits do not include either the exits by directors from Satyam or the exits by
erstwhile Satyam directors from other firms. Thus, both the sharp increase in ID exits in January 2009
as well as the overall increase in the post-Satyam period occurred due to the exogenous shock to the
risks of personal liability perceived by IDs.
Figures 2-4 provide a visual representation of the annual averages (across all firms in our sample)
of the key variables two years before and after the Satyam crisis. In Figure 2, we notice that the
percentage of IDs peaked in 2009 to fall substantially thereafter. We also notice that the percentage of
expert IDs peaked in 2008 to fall subsequently both in 2009 and 2010. Importantly, we notice the
absence of a time trend in both the percentage of IDs as well as the percentage of expert IDs. In
contrast, in Figure 3, we find a secularly increasing trend in directors’ compensation over the time
period 2007-2010 though the percentage of variable pay decreased considerably in 2009 and partially
recovered in 2010. Finally in Figure 4, we notice that Executive Director appointments increased in

15
2009 when compared to 2008 and then increased substantially more in 2010 when compared to that in
2009. We also notice that the percentage of EDs on the board increased substantially in 2010 after
being primarily range bound in the years 2007 to 2009.
5. Results
We start off by taking a simple before-after look at ID exits, board characteristics and board
monitoring. Since the Satyam crisis occurred on January 8, we define the period from 2006 to 2008 as
the “before” (pre-Satyam) period and the years 2009 and 2010 for which we have data as the “after”
(post-Satyam). Table 4 shows the average values of the dependent variables for the pre- and post-
Satyam periods, the percentage change in the variables and their statistical significance.
**** Insert Table 4 about here ****
First, we notice that the average number of IDs leaving boards every year has risen by over 20%
from 0.3 to 0.36 after the Satyam fiasco: this difference is statistically significant at a 1% level.
Second, the percentage of expert IDs as captured by their education and professional background has
declined significantly. In contrast, the percentage of expert EDs has increased substantially. Directors
are earning more after the crisis though this could just be a manifestation of the time trend we
observed in Figure 3. Average board size has increased significantly post-Satyam – a result somewhat
surprising given the increased departure of IDs. Since larger boards may be more effective monitors,
the enhanced need for monitoring post the Satyam episode may have led to this increase in board size.
Attendance in board meetings appears to have increased by about 3%. The proportion of Executive
Chairmen has fallen with borderline statistical significance while the number of promoter directors
has shown a close to 10% decline. Broadly, the univariate analysis suggests that Indian boards
differed significantly along several dimensions before and after the Satyam fiasco.
5.1 Exits by IDs
To start with, we examine Hypothesis 1a, which predicts that IDs would exit from other firms
post the Satyam fiasco. Both in Figure 1 and in the univariate comparisons in Table 4, we found that
ID exits increased substantially post the Satyam fiasco. To show that this change was indeed due to

16
the Satyam fiasco and not due to other confounding factors, we proceed to examine the effect in a
multivariate framework using the following regression:
ID exits(i,t) = β0 + β1*PostSatyam(t) + β*X(i,t) + ε(i,t) (1)
where PostSatyam(t) equals 1 for 2009-10 and 0 for 2006-08; X(i,t) denotes the set of control
variables for firm i at time t. Our sample period spans the years 2006-2010 and includes the set of
BSE-listed firms that complied with clause 49. In all our regressions, we estimate standard errors that
are robust to heteroskedasticity and are clustered by firm to account for the possibility of
autocorrelation in error terms within a firm.
**** Insert Table 5 about here ****
Column 1 of Table 5 shows the results obtained by estimating (1), where we employ the
following set of control variables. Since ID resignations may have been motivated by the riskiness of
a firm, we use volatility of a firm’s stock return to capture firm risk and logarithm of sales as a proxy
for firm size to capture additional risk associated with smaller firms. To account for the fact that IDs
may have resigned more from firms that were performing poorly, we include the firm’s ROA. To
control for the fact that IDs may have resigned more from firms whose operations were more
complex, we follow Linck et al. (2009) and include the ratio of R&D expenditure to assets to proxy
for the firm’s operational complexity. Firms facing greater financial constraints may be more likely to
perform poorly, which may motivate an ID to resign from such a firm. Therefore, following Linck et
al. (2009), we include a dummy for zero dividend paying companies as a proxy for the firm's financial
constraints. Finally, since the Satyam case involved a family-owned firm, IDs may be more likely to
exits from firms that are controlled by families, hereafter labelled “promoter controlled firms.”
Therefore, we include the promoter’s shareholding to proxy for the same. Except for the promoters’
shareholding, the set of control variables is similar to that employed by Linck et al. (2009).
In column 2, we include firm fixed effects as well, which enables us to control for unobserved
firm-specific factors that may have motivated ID exits:
ID exits(i,t) = βi + β1*PostSatyam(t) + β*X(i,t) + ε(i,t) (2)
In both column 1 and 2, we find that post the Satyam fiasco, ID exits increased; this effect is
statistically significant. Among the control variables, we find that the zero dividend dummy, which

17
proxies the extent of financial constraints in a firm, is associated positively and significantly with ID
exits; this suggests that IDs exited more from firms that faced financial constraints.
To account for the possibility that ID exits may be more numerous in firms with larger boards, in
column 3, we employ the number of ID exits divided by the size of the board:
ID exits(i,t)/Board size(i,t) = βi + β1*PostSatyam(t) + β*X(i,t) + ε(i,t) (3)
We find our results in columns 1 and 2 to be unaltered.
5.1.1 Economic magnitude
The economic effect of the Satyam fiasco on ID exits is significant as well. Compared to the
average number of ID exits, which equals 0.323 from Table 3, the increase of 0.041 in column 2
amounts to a 12.7% increase.
5.2 Board independence after the Satyam fiasco
While the evidence about increased ID exits provides preliminary evidence confirming the
increase in risk of personal liability perceived by IDs, it does not provide a complete picture since the
supply-side shock could also manifest in potential IDs deciding not to take up ID positions. To
examine the total effect of this shock, we now examine Hypothesis 1b relating to the effect on the
percentage of IDs on Indian corporate boards. Table 6 shows the results of these tests. In column 1,
we run the following regression:
%IDs(i,t) = β0 + β1*PostSatyam(t) + β*X(i,t) + ε(i,t) (4)
where we include PostSatyam(t) as well as several control variables that correlate with board
independence. Linck et al. (2009) argue that large firms or firms with complex operating and financial
structures benefit more from outside advising and monitoring. Consistent with their hypothesis, they
find that firms with high R&D intensity have more independent boards. We therefore employ the ratio
of R&D expenditure to assets to proxy for the firm's complexity. They also argue that outsiders lack
firm-specific information and, hence, face information acquisition and processing costs. More IDs on
the board also face additional costs of free-rider, coordination, and/or communication problems
(Lipton and Lorsch 1992; Jensen 1993). Therefore, Linck et al. (2009) predict that board's
independence decreases in monitoring costs. They use standard proxies for information asymmetry

18
(stock return volatility) and growth opportunities (R&D intensity) to measure firms’ monitoring costs.
Following Linck et al. (2009), we include the log of sales to capture firm size, stock return volatility
to proxy information asymmetry and R&D expenditure/assets to proxy for the firm's growth
opportunities. Boone et al. (2007) and Linck et al. (2009) find that firm performance proxies for a
CEO’s power and that CEO powered correlates negatively with board independence. We therefore
include the firm’s Return on Assets (ROA) to proxy firm performance. Since these studies also find
that firms that are less cash constrained have more independent boards, we follow them in including a
zero dividend dummy which is correlated with the firm's cash constraints.
Morck and Yeung (2003) argue that when a family controls a group of firms, such structures give
rise to a set of agency problems that are different from those in which shareholder ownership is
dispersed. These agency costs arise because the managers act on behalf of the controlling family, but
not necessarily on behalf of the shareholders.15 Therefore, we include the proportion of equity held by
the promoter to proxy agency costs in Indian family-owned firms.
**** Insert Table 6 about here ****
We find in column 1 that the coefficient of PostSatyam(t) is negative and statistically significant.
Among the control variables that we included, we find that larger firms have more independent boards
as seen in the positive coefficient of the log of sales. Consistent with the argument made in Boone et
al. (2007) and Linck et al. (2009) that firm performance proxies for a CEO’s power and that CEO
power correlates negatively with board independence, we find a negative and statistically significant
correlation between ROA and the percentage of IDs on the board. Also, consistent with the fact that
agency costs may be greater in firms where promoters’ holding is greater and the fact that greater
board independence may be an endogenous response to greater agency costs, we find a negative
correlation between promoters holding and the percentage of IDs on the board. However, the
coefficients on our proxies for monitoring costs (volatility) and firm complexity in the firm's growth
opportunities (R&D expenditures/assets) and the zero dividend dummy are statistically
15 For example, to avoid “creative self-destruction,” a family might quash innovation in one firm to protect its obsolete investment in another.

19
indistinguishable from zero. In column 2, we also include firm fixed effects to capture the effect of
firm characteristics that do not change substantially over time:
%IDs(i,t) = βi + β1*PostSatyam(t) + β*X(i,t) + ε(i,t) (5)
Since our sample spans a five-year time period and many of our control variables are unlikely to
change dramatically over our time series, this specification may reduce the explanatory power of our
firm characteristics. Along these expected lines, we find that in column 2 even the control variables
that were significant in column 1 (log of sales, ROA and promoters holding) lose their explanatory
power and become statistically indistinguishable from zero. However, the inclusion of the firm fixed
effects should not impact our estimate of post Satyam fiasco effect, which is largely a time-series
estimate. This is precisely what we find with the coefficient of PostSatyam(t) being negative and
statistically significant in column 2.
5.2.1 Separating the effect of Satyam fiasco from that of the onset of financial crisis
Are the above results due to the Satyam fiasco or due to the increase in risk perceptions from the
onset of the financial crisis, which can be dated back to September 2008, when the Lehman Brothers
failure happened? With respect to this alternative interpretation, we note that in Figure 1 the jump in
ID exits occurred in January 2009. In fact, in the three months between the onset of the financial crisis
and the Satyam fiasco (October to December 2008), ID exits were no different from those in the
preceding months. Thus, by looking at Figure 1 it is unmistakable that the en masse exit by IDs
happened due to the Satyam fiasco and not because of the onset of the financial crisis. Nevertheless,
we examine this concern in our multivariate tests as well. To do so, we separate our sample period
into two non-overlapping time periods and examine: (i) the difference in the percentage of IDs in
2009 and 2010 vis-à-vis that in 2008 to capture the effect of the Satyam fiasco separated from that of
the onset of the financial crisis in column 3 of Table 6; and (ii) the difference in percentage of IDs in
2008 vis-à-vis that in 2007 to capture the pure effect of the onset of the financial crisis in column 4 of
Table 6. We notice in column 4 that the coefficient of the financial crisis start dummy, which equals
one for the year 2008 and zero for the year 2007, is statistically indistinguishable from zero. In
contrast, in column 3, the coefficient of the PostSatyam(t) is negative and statistically significant. This

20
reassures us that the decrease in the percentage of IDs in Indian boards was more plausibly due to the
increase in risk perceptions of IDs post Satyam fiasco and not due to the onset of the financial crisis.
5.2.2 Economic magnitudes
As argued above, the coefficient of PostSatyam(t) in column 3 measures the pure effect of the
Satyam fiasco on the percentage of IDs in Indian corporate boards. Using this coefficient, we find that
due to the Satyam fiasco, the percentage of IDs on Indian corporate boards reduced by 0.68%. In
Table 3, we noted that the median firm had 40% of its directors as independent. This decrease of
0.68% is despite the clause 49 mandated needs for firms to maintain a certain threshold level of IDs
and possible new appointments. Therefore, the decrease is economically significant.
5.2.3 Difference-in-difference tests
We now investigate Hypothesis H2 using the following regression specification:
%IDs(i,t) = βi + βt + [β1*PostSatyam(t) + β2]*High performance(i,t-1) + β*X(i,t) + ε(i,t) (6)
Apart from the firm fixed effects βi, which control for unobserved factors that affect board
independence at the firm level, the year fixed effects βt enable us to control for the effect of time
trends in board independence. High performance(i,t-1) is a dummy that equals one if the firm ranked
above the median with respect to the performance measure that we employ. To ensure that the ranking
of firms by performance is done a priori before we observe board independence, we use the lagged
value of the firm performance measure. Given the firm and year fixed effects, β1 estimates the effect
of the Satyam fiasco on board independence as a difference-in-difference, i.e. the before-after
difference due to the Satyam fiasco in the firms that were performing well vis-à-vis the same
difference in firms that were performing poorly.
**** Insert Table 7 about here ****
Table 7 reports the results of these tests. In columns 1 to 3, we use ROA, sales growth and
profit margin as the performance measures respectively and find that the coefficient of interaction is
positive and statistically significant for each of these three measures of firm performance. Thus, board
independence decreased relatively less in the high-performance firms; conversely, board

21
independence decreased disproportionately more in the low performance firms. This finding is
consistent with Hypothesis H2.
5.2.4 Did the possibility of accounting manipulation affect board independence post-Satyam?
To examine whether the possibility of accounting manipulation affected ID exits and new IDs
appointments, we replace High performance(i,t-1) in (2) with Accruals(i,t-1) and find that the
interaction effect is negative and statistically significant, which suggests that ID entry and exits were
affected by the fear of accounting manipulation.
5.3 Changes in quality of IDs
In Table 8, to investigate Hypothesis H3a, we examine the effect of the Satyam fiasco on the
percentage of expert IDs, whom we identify as lawyers, business professionals, financial experts,
retired executives, consultants, academicians, civil servants or government officials.
**** Insert Table 8 about here ****
In columns 1 to 4, the specifications that we employ and the set of control variables that we
include are identical to those in Table 6. The coefficient of PostSatyam(t) is once again negative.
Furthermore by comparing columns 3 and 4, we notice that the decrease in the percentage of expert
IDs is not because of the onset of the financial crisis but is more plausibly due to the Satyam fiasco. In
Figure 2, we had noted that the percentage of expert IDs fell both in 2009 and 2010. Consistent with
this pattern, we find that the coefficient of PostSatyam(t) in column 3 is about a third of the
coefficient observed in column 1, which indicates that the effect of the Satyam fiasco on the
percentage of expert IDs was not only felt immediately in the year 2009 but continued to be felt in the
year 2010. Also, we find that the percentage of expert IDs is positively correlated with a firm’s size,
financial constraints and promoters’ shareholding.
5.3.1 Relative differences in percentage of expert IDs depending upon number of exits
In column 5, we interact PostSatyam(t) with the number of ID exits to examine if % of expert
IDs decreased disproportionately more in firms where IDs existed relatively more (Hypothesis 3b):
%ExpertIDs(i,t) = βi + βt + β1*PostSatyam(t)*IDExits(i,t) + β2* IDExits(i,t) + β*X(i,t) + ε(i,t) (7)

22
The above specification enables us to control for time trends as well as firm-specific unobserved
factors affecting ID quality through the year fixed effects and the firm fixed effects respectively. We
find that, consistent with Hypothesis 3b, ID quality decreased disproportionately more in those firms
that experienced greater ID exits when compared to firms that experienced lower number of ID exits.
5.4 Changes in Director Remuneration
In Table 9, investigate Hypothesis 4a, we examine the effects on ID remuneration.
**** Insert Table 9 about here ****
To mitigate the effect of the outliers in director remuneration, we use the logarithm of the
remuneration per director as the dependent variable. In columns 1 to 4, the specifications that we
employ and the set of control variables that we include are identical to that in Table 6. The coefficient
of PostSatyam(t) is positive and is statistically significant across columns 1 to 3. Furthermore, by
comparing columns 3 and 4, we notice that the increase in director remuneration was not because of
the onset of the financial crisis but was more plausibly due to the Satyam fiasco. In column 5, to
investigate Hypothesis 4b, we examine the effect of the Satyam fiasco on variable part of
compensation and find that variable compensation decreased, which is consistent with the increase in
the risks faced by IDs post the Satyam fiasco.
Among the control variables, firm size, firm profitability, firm complexity and growth
opportunities (R&D expenditure/assets), the absence of cash constraints are significantly and
positively related to total director remuneration. These results are consistent with the effects
documented in the prior literature, especially the ones based on the contracting theories (Hermalin and
Weisbach, 1988, 1998), which predict a positive relationship between pay and firm performance, job
complexity, and the absence of cash constraints.
5.4.1 Separating the effect of increased risk vis-à-vis that of increased workload
The increase in total compensation that we find in columns 1 to 3 could be due to the sum of
two effects. First, as we hypothesize, the increase in risks perceived by IDs led to the increase in
compensation. Second it is possible that post Satyam the workload borne by directors has increased,
which led to the increase in compensation. To investigate whether the increase in total compensation

23
was indeed due to the increased perception of risk, we use the log of total compensation per director
normalized by the average number of meetings attended by directors on the board in a given year.
Since increased workload would manifest in the directors attending more board meetings on average,
this measure accounts for the increase in compensation due to an increase in workload. Using this
dependent variable in column 6, we find that the coefficient of the PostSatyam(t) is positive and
statistically significant. Thus, we conclude that even after controlling for a possible increase in
director workload, the per director compensation increased, which suggests that the increase in risks
post the Satyam fiasco indeed lead to an increase in director compensation.
5.4.2 Changes in ID remuneration
In Panel B of Table 9, we examine the effect on compensation of IDs. Since information
about ID remuneration is only available to us for a sub-sample of firms, the sample size in these tests
is smaller. Using specifications that are very similar to those employed in Panel A, we find that indeed
ID remuneration increased because of the increase in risks post the Satyam fiasco.
5.4.3 Economic magnitude
The economic effect of the Satyam fiasco on total ID remuneration can be estimated using the
coefficient of the PostSatyam(t) in column 3 of Panel B of Table9. Since the dependent variable is log
of total remuneration per director, post Satyam total remuneration increased by exp(0.274) – 1 =
31.5%. This increase is lower in magnitude to the effect that Link et al. (2008) find for the increase in
non-executive director compensation post the Sarbanes-Oxley, which equalled 103%, 80% and 56%
for the small, medium and large firms.
Overall, our results are consistent with the hypothesis that the dramatic increase in IDs’ risks post
the Satyam fiasco significantly increased ID pay.
5.5 Accounting for the possible effects of a decrease in the faith in monitoring by IDs
The Satyam fiasco raised questions about the efficacy of IDs as a monitoring institution and may
have reduced demand for ID services. Theoretical work highlights two major functions of IDs:
monitoring and advising (see Hermalin and Weisbach (1998), Adams and Ferreira (2007), Raheja
(2005), and Harris and Raviv (2006)). However, IDs have to rely on the information provided by

24
insiders to be effective (Harris and Raviv, 2006). Since such information may not be easily
forthcoming from corporate insiders who owe their allegiance to the promoters/ controlling
shareholders, the de facto role of IDs remains questionable even in developed markets. As well,
considerable skepticism prevails about the “independence” of IDs even in the U.S. (see Byoung-
Hyown and Kim, 2009). Given the skepticism about the de facto independence and efficacy of IDs in
developed markets, it is natural that the role of IDs has been viewed with considerable doubt in
emerging market settings, where relationships frequently matter more than explicit contracts (see
Khanna and Palepu, 2010 for instance).
The Satyam fiasco considerably heightened scepticism about (i) the purported “independence” of
IDs; and (ii) the efficacy of IDs in monitoring the self-serving insiders. As described above, though
Satyam had an enviable board comprised of leading luminaries, on Dec 16 the board had given a go-
ahead to an acquisition of two real estate companies by Satyam – companies where Satyam Promoter
Raju’s family had significant stakes. To the rest of the world, particularly institutional investors in the
U.S. where Satyam’s ADRs were listed, this appeared to be a gross dereliction of supervisory duty by
a stellar board in a clear case of a related party transaction. Though the Satyam stock took a severe
drubbing and the move was abandoned within hours, the incident cast doubt not only on the purported
“independence” of the Satyam board but also on the efficacy of IDs themselves.
The effect of a decrease in demand for IDs on the percentage of IDs on Indian corporate boards
would reinforce the effects of an increase in the risk of personal liability perceived by IDs. However,
their effects on the ID compensation oppose each other. As a result, any effect of reduced demand
would only stack the odds against us finding evidence of increased risk perceived by IDs leading to an
increase in ID compensation. Therefore, the tests pertaining to ID remuneration provide compelling
evidence that an increase in the perceived risk of personal liability adversely affected the percentage
and quality of IDs on boards and increased director compensation.
5.6 Effect on monitoring by IDs that continue to hold ID positions
We investigate Hypothesis H5 in Table 10. In columns 1 and 2, we investigate Hypothesis H5a
and find that the number of board meetings held increased significantly after the Satyam fiasco.

25
Economically, post the Satyam fiasco, we find that the average board meets one more time per year
compared to the average before the fiasco. In columns 3 and 4, we investigate Hypothesis H5b and
find that the average attendance in board meetings has increased on average by about 0.5-0.8%. In
columns 5 and 6, we specifically examine the effect on the percentage of board meetings attended by
outside directors and find that the increase in the percentage of meetings attended by outside directors
is greater than the increase for the average director. This suggests that post the Satyam fiasco, outside
directors are attending meetings significantly more regularly compared to the period before the
Satyam fiasco. In columns 7 and 8, we investigate Hypotheses H5c and H5d respectively and find
evidence that conflict of interests on the board, as measured by the percentage of executive chairman
and the percentage of promoter directors, has declined significantly post the Satyam fiasco. Overall,
we conclude that the evidence is consistent with greater monitoring by existing IDs.
**** Insert Table 10 about here ****
5.7 Substitution of monitoring by IDs through other channels
We investigate Hypothesis H6 in Table 11 and find in column 1 that board size has increased
significantly post the Satyam fiasco; given the median board size of seven members from Table 3, the
increase in board size by 0.214 represents a 3% increase. Given the fact that this increase occurred
despite the exits by IDs and the fact that larger boards are supposed to be better monitors, this
evidence suggests that firms try to substitute lower monitoring by IDs by expanding board size. Given
the ID exits, the increase in board size could have happened either through an increase in outside
directors that are not independent or through an increase in EDs. To understand more clearly the
mechanism for this increase in board size, we examine the change in the percentage of ED's on the
board in column 2. We find that the percentage of EDs on corporate boards increased significantly
post the Satyam fiasco. Since such an increase must have happened to greater appointment of EDs, we
investigate the same in column 3 and find that ED appointments increased significantly post the
Satyam fiasco. Thus, board size seems to have increased due to greater appointment of EDs.
**** Insert Table 11 about here ****

26
This increase in percentage of EDs is particularly noteworthy since firms could have let go off
their EDs to counterbalance the IDs that exited and thereby maintain the mandatory level of board
independence. Since the increase in the percentage of EDs could also be due to a drive by the senior
management/controlling shareholder to entrench themselves, we investigate this possibility in column
(4) and find that the percentage of expert EDs (as measured by education and profession) actually
increased post the Satyam fiasco. Since CEOs with a desire for entrenchment are more likely to
appoint “dummy insiders,” the increase in the percentage of expert EDs is not consistent with the
entrenchment motivation. Furthermore, the decrease in the percentage of CEO-chairmen and the
percentage of promoter directors (as seen in Table 10) is also not consistent with the entrenchment
motivation. These findings suggest that companies may now be relying more on having multiple
voices of the top management in the board perhaps to balance out to some extent the power of the
CEO. Theoretically, these findings are consistent with the argument in Acharya et al. (2011) that
internal governance can mitigate agency problems when the potential reaction of subordinates can
limit the self-serving actions of top management. Thus, these findings are consistent with firms using
motivated subordinates to substitute for lower monitoring by IDs post the Satyam fiasco.
5.8 Effect of ID exits on ex-post performance
In Table 12, we investigate the effect of ID exits on ex-post firm performance using the
following regression specification:
FirmPerformance (i,t) = βi + βt + [β1*PostSatyam(t-1) + β2]*IDExits(i,t-1) + ε(i,t) (8)
where IDExits(i,t-1) equals zero for firm i in year t-1 if it did not experience any ID exits in that year.
We use ROA, profit margin and Tobin’s Q as the proxies for firm performance. Given the firm and
year fixed effects, the coefficient β1 estimates the difference-in-difference effect of ID exits in a
particular year on firm performance in the next year. In this difference-in-difference estimate, the
group of firms where there was no ID exits (at least one ID exit) constitutes the control (treatment)
group. In fact, the above specification also exploits variation in the number of ID exits among those
firms that experienced such exits.
**** Insert Table 12 about here ****

27
We find that using either of these three measures of firm performance, firms from which IDs exited
performed no worse when compared to firms from which IDs did not exit. This result is consistent
with the reduction in monitoring by IDs due to ID exits being offset by the combined effect of (i)
better monitoring by existing IDs; and (ii) firms choosing to substitute monitoring by IDs through
monitoring by other channels.
6. Conclusion
Deciding the optimal level of liability to impose on IDs presents the following trade-off. On the
one hand, an increase in ID liability may motivate IDs to be more vigilant and, thereby, decrease
instances where IDs are found “sleeping at the wheel.” On the other hand, increasing the liability
imposed on IDs may increase the costs associated with ID positions and, thereby, shrink the supply of
IDs. In this study, we examine the effect of a perceived increase in the personal liability faced by IDs
on the market for IDs. Since Directors and Officers insurance changes with the risk of personal
liabilities, studying this question is difficult in developed markets. We use a natural experiment in
India – a widespread exodus of IDs from several firms in the wake of a major fraud – to show that an
increase in the perceived risk of personal liability faced by IDs adversely affects the number and
quality of IDs on corporate boards and increases the cost of ID services, on the one hand, and
improves ID monitoring on the other hand.
References
Acharya, Viral, Stewart Myers and Raghuram Rajan, The Internal Governance of Firms, Journal of Finance, 66(3), 689–720. Adams, R. and D. Ferreira, 2007, “A Theory of Friendly Boards,” Journal of Finance, 62: 217–250. Agrawal, A., J.F. Jaffe and J.M. Karpoff, 1999, “Management turnover and governance changes following the revelation of fraud,” Journal of Law and Economics, 42, pp. 309–342. Agarwal, A. and Knoeber, C., 1996, “Firm Performance and Mechanisms to Control Agency Problems between Managers and Shareholders,” Journal of Financial and Quantitative Analysis, 31(3), 377-397. Bainbridge, Stephen M., 2009, “Caremark and Enterprise Risk Management,” UCLA School of Law, Law-Econ Research Paper No. 09-08. Bebchuk, L A., Bachelder, Law., Roel C. Campos, Byron S. Georgiou, Alan G. Hevesi, William Lerach, Robert Mendelsohn, Robert A.G. Monks, Toby Myerson, John F. Olson, Leo E. Strine Jr., John C. Wilcox, 2006, “Director Liability,” Delaware Journal of Corporate Law, Vol. 31, No. 3, pp. 1011-1045. Boone, Audra L., Laura Casares Field, Jonathan M. Karpoff, Charu G. Raheja, “The determinants of corporate board size and composition: An empirical analysis,” Journal of Financial Economics, 85(1), 66-101. Byoung-Hyoun Hwang, Seoyoung Kim, 2009, “It pays to have friends,” Journal of Financial Economics, 93(1), Pages 138-158.

28
Chalmers, John M.R., Larry Y. Dann and Jarrad Harford, 2002, “Managerial Opportunism? Evidence From Directors and Officers Insurance Purchases,” The Journal of Finance, 57(2), 609-636. Core, John E. 1997. ―On the Corporate Demand for Directors’ and Officers’ Insurance, The Journal of Risk and Insurance, Vol. 64, No. 1, pp. 63-87. Core, John E. 2000. ―The Directors' and Officers' Insurance Premium: An Outside Assessment of the Quality of Corporate Governance,ǁ The Journal of Law, Economics, and Organization. Vol. 16, No. 2, pp. 449-477. Fama, E., 1980, “Agency problems and the theory of the firms,” Journal of Political Economy 88, 288-307. Fama, E., and M. Jensen, 1983, “Separation of ownership and control,” Journal of Law and Economics 26, 301-325. Fahlenbrach, R., Angie Low, René M. Stulz, 2010, “The Dark Side of Outside Directors: Do They Quit When They are Most Needed?”, Working Paper, Ohio State University. Ferris, S., Jagannathan, M., and Pritchard, A., 2003, “Too Busy to Mind the Business? Monitoring by Directors with Multiple Board Appointments,” Journal of Finance LVIII (3), 1087-1111. Fich, Eliezer M. and Anil Shivdasani, 2007, “Financial fraud, director reputation, and shareholder wealth,” Journal of Financial Economics, 86(2), Pages 306-336. Gilson, S., 1990, “Bankruptcy, boards, banks, and blockholders: Evidence from changes in Corporate Ownership and Control when Firms Default,” Journal of Financial Economics 27, 355-387. Harford, J., “Takeover bids and target directors’ incentives: The impact of a bid on directors’ wealth and board seats,” Journal of Financial Economics, 69, pp. 51–83. Harris, Milton and Artur Raviv, “A Theory of Board Control and Size,” Review of Financial Studies, 21 (4): 1797-1832. Helland, E, “Reputational penalties and the merits of class action securities litigation,” Journal of Law and Economics, 49, pp. 365–395. Hermalin, B. and M. Weisbach, 1988, “The determinants of board composition,” Rand Journal of Economics, 19, pp. 589–606. Hermalin, B. and M. Weisbach, 1998, “Endogenously chosen boards of directors and their monitoring of the CEO,” American Economic Review, 88, pp. 96–118. Jensen, Michael C., 1993, “The modern industrial revolution, exit, and the failure of internal control systems,” Journal of Finance, 48, 831–880. Kaplan, S. and Reishus, D., 1990, “Outside Directors and Corporate Performance,” Journal of Financial Economics 27, 389-410. Khanna, Tarun and Krishna G. Palepu, 2010, Winning in Emerging Markets: A Road Map for Strategy and Execution, Harvard Business Press. Khanna, Vikramaditya S. and Shaun J. Mathew, 2010, “The Role of Independent Directors in Controlled Firms in India: Preliminary Interview Evidence,” National Law School of India Review, 22, 35-55. Linck, James S., Netter, Jeffry M. and Tina Yang, 2009, “Effects and Unintended Consequences of the Sarbanes-Oxley Act on Corporate Boards,” The Review of Financial Studies, 22(8), 3287-3328. Lipton, Martin and Jay W. Lorsch, 1992, “A modest proposal for improved corporate governance,” Business Lawyer, 48(1), 59–77. Morck, Randall and Bernard Yeung, “Agency Problems in Large Family Business Groups,” Entrepreneurship Theory and Practice, 2003, 27 (4), pages 367–382. Raheja, C.G., 2005, “Determinants of Board Size and Composition: A Theory of Corporate boards,” Journal of Financial & Quantitative Analysis, 40 (2), 283-306. Srinivasan, S., 2005, “Consequences of Financial Reporting Failure for Outside Directors: Evidence from Accounting Restatements and Audit Committee Members,” Journal of Accounting Research 43(2), 291-334. Yermack, D., 2004, “Remuneration, Retention, and Reputation Incentives for Outside Directors,” Journal of Finance 59 (5), 2281-2308.

29
Figure 1: Exodus of IDs from Indian listed firms Jul '07 to Jul '10
Figure 2: Percentage of IDs and the percentage of good quality IDs on Indian corporate boards from 2007 to 2010
0
10
20
30
40
50
60
70
80
90
100
110Number of independent director exits from BSE-listed firms
Satyam Fiasco
0.5
0.505
0.51
0.515
0.52
2007 2008 2009 2010
% Independent directors on the board
0.74
0.75
0.76
0.77
2007 2008 2009 2010
% Good quality independent directors

30
Figure 3: ID remuneration from 2007 to 2010
Figure 4: Appointment of EDs to Indian corporate boards and the percentage of EDs on Indian corporate boards from 2007 to 2010
9.50
10.00
10.50
11.00
11.50
12.00
2007 2008 2009 2010
% Variable pay
0.25
0.27
0.29
0.31
0.33
0.35
2007 2008 2009 2010
% Executive directors on the board
0.007
0.012
0.017
0.022
0.027
0.032
0.037
2007 2008 2009 2010
Executive director appointments
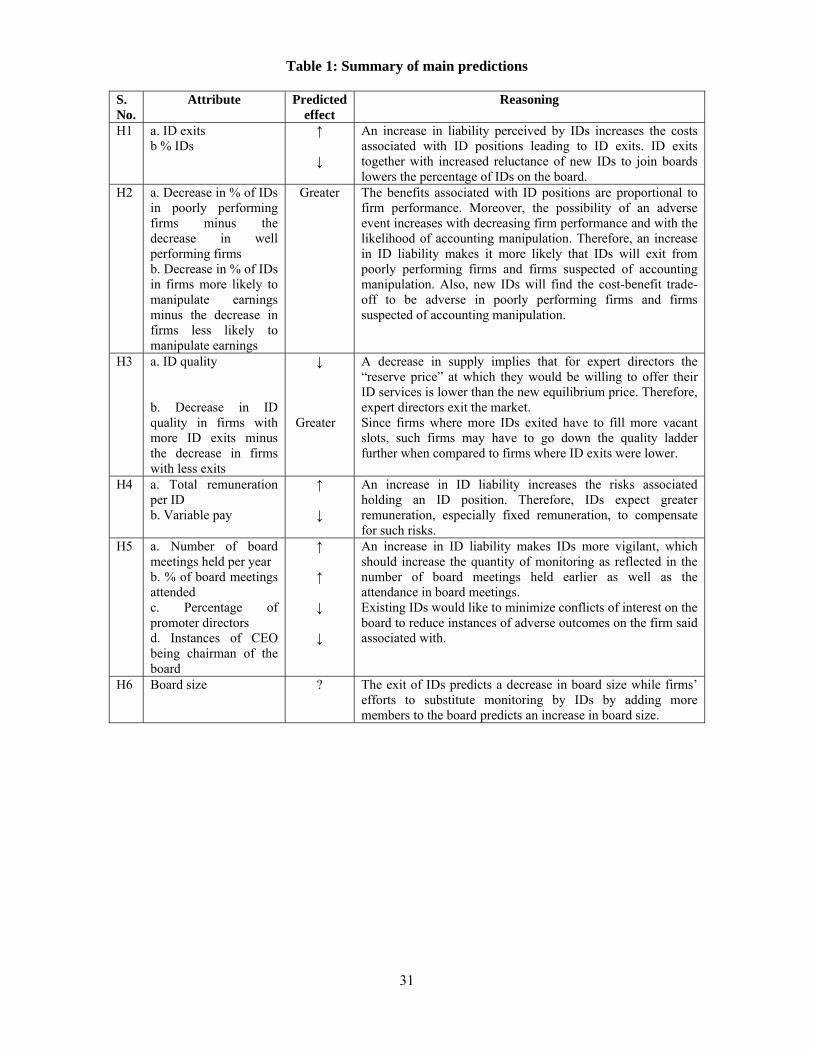
31
Table 1: Summary of main predictions
S. No.
Attribute Predicted effect
Reasoning
H1 a. ID exits b % IDs
↑ ↓
An increase in liability perceived by IDs increases the costs associated with ID positions leading to ID exits. ID exits together with increased reluctance of new IDs to join boards lowers the percentage of IDs on the board.
H2 a. Decrease in % of IDs in poorly performing firms minus the decrease in well performing firms b. Decrease in % of IDs in firms more likely to manipulate earnings minus the decrease in firms less likely to manipulate earnings
Greater The benefits associated with ID positions are proportional to firm performance. Moreover, the possibility of an adverse event increases with decreasing firm performance and with the likelihood of accounting manipulation. Therefore, an increase in ID liability makes it more likely that IDs will exit from poorly performing firms and firms suspected of accounting manipulation. Also, new IDs will find the cost-benefit trade-off to be adverse in poorly performing firms and firms suspected of accounting manipulation.
H3 a. ID quality b. Decrease in ID quality in firms with more ID exits minus the decrease in firms with less exits
↓
Greater
A decrease in supply implies that for expert directors the “reserve price” at which they would be willing to offer their ID services is lower than the new equilibrium price. Therefore, expert directors exit the market. Since firms where more IDs exited have to fill more vacant slots, such firms may have to go down the quality ladder further when compared to firms where ID exits were lower.
H4 a. Total remuneration per ID b. Variable pay
↑ ↓
An increase in ID liability increases the risks associated holding an ID position. Therefore, IDs expect greater remuneration, especially fixed remuneration, to compensate for such risks.
H5 a. Number of board meetings held per year b. % of board meetings attended c. Percentage of promoter directors d. Instances of CEO being chairman of the board
↑ ↑ ↓ ↓
An increase in ID liability makes IDs more vigilant, which should increase the quantity of monitoring as reflected in the number of board meetings held earlier as well as the attendance in board meetings. Existing IDs would like to minimize conflicts of interest on the board to reduce instances of adverse outcomes on the firm said associated with.
H6 Board size ? The exit of IDs predicts a decrease in board size while firms’ efforts to substitute monitoring by IDs by adding more members to the board predicts an increase in board size.

32
Table 2: Variables and Descriptions The following tables give a brief description of the variables and their sources.
Variable Description Source ID exits Number of ID exits from the board Directors
Database Board Size Number of directors on the board Prowess % IDs Proportion of IDs on the board Directors
Database % Expert IDs Percentage of IDs who are lawyers, professionals, financial experts,
consultants etc. Directors Database
Total Remuneration per director
Mean of all components of remuneration of all directors on the board Prowess
% Variable pay Ratio of Bonus pay to the Total remuneration Prowess % Meetings attendance Average meetings attended by the board scaled by the total meetings
held Prowess
Post Satyam fiasco dummy Variable that takes a value of 1 if year is 2009 or 2010, 0 otherwise Prowess Volatility The volatility of the firm’s daily stock returns Prowess log(Sales) Natural logarithm of annual sales revenue in crore rupees Prowess ROA Earnings before interest and taxes scaled by total assets Prowess Debt to Equity ratio The ratio of Total debt to Total equity Prowess R & D Expenditure/Assets R&D expenditure over total assets Prowess Zero dividend dummy Variable that takes a value of 1 if a firm does not pay any dividend, 0
otherwise Prowess
Table 3: Descriptive statistics
The table shows the summary statistics for the variables used in our study. The sample consists of 2653 BSE-listed firms that complied with clause 49. The sample covers the time period 2006-10.
Variable Obns. Min. Max. Mean Median Std. Dev. % IDs 13189 0.33 0.75 50.7 40.5 17.2 ID exits 13265 0 9 0.323 0 0.723 % Expert IDs 12725 0 100 76.1 80 26.6 % Expert EDs 13265 0 100 13.4 0 17.9 Total Remuneration per director (in INR million) 12394 0.11 92.7 1.09 0.27 3.13 % EDs 13189 0.10 0.60 29.3 23 5.1 % Variable compensation 9777 0 100 10.94 0 22.22
Executive director appointments 13265 0 4 0.015 0 0.139 Board Size 13265 3 27 7.9 7 3.3 Meetings held 12394 0 42 6.7 6 5.3 % Board meetings attended 11704 8.9 100 66.6 66.7 15.2 CEO - Chairman duality 13265 0 1 0.284 0 0.451 % Promoter directors 13189 0 100 20.3 18.2 19.3 Volatility 11593 0 1.049 0.041 0.040 0.017 Sales (in INR million) 11404 0.1 330003 9946 1104 7786 ROA 12791 -6.9 25.2 0.094 0.076 2.4 R & D Expenditure/Assets 12791 0 0.905 0.003 0 0.021 Zero Dividend Dummy 13240 0 1 0.483 0 0.500 % Promoters holding 12369 0 98.9 49.8 51.3 19.5

33
Table 4: Before and After the Satyam Fiasco – A snapshot The table shows the change in the variables from pre-Satyam fiasco period to post-Satyam fiasco period. The first column shows the variable names, the second columns shows the average values of the variables over the period 2006-08, the third column shows the average values of the variables over the period 2009-10, and the fourth column shows the percentage change along with its statistical significance. ***, **, and * denote statistical significance at 1%, 5%, and 10% respectively, where the standard errors are clustered by firm. The sample contains 2653 BSE-listed firms over the period 2006-10.
Variable 2006-08 2009-10 % Change % IDs 50.5 51.1 1.18** ID exits per year 0.299 0.360 20.4*** % Expert IDs 76.5 75.7 -1.04* log(1 + Total Remuneration per Director) 9.7 10.9 12.6*** Meetings held 6.68 6.70 0.29 % Board meetings attended 65.8 67.6 2.8*** CEO - Chairman duality 0.285 0.282 -0.86 % Promoter directors 21.2 19.1 -9.9*** Board Size 7.7 8.2 6.4*** % EDs 27.13 31.47 16.0* Executive director appointments in a year 0.008 0.026 234.4*** % Expert EDs 11.06 15.74 42.4***
Table 5: Effect of the Satyam fiasco on ID Exits This table shows the effect of Satyam fiasco on the ID exits from Indian corporate boards. Columns 1, 2 show the effect on the ID exits while column 3 shows the effect on exits by ID exits normalized by the size of the board. The time period for all the tests in Panel B sample covers the years 2006 - 2010. The PostSatyam equals one for t ≥ 2009 equals zero for t < 2009. Standard errors reported in parentheses are robust to heteroskedasticity and are clustered by firm. ***, **, and * denote statistical significance at 1%, 5%, and 10% respectively.
Dependent variable: ID Exits (i,t) ID Exits (i,t) / Board Size (i,t) (1) (2) (3) PostSatyam (t) 0.028* 0.041** 0.005** (0.014) (0.017) (0.002) Volatility (i,t) -1.165** -0.646 -0.056 (0.484) (0.455) (0.052) log(Sales) (i,t) 0.052*** 0.006 -0.000 (0.004) (0.016) (0.002) ROA (i,t) -0.015 -0.010 -0.001 (0.015) (0.011) (0.001) R & D Expenditure/Assets (i,t) -0.247 -0.538 -0.024 (0.191) (0.632) (0.050) Zero dividend dummy (i,t) 0.075*** 0.096*** 0.009** (0.019) (0.036) (0.004) Promoters holding (%) (i,t) -0.002*** -0.002 -0.000 (0.001) (0.002) (0.000) Constant 0.210*** 0.390*** 0.047*** (0.042) (0.108) (0.013) Firm FE No Yes Yes Observations 9,900 9,900 9881 R2 0.129 0.345 0.310
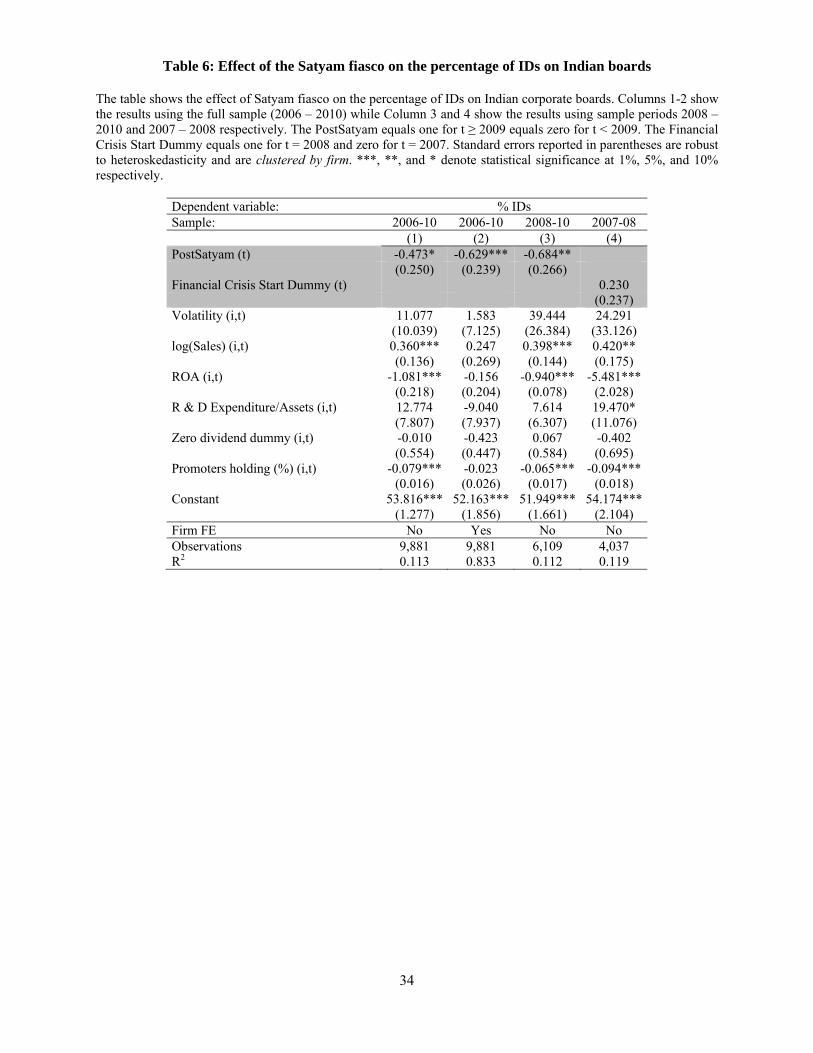
34
Table 6: Effect of the Satyam fiasco on the percentage of IDs on Indian boards
The table shows the effect of Satyam fiasco on the percentage of IDs on Indian corporate boards. Columns 1-2 show the results using the full sample (2006 – 2010) while Column 3 and 4 show the results using sample periods 2008 – 2010 and 2007 – 2008 respectively. The PostSatyam equals one for t ≥ 2009 equals zero for t < 2009. The Financial Crisis Start Dummy equals one for t = 2008 and zero for t = 2007. Standard errors reported in parentheses are robust to heteroskedasticity and are clustered by firm. ***, **, and * denote statistical significance at 1%, 5%, and 10% respectively.
Dependent variable: % IDs Sample: 2006-10 2006-10 2008-10 2007-08 (1) (2) (3) (4) PostSatyam (t) -0.473* -0.629*** -0.684** (0.250) (0.239) (0.266) Financial Crisis Start Dummy (t) 0.230 (0.237) Volatility (i,t) 11.077 1.583 39.444 24.291 (10.039) (7.125) (26.384) (33.126) log(Sales) (i,t) 0.360*** 0.247 0.398*** 0.420** (0.136) (0.269) (0.144) (0.175) ROA (i,t) -1.081*** -0.156 -0.940*** -5.481*** (0.218) (0.204) (0.078) (2.028) R & D Expenditure/Assets (i,t) 12.774 -9.040 7.614 19.470* (7.807) (7.937) (6.307) (11.076) Zero dividend dummy (i,t) -0.010 -0.423 0.067 -0.402 (0.554) (0.447) (0.584) (0.695) Promoters holding (%) (i,t) -0.079*** -0.023 -0.065*** -0.094*** (0.016) (0.026) (0.017) (0.018) Constant 53.816*** 52.163*** 51.949*** 54.174*** (1.277) (1.856) (1.661) (2.104) Firm FE No Yes No No Observations 9,881 9,881 6,109 4,037 R2 0.113 0.833 0.112 0.119

35
Table 7: Difference-in-difference estimate of the effect of the Satyam fiasco on the percentage of IDs
The table shows the effect of Satyam fiasco on the percentage of IDs on Indian corporate boards depending on whether the firm performance was high or low. The sample covers the time period from 2006 to 2010. The PostSatyam equals one for t ≥ 2009 equals zero for t < 2009. High ROA, High sales growth, High profit margin are dummies that equal one if the firm ranked about the median with respect to the performance measure used. Standard errors reported in parentheses are robust to heteroskedasticity and are clustered by firm. ***, **, and * denote statistical significance at 1%, 5%, and 10% respectively.
Dependent variable: % IDs(i,t) Sample: 2006-10 2006-10 2006-10 2006-10 (1) (2) (3) (4) Post Satyam Dummy(t) * High ROA (i,t-1) 1.778*** (0.480) Post Satyam Dummy(t) * High sales growth (i,t-1) 1.018** (0.436) Post Satyam Dummy(t) * High profit margin (i,t-1) 0.587* (0.351) Post Satyam Dummy(t) *Accruals (i,t-1) -0.471* (0.273) High ROA (i,t-1) -0.957*** (0.328) High sales growth (i,t-1) -0.066 (0.277) High profit margin (i,t-1) -1.120** (0.516) Accruals (i,t-1) 0.054 (0.067) Constant 50.035*** 49.493*** 50.181*** 51.060*** (0.285) (0.224) (0.381) (0.204) Firm FE Yes Yes Yes Yes Year FE Yes Yes Yes Yes Observations 13,189 13,189 13,189 10,535 R2 0.785 0.785 0.785 0.834

36
Table 8: Effect of the Satyam fiasco on the percentage of expert IDs on Indian boards
The table shows the effect of Satyam fiasco on the percentage of expert IDs on Indian corporate boards. Columns 1-2 show the results using the full sample (2006 – 2010) while Column 3 and 4 show the results using sample periods 2008 – 2010 and 2007 – 2008 respectively. We label a director to be an expert by searching for his educational qualification as well as his occupation: a director is defined to be an expert if (s)he is a civil servant, possesses a business or a law degree, is a practicing lawyer, PhD or an academic. The PostSatyam equals one for t ≥ 2009 equals zero for t < 2009. The Financial Crisis Start Dummy equals one for t = 2008 and zero for t = 2007. Standard errors reported in parentheses are robust to heteroskedasticity and are clustered by firm. ***, **, and * denote statistical significance at 1%, 5%, and 10% respectively.
Dependent variable: % Expert IDs (i,t) 2006-10 2006-10 2008-10 2007-08 2006-10 (1) (2) (3) (4) (5) PostSatyam (t) -0.952*** -0.689** -0.333* (0.368) (0.316) (0.191) Financial Crisis Start Dummy (t) -0.265 (0.326) Post Satyam dummy * -0.593* Number of ID exits (i,t) (0.344) Number of ID exits (i,t) -0.346 (-0.315) Volatility (i,t) -35.370 -1.075 -135.696*** -66.484 (22.139) (7.631) (49.553) (55.948) log(Sales) (i,t) 0.753*** -0.053 0.684*** 0.552** (0.227) (0.268) (0.239) (0.274) ROA (i,t) -3.134 1.091 -6.241** 0.958 (2.150) (0.998) (2.478) (3.058) R & D Expenditure/Assets (i,t) 14.711 -16.646 5.746 21.245 (14.264) (10.681) (11.454) (17.611) Zero dividend dummy (i,t) -2.220** -0.704 -2.860** -1.843 (1.040) (0.522) (1.118) (1.258) Promoters holding (%) (i,t) 0.111*** 0.024 0.110*** 0.121*** (0.027) (0.034) (0.028) (0.031) Constant 70.265*** 75.953*** 74.792*** 71.425*** 76.234*** (2.170) (2.159) (2.865) (3.323) (0.227) Firm FE No Yes No No Yes Year FE No No No No Yes Observations 9,739 9,739 6,038 3,976 12,725 R2 0.121 0.910 0.123 0.120 0.902

37
Table 9: Effect of the Satyam fiasco on the compensation of directors on Indian corporate boards
The table shows the effect of Satyam fiasco on the compensation of Directors on Indian corporate boards. Panel A shows the results for all directors while Panel B shows the results only for IDs. The PostSatyam equals one for t ≥ 2009 equals zero for t < 2009. The Financial Crisis Start Dummy equals one for t = 2008 and zero for t = 2007. Standard errors reported in parentheses are robust to heteroskedasticity and are clustered by firm. ***, **, and * denote statistical significance at 1%, 5%, and 10% respectively.
Panel A
Dependent variable: Log (Remuneration per director) (i,t) % Variable pay (i,t)
Log (Remuneration
per director) (i,t)
Log (Remuneration per director/Avg. board
meetings attended) (i,t) Sample: 2006-10 2006-10 2008-10 2007-08 2006-10 2006-10 2006-10 (1) (2) (3) (4) (5) (6) (7) PostSatyam (t) 0.752*** 0.760*** 0.539*** -1.219*** 0.443** (0.074) (0.074) (0.083) (0.424) (0.029) Financial Crisis Start Dummy (t)
0.452 (0.823)
PostSatyam (t) * % Expert Directors (i,t)
0.093** (0.042)
% Expert Directors (i,t) 0.002 (0.004)
Volatility (i,t) -11.192* -5.840 -19.977** -12.945 -15.15 -7.980 -3.366 (6.768) (3.778) (7.912) (9.735) (13.17) (5.982) (2.206) log(Sales) (i,t) 0.731*** 0.518*** 0.715*** 0.752*** 1.778*** 0.702*** 0.144*** (0.037) (0.085) (0.038) (0.045) (0.495) (0.037) (0.011) ROA (i,t) 0.791** 0.166 1.158** 0.807** 5.176*** 0.825* 0.172* (0.322) (0.346) (0.457) (0.399) (1.394) (0.498) (0.102) R&D Expenditure/Assets (i,t) 10.576*** -0.952 9.871*** 11.451*** 33.23 10.515*** 2.492***
(2.055) (3.317) (2.162) (2.341) (32.98) (2.354) (0.696) Zero dividend dummy (i,t) -1.120*** -0.083 -1.100*** -1.345*** -6.491*** -1.127*** -0.180*** (0.159) (0.162) (0.168) (0.199) (0.929) (0.161) (0.049) Promoters holding (%)(i,t) 0.008* -0.002 0.011** 0.008 -0.045 0.007 0.005*** (0.004) (0.007) (0.005) (0.005) (0.028) (0.004) (0.001) Constant 7.947*** 8.798*** 8.431*** 8.218*** 7.690** 7.333*** 1.602*** (0.436) (0.555) (0.472) (0.558) (3.109) (0.523) (0.137) Firm FE No Yes No No Yes No No Year FE No No No No No Yes No Observations 9,732 9,732 6,052 3,994 8,274 9,454 9,732 R2 0.231 0.800 0.237 0.251 0.888 0.218 0.098
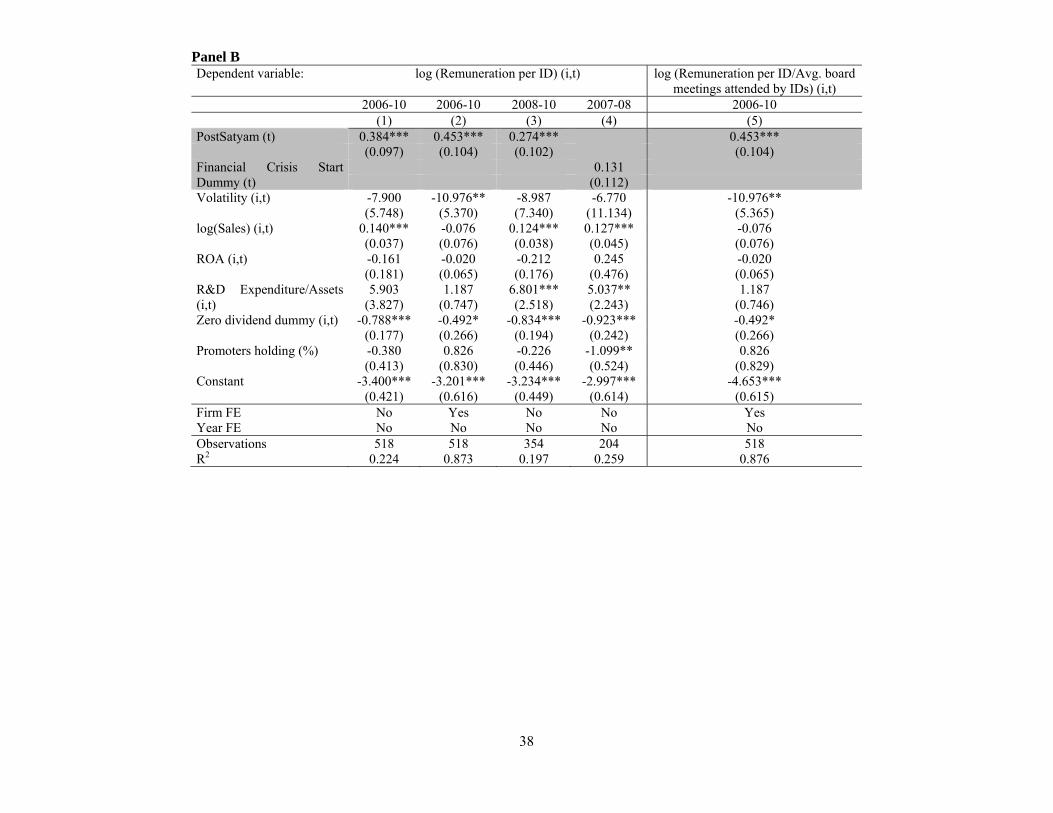
38
Panel B Dependent variable: log (Remuneration per ID) (i,t) log (Remuneration per ID/Avg. board
meetings attended by IDs) (i,t) 2006-10 2006-10 2008-10 2007-08 2006-10 (1) (2) (3) (4) (5) PostSatyam (t) 0.384*** 0.453*** 0.274*** 0.453*** (0.097) (0.104) (0.102) (0.104) Financial Crisis Start Dummy (t)
0.131 (0.112)
Volatility (i,t) -7.900 -10.976** -8.987 -6.770 -10.976** (5.748) (5.370) (7.340) (11.134) (5.365) log(Sales) (i,t) 0.140*** -0.076 0.124*** 0.127*** -0.076 (0.037) (0.076) (0.038) (0.045) (0.076) ROA (i,t) -0.161 -0.020 -0.212 0.245 -0.020 (0.181) (0.065) (0.176) (0.476) (0.065) R&D Expenditure/Assets (i,t)
5.903 1.187 6.801*** 5.037** 1.187 (3.827) (0.747) (2.518) (2.243) (0.746)
Zero dividend dummy (i,t) -0.788*** -0.492* -0.834*** -0.923*** -0.492* (0.177) (0.266) (0.194) (0.242) (0.266) Promoters holding (%) -0.380 0.826 -0.226 -1.099** 0.826 (0.413) (0.830) (0.446) (0.524) (0.829) Constant -3.400*** -3.201*** -3.234*** -2.997*** -4.653*** (0.421) (0.616) (0.449) (0.614) (0.615) Firm FE No Yes No No Yes Year FE No No No No No Observations 518 518 354 204 518 R2 0.224 0.873 0.197 0.259 0.876

39
Table 10: Effect of the Satyam fiasco on monitoring by IDs
The table shows the effect of satyam fiasco on monitoring by IDs in a firm using panel data for BSE-listed firms from 2007-2009. The variable ‘Post Satyam fiasco dummy’ takes a value of one in 2009 and zero otherwise. Robust standard errors clustered at the firm level are shown in parentheses. ***, **, and * denote statistical significance at the 1%, 5%, and 10% levels respectively.
Dependant variable is: Number of board meetings held
% of meetings attended by all directors
% of meetings attended by outside directors
% Executive Chairmen
% Promoter Directors
(1) (2) (1) (2) (3) (4) PostSatyam (t) 1.144*** 1.344** 0.796** 0.541* 0.949** 0.824* -0.006*** -1.324*** (0.398) (0.598) (0.317) (0.284) (0.414) (0.434) (0.002) (0.154) Volatility (i,t) -26.104 -0.521 0.009 0.085 -1.324*** (20.253) (0.890) (1.211) (0.082) (0.154) log(Sales) (i,t) 0.365 -0.291 -0.749 -0.001 6.547 (0.300) (1.332) (1.582) (0.002) (4.750) ROA (i,t) 0.200 2.337 1.979 -0.000 -0.282** (1.356) (2.586) (3.238) (0.001) (0.137) R&D Expenditure/ Assets (i,t) 8.748 -2.922 -4.454 -0.006 -0.191*** (13.858) (5.299) (11.717) (0.022) (0.072) Zero dividend dummy (i,t) -0.225 -0.633 -0.983 -0.003 -6.421 (0.591) (0.481) (0.661) (0.004) (4.524) Promoters holding (%) (i,t) -0.006 -0.002 0.028 -0.000 -0.136 (0.028) (0.049) (0.075) (0.000) (0.289) Constant 65.232*** 65.147*** 68.232*** 69.268*** 69.083*** 69.727*** 0.300*** 22.732*** (0.117) (2.190) (0.107) (3.694) (0.140) (4.982) (0.014) (1.102) Firm FE Yes Yes Yes Yes Yes Yes Yes Yes Observations 10,053 9,456 8,053 5,392 8,027 5,371 9,900 9,881 R2 0.717 0.637 0.717 0.722 0.693 0.701 0.984 0.950

40
Table 11: Substitution of ID monitoring through other mechanisms This table shows the effect of Satyam fiasco on board size, the percentage of EDs, number of ED appointments and the percentage of expert EDs. We label a director to be an expert by searching for his educational qualification as well as his occupation: a director is defined to be an expert if (s)he is a civil servant, possesses a business or a law degree, is a practicing lawyer, PhD or an academic. The PostSatyam dummy equals one for t ≥ 2009 equals zero for t < 2009. Standard errors reported in parentheses are robust to heteroskedasticity and are clustered by firm. ***, **, and * denote statistical significance at 1%, 5%, and 10% respectively.
Dependent variable: Board Size % EDs ED Appointments % Expert EDs (1) (2) (3) (4) PostSatyam (t) 0.214*** 0.226*** 0.015*** 0.671***
(0.040) (0.040) (0.003) (0.163) Volatility (i,t) -3.207*** -0.590 -0.041 -2.705 (1.231) (1.079) (0.068) (4.716) log(Sales) (i,t) 0.140*** 0.077*** 0.005** 0.151 (0.039) (0.030) (0.002) (0.121) ROA (i,t) 0.012 -0.004 -0.001 -0.005 (0.016) (0.005) (0.000) (0.017) R&D Expenditure/ Assets (i,t)
0.619 1.299 0.055 -6.600 (1.194) (1.515) (0.102) (7.929)
Zero dividend dummy (i,t)
-0.087 0.100 0.008 0.221 (0.071) (0.089) (0.009) (0.262)
Promoters holding (%) (i,t)
0.006 -0.004 0.000 -0.006 (0.004) (0.007) (0.000) (0.015)
Constant 7.460*** 0.446 -0.028 2.122*** (0.265) (0.398) (0.020) (0.790) Firm FE Yes Yes Yes Yes Year FE No No No No Observations 9,900 9,900 9,900 9,900 R2 0.877 0.901 0.284 0.916
Table 12: Effect of ID resignations following Satyam fiasco on ex-post firm performance This table presents results of difference-in-difference tests for the effect of ID resignations following the Satyam fiasco on ex-post measures of firm performance (ROA, Profit Margin, Tobin’s Q). Post Satyam Dummy(t-1) equals one for t = 2010 and equals zero for 2007 ≤ t < 2010. The interaction of Post Satyam Dummy(t-1) with ID exits (t-1) captures the before-after difference in next year's firm performance for treatment firms, where ID exited, minus this difference for the control group of firms, where there was no ID exits. We estimate robust standard errors that are clustered by firm. ***, ** and * denote statistical significance at 1%, 5% and 10% respectively.
(1) (2) (3) Dependent Variable: ROA(i,t) Profit Margin (i,t) Tobin’s Q (i,t) ID Exits(t-1)*Post Satyam Dummy(t-1) -0.052 -3.630 -0.032 (0.035) (3.805) (0.057) ID Exits (t-1) 0.006 -0.165 -0.023 (0.012) (2.295) (0.033) Firm FE Yes Yes Yes Year FE Yes Yes Yes Observations 10,216 8,993 9,848 R2 0.474 0.633 0.794

41
Appendix: Definition of an Independent Director according to Clause 49 of the stock exchange
listing agreement promulgated by the Securities and Exchange Board of India (SEBI) in 2000
The expression independent director shall mean a non-executive director of the company who: 1. Apart from receiving director’s remuneration, does not have any material pecuniary relationships or transactions with the company, its promoters, its directors, its senior management or its holding company, its subsidiaries and associates that may affect independence of the director. 2. Is not related to promoters or persons occupying management positions at the board level or at one level below the board. 3. Has not been an executive of the company in the immediately preceding three financial years. 4. Is not a partner or an executive or was not partner or an executive during the preceding three years, of any of the following: the statutory audit firm or the internal audit firm that is associated with the company; and the legal firm(s) and consulting firm(s) that have a material association with the company. 5. Is not a material supplier, service provider or customer or a lessor or lessee of the company, which may affect independence of the director. 6. Is not a substantial shareholder of the company i.e. own more than 2 percent of the voting shares. Explanations are: Associate shall mean a company which is an associate as defined in Accounting Standard (AS) 23, Accounting for Investments in Associates in Consolidated Financial Statements, issued by the Institute of Chartered Accountants of India. ‘‘Senior management’’ shall mean personnel of the company who are members of its core management team excluding the board of directors. Normally, this would comprise all members of management one level below the executive directors, including all functional heads. ‘‘Relative’’ shall mean ‘‘relative’’ as defined in section 2(41) and section 6 read with Schedule IA of the Companies Act, 1956. Nominee directors appointed by an institution, which has invested in or lent to the company shall be deemed to be independent directors. (Institution for this purpose means a public financial institution as defined in Section 4A of the Companies Act, 1956 or a corresponding new bank as defined in section 2(d) of the Banking Companies (Acquisition and Transfer of Undertakings) Act, 1970 or the Banking Companies (Acquisition and Transfer of Undertakings) Act, 1980 (both Acts). Source: Securities and Exchange Board of India (SEBI)