Embed Size (px)
Citation preview
http://keck.wooster.edu/publications/eighteenthannual…
7
DETERMINING THE THICKNESS OF SEDIMENTS USING SEISMIC REFRACTION, CYCLONE GRABEN,
CANYONLANDS NATIONAL PARK, UTAH
JENNIFER ABRAHAMSON Beloit College
Sponsor: Susan Swanson
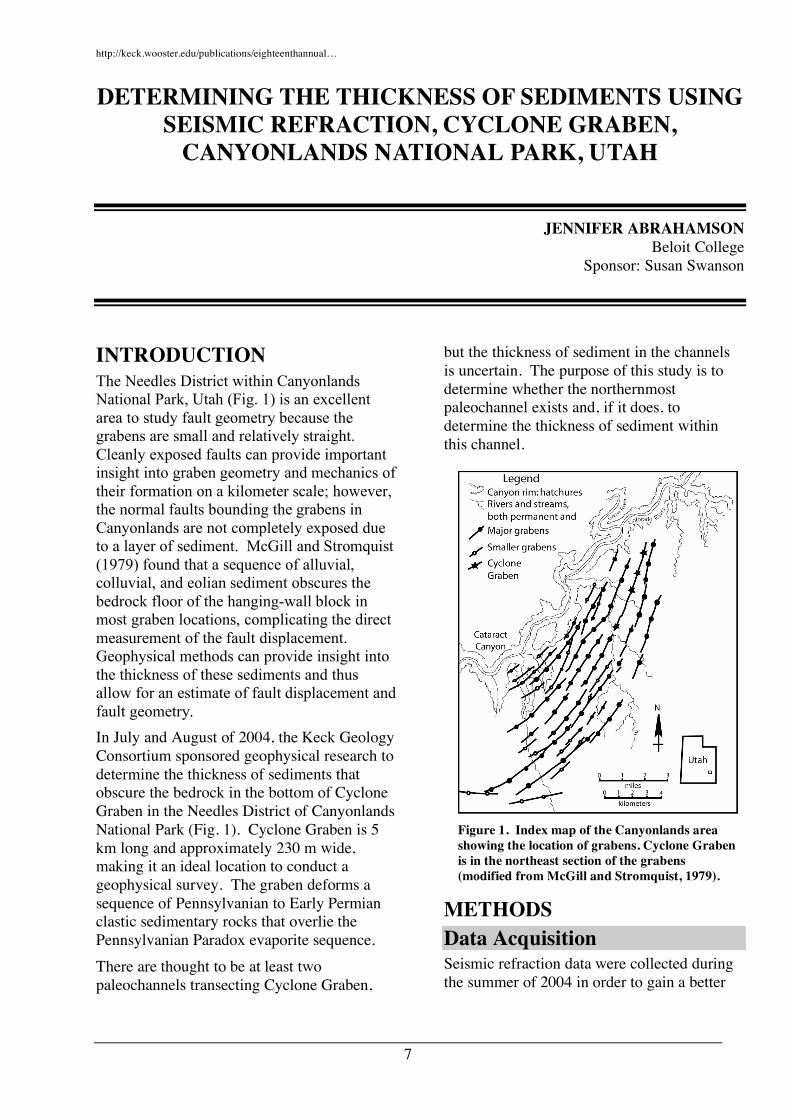
INTRODUCTION The Needles District within Canyonlands National Park, Utah (Fig. 1) is an excellent area to study fault geometry because the grabens are small and relatively straight. Cleanly exposed faults can provide important insight into graben geometry and mechanics of their formation on a kilometer scale; however, the normal faults bounding the grabens in Canyonlands are not completely exposed due to a layer of sediment. McGill and Stromquist (1979) found that a sequence of alluvial, colluvial, and eolian sediment obscures the bedrock floor of the hanging-wall block in most graben locations, complicating the direct measurement of the fault displacement. Geophysical methods can provide insight into the thickness of these sediments and thus allow for an estimate of fault displacement and fault geometry. In July and August of 2004, the Keck Geology Consortium sponsored geophysical research to determine the thickness of sediments that obscure the bedrock in the bottom of Cyclone Graben in the Needles District of Canyonlands National Park (Fig. 1). Cyclone Graben is 5 km long and approximately 230 m wide, making it an ideal location to conduct a geophysical survey. The graben deforms a sequence of Pennsylvanian to Early Permian clastic sedimentary rocks that overlie the Pennsylvanian Paradox evaporite sequence. There are thought to be at least two paleochannels transecting Cyclone Graben,
but the thickness of sediment in the channels is uncertain. The purpose of this study is to determine whether the northernmost paleochannel exists and, if it does, to determine the thickness of sediment within this channel.
METHODS Data Acquisition Seismic refraction data were collected during the summer of 2004 in order to gain a better
Figure 1. Index map of the Canyonlands area showing the location of grabens. Cyclone Graben is in the northeast section of the grabens (modified from McGill and Stromquist, 1979).
http://keck.wooster.edu/publications/eighteenthannual…
8
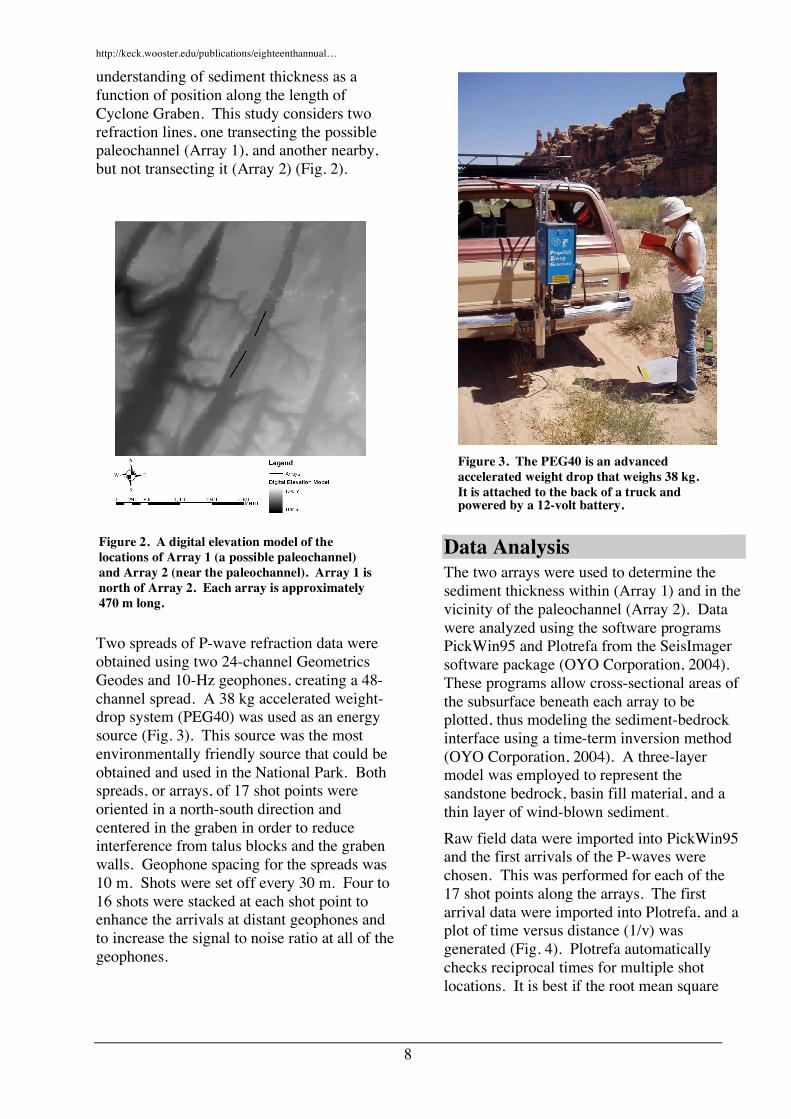
understanding of sediment thickness as a function of position along the length of Cyclone Graben. This study considers two refraction lines, one transecting the possible paleochannel (Array 1), and another nearby, but not transecting it (Array 2) (Fig. 2).
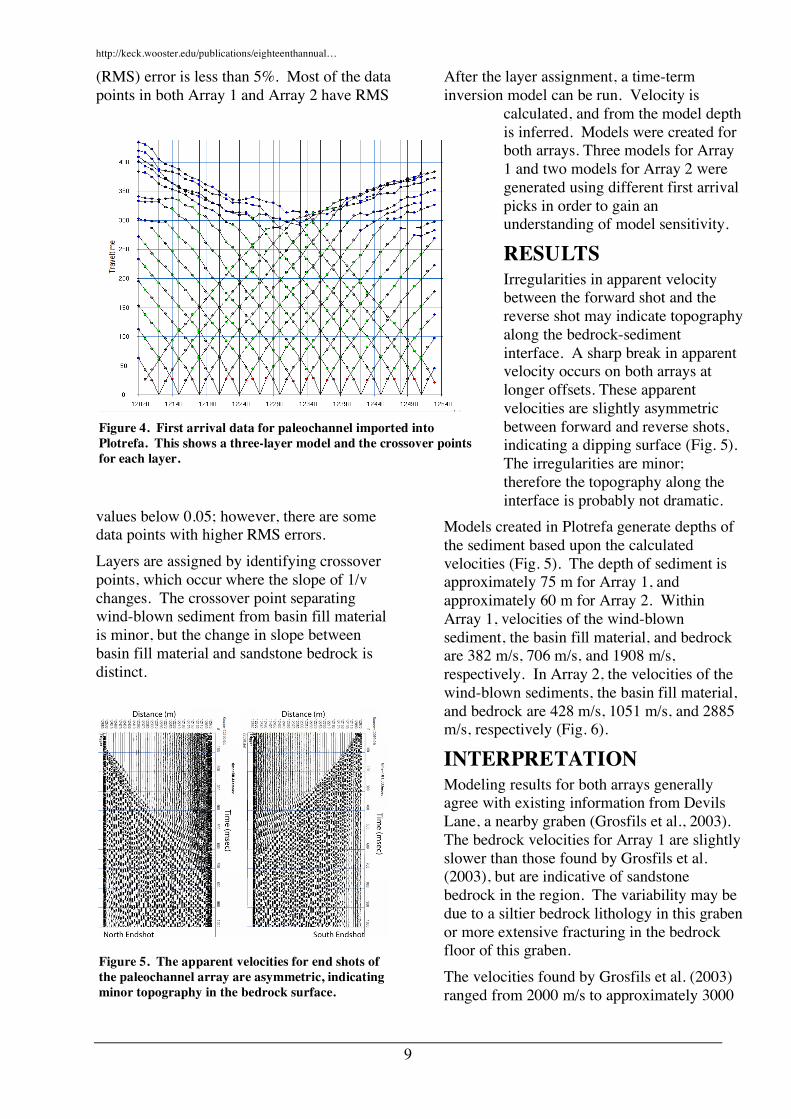
Two spreads of P-wave refraction data were obtained using two 24-channel Geometrics Geodes and 10-Hz geophones, creating a 48-channel spread. A 38 kg accelerated weight-drop system (PEG40) was used as an energy source (Fig. 3). This source was the most environmentally friendly source that could be obtained and used in the National Park. Both spreads, or arrays, of 17 shot points were oriented in a north-south direction and centered in the graben in order to reduce interference from talus blocks and the graben walls. Geophone spacing for the spreads was 10 m. Shots were set off every 30 m. Four to 16 shots were stacked at each shot point to enhance the arrivals at distant geophones and to increase the signal to noise ratio at all of the geophones.
Data Analysis The two arrays were used to determine the sediment thickness within (Array 1) and in the vicinity of the paleochannel (Array 2). Data were analyzed using the software programs PickWin95 and Plotrefa from the SeisImager software package (OYO Corporation, 2004). These programs allow cross-sectional areas of the subsurface beneath each array to be plotted, thus modeling the sediment-bedrock interface using a time-term inversion method (OYO Corporation, 2004). A three-layer model was employed to represent the sandstone bedrock, basin fill material, and a thin layer of wind-blown sediment. Raw field data were imported into PickWin95 and the first arrivals of the P-waves were chosen. This was performed for each of the 17 shot points along the arrays. The first arrival data were imported into Plotrefa, and a plot of time versus distance (1/v) was generated (Fig. 4). Plotrefa automatically checks reciprocal times for multiple shot locations. It is best if the root mean square
Figure 3. The PEG40 is an advanced accelerated weight drop that weighs 38 kg. It is attached to the back of a truck and powered by a 12-volt battery.
Figure 2. A digital elevation model of the locations of Array 1 (a possible paleochannel) and Array 2 (near the paleochannel). Array 1 is north of Array 2. Each array is approximately 470 m long.
http://keck.wooster.edu/publications/eighteenthannual…
9
(RMS) error is less than 5%. Most of the data points in both Array 1 and Array 2 have RMS
values below 0.05; however, there are some data points with higher RMS errors. Layers are assigned by identifying crossover points, which occur where the slope of 1/v changes. The crossover point separating wind-blown sediment from basin fill material is minor, but the change in slope between basin fill material and sandstone bedrock is distinct.
After the layer assignment, a time-term inversion model can be run. Velocity is
calculated, and from the model depth is inferred. Models were created for both arrays. Three models for Array 1 and two models for Array 2 were generated using different first arrival picks in order to gain an understanding of model sensitivity.
RESULTS Irregularities in apparent velocity between the forward shot and the reverse shot may indicate topography along the bedrock-sediment interface. A sharp break in apparent velocity occurs on both arrays at longer offsets. These apparent velocities are slightly asymmetric between forward and reverse shots, indicating a dipping surface (Fig. 5). The irregularities are minor; therefore the topography along the interface is probably not dramatic.
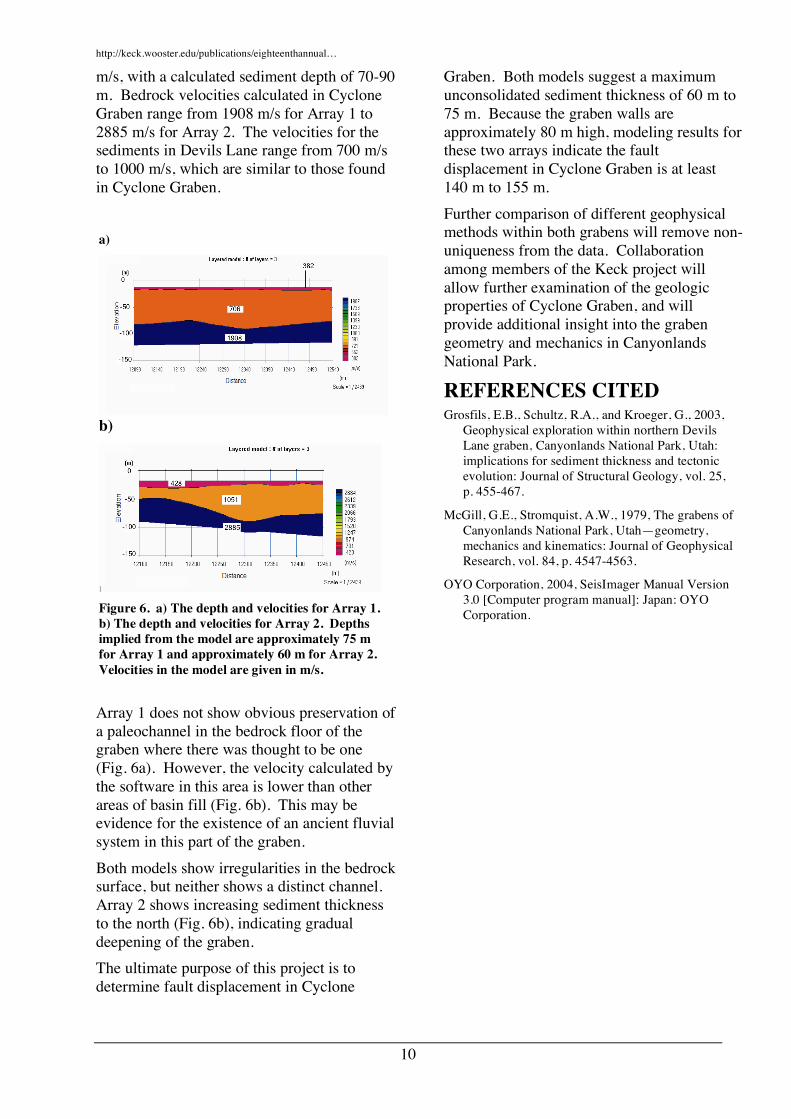
Models created in Plotrefa generate depths of the sediment based upon the calculated velocities (Fig. 5). The depth of sediment is approximately 75 m for Array 1, and approximately 60 m for Array 2. Within Array 1, velocities of the wind-blown sediment, the basin fill material, and bedrock are 382 m/s, 706 m/s, and 1908 m/s, respectively. In Array 2, the velocities of the wind-blown sediments, the basin fill material, and bedrock are 428 m/s, 1051 m/s, and 2885 m/s, respectively (Fig. 6).
INTERPRETATION Modeling results for both arrays generally agree with existing information from Devils Lane, a nearby graben (Grosfils et al., 2003). The bedrock velocities for Array 1 are slightly slower than those found by Grosfils et al. (2003), but are indicative of sandstone bedrock in the region. The variability may be due to a siltier bedrock lithology in this graben or more extensive fracturing in the bedrock floor of this graben. The velocities found by Grosfils et al. (2003) ranged from 2000 m/s to approximately 3000
Figure 4. First arrival data for paleochannel imported into Plotrefa. This shows a three-layer model and the crossover points for each layer.
Figure 5. The apparent velocities for end shots of the paleochannel array are asymmetric, indicating minor topography in the bedrock surface.
http://keck.wooster.edu/publications/eighteenthannual…
10
m/s, with a calculated sediment depth of 70-90 m. Bedrock velocities calculated in Cyclone Graben range from 1908 m/s for Array 1 to 2885 m/s for Array 2. The velocities for the sediments in Devils Lane range from 700 m/s to 1000 m/s, which are similar to those found in Cyclone Graben.
Array 1 does not show obvious preservation of a paleochannel in the bedrock floor of the graben where there was thought to be one (Fig. 6a). However, the velocity calculated by the software in this area is lower than other areas of basin fill (Fig. 6b). This may be evidence for the existence of an ancient fluvial system in this part of the graben. Both models show irregularities in the bedrock surface, but neither shows a distinct channel. Array 2 shows increasing sediment thickness to the north (Fig. 6b), indicating gradual deepening of the graben. The ultimate purpose of this project is to determine fault displacement in Cyclone
Graben. Both models suggest a maximum unconsolidated sediment thickness of 60 m to 75 m. Because the graben walls are approximately 80 m high, modeling results for these two arrays indicate the fault displacement in Cyclone Graben is at least 140 m to 155 m. Further comparison of different geophysical methods within both grabens will remove non-uniqueness from the data. Collaboration among members of the Keck project will allow further examination of the geologic properties of Cyclone Graben, and will provide additional insight into the graben geometry and mechanics in Canyonlands National Park.
REFERENCES CITED Grosfils, E.B., Schultz, R.A., and Kroeger, G., 2003,
Geophysical exploration within northern Devils Lane graben, Canyonlands National Park, Utah: implications for sediment thickness and tectonic evolution: Journal of Structural Geology, vol. 25, p. 455-467.
McGill, G.E., Stromquist, A.W., 1979, The grabens of Canyonlands National Park, Utah—geometry, mechanics and kinematics: Journal of Geophysical Research, vol. 84, p. 4547-4563.
OYO Corporation, 2004, SeisImager Manual Version 3.0 [Computer program manual]: Japan: OYO Corporation.
a)
b)
Figure 6. a) The depth and velocities for Array 1. b) The depth and velocities for Array 2. Depths implied from the model are approximately 75 m for Array 1 and approximately 60 m for Array 2. Velocities in the model are given in m/s.