Embed Size (px)
Citation preview

DETERMINING THE OPTIMAL TECHNIQUE FOR EARLY DETECTION OF BROKEN ROTOR BARS IN MEDIUM VOLTAGE SQUIRREL CAGE INDUCTION MOTORS DURING OPERATION Lourenco Mafika Thusi A research report submitted to the Faculty of Engineering and Built Environment,
University of Witwatersrand, Johannesburg, in partial fulfilment of the
requirements for the degree of Master of Science in Engineering.
Johannesburg, 2009
i
DECLARATION
I declare that this research report is my own, unaided work, except where
otherwise acknowledged. It is being submitted as a partial fulfilment for the
degree of Master of Science in the University of Witwatersrand, Johannesburg. It
has not previously been submitted for any degree or examination in any other
university.
……………………
L.M. Thusi
Signed on this ………day of ……………….2009

ii
ABSTRACT
Electric motors play a pivotal role in various industrial plant processes for
electrical to mechanical energy conversion. As a result their reliability and
availability is of utmost importance to industries. The reliability and availability of
plant electric motors can be achieved by early detection of any developing fault
by performing condition monitoring and preventative maintenance on motors.
An important motor failure mode, which has been quite challenging to detect, is
cracking and subsequent breaking of rotor bars in induction motors.
The existing condition monitoring techniques are incapable of positively detecting
a cracked or single bar problem during operating conditions. Bars have broken,
lifting out of the rotor slots and damaging all stator coils, consequently forcing the
removal of the motor during plant operation and a complete rewind of the stator.
This research is being conducted to ascertain, from existing conventional
techniques, an optimal technique for the detection of a cracked rotor bar or a
completely broken single rotor bar in induction motors under operating
conditions. Furthermore, it explores non-conventional techniques, which can
assist in detection of broken rotor bars.
The report starts by presenting the literature on stator current and axial vibration
analysis which are conventional rotor bat detection techniques. Thereafter, the
Maxwell 2D simulation results which indicate stator current broken rotor bar
detection frequencies are discussed, followed by the experimental measurement
results and discussions. The conclusion drawn from the experimental results is
that the stator current analysis is, presently, the optimal technique to detect a
single broken rotor bar during a medium voltage induction motor operation. The
axial vibration analysis is recommended as a secondary monitoring technique to
solidify the stator current diagnosis. The shaft voltage analysis is introduced as a
non-conventional technique and the shaft voltage results are discussed.

iii
DEDICATION
To my parents V.O. Thusi and J.D. Thusi

iv
ACKNOWLEDGEMENTS
The author would like to thank the following for their guidance, assistance and
patience during the course of this research work:
• Professor W.A. Cronje, my supervisor for his assistance and guidance over
the duration of this research project.
• Mohamed Ahmed, Eskom CED Electric Machines Consultant for initiating the
project to me and together with Associate Professor A. Meyer for assistance,
guidance and advise in performing this research project.
• Daniel de Cahna and Kahesh Dhuness, Fellow Postgraduates from University
of Witwatersrand and University of Johannesburg respectively, for their
assistance in experimental and simulation parts of the project and willingness
to give up their time to help me when necessary.
• Eskom - ERID and Eskom - Generation - Arnot Power Station respectively,
for their financial assistance in making this project possible and for providing
the motors for experimental work on the project.
• Marthinusen & Coutts (M&C) Management and Test Bay personnel, CMM
Consultants (Pty) Ltd and Westward Electric Co. (Pty) Ltd for their patience
and for assisting in performing the tests and part taking in the investigations.
• Lastly, my family, my wife and friends for helping me through difficult patches
and for giving me moral support.
v
CONTENTS Page
DECLARATION…………………………………………………………….….. (i)
ABSTRACT……………………………………………………………….……. (ii)
ACKNOWLEDGEMENTS………………………………………………….…. (iv)
CONTENTS……………………………………………………………….……. (v)
LIST OF FIGURES……………………………………………………….……. (ix)
LIST OF TABLES……………………………………………………….……… (xii)
LIST OF SYMBOLS………………………………………………………....…. (xiii)
1. INTRODUCTION 1 1.1 Broken Rotor Bar Failure Mechanisms……………………………… 3
1.2 Structure of the Research Project …………………………………… 4
2. BACKGROUND ON DETECTION OF BROKEN ROTOR BARS 6 2.1 The Interbar Currents Phenomenon ..………………………………. 6
2.2 Factors Influencing Detection of Broken Rotor Bars ……………… 7
2.3 Axial Vibration Monitoring…………………………………………….. 9
2.4 Thermal Consideration due to Interbar Currents ………………….. 9
2.5 Other Research Work and Case Studies …………………………... 10
3. BROKEN ROTOR BAR DETECTION TECHNIQUES 13 3.1 Interbar Currents ……………………………………………………… 13
3.2 Axial Vibration Monitoring.……………………………..…………….. 15
3.3 Stator Current Monitoring.……………………………………………. 18
3.4 Flux Monitoring….…………………………………………………….. 21
3.5 The Effects of Load..………..…………………………………………… 22
4. MAXWELL 2D SIMULATION OF A BROKEN ROTOR BAR 24
4.1 Induction Motor Simulation Parameters …………………………… 24
4.1.1 Creating the Model……………………………………………………. 26
vi
4.1.2 Materials Setup………………………………………………………. 27
4.1.3 Boundary and Sources Setup………………………………………. 28
4.1.4 Setup Solution………………………………………………………… 29
4.1.5 Solution Options……………………………………………………… 30
4.1.6 Motion Setup………………………………………………………….. 30
4.1.7 Signal Processing…………………………………………………….. 31
4.2 Induction Motor Simulation Results ………………………………… 31
4.3 Induction Motor Simulation Conclusion…………………………….. 34
5. EXPERIMENTAL VALIDATION TESTING DETAILS AND METHODS 35
5.1 Experimental Test Details …………………………………………... 35
5.2 Experiment Measuring Instruments ……………………………….. 37
5.2.1 Current Transducer…………………………………………………... 37
5.2.2 Vibration Sensors……………………………………………………… 39
5.2.3 Speed Sensor: Tachometer…………………………………………. 40
5.3 Data Acquisition and Processing …………………………………... 41
5.3.1 dSpace: DS1104 R&D Controller Board…………………………… 41
5.3.2 Signal Processing…………………………………………………….. 43
5.3.3 Selection of FFT parameters………………………………………… 46
6. INDUSTRIAL EXPERIMENTAL RESULTS AND DISCUSSION 48 6.1 Experiment Results Introduction …………………………………. 48
6.2 Stator Current Analysis ……………………………………………. 48
6.2.1 Motor A Stator Current Analysis…………………………………… 50
6.2.2 Motor B Stator Current Analysis…………………………………… 57
6.3 Axial Vibration Analysis..……………………………………………. 60
6.3.1 Motor A Axial Vibration Analysis…………………………………… 60
6.3.2 Motor B Axial Vibration Analysis…………………………………… 65
6.4 Other detection technique: Shaft Voltage Analysis…..………….. 68
6.4.1 Motor A Shaft Voltage Analysis…………………………………….. 69
vii
6.4.2 Motor B Shaft Voltage Analysis……………………………………. 75
6.5 The Effects of Load..…………………………………………………. 76
6.5.1 Motor A Load Effects Comparison…………………………………. 76
6.6 Experiment Results Summary……………………………………… 78
6.7 Experiment Results Conclusion …………………………………… 79
7. CONCLUSION AND RECOMMENDATIONS 80 7.1 Research Report Summary……………………………………….. 80
7.2 Research Report Conclusion……………………………………… 81
7.3 Recommended Future Work………………………………………. 82
APPENDIX A: MAXWELL 2D: INDUCTION MOTOR SIMULATION 84
A.1 General Procedure for creating and solving a 2D Model……….. 84
APPENDIX B: DS1104 R&D CONTROLLER BOARD SPECIFICATIONS 88 APPENDIX C: DATA PROCESSING MATLAB CODES 90 C.1 The Matlab FFT Function used for data processing [47]…………… 90
C.2 Measured Signal Processing………………………………………….. 91
APPENDIX D: ADDITIONAL THEORETICAL AND INDUSTRIAL MEASUREMENTS RESULTS 93 D.1 Stator Current Analysis……………………………………………… 93
D.2 Axial Vibrations Analysis……………………………………………. 96
APPENDIX E: ADDITIONAL BROKEN ROTOR BAR DETECTION INSTRUMENTS 98 E.1 CSMeter……………………………………………………………… 98
E.2 CSI 2130 Machinery Health Analyser…………………………….. 101
E.3 Current Clamps……………………………………………………… 102
E.4 Flux Coil……………………………………………………………… 102
viii
APPENDIX F: CMM CONSULTANTS EXPERIMENT REPORT 105 APPENDIX G: IRIS POWER EXPERIMENT REPORT 117 REFERENCES 131
ix
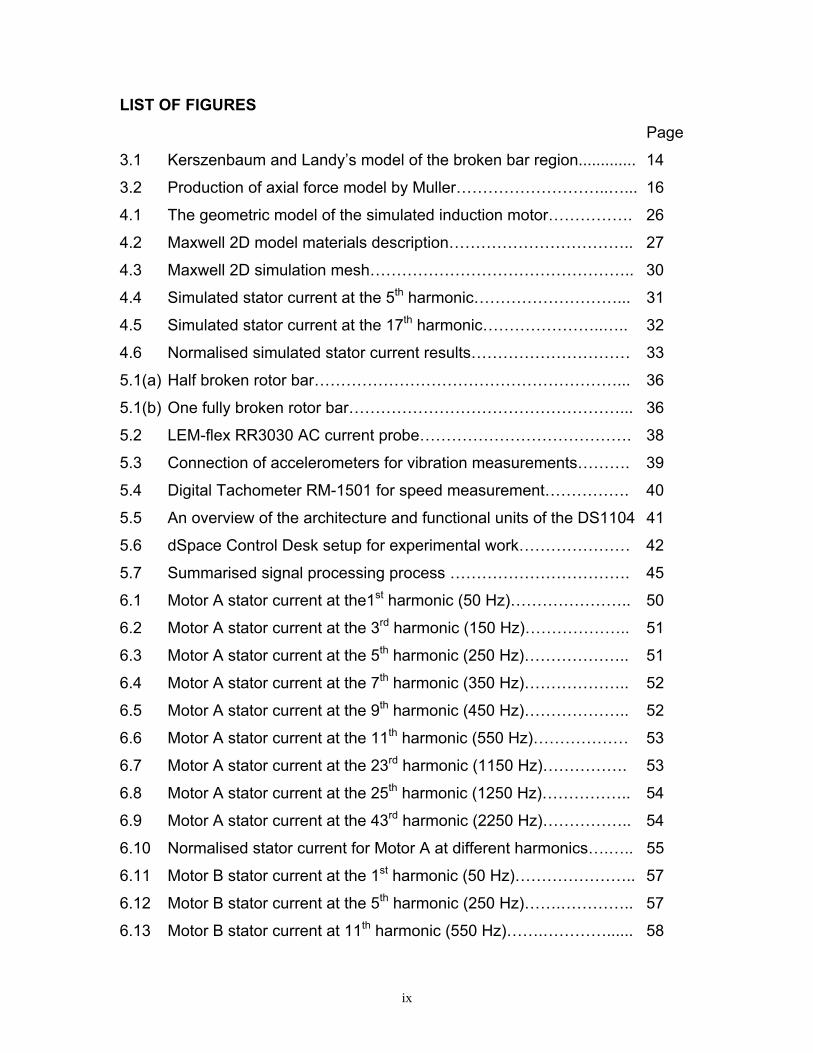
LIST OF FIGURES Page
3.1 Kerszenbaum and Landy’s model of the broken bar region............. 14
3.2 Production of axial force model by Muller………………………..…... 16
4.1 The geometric model of the simulated induction motor……………. 26
4.2 Maxwell 2D model materials description…………………………….. 27
4.3 Maxwell 2D simulation mesh………………………………………….. 30
4.4 Simulated stator current at the 5th harmonic………………………... 31
4.5 Simulated stator current at the 17th harmonic…………………..….. 32
4.6 Normalised simulated stator current results………………………… 33
5.1(a) Half broken rotor bar…………………………………………………... 36
5.1(b) One fully broken rotor bar……………………………………………... 36
5.2 LEM-flex RR3030 AC current probe…………………………………. 38
5.3 Connection of accelerometers for vibration measurements………. 39
5.4 Digital Tachometer RM-1501 for speed measurement……………. 40
5.5 An overview of the architecture and functional units of the DS1104 41
5.6 dSpace Control Desk setup for experimental work………………… 42
5.7 Summarised signal processing process ……………………………. 45
6.1 Motor A stator current at the1st harmonic (50 Hz)………………….. 50
6.2 Motor A stator current at the 3rd harmonic (150 Hz)……………….. 51
6.3 Motor A stator current at the 5th harmonic (250 Hz)……………….. 51
6.4 Motor A stator current at the 7th harmonic (350 Hz)……………….. 52
6.5 Motor A stator current at the 9th harmonic (450 Hz)……………….. 52
6.6 Motor A stator current at the 11th harmonic (550 Hz)……………… 53
6.7 Motor A stator current at the 23rd harmonic (1150 Hz)……………. 53
6.8 Motor A stator current at the 25th harmonic (1250 Hz)…………….. 54
6.9 Motor A stator current at the 43rd harmonic (2250 Hz)…………….. 54
6.10 Normalised stator current for Motor A at different harmonics….….. 55
6.11 Motor B stator current at the 1st harmonic (50 Hz)………………….. 57
6.12 Motor B stator current at the 5th harmonic (250 Hz)…….………….. 57
6.13 Motor B stator current at 11th harmonic (550 Hz)…….…………...... 58
x
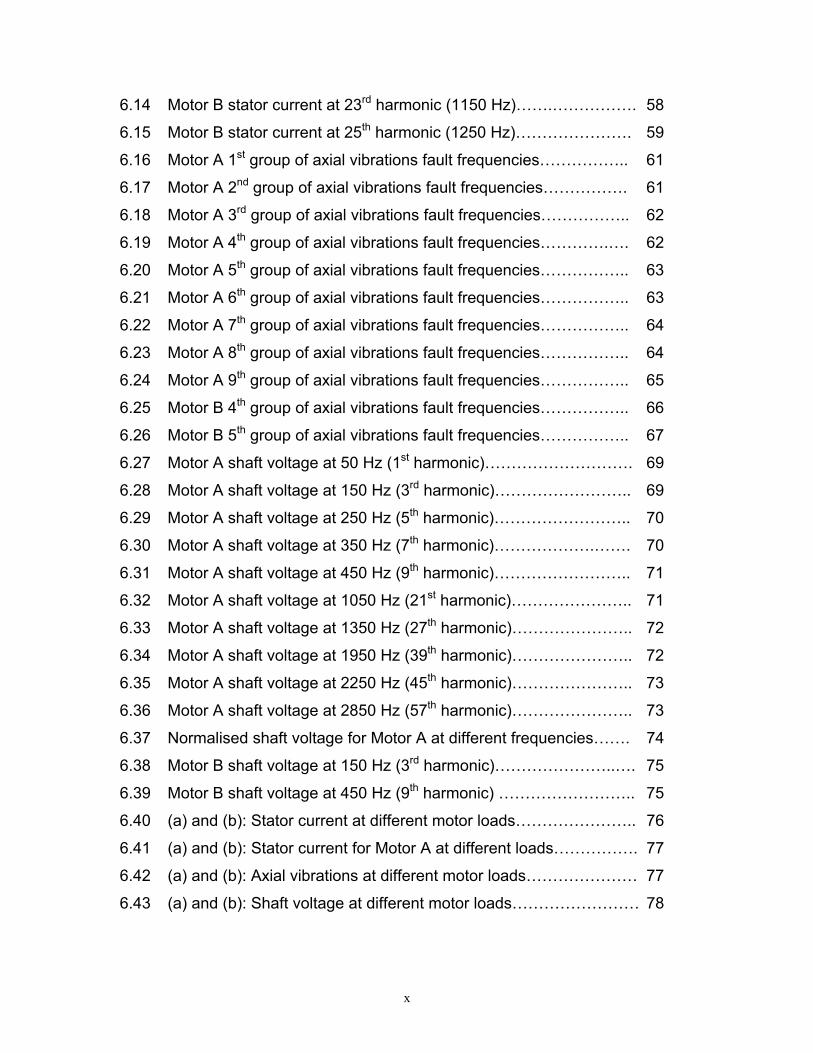
6.14 Motor B stator current at 23rd harmonic (1150 Hz)…….……………. 58
6.15 Motor B stator current at 25th harmonic (1250 Hz)…………………. 59
6.16 Motor A 1st group of axial vibrations fault frequencies…………….. 61
6.17 Motor A 2nd group of axial vibrations fault frequencies……………. 61
6.18 Motor A 3rd group of axial vibrations fault frequencies…………….. 62
6.19 Motor A 4th group of axial vibrations fault frequencies………….…. 62
6.20 Motor A 5th group of axial vibrations fault frequencies…………….. 63
6.21 Motor A 6th group of axial vibrations fault frequencies…………….. 63
6.22 Motor A 7th group of axial vibrations fault frequencies…………….. 64
6.23 Motor A 8th group of axial vibrations fault frequencies…………….. 64
6.24 Motor A 9th group of axial vibrations fault frequencies…………….. 65
6.25 Motor B 4th group of axial vibrations fault frequencies…………….. 66
6.26 Motor B 5th group of axial vibrations fault frequencies…………….. 67
6.27 Motor A shaft voltage at 50 Hz (1st harmonic)………………………. 69
6.28 Motor A shaft voltage at 150 Hz (3rd harmonic)…………………….. 69
6.29 Motor A shaft voltage at 250 Hz (5th harmonic)…………………….. 70
6.30 Motor A shaft voltage at 350 Hz (7th harmonic)……………….……. 70
6.31 Motor A shaft voltage at 450 Hz (9th harmonic)…………………….. 71
6.32 Motor A shaft voltage at 1050 Hz (21st harmonic)………………….. 71
6.33 Motor A shaft voltage at 1350 Hz (27th harmonic)………………….. 72
6.34 Motor A shaft voltage at 1950 Hz (39th harmonic)………………….. 72
6.35 Motor A shaft voltage at 2250 Hz (45th harmonic)………………….. 73
6.36 Motor A shaft voltage at 2850 Hz (57th harmonic)………………….. 73
6.37 Normalised shaft voltage for Motor A at different frequencies……. 74
6.38 Motor B shaft voltage at 150 Hz (3rd harmonic)…………………..…. 75
6.39 Motor B shaft voltage at 450 Hz (9th harmonic) …………………….. 75
6.40 (a) and (b): Stator current at different motor loads………………….. 76
6.41 (a) and (b): Stator current for Motor A at different loads……………. 77
6.42 (a) and (b): Axial vibrations at different motor loads………………… 77
6.43 (a) and (b): Shaft voltage at different motor loads…………………… 78
xi
A.1 XY and RZ geometric model planes…………………………………. 85
A.2 Flow diagram of creating and solving a Maxwell 2D Model………. 87
E.1 CSMeter………………………………………………………………… 99
E.2 CSI2130 Machine Health Analyser………………………………….. 101
E.3 Current Clamps………………………………………………………… 102
E.4 Flux Coil………………………………………………………………… 102
xii
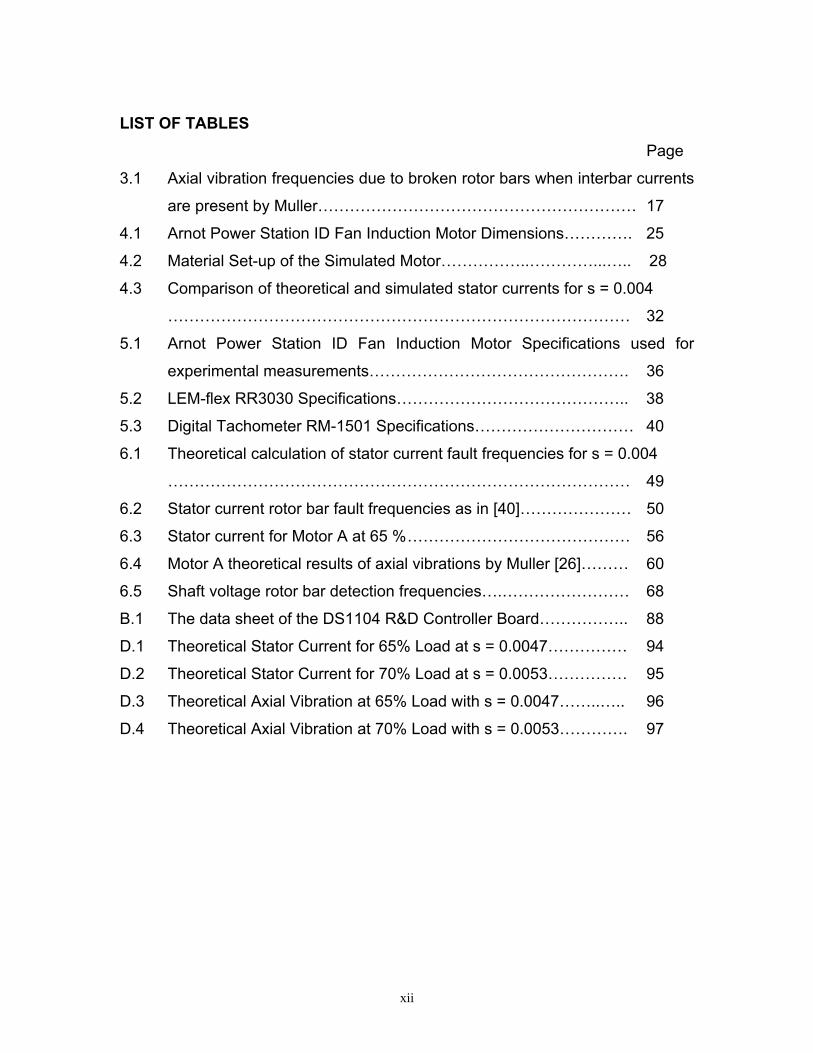
LIST OF TABLES Page
3.1 Axial vibration frequencies due to broken rotor bars when interbar currents
are present by Muller…………………………………………………… 17
4.1 Arnot Power Station ID Fan Induction Motor Dimensions…………. 25
4.2 Material Set-up of the Simulated Motor……………..…………...….. 28
4.3 Comparison of theoretical and simulated stator currents for s = 0.004
…………………………………………………………………………… 32
5.1 Arnot Power Station ID Fan Induction Motor Specifications used for
experimental measurements…………………………………………. 36
5.2 LEM-flex RR3030 Specifications…………………………………….. 38
5.3 Digital Tachometer RM-1501 Specifications………………………… 40
6.1 Theoretical calculation of stator current fault frequencies for s = 0.004
…………………………………………………………………………… 49
6.2 Stator current rotor bar fault frequencies as in [40]………………… 50
6.3 Stator current for Motor A at 65 % …………………………………… 56
6.4 Motor A theoretical results of axial vibrations by Muller [26]……… 60
6.5 Shaft voltage rotor bar detection frequencies….…………………… 68
B.1 The data sheet of the DS1104 R&D Controller Board…………….. 88
D.1 Theoretical Stator Current for 65% Load at s = 0.0047…………… 94
D.2 Theoretical Stator Current for 70% Load at s = 0.0053…………… 95
D.3 Theoretical Axial Vibration at 65% Load with s = 0.0047……..….. 96
D.4 Theoretical Axial Vibration at 70% Load with s = 0.0053…………. 97
xiii
LIST OF SYMBOLS
Arnot Arnot Power Station is one of the Eskom: Generation: Power
Station built in 1956 and situated in Middelburg, Mpumalanga.
B flux density along a conductor
EMF electromagnetic field
EPRI Electric Power Research Institute
ESKOM a major Electric Power Utility Corporation in South Africa
f supply frequency ≈ fundamental frequency ≈ line frequency
fsb frequencies of sidebands due to broken rotor bars
flsb lower sideband frequency
fusb upper sideband frequency
fb pole pass frequency
fslip slip frequency
Ib(x) bar current distribution along the length bar
Ic total interbar current flowing into the core
In current in a healthy bar
It total current flowing in the broken bar and two adjacent bars
k 1,2,3…n
l length of the core
Majuba Majuba Power Station is one of the Eskom: Generation: Power
Station built during 2003 and situated in Volksrust, Mpumalanga.
MCSA Motor Current Signature Analysis
MMF magnetomotive force
n estimate of the number of broken bars
N average dB difference between the upper and lower sidebands and
the supply component.
OEM Original Equipment Manufacturer
p pole-pairs
qa flux density harmonic in electrical measure
xiv
qb interbar current harmonic in electrical measure
s slip frequency
R number of rotor slots
VA(x) differential voltage drops along healthy bar
VB(x) differential voltage drops along broken bar
X axial position along the rotor core from healthy side
Zb bar impedance
Zc interbar impedance
1
CHAPTER 1
INTRODUCTION
Electric motors play a pivotal role in various industrial plant processes for
electrical to mechanical energy conversion. Industrial medium voltage electric
motor applications mainly include driving pumps, conveyors, fans, mills and
compressors. The induction motor is the most commonly used motor type of its
strength, reliability, relatively high efficiency and lower maintenance demand.
An induction motor comprises of two essential components, a stator and a rotor.
This research focuses on the rotor component of an induction motor. The rotor is
composed of thin-slotted, highly permeable steel laminations that are pressed
onto a shaft. There are two types of rotors: a squirrel cage rotor and a wound
rotor but this research focuses on a squirrel cage rotor because of its
construction. The squirrel cage rotor has conductors in the form of bars in the
rotor slots and the bars are shorted together at each end of the rotor by an end
ring to which the conductors are attached.
In an induction motor, the rotor rotates at a speed lower than the synchronous
speed of the revolving field. The difference between the rotor speed and the
synchronous speed is called the slip speed. The slip speed is commonly
expressed in terms of slip, which is a ratio of the slip speed to the synchronous
speed. The slip plays an important role in the diagnosis of faults in an induction
motor, as it will be indicated in the analysis of results in this research.
Each motor is designed for a specific lifespan. Any failure during the stipulated
lifespan has high financial implications in terms of loss of production and the cost
of repairs. In an industry like Eskom, from which this research was initiated,
medium voltage induction motors are mostly used in power generating stations
and form the core of generating plant processes. Failure of some motors,
2
namely induced draught fan, forced draught fan and boiler feed pump motors
lead to loss of power generation. Other motors, which are mill, primary air fan
and ash pump motors operate on a redundant basis where one motor is on
standby during normal operation but failure of more than one motor in the same
generating unit can lead to loss of power generation. With Eskom presently,
especially during winter seasons, experiencing high demand resulting in power
shortages, generating plants reliability and availability is of utmost importance.
Reliability and availability of plant electric motors can be achieved by early
detection of any developing fault by performing condition monitoring and
preventative maintenance on motors. An important motor failure mode, which
has been quite challenging to detect, is cracking and subsequently breaking of
rotor bars in induction motors. Haji and Toliyat [10] state that broken rotor bar
and end ring faults (rotor failures) account for 5-10% of the induction motor
failures.
The existing condition monitoring techniques are unable to positively detect a
cracked or single bar problem during operating conditions and bars have broken,
subsequently lifting out of the rotor slots and damaging all stator coils. This
forces the removal of the motor during plant operation and a complete rewind of
the stator.
This research was conducted to ascertain from existing conventional techniques,
an optimal technique for the detection of a cracked rotor bar or a completely
broken single rotor bar in induction motors under operating conditions.
Furthermore, it explores non-conventional techniques and highlights broken rotor
bar condition monitoring guidelines which can assist in performing
measurements in industries.
In addition, this research addresses the following questions raised in [1]:
• What equipment exists to detect broken rotor bars?
3
• Can the technique detect a cracked and one broken rotor bar on-line and
immediately or periodic non-intrusive assessments are required?
1.1 Rotor Bar Failure Mechanisms
The frequent starting of a motor places the heaviest stress on the rotor bars
because bars are carrying the highest current since the rotor is running at much
lower than synchronous speed. The high currents cause heating and expansion
of the bars relative to the rotor itself, and differences in electrical resistance of the
individual bars result in uneven heating and uneven expansion. This leads to
cracking of the joints where bars are joined to the short ring. This rotor bar
failure phenomenon is called cyclic thermal stressing. Also, when the rotor is
heated, the endring expands at a faster rate than the rotor core, creating
additional stressing of the joint [27].
In addition the causes of bar cracks or breaks can be attributed to following
reasons as indicated by Müller and Landy [26 - 27]:
• Bars in the region between the core and endring are exposed to large
accelerating and decelerating forces. These centrifugal forces place
excessive stress on the bars in the unsupported region – causing fatigue in
the joint between the bar and the endring.
• When the motor is started, the current migrates to the top of the bar due to
skin effect. This current migration creates temperature gradient over the
depth of the bar because the top of the bar heats faster than the bottom of the
bar. This uneven expansion stresses the joints at the endrings, and can
cause the bar to separate from the endring.
• Manufacturing defects are a cause of broken rotor bars. Poor brazing of the
bat onto the endring results in a weak joint. A weak joint along with the
heating of the bar and large centrifugal forces can result in a cracked bar. A
further cause of broken rotor bars due to manufacturing defects is loose rotor
4
bars. Rotor bars that are loose in the rotor core also place excessive stress
on the endring joint.
1.2 Structure of the Research Report
Chapter 2 highlights previous researches conducted on detection of broken rotor
bars which has assisted in better understanding of the existence of interbar
currents and axial forces, factors influencing early detection of broken rotor bars
and development of broken rotor bar detection techniques.
Chapter 3 discusses the literature and analysis of different broken rotor bar
detection techniques. These detection phenomena originated from the
researches presented in Chapter 2. The broken rotor bars identifying
frequencies in each technique are presented.
Chapter 4 presents modelling of a broken rotor bar simulation using Maxwell 2D.
The simulation was performed to investigate the induction motor stator current
that is how the sidebands change in a single broken bar rotor with respect to a
healthy rotor.
Chapter 5 discusses the experimental work conducted to validate the literature
and practical implementation of the techniques. This chapter explains the
measuring process and the set up of the equipment used in the experimental
work, capturing and analysis of data.
Chapter 6 presents the experimental results from the industrial tests performed
on the research with discussions of measurements taken. Finally, Chapter 7
presents the conclusion and recommendations on the effective technique on
detection of broken rotor bars during operation.

5
The author hopes that the research report recommendations assist in early
detection of a cracked and a single broken rotor bar on-line during operation
without intrusion to the motor.
6
CHAPTER 2
BACKGROUND ON DETECTION OF BROKEN ROTOR BARS
A lot of research work and case studies have been performed and are still being
performed on detection of broken rotor bars but the main problems seem to be
analysis of the measurements and correct diagnosis especially for a cracked and
one broken rotor bar. It is important to note that most techniques seem to detect
broken rotor bars when many of the rotor bars have already broken, this is not
effective as the damage is quite severe at that stage.
2.1 The Interbar Currents Phenomenon Kerszenbaum [14, 15, 16] together with Landy introduced the concept that in an
induction motor with rotor bars not insulated to the rotor core, interbar currents
exist when there is a broken rotor bar. In the research, the following
assumptions were made:
• The laminar currents flow only between the broken bar and the two
immediately adjacent bars. (This assumption is valid when the endring
impedance represents only a small part of the total secondary impedance, as
is usually the case with large machines).
• The voltages induced in the three bars (broken bar and adjacent bars) are
equal in magnitude and are in phase with one another. (This is valid when the
number of rotor slots per pole is relatively high).
• The interbar impedance is mostly resistive at the frequencies dealt with. (This
fact was verified by measurement).
• The end ring impedance between the bars is negligible.
• The portion of the bars between the end ring and the core is disregarded.
Kerszenbaum developed a term which describes the distribution of currents in an
induction motor having a broken bar and experimentally showed that the
7
magnitude of the current flowing into the broken bar and the magnitude of the
interbar currents varies with the slip. The theory was later expanded by Muller
[26] who derived an equation for the interbar current density entering the rotor
core. The derivation of the equations is discussed in details in Chapter 3.
2.2 Factor Influencing the Detection of Broken Rotor Bars
The early detection of broken rotor bars is mainly affected by the rotor and stator
geometrical nonuniformities or asymmetries. Kliman et.al. [19] named these
asymmetries as rotor quality, cage misalignment, variation of cage conductivity,
bearing misalignment and magnetic orientation of the laminations. These
asymmetries may create airgap disturbances which, as far as its fundamental
field is concerned, cannot be distinguished from the broken bar effects. By
investigating the airgap flux Kliman et. al. [19] showed that the magnitude of the
line frequency sidebands due to asymmetries might be comparable to or larger
than those due to broken rotor bar in the same motor. But the magnitudes of the
asymmetry components decay much more rapidly in higher harmonics, than
those of broken rotor bar.
Walliser [40] under the supervision of Landy undertook a research to investigate
factors influencing detection of broken rotor bars. Walliser revisited the work
done by Kliman et. al. [19] by showing the influences of the stator winding layout,
the presence of other rotor asymmetries, the rotor inertia, and lastly the presence
of interbar currents.
As it is not possible to measure the rotor bar current during operation, the fault
measurements are taken from the stator winding. The fields produced by the
fault will result in a flux linking with the stator windings, which will induce an EMF
and consequently current in the stator winding. The layout of the stator windings
will cancel the response to certain harmonic components that would normally
exist in the airgap of the machine due to the fault. The magnitudes of the
8
harmonics that are able to induce currents in the stator are also modified by the
stator structure.
Walliser [40] stated that due to short chording in the stator winding, which is done
to reduce harmonic effects, the EMF the fault harmonics can induce in the stator
can be reduce by a factor, known as the chording factor. Also the distribution of
coils in one phase of the stator winding will result in the EMF, the fault harmonics
can induce, requiring to be multiplied by a factor, called the distribution factor.
Lastly, the other factor is the harmonic differential leakage coefficient. This is
due to the fact that each harmonic voltage induced into the stator by the fault
field, produces in turn its own set of harmonics. These harmonics act as an extra
reactance to the induced current, and will thus reduce its magnitude.
The influence of the presence of interbar was demonstrated in [40] by testing an
induction motor with a healthy cage, one broken uninsulated bar (interbar
currents flow) and insulated bar (no interbar currents). Theoretically and
experimentally, it was shown that interbar currents reduce the magnetic
imbalance brought by a broken rotor bar and consequently the sidebands
produced in the stator current spectrum. This then makes early detection of
broken rotor bars more difficult especially if monitoring sidebands around the
fundamental as sidebands may be reduced to levels due to other factors.
Kliman et. al. [19] then later Walliser [40] after further examination of the above
mentioned factors recommended monitoring higher harmonic amplitudes
asymmetries in the spectrum in conjunction with the sidebands around the
fundamental, for correct diagnosis or early detection of broken rotor bar in a
motor.
Another factor influencing the early detection broken rotor bars is the lack
knowledge, by condition monitoring personnel on industrial plants, where
9
induction motors are being operated, on detection of broken rotor bars. The
following questions were raised in Eskom [1]:
(i) What techniques and equipment exist to detect broken rotor bars on-line?
(ii) How to perform the rotor bar detection techniques i.e. where to measure
to get optimum results?
(iii) What indicates a broken bar on any techniques’ spectrum?
(iv) How often to perform broken rotor bar condition monitoring?
These questions prompted and are the basis of this research. The research tries
to bridge the gap between researched detection techniques and utilization of
these techniques in industrial plants. The author hopes all the research questions
are answered and the gap will be bridge by this research.
2.3 Axial Vibration Monitoring After realising that Kerszenbaum [15] and Hop [11] could not explain the origin of
the axial vibrations that existed in a motor with broken rotor bars, Muller [26]
under the supervision of Landy undertook a research to identify the origin of the
axial forces. Mullers’ research showed that interbar currents in the rotor do in
fact produce an axial force at specific frequencies. The theory was verified by
experimental measurements on several different motors and with this
consolidated the technique of measuring these frequencies in the axial vibration
as a reliable method to detect broken rotor bars.
The expressions for these axial vibration frequencies are discussed in Chapter 3.
2.4 Thermal Consideration due to Interbar Currents One of the major factors which cause rotor bar failures is thermal stress but
before Zachas [42] very little research work had been done to examine the
effects or existence of heating in a motor with a broken rotor bar especially when
10
interbar currents are present. Zachas investigated the relationship between
interbar currents and the thermal effects that might occur as a result of these
currents.
Zachas derived calculations and developed models to predict the temperature
distribution for various conditions a motor will be subjected to. Through
experiments, a good correlation between heating and interbar currents was
achieved and a conclusion was made. The conclusion drawn was that the
heating follows the same distribution as the interbar currents and is concentrated
at the unhealthy side of the broken rotor bar.
2.5 Other Research Work and Case Studies
EPRI [48] initiated research projects to study motor problems and how they can
be detected, which provided intelligence that contributes to motor condition
monitoring and a predictive maintenance strategy. One aspect of the research
projects was detection of broken rotor bars with one rotor bar cut by 50%, same
bar cut 100%, a second bar, located 180º degrees from the first bar, cut 100%,
and lastly two additional bars were cut 100%. The two additional bars were
located adjacent to the original cut bar, making four total bars cut. Each motor
was run at 0%, 50%, and 100% and back down to 50% of rated load.
The tests performed or data collected on each motor were vibration data, motor
current signature analysis data, power signature data and flux data which were
done on-line at each of the data points with the motor circuit analysis data being
collected off-line.
The EPRI research project results were analysed by each utility analyst for their
respective equipment and also by the equipment vendors. A vendor and utility
analyst was given a copy of only their data, without any information about the
specific fault that were induced in each motor. The results, recommendations
11
and conclusions of the research project may be examined by obtaining Electric
Motor Predictive Maintenance Program, TR-108773-V2 Final Report [48] but it
must be highlighted that the research findings show that it is possible to perform
early detection of broken rotor bars.
McCully and Landy [22] evaluated the on-line condition monitoring techniques for
detecting broken rotor bars, by evaluating both current and vibration signals and
taking cognisance of interbar currents. The conclusion on the evaluation was
that measurement of both current and vibration signals taking cognisance of
interbar currents can provide an accurate diagnosis of the condition of the bars in
large squirrel cage induction machines.
Thomson and Fenger in [38, 39] discuss the development of a tool to detect
faults in an induction motor using current signature analysis. Furthermore, using
the developed tool performs case studies by performing current analysis on
different motors. The tool was developed to include the following crucial
features:
• Unambiguous diagnosis of a fault over a range of motor faults.
• Correct estimation of the slip for any given load conditions for a range of
motor designs and power ratings.
• Clear discrimination between unique current signature patterns caused by a
fault and any current components induced due to normal characteristics of the
drive system.
• Current components caused by the effect of mechanical load must be reliably
diagnosed since they can be misinterpreted as components from broken rotor
bar.
• The goal is to eliminate the need for an expert to interpret the acquired data
by applying reliable, advanced diagnostic algorithms to the spectra.
12
The tool developed in the research by Thomson and Fenger is the CSI Meter.
The CSI Meter was used in the research and more detailed specifications are
included in Appendix E.
13
CHAPTER 3 BROKEN ROTOR BARS DETECTION TECHNIQUES
3.1 Interbar Currents
As soon as a crack develops, the resistance of that bar increases, increasing its
heating, and consequently worsening the crack. At the same time, the adjacent
bars experience increased currents because of the reduced current in the
cracked or broken bar.
Kerszenbaum and Landy [14, 15, and 16] proved that interbar currents exist
when a rotor bar is broken in large copper bar squirrel cage induction motors with
uninsulated rotor bars. Interbar currents can flow in the laminated core,
perpendicular to the bars.
14
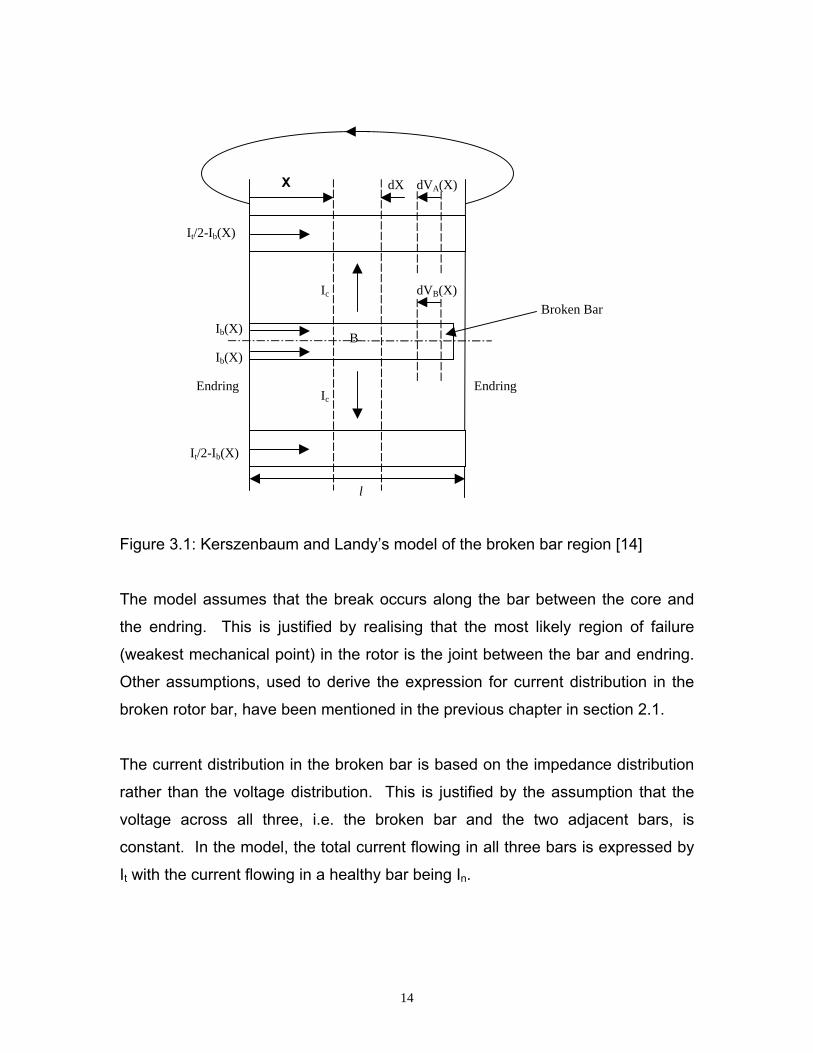
Figure 3.1: Kerszenbaum and Landy’s model of the broken bar region [14]
The model assumes that the break occurs along the bar between the core and
the endring. This is justified by realising that the most likely region of failure
(weakest mechanical point) in the rotor is the joint between the bar and endring.
Other assumptions, used to derive the expression for current distribution in the
broken rotor bar, have been mentioned in the previous chapter in section 2.1.
The current distribution in the broken bar is based on the impedance distribution
rather than the voltage distribution. This is justified by the assumption that the
voltage across all three, i.e. the broken bar and the two adjacent bars, is
constant. In the model, the total current flowing in all three bars is expressed by
It with the current flowing in a healthy bar being In.
X
Broken Bar
Endring
l
B
Ic
Ic
It/2-Ib(X)
Endring
Ib(X)
It/2-Ib(X)
Ib(X)
dVA(X)
dVB(X)
dX
15
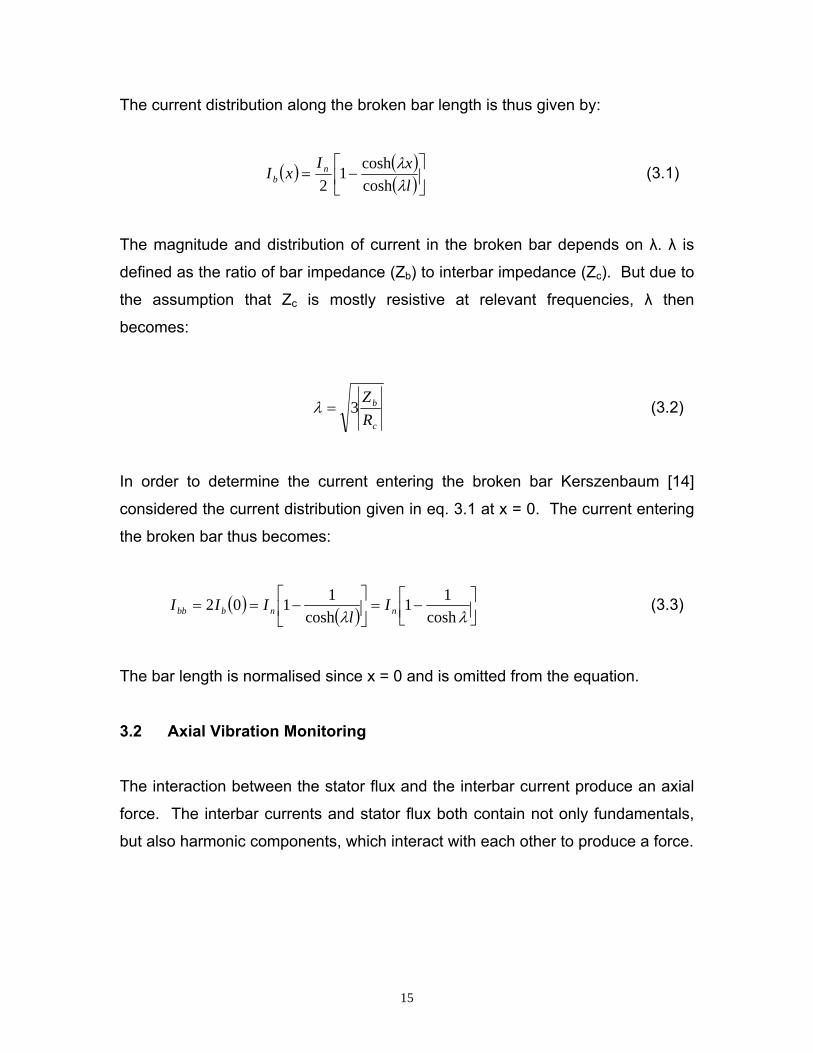
The current distribution along the broken bar length is thus given by:
( ) ( )( )⎥⎦
⎤⎢⎣
⎡−=
lxI
xI nb λ
λcoshcosh1
2 (3.1)
The magnitude and distribution of current in the broken bar depends on λ. λ is
defined as the ratio of bar impedance (Zb) to interbar impedance (Zc). But due to
the assumption that Zc is mostly resistive at relevant frequencies, λ then
becomes:
c
b
RZ
3=λ (3.2)
In order to determine the current entering the broken bar Kerszenbaum [14]
considered the current distribution given in eq. 3.1 at x = 0. The current entering
the broken bar thus becomes:
( ) ( ) ⎥⎦⎤
⎢⎣⎡ −=⎥
⎦
⎤⎢⎣
⎡−==
λλ cosh11
cosh1102 nnbbb I
lIII (3.3)
The bar length is normalised since x = 0 and is omitted from the equation.
3.2 Axial Vibration Monitoring
The interaction between the stator flux and the interbar current produce an axial
force. The interbar currents and stator flux both contain not only fundamentals,
but also harmonic components, which interact with each other to produce a force.
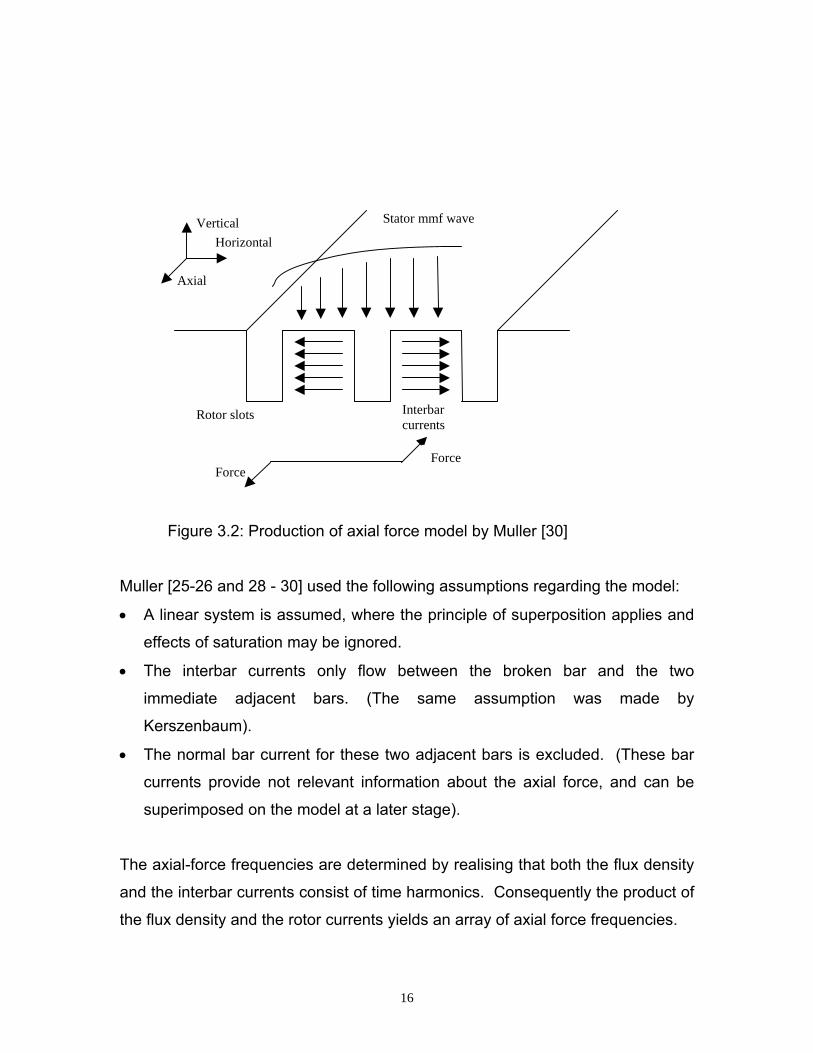
16
Figure 3.2: Production of axial force model by Muller [30]
Muller [25-26 and 28 - 30] used the following assumptions regarding the model:
• A linear system is assumed, where the principle of superposition applies and
effects of saturation may be ignored.
• The interbar currents only flow between the broken bar and the two
immediate adjacent bars. (The same assumption was made by
Kerszenbaum).
• The normal bar current for these two adjacent bars is excluded. (These bar
currents provide not relevant information about the axial force, and can be
superimposed on the model at a later stage).
The axial-force frequencies are determined by realising that both the flux density
and the interbar currents consist of time harmonics. Consequently the product of
the flux density and the rotor currents yields an array of axial force frequencies.
Rotor slots
Force
VerticalHorizontal
Axial
Stator mmf wave
Interbarcurrents
Force
17
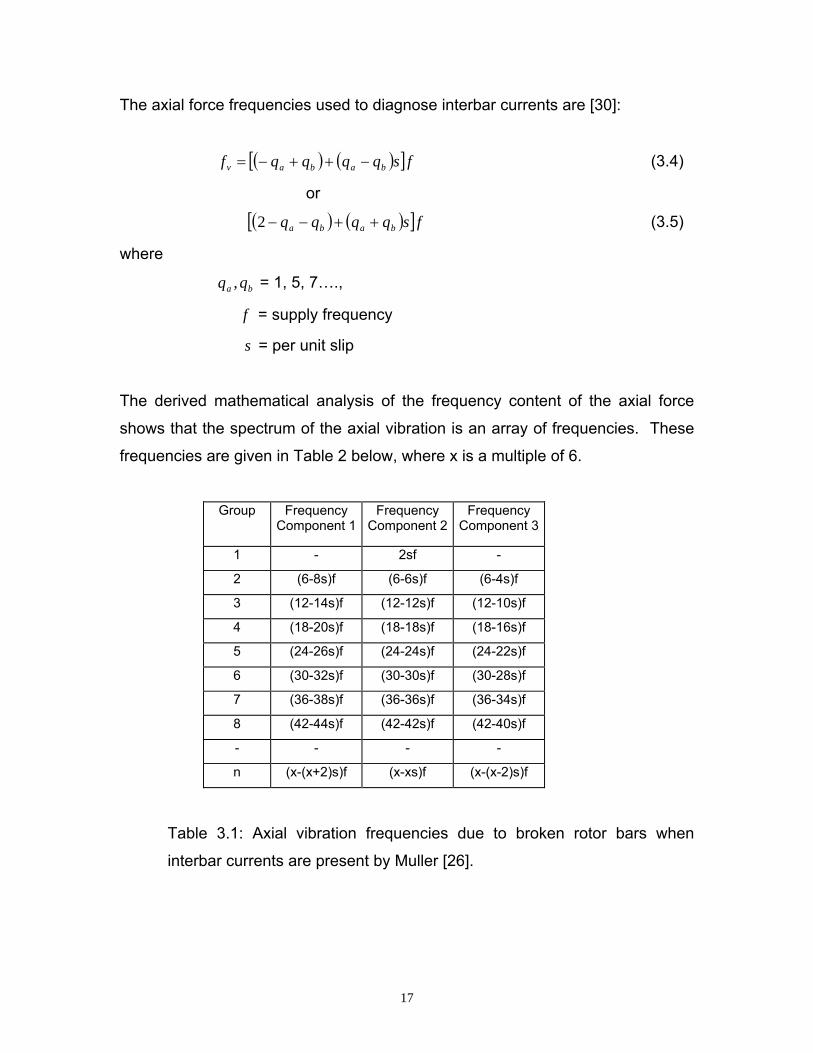
The axial force frequencies used to diagnose interbar currents are [30]:
( ) ( )[ ] fsqqqqf babav −++−= (3.4)
or
( ) ( )[ ] fsqqqq baba ++−−2 (3.5)
where
ba qq , = 1, 5, 7….,
f = supply frequency
s = per unit slip
The derived mathematical analysis of the frequency content of the axial force
shows that the spectrum of the axial vibration is an array of frequencies. These
frequencies are given in Table 2 below, where x is a multiple of 6.
Group Frequency
Component 1Frequency
Component 2Frequency
Component 3
1 - 2sf -
2 (6-8s)f (6-6s)f (6-4s)f
3 (12-14s)f (12-12s)f (12-10s)f
4 (18-20s)f (18-18s)f (18-16s)f
5 (24-26s)f (24-24s)f (24-22s)f
6 (30-32s)f (30-30s)f (30-28s)f
7 (36-38s)f (36-36s)f (36-34s)f
8 (42-44s)f (42-42s)f (42-40s)f
- - - -
n (x-(x+2)s)f (x-xs)f (x-(x-2)s)f
Table 3.1: Axial vibration frequencies due to broken rotor bars when
interbar currents are present by Muller [26].
18
3.3 Stator Current Monitoring
The stator current monitoring is the most commonly used method for detection of
broken rotor bars. McCully and Landy in [22] explained why the stator winding is
monitored. The positive-sequence supply voltage applied to the stator winding
produces current in the stator winding. This stator phase current produces space
harmonic fields in the airgap of an induction machine, which consist of either
backward or forward rotating components.
Each of these space harmonic fields induces current components into the copper
bars of the squirrel cage rotor. In turn, each of these rotor current components
produces field components back into the airgap of the machine. These rotor
produced fields induce current components back into the stator winding. Then
depending on the condition of the rotor the following will occur:
• If the rotor of the machine is symmetrical (without any rotor fault), the forward
rotating components will add and the backward components will sum to zero.
• However, if the rotor of the machine is asymmetrical (with a rotor fault), the
backward rotating field components do not sum to zero. These backward
rotating components produce sidebands around all the rotor produced current
components in the stator winding.
The rotor produced fields’ current components that are induced in the stator
winding at frequencies given by:
( )sff sb 21±= (3.6)
Kliman [19], Thomson [39], Elkasabgy [9] and Filipetti [3] used eq. 3.6 to analyse
the motor supply current to detect broken bar faults. Their investigations
involved investigating sideband components around the fundamental for
19
detecting broken bars. The lower sideband frequency component lsbf is
specifically due to the broken bar and the upper sideband frequency component
usbf is due to the consequent speed oscillation.
( )sff lsb 21−= (3.7)
and
( )sffusb 21+= (3.8)
Filipetti et. al. in [3] showed that broken bars actually give rise to a sequence of
such sidebands given by:
( )ksff sb 21±= (3.9)
where k = 1, 2, 3,.…
Kliman et.al. [19] expressed the frequencies that are present in the air gap flux
due to broken bar faults and that can be observed in the stator current as:
( ) ⎥⎦
⎤⎢⎣
⎡±−⎟⎟
⎠
⎞⎜⎜⎝
⎛= ss
pkff sb 1 (3.10)
where
pk = 1, 3, 5…,
These are the high frequencies, which should be observed as the fundamental
frequency may be influenced by other factors for early detection of broken rotor
bars.
Benbouzid [4] upon reviewing the motor current signature analysis for fault
detection suggested that the amplitude of the left sideband frequency component
is proportional to the number of broken rotor bars. Then approximated the
amplitude brbI of frequency component ( )sff lsb 21−= by:

20
( )απα−
≅22sin
pII
s
brb (3.11)
where sI = stator current fundamental frequency component
R
pRbπα
2= (3.12)
R = number of healthy rotor bars bR = number of broken rotor bars
Thomson et.al. [38] when developing the tool for detection of broken rotor bars
used the equation of the estimation of the number of broken rotors (broken bar
factor) as follows:
p
Rn N
+=
2010
2 (3.13)
where
n = estimate of the number of broken rotor bars
R = number of rotor slots
N = average dB difference between the upper and lower sidebands and
the supply component
p = number of pole pairs
Walliser [40] then later Muller [26], with Landy highlighted that the fault
frequencies in the stator current spectrum can also be calculated by:
sfqnf rs ±= 1 (3.14)
where rn = rotational speed of the rotor in rev./sec.
1q = harmonic in mechanical measure
The stator slot harmonics are calculated according to pSq ±= 11 (3.16)
where
21
1S = number of stator slots
p = number of pole pairs
3.4 Flux Monitoring
Kliman et.al. [19], and Tavner and Penman [37] state that axial leakage flux
occurs in all electrical machines due to the fact that no machine can be
constructed perfectly symmetrical. Kliman et.al. [19] by mounting an external
axial flux coil around the shaft of the motor, determined that the axial gap flux
frequencies that are present due to machine asymmetrices can be expressed by
eq. 6 with k = harmonic index = 1, 2, 3, …. There were two important features
noted by Kliman et. al:
• The magnitude of the line frequency sidebands due to asymmetries may be
comparable to or larger than those due to a broken rotor bar in the same
motor, and
• The magnitudes of the asymmetry components decay much more rapidly, in
the higher harmonics, than those for a broken rotor bar.
Two conclusions were drawn from the above features; the first conclusion to be
drawn is that there is real possibility that, with sensitivity sufficient to detect a
single broken rotor bar, manufacturing or other asymmetries may give rise to a
false broken bar indication. The second conclusion that may be drawn is that by
examination of the higher harmonic amplitudes asymmetries may be
distinguished from broken bars, hence the development of eq. 10 to monitor
these higher harmonic asymmetries.
Milimonfared et. al. [13] stated that the reaction by ( ) fs21± sideband harmonics
of the stator current with the rotor produces currents with the frequency of sf3 .
22
As a result of rotor asymmetry, the stator currents contain harmonic components
of by ( ) fks±1 and the rotor currents contain harmonic components
of ..)5,3,1( =± kksf . These harmonic components are the sources of MMF
harmonics and, consequently the flux harmonics in the motor structure. Under
the rotor asymmetry, these MMF harmonics produce shaft fluxes with the
harmonic components of ..)5,3,1( =± kksf .
The results in [13], after testing by inserting four search coils in a three phase six-
pole induction motor, showed the existence of sf , sf3 , sf5 and sf7 voltage
harmonics in the search coil surrounding the shaft at the faulty end due to the
rotor asymmetry.
Even though the commonly used method of broken rotor bar detection is stator
current monitoring, the stator current broken rotor bar fault frequencies can be
applied to flux monitoring. Walliser [40] holds the same opinion since in the
stator current monitoring; the stator winding acts as a coil whereas with flux
monitoring an external mounted coil can be used. Walliser suggests that the
points applicable to current monitoring technique can be applied to flux
monitoring technique.
3.5 The Effects of Load
Kilbey [17] assessed the effect of the load on detection of broken rotor bars and
concluded the following:
• The degree to which the motor is loaded affects the temperature of the motor
which in turn affects thermal expansion of cracks and breaks. Reduced load
may not produce enough heat to open cracked bars.
• Load also affects the speed of the motor. As the motor becomes more heavily
loaded, the rotational frequency slows and the slip frequency increases. The
23
greater the slip, the greater is the frequency separation that can be observed
between sideband and line frequency. The lighter the load, the larger the ratio
between line frequency amplitude and that of the sideband; especially, as
load moves below 50 percent of full load. From 50 to 100 percent load this
effect is less significant.
Schoen and Habetler [33] investigated the effects of time-varying loads on rotor
fault detection and observed that if the load torque varies with the rotor position,
the current spectral harmonics, produced by the load, contain the spectral
components, which coincide with those caused by a fault condition. Schoen and
Habetler then recommended monitoring of multiple frequency signatures and
identifying those components not obscured by the load effect. Benhouzid and
Kliman [5] expanded on this, suggesting that broken rotor bars detection is still
possible since the current typically contains higher order harmonics than those
induced by the load.
24
CHAPTER 4 MAXWELL 2D SIMULATION OF A CRACKED AND BROKEN ROTOR BAR The simulation involved analysis of a cracked and single broken rotor of the
squirrel cage induction motor using Maxwell 2D Field Simulator. Maxwell 2D
Field Simulator is an interactive software package that uses finite element
analysis to solve two-dimensional (2D) electromagnetic problems. In performing
the simulation to analyse a problem, an appropriate geometry, material
properties and excitation for a device or system of devices need to be specified.
4.1 Induction Motor Simulation Parameters This section presents quantities and parameters used in creating and solving the
induction motor for this research. A general procedure for creating and solving a
Maxwell 2D model is presented in Appendix A. The simulation was done using
guidelines in [2], especially on material, boundary and sources setup and the
setup solution.
The induction motor simulated for this research has similar characteristics as the
motors used in the industrial motor testing in Chapter 5. The physical motor
dimensions measured and used in the simulation are tabulated in Table 4.1.
25
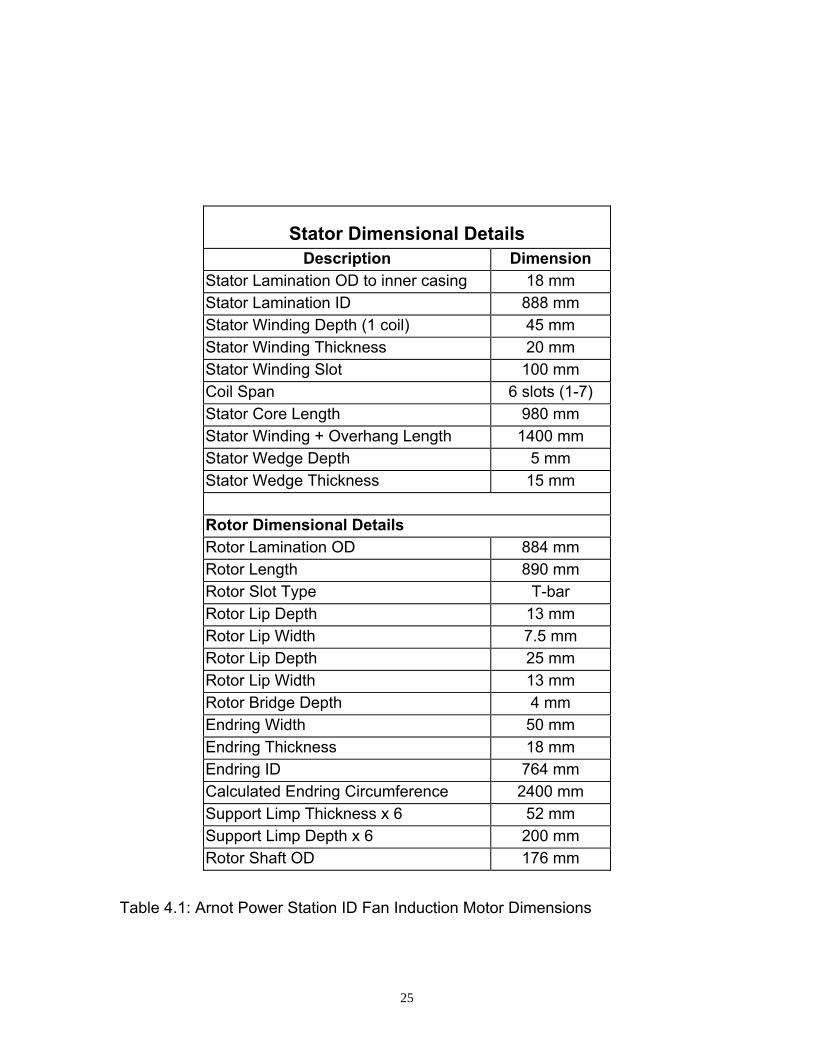
Stator Dimensional Details Description Dimension
Stator Lamination OD to inner casing 18 mm Stator Lamination ID 888 mm Stator Winding Depth (1 coil) 45 mm Stator Winding Thickness 20 mm Stator Winding Slot 100 mm Coil Span 6 slots (1-7) Stator Core Length 980 mm Stator Winding + Overhang Length 1400 mm Stator Wedge Depth 5 mm Stator Wedge Thickness 15 mm Rotor Dimensional Details Rotor Lamination OD 884 mm Rotor Length 890 mm Rotor Slot Type T-bar Rotor Lip Depth 13 mm Rotor Lip Width 7.5 mm Rotor Lip Depth 25 mm Rotor Lip Width 13 mm Rotor Bridge Depth 4 mm Endring Width 50 mm Endring Thickness 18 mm Endring ID 764 mm Calculated Endring Circumference 2400 mm Support Limp Thickness x 6 52 mm Support Limp Depth x 6 200 mm Rotor Shaft OD 176 mm
Table 4.1: Arnot Power Station ID Fan Induction Motor Dimensions
26
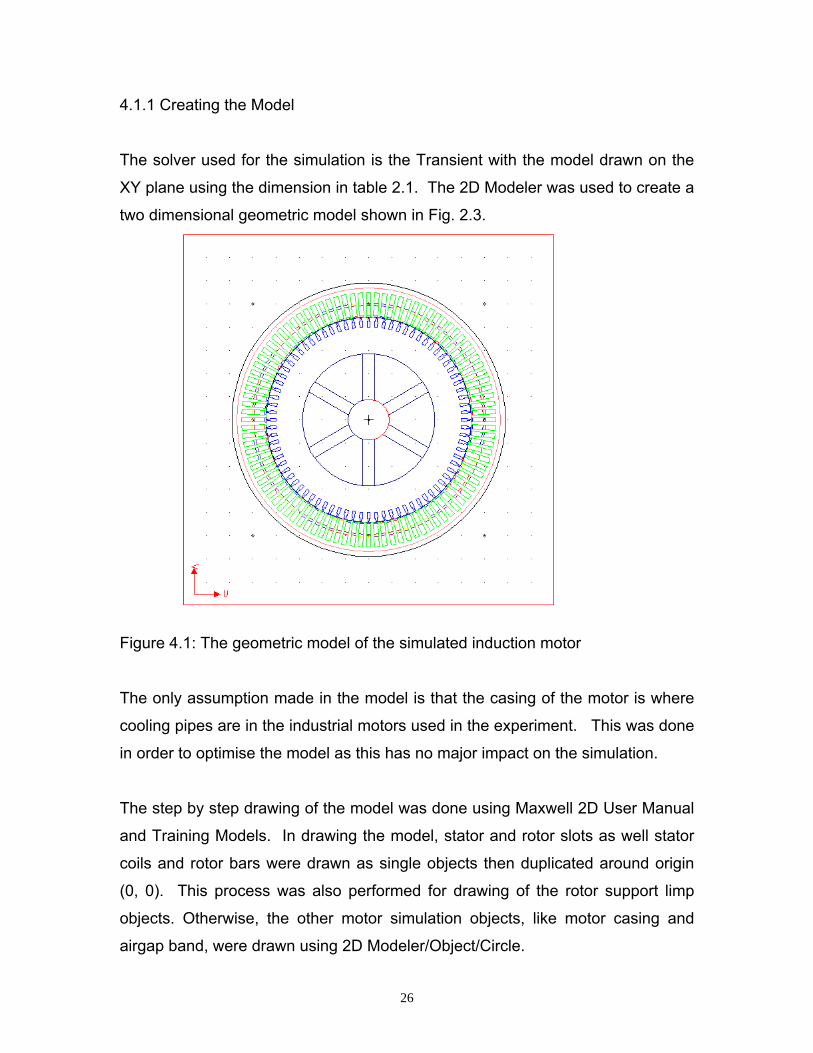
4.1.1 Creating the Model
The solver used for the simulation is the Transient with the model drawn on the
XY plane using the dimension in table 2.1. The 2D Modeler was used to create a
two dimensional geometric model shown in Fig. 2.3.
Figure 4.1: The geometric model of the simulated induction motor
The only assumption made in the model is that the casing of the motor is where
cooling pipes are in the industrial motors used in the experiment. This was done
in order to optimise the model as this has no major impact on the simulation.
The step by step drawing of the model was done using Maxwell 2D User Manual
and Training Models. In drawing the model, stator and rotor slots as well stator
coils and rotor bars were drawn as single objects then duplicated around origin
(0, 0). This process was also performed for drawing of the rotor support limp
objects. Otherwise, the other motor simulation objects, like motor casing and
airgap band, were drawn using 2D Modeler/Object/Circle.
27
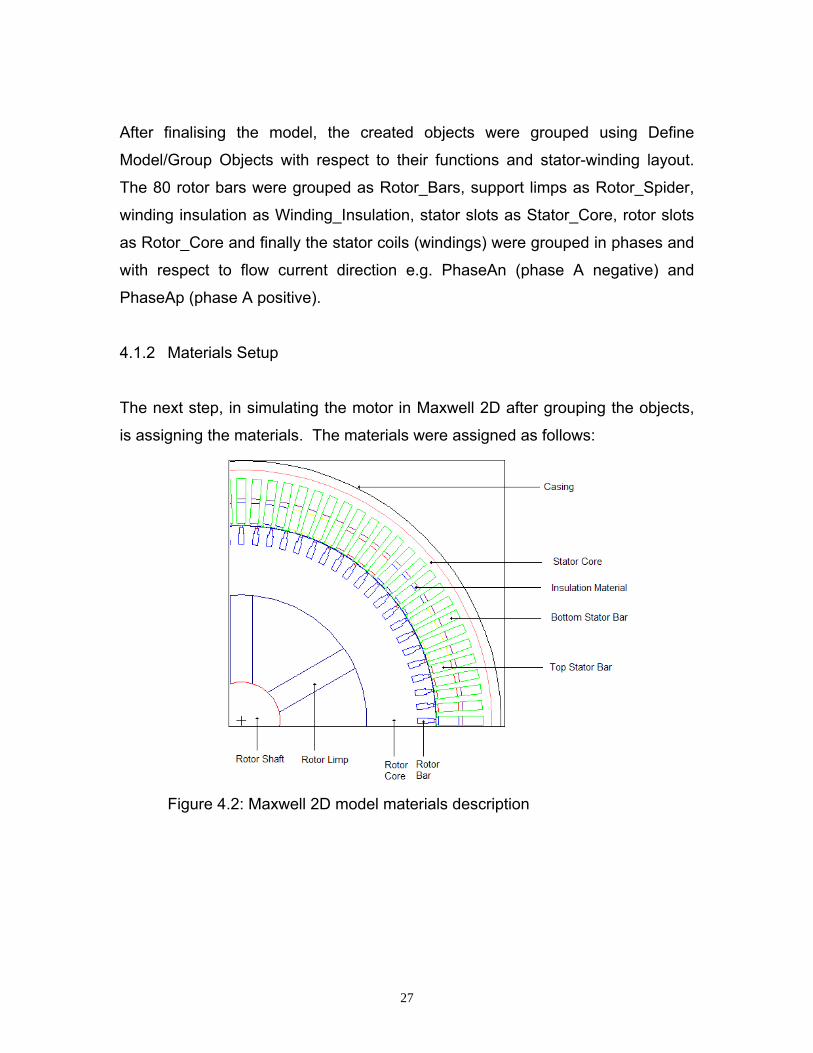
After finalising the model, the created objects were grouped using Define
Model/Group Objects with respect to their functions and stator-winding layout.
The 80 rotor bars were grouped as Rotor_Bars, support limps as Rotor_Spider,
winding insulation as Winding_Insulation, stator slots as Stator_Core, rotor slots
as Rotor_Core and finally the stator coils (windings) were grouped in phases and
with respect to flow current direction e.g. PhaseAn (phase A negative) and
PhaseAp (phase A positive).
4.1.2 Materials Setup
The next step, in simulating the motor in Maxwell 2D after grouping the objects,
is assigning the materials. The materials were assigned as follows:
Figure 4.2: Maxwell 2D model materials description
28
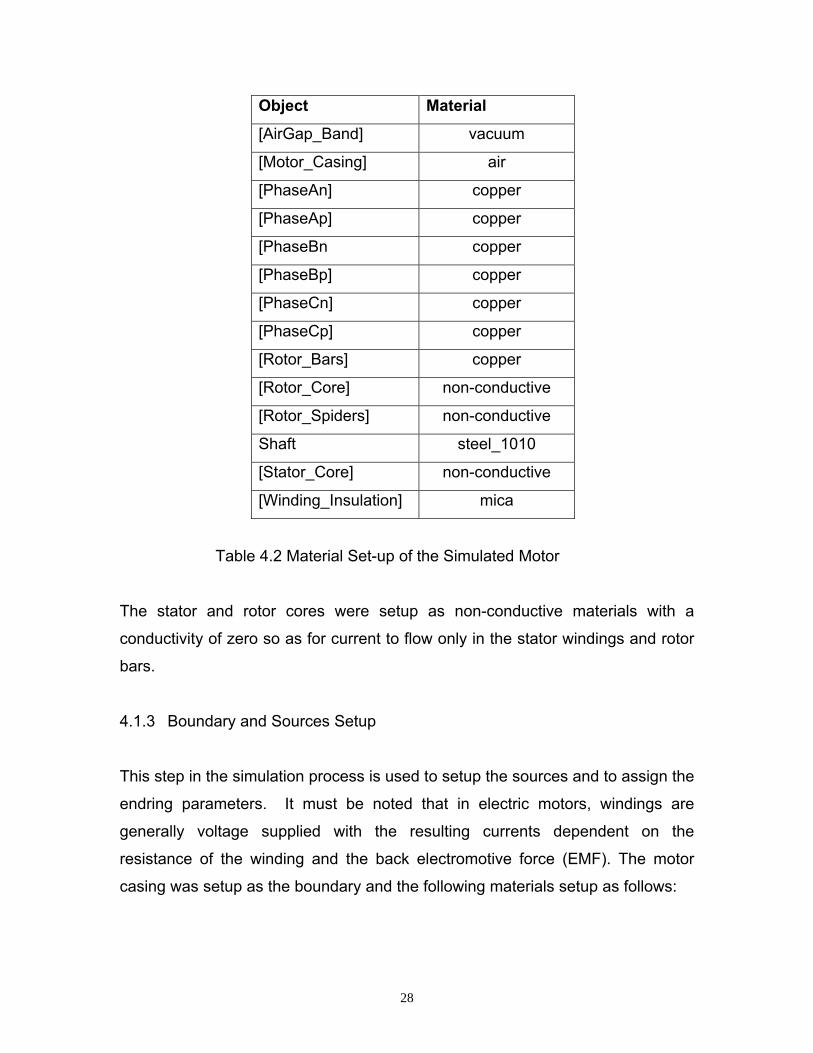
Object Material
[AirGap_Band] vacuum
[Motor_Casing] air
[PhaseAn] copper
[PhaseAp] copper
[PhaseBn copper
[PhaseBp] copper
[PhaseCn] copper
[PhaseCp] copper
[Rotor_Bars] copper
[Rotor_Core] non-conductive
[Rotor_Spiders] non-conductive
Shaft steel_1010
[Stator_Core] non-conductive
[Winding_Insulation] mica
Table 4.2 Material Set-up of the Simulated Motor
The stator and rotor cores were setup as non-conductive materials with a
conductivity of zero so as for current to flow only in the stator windings and rotor
bars.
4.1.3 Boundary and Sources Setup
This step in the simulation process is used to setup the sources and to assign the
endring parameters. It must be noted that in electric motors, windings are
generally voltage supplied with the resulting currents dependent on the
resistance of the winding and the back electromotive force (EMF). The motor
casing was setup as the boundary and the following materials setup as follows:
29
• The endring was setup as a passive end-connected conductor with 0.008
ohms in the end resistance between adjacent conductors and 0.005 henries
in the end inductance between adjacent conductors.
• The phases were assigned the voltage sources as stranded with the following
functions:
• PhaseA=3300*sqrt(2/3)*cos(2*pi*50*T)
• PhaseB=3300*sqrt(2/3)*cos(360*50*T - 120)
• PhaseC=3300*sqrt(2/3)*cos(360*50*T - 240)
The windings in each phase were assigned as positive and negative polarity
according to grouping in section 2.2.1. Furthermore, the terminal attributes
were assigned; the resistance value of 8 ohms, inductance of 0.003 henries,
200 total turns as seen from the terminal and 4 number of parallel branches.
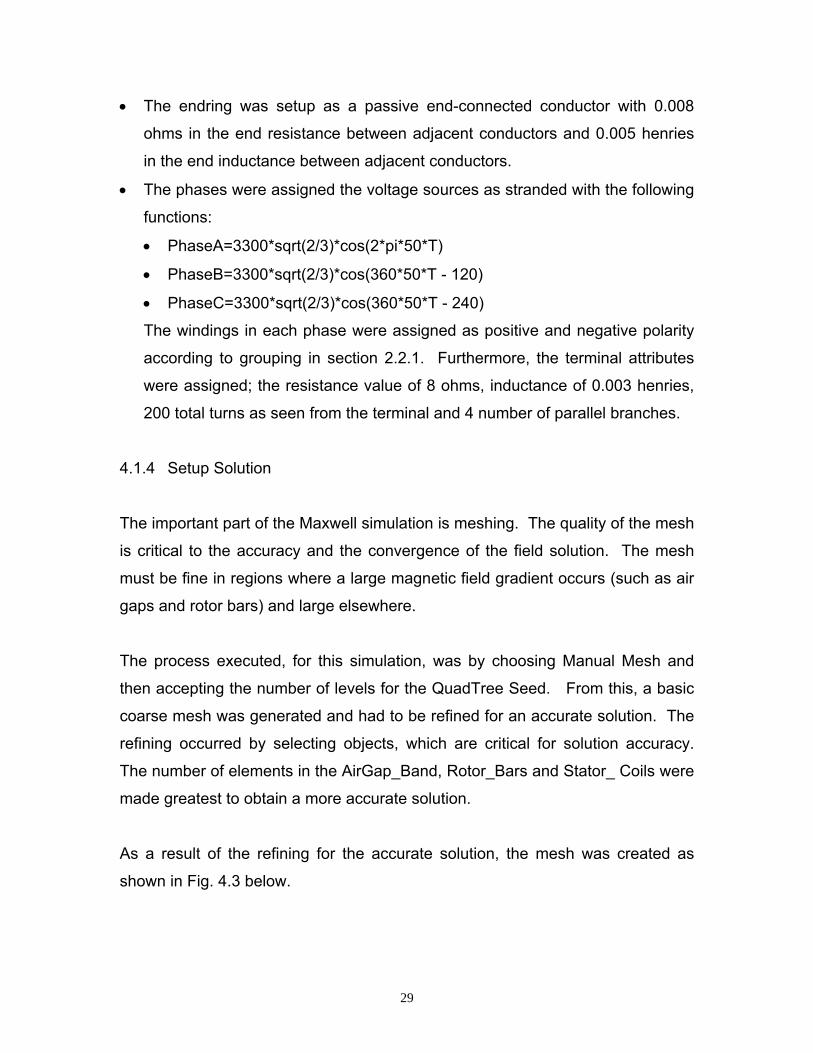
4.1.4 Setup Solution
The important part of the Maxwell simulation is meshing. The quality of the mesh
is critical to the accuracy and the convergence of the field solution. The mesh
must be fine in regions where a large magnetic field gradient occurs (such as air
gaps and rotor bars) and large elsewhere.
The process executed, for this simulation, was by choosing Manual Mesh and
then accepting the number of levels for the QuadTree Seed. From this, a basic
coarse mesh was generated and had to be refined for an accurate solution. The
refining occurred by selecting objects, which are critical for solution accuracy.
The number of elements in the AirGap_Band, Rotor_Bars and Stator_ Coils were
made greatest to obtain a more accurate solution.
As a result of the refining for the accurate solution, the mesh was created as
shown in Fig. 4.3 below.

30
Figure 4.3: Maxwell 2D simulation mesh
4.1.5 Solution Options
The ‘Time Step’ which instructs the solver to calculate the fields at each
stipulated time of the solution process, was chosen in a manner to be able to
study even high frequency harmonics as will be seen in the simulation results.
The model depth was chosen to be 980 mm which is the length of the stator
winding.
4.1.6 Motion Setup
For the motion setup a band was defined in the airgap. The band can be defined
as a moving object that contains all moving objects. Then rotation was selected
as the type of motion to be used with the set position at (0, 0) as the centre of
31
rotation. The mechanical setup of the motor was set at 747 rpm for the same
load of the motor being that was used in the experiment.
4.1.7 Signal Processing
The simulation stator current signals were then exported and processed using
Matlab to perform an FFT. The FFT function used and processing is explained in
more detail in Chapter 5 section 5.3.2.
4.2 Induction Motor Simulation Results
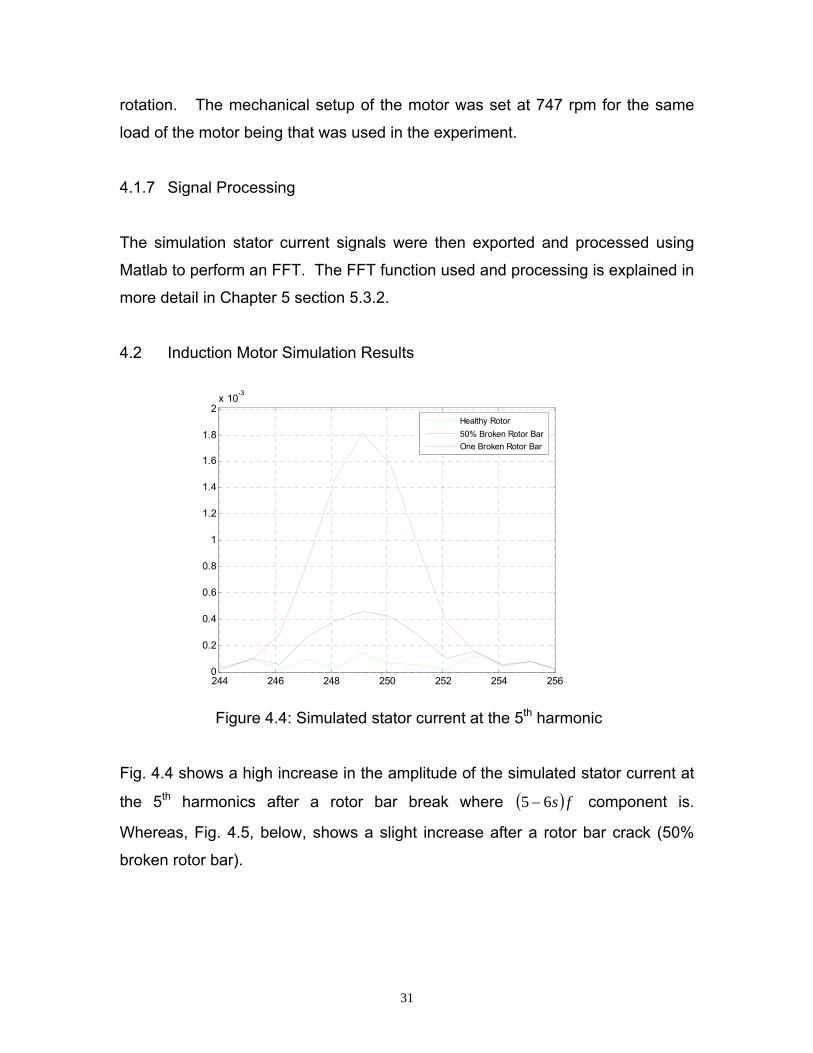
Figure 4.4: Simulated stator current at the 5th harmonic
Fig. 4.4 shows a high increase in the amplitude of the simulated stator current at
the 5th harmonics after a rotor bar break where ( ) fs65 − component is.
Whereas, Fig. 4.5, below, shows a slight increase after a rotor bar crack (50%
broken rotor bar).
244 246 248 250 252 254 2560
0.2
0.4
0.6
0.8
1
1.2
1.4
1.6
1.8
2x 10⁻³
Healthy Rotor50% Broken Rotor BarOne Broken Rotor Bar
32
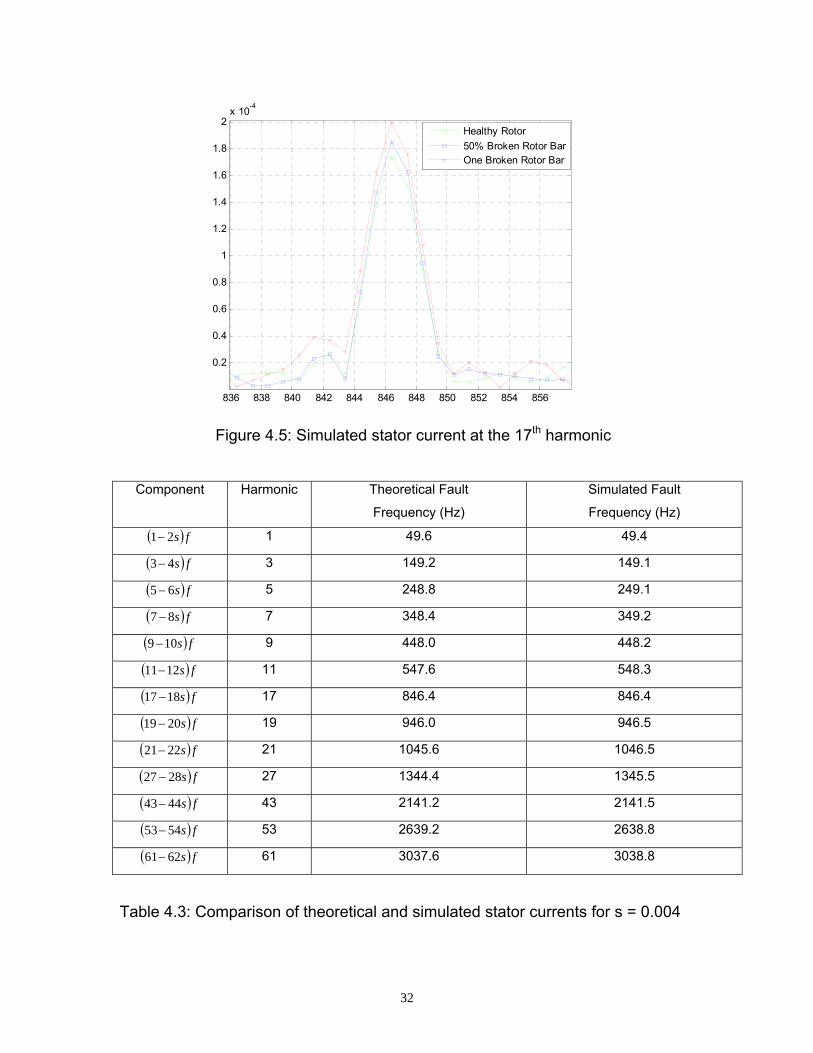
Figure 4.5: Simulated stator current at the 17th harmonic
Component Harmonic Theoretical Fault
Frequency (Hz)
Simulated Fault
Frequency (Hz)
( ) fs21− 1 49.6 49.4
( ) fs43− 3 149.2 149.1
( ) fs65− 5 248.8 249.1
( ) fs87 − 7 348.4 349.2
( ) fs109− 9 448.0 448.2
( ) fs1211− 11 547.6 548.3
( ) fs1817− 17 846.4 846.4
( ) fs2019− 19 946.0 946.5
( ) fs2221− 21 1045.6 1046.5
( ) fs2827 − 27 1344.4 1345.5
( ) fs4443− 43 2141.2 2141.5
( ) fs5453− 53 2639.2 2638.8
( ) fs6261− 61 3037.6 3038.8
Table 4.3: Comparison of theoretical and simulated stator currents for s = 0.004
836 838 840 842 844 846 848 850 852 854 856
0.2
0.4
0.6
0.8
1
1.2
1.4
1.6
1.8
2x 10⁻⁴
Healthy Rotor 50% Broken Rotor BarOne Broken Rotor Bar
33
The theoretical and simulated stator current frequencies for detection of rotor bar
faults for the simulated motor at s = 0.004 are very similar to each other
especially in lower harmonics. This indicates that the simulation results give a
good indication of rotor bar detection frequencies for the conditions, the motor
was simulated under. These frequencies are later utilised for the detection of a
cracked and broken rotor bar in the experiment of the research.
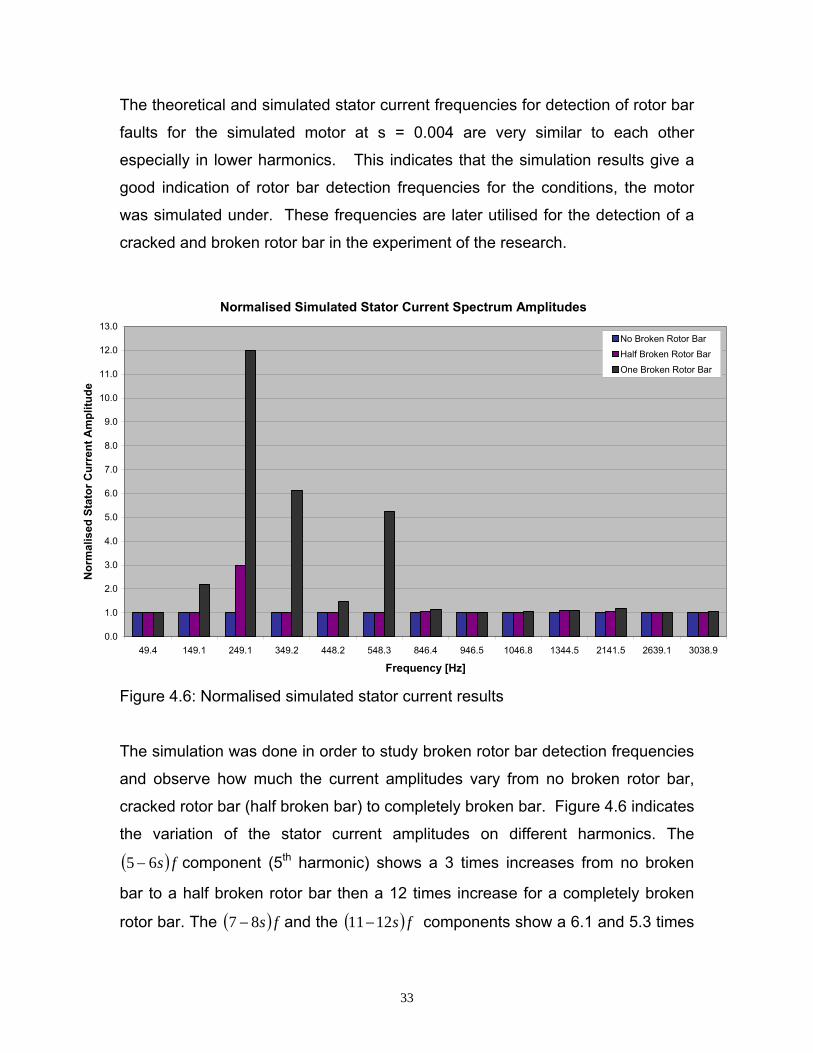
Figure 4.6: Normalised simulated stator current results
The simulation was done in order to study broken rotor bar detection frequencies
and observe how much the current amplitudes vary from no broken rotor bar,
cracked rotor bar (half broken bar) to completely broken bar. Figure 4.6 indicates
the variation of the stator current amplitudes on different harmonics. The
( ) fs65 − component (5th harmonic) shows a 3 times increases from no broken
bar to a half broken rotor bar then a 12 times increase for a completely broken
rotor bar. The ( ) fs87 − and the ( ) fs1211− components show a 6.1 and 5.3 times
Normalised Simulated Stator Current Spectrum Amplitudes
0.0
1.0
2.0
3.0
4.0
5.0
6.0
7.0
8.0
9.0
10.0
11.0
12.0
13.0
49.4 149.1 249.1 349.2 448.2 548.3 846.4 946.5 1046.8 1344.5 2141.5 2639.1 3038.9
Frequency [Hz]
Nor
mal
ised
Sta
tor C
urre
nt A
mpl
itude
No Broken Rotor Bar
Half Broken Rotor Bar
One Broken Rotor Bar
34
increase after a completely broken rotor bar respectively with no increase after a
rotor bar crack. In other harmonics, there are slight increase as can been seen
in Figure 4.6.
4.3 Induction Motor Simulation Conclusion
The results of the Maxwell 2D simulation affirm the theoretical rotor bar detection
frequencies, which are expressed by eq. 3.10. Most theoretical and simulated
rotor bar detection frequencies are within or less than 0.5 Hz of each other.
Furthermore, the results show how the stator current amplitudes vary at specific
frequencies from no broken bar to a cracked bar and then to a completely broken
bar. When a bar is completely broken there is a significant increase in the stator
current amplitude. This simulation study gave a base for the broken rotor
detection frequencies to be examined when performing the experimental
measurements on industrial squirrel cage induction motors.
35
CHAPTER 5 EXPERIMENTAL TESTING DETAILS AND DATA PROCESSING 5.1 Experimental Test Details
Recently, a high frequency of electric motor failures due to broken rotor bars
have been experienced at Eskom generation power stations. This prompted an
investigation to determine an optimal technique to detect breaking of bars at the
inception of the break.
The research involved uses a wide range of conventional broken rotor bar
detection techniques and also explores new detection techniques. The testing
was performed using different measuring instruments, operated by a number of
test personnel from different companies and most importantly analysis of results.
The experimental testing involved testing of two industrial induction motors which
had operated as induced draught fan motors at Arnot Power Station. The testing
was performed at a motor repair workshop, which had a capability to load a
motor to simulate operating plant condition. The two induction motors were of the
same design, even though other the motor had indications that it might have
been rewound before.
The conventional rotor bar detection techniques performed were vibration (radial
and axial) monitoring and stator current monitoring. The non-conventional
techniques explored were shaft voltage and leakage flux monitoring (leakage flux
results included in Appendix F). The tests measurements were taken under
different condition of the rotor bar that is without any broken rotor bar, half broken
rotor bar and fully broken rotor bar at different loads. The first phase of testing,
involved testing the motors as received with an assumption that there were no
broken rotor bars. The second phase of testing, involved testing after inducing a
36
rotor bar fault into the two induction motors with the testing personnel not
knowing which one had what fault induced on it.
The motor details are provided below in Table 5.1.
General Motor Details Description Rating Serial No.: 300068/01 & 300071/01 Supply Connection 3 phases Rated Voltage 3.3 kV Rated Current 352 A Power Rating 2300 hp = 1.7 MW Rated Speed 744 rpm Number of Poles 8 poles Number of Stator Slots 96 Number of Rotor Slots 80
Table 5.1: Arnot Power Station ID Fan Induction Motor Specifications used for
experimental measurements
The other motor details, which include dimensional details of the motors, were
earlier included in Chapter 4.
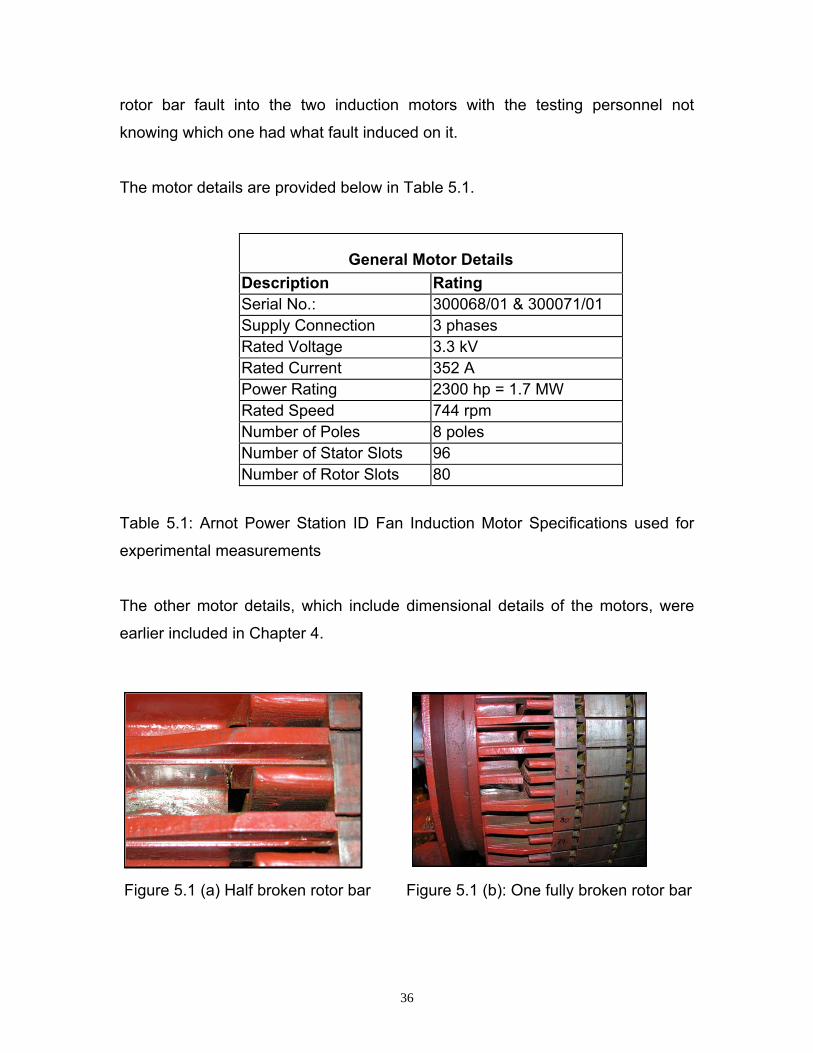
Figure 5.1 (a) Half broken rotor bar Figure 5.1 (b): One fully broken rotor bar
37
Fig. 5.1 (a) and (b) illustrate a half-broken and one fully broken rotor bar used in
the experimental testing. This specific rotor was used in the initial experimental
measurements performed in 2005 indicated in Chapter 5 in [47] when the project
initial commenced but is of the similar design as the motors used in the
experiment for this research.
5.2 EXPERIMENT MEASURING INSTRUMENTS
5.2.1 Current Transducer
A current transducer was used to capture the current induced into the stator
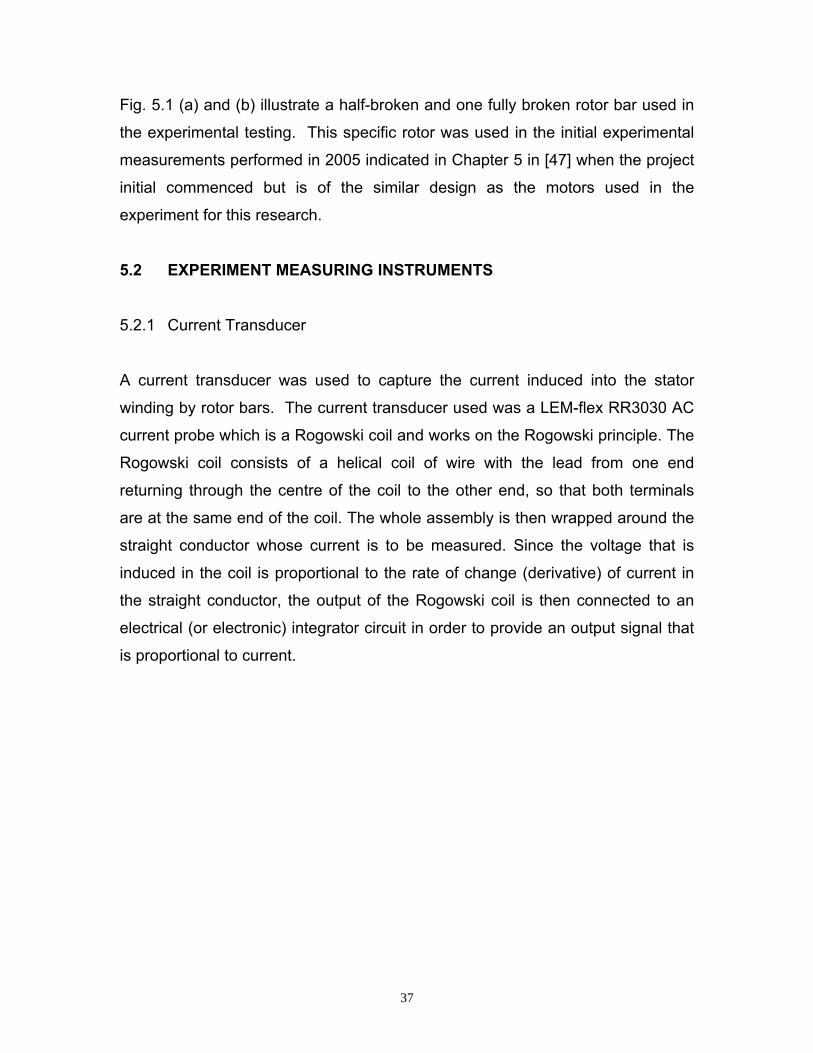
winding by rotor bars. The current transducer used was a LEM-flex RR3030 AC
current probe which is a Rogowski coil and works on the Rogowski principle. The
Rogowski coil consists of a helical coil of wire with the lead from one end
returning through the centre of the coil to the other end, so that both terminals
are at the same end of the coil. The whole assembly is then wrapped around the
straight conductor whose current is to be measured. Since the voltage that is
induced in the coil is proportional to the rate of change (derivative) of current in
the straight conductor, the output of the Rogowski coil is then connected to an
electrical (or electronic) integrator circuit in order to provide an output signal that
is proportional to current.
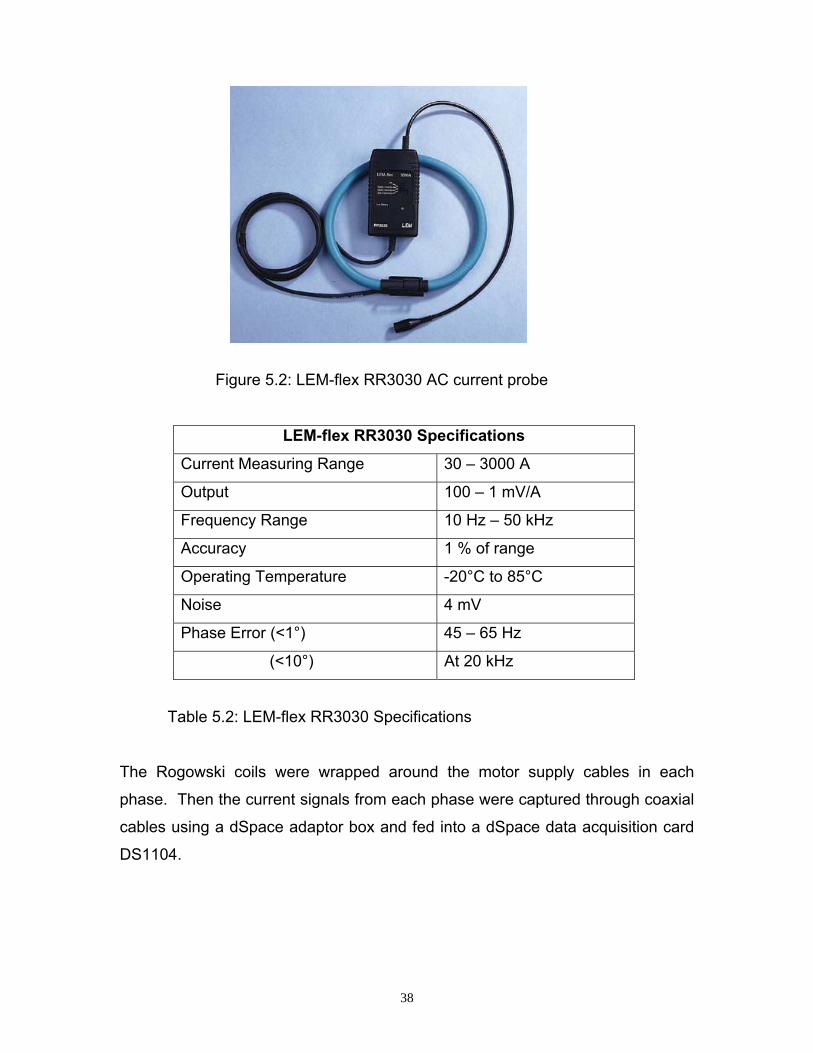
38
Figure 5.2: LEM-flex RR3030 AC current probe
LEM-flex RR3030 Specifications
Current Measuring Range 30 – 3000 A
Output 100 – 1 mV/A
Frequency Range 10 Hz – 50 kHz
Accuracy 1 % of range
Operating Temperature -20°C to 85°C
Noise 4 mV
Phase Error (<1°) 45 – 65 Hz
(<10°) At 20 kHz
Table 5.2: LEM-flex RR3030 Specifications
The Rogowski coils were wrapped around the motor supply cables in each
phase. Then the current signals from each phase were captured through coaxial
cables using a dSpace adaptor box and fed into a dSpace data acquisition card
DS1104.
39
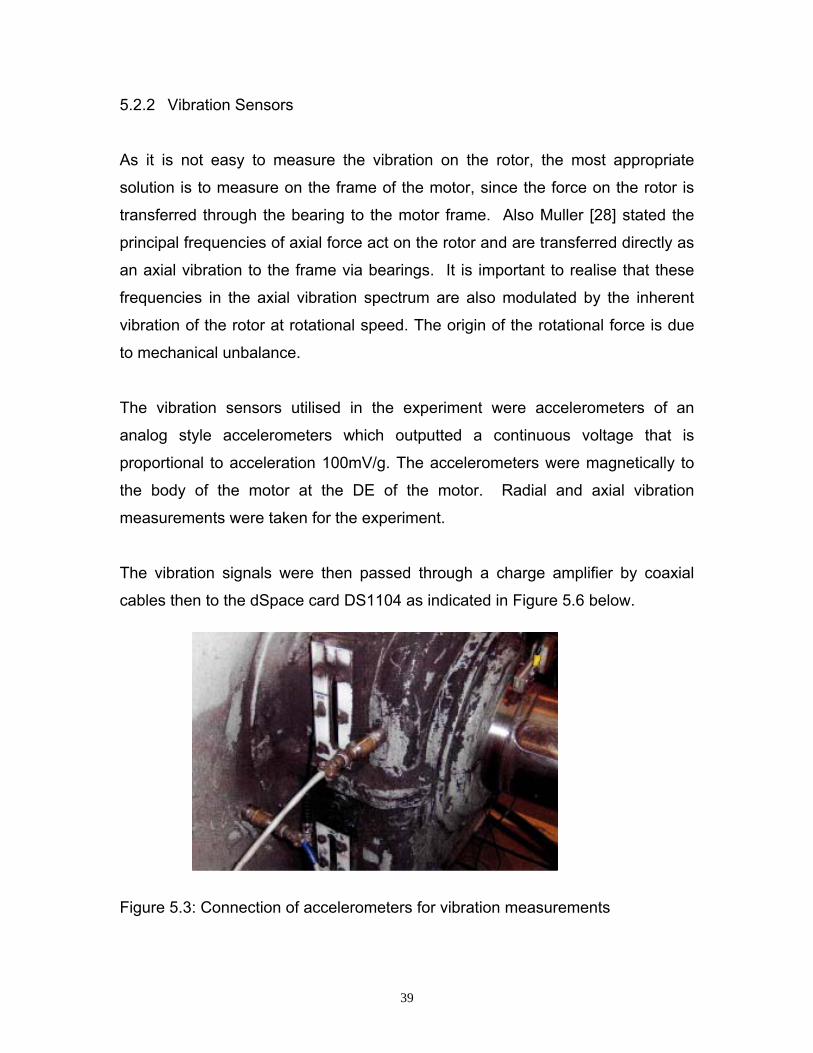
5.2.2 Vibration Sensors
As it is not easy to measure the vibration on the rotor, the most appropriate
solution is to measure on the frame of the motor, since the force on the rotor is
transferred through the bearing to the motor frame. Also Muller [28] stated the
principal frequencies of axial force act on the rotor and are transferred directly as
an axial vibration to the frame via bearings. It is important to realise that these
frequencies in the axial vibration spectrum are also modulated by the inherent
vibration of the rotor at rotational speed. The origin of the rotational force is due
to mechanical unbalance.
The vibration sensors utilised in the experiment were accelerometers of an
analog style accelerometers which outputted a continuous voltage that is
proportional to acceleration 100mV/g. The accelerometers were magnetically to
the body of the motor at the DE of the motor. Radial and axial vibration
measurements were taken for the experiment.
The vibration signals were then passed through a charge amplifier by coaxial
cables then to the dSpace card DS1104 as indicated in Figure 5.6 below.
Figure 5.3: Connection of accelerometers for vibration measurements
40
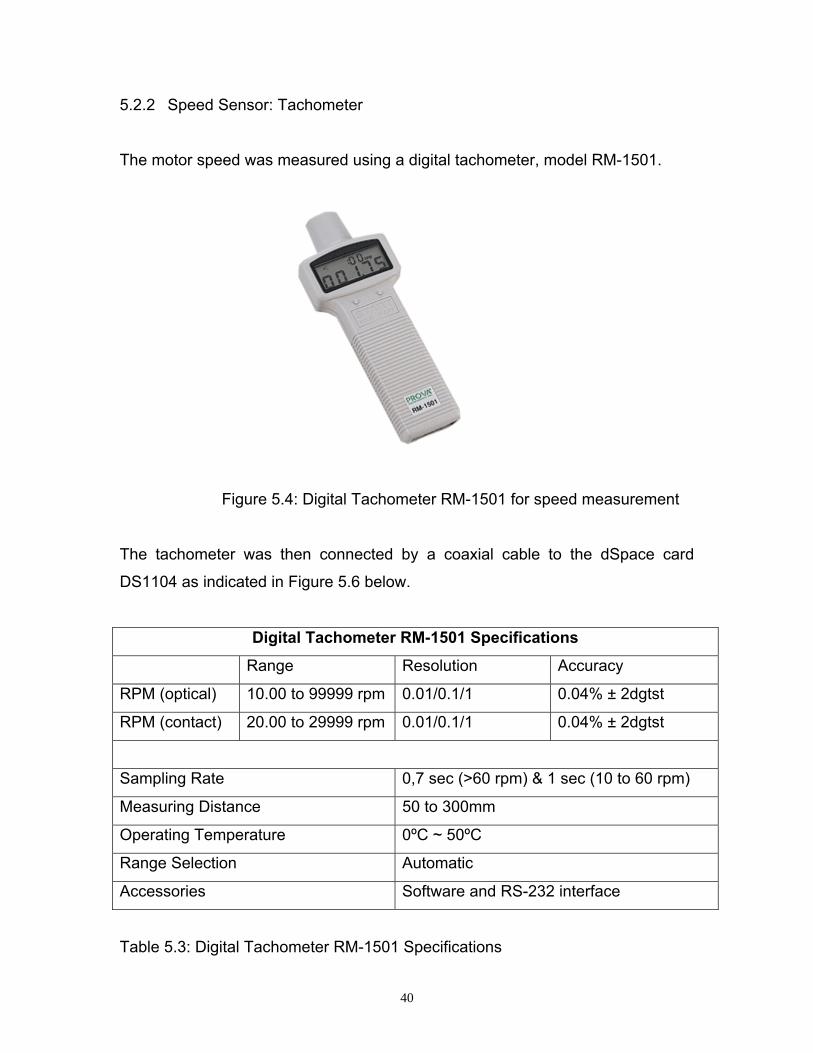
5.2.2 Speed Sensor: Tachometer
The motor speed was measured using a digital tachometer, model RM-1501.
Figure 5.4: Digital Tachometer RM-1501 for speed measurement
The tachometer was then connected by a coaxial cable to the dSpace card
DS1104 as indicated in Figure 5.6 below.
Digital Tachometer RM-1501 Specifications
Range Resolution Accuracy
RPM (optical) 10.00 to 99999 rpm 0.01/0.1/1 0.04% ± 2dgtst
RPM (contact) 20.00 to 29999 rpm 0.01/0.1/1 0.04% ± 2dgtst
Sampling Rate 0,7 sec (>60 rpm) & 1 sec (10 to 60 rpm)
Measuring Distance 50 to 300mm
Operating Temperature 0ºC ~ 50ºC
Range Selection Automatic
Accessories Software and RS-232 interface
Table 5.3: Digital Tachometer RM-1501 Specifications
41
5.3 DATA ACQUISITION AND PROCESSING
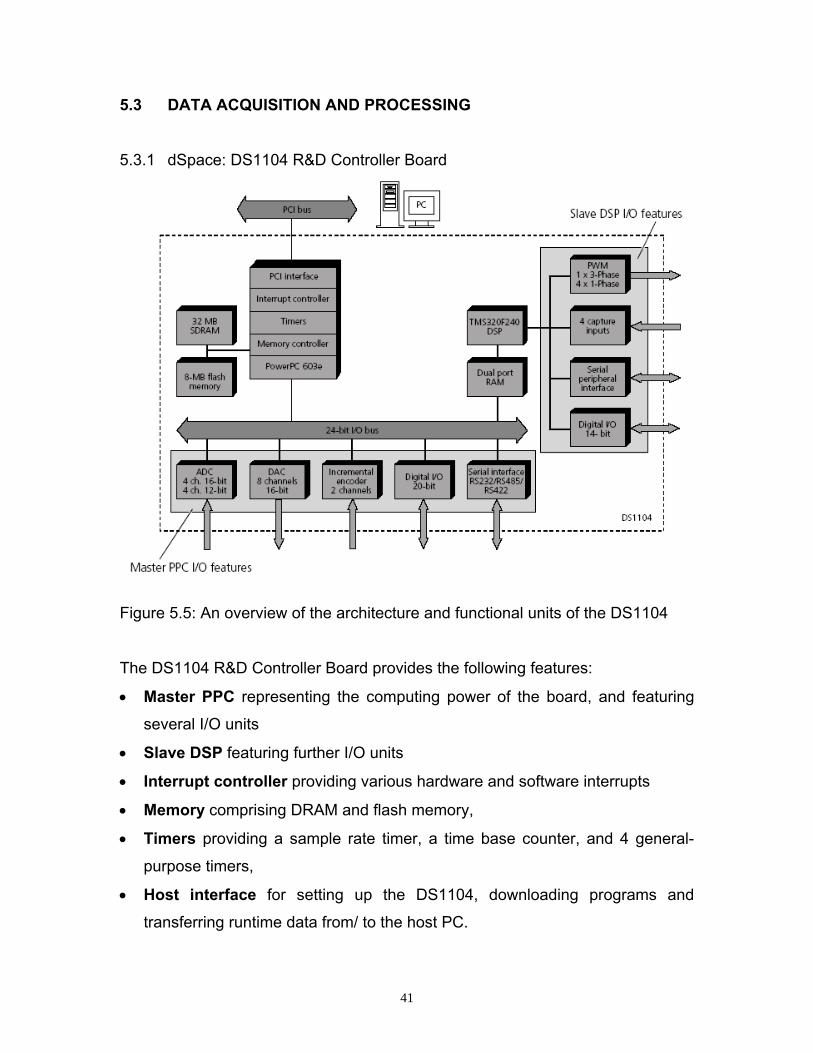
5.3.1 dSpace: DS1104 R&D Controller Board
Figure 5.5: An overview of the architecture and functional units of the DS1104
The DS1104 R&D Controller Board provides the following features:
• Master PPC representing the computing power of the board, and featuring
several I/O units
• Slave DSP featuring further I/O units
• Interrupt controller providing various hardware and software interrupts
• Memory comprising DRAM and flash memory,
• Timers providing a sample rate timer, a time base counter, and 4 general-
purpose timers,
• Host interface for setting up the DS1104, downloading programs and
transferring runtime data from/ to the host PC.
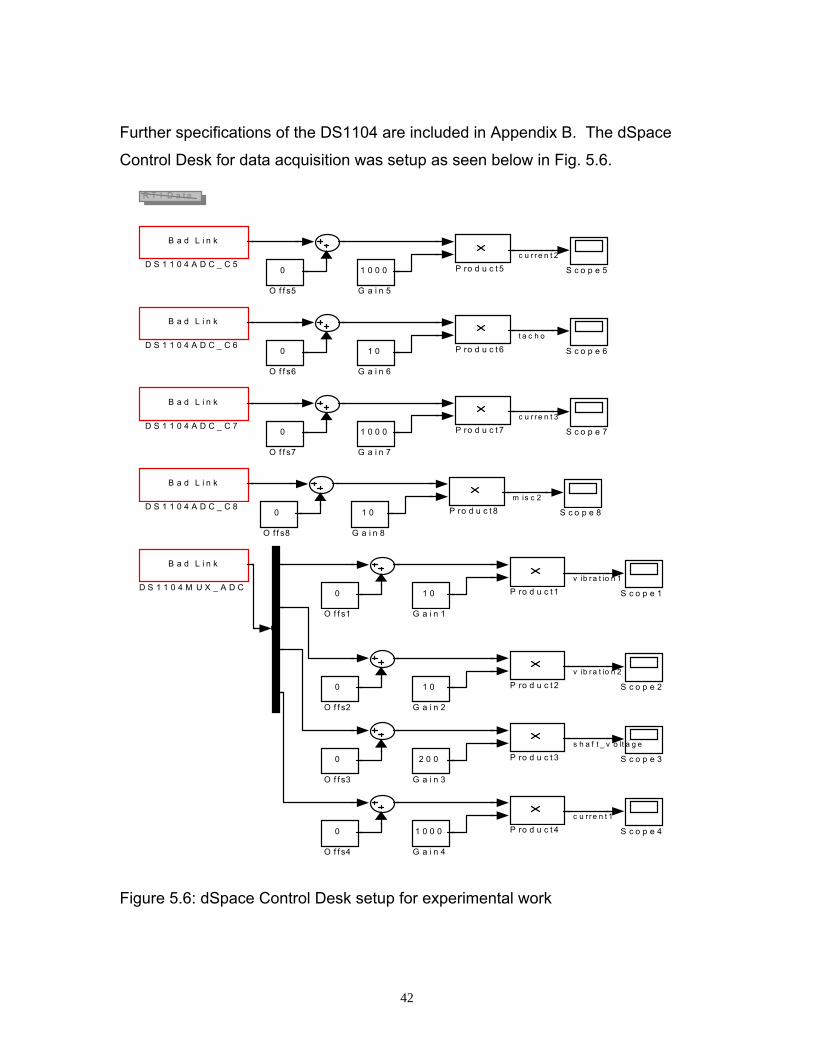
42
Further specifications of the DS1104 are included in Appendix B. The dSpace
Control Desk for data acquisition was setup as seen below in Fig. 5.6.
S c o p e 8
S c o p e 7
S c o p e 6
S c o p e 5
S c o p e 4
S c o p e 3
S c o p e 2
S c o p e 1
R T I D a t a
P ro d u c t 8
P ro d u c t 7
P ro d u c t 6
P ro d u c t 5
P ro d u c t 4
P ro d u c t 3
P ro d u c t 2
P ro d u c t 1
0
O f f s8
0
O f f s7
0
O f f s6
0
O f f s5
0
O f f s4
0
O f f s3
0
O f f s2
0
O f f s1
1 0
G a i n 8
1 0 0 0
G a i n 7
1 0
G a i n 6
1 0 0 0
G a i n 5
1 0 0 0
G a i n 4
2 0 0
G a i n 3
1 0
G a i n 2
1 0
G a i n 1m
B a d L i n k
D S 1 1 0 4 M U X _ A D C
B a d L i n k
D S 1 1 0 4 A D C _ C 8
B a d L i n k
D S 1 1 0 4 A D C _ C 7
B a d L i n k
D S 1 1 0 4 A D C _ C 6
B a d L i n k
D S 1 1 0 4 A D C _ C 5c u r r e n t 2
t a c h o
c u r r e n t 3
m is c 2
v ib r a t io n 1
v ib r a t io n 2
s h a f t _ v o lt a g e
c u r r e n t 1
Figure 5.6: dSpace Control Desk setup for experimental work
43
5.3.2 Signal Processing
The second most important aspect of signal analysis (and of this research) is the
signal processing before fault diagnosis. Ayhan et. al. [43] mentioned that the
Fast Fourier Transform (FFT) is the most widely used non-parametric spectrum
analysis method, which yields efficient and reasonable results for MCSA
technique. The FFT is an algorithm to compute the Discrete Fourier Transform
(DFT) of a discrete time series function with minimum computational effort. FFT
algorithms compute the DFT of the given time series by successively
decomposing the N-point DFT computation into computations of smaller size.
Ayhan [43] suggests that Welsch’s periodogram method is most efficient than
FFT and periodogram methods in terms of fault detection performance. Although
all the three methods are based on DFT technique, the use of a Hanning window
and overlapping segments in Welch’s method contributed to the fault detection in
a positive way. The use of Hanning window reduces the side effect of the
sidelobes and results in a decrease in the PSD estimate bias. The side lobes of
the signal spectrum cause the signal power leak into other frequencies. The bias
of the PSD estimate is due to this spectral leakage. Applying a tapered window
to the signal in the spectral estimation, such a Hanning window reduces the
effect considerably. This results in a decreased estimation bias, which shows
that the PSD estimate is closer to the real value. On the other hand, overlapping
segments case the data treatment and smoothing of the PSD estimate. As the
number of data segments increase, the PSD estimate variance decreases. Both
these positive effects suggest that Welch’s periodgram method is a preferred
approach when compared to the other two inspected methods in the broken rotor
bar fault detection of induction motors.
However, Dhuness [47] suggested that the Welsh’s method is not adequate for
large machines as the magnitude of interbar currents may become larger than
fault frequency components as stipulated by Landy. Landy et.al. [20] outlined the
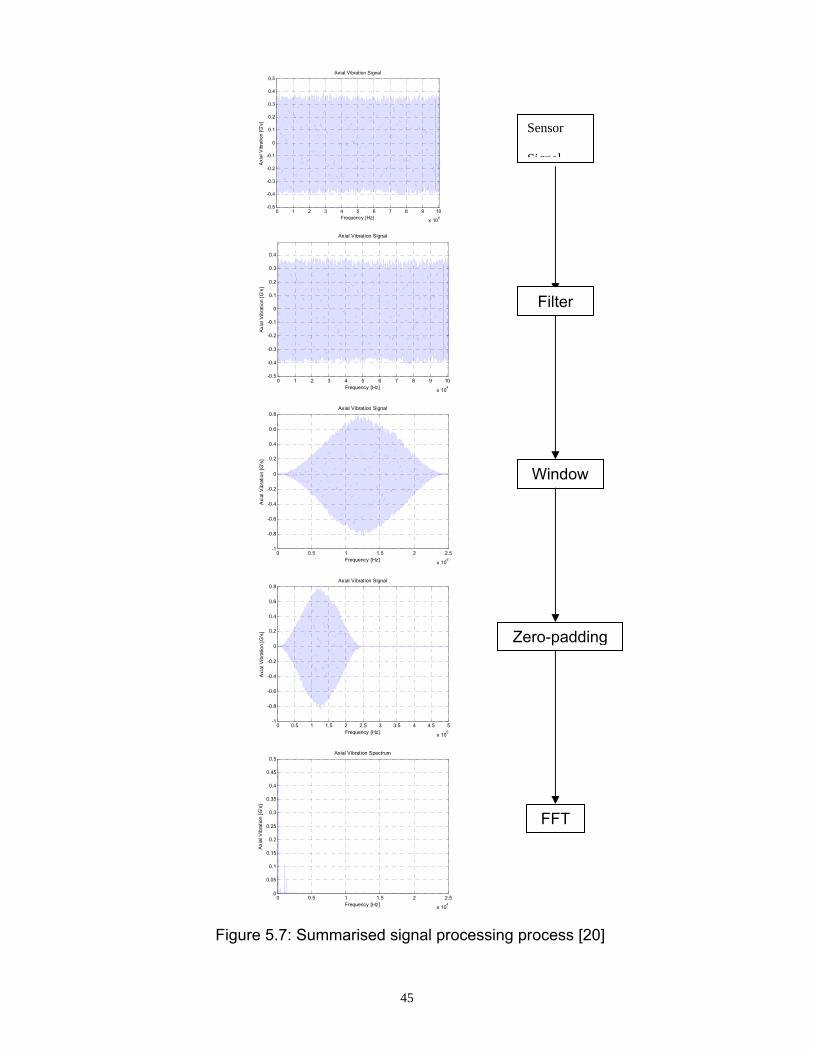
44
signal processing to be employed in large machines as outlined in Fig. 5.7. The
MATLABTM codes used for the signal processing are included in Appendix B.
• Filtering: the function of the filter is to remove unwanted parts of the
signal, such as random noise, or to extract useful parts of the signal, such
as components lying within a certain frequency range.
• Windowing as explained by Ayhan [43] above.
• Zero-padding: Zero-padding is adding a series of zeros onto the end of
the signal. This is done to overcome the problem of picket fencing which
is when the peak of a frequency of interest lies between the two of the
discrete transform lines. If the frequency resolution of the spectrum is
defined as
Nf
f s=Δ (5.1)
The number of points by M, the frequency resolution becomes
MNf
f s
+=Δ (5.2)
Zero-padding improves the resolution of the spectrum.
• FFT: The FFT is an algorithm to compute the Discrete Fourier Transform
(DFT) of a discrete time series function with minimum computational effort.
The DFT takes a discrete signal in the time domain and transforms that
signal into its discrete frequency domain representation. FFT is then
extremely important in frequency (spectrum) analysis.
45
Figure 5.7: Summarised signal processing process [20]
0 1 2 3 4 5 6 7 8 9 10
x 104
-0.5
-0.4
-0.3
-0.2
-0.1
0
0.1
0.2
0.3
0.4
0.5
Frequency [Hz]
Axi
al V
ibra
tion
[G's
]
Axial Vibration Signal
0 1 2 3 4 5 6 7 8 9 10
x 104
-0.5
-0.4
-0.3
-0.2
-0.1
0
0.1
0.2
0.3
0.4
Axial Vibration Signal
Frequency [Hz]
Axi
al V
ibra
tion
[G's
]
0 0.5 1 1.5 2 2.5
x 105
-1
-0.8
-0.6
-0.4
-0.2
0
0.2
0.4
0.6
0.8
Frequency [Hz]
Axi
al V
ibra
tion
[G's
]
Axial Vibration Signal
0 0.5 1 1.5 2 2.5 3 3.5 4 4.5 5
x 105
-1
-0.8
-0.6
-0.4
-0.2
0
0.2
0.4
0.6
0.8Axial Vibration Signal
Frequency [Hz]
Axi
al V
ibra
tion
[G's
]
0 0.5 1 1.5 2 2.5
x 104
0
0.05
0.1
0.15
0.2
0.25
0.3
0.35
0.4
0.45
0.5
Frequency [Hz]
Axi
al V
ibra
tion
[G's
]
Axial Vibration Spectrum
Sensor
Signal
Filter
Window
Zero-padding
FFT
46
5.3.3 Selection of FFT parameters [20]
This subsection discusses important parameters in signal data processing which
are important for capturing the signals.
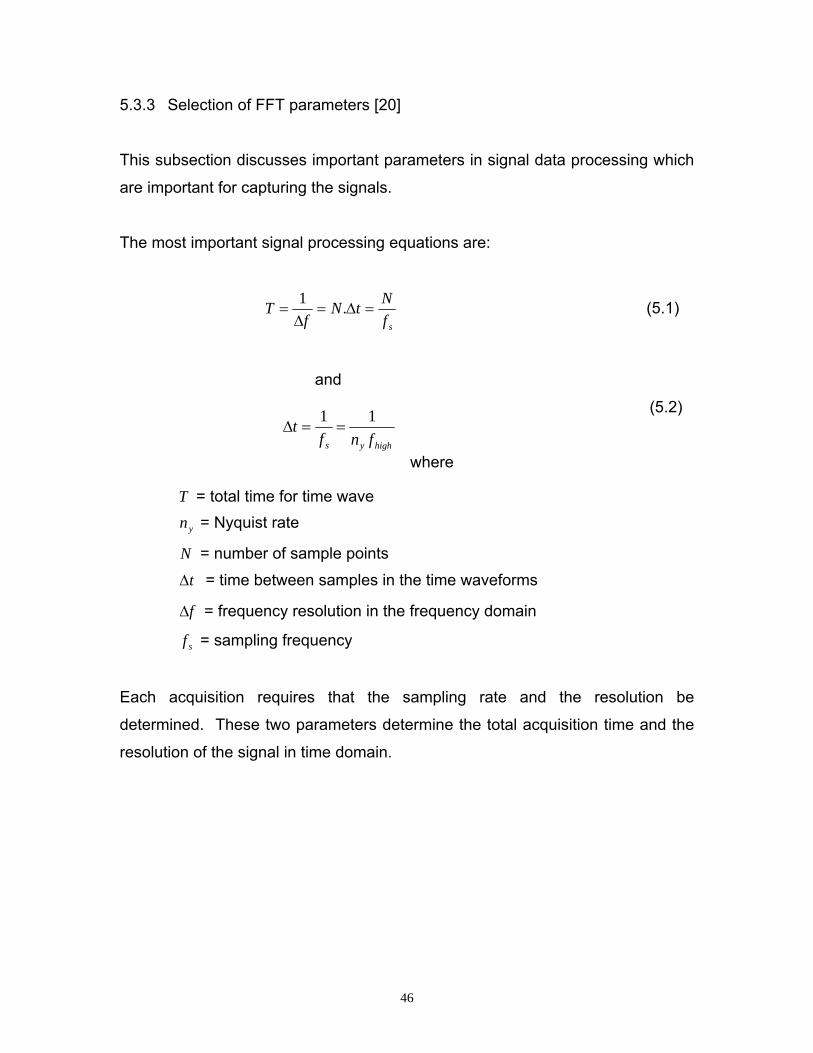
The most important signal processing equations are:
sfNtN
fT =Δ=
Δ= .1 (5.1)
and
(5.2)
where
T = total time for time wave yn = Nyquist rate
N = number of sample points
tΔ = time between samples in the time waveforms
fΔ = frequency resolution in the frequency domain
sf = sampling frequency
Each acquisition requires that the sampling rate and the resolution be
determined. These two parameters determine the total acquisition time and the
resolution of the signal in time domain.
highys fnft 11
==Δ
47
5.3.3.1 Sampling rate
The sampling rate is calculated as:
highys fnf = (5.3)
The highest frequency ( highf ) that is required for successfully monitoring the
motor should be known and used to set the sampling rate. The Nyquist rate ( yn )
of depends on the spectrum analyzer and more specifically the roll-off of the anti-
aliasing filter.
5.3.3.2 Frequency resolution
The frequency resolution is determined by the number of points and the sampling
frequency. Invariably the number of points is limited by the spectrum analyzer.
The frequency resolution is
Nf
f s=Δ (5.4)
Prior knowledge of the frequency spectrum is necessary in order to select an
acceptable frequency resolution. If the frequency resolution is not of acceptable
level, the time signal may be zeropadded. Zeropadding the time signal however
requires intensive processing, and all the original time points.
5.3.3.3 Acquisition time and time resolution
These parameters are automatically set by determining the sampling rate and the
frequency resolution. The total acquisition time is determined by eq. 5.1. and
5.2.
48
CHAPTER 6 INDUSTRIAL EXPERIMENTAL RESULTS AND DISCUSSION
6.1 Experimental Results Introduction
The experimental results for the tests performed are presented in this order,
stator current analysis, axial vibration analysis and shaft voltage analysis for
each motor before and after fault inception. Comparisons of the literature
supporting each technique as well as the Maxwell simulation results of the stator
current are outlined in this section.
6.2 Motor Stator Current Analysis
When using the stator current signature to monitor the condition of the rotor bars,
eq. 3.7 and eq. 3.8 were used and compared with the fault frequencies obtained
from testing before and after fault inception.
The results presented below, in Table 6.1, indicate expected theoretical fault
frequencies for Motor A at 54% load, running at a speed of 747 rpm then the slip
is 0.004. The table presents all fault frequencies from the first harmonic till the
61st harmonic.
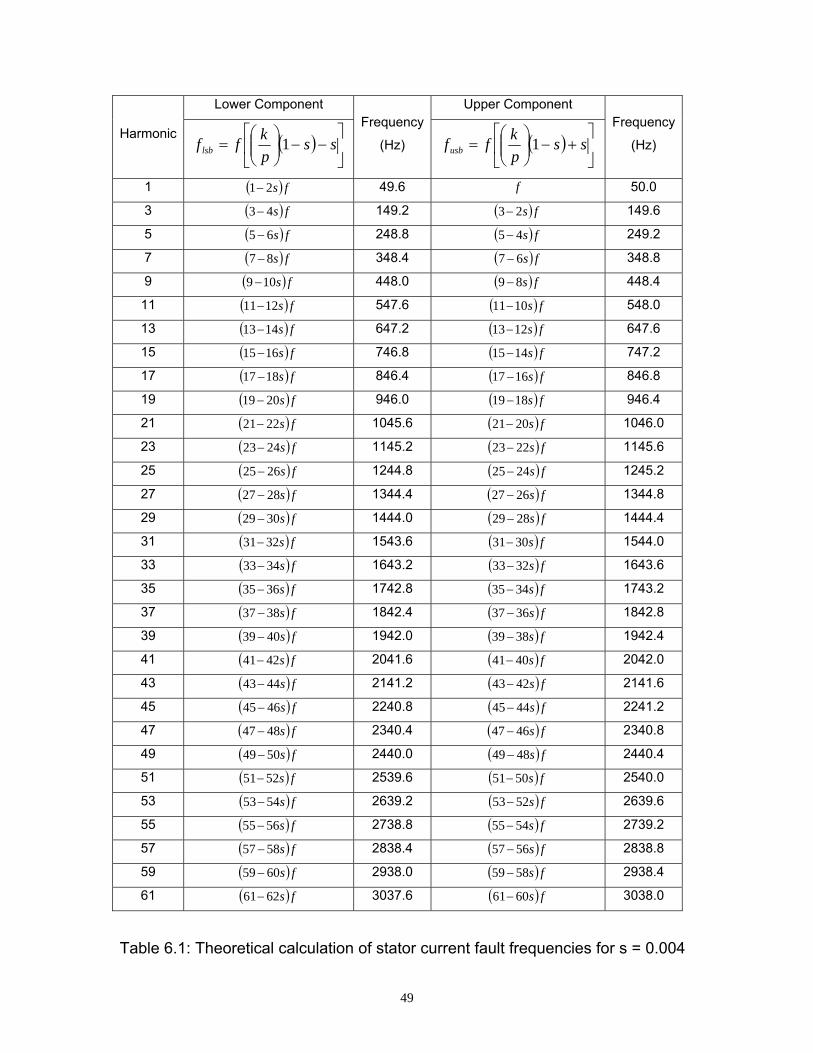
49
Harmonic
Lower Component Frequency
(Hz)
Upper Component Frequency
(Hz) ( ) ⎥⎦
⎤⎢⎣
⎡−−⎟⎟
⎠
⎞⎜⎜⎝
⎛= ss
pkff lsb 1 ( ) ⎥
⎦
⎤⎢⎣
⎡+−⎟⎟
⎠
⎞⎜⎜⎝
⎛= ss
pkffusb 1
1 ( ) fs21− 49.6 f 50.0
3 ( ) fs43− 149.2 ( ) fs23− 149.6
5 ( ) fs65− 248.8 ( ) fs45− 249.2
7 ( ) fs87 − 348.4 ( ) fs67 − 348.8
9 ( ) fs109 − 448.0 ( ) fs89 − 448.4
11 ( ) fs1211− 547.6 ( ) fs1011− 548.0
13 ( ) fs1413− 647.2 ( ) fs1213− 647.6
15 ( ) fs1615− 746.8 ( ) fs1415− 747.2
17 ( ) fs1817− 846.4 ( ) fs1617− 846.8
19 ( ) fs2019− 946.0 ( ) fs1819− 946.4
21 ( ) fs2221− 1045.6 ( ) fs2021− 1046.0
23 ( ) fs2423− 1145.2 ( ) fs2223− 1145.6
25 ( ) fs2625− 1244.8 ( ) fs2425− 1245.2
27 ( ) fs2827 − 1344.4 ( ) fs2627 − 1344.8
29 ( ) fs3029− 1444.0 ( ) fs2829− 1444.4
31 ( ) fs3231− 1543.6 ( ) fs3031− 1544.0
33 ( ) fs3433− 1643.2 ( ) fs3233− 1643.6
35 ( ) fs3635− 1742.8 ( ) fs3435− 1743.2
37 ( ) fs3837 − 1842.4 ( ) fs3637 − 1842.8
39 ( ) fs4039− 1942.0 ( ) fs3839− 1942.4
41 ( ) fs4241− 2041.6 ( ) fs4041− 2042.0
43 ( ) fs4443− 2141.2 ( ) fs4243− 2141.6
45 ( ) fs4645− 2240.8 ( ) fs4445− 2241.2
47 ( ) fs4847 − 2340.4 ( ) fs4647 − 2340.8
49 ( ) fs5049− 2440.0 ( ) fs4849− 2440.4
51 ( ) fs5251− 2539.6 ( ) fs5051− 2540.0
53 ( ) fs5453− 2639.2 ( ) fs5253− 2639.6
55 ( ) fs5655− 2738.8 ( ) fs5455− 2739.2
57 ( ) fs5857 − 2838.4 ( ) fs5657 − 2838.8
59 ( ) fs6059− 2938.0 ( ) fs5859− 2938.4
61 ( ) fs6261− 3037.6 ( ) fs6061− 3038.0
Table 6.1: Theoretical calculation of stator current fault frequencies for s = 0.004
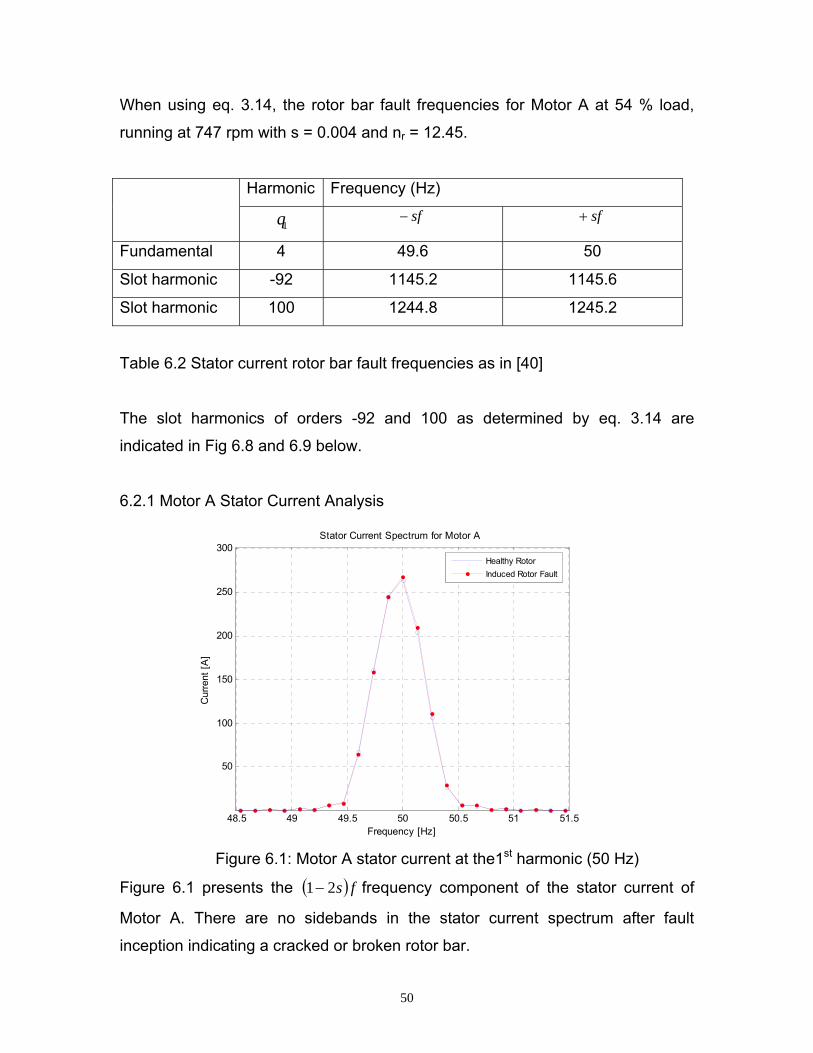
50
When using eq. 3.14, the rotor bar fault frequencies for Motor A at 54 % load,
running at 747 rpm with s = 0.004 and nr = 12.45.
Harmonic Frequency (Hz)
1q sf− sf+
Fundamental 4 49.6 50
Slot harmonic -92 1145.2 1145.6
Slot harmonic 100 1244.8 1245.2
Table 6.2 Stator current rotor bar fault frequencies as in [40]
The slot harmonics of orders -92 and 100 as determined by eq. 3.14 are
indicated in Fig 6.8 and 6.9 below.
6.2.1 Motor A Stator Current Analysis
Figure 6.1: Motor A stator current at the1st harmonic (50 Hz)
Figure 6.1 presents the ( ) fs21− frequency component of the stator current of
Motor A. There are no sidebands in the stator current spectrum after fault
inception indicating a cracked or broken rotor bar.
48.5 49 49.5 50 50.5 51 51.5
50
100
150
200
250
300
Frequency [Hz]
Cur
rent
[A]
Stator Current Spectrum for Motor A
Healthy RotorInduced Rotor Fault
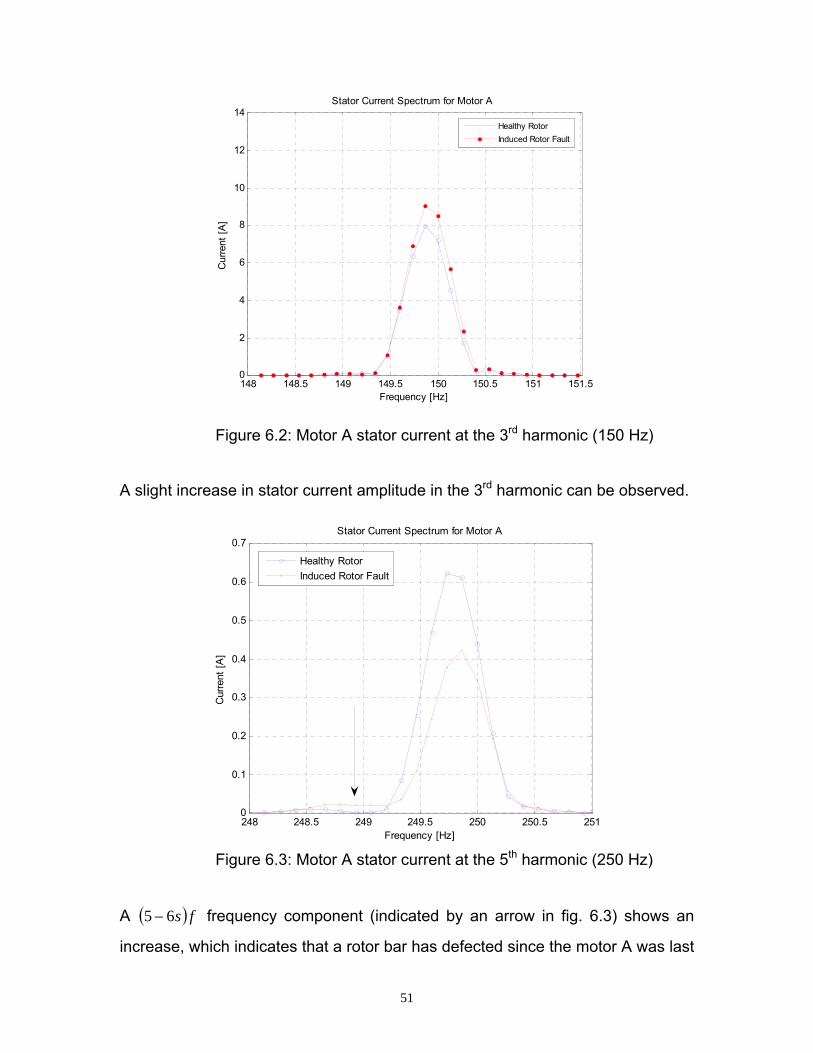
51
Figure 6.2: Motor A stator current at the 3rd harmonic (150 Hz)
A slight increase in stator current amplitude in the 3rd harmonic can be observed.
Figure 6.3: Motor A stator current at the 5th harmonic (250 Hz)
A ( ) fs65 − frequency component (indicated by an arrow in fig. 6.3) shows an
increase, which indicates that a rotor bar has defected since the motor A was last
148 148.5 149 149.5 150 150.5 151 151.50
2
4
6
8
10
12
14
Frequency [Hz]
Cur
rent
[A]
Stator Current Spectrum for Motor A
Healthy RotorInduced Rotor Fault
248 248.5 249 249.5 250 250.5 2510
0.1
0.2
0.3
0.4
0.5
0.6
0.7
Frequency [Hz]
Cur
rent
[A]
Stator Current Spectrum for Motor A
Healthy RotorInduced Rotor Fault
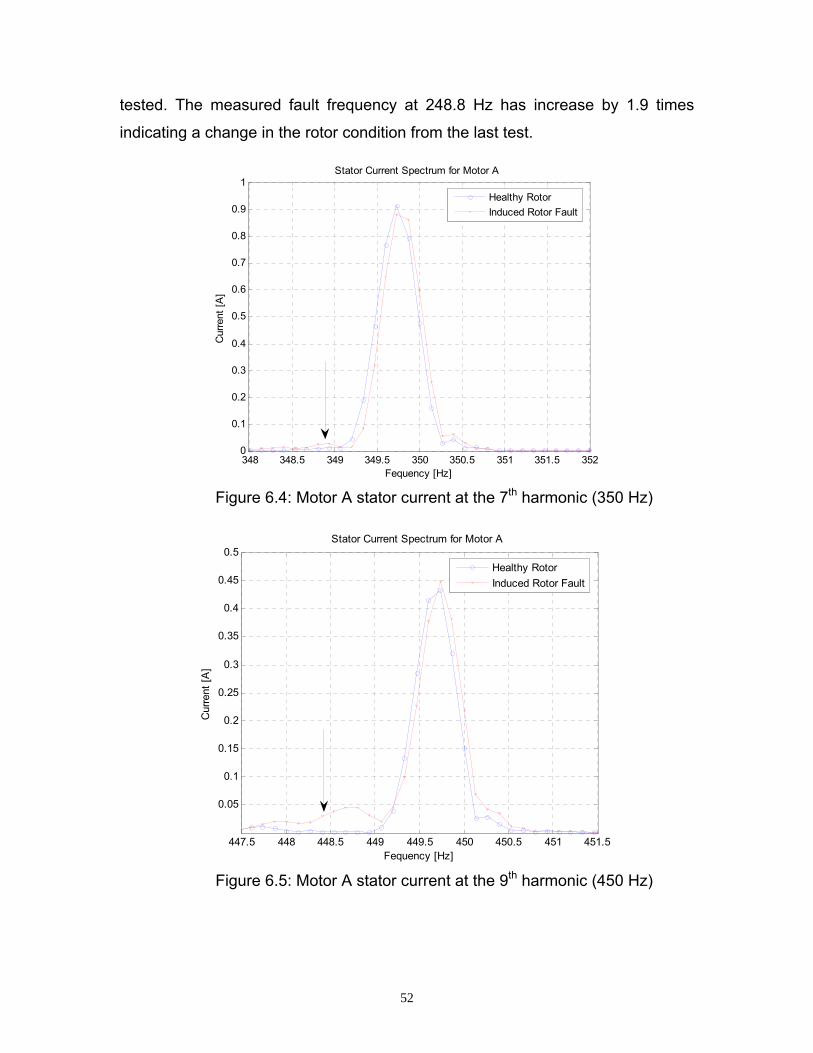
52
tested. The measured fault frequency at 248.8 Hz has increase by 1.9 times
indicating a change in the rotor condition from the last test.
Figure 6.4: Motor A stator current at the 7th harmonic (350 Hz)
Figure 6.5: Motor A stator current at the 9th harmonic (450 Hz)
447.5 448 448.5 449 449.5 450 450.5 451 451.5
0.05
0.1
0.15
0.2
0.25
0.3
0.35
0.4
0.45
0.5
Fequency [Hz]
Cur
rent
[A]
Stator Current Spectrum for Motor A
Healthy Rotor Induced Rotor Fault
348 348.5 349 349.5 350 350.5 351 351.5 3520
0.1
0.2
0.3
0.4
0.5
0.6
0.7
0.8
0.9
1
Fequency [Hz]
Cur
rent
[A]
Stator Current Spectrum for Motor A
Healthy Rotor Induced Rotor Fault
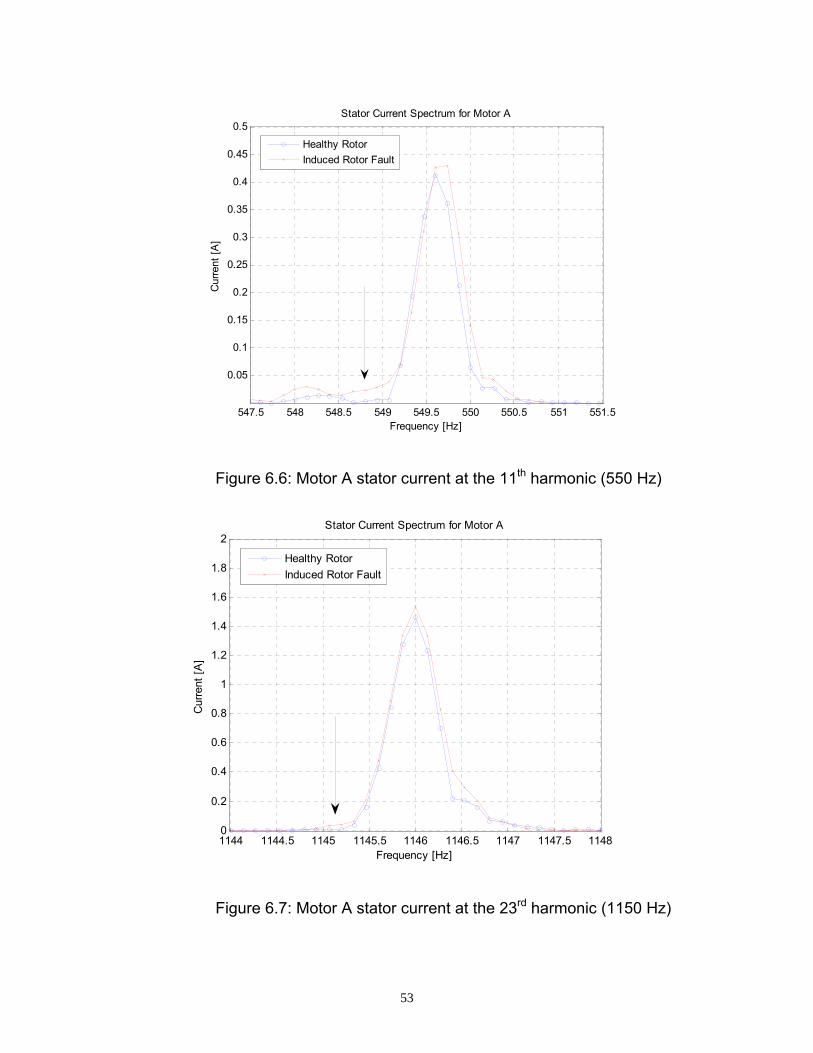
53
Figure 6.6: Motor A stator current at the 11th harmonic (550 Hz)
Figure 6.7: Motor A stator current at the 23rd harmonic (1150 Hz)
547.5 548 548.5 549 549.5 550 550.5 551 551.5
0.05
0.1
0.15
0.2
0.25
0.3
0.35
0.4
0.45
0.5
Frequency [Hz]
Cur
rent
[A]
Stator Current Spectrum for Motor A
Healthy RotorInduced Rotor Fault
1144 1144.5 1145 1145.5 1146 1146.5 1147 1147.5 11480
0.2
0.4
0.6
0.8
1
1.2
1.4
1.6
1.8
2
Frequency [Hz]
Cur
rent
[A]
Stator Current Spectrum for Motor A
Healthy RotorInduced Rotor Fault
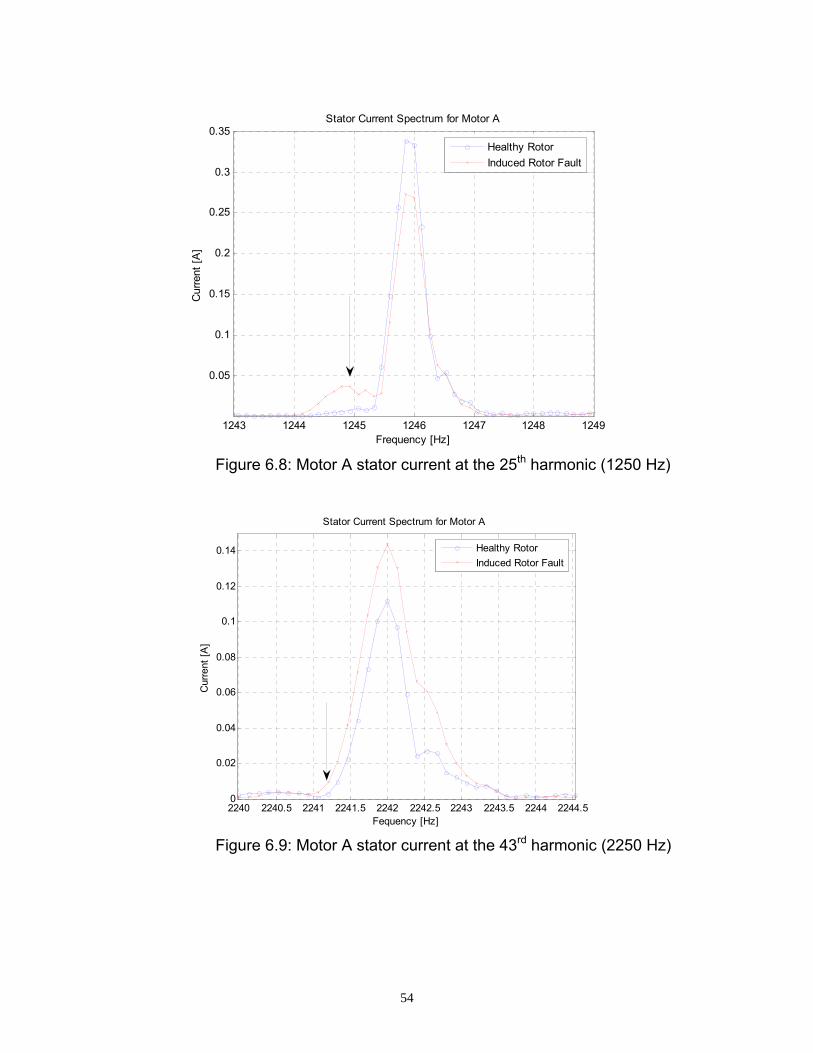
54
Figure 6.8: Motor A stator current at the 25th harmonic (1250 Hz)
Figure 6.9: Motor A stator current at the 43rd harmonic (2250 Hz)
1243 1244 1245 1246 1247 1248 1249
0.05
0.1
0.15
0.2
0.25
0.3
0.35
Frequency [Hz]
Cur
rent
[A]
Stator Current Spectrum for Motor A
Healthy RotorInduced Rotor Fault
2240 2240.5 2241 2241.5 2242 2242.5 2243 2243.5 2244 2244.50
0.02
0.04
0.06
0.08
0.1
0.12
0.14
Fequency [Hz]
Cur
rent
[A]
Stator Current Spectrum for Motor A
Healthy Rotor Induced Rotor Fault
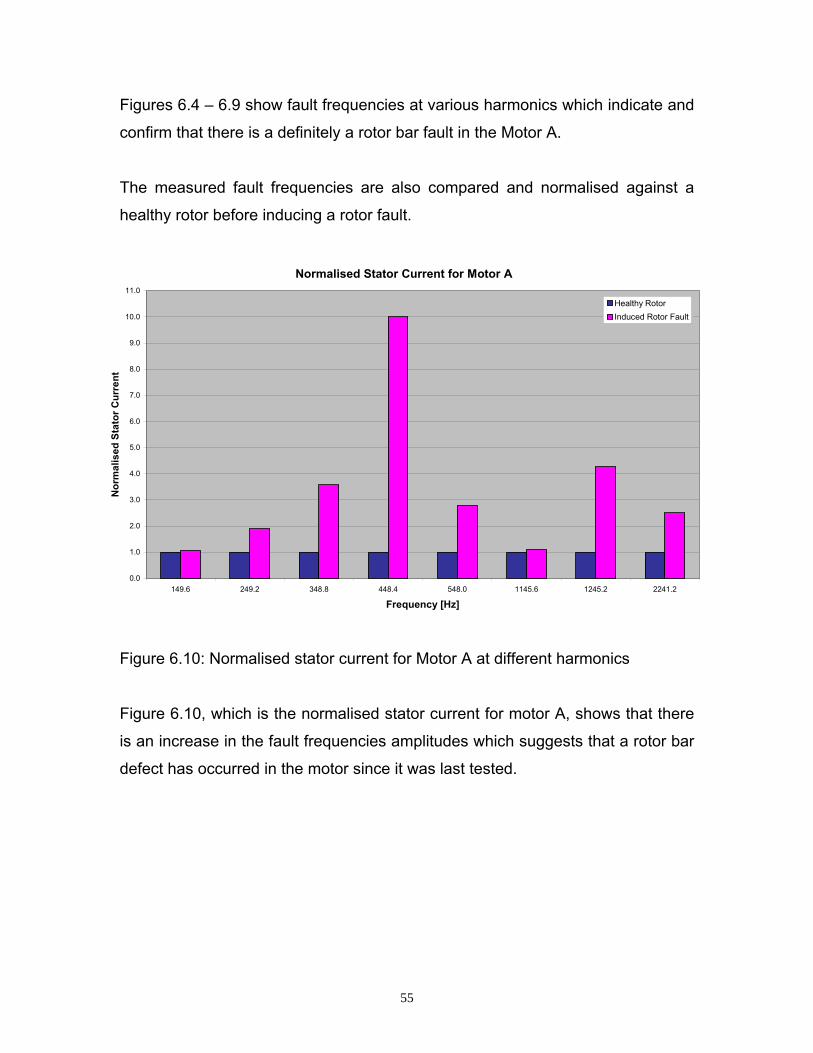
55
Figures 6.4 – 6.9 show fault frequencies at various harmonics which indicate and
confirm that there is a definitely a rotor bar fault in the Motor A.
The measured fault frequencies are also compared and normalised against a
healthy rotor before inducing a rotor fault.
Figure 6.10: Normalised stator current for Motor A at different harmonics
Figure 6.10, which is the normalised stator current for motor A, shows that there
is an increase in the fault frequencies amplitudes which suggests that a rotor bar
defect has occurred in the motor since it was last tested.
Normalised Stator Current for Motor A
0.0
1.0
2.0
3.0
4.0
5.0
6.0
7.0
8.0
9.0
10.0
11.0
149.6 249.2 348.8 448.4 548.0 1145.6 1245.2 2241.2
Frequency [Hz]
Nor
mal
ised
Sta
tor C
urre
nt
Healthy RotorInduced Rotor Fault
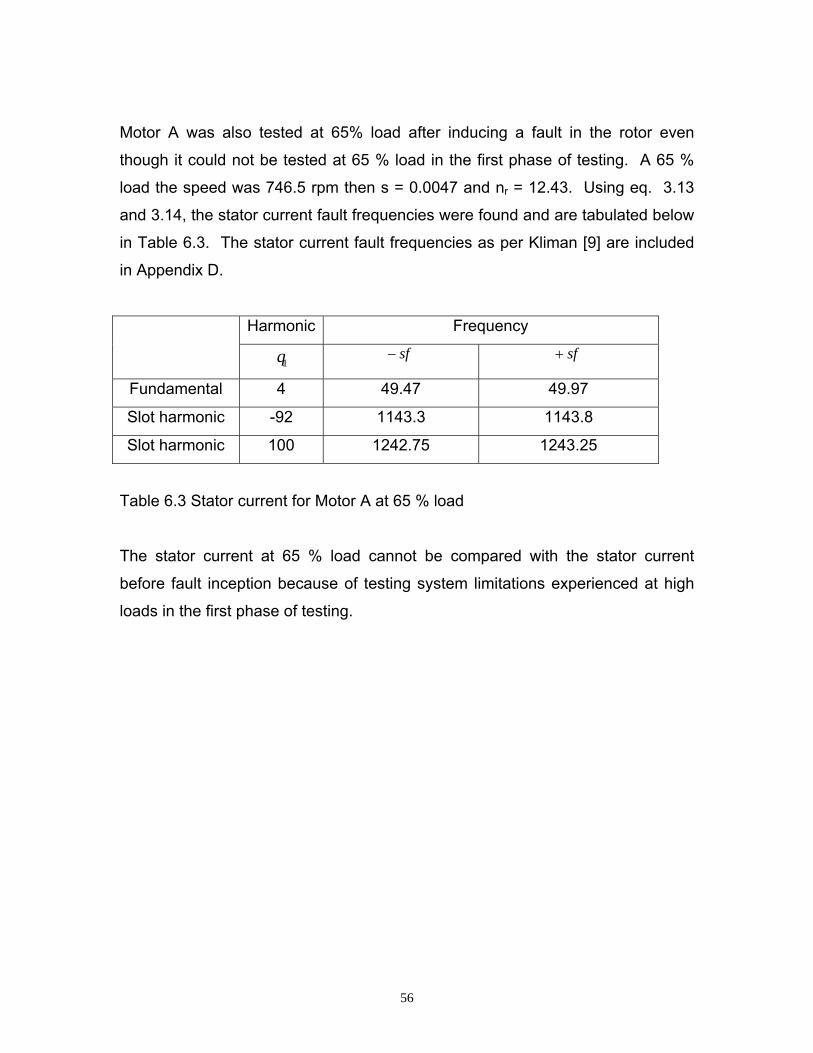
56
Motor A was also tested at 65% load after inducing a fault in the rotor even
though it could not be tested at 65 % load in the first phase of testing. A 65 %
load the speed was 746.5 rpm then s = 0.0047 and nr = 12.43. Using eq. 3.13
and 3.14, the stator current fault frequencies were found and are tabulated below
in Table 6.3. The stator current fault frequencies as per Kliman [9] are included
in Appendix D.
Harmonic Frequency
1q sf− sf+
Fundamental 4 49.47 49.97
Slot harmonic -92 1143.3 1143.8
Slot harmonic 100 1242.75 1243.25
Table 6.3 Stator current for Motor A at 65 % load
The stator current at 65 % load cannot be compared with the stator current
before fault inception because of testing system limitations experienced at high
loads in the first phase of testing.
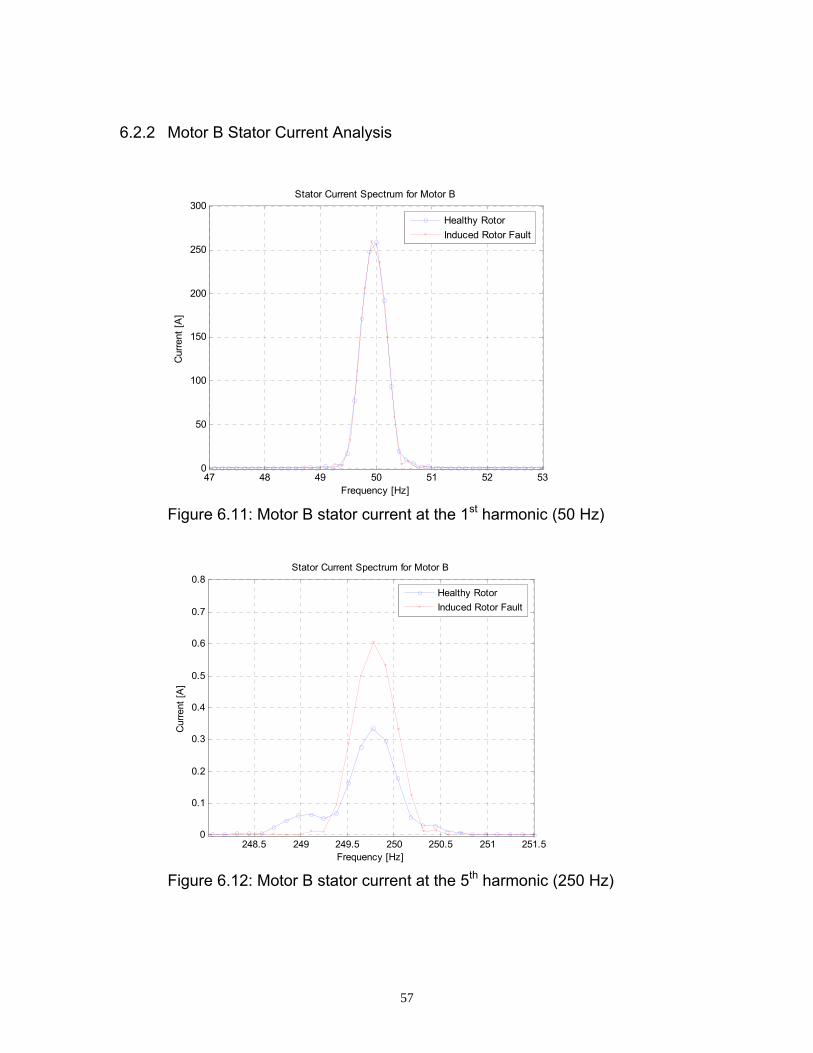
57
6.2.2 Motor B Stator Current Analysis
Figure 6.11: Motor B stator current at the 1st harmonic (50 Hz)
Figure 6.12: Motor B stator current at the 5th harmonic (250 Hz)
47 48 49 50 51 52 530
50
100
150
200
250
300
Frequency [Hz]
Cur
rent
[A]
Stator Current Spectrum for Motor B
Healthy Rotor Induced Rotor Fault
248.5 249 249.5 250 250.5 251 251.50
0.1
0.2
0.3
0.4
0.5
0.6
0.7
0.8
Frequency [Hz]
Cur
rent
[A]
Stator Current Spectrum for Motor B
Healthy Rotor Induced Rotor Fault
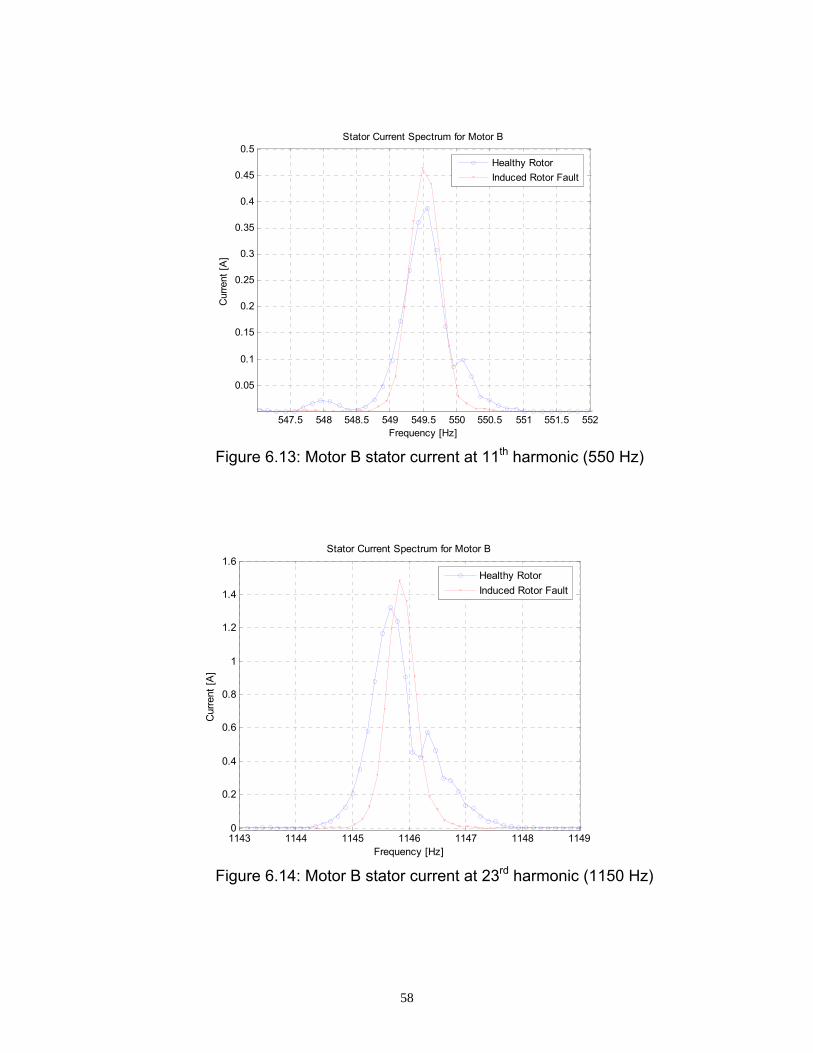
58
Figure 6.13: Motor B stator current at 11th harmonic (550 Hz)
Figure 6.14: Motor B stator current at 23rd harmonic (1150 Hz)
547.5 548 548.5 549 549.5 550 550.5 551 551.5 552
0.05
0.1
0.15
0.2
0.25
0.3
0.35
0.4
0.45
0.5
Frequency [Hz]
Cur
rent
[A]
Stator Current Spectrum for Motor B
Healthy Rotor Induced Rotor Fault
1143 1144 1145 1146 1147 1148 11490
0.2
0.4
0.6
0.8
1
1.2
1.4
1.6
Frequency [Hz]
Cur
rent
[A]
Stator Current Spectrum for Motor B
Healthy Rotor Induced Rotor Fault
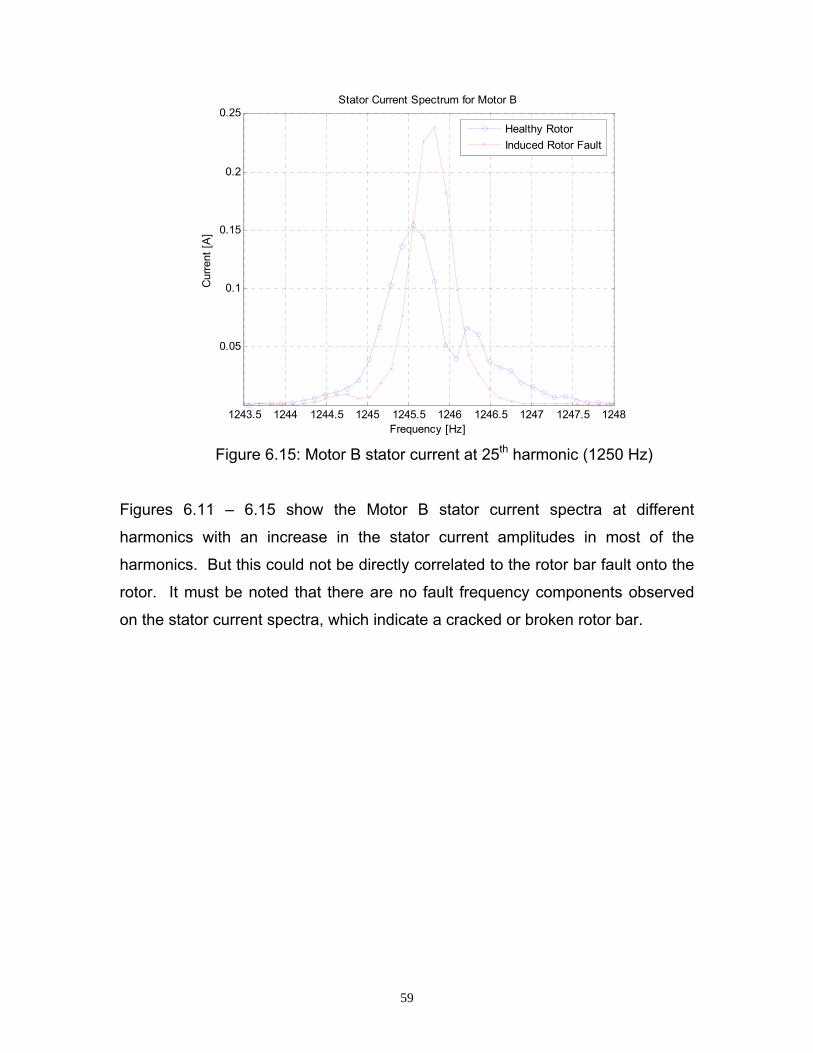
59
Figure 6.15: Motor B stator current at 25th harmonic (1250 Hz)
Figures 6.11 – 6.15 show the Motor B stator current spectra at different
harmonics with an increase in the stator current amplitudes in most of the
harmonics. But this could not be directly correlated to the rotor bar fault onto the
rotor. It must be noted that there are no fault frequency components observed
on the stator current spectra, which indicate a cracked or broken rotor bar.
1243.5 1244 1244.5 1245 1245.5 1246 1246.5 1247 1247.5 1248
0.05
0.1
0.15
0.2
0.25
Frequency [Hz]
Cur
rent
[A]
Stator Current Spectrum for Motor B
Healthy Rotor Induced Rotor Fault
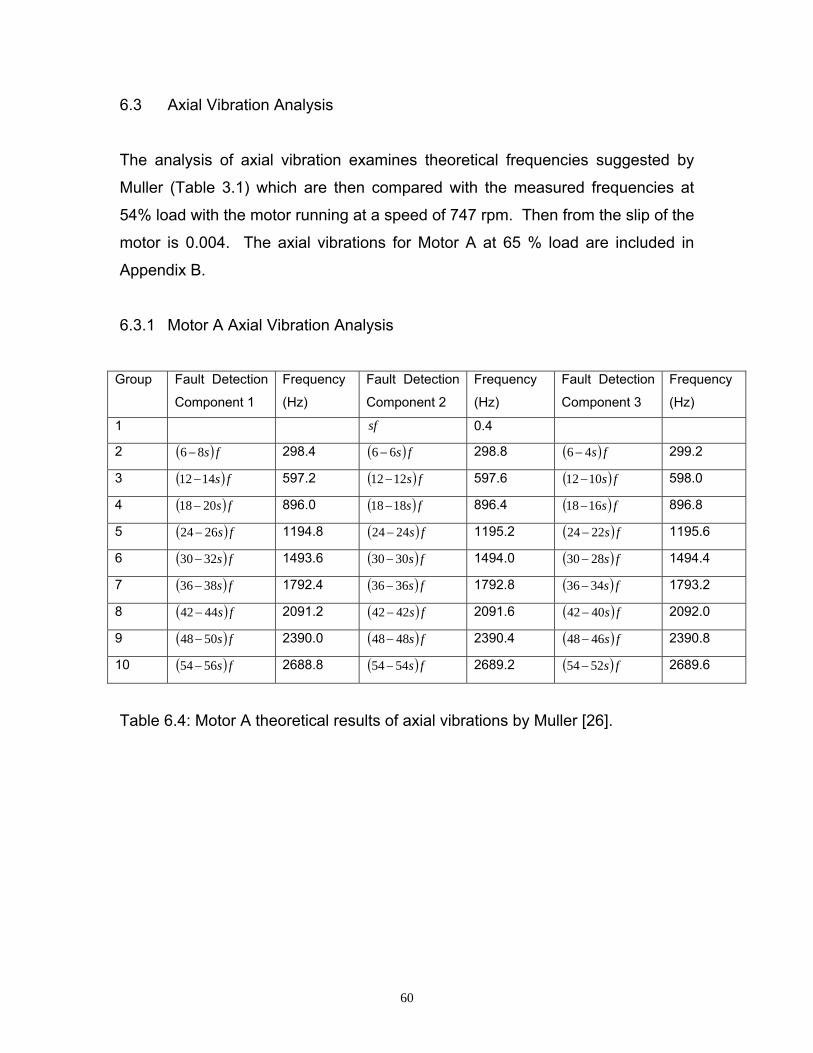
60
6.3 Axial Vibration Analysis
The analysis of axial vibration examines theoretical frequencies suggested by
Muller (Table 3.1) which are then compared with the measured frequencies at
54% load with the motor running at a speed of 747 rpm. Then from the slip of the
motor is 0.004. The axial vibrations for Motor A at 65 % load are included in
Appendix B.
6.3.1 Motor A Axial Vibration Analysis
Group Fault Detection
Component 1
Frequency
(Hz)
Fault Detection
Component 2
Frequency
(Hz)
Fault Detection
Component 3
Frequency
(Hz)
1 sf 0.4
2 ( ) fs86− 298.4 ( ) fs66− 298.8 ( ) fs46− 299.2
3 ( ) fs1412− 597.2 ( ) fs1212− 597.6 ( ) fs1012− 598.0
4 ( ) fs2018− 896.0 ( ) fs1818− 896.4 ( ) fs1618− 896.8
5 ( ) fs2624− 1194.8 ( ) fs2424− 1195.2 ( ) fs2224− 1195.6
6 ( ) fs3230− 1493.6 ( ) fs3030− 1494.0 ( ) fs2830− 1494.4
7 ( ) fs3836− 1792.4 ( ) fs3636− 1792.8 ( ) fs3436− 1793.2
8 ( ) fs4442− 2091.2 ( ) fs4242− 2091.6 ( ) fs4042− 2092.0
9 ( ) fs5048− 2390.0 ( ) fs4848− 2390.4 ( ) fs4648− 2390.8
10 ( ) fs5654− 2688.8 ( ) fs5454− 2689.2 ( ) fs5254− 2689.6
Table 6.4: Motor A theoretical results of axial vibrations by Muller [26].

61
Figure 6.16: Motor A 1st group of axial vibrations fault frequencies
Figure 6.17: Motor A 2nd group of axial vibrations fault frequencies
596 596.5 597 597.5 598 598.5 599 599.5 600
2
4
6
8
10
12
x 10-4
Frequency [Hz]
Axi
al V
ibra
tion
[G's
]
Axial Vibration Spectrum for Motor A
Healthy RotorInduced Rotor Fault
297.5 298 298.5 299 299.5 300 300.5 3010
0.5
1
1.5
2
2.5
3x 10⁻³
Frequency [Hz]
Axi
al V
ibra
tion
[G's
]
Axial Vibration Spectrum for Motor A
Healthy RotorInduced Rotor Fault
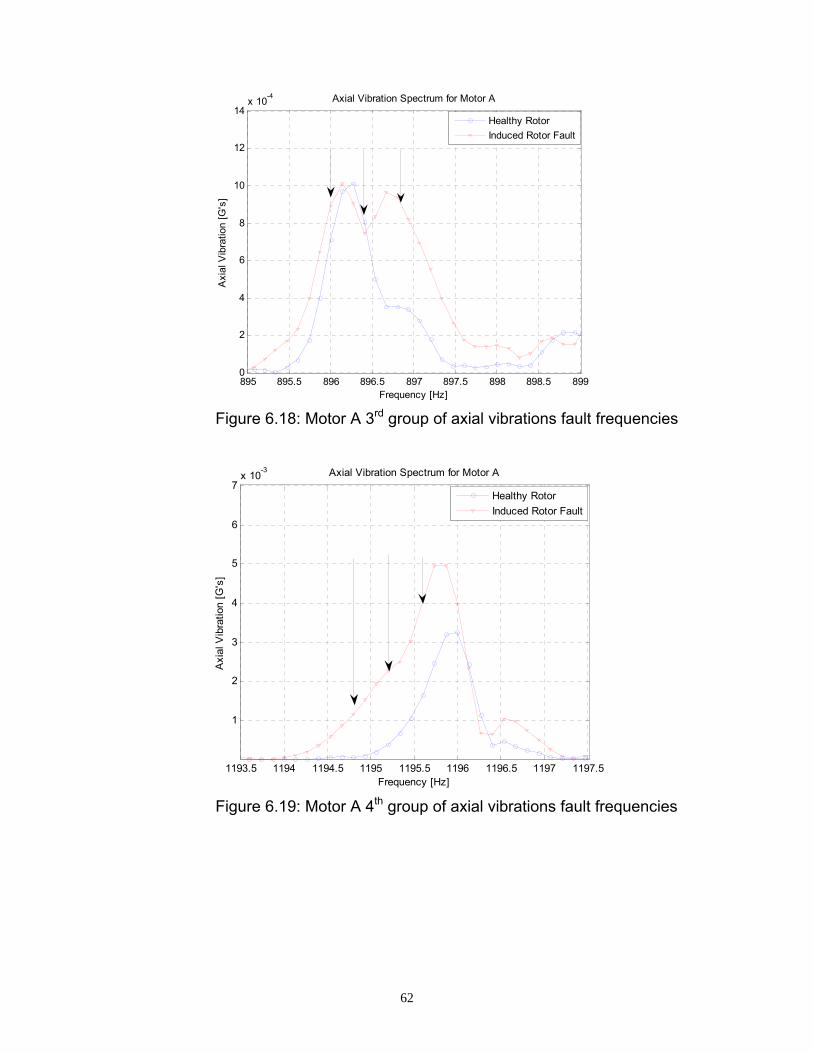
62
Figure 6.18: Motor A 3rd group of axial vibrations fault frequencies
Figure 6.19: Motor A 4th group of axial vibrations fault frequencies
895 895.5 896 896.5 897 897.5 898 898.5 8990
2
4
6
8
10
12
14x 10-4
Frequency [Hz]
Axi
al V
ibra
tion
[G's
]
Axial Vibration Spectrum for Motor A
Healthy RotorInduced Rotor Fault
1193.5 1194 1194.5 1195 1195.5 1196 1196.5 1197 1197.5
1
2
3
4
5
6
7x 10⁻³
Frequency [Hz]
Axi
al V
ibra
tion
[G's
]
Axial Vibration Spectrum for Motor A
Healthy RotorInduced Rotor Fault
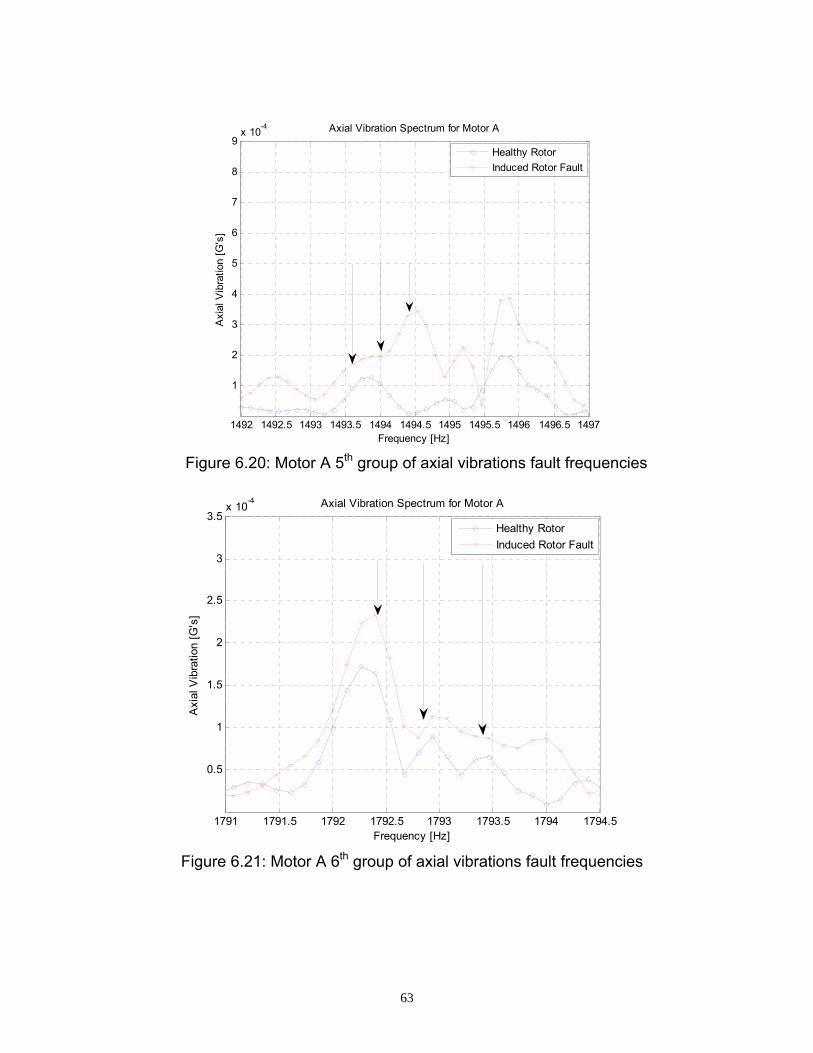
63
Figure 6.20: Motor A 5th group of axial vibrations fault frequencies
Figure 6.21: Motor A 6th group of axial vibrations fault frequencies
1492 1492.5 1493 1493.5 1494 1494.5 1495 1495.5 1496 1496.5 1497
1
2
3
4
5
6
7
8
9x 10⁻⁴
Frequency [Hz]
Axi
al V
ibra
tion
[G's
]
Axial Vibration Spectrum for Motor A
Healthy RotorInduced Rotor Fault
1791 1791.5 1792 1792.5 1793 1793.5 1794 1794.5
0.5
1
1.5
2
2.5
3
3.5x 10⁻⁴
Frequency [Hz]
Axi
al V
ibra
tion
[G's
]
Axial Vibration Spectrum for Motor A
Healthy RotorInduced Rotor Fault

64
Figure 6.22: Motor A 7th group of axial vibrations fault frequencies
Figure 6.23: Motor A 8th group of axial vibrations fault frequencies
2091 2091.2 2091.4 2091.6 2091.8 2092 2092.2 2092.4 2092.6 2092.8
2
4
6
8
10
12
14
x 10-4
Frequency [Hz]
Axi
al V
ibra
tion
[G's
]
Axial Vibration Spectrum for Motor A
Healthy RotorInduced Rotor Fault
2388 2388.5 2389 2389.5 2390 2390.5 2391 2391.5 2392 2392.5 23930
1
2
3
4
5
6
7x 10⁻⁴
Frequency [Hz]
Axi
al V
ibra
tion
[G's
]
Axial Vibration Spectrum for Motor A
Healthy RotorInduced Rotor Fault

65
Figure 6.24: Motor A 9th group of axial vibrations fault frequencies
The axial vibration broken rotor bar detection frequencies recommended by
Muller [24] are observed and indicated in the Motor A axial vibration spectra fig.
6.16 – 6.24.
2687 2687.5 2688 2688.5 2689 2689.5 2690 2690.5 2691 2691.50
2
4
6
8
10
12
14x 10-5
Frequency [Hz]
Axi
al V
ibra
tion
[G's
]
Axial Vibration Spectrum for Motor A
Healthy RotorInduced Rotor Fault
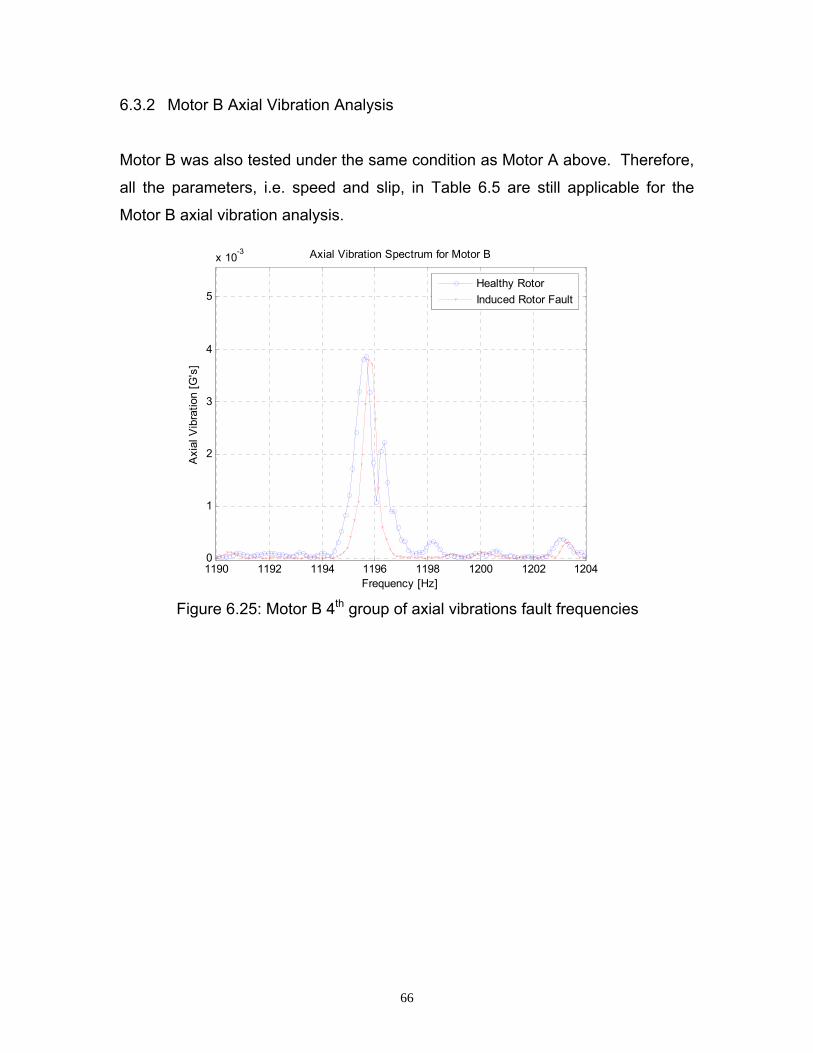
66
6.3.2 Motor B Axial Vibration Analysis
Motor B was also tested under the same condition as Motor A above. Therefore,
all the parameters, i.e. speed and slip, in Table 6.5 are still applicable for the
Motor B axial vibration analysis.
Figure 6.25: Motor B 4th group of axial vibrations fault frequencies
1190 1192 1194 1196 1198 1200 1202 12040
1
2
3
4
5
x 10-3
Frequency [Hz]
Axi
al V
ibra
tion
[G's
]
Axial Vibration Spectrum for Motor B
Healthy RotorInduced Rotor Fault
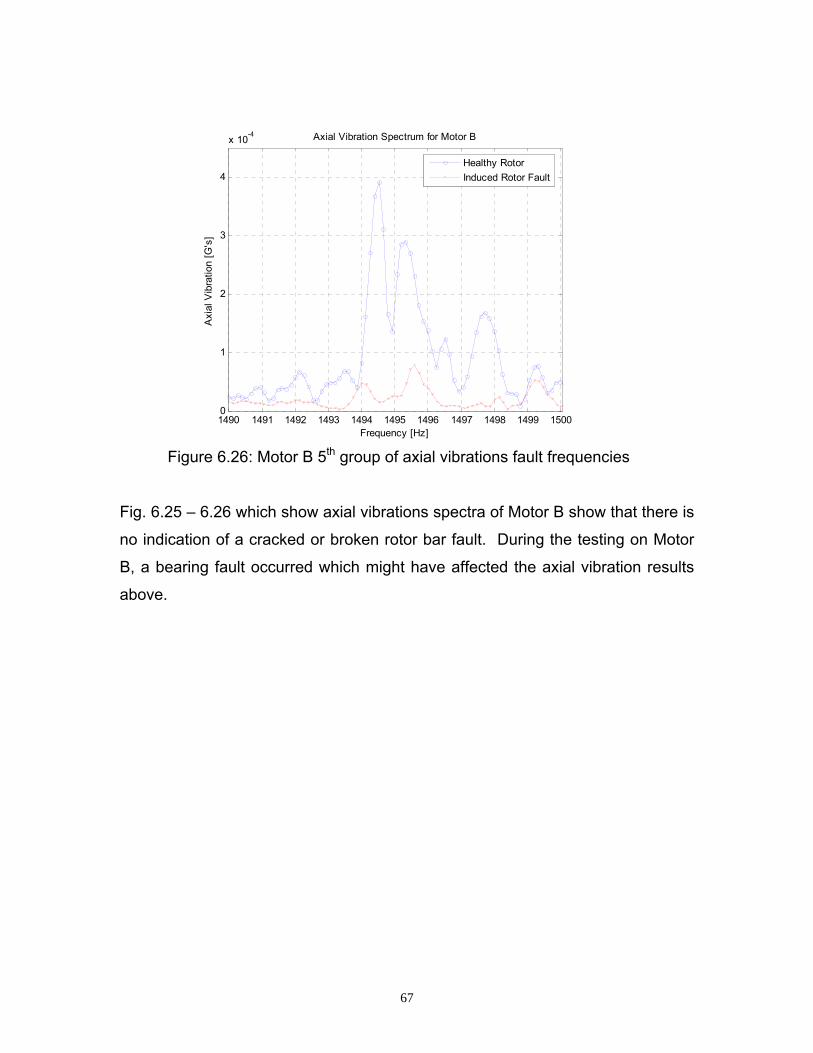
67
Figure 6.26: Motor B 5th group of axial vibrations fault frequencies
Fig. 6.25 – 6.26 which show axial vibrations spectra of Motor B show that there is
no indication of a cracked or broken rotor bar fault. During the testing on Motor
B, a bearing fault occurred which might have affected the axial vibration results
above.
1490 1491 1492 1493 1494 1495 1496 1497 1498 1499 15000
1
2
3
4
x 10-4
Frequency [Hz]
Axi
al V
ibra
tion
[G's
]
Axial Vibration Spectrum for Motor B
Healthy RotorInduced Rotor Fault
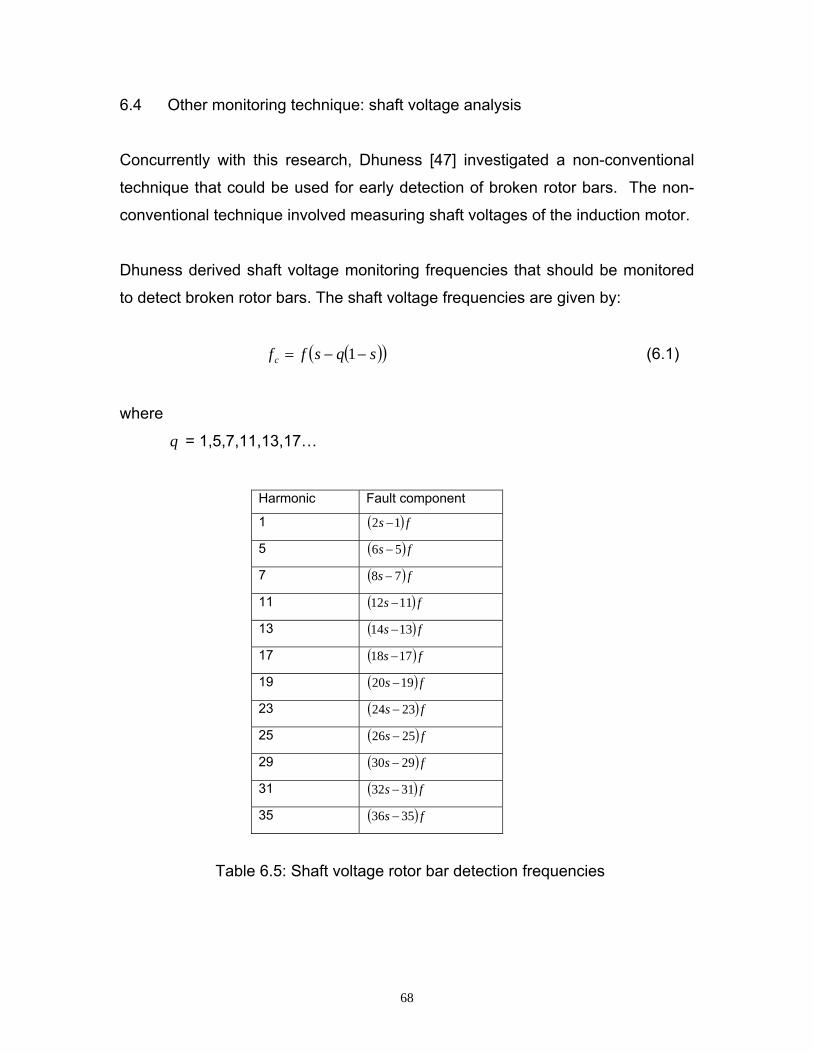
68
6.4 Other monitoring technique: shaft voltage analysis
Concurrently with this research, Dhuness [47] investigated a non-conventional
technique that could be used for early detection of broken rotor bars. The non-
conventional technique involved measuring shaft voltages of the induction motor.
Dhuness derived shaft voltage monitoring frequencies that should be monitored
to detect broken rotor bars. The shaft voltage frequencies are given by:
( )( )sqsffc −−= 1 (6.1)
where
q = 1,5,7,11,13,17…
Harmonic Fault component
1 ( ) fs 12 −
5 ( ) fs 56 −
7 ( ) fs 78 −
11 ( ) fs 1112 −
13 ( ) fs 1314 −
17 ( ) fs 1718 −
19 ( ) fs 1920 −
23 ( ) fs 2324 −
25 ( ) fs 2526 −
29 ( ) fs 2930 −
31 ( ) fs 3132 −
35 ( ) fs 3536 −
Table 6.5: Shaft voltage rotor bar detection frequencies
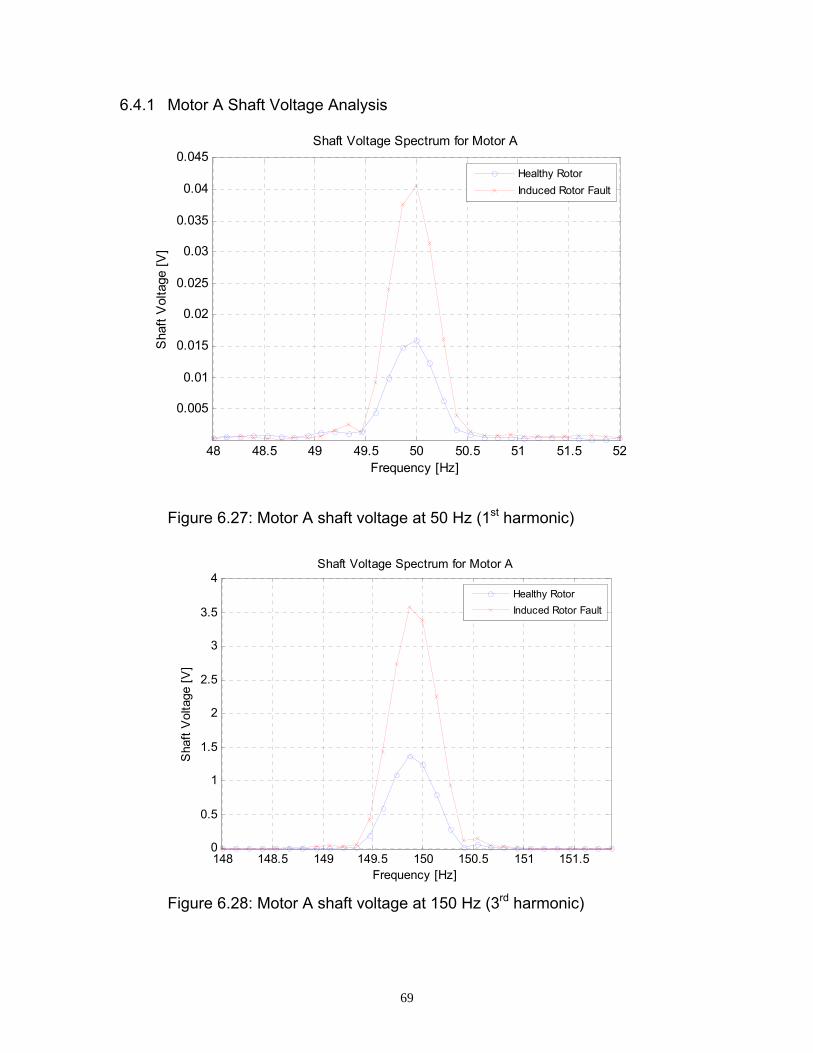
69
6.4.1 Motor A Shaft Voltage Analysis
Figure 6.27: Motor A shaft voltage at 50 Hz (1st harmonic)
Figure 6.28: Motor A shaft voltage at 150 Hz (3rd harmonic)
148 148.5 149 149.5 150 150.5 151 151.50
0.5
1
1.5
2
2.5
3
3.5
4
Frequency [Hz]
Sha
ft V
olta
ge [V
]
Shaft Voltage Spectrum for Motor A
Healthy RotorInduced Rotor Fault
48 48.5 49 49.5 50 50.5 51 51.5 52
0.005
0.01
0.015
0.02
0.025
0.03
0.035
0.04
0.045
Frequency [Hz]
Sha
ft V
olta
ge [V
]Shaft Voltage Spectrum for Motor A
Healthy RotorInduced Rotor Fault
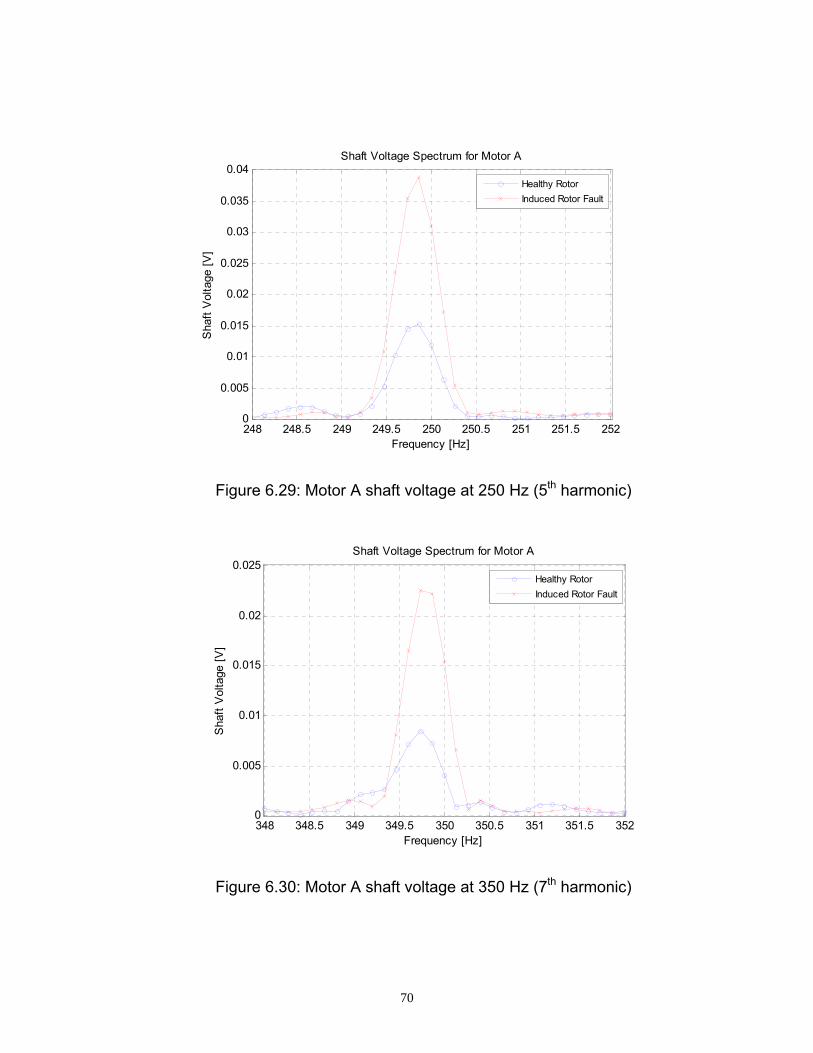
70
Figure 6.29: Motor A shaft voltage at 250 Hz (5th harmonic)
Figure 6.30: Motor A shaft voltage at 350 Hz (7th harmonic)
248 248.5 249 249.5 250 250.5 251 251.5 2520
0.005
0.01
0.015
0.02
0.025
0.03
0.035
0.04
Frequency [Hz]
Sha
ft V
olta
ge [V
]
Shaft Voltage Spectrum for Motor A
Healthy RotorInduced Rotor Fault
348 348.5 349 349.5 350 350.5 351 351.5 3520
0.005
0.01
0.015
0.02
0.025
Frequency [Hz]
Sha
ft V
olta
ge [V
]
Shaft Voltage Spectrum for Motor A
Healthy RotorInduced Rotor Fault
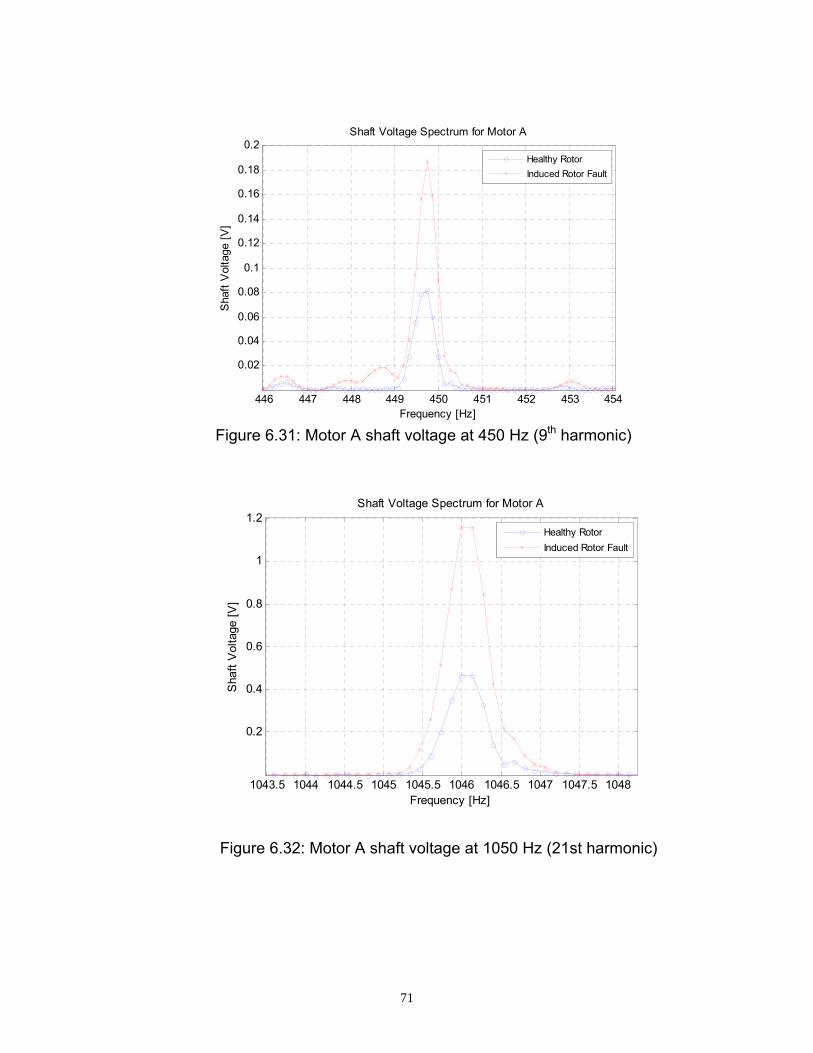
71
Figure 6.31: Motor A shaft voltage at 450 Hz (9th harmonic)
Figure 6.32: Motor A shaft voltage at 1050 Hz (21st harmonic)
446 447 448 449 450 451 452 453 454
0.02
0.04
0.06
0.08
0.1
0.12
0.14
0.16
0.18
0.2
Frequency [Hz]
Sha
ft V
olta
ge [V
]
Shaft Voltage Spectrum for Motor A
Healthy RotorInduced Rotor Fault
1043.5 1044 1044.5 1045 1045.5 1046 1046.5 1047 1047.5 1048
0.2
0.4
0.6
0.8
1
1.2
Frequency [Hz]
Sha
ft V
olta
ge [V
]
Shaft Voltage Spectrum for Motor A
Healthy RotorInduced Rotor Fault
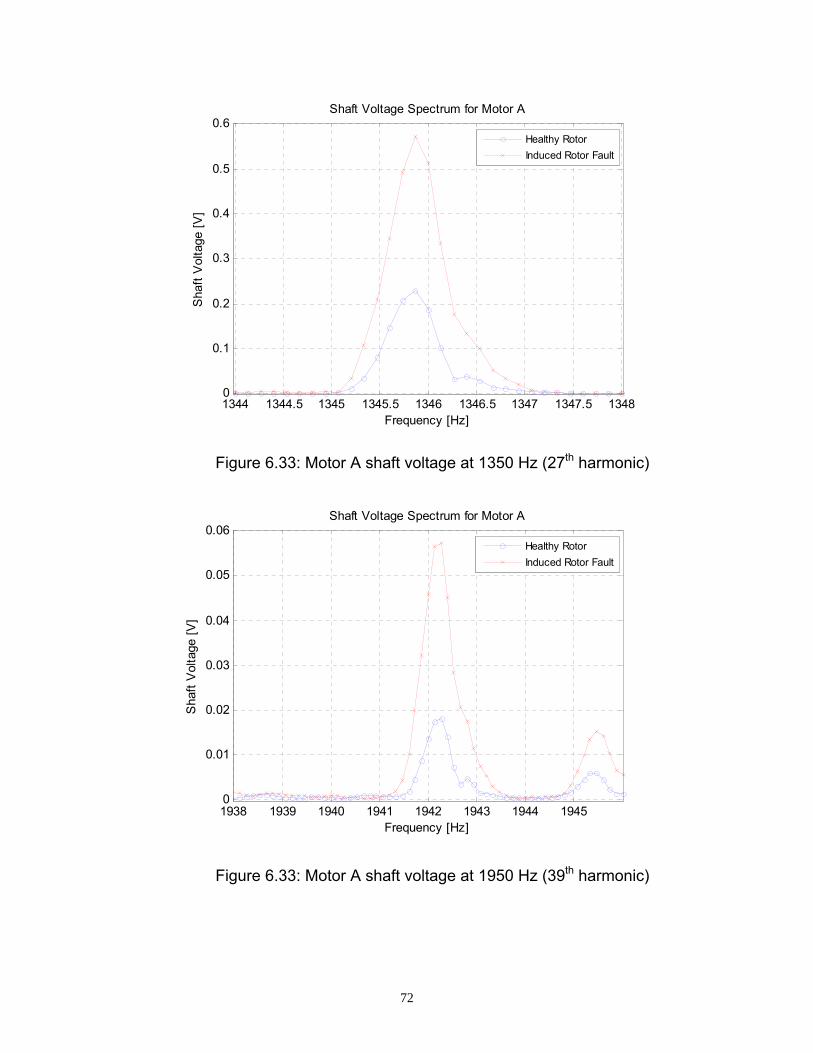
72
Figure 6.33: Motor A shaft voltage at 1350 Hz (27th harmonic)
Figure 6.33: Motor A shaft voltage at 1950 Hz (39th harmonic)
1344 1344.5 1345 1345.5 1346 1346.5 1347 1347.5 13480
0.1
0.2
0.3
0.4
0.5
0.6
Frequency [Hz]
Sha
ft V
olta
ge [V
]
Shaft Voltage Spectrum for Motor A
Healthy RotorInduced Rotor Fault
1938 1939 1940 1941 1942 1943 1944 19450
0.01
0.02
0.03
0.04
0.05
0.06
Frequency [Hz]
Sha
ft V
olta
ge [V
]
Shaft Voltage Spectrum for Motor A
Healthy RotorInduced Rotor Fault
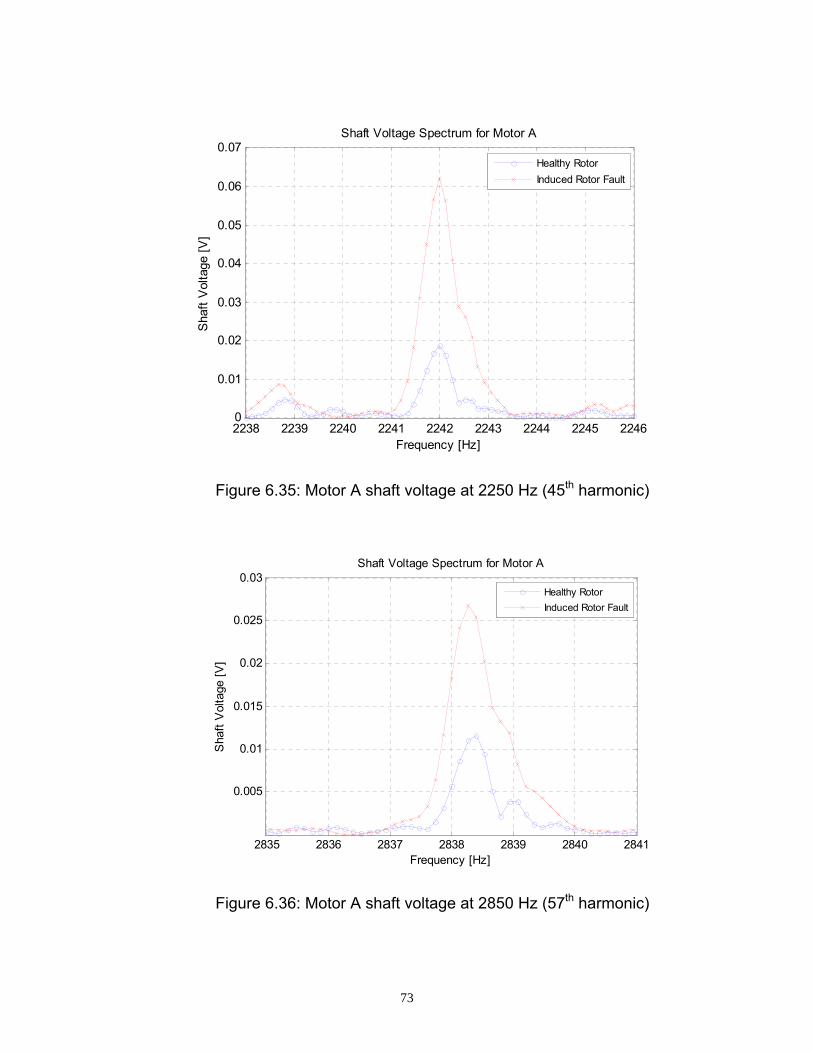
73
Figure 6.35: Motor A shaft voltage at 2250 Hz (45th harmonic)
Figure 6.36: Motor A shaft voltage at 2850 Hz (57th harmonic)
2238 2239 2240 2241 2242 2243 2244 2245 22460
0.01
0.02
0.03
0.04
0.05
0.06
0.07
Frequency [Hz]
Sha
ft V
olta
ge [V
]
Shaft Voltage Spectrum for Motor A
Healthy RotorInduced Rotor Fault
2835 2836 2837 2838 2839 2840 2841
0.005
0.01
0.015
0.02
0.025
0.03
Frequency [Hz]
Sha
ft V
olta
ge [V
]
Shaft Voltage Spectrum for Motor A
Healthy RotorInduced Rotor Fault
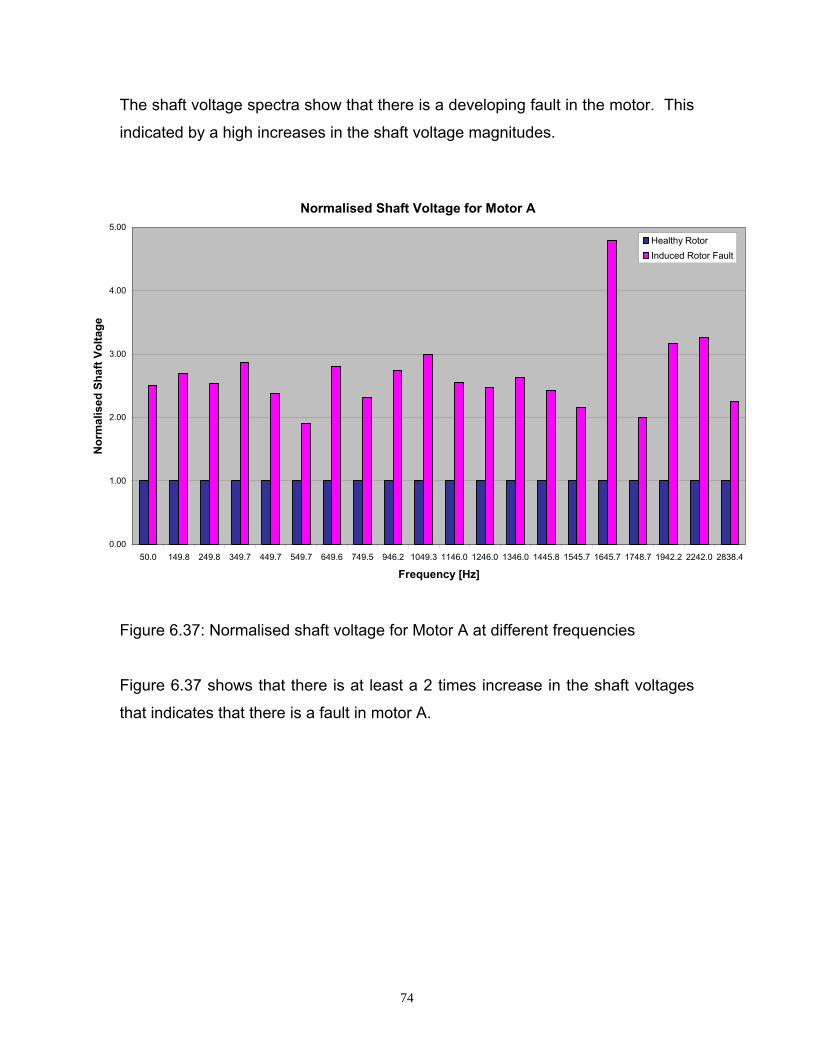
74
The shaft voltage spectra show that there is a developing fault in the motor. This
indicated by a high increases in the shaft voltage magnitudes.
Figure 6.37: Normalised shaft voltage for Motor A at different frequencies
Figure 6.37 shows that there is at least a 2 times increase in the shaft voltages
that indicates that there is a fault in motor A.
Normalised Shaft Voltage for Motor A
0.00
1.00
2.00
3.00
4.00
5.00
50.0 149.8 249.8 349.7 449.7 549.7 649.6 749.5 946.2 1049.3 1146.0 1246.0 1346.0 1445.8 1545.7 1645.7 1748.7 1942.2 2242.0 2838.4
Frequency [Hz]
Nor
mal
ised
Sha
ft Vo
ltage
Healthy RotorInduced Rotor Fault
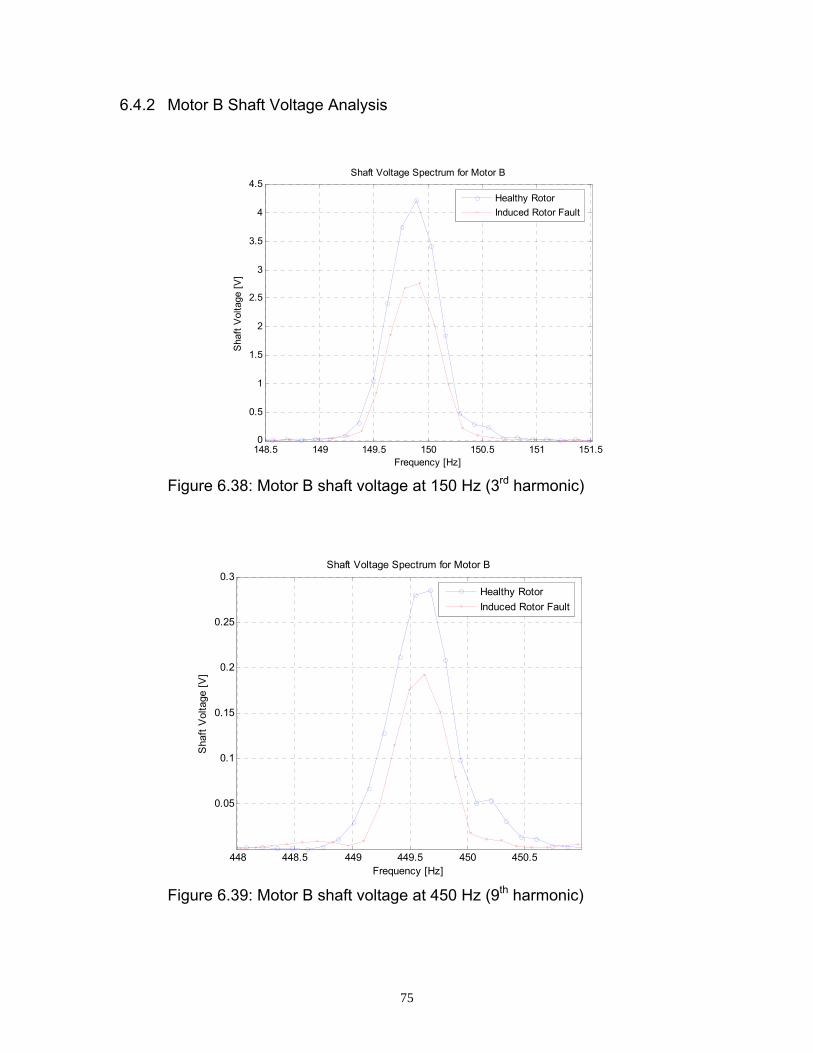
75
6.4.2 Motor B Shaft Voltage Analysis
Figure 6.38: Motor B shaft voltage at 150 Hz (3rd harmonic)
Figure 6.39: Motor B shaft voltage at 450 Hz (9th harmonic)
148.5 149 149.5 150 150.5 151 151.50
0.5
1
1.5
2
2.5
3
3.5
4
4.5
Frequency [Hz]
Sha
ft V
olta
ge [V
]
Shaft Voltage Spectrum for Motor B
Healthy Rotor Induced Rotor Fault
448 448.5 449 449.5 450 450.5
0.05
0.1
0.15
0.2
0.25
0.3
Frequency [Hz]
Sha
ft V
olta
ge [V
]
Shaft Voltage Spectrum for Motor B
Healthy Rotor Induced Rotor Fault
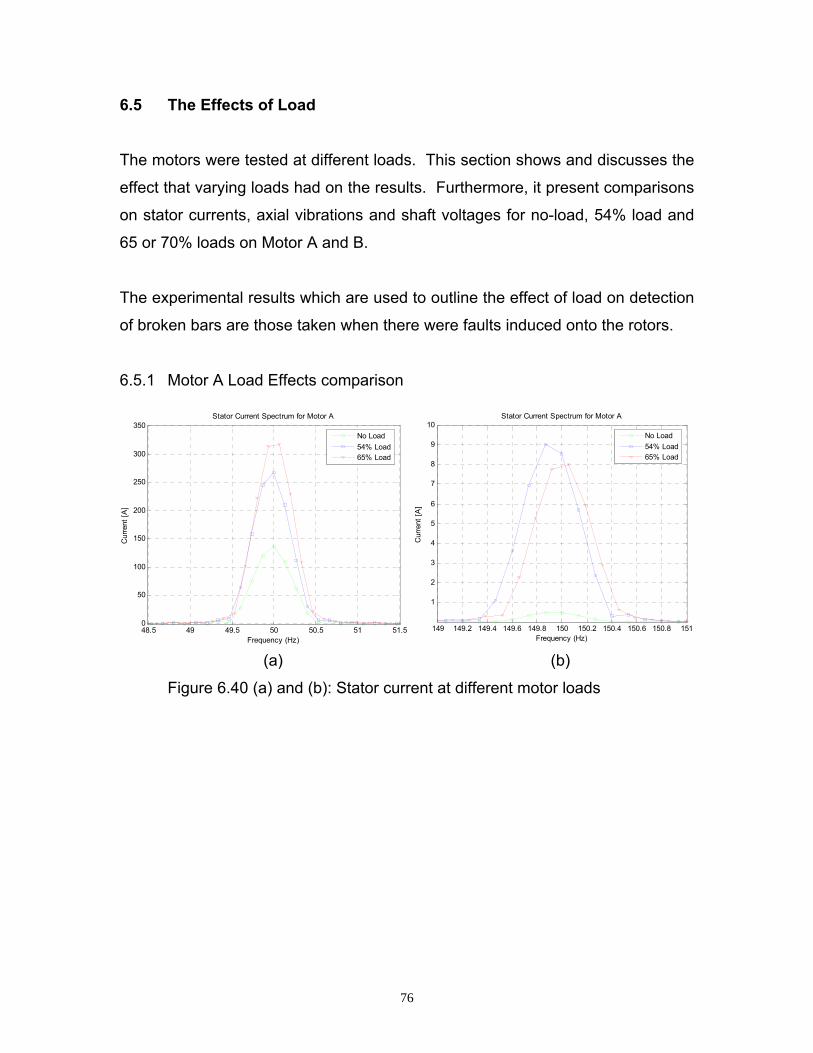
76
6.5 The Effects of Load
The motors were tested at different loads. This section shows and discusses the
effect that varying loads had on the results. Furthermore, it present comparisons
on stator currents, axial vibrations and shaft voltages for no-load, 54% load and
65 or 70% loads on Motor A and B.
The experimental results which are used to outline the effect of load on detection
of broken bars are those taken when there were faults induced onto the rotors.
6.5.1 Motor A Load Effects comparison
(a) (b)
Figure 6.40 (a) and (b): Stator current at different motor loads
48.5 49 49.5 50 50.5 51 51.50
50
100
150
200
250
300
350
Frequency (Hz)
Cur
rent
[A]
Stator Current Spectrum for Motor A
No Load54% Load65% Load
149 149.2 149.4 149.6 149.8 150 150.2 150.4 150.6 150.8 151
1
2
3
4
5
6
7
8
9
10
Frequency (Hz)
Cur
rent
[A]
Stator Current Spectrum for Motor A
No Load54% Load65% Load
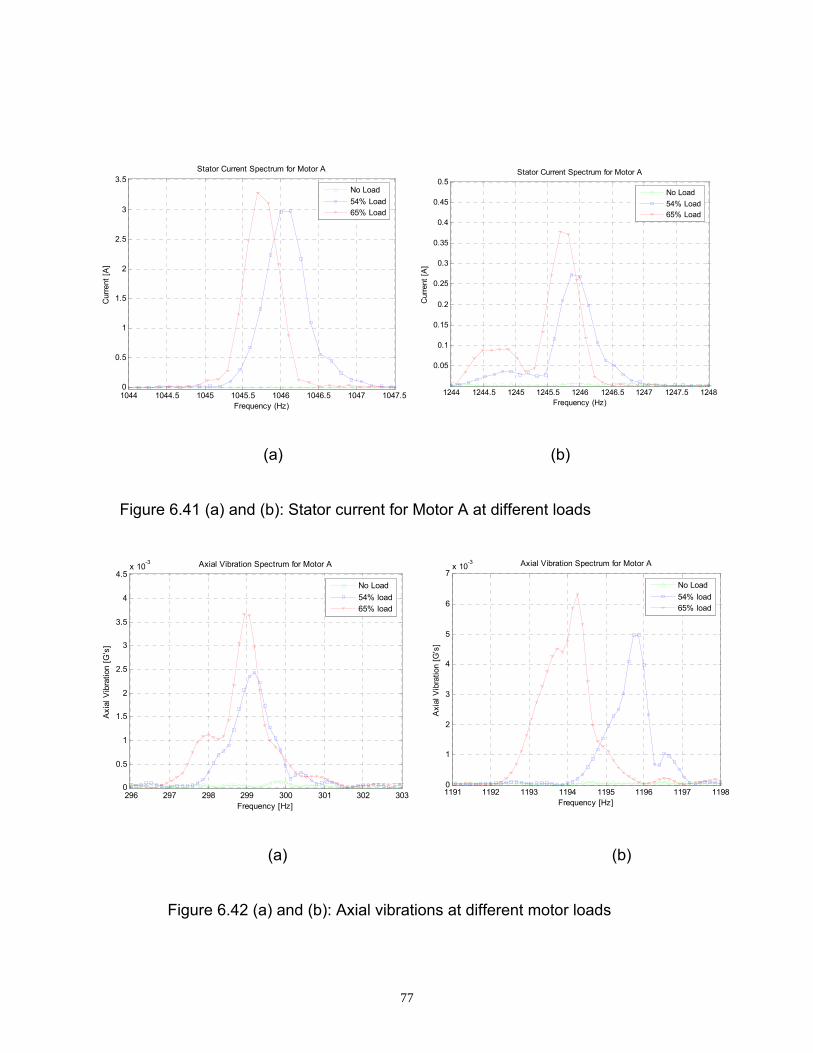
77
(a) (b)
Figure 6.41 (a) and (b): Stator current for Motor A at different loads
(a) (b)
Figure 6.42 (a) and (b): Axial vibrations at different motor loads
1244 1244.5 1245 1245.5 1246 1246.5 1247 1247.5 1248
0.05
0.1
0.15
0.2
0.25
0.3
0.35
0.4
0.45
0.5
Frequency (Hz)
Cur
rent
[A]
Stator Current Spectrum for Motor A
No Load54% Load65% Load
1044 1044.5 1045 1045.5 1046 1046.5 1047 1047.50
0.5
1
1.5
2
2.5
3
3.5
Frequency (Hz)
Cur
rent
[A]
Stator Current Spectrum for Motor A
No Load54% Load65% Load
296 297 298 299 300 301 302 3030
0.5
1
1.5
2
2.5
3
3.5
4
4.5x 10⁻³ Axial Vibration Spectrum for Motor A
Frequency [Hz]
Axi
al V
ibra
tion
[G's
]
No Load54% load65% load
1191 1192 1193 1194 1195 1196 1197 11980
1
2
3
4
5
6
7x 10⁻³ Axial Vibration Spectrum for Motor A
Frequency [Hz]
Axi
al V
ibra
tion
[G's
]
No Load54% load65% load
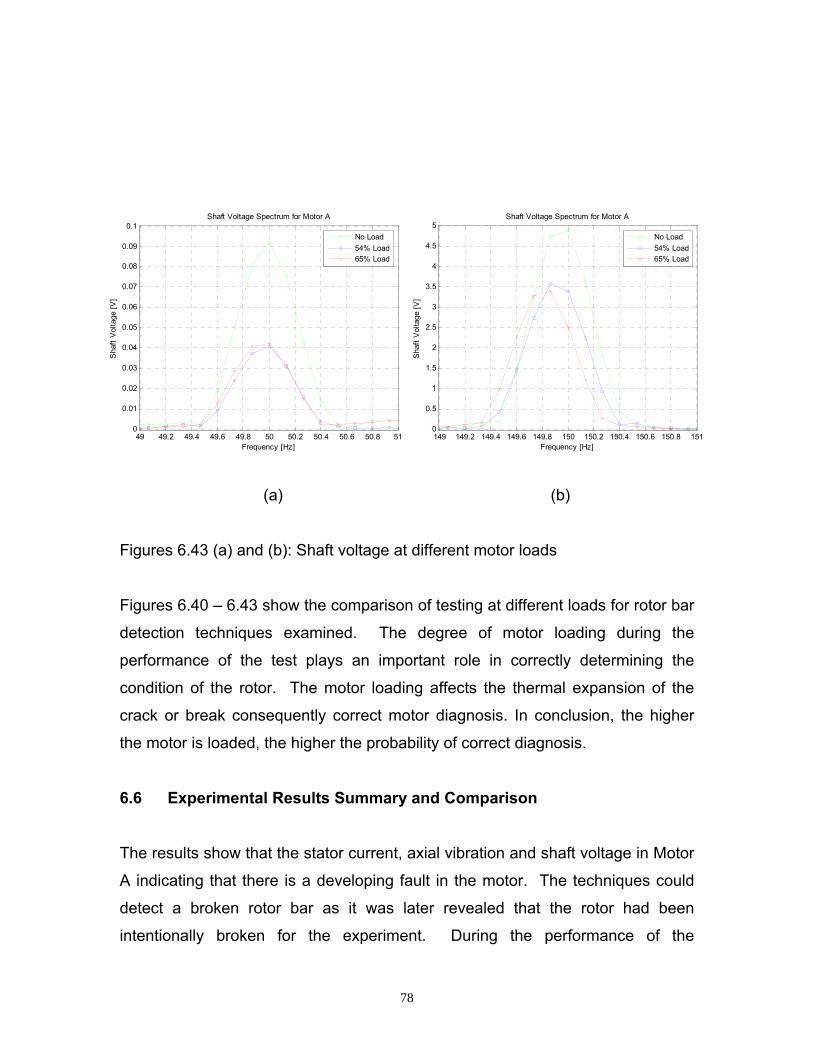
78
(a) (b)
Figures 6.43 (a) and (b): Shaft voltage at different motor loads
Figures 6.40 – 6.43 show the comparison of testing at different loads for rotor bar
detection techniques examined. The degree of motor loading during the
performance of the test plays an important role in correctly determining the
condition of the rotor. The motor loading affects the thermal expansion of the
crack or break consequently correct motor diagnosis. In conclusion, the higher
the motor is loaded, the higher the probability of correct diagnosis.
6.6 Experimental Results Summary and Comparison
The results show that the stator current, axial vibration and shaft voltage in Motor
A indicating that there is a developing fault in the motor. The techniques could
detect a broken rotor bar as it was later revealed that the rotor had been
intentionally broken for the experiment. During the performance of the
49 49.2 49.4 49.6 49.8 50 50.2 50.4 50.6 50.8 510
0.01
0.02
0.03
0.04
0.05
0.06
0.07
0.08
0.09
0.1
Frequency [Hz]
Sha
ft V
olta
ge [V
]
Shaft Voltage Spectrum for Motor A
No Load54% Load65% Load
149 149.2 149.4 149.6 149.8 150 150.2 150.4 150.6 150.8 1510
0.5
1
1.5
2
2.5
3
3.5
4
4.5
5
Frequency [Hz]
Sha
ft V
olta
ge [V
]
Shaft Voltage Spectrum for Motor A
No Load54% Load65% Load
79
experiment on Motor B a bearing fault occurred which might have affected the
results above. The stator current, however was not greatly affected by the
developing bearing fault. The results of the stator current show some variations
in the stator current fault frequencies but could not be correlated to any fault.
Motor B was later revealed to have had a half broken bar fault induced on the
rotor.
6.7 Experimental Results Conclusion
The theoretical rotor bar fault frequencies were observed in the experimental
results in each technique with the stator current fault frequencies having been
verified by the simulation.
Both Motor A and Motor B were verified to have had no broken rotor bars before
commencing the experiment. Thereafter, in Motor A, a completely broken rotor
bar fault was induced and in Motor B, a half broken rotor bar fault was induced.
The completely broken rotor bar fault, in Motor A, could be detected by the stator
current analysis, axial vibration analysis and the shaft voltage analysis.
However, the half broken rotor bar could not be detected in Motor B due to a
bearing develop fault in the motor.

80
CHAPTER 7 CONCLUSION AND RECOMMENDEND FUTURE WORK
7.1 Research Report Summary
Chapter 1 outlined the overview of this research, states the problem statement
and rotor bar failure mechanisms or rather causes of rotor bar/s breaks.
Chapter 2 highlighted previous researches and case studies conducted on
detection of broken rotor bars which has assisted in better understanding of the
existence of interbar currents and axial forces, factors influencing early detection
of broken rotor bars and development of broken rotor bar detection techniques.
Chapter 3 discussed the literature and analysis of different broken rotor bar
detection techniques. These detection phenomena originated from previous
research presented in Chapter 2. The broken rotor bars identifying frequencies
in each technique were also presented.
Chapter 4 presented modelling of a broken rotor bar simulation using Maxwell
2D. The simulation was performed to investigate the induction motor stator
current that is how the sidebands change in a single broken bar rotor with
respect to a healthy rotor.
Chapter 5 discussed the experimental work conducted to validate the literature
and practical implementation of the techniques. This chapter explains the
measuring process and the set up of the equipment used in the experimental
work, capturing and analysis of data.
Chapter 6 presented the experimental results from the industrial tests performed
on the research with discussions of measurements taken. Finally, Chapter 7
81
presents the conclusion and recommendations on the effective technique on
detection of broken rotor bars during operation.
7.2 Research Report Conclusion
The main objective of this research was to determine an optimal technique for
detection of a cracked and broken rotor bar in medium voltage motors during
operation. Additionally, to give recommendations that can be used to develop
guidelines for the implementation of the technique.
Based on the theory and experimental measurement results, presented on this
report, the motor stator current analysis proved to be a more reliable rotor bar
detection technique. Hence the motor stator current analysis was determined as
an optimal technique for detection of broken rotor bar in medium voltage motors.
The author recommends the utilization of the motor stator current analysis
supported by axial vibration analysis with the following conditions:
1. The induction motor is loaded as high as possible but not less than 50%
during taking of the measurements.
2. The measurements are to be taken and trended at the same load over a
period of time depending on the criticality of the induction motor.
3. Baseline measurements are recommended on all medium voltage squirrel
cage induction motors with one measurement for every six months taken
thereafter for one year. Then the induction motor operations and number
of starts the motor endures can be used to determine the frequency of
measurements required.
4. Safety measures need to be enforced during the performance of
measurements to ensure safety of the testing personnel as the motors will
be tested on load.
5. The possibility of interbar currents being present in the motor should be
investigated as they can influence the detection of a broken rotor bar. If
82
this information is not readily available, the possibility of interbar being
present in the machine in question should be held in mind.
6. The number of stator slots and the number of rotor bars must be known in
order to determine some of the fault frequencies to be observed during the
measurements analysis.
7. Vibration measurements must be taken in the same motor bearing
housing position. Vibrations are transmitted to the bearing housing as well
as the stator frame but the bearing housing will give a better
measurements. The type of bearings used in the motor also has an effect
on the transmission of the exciting forces.
The shaft voltage analysis is a non-conventional technique that was investigated
in this research. The shaft voltage analysis results show that the technique can
be used to detect broken rotor bars in squirrel cage induction motors during
operation but a further investigation is required to confirm reliability for diagnosis
of large induction machines.
Stator current analysis is the optimal technique, presently, for early detection of a
broken rotor bar under operating condition in medium voltage induction motors.
The results for a cracked rotor bar did not yield any conclusive rotor bar detection
diagnosis. Axial vibration analysis can be used as a secondary technique to
stator current analysis. But it must be noted that the stator current analysis or
any other technique cannot presently be used a one time diagnostic tool for a
broken rotor bar, periodic non-intrusive trending is recommended.
7.3 Recommendations for further research
An investigation of axial flux (leakage) monitoring as an alternation technique for
early detection of broken rotor bars is recommended with also more exploration
of the shaft voltage analysis.

83
Zachas [42] showed that there is heating which follows the same distribution as
the interbar currents and is concentrated at the unhealthy side of the broken rotor
bar. He recommended utilisation of a thermal camera to evaluate the distribution
of heat along a broken rotor bar. During the testing phase of this research, this
was not explored but seems to be a consideration for future testing. This may
seem to be a much quicker way to non-invasively detect broken rotor bars in
motors when interbar currents are present.
The currently available technology, which is normally utilized in the industry need
to be investigated and is presented in this report Appendix E but more
technology, needs to be developed for detection of broken rotor bars.
There is a need to set up a standard for performance of each broken rotor bar
detection technique. Furthermore, compilation of a guideline for analysing the
data captured for the tests, indicating which frequencies correlate to broken rotor
bar.
Training of condition monitoring personnel in terms of performing the detection
techniques, data capturing and analysis is highly recommended with the
information presented in this research report.
The author hopes that the research report recommendations assist in early
detection of a cracked and a single broken rotor bar on-line during operation
without intrusion to the motor.
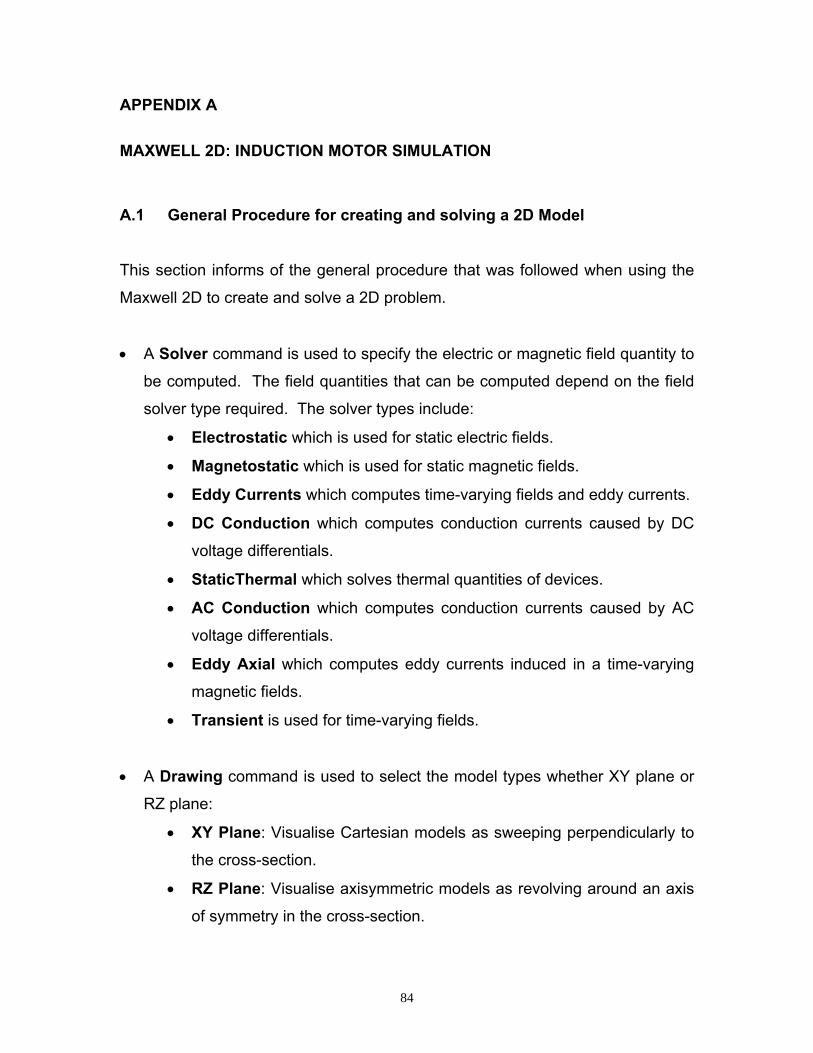
84
APPENDIX A MAXWELL 2D: INDUCTION MOTOR SIMULATION A.1 General Procedure for creating and solving a 2D Model This section informs of the general procedure that was followed when using the
Maxwell 2D to create and solve a 2D problem.
• A Solver command is used to specify the electric or magnetic field quantity to
be computed. The field quantities that can be computed depend on the field
solver type required. The solver types include:
• Electrostatic which is used for static electric fields.
• Magnetostatic which is used for static magnetic fields.
• Eddy Currents which computes time-varying fields and eddy currents.
• DC Conduction which computes conduction currents caused by DC
voltage differentials.
• StaticThermal which solves thermal quantities of devices.
• AC Conduction which computes conduction currents caused by AC
voltage differentials.
• Eddy Axial which computes eddy currents induced in a time-varying
magnetic fields.
• Transient is used for time-varying fields.
• A Drawing command is used to select the model types whether XY plane or
RZ plane:
• XY Plane: Visualise Cartesian models as sweeping perpendicularly to
the cross-section.
• RZ Plane: Visualise axisymmetric models as revolving around an axis
of symmetry in the cross-section.
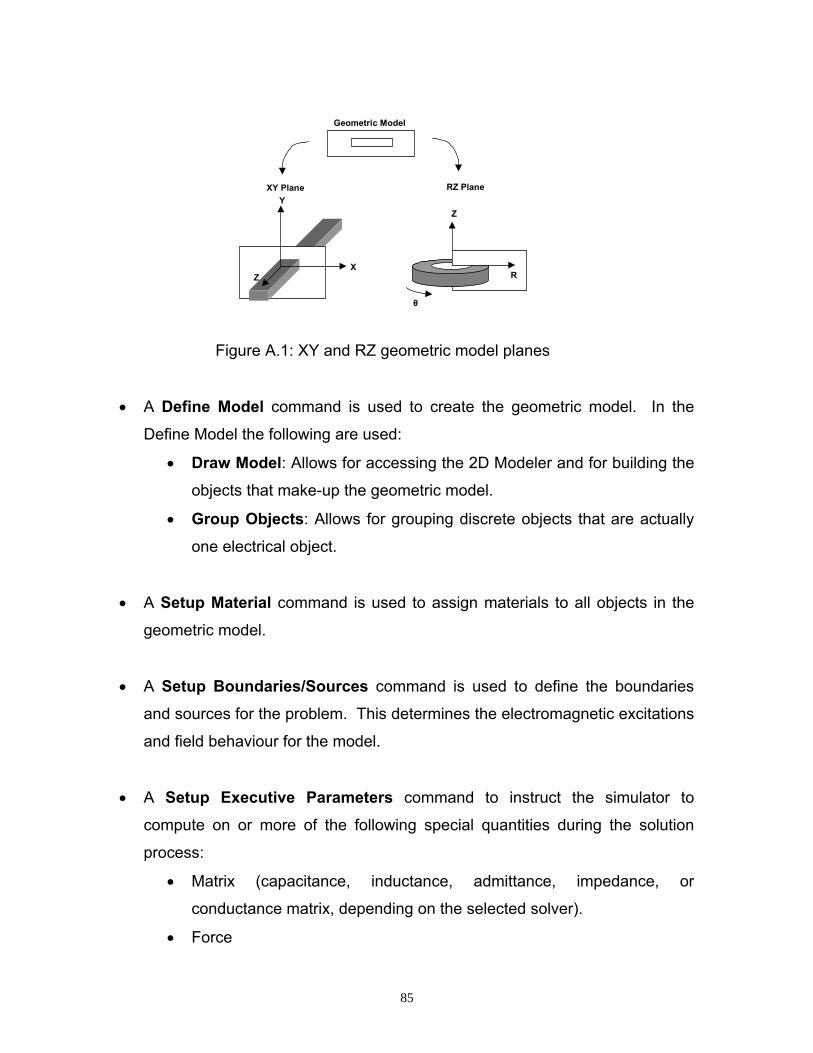
85
Figure A.1: XY and RZ geometric model planes
• A Define Model command is used to create the geometric model. In the
Define Model the following are used:
• Draw Model: Allows for accessing the 2D Modeler and for building the
objects that make-up the geometric model.
• Group Objects: Allows for grouping discrete objects that are actually
one electrical object.
• A Setup Material command is used to assign materials to all objects in the
geometric model.
• A Setup Boundaries/Sources command is used to define the boundaries
and sources for the problem. This determines the electromagnetic excitations
and field behaviour for the model.
• A Setup Executive Parameters command to instruct the simulator to
compute on or more of the following special quantities during the solution
process:
• Matrix (capacitance, inductance, admittance, impedance, or
conductance matrix, depending on the selected solver).
• Force
Y
XZ
Z
R
θ
XY Plane RZ Plane
Geometric Model

86
• Torque
• Flux Linkage
• Post Processor macros
• Current flow
• A Setup Solution/Options command is used to enter parameters that affect
how the solution is computed.
• A Setup Solution/Motion Setup command to define the motion parameters
of the system.
• A Solve/Nominal Problem command is used to solve the appropriate field
quantities.
• A Post Processor command is used to analyse the solution.
These commands must be chosen in the sequence presented above or as they
appear on the Maxwell 2D.
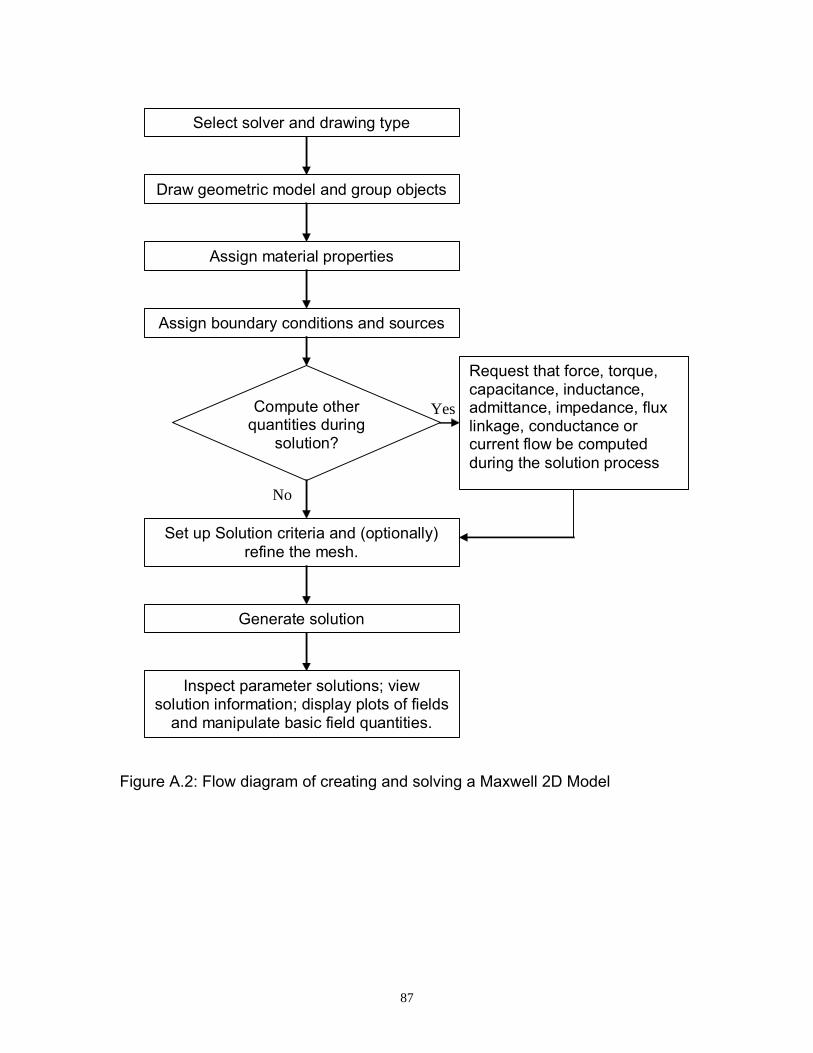
87
Figure A.2: Flow diagram of creating and solving a Maxwell 2D Model
Select solver and drawing type
Draw geometric model and group objects
Assign material properties
Assign boundary conditions and sources
Compute other quantities during
solution?
Set up Solution criteria and (optionally) refine the mesh.
Generate solution
Inspect parameter solutions; view solution information; display plots of fields
and manipulate basic field quantities.
Request that force, torque, capacitance, inductance, admittance, impedance, flux linkage, conductance or current flow be computed during the solution process
Yes
No
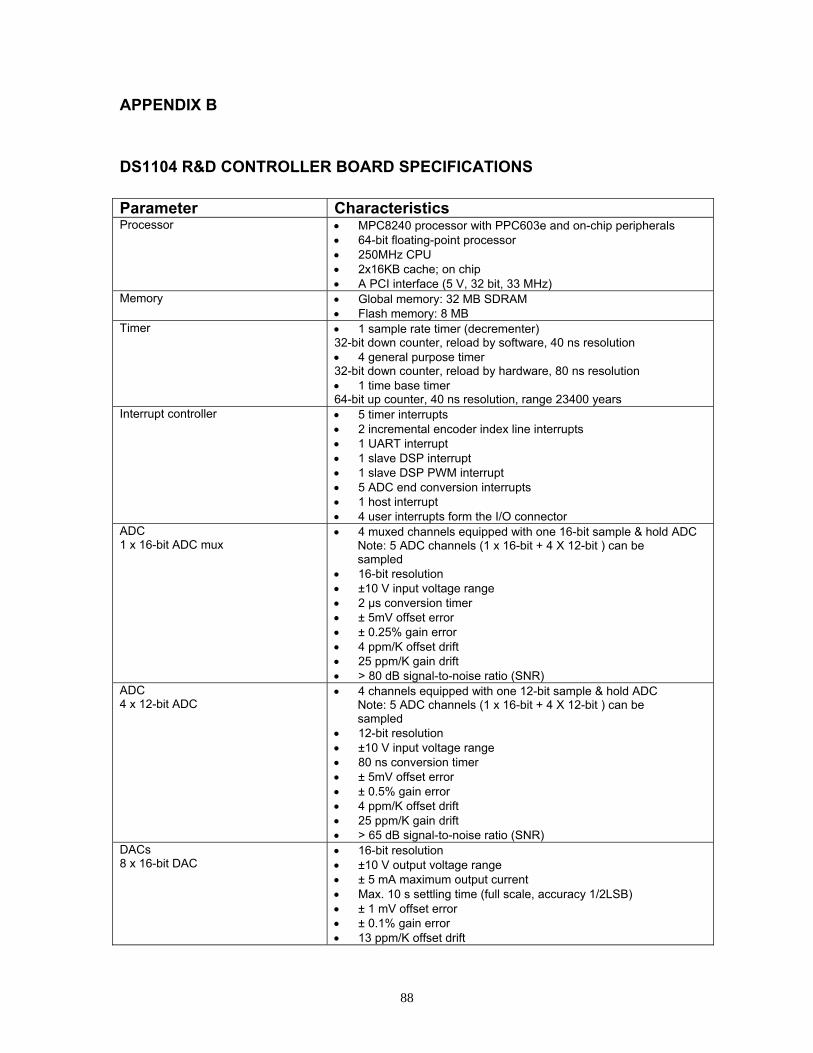
88
APPENDIX B
DS1104 R&D CONTROLLER BOARD SPECIFICATIONS Parameter Characteristics Processor • MPC8240 processor with PPC603e and on-chip peripherals
• 64-bit floating-point processor • 250MHz CPU • 2x16KB cache; on chip • A PCI interface (5 V, 32 bit, 33 MHz)
Memory • Global memory: 32 MB SDRAM • Flash memory: 8 MB
Timer • 1 sample rate timer (decrementer) 32-bit down counter, reload by software, 40 ns resolution • 4 general purpose timer 32-bit down counter, reload by hardware, 80 ns resolution • 1 time base timer 64-bit up counter, 40 ns resolution, range 23400 years
Interrupt controller • 5 timer interrupts • 2 incremental encoder index line interrupts • 1 UART interrupt • 1 slave DSP interrupt • 1 slave DSP PWM interrupt • 5 ADC end conversion interrupts • 1 host interrupt • 4 user interrupts form the I/O connector
ADC 1 x 16-bit ADC mux
• 4 muxed channels equipped with one 16-bit sample & hold ADC Note: 5 ADC channels (1 x 16-bit + 4 X 12-bit ) can be sampled • 16-bit resolution • ±10 V input voltage range • 2 µs conversion timer • ± 5mV offset error • ± 0.25% gain error • 4 ppm/K offset drift • 25 ppm/K gain drift • > 80 dB signal-to-noise ratio (SNR)
ADC 4 x 12-bit ADC
• 4 channels equipped with one 12-bit sample & hold ADC Note: 5 ADC channels (1 x 16-bit + 4 X 12-bit ) can be sampled • 12-bit resolution • ±10 V input voltage range • 80 ns conversion timer • ± 5mV offset error • ± 0.5% gain error • 4 ppm/K offset drift • 25 ppm/K gain drift • > 65 dB signal-to-noise ratio (SNR)
DACs 8 x 16-bit DAC
• 16-bit resolution • ±10 V output voltage range • ± 5 mA maximum output current • Max. 10 s settling time (full scale, accuracy 1/2LSB) • ± 1 mV offset error • ± 0.1% gain error • 13 ppm/K offset drift
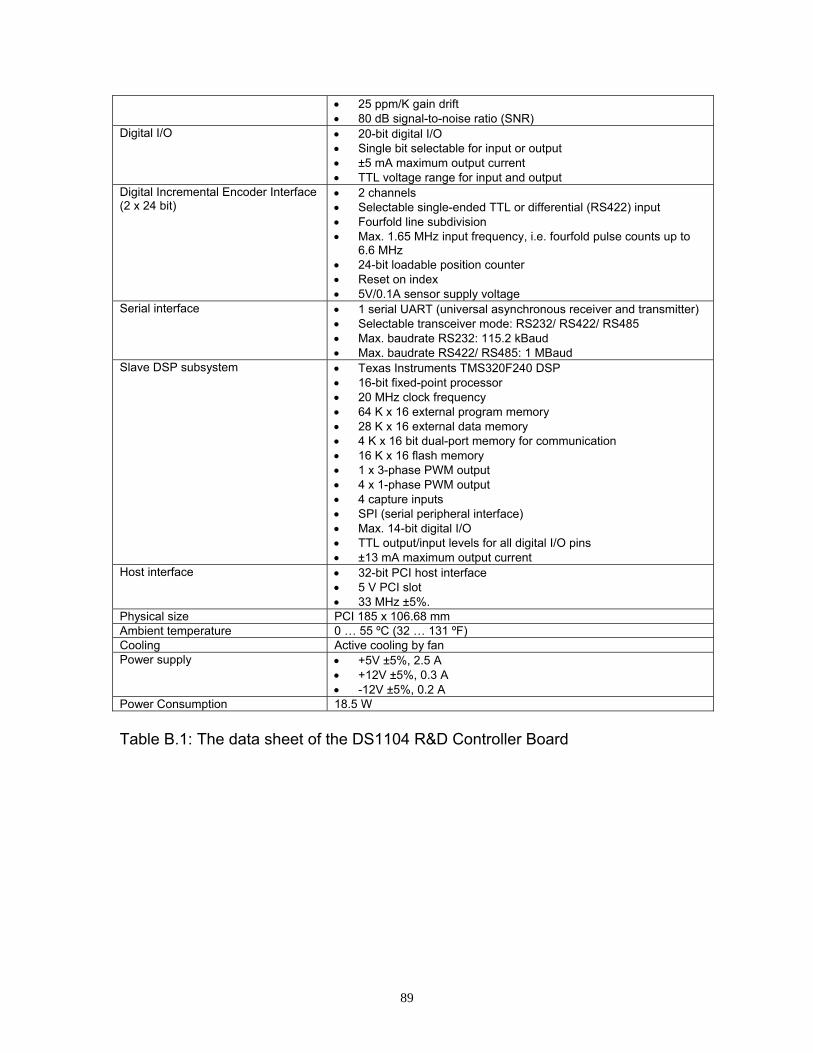
89
• 25 ppm/K gain drift • 80 dB signal-to-noise ratio (SNR)
Digital I/O
• 20-bit digital I/O • Single bit selectable for input or output • ±5 mA maximum output current • TTL voltage range for input and output
Digital Incremental Encoder Interface (2 x 24 bit)
• 2 channels • Selectable single-ended TTL or differential (RS422) input • Fourfold line subdivision • Max. 1.65 MHz input frequency, i.e. fourfold pulse counts up to
6.6 MHz • 24-bit loadable position counter • Reset on index • 5V/0.1A sensor supply voltage
Serial interface • 1 serial UART (universal asynchronous receiver and transmitter) • Selectable transceiver mode: RS232/ RS422/ RS485 • Max. baudrate RS232: 115.2 kBaud • Max. baudrate RS422/ RS485: 1 MBaud
Slave DSP subsystem • Texas Instruments TMS320F240 DSP • 16-bit fixed-point processor • 20 MHz clock frequency • 64 K x 16 external program memory • 28 K x 16 external data memory • 4 K x 16 bit dual-port memory for communication • 16 K x 16 flash memory • 1 x 3-phase PWM output • 4 x 1-phase PWM output • 4 capture inputs • SPI (serial peripheral interface) • Max. 14-bit digital I/O • TTL output/input levels for all digital I/O pins • ±13 mA maximum output current
Host interface • 32-bit PCI host interface • 5 V PCI slot • 33 MHz ±5%.
Physical size PCI 185 x 106.68 mmAmbient temperature 0 … 55 ºC (32 … 131 ºF)Cooling Active cooling by fan Power supply • +5V ±5%, 2.5 A
• +12V ±5%, 0.3 A • -12V ±5%, 0.2 A
Power Consumption 18.5 W Table B.1: The data sheet of the DS1104 R&D Controller Board
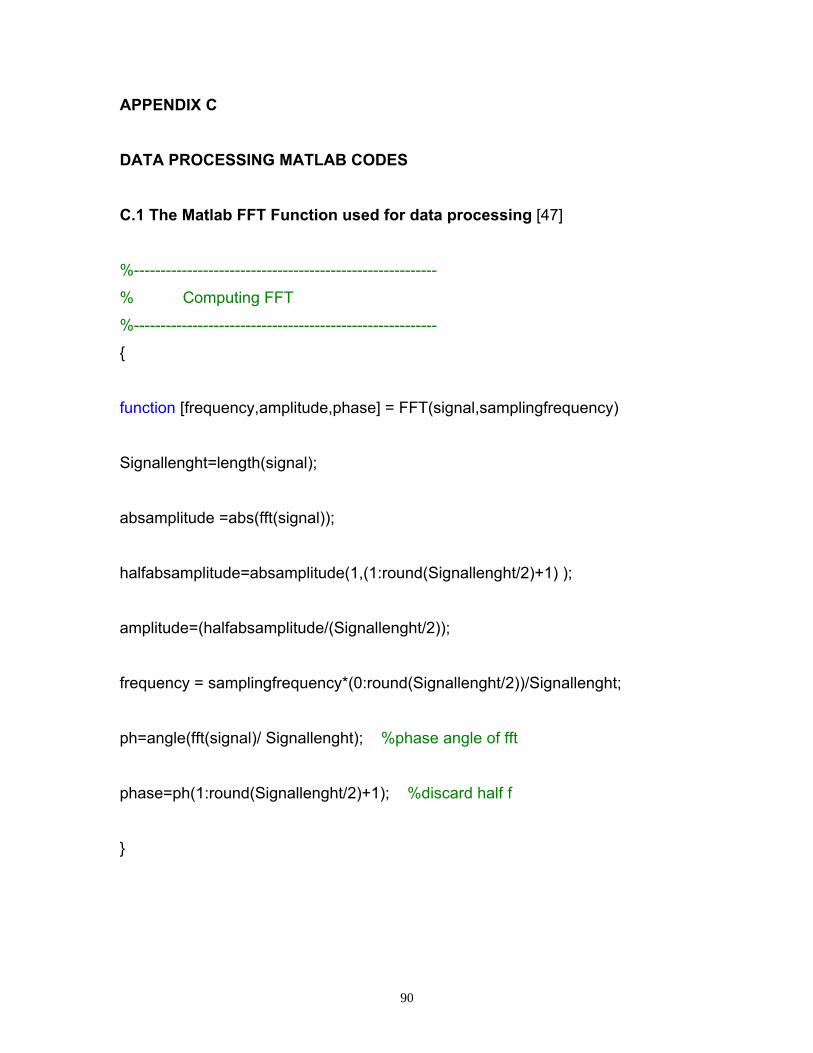
90
APPENDIX C
DATA PROCESSING MATLAB CODES
C.1 The Matlab FFT Function used for data processing [47]
%---------------------------------------------------------
% Computing FFT
%---------------------------------------------------------
{
function [frequency,amplitude,phase] = FFT(signal,samplingfrequency)
Signallenght=length(signal);
absamplitude =abs(fft(signal));
halfabsamplitude=absamplitude(1,(1:round(Signallenght/2)+1) );
amplitude=(halfabsamplitude/(Signallenght/2));
frequency = samplingfrequency*(0:round(Signallenght/2))/Signallenght;
ph=angle(fft(signal)/ Signallenght); %phase angle of fft
phase=ph(1:round(Signallenght/2)+1); %discard half f
}

91
C.2 Measured Signal Processing
load (‘D:\...\54_load_ 6-4s_1ds.Y.Data ‘);% 54% load data sampled at 40kHz
sc54_40_1a=54_load_6-4s_1ds.Y(1,5).Data; %red phase line current
sc54_40_1b=54_load_6-4s_1ds.Y(1,7).Data; % white phase line current
sc54_40_1c=54_load_6-4s_1ds.Y(1,4).Data; % blue phase line current
vb54_40_1a=54_load_6-4s_1ds.Y(1,1).Data; %axial vibration
vb54_40_1b=54_load_6-4s_1ds.Y(1,2).Data; %radial vibration
sh54_40_1=54_load_6-4s_1ds.Y(1,3).Data; % shaft voltage
speed54_40_1=54_load_6-4s_1ds.Y(1,6).Data; % speed of the shaft
time54_40_1=54_load_6-4s_1ds.X.Data;
%The Matlab code used to perform the FFT through all process in [47]
N = 200000; %N : Number of FFT points
w=hann(N);
overlap=[];
cf=15e3; % cf: cut-off frequency in Hz
Fs=40e3; % Fs: Sampling Frequency in Hz
[b,a]=butter(3,(cf/(Fs/2)),'low');
Shsum=sc54_40_1a;
yShsum=filter(b,a,Shsum);
clear Shsum
winyShsum=2*w'.*yShsum(1,1:N);
sizewindow=size(winyShsum);
wShsum=zeros(1,sizewindow(1,2)*2);
wShsum(1,1:sizewindow(1,2))=winyShsum;
clear winyShsum;
cu54_40_1a=wShsum;
[fShsum,PyyShsum,phase]=FFT(cu54_40_1a,Fs);
figure;
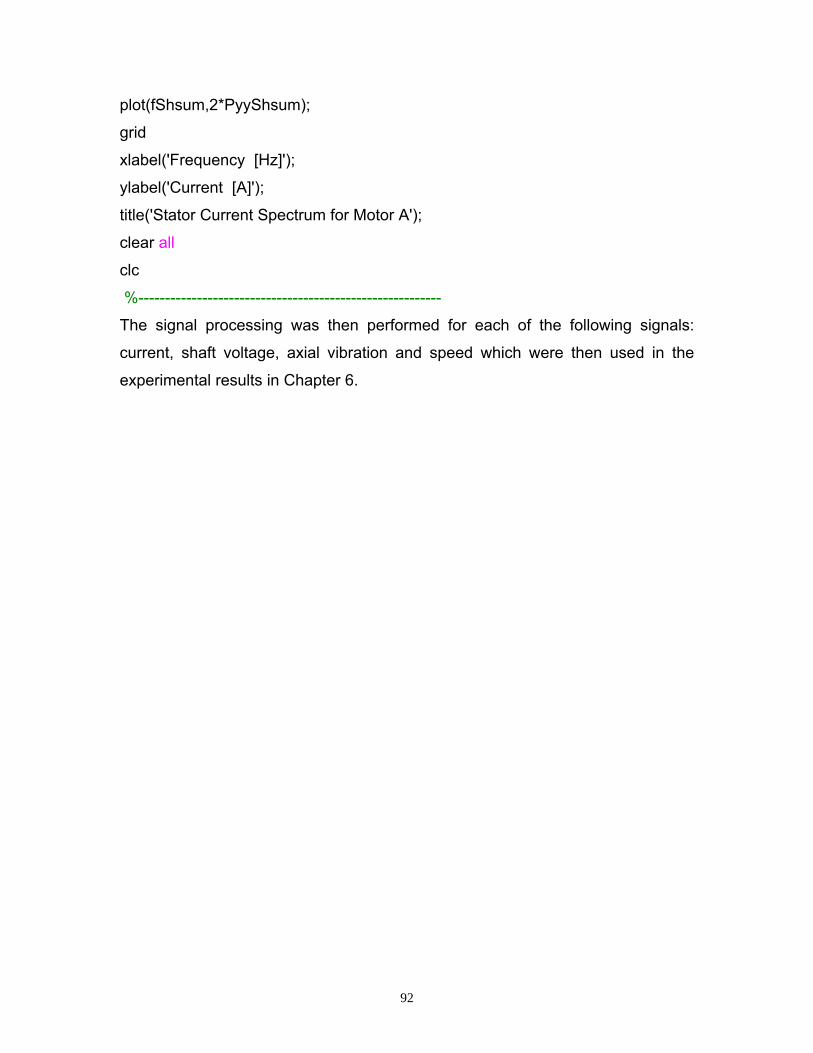
92
plot(fShsum,2*PyyShsum);
grid
xlabel('Frequency [Hz]');
ylabel('Current [A]');
title('Stator Current Spectrum for Motor A');
clear all
clc
%---------------------------------------------------------
The signal processing was then performed for each of the following signals:
current, shaft voltage, axial vibration and speed which were then used in the
experimental results in Chapter 6.
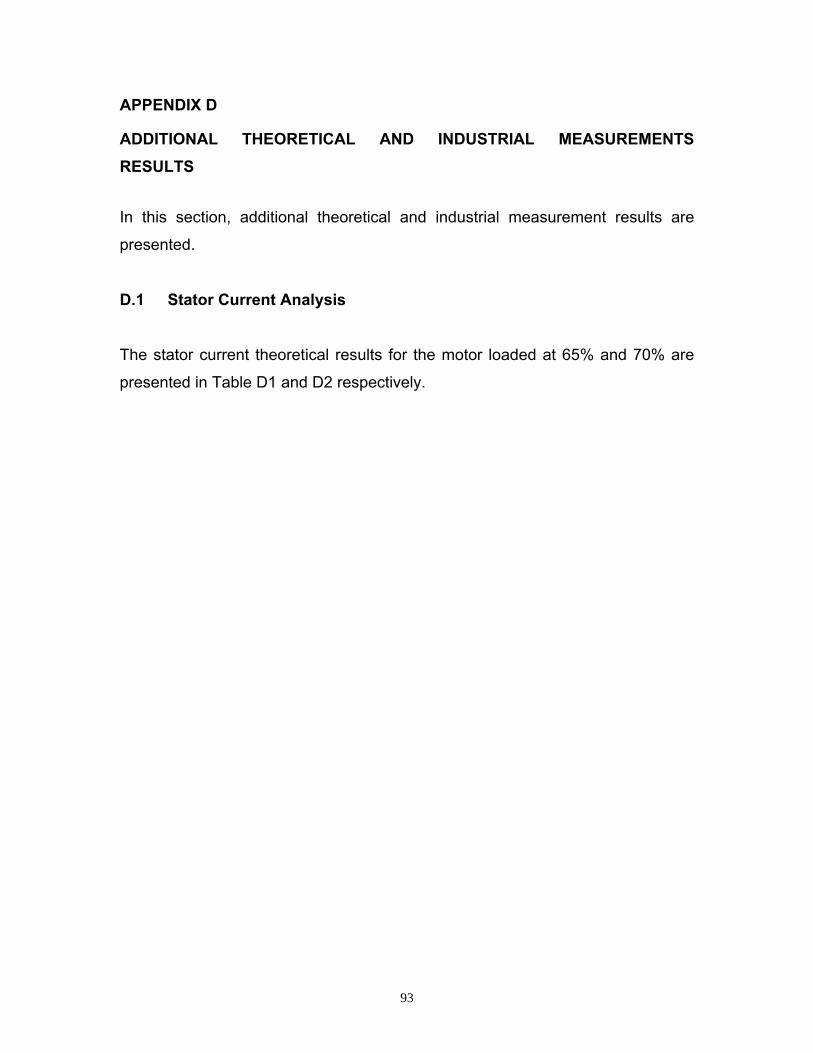
93
APPENDIX D
ADDITIONAL THEORETICAL AND INDUSTRIAL MEASUREMENTS RESULTS
In this section, additional theoretical and industrial measurement results are
presented.
D.1 Stator Current Analysis
The stator current theoretical results for the motor loaded at 65% and 70% are
presented in Table D1 and D2 respectively.
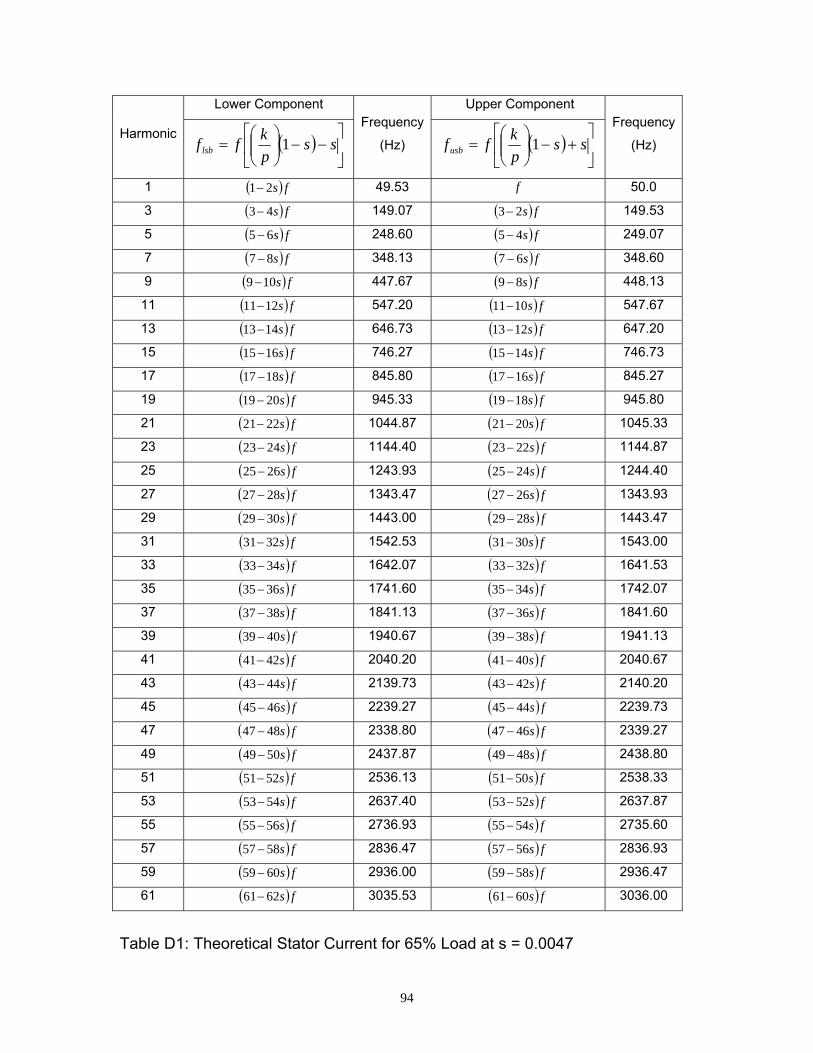
94
Harmonic
Lower Component Frequency
(Hz)
Upper Component Frequency
(Hz) ( ) ⎥⎦
⎤⎢⎣
⎡−−⎟⎟
⎠
⎞⎜⎜⎝
⎛= ss
pkff lsb 1 ( ) ⎥
⎦
⎤⎢⎣
⎡+−⎟⎟
⎠
⎞⎜⎜⎝
⎛= ss
pkffusb 1
1 ( ) fs21− 49.53 f 50.0
3 ( ) fs43− 149.07 ( ) fs23− 149.53
5 ( ) fs65− 248.60 ( ) fs45− 249.07
7 ( ) fs87 − 348.13 ( ) fs67 − 348.60
9 ( ) fs109 − 447.67 ( ) fs89 − 448.13
11 ( ) fs1211− 547.20 ( ) fs1011− 547.67
13 ( ) fs1413− 646.73 ( ) fs1213− 647.20
15 ( ) fs1615− 746.27 ( ) fs1415− 746.73
17 ( ) fs1817− 845.80 ( ) fs1617− 845.27
19 ( ) fs2019− 945.33 ( ) fs1819− 945.80
21 ( ) fs2221− 1044.87 ( ) fs2021− 1045.33
23 ( ) fs2423− 1144.40 ( ) fs2223− 1144.87
25 ( ) fs2625− 1243.93 ( ) fs2425− 1244.40
27 ( ) fs2827 − 1343.47 ( ) fs2627 − 1343.93
29 ( ) fs3029− 1443.00 ( ) fs2829− 1443.47
31 ( ) fs3231− 1542.53 ( ) fs3031− 1543.00
33 ( ) fs3433− 1642.07 ( ) fs3233− 1641.53
35 ( ) fs3635− 1741.60 ( ) fs3435− 1742.07
37 ( ) fs3837 − 1841.13 ( ) fs3637 − 1841.60
39 ( ) fs4039− 1940.67 ( ) fs3839− 1941.13
41 ( ) fs4241− 2040.20 ( ) fs4041− 2040.67
43 ( ) fs4443− 2139.73 ( ) fs4243− 2140.20
45 ( ) fs4645− 2239.27 ( ) fs4445− 2239.73
47 ( ) fs4847 − 2338.80 ( ) fs4647 − 2339.27
49 ( ) fs5049− 2437.87 ( ) fs4849− 2438.80
51 ( ) fs5251− 2536.13 ( ) fs5051− 2538.33
53 ( ) fs5453− 2637.40 ( ) fs5253− 2637.87
55 ( ) fs5655− 2736.93 ( ) fs5455− 2735.60
57 ( ) fs5857 − 2836.47 ( ) fs5657 − 2836.93
59 ( ) fs6059− 2936.00 ( ) fs5859− 2936.47
61 ( ) fs6261− 3035.53 ( ) fs6061− 3036.00
Table D1: Theoretical Stator Current for 65% Load at s = 0.0047
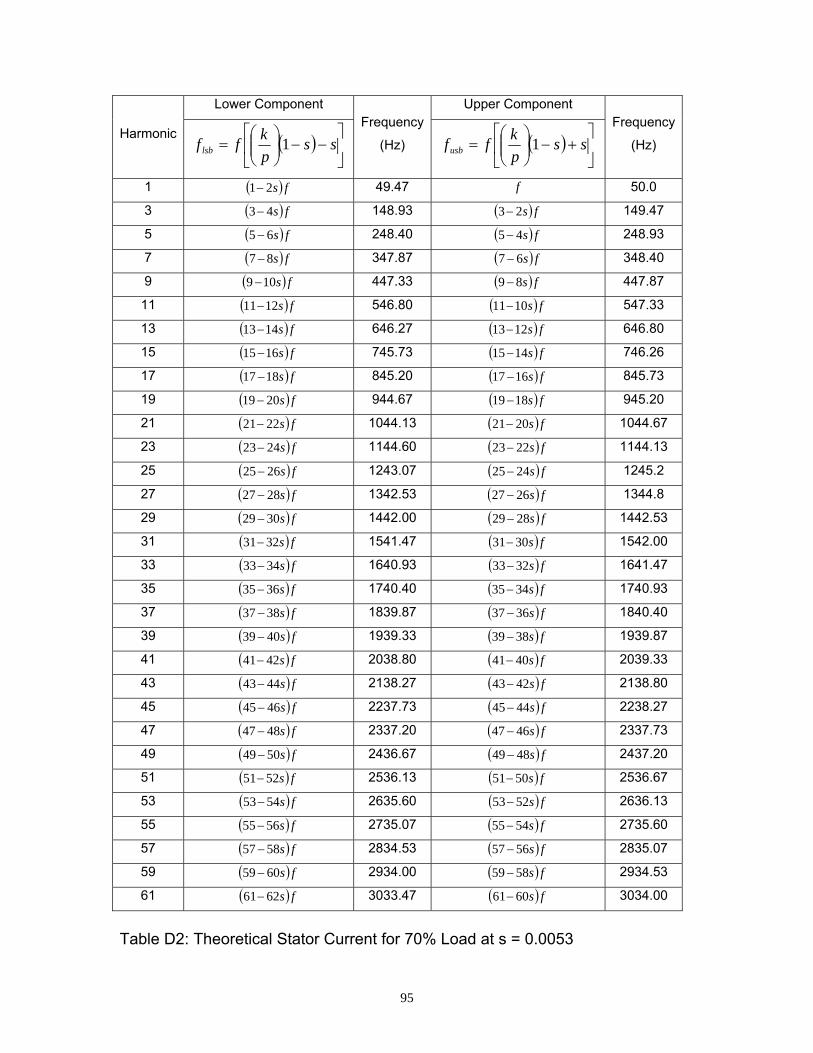
95
Harmonic
Lower Component Frequency
(Hz)
Upper Component Frequency
(Hz) ( ) ⎥⎦
⎤⎢⎣
⎡−−⎟⎟
⎠
⎞⎜⎜⎝
⎛= ss
pkff lsb 1 ( ) ⎥
⎦
⎤⎢⎣
⎡+−⎟⎟
⎠
⎞⎜⎜⎝
⎛= ss
pkffusb 1
1 ( ) fs21− 49.47 f 50.0
3 ( ) fs43− 148.93 ( ) fs23− 149.47
5 ( ) fs65− 248.40 ( ) fs45− 248.93
7 ( ) fs87 − 347.87 ( ) fs67 − 348.40
9 ( ) fs109 − 447.33 ( ) fs89 − 447.87
11 ( ) fs1211− 546.80 ( ) fs1011− 547.33
13 ( ) fs1413− 646.27 ( ) fs1213− 646.80
15 ( ) fs1615− 745.73 ( ) fs1415− 746.26
17 ( ) fs1817− 845.20 ( ) fs1617− 845.73
19 ( ) fs2019− 944.67 ( ) fs1819− 945.20
21 ( ) fs2221− 1044.13 ( ) fs2021− 1044.67
23 ( ) fs2423− 1144.60 ( ) fs2223− 1144.13
25 ( ) fs2625− 1243.07 ( ) fs2425− 1245.2
27 ( ) fs2827 − 1342.53 ( ) fs2627 − 1344.8
29 ( ) fs3029− 1442.00 ( ) fs2829− 1442.53
31 ( ) fs3231− 1541.47 ( ) fs3031− 1542.00
33 ( ) fs3433− 1640.93 ( ) fs3233− 1641.47
35 ( ) fs3635− 1740.40 ( ) fs3435− 1740.93
37 ( ) fs3837 − 1839.87 ( ) fs3637 − 1840.40
39 ( ) fs4039− 1939.33 ( ) fs3839− 1939.87
41 ( ) fs4241− 2038.80 ( ) fs4041− 2039.33
43 ( ) fs4443− 2138.27 ( ) fs4243− 2138.80
45 ( ) fs4645− 2237.73 ( ) fs4445− 2238.27
47 ( ) fs4847 − 2337.20 ( ) fs4647 − 2337.73
49 ( ) fs5049− 2436.67 ( ) fs4849− 2437.20
51 ( ) fs5251− 2536.13 ( ) fs5051− 2536.67
53 ( ) fs5453− 2635.60 ( ) fs5253− 2636.13
55 ( ) fs5655− 2735.07 ( ) fs5455− 2735.60
57 ( ) fs5857 − 2834.53 ( ) fs5657 − 2835.07
59 ( ) fs6059− 2934.00 ( ) fs5859− 2934.53
61 ( ) fs6261− 3033.47 ( ) fs6061− 3034.00
Table D2: Theoretical Stator Current for 70% Load at s = 0.0053
96
D.2 Axial Vibrations Analysis
The axial vibrations theoretical results for the motor loaded at 65% and 70% are
presented in Table D3 and D4 respectively. Group Fault Detection
Component 1
Frequency
(Hz)
Fault Detection
Component 2
Frequency
(Hz)
Fault Detection
Component 3
Frequency
(Hz)
1 sf 0.5
2 ( ) fs86 − 298.1 ( ) fs66− 298.6 ( ) fs46− 299.1
3 ( ) fs1412− 596.7 ( ) fs1212− 597.2 ( ) fs1012− 597.7
4 ( ) fs2018− 895.3 ( ) fs1818− 895.8 ( ) fs1618− 896.3
5 ( ) fs2624− 1193.9 ( ) fs2424− 1194.4 ( ) fs2224− 1194.9
6 ( ) fs3230− 1492.5 ( ) fs3030− 1493.0 ( ) fs2830− 1493.5
7 ( ) fs3836− 1791.1 ( ) fs3636− 1791.6 ( ) fs3436− 1792.1
8 ( ) fs4442− 2089.7 ( ) fs4242− 2090.2 ( ) fs4042− 2092.7
9 ( ) fs5048− 2388.3 ( ) fs4848− 2388.8 ( ) fs4648− 2389.3
10 ( ) fs5654− 2686.9 ( ) fs5454− 2687.4 ( ) fs5254− 2687.9
Table D3: Theoretical Axial Vibration at 65% Load with s = 0.0047
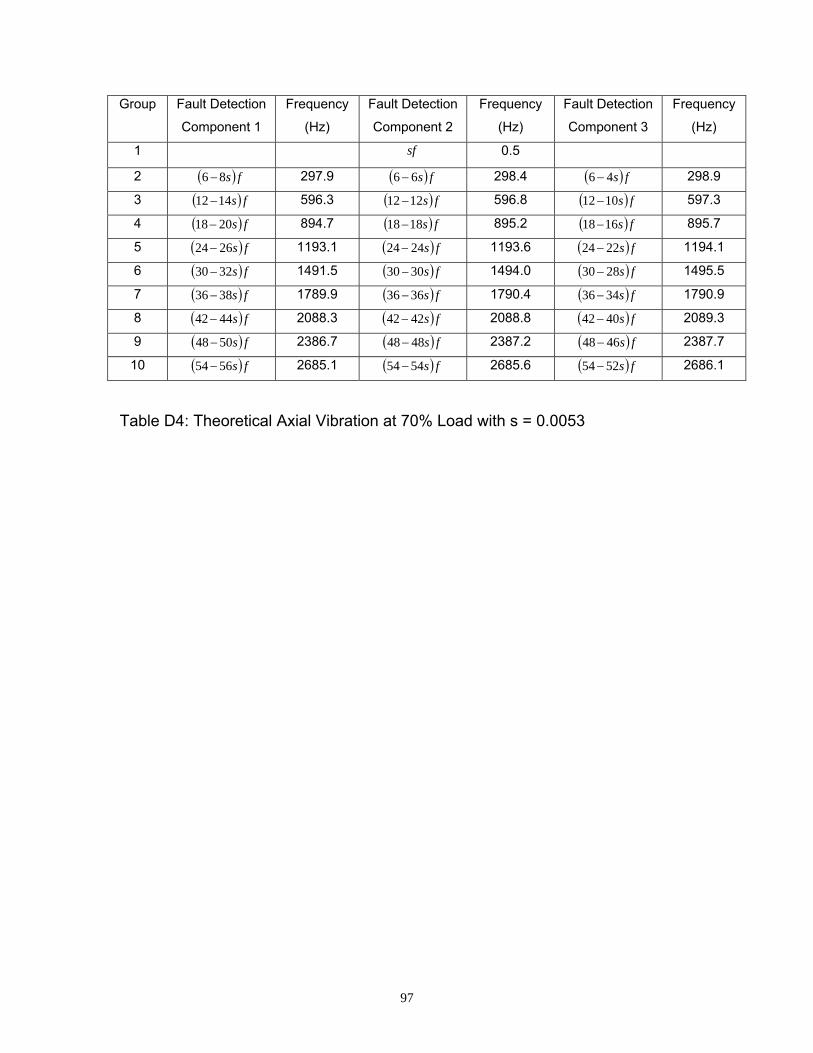
97
Group Fault Detection
Component 1
Frequency
(Hz)
Fault Detection
Component 2
Frequency
(Hz)
Fault Detection
Component 3
Frequency
(Hz)
1 sf 0.5
2 ( ) fs86 − 297.9 ( ) fs66− 298.4 ( ) fs46− 298.9
3 ( ) fs1412− 596.3 ( ) fs1212− 596.8 ( ) fs1012− 597.3
4 ( ) fs2018− 894.7 ( ) fs1818− 895.2 ( ) fs1618− 895.7
5 ( ) fs2624− 1193.1 ( ) fs2424− 1193.6 ( ) fs2224− 1194.1
6 ( ) fs3230− 1491.5 ( ) fs3030− 1494.0 ( ) fs2830− 1495.5
7 ( ) fs3836− 1789.9 ( ) fs3636− 1790.4 ( ) fs3436− 1790.9
8 ( ) fs4442− 2088.3 ( ) fs4242− 2088.8 ( ) fs4042− 2089.3
9 ( ) fs5048− 2386.7 ( ) fs4848− 2387.2 ( ) fs4648− 2387.7
10 ( ) fs5654− 2685.1 ( ) fs5454− 2685.6 ( ) fs5254− 2686.1
Table D4: Theoretical Axial Vibration at 70% Load with s = 0.0053
98
APPENDIX E
ADDITIONAL BROKEN ROTOR BAR DETECTION INSTRUMENTS
One of the objectives of this research was to determine which equipment exists
for the detection of broken rotor bars. An opportunity was then taken to utilize
these equipment for detection of broken rotor bars in order to assess their
functionality and utilization for detection of a cracked or broken rotor bar
conducted in this research. This section then presents the specifications for the
equipment utilised in the research. The equipments were operated and the
results analysed by the South African agencies of the OEMs. The full detailed
reports submitted are included in APPENDIX F and APPENDIX G.
For the purpose of the better understanding of the discussions in the reports
attached in the APPENDIX F and G, the motor with serial number 300068/01
was tested on the 12 September and 10 October is referred to as Motor A or
Motor 1 and the motor with serial number 300071/01 tested on the 14 September
and 12 October is referred to as Motor B or Motor 1.
E.1 CSMeter
Thomson and Fender [38], after several case studies, developed a portable
handheld instrument for reliable on-line detection of broken rotor bars and
abnormal levels of eccentricity. The instrument is called CSMeter and is said to
detect cracked or broken rotor bars, along with porosity in cast rotors.
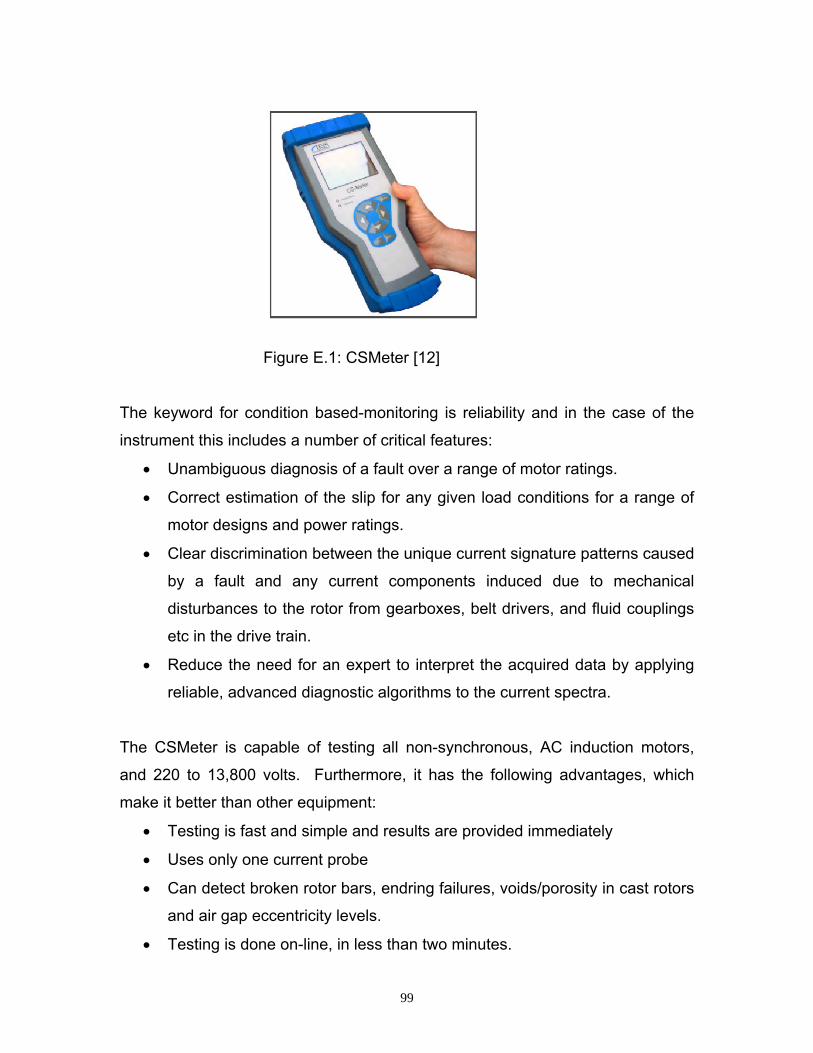
99
Figure E.1: CSMeter [12]
The keyword for condition based-monitoring is reliability and in the case of the
instrument this includes a number of critical features:
• Unambiguous diagnosis of a fault over a range of motor ratings.
• Correct estimation of the slip for any given load conditions for a range of
motor designs and power ratings.
• Clear discrimination between the unique current signature patterns caused
by a fault and any current components induced due to mechanical
disturbances to the rotor from gearboxes, belt drivers, and fluid couplings
etc in the drive train.
• Reduce the need for an expert to interpret the acquired data by applying
reliable, advanced diagnostic algorithms to the current spectra.
The CSMeter is capable of testing all non-synchronous, AC induction motors,
and 220 to 13,800 volts. Furthermore, it has the following advantages, which
make it better than other equipment:
• Testing is fast and simple and results are provided immediately
• Uses only one current probe
• Can detect broken rotor bars, endring failures, voids/porosity in cast rotors
and air gap eccentricity levels.
• Testing is done on-line, in less than two minutes.
100
• Can accurately test motors under varying load conditions
• Can distinguish between mechanically induced side bands caused by gear
reducers, and legitimate rotor bar problems.
• No special training or expertise is needed
• No voltage input required
• No speed input is required
The stator current can be taken by using an industrial CT, which is not sensitive
enough to due to burdens across them and saturation problems. The industrial
CT must be shorted in its secondary to improve its sensitivity during testing. The
measurements are then taken from the shorted output using a current clamp.
Then the measured stator current is analysed using CSView. The experiment
report for this instrument is included in APPENDIX G.
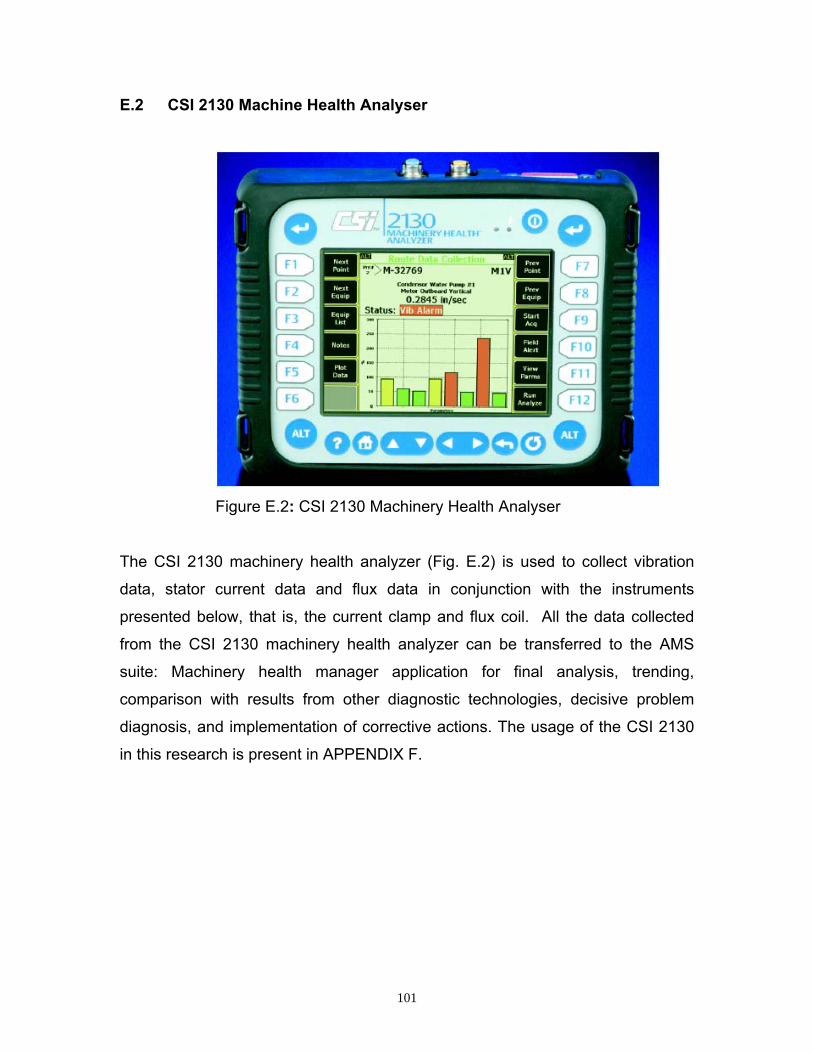
101
E.2 CSI 2130 Machine Health Analyser
Figure E.2: CSI 2130 Machinery Health Analyser The CSI 2130 machinery health analyzer (Fig. E.2) is used to collect vibration
data, stator current data and flux data in conjunction with the instruments
presented below, that is, the current clamp and flux coil. All the data collected
from the CSI 2130 machinery health analyzer can be transferred to the AMS
suite: Machinery health manager application for final analysis, trending,
comparison with results from other diagnostic technologies, decisive problem
diagnosis, and implementation of corrective actions. The usage of the CSI 2130
in this research is present in APPENDIX F.
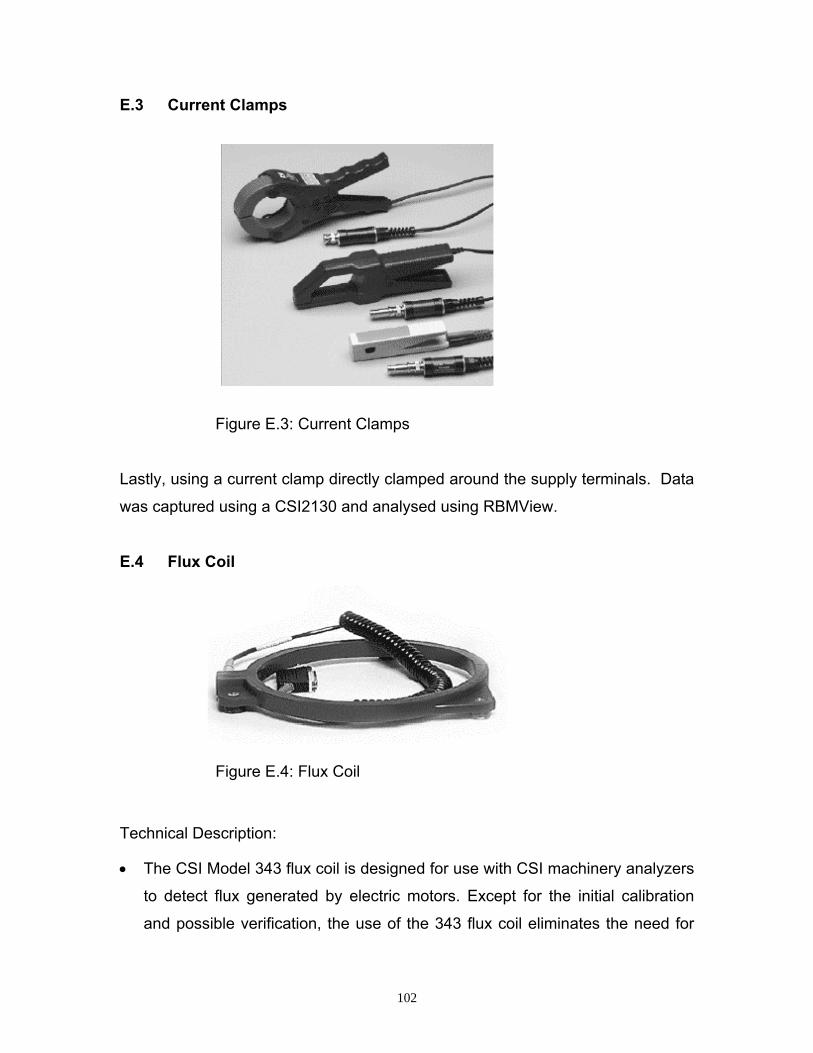
102
E.3 Current Clamps
Figure E.3: Current Clamps
Lastly, using a current clamp directly clamped around the supply terminals. Data
was captured using a CSI2130 and analysed using RBMView.
E.4 Flux Coil
Figure E.4: Flux Coil
Technical Description:
• The CSI Model 343 flux coil is designed for use with CSI machinery analyzers
to detect flux generated by electric motors. Except for the initial calibration
and possible verification, the use of the 343 flux coil eliminates the need for
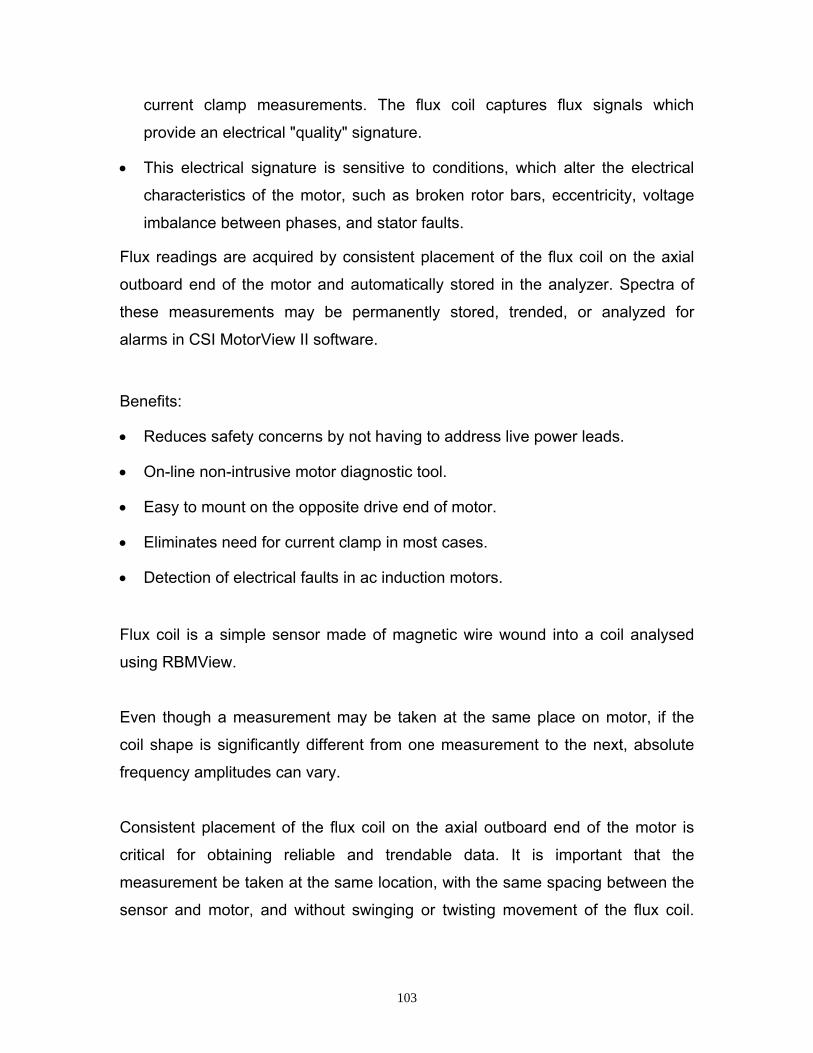
103
current clamp measurements. The flux coil captures flux signals which
provide an electrical "quality" signature.
• This electrical signature is sensitive to conditions, which alter the electrical
characteristics of the motor, such as broken rotor bars, eccentricity, voltage
imbalance between phases, and stator faults.
Flux readings are acquired by consistent placement of the flux coil on the axial
outboard end of the motor and automatically stored in the analyzer. Spectra of
these measurements may be permanently stored, trended, or analyzed for
alarms in CSI MotorView II software.
Benefits:
• Reduces safety concerns by not having to address live power leads.
• On-line non-intrusive motor diagnostic tool.
• Easy to mount on the opposite drive end of motor.
• Eliminates need for current clamp in most cases.
• Detection of electrical faults in ac induction motors.
Flux coil is a simple sensor made of magnetic wire wound into a coil analysed
using RBMView.
Even though a measurement may be taken at the same place on motor, if the
coil shape is significantly different from one measurement to the next, absolute
frequency amplitudes can vary.
Consistent placement of the flux coil on the axial outboard end of the motor is
critical for obtaining reliable and trendable data. It is important that the
measurement be taken at the same location, with the same spacing between the
sensor and motor, and without swinging or twisting movement of the flux coil.

104
CSI has designed a formed flux coil. It is manufactured in two sizes with
diameters of 6" and 12'. The portable coil can be mounted to a motor via
magnets or permanently mounted holding pads. A specially designed bracket for
holding the flux coil steady will attach to both the magnet and holding pad.

105
APPENDIX F: CMM CONSULTANTS EXPERIMENT REPORT
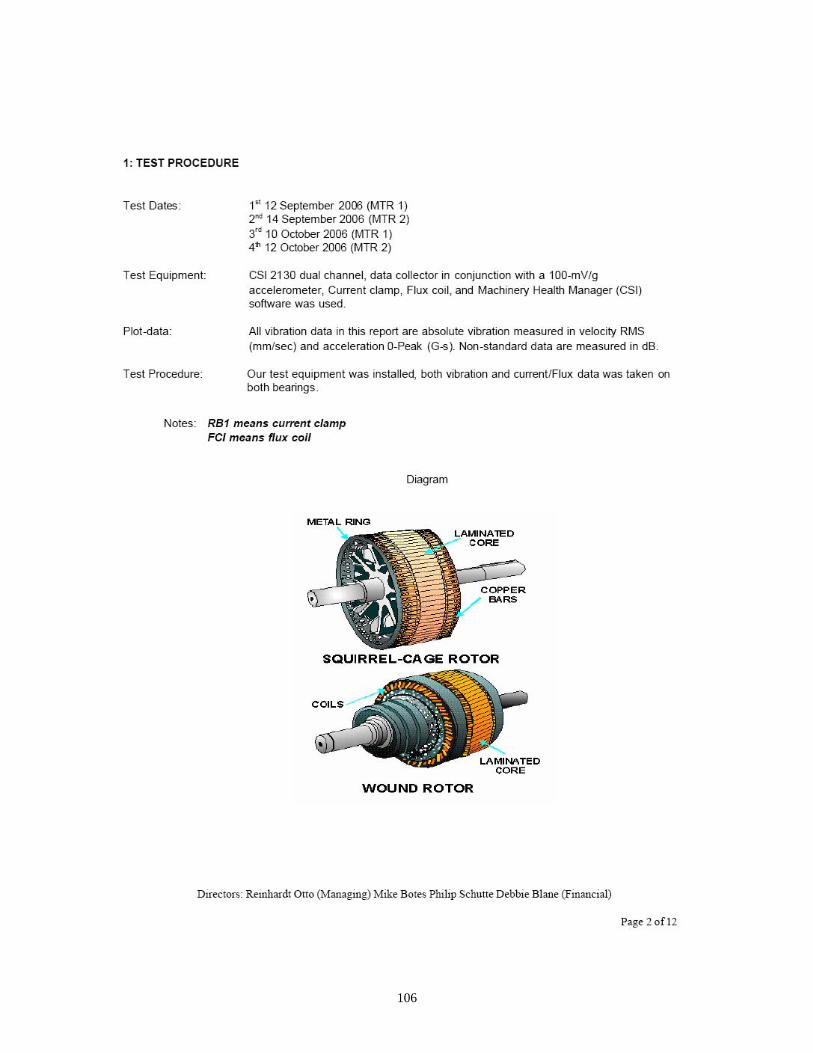
106
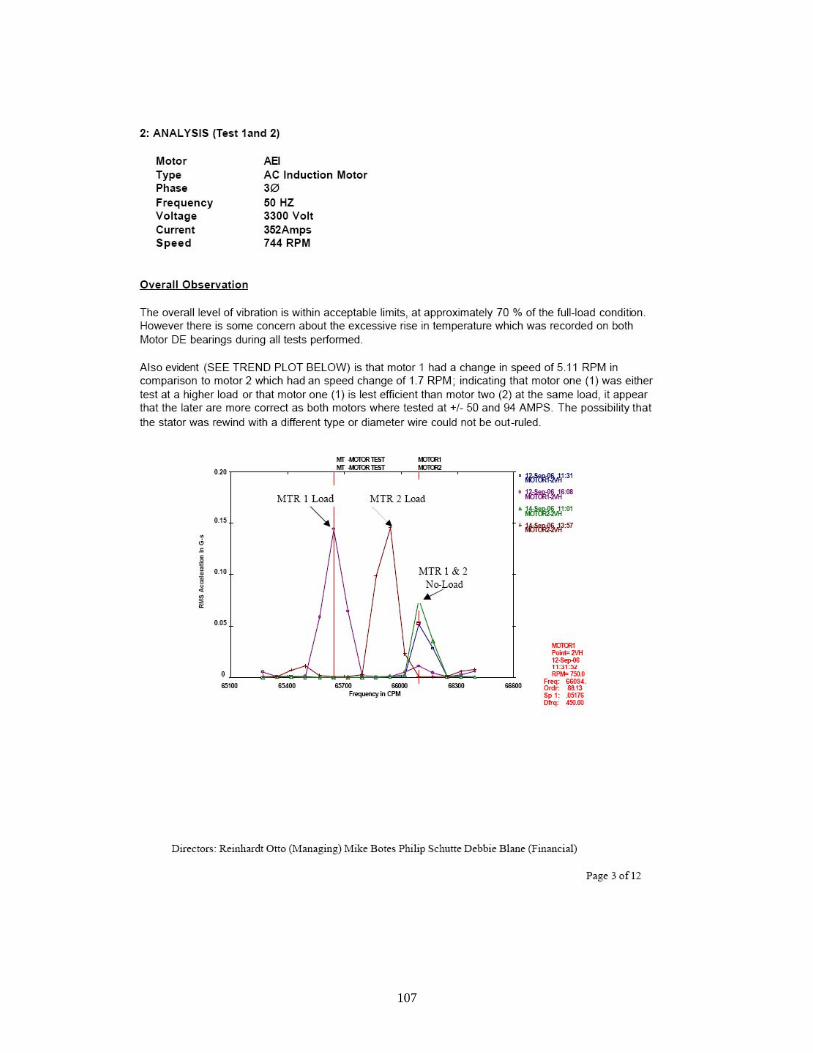
107
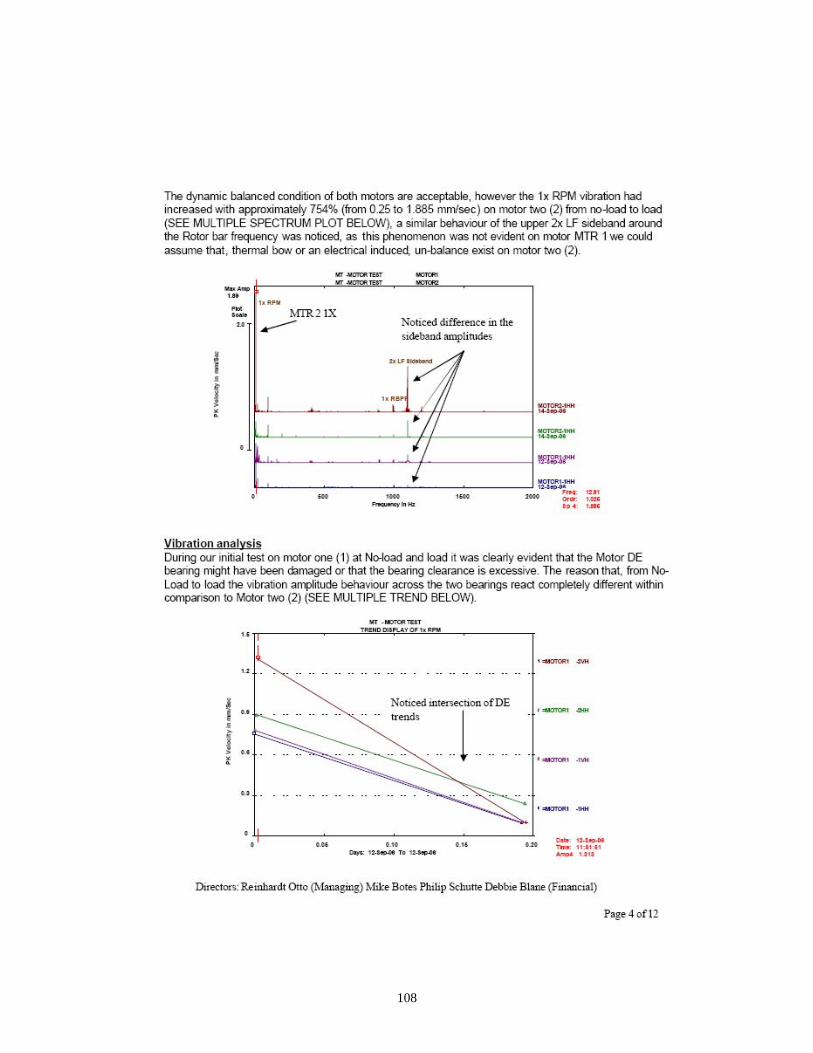
108
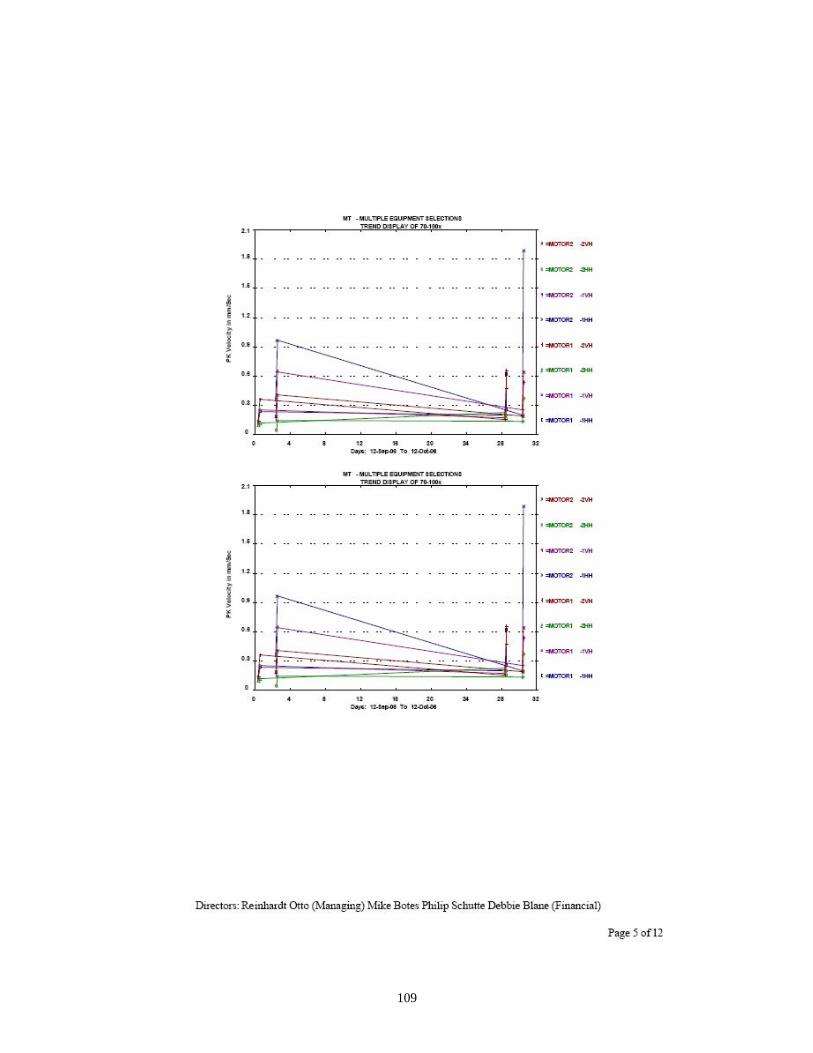
109
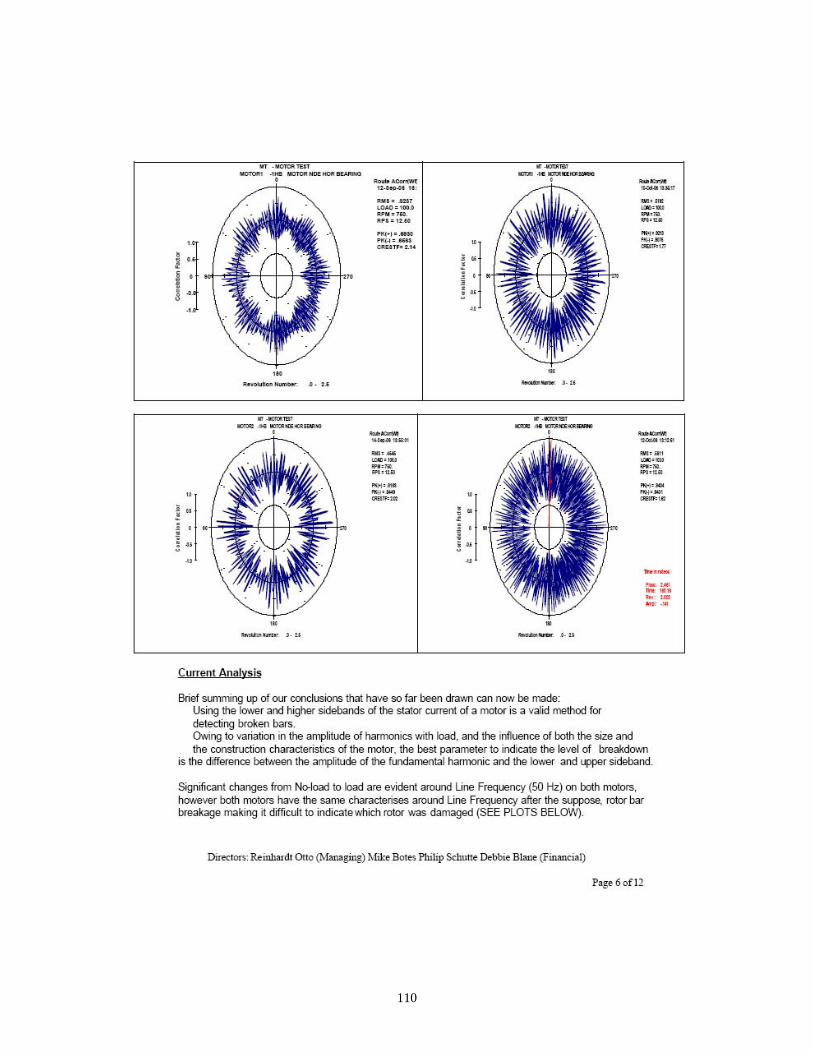
110
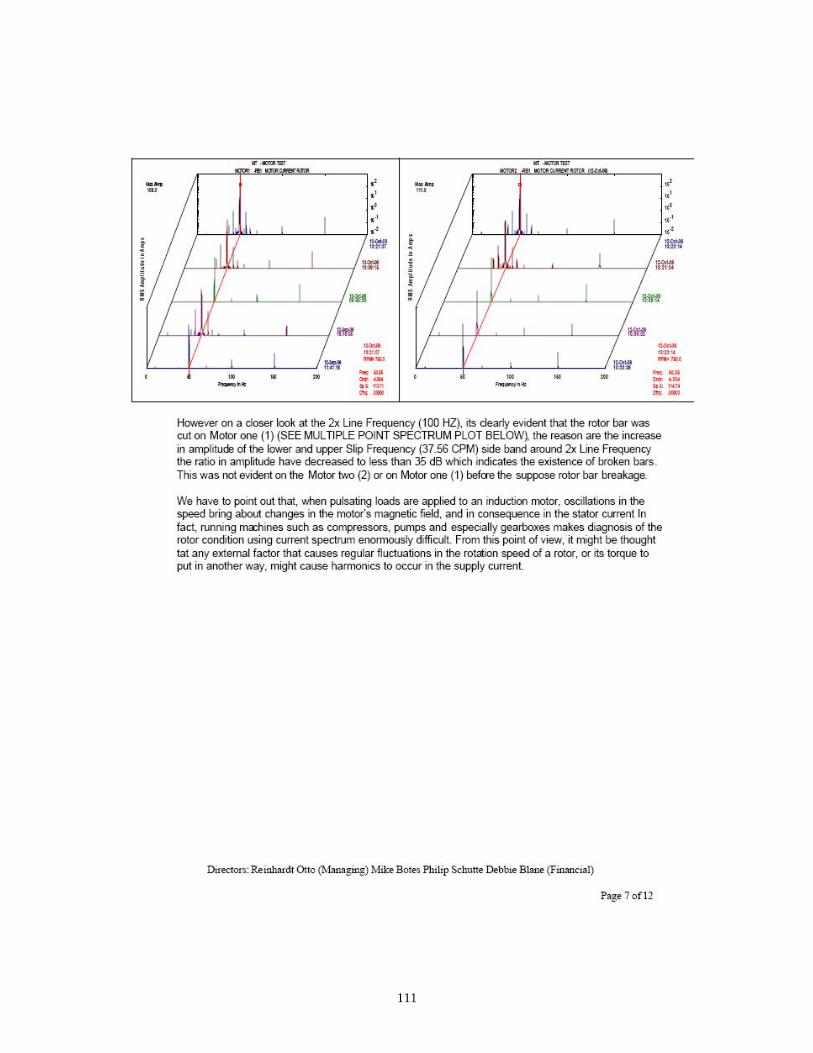
111
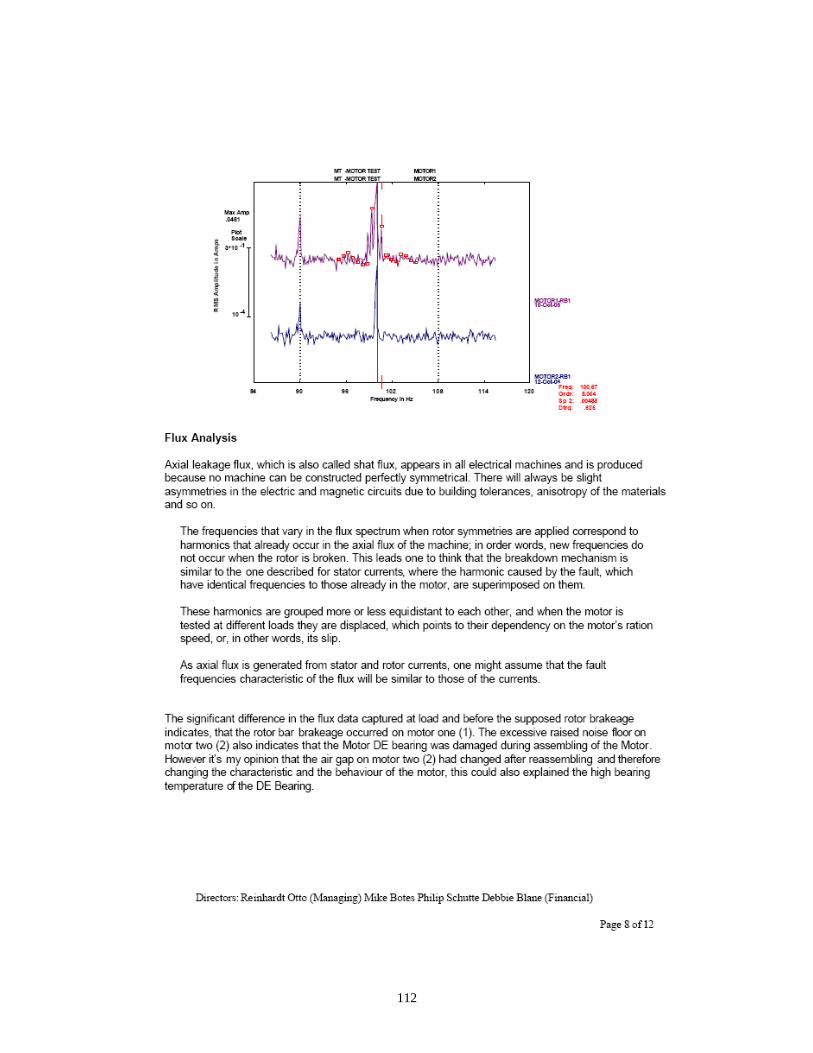
112
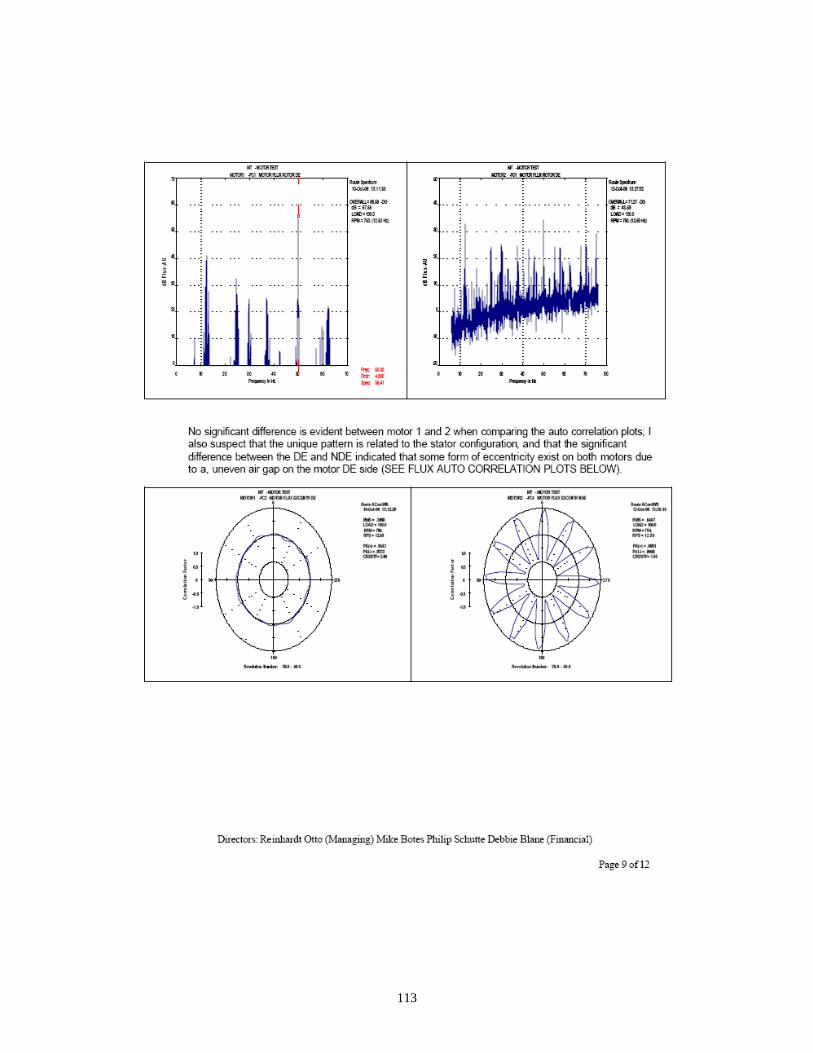
113
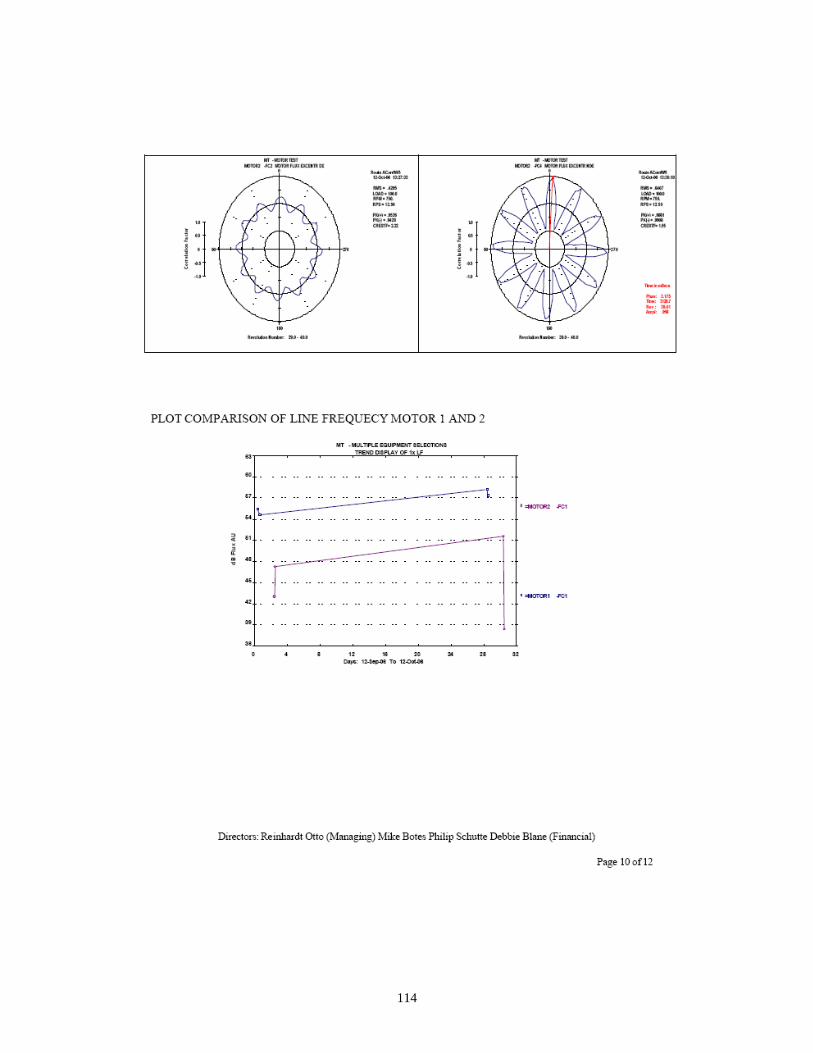
114
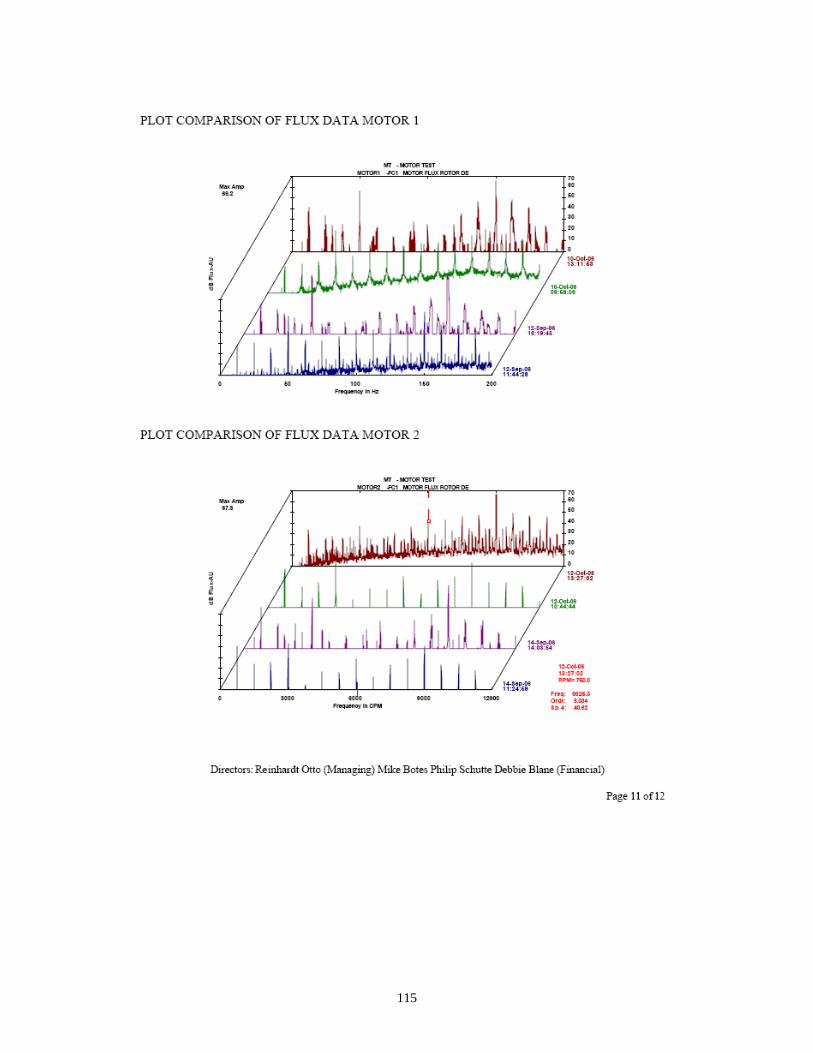
115
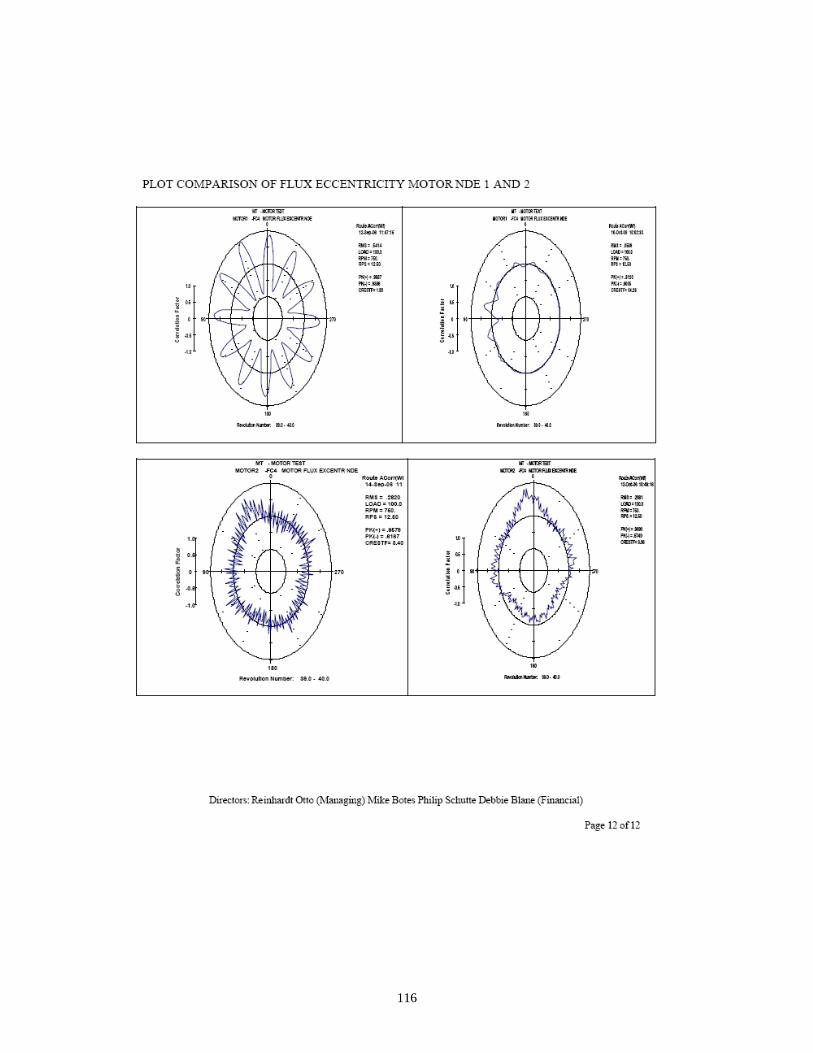
116
117
APPENDIX G: IRIS POWER EXPERIMENT REPORT
118
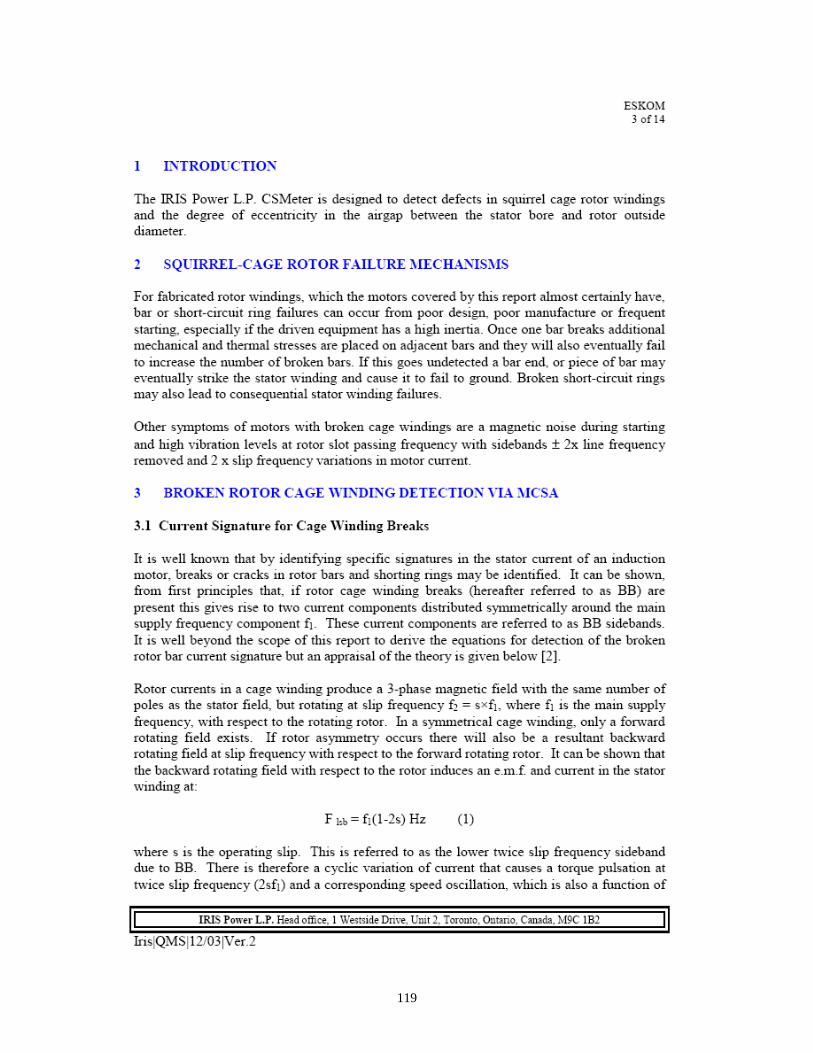
119
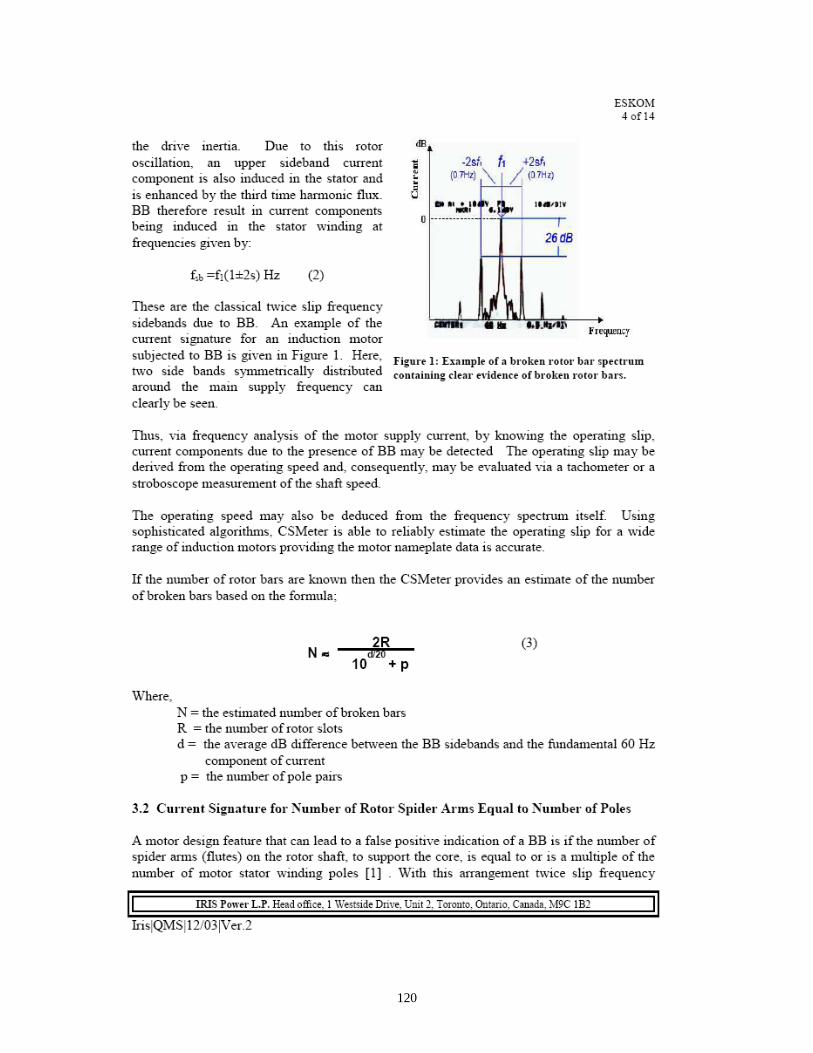
120
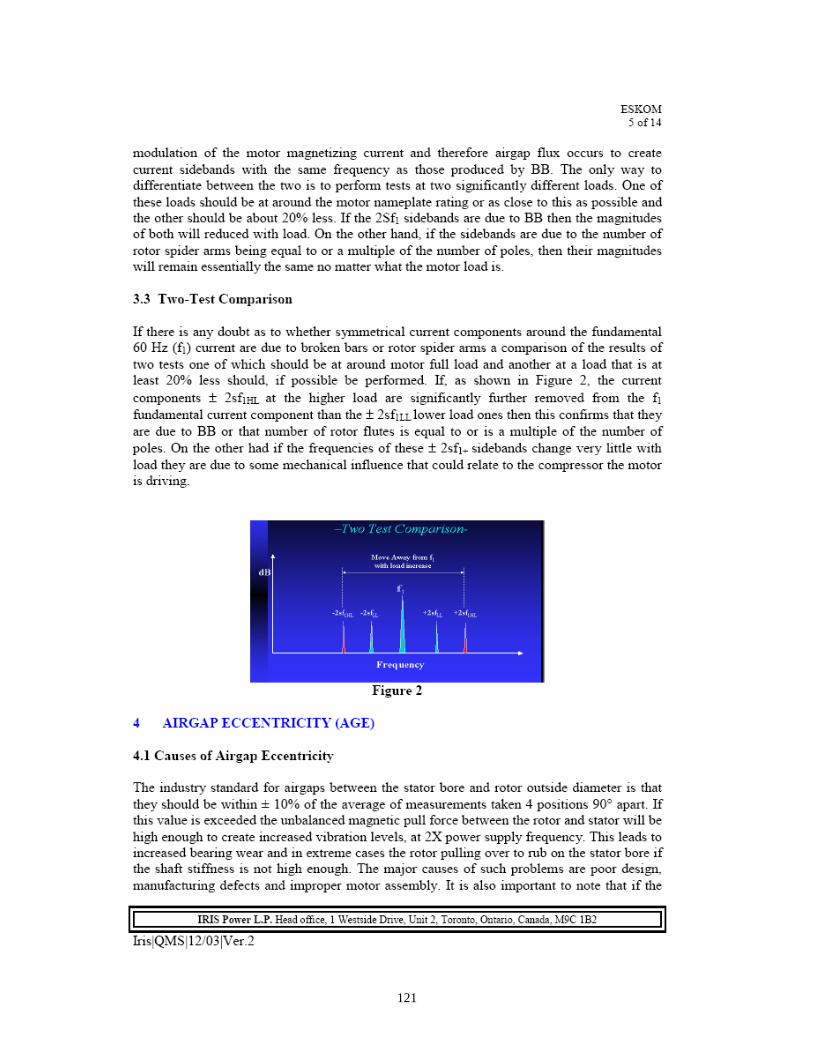
121
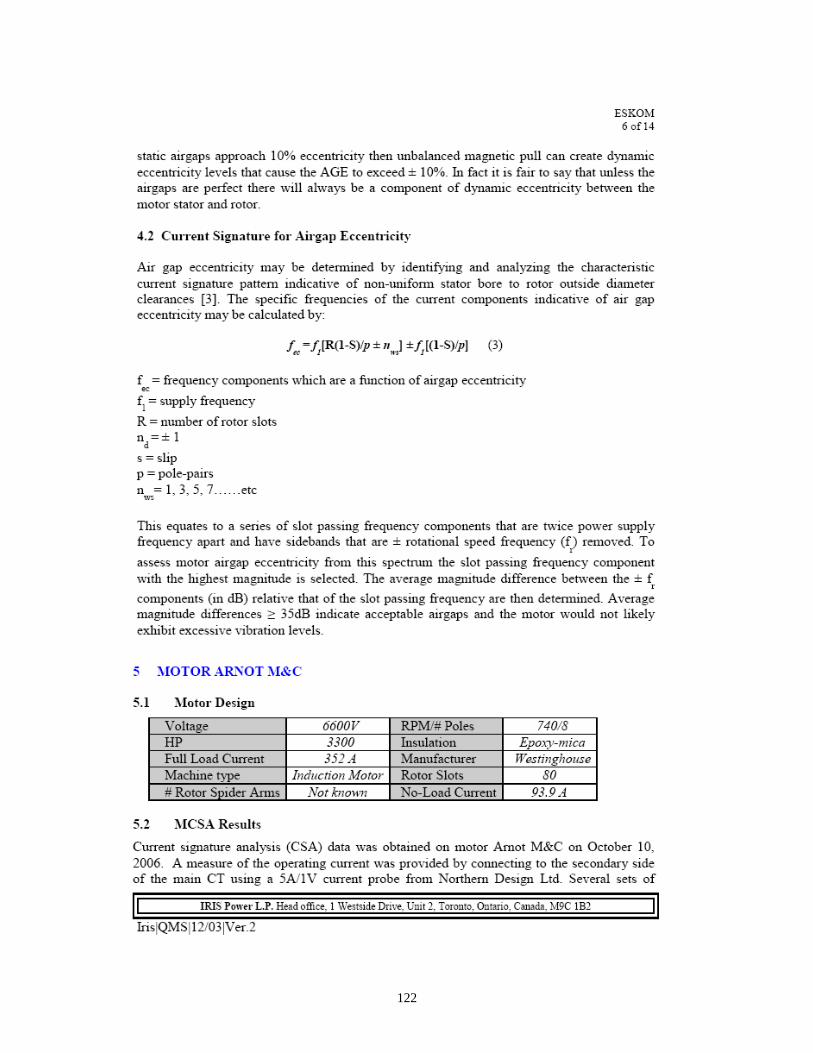
122

123
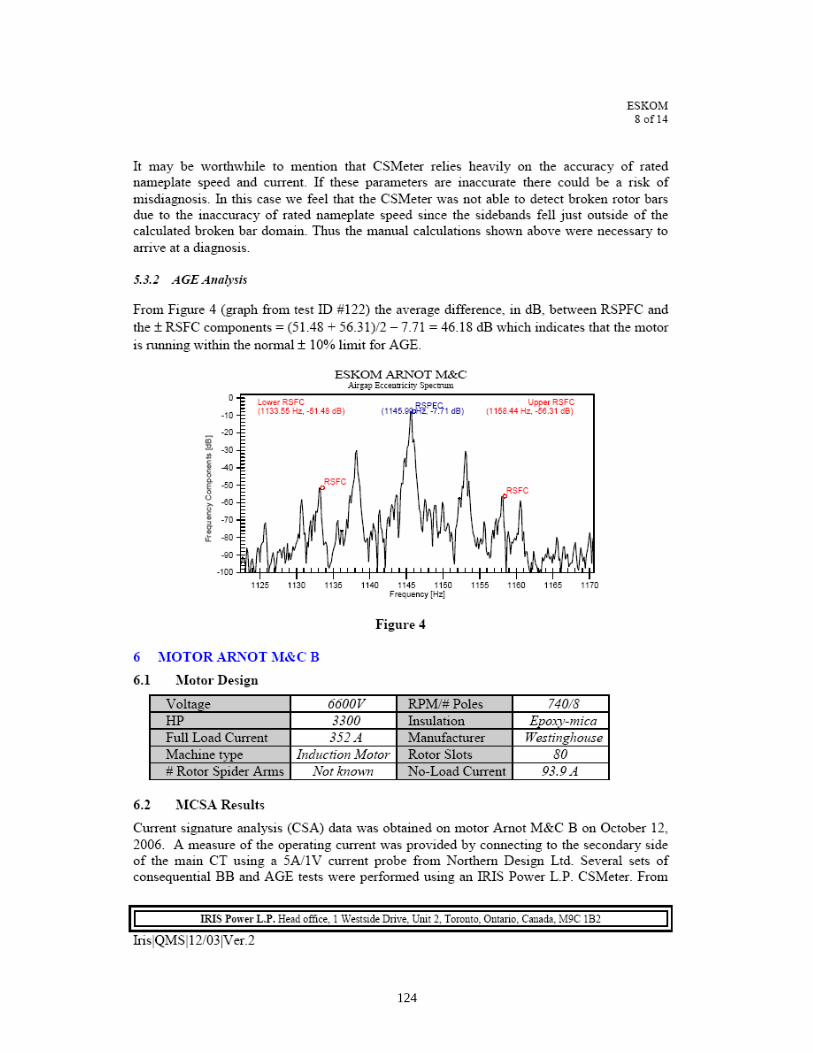
124
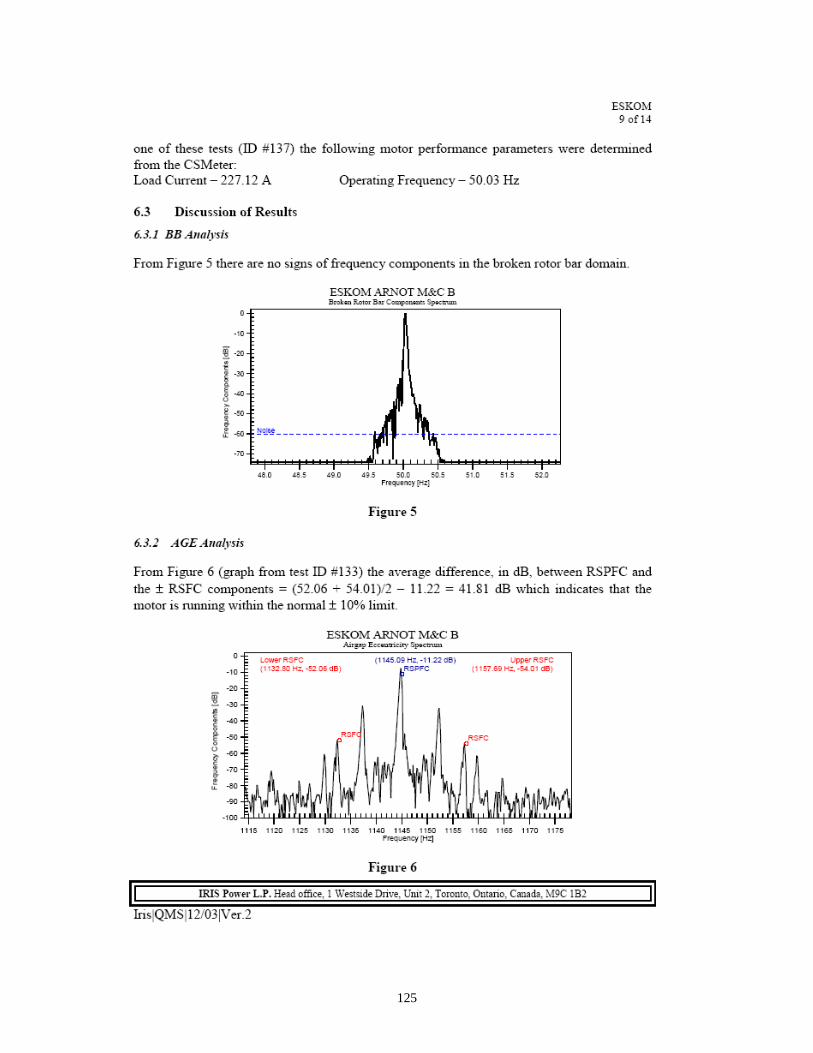
125
126
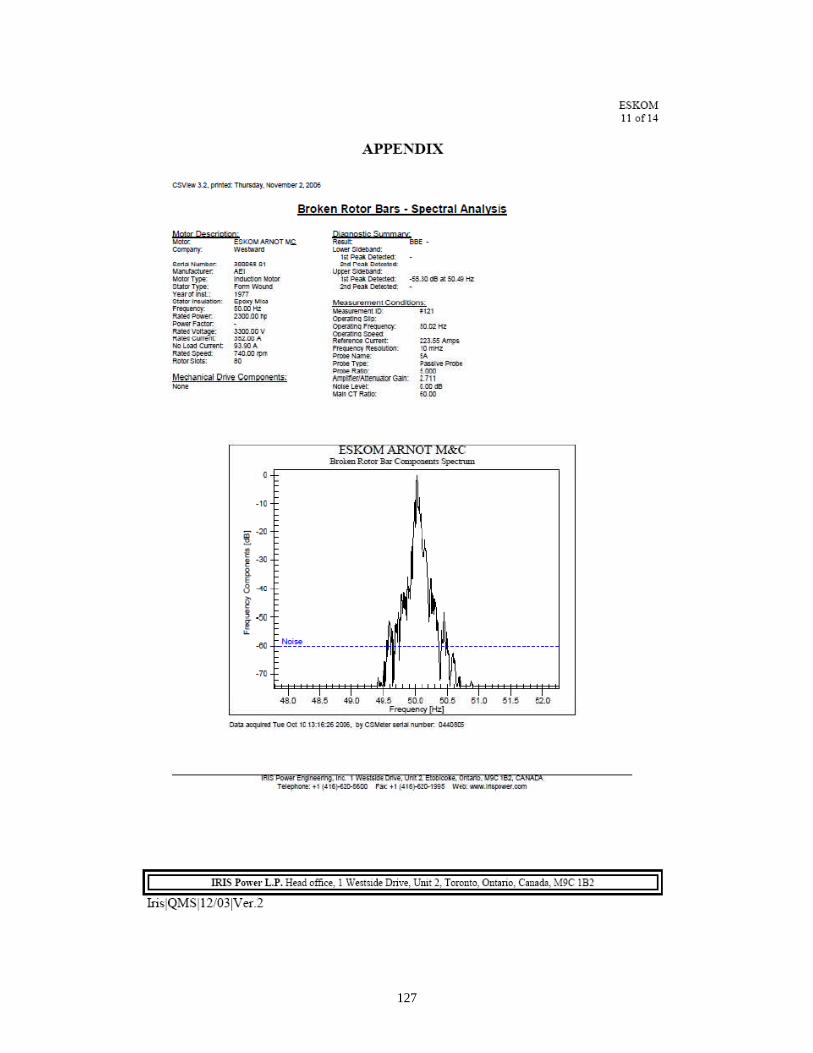
127
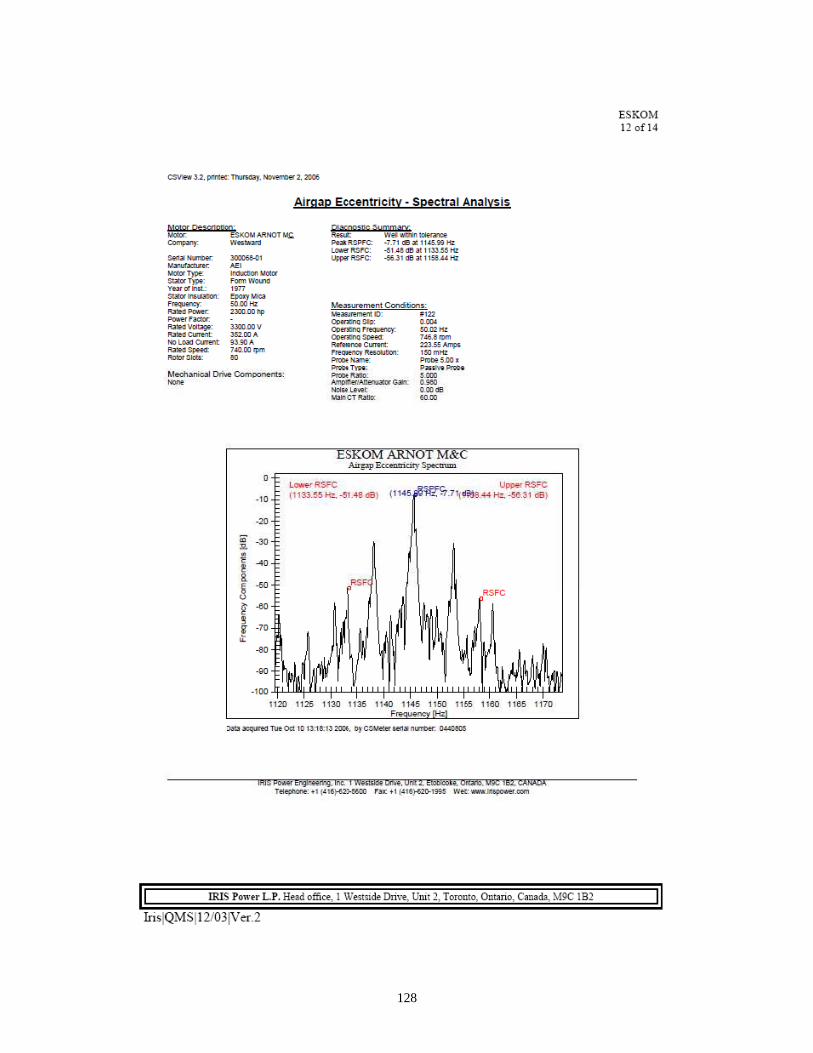
128
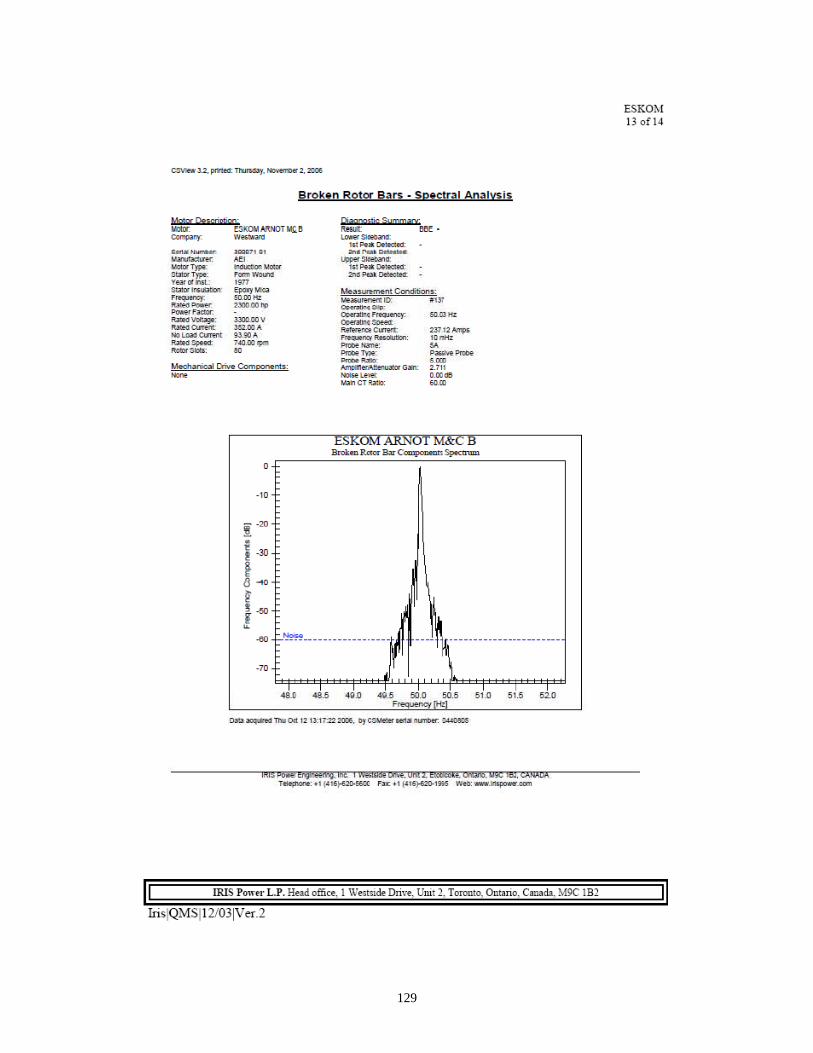
129
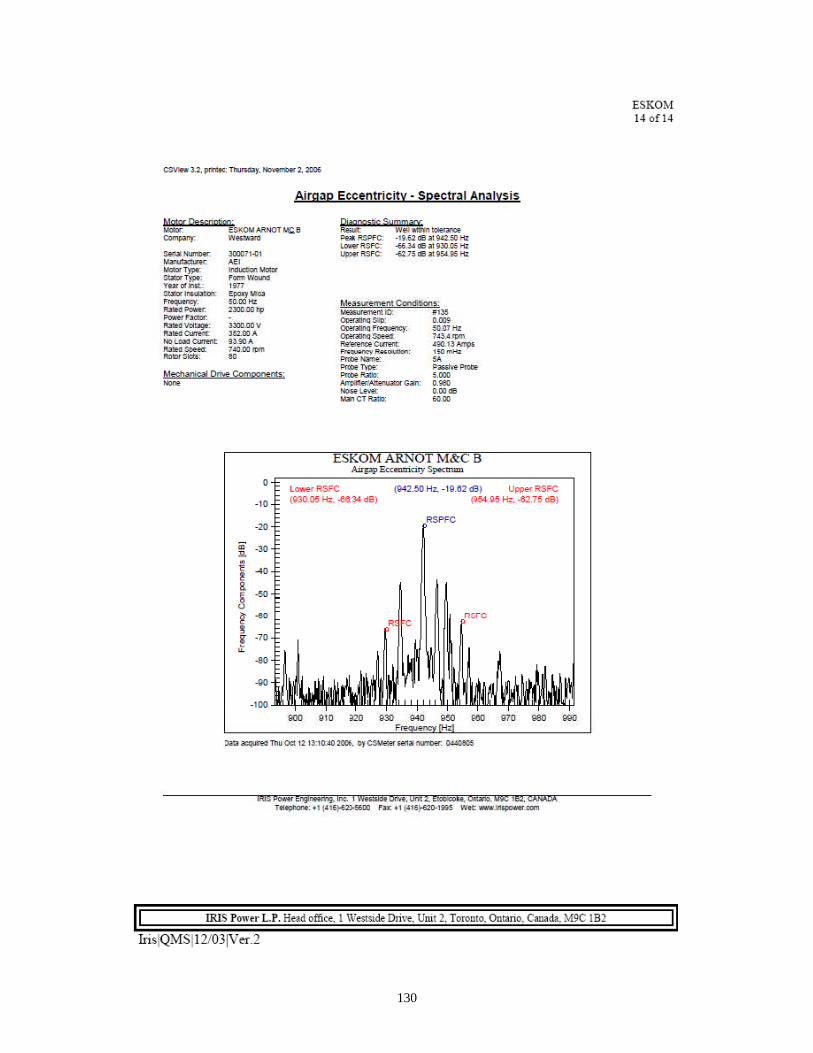
130
131
REFERENCES
[1] Ahmed M. and Henderson R., ‘Medium Voltage Motor Reliability and
Performance Enhancement’, Eskom Resources and Strategy Research
Division, Research Proposal.
[2] Ansoft RMxprt: AP0679911, ‘A Three-phase Induction Motor Problem’.
INTERNET: www.ansoft.com/devices/motor/3phase10.pdf, - Application
Note, Cited December 2006.
[3] Bellini A., Filipetti F., Franceschini G., Tassoni C., and Kliman G.B.,
‘Quantitative Evaluation of Induction Motor Broken Bars by Means of
Electrical Signature Analysis’, IEEE Transaction on Industrial Applications,
vol. 37, no 5 pp 1258-1255, 2001.
[4] Benbouzid Mohamed El Hachemi, ‘A Review of Induction Motors
Signature Analysis as a Medium for Faults Detection’, IEEE Trans. on Ind.
Electronics, Vol. 47, No. 5 October 2000.
[5] Benbouzid M.E.H., Kliman G.B., ‘What stator current processing based
technique to use for induction motor rotor faults diagnosis?’ IEEE Power
Engineering Review, August 2002.
[6] Bowers S.W., Piety K.R., and Piety R.W. and Colsher Richard J.,
‘Evaluation of the Field Application of Motor Current Analysis’, INTERNET:
http://www.compsys.com/ - Application Papers, Cited 30 March 2006.
[7] Bowers S.V. and Piety K.R., ‘Proactive Motor Monitoring Through
Temperature, Shaft Current and Magnetic Flux Measurements’,
INTERNET: http://www.compsys.com/ - Application Papers, Cited 28 May
2006.

132
[8] Daviu J.A., Guasp M.R., Folch J.R., Gimenez F.M. and Peris A.,
‘Application and optimisation of the discrete wavelet transform for the
detection of broken rotor bars in induction machines’, Applied and
Computational Harmonic Analysis, Vol. 21, Issue 2, pp 268-279,
September 2005.
[9] Elkasabgy N.M., Eastham A.R., Dawson G.E, ‘Detection of Broken Bars in
the Cage Rotor on an Induction Machine’, IEEE Transactions on Industrial
Applications, vol. 28 no. 6, pp 165-171, January/February 1992.
[10] Haji M., and Toliyat H.A, ‘Pattern Recognition – a technique for induction
Machines Rotor Broken Bar Detection’, IEEE Transaction on Energy
Conversion, vol. 16 no. 4, pp312-317, 2001.
[11] Hop D., ‘The assessment of vibration produced in Squirrel Cage Induction
Motors having cracked and/or broken bars’, Master of Engineering
Dissertation submitted at University of the Witwatersrand, July 1992.
[12] INTERNET: http://www.irispower/newsite/index.aspx?nav=CSMeter, Cited
14 May 2006.
[13] Kelk H. M., Milimonfared J., and H.A. Toliyat H.A., ‘Interbar Currents and
Axial Fluxes in Healthy and Faulty Induction Motors’, IEEE Trans. on
Industry Applications, Vol 40, No. 1, pp 128-134, January/February 2004.
[14] Kerszenbaum I. and Landy C.F., ‘Investigation of the existence of
significant interbar laminar currents in the three-phase in squirrel cage
motors with rotor bar and/or endrings’, The Transactions of the SAIEE, pp.
139 - 144, June 1983.
133
[15] Kerszenbaum I., ‘The behaviour of three-phase squirrel cage induction
motors with unbalance in the rotor; in particular two pole motors’, Doctor of
Philosophy Thesis submission at the University of Witwatersrand, July
1983
[16] Kerszenbaum I. and Landy C.F., ‘The detection of broken bars and/or
endrings in large squirrel cage induction motors’, The Transactions of the
SAIEE, pp. 22 - 27, July 1984.
[17] Kilbey Bill, ‘Electric Motor Diagnostics Defect Frequencies and Data
Collection Methods’, INTERNET: http://www.compsys.com/ - Application
Papers, Cited 30 May 2006.
[19] Kliman, G.B., Koegl, R.A., Stein, J., Endicott, R.D., and Madden M.W.,
‘Noninvasive Detection of Broken Rotor Bars in Operating Motors’, IEEE
Trans. on Energy Conversion, Vol. 3, No. 4, pp. 873 – 879, December
1988.
[20] Landy C.F., Reynders J.P. and Müller G.H., ‘Condition Monitoring of
Induction Motors’, Electric Power Research Group, University of
Witwatersrand, August 1996.
[21] Liang B., Iwnicki S.D., and Ball A.D., ‘Asymmetrical stator and rotor faulty
detection using vibration, phase current and transient speed’, Mechanical
Systems and Signal Processing, Vol. 17, Issue 4, pp 857-869, July 2003.
[22] McCully P.J. and Landy C.F., ‘Evaluation of Current and Vibration Signals
for Squirrel Cage Induction Motor Condition Monitoring’, Proceedings of
International Conference on Electrical Machines, pp 331 – 335, 1997.
134
[23] Menacer A., Mohamed-Saїd NAÎT-Saїd, Benakcha A/Hamid and Drid
Saїd, ‘Stator Current Analysis of Incipient Fault into Asynchronous Motor
Rotor Bars using Fourier Fast Transform’, Journal of Electrical
Engineering, vol. 55, no. 5-6, pp 122-130, 2004.
[24] Milimonfared J., Kelk H.M., Nandi S., Minassians A. D. and Toliyat H.A., ‘A
Novel Approach for Broken-Rotor-Bar Detection in Cage Induction
Motors’, IEEE Transactions on Ind. Appl., Vol 35, No. 5, pp 1000-1006
September/October 1999.
[25] Müller G.H. and Landy C.F., ‘Detection of broken rotor bars by axial
vibrations produced in squirrel cage induction motors having interbar
currents’, South African universities Power Engineering Conference, pp
195 – 198, 1996.
[26] Müller G.H., ‘A Novel Method to Detect Broken Bars in Squirrel Cage
Induction Motors when Interbar Currents are present’, Doctor of
Philosophy Thesis submission at the University of the Witwatersrand,
1997.
[27] Müller G.H. and Landy C.F., ‘Detection of Broken Rotor Bars in Squirrel
Cage Induction Motors’, Elektron, July 1998.
[28] Müller G.H. and Landy C.F., ‘Detection of Broken Rotor Bars Part I – New
Theory’, Transaction of the SAIEE, pp 7-18, March 2003.
[29] Müller G.H. and Landy C.F., ‘Detection of Broken Rotor Bars Part II –
Experimental Verification’, Transaction of the SAIEE, pp 19-28 March
2003.
135
[30] Müller G.H. and Landy C.F., ‘Vibration produced in squirrel cage induction
motors having broken rotor bars and interbar currents’, Proceedings of
International Conference on Electric Machines, pp 595-600.
[31] O'bannon Bob, ‘Advanced AMS Machinery Manager - RBMview’,
INTERNET: http://www.compsys.com/ - Application Papers, Cited 28 May
2006.
[32] Pereira L.A. and Daniel da Silva Gazzana, ‘Rotor Broken bar and
Diagnosis in Induction Motors using Stator Current Signature Analysis and
Fuzzy Logic’, IEEE Industrial Electronics Society Annual Conference, pp
3019-3024, November 2004.
[33] Schoen R.R. and Habetler T.G., ‘Effects of Time-Varying Loads on Rotor
Fault Detection in Induction Machines’, IEEE Transactions on Industrial
Applications, vol. 31 no. 4, pp 900-906, July/August 1995.
[34] Schoen R.R., Lin B.K., Habetler T.G., Schlag J.H. and Farag S. ‘An
Unsupervised, On-line System for Induction Motor Fault Detection using
Stator Current Monitoring’, IEEE Transactions on Industrial Applications,
vol. 31 no. 6, pp 1280-1286, November/December 1995.
[35] Siyambalapitiya D.J.T., McLaren P.G., and Acarnley P.P., ‘A Rotor
Condition Monitor for Squirrel cage Induction Motor’, IEEE Transactions
on Industrial Applications, vol. 23 no. 2, pp 334-340, March/April 1987.
[36] Sorensen Vern, ‘Defining Analysis Parameter, Alarm Limit, & Fault
Frequency Sets’, INTERNET: http://www.compsys.com/ - Application
Papers, Cited 15 June 2006.
136
[37] Tavner P.J. and Penman J., Condition Monitoring of Electrical Machines,
New York: John Wiley & Sons Inc., 1987.
[38] Thomson William T. and Fenger Mark, ‘Development of a tool to Detect
Faults in Induction Motors via Current Signature Analysis’, Iris Rotating
Machine Conference, June 2002, San Antonio, TX - INTERNET:
http://www.irispower.com/newsite/index.aspx?nav=techpaper; Cited 26
May 2006.
[39] Thomson William T. and Fenger Mark, ‘Case Histories of Current
Signature Analysis to Detect Faults in Induction Motor Drives’ INTERNET:
http://www.irispower.com/newsite/index.aspx?nav=techpaper; Cited 26
May 2006.
[40] Walliser R.F., ‘An investigation into factors influencing the detection of
broken rotor bars in single- and double-cage induction motors; with
reference to interbar currents’, Doctor of Philosophy Thesis submitted at
the University of the Witwatersrand, 1993.
[41] Walliser R.F. and Landy C.F., ‘Determination of interbar current effects in
the detection of broken rotor cars in squirrel cage induction motors’, IEEE
Transaction on Energy Conversion, Vol. 9, No.1, pp. 152-158, March
1994.
[42] Zachas A., ‘Evaluation of Heating Effects Due to Interbar Currents’,
Research Report submission for partial fulfilment for Master of Science
degree at the University of the Witwatersrand, 2004.
137
Additional References
[43] Ayhan B., Chow Mo-Yeun, Trussell H.J. and Song Myung-Hyun, ‘A Case
Study on the Comparison of Non-parametric Spectrum Methods for
Broken Bar Fault Detection’, IEEE Industrial Electronics Society, Vol. 29,
pp 2835-2840, 2003.
[44] Ayhan B., Chow Mo-Yeun and Song Myung-Hyun, ‘Multiple Signature
Processing-Based Fault Detection Schemes for Broken Rotor Bar in
Induction Motors’, IEEE Transaction on Energy Conversion, Vol. 20, No.2,
June 2005.
[45] Botha M.M. – L H Marthinusen, Broken Rotor Bars, Elektron pg 27 -29,
May 1993.
[46] Deng, X. ‘Detection of rotor faults on induction motors by investigating the flux linkage of the stator winding’, PhD Thesis, Aalborg University, Denmark, Dec. 1994.
[47] Dhuness, Kahesh, ‘An investigation into aspects of the online detection of
broken rotor bars in induction motors’, Dissertation submission for partial
fulfilment of the requirements for the Magister Ingeneriae degree at the
University of Johannesburg, December 2006.
[48] EPRI, Electric Motor Predictive Maintenance Program, TR-108773-V2
Final Report, August 1999.
[49] Guru Bhag S. and Hiziroğlu Hüseyin R., Electric Machinery and
Transformers, Third Edition.
138
[50] Lebaround A. and Bentounsi A., ‘Detection Improvement of the broken
rotor bars of IM after supply disconnection’, Journal of Electrical
Engineering, vol. 56, no. 11-12, pp 322-326, 2005.
[51] Penman J. and Stavrou A., ‘Broken rotor bars: their effect on the transient
performance of induction machines’, IEE Proc.-Electr. Power Appl., Vol.
143, No. 6, November 1996.
[52] Schoen R.R., Habetler T.G., Kamran F. and Bartheld R.G. ‘Motor Bearing
Damage Detection using Stator Current Monitoring’, IEEE Transactions on
Industrial Applications, vol. 31 no. 6, pp 1274-1279, November/December
1995.
Associated Experimental References
[53] APPENDIX F: CMM CONSULTANTS EXPERIMENT REPORT
[54] APPENDIX G: IRIS POWER EXPERIMENT REPORT