Embed Size (px)
Citation preview

Determining the impact and materiality of different sustainability dimensions on corporate operational
performance and risk
Robin Åkerberg
Department of Finance and Statistics
Hanken School of Economics
Helsinki
2019

HANKEN SCHOOL OF ECONOMICS
Department of: Department of Finance and Statistics
Type of work: Thesis
Author: Robin Åkerberg Date: 29.7.2019 Title of thesis: Determining the impact and materiality of different sustainability dimensions on corporate operational performance and risk Abstract: In a world with limited resources, businesses play a crucial role in the steps towards a more sustainable future. Consequently, research regarding the economic incentives for businesses to improve their corporate sustainability performance (CSP) has increased a lot in the last two decades. Despite of this, there is still a lack of consensus on the effects of CSP on corporate financial performance (CFP). In this thesis I therefore set out to determine the impact and materiality of different measures of sustainability on corporate operational performance and risk in 9 economic sectors. The data covers European companies during 2002–18. Because sustainability is multifaceted and difficult to measure and define accurately, an entire industry of companies providing their estimates of how well firms perform on sustainability issues has developed. The calculation methods behind the sustainability scores often lack transparency and the scores have been shown to be inconsistent between different providers. To evaluate the connection between CSP and CFP in a transparent way, I use raw data points regarding the performance of companies on several sustainability issues and combine them into 21 CSP factors using principal component analysis. This results in 6 environmental factors, 9 social factors, 2 corporate governance factors and 4 controversy factors. These factors are then used in 3 separate fixed effects regression models exchanging between several different measures of corporate operational performance and risk as dependent variables, to assess how CSP influences CFP in the long-term, in the short-term and over different time-periods. The results of this study indicate that the CSP–CFP relationship is generally non-negative, and that the economic benefits of improving a company’s performance on sustainability issues mainly stem from reduced firm risk. Companies that provide ecologically sourced products, companies that report on green initiatives and companies that avoid environmental & social controversies, as well as controversies regarding business ethics, are found to have both higher operational performance and lower risk in the long-term. Investments in the workforce and corporate governance issues are found to have a slightly lower operational performance, although a high performance on corporate governance issues is found to reduce firm risk. Keywords: Corporate sustainability, operational performance, firm risk, principal component analysis (PCA), value maximization theory, stakeholder theory, legitimacy theory, resource-based view, shared value, CSP, CFP, fixed effects regression.
SVENSKA HANDELSHÖGSKOLAN
Institution: Institutionen för finansiell ekonomi &
ekonomisk statistik
Arbetets art: Magisteravhandling
Författare: Robin Åkerberg (123700) Datum: 31.7.2019
Avhandlingens rubrik: En bedömning av hur hållbarhetsprestation inverkar på
företagens operativa lönsamhet och risk
Sammandrag:
I mänsklighetens strävan till att övergå till ett konsumtionssamhälle där jordens begränsade resurser används på ett hållbart sätt kan företagsvärlden komma att spela en stor roll. Att uppnå olika hållbarhetsmål hör i dagens läge till mänsklighetens största globala utmaningar och hållbarhetsfrågor har följaktligen fått alltmera uppmärksamhet under de senaste årtiondena, både i samhället och inom forskningssammanhang. Begreppet hållbarhet saknar dock en tydlig och enhetlig definition och det är således svårt att mäta företagens hållbarhetsprestation exakt. En hel industri med företag som erbjuder färdigt uträknade mått på hur väl företag presterar på olika hållbarhetsindikatorer har därför vuxit fram, men dessa tjänster saknar ofta både transparens och enhetlighet. Syftet med denna avhandling är att undersöka hur företagens hållbarhetsprestation inverkar på deras operativa lönsamhet och risk. Undersökningen är gjord i ett europeiskt sammanhang för tiden 2002–2018 och sambandet mellan hållbarhetsprestation och finansiell prestation undersöks skiljt för 9 ekonomiska sektorer. Data är hämtat från Thomson Reuters Eikon. För att mäta företagens hållbarhetsprestation på ett transparent sätt använder jag rådata på hur väl företag presterar på olika hållbarhetsindikatorer, som kombineras till 21 hållbarhetsfaktorer genom principalkomponentanalys. Dessa hållbarhetsfaktorer används därefter i 3 olika regressionsmodeller för att avgöra sambandet mellan företagens hållbarhetsprestation och deras finansiella lönsamhet och risk på lång sikt, kort sikt och mellan olika tidsperioder. Cirka 90 procent av tidigare forskningsresultat visar ett icke-negativt samband mellan företagens hållbarhetsprestation och företagens ekonomiska prestation. De erhållna resultaten i denna avhandling är överlag i linje med dessa och visar att företag med hög hållbarhetsprestation främst gynnas av lägre företagsrisk. Då hela samplet beaktas stöder speciellt miljöfaktorerna och de kontroversiella faktorerna synen att ökad hållbarhet kan resultera i bättre ekonomisk prestation på lång sikt. De samhälleliga och företagsstyrningsrelaterade faktorerna indikerar dock ett mera neutralt samband på längre sikt. En hög prestation på företagsstyrningsfaktorer leder dock till lägre företagsrisk. Nyckelord: Hållbarhet, hållbarhetsprestation, operativ lönsamhet, företagsrisk,
principalkomponentanalys, värdemaximeringsteorin, intressentteorin
CONTENTS
1 Introduction .............................................................................................................. 1
1.1 Purpose of the study .......................................................................................... 3
1.2 Motivation of the study ..................................................................................... 3
1.3 Main contributions ............................................................................................ 5
1.4 Limitations ......................................................................................................... 5
1.5 Glossary of the main concepts ........................................................................... 6
1.6 Structure of the paper ....................................................................................... 6
2 Defining corporate sustainability concepts .............................................................. 7
2.1 Corporate Social Responsibility (CSR) ................................................................ 7
2.1.1 The triple-bottom-line (3BL) ....................................................................... 9
2.2 Corporate Sustainability (CS) ........................................................................... 10
2.3 Differences between CS and CSR ..................................................................... 11
2.4 Corporate Social/Sustainability Performance (CSP) ........................................ 11
2.5 Measuring CSP ................................................................................................. 13
2.5.1 Aggregate CSP measures .......................................................................... 14
2.5.1.1 Environmental, Social & Governance (ESG) ...................................... 15
2.5.1.2 Absolute vs relative measures .......................................................... 15
2.5.1.3 Other aggregation methods .............................................................. 16
2.6 Chapter summary ............................................................................................ 17
3 Linking corporate sustainability and financial performance .................................. 18
3.1 The costs of corporate sustainability – value maximization theory, agency theory and the trade-off between CSP and CFP ........................................................ 18
3.2 Stakeholder theory .......................................................................................... 20
3.3 Resource-based view ....................................................................................... 21
3.4 Legitimacy theory ............................................................................................ 22
3.5 Shared Value .................................................................................................... 22
3.6 The benefits of corporate sustainability .......................................................... 23
3.6.1 Improved efficiency .................................................................................. 24
3.6.2 Risk reduction ........................................................................................... 25
3.6.3 Access to finance ...................................................................................... 26
3.7 Measuring the CSP - CFP relationship .............................................................. 27

6
3.7.1 The impact of industry .............................................................................. 27
3.7.2 The impact of legal origin ......................................................................... 27
3.7.3 The impact of financial crises ................................................................... 28
3.7.4 Chicken vs egg? Causality between CSP and CFP ..................................... 28
3.8 Summary of the theories regarding the link between CSP and CFP ............... 30
4 Previous studies ...................................................................................................... 32
4.1 Waddock, S.A. and Graves, S.B., 1997. The corporate social performance–financial performance link .......................................................................................... 32
4.1.1 Data & Method ......................................................................................... 32
4.1.2 Main findings ............................................................................................ 33
4.1.3 Relevancy for this study ........................................................................... 33
4.2 Galema, R., Plantinga, A. and Scholtens, B., 2008. The stocks at stake: Return and risk in socially responsible investment ................................................................ 33
4.2.1 Data & Method ......................................................................................... 33
4.2.2 Main findings ............................................................................................ 34
4.2.3 Relevancy for this study ........................................................................... 34
4.3 Mǎnescu, C., 2011. Stock returns in relation to environmental, social and governance performance: Mispricing or compensation for risk? .............................. 34
4.3.1 Data & Method ......................................................................................... 34
4.3.2 Main findings ............................................................................................ 35
4.3.3 Relevancy for this study ........................................................................... 35
4.4 Other previous findings ................................................................................... 35
4.5 Summary of the previous literature ................................................................ 36
5 Data......................................................................................................................... 38
5.1 CSP data ........................................................................................................... 39
5.1.1 Principal component analysis ................................................................... 41
5.1.1.1 Variable requirements ...................................................................... 41
5.1.1.2 Dealing with missing values .............................................................. 42
5.1.1.3 Suitability of the data for factor analysis .......................................... 43
5.1.1.4 PCA extraction rules and criteria....................................................... 44
5.1.1.5 Interpreting the results of the PCA ................................................... 45
5.1.2 Environmental factors .............................................................................. 46
5.1.3 Social factors ............................................................................................. 47
5.1.4 Governance factors .................................................................................. 48
5.1.5 Controversy factors .................................................................................. 48

7
5.2 Financial data ................................................................................................... 49
5.2.1 Dependent variables ................................................................................. 49
5.2.1.1 Return on assets (ROA) ..................................................................... 50
5.2.1.2 Cash flows from operations to total assets (CFOTA) ........................ 50
5.2.1.3 Sales growth (SG) .............................................................................. 50
5.2.1.4 Gross margin (GM) ............................................................................ 51
5.2.1.5 Long-term measures of operational performance and risk .............. 51
5.2.2 Control variables ....................................................................................... 53
5.2.2.1 Size..................................................................................................... 53
5.2.2.2 Leverage ............................................................................................ 53
5.2.2.3 Age ..................................................................................................... 54
5.3 Descriptive statistics ........................................................................................ 55
5.4 Hypothesis formulation ................................................................................... 59
6 Methodology .......................................................................................................... 60
6.1 Choosing the appropriate panel data regression model ................................. 60
6.1.1 Pooled OLS vs random / fixed effects model ........................................... 62
6.1.2 Fixed effects model vs. random effects model ........................................ 62
6.2 Panel data regression models .......................................................................... 63
6.2.1 Examining the long-term CSP – CFP relationship ..................................... 63
6.2.2 Examining the short-term CSP–CFP relationship ..................................... 64
6.2.3 Changes in the CSP–CFP relationship over time ...................................... 65
6.2.4 Taking company CO2 emissions into consideration ................................. 66
6.3 Model diagnostics ............................................................................................ 67
7 Results..................................................................................................................... 68
7.1 Results for the full sample ............................................................................... 68
7.2 Results for the basic materials sector .............................................................. 75
7.3 Results for the consumer cyclicals sector ........................................................ 78
7.4 Results for the consumer non-cyclicals sector ................................................ 81
7.5 Results for the energy sector ........................................................................... 84
7.6 Results for the healthcare sector ..................................................................... 86
7.7 Results for the industrials sector ..................................................................... 89
7.8 Results for the technology sector .................................................................... 92
7.9 Results for the telecommunications services sector ....................................... 94
7.10 Results for the utilities sector ...................................................................... 97
8
7.11 Summary of the long-term results ............................................................... 99
7.12 Summary of the short-term results ........................................................... 102
7.13 Robustness of the models .......................................................................... 103
7.14 Limitations of the study and suggestions for future research ................... 105
8 Summary and conclusions .................................................................................... 107
APPENDICES
Appendix 1 Variables included in the environmental factors ................................... 125
Appendix 2 Variables included in the social factors .................................................. 127
Appendix 3 Variables included in the governance factors ........................................ 129
Appendix 4 Variables included in the controversy factors ........................................ 131
Appendix 5 Variable definitions ................................................................................. 132
Appendix 6 Correlation Matrix of independent variables ......................................... 133
Appendix 7 Summary table of results using model 1 with CSP variables provided by Eikon ....................................................................................................... 134
TABLES
Table 1 Summary of the theories regarding the CSP–CFP link ................................. 31
Table 2 Summary of previous research .................................................................... 37
Table 3 Allocation between sectors and countries................................................... 39
Table 4 Summary of the variable selection- and missing value-processes .............. 43
Table 5 Descriptive statistics ..................................................................................... 58
Table 6 Results for the full sample ............................................................................ 72
Table 7 Results for the basic materials sector .......................................................... 77
Table 8 Results for the consumer cyclicals sector .................................................... 79
Table 9 Results for the consumer non-cyclicals sector ............................................. 82
Table 10 Results for the energy sector ....................................................................... 85
Table 11 Results for the healthcare sector ................................................................. 87
Table 12 Results for the industrials sector ................................................................. 90
Table 13 Results for the technology sector ................................................................ 93
Table 14 Results for the telecommunications services sector ................................... 95
Table 15 Results for the utilities sector ...................................................................... 98
Table 16 Summary of the long-term regression results ........................................... 101
Table 17 Summary of the short-term results ........................................................... 103
FIGURES

9
Figure 1 An illustration of the CSP – CFP relationship as viewed in this thesis ......... 12
Figure 2 Number of observations per year ................................................................ 38
Figure 3 ESG Building blocks ...................................................................................... 40

1
1 INTRODUCTION
In October of 2018 the Intergovernmental Panel on Climate Change (IPCC) released a
special report on the impacts of climate change, highlighting the importance of limiting
global warming to 1.5 °C above pre-industrial levels. The report, which cites more than
6,000 academic papers and has been approved by governments worldwide, states that
the entire world economy would be affected negatively if the goals are not met (IPCC,
2018). The United Nations (UN) have also set out 17 sustainable development goals that
address social, environmental and economic global challenges, with the aim that these
goals will be reached by 2030 (UN, 2019). Battling climate change and using the world’s
limited resources in a sustainable manner is therefore in everyone’s interest, and
sustainability issues are likely to have an impact also on the financial markets in the
foreseeable future, possibly through changes in legislation, taxation, and societal
demands (Bassen & Kovács, 2008).
The interest towards corporate sustainability has increased rapidly over the last two
decades in Europe, the geographical area studied in this paper, and across the globe
(Carroll & Shabana, 2010). Based on a survey by Lacy, Cooper, Hayward and Neuberger
(2010), 93 percent of CEOs believe that sustainability issues are critical for the success
of their business in the future. In the beginning of the 1990s less than 20 public
companies reported on environmental, social and governance (ESG) information but
this number had grown to 8,500 in 2014 (Kotsantonis, Pinney & Serafeim, 2016). A
growing number of companies also have a full-time sustainability officer (Miller &
Serafeim, 2014; GreenBiz, 2018), demonstrating that companies increasingly find
sustainability efforts important.
Socially responsible investing (SRI) has also increased and developed enormously as
investors have showed more interest towards including nonfinancial issues, such as the
inclusion of ESG aspects, into their investment decisions (Dorfleitner, Halbritter &
Nguyen, 2015). For instance, the UN-supported Principles for Responsible Investment
(PRI) currently have approximately 2,200 signatories, compared to less than 100
signatories in 2006, and close to US$ 90,000 billion in assets under management (PRI,
2018). This is according to Friede, Busch and Bassen (2015), the majority of the total
global institutional asset base. Furthermore, with more focus being directed towards
corporate sustainability, and as companies disclose more qualitative and nonfinancial
information, a larger proportion of company value can be attributed to intangible assets
2
(Bassen & Kovács, 2008). In 2009, intangible assets accounted for more than 80 percent
of company market values compared to 20 % in 1975 (Eccles, Serafeim & Krzus, 2011).
The amplified interest towards sustainability can also be seen in the increased coverage
by academia; Margolis and Walsh (2003) find 127 published studies that examine the
relationship between corporate sustainability performance1 (CSP) and corporate
financial performance2 (CFP), starting with papers by Bragdon and Marlin (1972) and
Moskowitz (1972). The growth in publications has according to Friede et al. (2015) been
especially large since the 1990s, and the authors find at least 2,200 studies on the CSP–
CFP link.
Traditional finance theory claims that the purpose of any business entity is to increase
the value of its shareholders (Friedman, 1970), and based on this view corporate
responsibility can be seen as a voluntary action unlikely to impact CFP. However,
corporate sustainability is nowadays often defined as a concern which should be part of
the core strategy of companies (Lacy et al., 2010; Kramer & Porter, 2011; European
Commission, 2011), and several theory frameworks have been presented in favour of how
increased sustainability performance can improve corporate financial performance.
The majority of previous research find a positive link between CSP and CFP, with
approximately 90 percent of research showing a non-negative relationship (Friede et al.,
2015). There are some discrepancies in results however, which may have several
underlying explanations. Measuring the qualitative aspects of corporate sustainability
quantitatively is difficult in itself, since there are no standardized measures of corporate
sustainability available despite decades of empirical research (Escrig-Olmedo, Munoz-
Torres & Fernandez-Izquierdo, 2010; Dorfleitner, Halbritter & Nguyen, 2015). The lack
of validity of social responsibility measures, the lack of comparability between different
time periods and disparate research methods, and sampling problems are therefore
some of the issues that have been raised regarding the empirical research concerning this
topic (Peloza, 2009; Perrini, Russo, Tencati & Vurro, 2011). ESG scores are regularly
used as indicators of the level of corporate responsibility of firms, and a whole new
industry has developed around providing these scores to different stakeholders. There
are severe inconsistency issues with ESG scores however, as they vary depending on the
provider (Dorfleitner et al., 2015). The ESG providers may use different weights for
1 This is a general term for measures of how well a company performs on sustainability related issues. 2 This is a general term for financial measures used to assess how well a company performs economically.
3
different information, and they may even have explicit differences in how they define
corporate sustainability (Dorfleitner et al., 2015; Chatterji, Durand, Levine & Touboul,
2016). Therefore, the dataset being used, as well as circumstantial factors such as firm
size, economic conditions, the legal origin of the country in which the firms operate, and
the industry in which they operate, affect the CSP-CFP relationship (Peloza, 2009;
Dorfleitner et al., 2015; Liang & Renneboog, 2017). Using a composite measure for
sustainability can also be criticized because the CSP–CFP relationship may vary between
different dimensions3 of sustainability, and these dimensions should therefore be
studied separately (Brammer et al., 2006; Galema, Plantinga & Scholtens, 2008;
Mǎnescu, 2011).
Khan et al. (2016) build on this view and their paper is one of the first to study the CSP–
CFP relationship based on material information. The materiality of information can be
defined as such information that if omitted, the total mix of relevant information
available to stakeholders would be altered, because it has a likely impact on financial
performance. The authors confirm that firms with strong ratings on material
sustainability issues outperform firms with poorer ratings on these issues, but that this
is not the case for firms with strong grades on immaterial issues.
1.1 Purpose of the study
The purpose of the thesis is to study the impact and materiality of different sustainability
dimensions on corporate operational performance and risk.
1.2 Motivation of the study
The chosen topic is interesting for several reasons. First, corporations have an important
role in the strive to reach the sustainable development goals set by the UN, and research
about the sustainability-related finance is of growing importance. If there indeed is a
significant relationship between CSP and CFP, then the existing limitations with regards
to credibility, comparability, quality, transparency and consistency of sustainability
reporting, act as barriers to making this information as relevant as other financial
information (Eccles, Krzus, Rogers & Serafeim, 2012). Corporations and investors alike
are in an urgent need for sustainability reporting standards, and many regulators and
financial professionals have already started to tackle the problem (Lydenberg, Rogers &
3 The different dimensions of sustainability refer to the different aspects included in sustainability, such as human rights issues, resource efficiency, community relations or business ethics. In this study, 21 dimensions of sustainability are used.

4
Wood, 2010). By constructing 21 sustainability factors in a transparent way, this paper
studies the CSP–CFP relationship over the long- and short-terms as well as for three
recent time periods, to fill the existing gap in the literature on which sustainability
information that has relevance for a firm’s financial performance.
Second, the Morgan Stanley Capital International’s (MSCI) KLD database, is often used
as the source for the sustainability data in previous studies (e.g. Khan et al., 2016; Lins,
Servaes & Tamayo, 2017). However, exchanging the data sets used in research is an
important test of robustness of previous findings (Dorfleitner et al., 2015). To improve
the understanding of how the materiality of sustainability issues vary across countries,
changing the geographical scope is also a motivated check of validity, as factors such as
legal environment have a significant impact on corporate sustainability (Peloza, 2009;
Liang & Renneboog, 2017; Amel-Zadeh & Serafeim, 2018). Although the integration of
ESG criteria is integral to European fund management (Eurosif, 2018), studies that cover
the materiality of sustainability information is relatively new and has to my knowledge
not been done extensively in a European context, providing a gap in the existing
literature that I aim to fill.
Third, there are some organizations, such as SASB, and practitioners’ reports that study
the key performance indicators of sustainability, i.e. the sustainability factors with a
material impact on CFP (e.g. DVFA/EFFAS, 2009; Lydenberg et al., 2010; Sitawi, 2016).
These reports are indicative of the results that may emerge, but often may lack
transparent process descriptions (Lydenberg et al., 2010), empirical results showing the
signs of the relationships, and descriptions of the variables that have been used to
calculate the KPIs. Khan et al. (2016) also point out that the classifications into material
and immaterial information are likely to differ depending on the method used. By using
more transparent methods, the results of this thesis can therefore increase the credibility
of preceding findings of CSP’s impact on the operational side of business.
Fourth and finally, the choice to focus on the operational aspects of firms’ financial
performance is motivated by the fact that accounting-based measures are found to be
more correlated with CSP than market-based measures (Orlitzky, Schmidt & Rynes,
2003). One possible explanation for this could be that the actual business performance
is an important determinant of the market-based measures, and that the latter are
affected by more noise.
5
1.3 Main contributions
This paper contributes to the existing literature by identifying the effects of CSP on firm
operational and risk performance in both the long-term and short-term, using a
relatively recent data set (2002–2018). Unlike the majority of previous studies who
overwhelmingly study CSP at a cross-industry level (Peloza, 2009), I examine the CSP–
CFP relationship separately for several economic sectors. Especially the analysis of the
long-term effects of higher CSP brings an important addition to the existing research on
the topic. I find that firms with high CSP performance tend to have lower risk and that
the operational performance of a firm in general does not suffer from increasing its CSP.
I also look at changes in the CSP–CFP relationship across different time periods. I find
that there has been an increase in demand during later time periods towards products
and services from firms with a strong performance on environmental issues.
Furthermore, I contribute by showing that the division of sustainability dimensions into
smaller fractions can provide new information regarding the sustainability-performance
relationship.
The results of this study are likely to be of interest to several stakeholders, including
managers, investors, governments and consumers alike.
1.4 Limitations
The scope of the study is restricted to public companies headquartered in countries of
the European Union (EU) or the European Free Trade Association (EFTA). Europe is an
interesting market to study, as Bird, Momenté and Reggiani (2012) find that investors
seem to put a high value on CSR activities in this region. Especially companies in the
Nordic countries and Switzerland are found to be world leaders in sustainability
performance (RobecoSam, 2018). The time period is selected on the basis of data
availability and covers the period 2002-2018, providing observations over 17 years. To
be included in the dataset, ESG data for at least two consecutive years is required
(assuming that these scores are calculated only when there is enough underlying data for
a specific company). Financial firms are excluded from the study similarly to previous
studies (e.g. Lins et al., 2017). These companies hold a large amount of assets of other
companies with varying sustainability performance.
6
1.5 Glossary of the main concepts
The following concepts will be used frequently throughout the paper and their definitions
are summarized here:
CS = Corporate sustainability. Defined as a firm’s use of resources in an ethical
manner, which promotes equal opportunity and poverty reduction without being
harmful to the environment or the communities in which a firm operates, and
which does not compromise the use of any resources for generations to come.
CSP = Corporate sustainability performance. This is a general term for measures
of how well a company performs on CS issues. In this study, 21 CSP factors are
used.
CFP = Corporate financial performance. This is a general term for different
measures of a company’s financial performance. Several CFP measures are used in
this study as proxies for firm operational performance and risk.
CS business case = a concept used in this study which means that higher CSP
results in improved CFP.
1.6 Structure of the paper
The structure of the paper is as follows: chapters 2 to 4 deal with theory and previous
findings, whereas chapters 5 to 7 make up the empirical part of this study.
Chapter 2 will cover terminology and definitions of different sustainability concepts that
are relevant for this study. In chapter 3 the existing theories regarding the CSP–CFP link,
as well the main arguments for and against the existence of a business case for corporate
sustainability, will be presented and discussed. Previous studies will be presented in
chapter 4. Data, methodology and results will be dealt with in chapters 5, 6 and 7,
respectively. Chapter 8 will summarize and conclude.
7
2 DEFINING CORPORATE SUSTAINABILITY CONCEPTS
The concept of corporate sustainability (CS) is ambiguous and difficult to measure, as
there is no complete and commonly accepted way of defining it (see e.g. Montiel &
Delgado-Ceballos, 2014). Additional concepts such as corporate social responsibility
(CSR), corporate responsibility, (corporate) sustainable development and corporate
sustainability (social) performance (CSP) are often used interchangeably. Although the
history of the concepts vary, they are argued by some to have slightly different meanings
and interpretations. According to the view taken in this thesis, CSR has to do with
creating value for companies while simultaneously meeting the demands set out by
society. I view CSR as a part of the more general term CS, which I define as a firm’s use
of resources in an ethical manner which promotes equal opportunity and poverty
reduction without being harmful to the environment or the communities in which a firm
operates, and which does not compromise the use of any resources for generations to
come (modification of the definition of sustainable development proposed by WCED,
1987). Time is therefore an important part of CS as it involves intergenerational equity
and the distribution of resources between generations (Bansal & DesJardine, 2014).
Corporate sustainability performance (CSP) is essentially a general term for
measurements on how CS is carried out in practice by companies.
In this chapter I present the different concepts briefly and explain their differences and
overlaps. I also justify the interpretations of the concepts that have been made in this
study.
2.1 Corporate Social Responsibility (CSR)
The modern concept of corporate social responsibility originates to a large extent from
Bowen’s (1953) view on social responsibility. He argued that large businesses are
powerful decision makers in society, and that businessmen are responsible for the
societal consequences of their actions (Carroll, 1999). Historically, CSR has had to do
with social issues that are dealt with on a voluntary basis, whereas research regarding
other areas of sustainability, such as environmental issues, have commonly fallen under
environmental management (Montiel, 2008). A commonly cited view of CSR is the
definition put forward by Carroll (1979:500):
the social responsibility of business encompasses the economic, legal, ethical, and discretionary expectations that society has of organizations at a given point in time.
8
This definition identifies four categories of societal firm responsibilities, where the
economic responsibilities have the relatively largest role, followed by the legal and ethical
responsibilities, with discretionary responsibilities (in a later paper being referred to as
philanthropic responsibilities) having the relatively smallest role (Wood, 2010; Carroll,
2016). These four categories are not mutually exclusive however, rather they are ordered
based on the relative magnitude of each responsibility (Carroll, 1979). Kang (1995)
turned Carroll’s (1979) view around and argued that moral responsibilities are of primary
importance, since companies that are not profitable in ethical and legal ways will be
eliminated by society in the long run (Wood, 2010).
The view on CSR has changed significantly over the last decades however, and the notion
that CSR is a multidimensional concept has become more common in the last decades
(see e.g. Lopez, Garcia & Rodriguez, 2007). This can also be seen for instance in the
development of the definitions provided by the European Commission. In 2001, the
European Commission (2001:7) defined CSR as
a concept whereby companies integrate social and environmental concerns in their business operations and in their interaction with their stakeholders on a voluntary basis.
Here, CSR is viewed as a bi-dimensional construct in which also environmental concerns
are included, and the definition involves voluntary actions that philanthropic companies
can take to go beyond their legal obligations. A similar definition to this is provided by
the International Organization for Standardization (2018), who state that CSR is the
“responsibility of an organisation for the impacts of its decisions and activities on
society and the environment”. In 2011, the European Commission renewed the
definition of CSR and defined it as “the responsibility of enterprises for their impacts on
society” (European Commission, 2011:6). Further details are then specified:
To fully meet their corporate social responsibility, enterprises should have in place a process to integrate social, environmental, ethical, human rights and consumer concerns into their business operations and core strategy in close collaboration with their stakeholders, with the aim of:
–maximising the creation of shared value for their owners/shareholders and for their other stakeholders and society at large;
–identifying, preventing and mitigating their possible adverse impacts.
[…] To maximise the creation of shared value, enterprises are encouraged to adopt a long-term, strategic approach to CSR.
The importance of integrating CSR policies into the core strategy of the business is
relevant in this definition. This is in line with the view of Lopez et al. (2007), who argue
that long-lasting positive effects of CSR can only be achieved when CSR policies are
9
present in all the firm’s important decisions. Furthermore, although social aspects are
highlighted in the renewed definition by the EU, the notion about maximised shared
value to the shareholders and other stakeholders is also mentioned, indicating a broader
view on CSR.
Frederick (1994) suggests that the CSR concept can be further divided into CSR1,
referring to corporate social responsibility, and CSR2, referring to corporate social
responsiveness. CSR1 has to do with the obligations of a firm to be socially responsible,
whereas CSR2 refers to the capacity of companies to respond to different social pressures
(Frederick, 1994).
2.1.1 The triple-bottom-line (3BL)
CSR is sometimes considered as a part of a more general term, corporate responsibility
(CR), of which the social aspects are just one dimension in a larger entity. Elkington
(1998) introduced the concept of the triple-bottom-line (3BL), consisting of a societal,
economic and environmental pillar. The social equity pillar has to do with equal
opportunity, poverty reduction, human rights, peace, justice and access to resources for
all members of society, and includes meeting the basic needs of people, as well as
ensuring them healthcare, education and political freedom (Goodland, 1995; Bansal,
2005; UN, 2018). Environmental integrity implies that companies do not consume
natural resources (land, air and water) at a rate which is higher than the natural
reproduction rate (Dyllick & Hockerts, 2002; Bansal, 2005). According to basic finance
theory the economic pillar has to do with maximizing shareholder wealth (Friedman,
1970), but it also has to do with economic sustainability in the 3BL model and the
“maintenance of capital” (Goodland & Daly 1996:1004). Bansal (2005) emphasizes that
economic prosperity is fundamentally connected with the environmental and social
pillars. Goodland (1995:9) differentiates between growth and development and argues
that “our planet develops over time without growing”, and argues that the economy, as
a subsystem of the finite planet, cannot grow infinitely. Instead, economic prosperity
concerns sustainable levels of production and consumption (Goodland, 1995).
The UN later paraphrased the 3BL model into “people, planet, prosperity” for the World
Summit on Sustainable Development, which was held in Johannesburg 2002
(Hammond, 2006). The 3BL model motivates why companies should act sustainably and
aims for a “win-win-win situation”, in which all three pillars can prosper (Heikkurinen,
2010:143). It is argued that each pillar is necessary, but insufficient by itself: economic
10
sustainability in the long run requires all three dimensions to be satisfied and an
exclusive focus on the economic pillar can only be successful in the short run (Dyllick &
Hockerts, 2002; Bansal, 2005).
According to Montiel (2008), CSR scholars tend to view the dimensions of the 3BL model
as independent components, whereas CS scholars often view the three pillars as
interconnected. Gibson (2006) delves deeper into the advantages and shortcomings of
the two approaches and argues that an integrative approach is more suitable.
2.2 Corporate Sustainability (CS)
Traditionally, CS has been associated mostly with environmental issues (Van Marrewijk,
2003), but a clear unanimous definition of CS is lacking, and CS can be viewed either as
a concept of ecological sustainability, or as a bi- or tri-dimensional concept including
social, environmental and economic aspects (Montiel, 2008; Montiel & Delgado-
Ceballos, 2014). The tri-dimensional view is therefore very similar to that of the 3BL
model.
Whereas CSR can be derived from the social responsibilities of a firm, researchers and
scholars (e.g. Montiel, 2008; Ketola, 2010) alike commonly agree that the modern notion
of corporate sustainability has emerged from the Brundtland Report’s (World
Commission for Environmental and Development, 1987) definition of sustainable
development, which is “development that meets the needs of the present without
compromising the ability of future generations to meet their own needs” (WCED,
1987:43). This definition, which incorporates the notion of intergenerational ethics
(Hammond, 2006), became widely popular and used, but it has also received criticism
and has been called an illusion and an oxymoron (Gibson, 2006). Banerjee (2003) states
that the definition is in fact a slogan and not a definition and criticizes it for being based
on an economic and not an ecological rationality. As previously mentioned, the definition
of CS used in this thesis is an upgraded version of the Brundtland definition.
Figge and Hahn (2004) argue that economists tend to use a capital theory approach to
sustainability: capital in the form of human capital, natural capital, man-made capital,
and social capital, is sustainable if it is kept constant over time. The authors also discuss
two different categorizations of CS in an economic context: weak sustainability and
strong sustainability. The weak view on sustainability implies that these different forms
of capital are substitutable, whereas the strong view on sustainability implies that the
capital is complementary and non-substitutable (Figge & Hahn, 2004).

11
2.3 Differences between CS and CSR
The multiple definitions that exist for CS and CSR result in that the concepts have a
different meaning depending on who you ask (Van Marrewijk, 2003). Some argue that
the two concepts have merged and that they can be viewed synonymously (e.g. Lopez et
al., 2007; Montiel, 2008), while others claim that there are small but distinct differences
between the concepts. Van Marrewijk (2003:102) finds it warranted to
associate CSR with the communion aspect of people and organisations and CS with the agency principle. Therefore CSR relates to phenomena such as transparency, stakeholder dialogue and sustainability reporting, while CS focuses on value creation, environmental management, environmental friendly production systems, human capital management and so forth.
Other scholars view CS as a larger entity that incorporates all aspects of sustainability,
and therefore includes corporate responsibility (CR), which in turn contains the 3BL
(Van Marrewijk, 2003; Lopez et al., 2007; Heikkurinen 2010). In other words, corporate
responsibility implies the responsibilities required by law, ethical reasoning and society,
whereas CS goes beyond these requirements.
2.4 Corporate Social/Sustainability Performance (CSP)
In the same way as with CSR and CS, the meanings of CSP have changed over time and
depending on the person who defines the term, and therefore no definite definition exists
(Wood, 1991). Carroll (1979) introduced the corporate social performance concept,
which was closely associated with the views on corporate social responsibility (Montiel,
2008). CSP as an abbreviation for corporate social performance has frequently been
used in academia since then and has often been equated with different measures for
sustainability performance. The CSP concept was expanded by Wartick & Cochran
(1985), who integrated competing perspectives such as economic responsibility and
public policy responsibility into the model, and CSP was later developed even further by
Wood (1991:693), who described it as:
a business organization's configuration of principles of social responsibility, processes of social responsiveness, and policies, programs, and observable outcomes as they relate to the firm's societal relationships.
Wood’s (1991) version of CSP still is closely related to CSR, but incorporates that CSP has
to do with processes, policies, programs and their outcomes. Compared to CSR and CS,
Wood (1991) points out that the term performance implies actions and outcomes, and
thus all companies can be assessed on their CSP. Therefore, CSP is not something that a
firm does or does not do, but a set of outcomes that happen whether businesses intend
for them to happen or not (Wood, 2010). Furthermore, Wood (1991; 2010) argues that
12
corporate responsibility is not an accidental by-product of a company’s search for good
CFP, instead it is the outcome of deliberate principles and processes. Rowley and Berman
(2000:398) state that
CSP research involves investigations of variables intended to represent social outcomes of firm behaviors.
Within the last decade, the acronym CSP has received an alternate meaning, namely
corporate sustainability performance. To my knowledge, Lee and Faff (2009) were the
first to use this expression, although they do not define the concept and they seem to use
it synonymously with corporate social performance. Both Wagner (2010) and Artiach,
Lee, Nelson and Walker (2010) define CSP as corporate sustainability performance
however, and Wagner (2010) states that the term aims to deal with activities relating to
all three pillars of the 3BL model. Hence, as measurements of all three pillars are
incorporated in this study, the term corporate sustainability performance is more
suitable than corporate social performance. The abbreviation CSP will henceforth only
imply corporate sustainability performance.
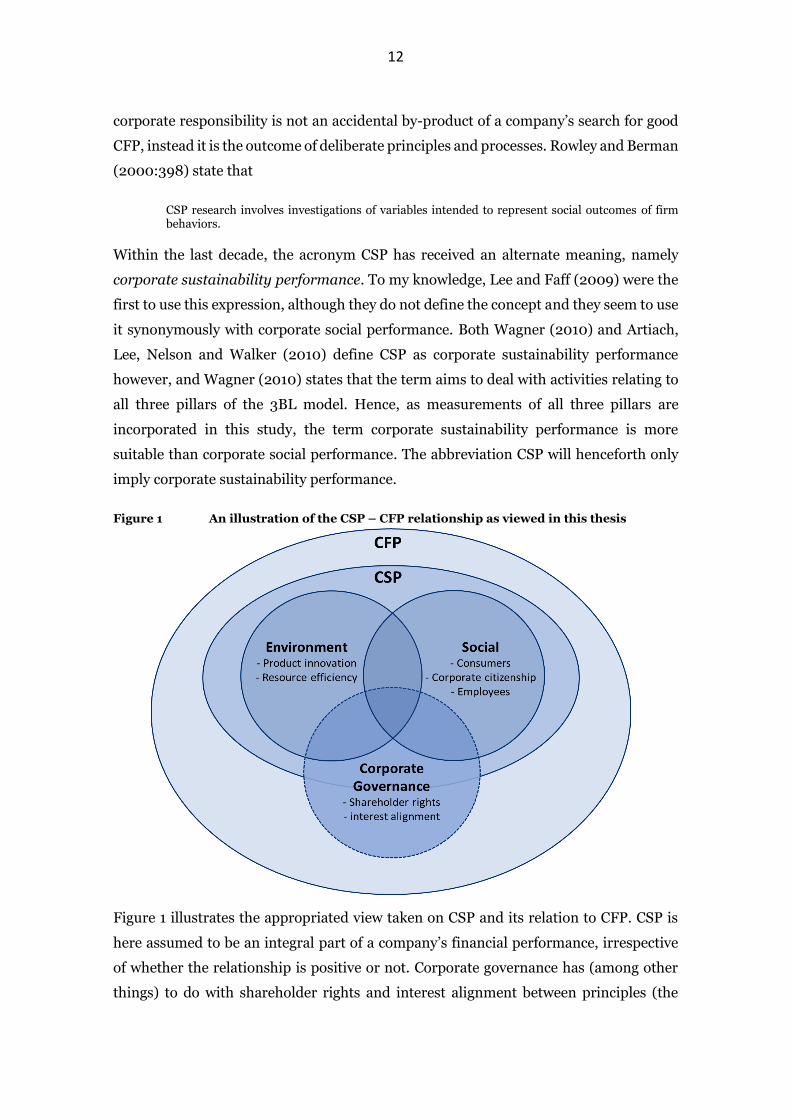
Figure 1 An illustration of the CSP – CFP relationship as viewed in this thesis
Figure 1 illustrates the appropriated view taken on CSP and its relation to CFP. CSP is
here assumed to be an integral part of a company’s financial performance, irrespective
of whether the relationship is positive or not. Corporate governance has (among other
things) to do with shareholder rights and interest alignment between principles (the

13
shareholders) and agents (management). Although high corporate governance
performance can be seen as a positive sign for transparency, equality and trust towards
a company, it is not equally important as the environmental and social pillars for the
CSP, based on how I define CS in this thesis. In other words, certain aspects of a firm’s
performance on corporate governance issues can be considered to be related to CSP,
while other aspects are more closely related to CFP.
2.5 Measuring CSP
Unlike CFP indicators which are clearly defined and readily available, the CSP
counterparts are not. Measuring CSP is an important element of this study, but it comes
with several limitations. Since there are no commonly agreed upon definitions of the
concepts regarding sustainability, it is no surprise that there are no consistent metrics to
measure it either (Cochran & Wood, 1984). Thus, researchers lack the foundation to
build measurements on. Finding appropriate measures for CSP has therefore continued
to plague researchers and practitioners (Davenport, 2000). Finding best practices to
measure CSP is important for both managers and investors as it would enable them to
make better decisions regarding CSP related goals, strategies and challenges (Peloza,
2009).
Despite several decades of research in the field, inconsistent methods used to measure
CSP across disparate time periods have made the results incomparable and flawed
(Peloza, 2009). Making it even more difficult to assess CSP, greenwashing, i.e. when
companies make false promises of environmental benefits (Dahl, 2010), can portray
companies as more sustainable than they in fact are. Parisi and Maraghini (2010) state
that only 35 % of major USA corporations can prove that they follow their sustainability
commitments and Davis-Peccoud, Stone and Tovey (2016) find that only 2 percent of
companies are currently able to achieve or exceed their sustainability transformation
goals in times of corporate transformation. Walker and Wan (2012) find that
greenwashing has a negative effect on CFP.
Cochran and Wood (1984) identified two main methods of measuring CSP: reputation
indices and content analysis, both with their advantages and shortcomings. The
reputation index method is described as a method where “knowledgeable observers rate
firms on the basis of one or more dimensions of social performance”, and content
analysis has to do with analysing the extent of the companies’ sustainability reporting
(Cochran & Wood, 1984:43-44). Classifying firms as sustainable or not based on a
14
company’s inclusion in a sustainability index is an example of the reputation index
method and has been used for instance by Lopez et al. (2007) and Consolandi, Jaiswal-
Dale, Poggiani and Vercelli (2009). The content analysis method is deemed reasonably
objective and independent of the researcher once the included variables are selected.
Since then, several other methods to assess CSP have been proposed.
Peloza (2009) finds a total of 39 unique measures of CSP between 1972 and 2008, that
have been used to determine the CSP–CFP relationship. The author shows that the
majority of studies use a composite measure of CSP. He finds that the most popular
measure was only used in 18 percent of the sample, whereas 38 % of the measures were
used in only one study, thus emphasizing the discrepancies in methods used in previous
research.
The socially responsible investing (SRI) community initially used only so-called
negative screens, where ‘bad’ companies were excluded from the investment portfolios,
to separate good CSP from bad CSP (Wood, 2010). These so-called bad companies are
often referred to as sin-companies, as they participate in controversial activities such as
the production of firearms, tobacco, alcohol, pornography, gambling or military
products, and sometimes even companies with activities in specific geographical regions
may be considered ‘sinful’. Later, positive screens were introduced, where the
responsible investor limits the investable universe only to firms with features that are in
line with his or her values (Barnett & Salomon, 2006; Wood, 2010). According to
Wimmer (2013), SRI investors can be categorised into value-driven investors, who
prioritize sustainability values over strictly financial ones, and profit-seeking investors,
who believe that SRI can contribute to superior financial performance. This study can be
considered more relevant to profit-seeking investors, as the positive externalities that
result from higher CSP and from which value-driven investors obtain utility, are not
taken into account.
2.5.1 Aggregate CSP measures
The investment firm Kinder, Lydenberg, Domini and Company, Inc, commonly known
as KLD, has since 1988 offered a mutual fund based on the Standard & Poor 500
companies, which is screened based on sustainability factors (Wood, 2010). Since the
emergence of sustainability indices, the companies that have been included in them have
often been used as representants of good CS performers within empirical research (e.g.
Lopez et al., 2007; Lee & Faff, 2009). Also, the KLD database which has become

15
increasingly extensive and sophisticated, has often been used to calculate CSP, but
numerous other third-parties nowadays offer comprehensive CSP measures (Wood,
2010).
2.5.1.1 Environmental, Social & Governance (ESG)
A widely used measure of CSP is the environmental, social and governance (ESG) score.
This score is often an aggregate measure of CSP and is a combination of sub-criteria
regarding the separate ‘E’, ‘S’ or ‘G’ pillars (Dorfleitner et al., 2015). Today, a whole
industry of ESG rating agencies that provide these scores has emerged, and both
managers and (SRI) investors are increasingly using these ratings within their decision-
making processes, assuming that the measures are valid (Dorfleitner et al., 2015). There
is a systematic lack of convergence between the ESG scores provided by different
providers however, even after controlling for explicit differences in how CS is defined
(Chatterji et al., 2016). The low commensurability may arise for instance when different
rating agencies use different weights to similar criteria (Escrig-Olmedo et al., 2010;
Dorfleitner et al., 2015). Another problem is that several different scales are used for the
scores, as some rating agencies use a scale from 0 to 100, while others use deviations
from an average, and others use categorical scales (Escrig-Olmedo et al., 2010).
Escrig-Olmedo et al. (2010) further find that there is little information made available to
the public regarding the analysis criteria, evaluation and scoring systems used, and that
the rating agencies in general lack transparency. The authors state however, that
evaluations are normally based on both questionnaires and content analysis (Escrig-
Olmedo et al., 2010). Survey methodologies are often inconsistent and depend on factors
such as questionnaire return rates and subjective interpretations (Waddock & Graves,
1997). The content analysis is reported to include company data, basic company
information, social initiatives, corporate governance, consumer data, employee data,
environmental management data, information about controversial business activities
and relationships with shareholders and suppliers, but the categorization of the
information differs between rating agencies (Escrig-Olmedo et al., 2010).
2.5.1.2 Absolute vs relative measures
Due to the prevalently qualitative nature of CS, CSP measures are often based on so-
called soft indicators, such as management practices, instead of hard indicators, such as
tons of CO2 emissions (Chen & Delmas, 2011). Figge and Hahn (2004) state that there
are two prevailing methods to measure CSP in an economic context: absolute methods

16
and relative methods. Absolute methods subtract the costs from the benefits created,
and if the benefits exceed the sum of internal and external costs, the result is called ‘net
value added’ (Figge & Hahn, 2004). The costs and benefits need to be in the same
monetarized unit, and the authors critique the limited practicability of the method.
Relative methods on the other hand express a company’s CS contributions per unit of
impact added. Figge and Hahn (2004) take the eco-efficiency measure as an example of
a relative measure, which Derwall, Günster, Bauer and Koedijk (2005) define as the
economic value a company adds by producing its products and services divided by the
waste created as a part of that production.
Figge and Hahn (2004) propose a measure of CSP called sustainable value added (SVA),
which according to them covers all three pillars of the 3BL concept. The authors theorize
that value is created whenever benefits exceed the costs of external damage caused, and
instead base their model on opportunity costs. In contrast to absolute methods, external
costs of environmental and social costs do not need to be estimated to calculate SVA.
Instead, information regarding the eco- and social-efficiency of the company, the
economic performance of the company and information regarding a benchmark, is
required to calculate how much a company contributes to sustainability. This
contribution can be expressed in economic, social or environmental terms. As only the
sustainability contribution is measured, SVA does not indicate whether a company is
sustainable or not however. (Figge & Hahn, 2004)
2.5.1.3 Other aggregation methods
Another way to measure CSP is to use linear aggregation methods to create aggregate
CSP scores, either by assigning equal weights to all indicators or assigning weights to
them based on stakeholder preferences (Chen & Delmas, 2011). For instance, Schuler
and Cording (2006) find that consumers value good CSP and are more affected by CSP
information when it is provided by external sources and not by the company itself.
However, stakeholder preferences can change over time, and it is therefore impossible
to find universally accepted optimal weights for these aggregation methods (Chen &
Delmas, 2011). Such variations make many aggregate scores incomparable. Aggregations
can also be conducted by adding the ‘strength’ scores and subtracting ‘concern scores’
(Chen & Delmas, 2011).
Aggregated measures for CSP do not take into consideration the multifaceted aspects
and interrelations of the construct, and although they are often used (Rowley & Berman,
17
2000), the invalidity of aggregate scores is widely agreed upon (Chen & Delmas, 2011;
Dorfleitner et al., 2015). Rowley and Berman (2000) argue that, as CSP from the
stakeholder point of view has to do with the behaviour towards several constituent
groups, CSP measures should not only represent one group or dimension. However,
aggregating dimension scores is, despite several disadvantages, to some extent often the
best option available (Chen & Delmas, 2011).
2.6 Chapter summary
In this chapter definitions of the corporate sustainability (CS) concepts were introduced.
Although CS and CSR (corporate social responsibility) are often used interchangeably,
the two concepts have a different history and are not considered to mean the same thing
in this study. CSR is thought of as meeting the demands set by society while
simultaneously creating business value. In this thesis, CSR is regarded to be a part of CS
however, which is a more general term that has to do with meeting societal and
environmental demands over time. A firm’s performance on CS issues (CSP) in turn, I
assume to be an integral part of the corporate financial performance (CFP).
Whereas measures to proxy CFP is more straightforward, CSP is more difficult to grasp.
Aggregations of several aspects is the most common way of assessing a firm’s
sustainability performance and an entire industry has developed around providing
environmental, social and governance (ESG) scores. Due to the ways that the
sustainability concepts are defined in this study, the environmental and social
dimensions are deemed more important than governance issues, although corporate
governance certainly has some relevance for a firm’s CSP as well.
18
3 LINKING CORPORATE SUSTAINABILITY AND FINANCIAL PERFORMANCE
Whether there exists a business case for sustainability or not is a central question in this
study, so in this chapter I aim to delve into the existing research and theories thereof
regarding the economic costs and benefits from sustainability investments. First, the
costs and disadvantages of sustainability, as well as the central theories that have been
developed to justify the CS business case, will be presented. This will be followed by the
potential competitive advantages that sustainability investments have been argued to
generate. It is important to point out at this point that there is of course also the
opportunity that a neutral or insignificant relationship between CSP and CFP exists,
which several previous papers have found. This topic will not be covered in a section of
its own however, as there are no specific theories covering this option.
In subsection 3.7, some of the most important contextual factors that impact the CSP –
CFP relationship and the direction of causality of the relationship, will be discussed.
3.1 The costs of corporate sustainability – value maximization theory, agency theory and the trade-off between CSP and CFP
Milton Friedman (1970) stated in a highly debated paper that the sole purpose of
business is to increase the wealth of shareholders. This view is sometimes referred to as
the value maximization theory (Jensen, 2001). Although he does not directly say that
social and environmental welfare is bad, Friedman (1970) argues that firms have an
exclusive responsibility to think of the long-term wealth of their shareholders.
Supporters and believers of sustainability related responsibilities are according to him
preaching pure and unadulterated socialism. Businessmen who talk this way are unwitting puppets of the intellectual forces that have been undermining the basis of a free society (Friedman 1970:1).
Any managerial decisions to increase the welfare of society or the environment beyond
what is required by the law would, based on the value maximization theory, destroy
shareholder value. Thus, the ‘doing good but not well’ view would imply a negative CSP–
CFP relationship and that low sustainability ratings/scores would have superior financial
performance.
This view is related to agency cost theory, where the managers (agents) act on behalf of
the principal (shareholders) in a way that is not in the best interest of the principal (Ross,
1973). From a social perspective, the resources spent on social welfare by firms with high
CSP, could according to the value maximization theory have been spent more wisely on

19
profit increasing projects (McWilliams & Siegel, 2001). Thus, in this neo-classical way of
thinking, adding constraints to the business, e.g. by improving social welfare through
increasing workforce safety or by hiring the disabled, will reduce profits (Kramer &
Porter, 2011).
Bénabou and Tirole (2010:2) argue that CSR can be defined as “sacrificing profits in the
social interest”. Based on this definition and view, CSP and CFP are seen as two mutually
exclusive options that firms can chose between, so that the CSP, per definition, cannot
possibly have a positive impact on CFP.
Barnea and Rubin (2010) hypothesize that the CSP–CFP relationship is nonmonotonic
and concave and Auer and Schuhmacher (2016) compare it to the trade-off theory: CS
expenditures add value up to some point and after that, additional CS investments will
start to decrease company value. If managers of a company increase the CS expenditures
beyond the tipping point, the authors argue that it is due to the self-interests of these
insiders at the expense of shareholders (Barnea & Rubin, 2010).
When it comes to environmental protection, Hart and Ahuja (1996) identify two main
methods to reduce emissions and argue that they can either be treated (e.g. stored,
trapped or disposed of), or prevented. The former method can be expensive and is often
non-productive, whereas the latter method involves efficiency and potential cost-savings
and does not necessarily reduce productivity. For instance, national expenditures within
the European Union on environmental protection amounted to EUR 316 billion in 2017,
equivalent to more than 2 percent of GDP (Eurostat, 2018). Hart and Ahuja (1996) state
that there is a time lag between the initiation of CS investments and the realization in
bottom line benefits. This is because investments in CS often require up-front
expenditures to improve systems and processes, to update production technologies, to
train and educate employees, and so on. Lopez et al. (2007:296) confirm this, by finding
a short-term negative impact on CFP, and state that
longer-term view is necessary for new policies, i.e. sustainability criteria, to be reflected in the budgets.
Hong and Kacperczyk (2009) find that sin stocks have higher returns than other
comparable stocks due to that they are often neglected through negative screens and as
a result face greater litigation risk. Thus, from an investor point of view, reducing the
investable universe by excluding companies with bad CSP performance, may in theory
be costly and reduce returns (Borgers & Pownall, 2014). In line with this, Auer and
20
Schuhmacher (2016) find that SRI investors in USA and the Asia-Pacific region earn
similar returns as the broad market, but that socially responsible investors in Europe
tend to pay a price for their chosen strategy. Brammer et al. (2006) find that composite
measures of CSP have a significantly negative impact on CFP, whereas Renneboog et al.
(2008) find a negative relationship, but with insignificant regression alphas. Peloza
(2009) cites a Yale University study which suggests that finance executives tend to
discount environmental issues due to a lack of concrete data, even though they consider
these issues as relevant to their business.
The negative effects of limiting the investable universe, although perhaps costly, are
often negligible as long as the screens do not significantly reduce the investable universe
(Borgers & Pownall, 2014). Mǎnescu (2011) further points out that, if there are enough
value-driven investors who can derive non-financial utility from SRI and as a
consequence are indifferent to whether the costs exceed the benefits or not, they can
affect stock returns. Indeed, most of the empirical research in fact find that CSP has a
positive impact on CFP (Peloza, 2009).
3.2 Stakeholder theory
As the main opposing view of the more traditional value maximization theory, the
stakeholder approach suggested by Freeman (1984) can be used as a framework to assess
the relationship between CSP and CFP (Ruf et al., 2001). The stakeholder theory argues
that as a firm’s actions are reflected on its stakeholders, then managing and improving
the relationships with these key constituent groups is simply good management practice,
which works to fulfil a firm’s best interests (Freeman 1984; Waddock & Graves 1997;
McWilliams & Siegel 2001). All firms have explicit and implicit contracts with their
stakeholders and at some level, the demands of these stakeholders must be satisfied as
an unavoidable cost of doing business (Ruf et al., 2001). Rather than looking at business
and ethics as two separate concepts, the two should be viewed together (Freeman, 1994).
Jo and Harjoto’s (2012) results give empirical support to the stakeholder theory, but the
theory has also been criticised, as the needs and interests of different stakeholder groups
may be diverse and completely incompatible (Banerjee, 2007:32). Thus, maintaining the
implicit and explicit contracts with stakeholders may be costly. Ruf et al. (2001) point
out that when the costs increase as a result of differing stakeholder demands, there are
incentives for companies to engage in opportunistic behaviour. However, there are costs
involved both in meeting stakeholder demands and engaging in opportunistic action.
21
Stakeholders may confront the firm, e.g. through strikes, boycotts, unions and
government, or by lobbying for regulation and forcing mandatory compliance (Ruf et al.,
2001). Rehbein, Waddock and Graves (2004) find that especially the largest and most
visible companies are subjects for stakeholder activism. In addition, Jones (1995) finds
that firms that do not engage in opportunistic actions are able to enjoy competitive
advantages from increased trust and cooperation.
Jensen (2001) proposes a modified version of the stakeholder theory, called enlightened
stakeholder theory, which combines the value maximization principle of maximizing
shareholder value over the long run, and uses that criteria for making the trade-offs
among its stakeholders. Others have argued that CS is only based on ‘enlightened self-
interest’, meaning that CS is only a mean to serve the self-interests of management, and
that a search for a positive CSP-CFP link is a way to validate this self-interest (Wood &
Jones, 1995). Bird, Hall, Momentè and Reggiani (2007) also hypothesize that the
stakeholder and value maximization theories do not necessarily have to contradict each
other as good stakeholder management is likely to be consistent with maximizing value
for the owners of the firm. Their results indicate just that, i.e. that the stakeholder view
does not jeopardise shareholder interests. Finally, Hillman and Keim (2001) also show
that good stakeholder management improves shareholder value, although their results
indicate that investing in social issues has a negative impact.
3.3 Resource-based view
Sometimes seen as a complement to stakeholder theory, the resource-based view of the
firm sees strong CSP as a resource which in return can provide the company with
sustainable competitive advantages (Ruf et al., 2001). Wernerfelt (1984) defines
resources as tangible and intangible assets that can be seen as strengths or weaknesses
of a firm and which are tied at least semi-permanently to the firm. Instead of viewing
competitors as homogenous, differences in firm-performance are, based on the resource-
based view, therefore the result of the different collections of resources that the
companies have acquired (Litz, 1996; Ruf et al., 2001).
Litz (1996) suggested that strong social and environmental competences should be
viewed as valuable resources that can aid companies in their quest for sustainable
competitive advantages through quick responsive actions to societal demands and
increased production efficiency.

22
3.4 Legitimacy theory
Building on stakeholder theory and the resource-based view, legitimacy theory is based
on society’s perceptions of the sustainability performance of companies and focuses on
whether the norms displayed by organizations are congruent with the norms of society
in general (Cho et al., 2015). Suchman (1995:574) defines legitimacy as follows:
Legitimacy is a generalized perception or assumption that the actions of an entity are desirable, proper, or appropriate within some socially constructed system of norms, values, beliefs, and definitions.
Thus, legitimate organizations have a reputation of being more trustworthy and
transparent (Suchman, 1995). If the status of organizational legitimacy is not preserved,
the longevity of the firm’s future cash flows cannot be guaranteed, as stakeholders may
be unwilling to do business with a company lacking legitimacy (Lopatta & Kaspereit,
2014). This can result in reduced profits and may in worst case lead to corporate failure.
To convey information to stakeholders and reduce information asymmetry, firms may
use different ways of signalling (Cho et al., 2015). The inclusion of CS information in
company reports are for instance often intended to persuade stakeholders of the
company’s values and can be seen as attempts to increase the legitimacy of the company
(Lanis & Richardson, 2012). A growing standardization of sustainability reporting can
therefore build up pressure for companies to meet stakeholder expectations and
managing the risks thereof (Cho et al., 2015). Cho et al. (2015) further argue that
greenwashing and other non-credible signals from companies will harm and decrease
their reputational asset values. Porter and Kramer (2006) in turn emphasize that quite
often corporations’ response to sustainability matters is purely cosmetic and relates
almost exclusively to promoting the corporations’ good citizenship-behaviour.
Institutional theory on the other hand would suggest that companies simply mimic each
other, so that if competitors increase their sustainability efforts, the rest of the industry
participants follow suit (Etzion & Ferraro, 2010).
3.5 Shared Value
Kramer and Porter (2011) propose a slightly different view on corporate sustainability,
namely the concept of shared value. They suggest that societal needs in addition to
economic needs, define markets, and that social and environmental harms create
internal costs for firms. Companies need a strong, successful and supportive business
environment, and communities in turn are dependent on successful companies to
provide jobs and wealth creation opportunities.
23
The main argument of shared value is that companies can create economic value by
creating value for society and Kramer and Porter (2011:6) define the concept as:
policies and operating practices that enhance the competitiveness of a company while simultaneously advancing the economic and social conditions in the communities in which it operates.
Shared value can be reached in three distinct ways: through product innovation, by
redefining productivity in the value chain or by enabling supportive cluster development.
New products and services can be provided to all levels of society, and the authors bring
up micro financing as an innovative example of meeting unfulfilled societal needs in
developing countries. Redefining productivity has to do with realising the positive
increases in value from increased efficiency from using less energy, producing less waste,
using less water and other resources, optimizing transportation routes, decreasing costs
of health coverage and lost working days by increasing employee safety and wellness,
and so on. Finally, the authors argue that by enabling the development of local clusters,
logistical efficiencies can be attained, and the clusters can drive collaboration,
innovation, competitiveness and productivity. (Kramer & Porter, 2011)
3.6 The benefits of corporate sustainability
As previously mentioned, approximately 90 percent of both empirical research and
practitioner reports find a non-negative relationship between CSP and CFP, and the
majority of these findings show that firms with better CSP have better CFP (Peloza, 2009;
Friede et al., 2015). Kempf and Osthoff’s (2007) results suggest that a strategy which
involves buying stocks with high CSP and selling stocks with low CSP yields abnormal
returns of up to 8.7 percent per year, and even higher returns are available for investors
who use best-in-class screens. Khan et al. (2016) find that especially firms with a good
CSP performance on their industry-specific materially important issues, outperform
firms with poor performance on these issues.
Hart and Ahuja (1996) find that operating measures also are affected positively by
increased environmental efforts. As one might expect, the authors find that the worst
polluters and companies with the lowest CSP, have the most to improve and can reap the
largest benefits from improving their CSP. Worth noting though, is that the marginal
costs of reducing emissions does not generally exceed the marginal benefits, and this
holds even for firms that have already drastically improved their sustainability efforts by
reducing emissions. The results are not always instant and there is normally a time lag
of 1 or 2 years after initiation until the positive effects can be noticed in the operating and
24
financial performance (Hart & Ahuja, 1996). One reason for this time lag out of several
reasons discussed by the authors, is that investments in employee training and
equipment is often required to increase a firm’s CSP (Hart & Ahuja, 1996)
Peloza (2009) finds that CSP impacts accounting-based metrics positively more often (in
70 percent of cases) than market-based metrics (53 percent). It is worth remarking
however, that a large proportion of empirical findings show a neutral relationship
between CSP and CFP, so that CS neither destroys nor adds value (e.g. McWilliams &
Siegel, 2001).
Some firms may see CS as ‘the right thing to do’, regardless of the economic effects of
altruistic activities. There are many additional arguments to why and how CS can affect
CFP positively however, and these will be the focus of the remainder of this subsection.
3.6.1 Improved efficiency
Increased efficiency is one of the main and most common arguments to the arguments
in favour of the CS business case. Porter and Kramer (2006) argue that the best CS
initiatives have clear, measurable goals, that are tracked over time. This is true especially
for environmental initiatives as these cost-savings are often the most obvious and easy
to calculate (Peloza, 2009). Examples of environmental cost-based approaches that can
lead to direct cost-savings include using less raw material, producing less waste,
conserving energy, reducing the use of costly hazardous materials, using less water, and
so on (Peloza, 2009).
Improved operational results can be obtained by, ceteris paribus, decreasing costs or
increasing sales. Many consumers value CS attributes (Sen, Bhattacharya & Korschun,
2006), so a good CSP may entitle companies to reap price premiums and increased
market shares (Sprinkle & Maines, 2010). CS can therefore be seen as a differentiation
strategy (McWilliams & Siegel, 2001). Sprinkle & Maines (2010) bring up Louis Vuitton
as an example of a company that has been able to use the arguments towards
consumerism in their favour and increase the understanding of how high-quality
products are better for the environment due to that they last longer. Furthermore,
company investments in research and development (R&D) may result in both improved
CS processes and product innovations (McWilliams & Siegel, 2001; Fischer and Sawczyn,
2013). Sen et al. (2006) emphasize that high CSP does not only have company-favouring
effects on some consumers in the form of shared beliefs, loyalty and identification, but
25
that they are also more likely to develop multidimensional relationships with these
companies, e.g. as employees or investors.
A high CSP can be seen as an attractive employer attribute and this can facilitate the
hiring and retention of high-quality employees, thereby lowering hiring costs (Turban &
Greening, 1997; Peloza, 2009). In addition, Edmans (2011) finds that firms with a high
level of employee satisfaction subsequently improve employee productivity, as these
firms outperform both the general market and their industry benchmarks. Many people
seek meaning at work, so staff motivation can have major bottom-line benefits for the
company (Sprinkle & Maines, 2010). Firms with good employee satisfaction also exhibit
more positive earnings surprises and Edmans (2011) interprets these results as a failure
of markets to incorporate intangibles into stock valuations.
3.6.2 Risk reduction
In addition to increased operational performance, increasing the CSP of a firm is thought
to impact company risk. This can be achieved by lowering the probabilities of law suits
and legal fines, as well as by promoting better stakeholder relationships (Sassen, Hinze
& Hardeck, 2016). Lins et al. (2017) find that stakeholder trust in firms, built up through
CS activities, pays off especially in times of financial crisis, as firms with high CSP ratings
outperform firms with low CSP ratings by at least 4 percent in these times. Thus, CS
investments can be seen as a form of insurance policy for times of recession.
Lee and Faff (2009) find that firms with good CSP do not underperform the broad
market, although portfolios of their lagging (firms with poor CSP performance)
counterparts outperform the market. However, the authors find that leading CSP firms
have lower idiosyncratic risk and show that the difference in performance can be
explained by these differences in company-specific risk.
Oikonomou, Brooks and Pavelin (2012) study a panel of US companies and find that
almost all strength components of the examined dimensions of sustainability, although
insignificant, are negatively related also to systematic risk. The authors argue that this is
more relevant than idiosyncratic risk, as systematic risk cannot be eliminated through
diversification. They also find that the controversy components are significantly
positively associated with systematic risk, meaning that firms with bad CSP performance
have higher systematic risk (Oikonomou et al., 2012). These results are validated by
using both conventional and downside risk measures but are found to have neither
positive nor negative impacts on financial utility, measured using a certainty equivalent.
26
Furthermore, Bouslah, Kryzanowski and M’Zali (2013) find that different dimensions of
CS impact risk differently depending on the sample.
Relevant to this study, Sassen et al. (2016) evaluate the link between CSP and risk using
ESG data, for European companies. Their results indicate that a higher CSP decreases
both total and idiosyncratic risk. They do not detect a significant impact from a firm’s
performance on governance issues on risk. Good social performance reduces
idiosyncratic risk, systematic and total risk, whereas strong environmental performance
affects all three measures only in environmentally sensitive industries. (Sassen et al.,
2016)
3.6.3 Access to finance
Goss and Roberts (2011) theorize that if firms with better CSP have lower risk and better
financial performance, then banks will provide them with better terms for their bank
loans. Their results support this hypothesis and show that companies associated with
sustainability controversies pay between 7 and 18 basis points more than firms with
better CSP. Cheng, Ioannou and Serafeim (2014) further hypothesize that enhanced
stakeholder engagement as a result of better CS practices can reduce agency costs and
reduce information asymmetry between managers and stakeholders, as well as increase
transparency, and this way lead to better access to finance. The authors find that firms
with better CSP performance have to deal with significantly lower capital constraints and
show that both the social and the environmental dimensions of CS drive this relationship.
Ghoul, Guedhami, Kwok and Mishra (2011) find that better CSP also results in cheaper
cost of equity, especially for firms with strong employee relations, environmental policies
and product strategies. In contrast, companies that participate in the tobacco and
nuclear power industries tend to pay a higher price for obtaining equity capital (Ghoul et
al., 2011).
These results are in line with those of Chava (2014), who shows that significantly higher
interest rates are imposed on companies that are excluded on environmental screens
compared to firms that are not excluded by such screens. Firms who derive significant
revenue from environmentally beneficial products further receive lower interest rates,
but in general, both the cost of equity and cost of debt are not lower for firms with
environmental strengths (Chava, 2014). Also, obtaining equity capital for controversial
companies can be seen as more difficult and costlier than for others, as Chava (2014)
27
finds that investors demand significantly higher expected returns on these stocks, and
they are also found to have lower institutional ownership.
Finally, the cost of capital is likely to be of great importance for the European sample
studied in this thesis, as the EU is at the forefront of building a financial system that
supports a transition to a low-carbon, resource-efficient and sustainable economy
(European Commission, 2019).
3.7 Measuring the CSP - CFP relationship
Empirical research regarding the CSP–CFP link is affected by a myriad of circumstantial
factors, including firm size, industry, macroeconomic conditions, legal environment and
societal demands (Peloza, 2009). Ideally, all these factors would be controlled for. More
recent papers also suggest that the materiality of sustainability issues should be
incorporated when measuring the CSP–CFP relationship (Eccles et al., 2012; Khan et al.,
2016).
3.7.1 The impact of industry
Overall, industry is found to be an important determinant for differences in the CSP –
CFP relationship (e.g. Peloza, 2009; Khan et al., 2016). Different industries face different
CS challenges: firms in the energy industry are more likely to deal with CS issues such as
pollution and carbon trading, whereas human rights issues are likely to be of importance
in the clothing industry (Peloza, 2009). The industry of a firm affects its environmental
efforts and performance a lot: the top firms in environmental performance rankings tend
to be companies within the computer technology sector, whereas the lowest ranked firms
are often utilities companies (Cordeiro & Tewari, 2015).
Disregarding the importance of industry as a mediating metric, Peloza (2009) finds that
77 percent of CSP research samples does not study any particular sectors of the economy.
Instead, CSP is overwhelmingly studied at a cross-industry level.
3.7.2 The impact of legal origin
Adding to the research to what drives CS, Liang and Renneboog (2017) examine the
impacts of legal origin on CS. Their findings suggest that legal origin is an important
determinant of the level of CSP in a country and that CSP is on average higher in civil law
countries than in common law countries. On average, CSP is the highest in companies
with Scandinavian legal origin.
28
The authors argue that the results are reasonable and consistent with demand-side
arguments to CS and stakeholder theory, as social preferences are embedded in law-
based mechanisms, which are more prevalent in countries with civil law. The common
law tradition is argued to be less stakeholder-oriented. (Liang & Renneboog, 2017)
3.7.3 The impact of financial crises
Volatility conditions of the financial markets play a moderating role in the strength and
nature of the CSP–CFP relationship (Oikonomou et al., 2012). Lins et al. (2017) find a
neutral relationship between CSP and CFP for normal states of the economy. However,
the authors show that companies with high CSP significantly outperform firms with low
CSP during times of financial crises. Based on this, they conclude that CSP is embedded
in the share prices during normal times, but that they matter in periods where trust in
corporations is low.
In line with Lins et al. (2017), Lopatta and Kaspereit (2014) find that from an
institutional theory perspective, it is a positive signal for a firm when its sustainability
performance is maintained or even raised during times of macroeconomic crises. They
theorize that this could be due to less financial constraints than competitors, perhaps
due to that the firm is able to take advantage of changes in the competitive environment,
such as alterations in regulation or changes in consumer preferences toward more
trustworthy firms with more sustainable products and services.
Similarly, Buchanan, Cao and Chen (2018) find that the effect of CSP on CFP depends on
the economic conditions. However, although companies with high CSP on average are
found to have higher firm values (measured by Tobin’s Q), the authors find that they are
hit harder in times of financial crisis, contradicting the results of Lopatta and Kaspereit
(2014) and Lins et al. (2017).
3.7.4 Chicken vs egg? Causality between CSP and CFP
Another debated topic regarding the CSP – CFP link, is the direction of the causality and
potential endogeneity problems. Endogeneity is an unwanted property which implies
correlation between the right-hand-side regressors and the disturbances (Baltagi,
2005:113). If this endogeneity problem is not considered in the estimation procedure,
the parameter estimates may be biased, leading to incorrect inferences (Jo & Harjoto,
2012).
29
To test for the direction of causality, the Granger test may be used. Bouslah et al.
(2013:1270-1271) explain it so that
generally speaking, the variable X is said to Granger cause the variable Y if, given the past values of Y, the past values of X are useful for predicting Y. […] It is possible that Granger causality runs in the opposite direction, i.e., the causation may run from Y to X. It is also possible that Granger causality runs in both directions. In this case, we have Y Granger causes X and X Granger causes Y (bi-directional causality).
When researching the effect of CSP on CFP, endogeneity can occur if CFP in fact is the
determinant of CSP (Suto & Takehara, 2016). In other words, there is the possibility that
firms that perform financially well have the resources necessary to invest in CS matters
so that firms ‘do good by doing well’ (Waddock & Graves, 1997). This view is sometimes
referred to as the slack resources theory (Waddock & Graves, 1997). For instance,
Fischer and Sawczyn (2013) find support for this theory and Barnea and Rubin (2010)
find that firms with higher leverage ratios have a lower likelihood of being classified as
sustainable, which is in line with this view: overinvesting in CS is more difficult when
there is less cash available (Jensen, 1986). Dorfleitner et al. (2015) in turn find that larger
firms are more likely to have high ESG scores, perhaps indicating that larger firms invest
in CS once they have fewer other investment opportunities available. Finally, Peloza
(2009) interprets the result that accounting-based measures tend to show a larger
correlation between CSP and financial performance than market-based measures, as
support for the slack resources theory.
The opposing view, that CSP has a positive impact on CFP and that investments in CSP
are a sign of good management practices, is sometimes called the good management
theory (Waddock & Graves, 1997). Thus, firms can ‘do well by doing good’ and good
management theory is therefore closely related to the theories and economic reasonings
in support of the business case for CS, as discussed in sections 3.2-3.6. For instance, Jo
and Harjoto (2012) find support for the good management theory and Adegbite, Guney,
Kwabi, and Tahir (2019) find that CSP has a significant impact on CFP for non-financial
firms. They also find results that point to that firms adjust their CS commitments
periodically, in order to reach their target CSP.
A third hypothesis regarding the causal relationship of CSP and CFP is that of
simultaneity (bi-directional causality). In this case CSP is both the predictor and the
consequence of financial performance, in what Waddock & Graves (1997) call a virtuous
circle. The results by Waddock and Graves (1997), as well as by Schreck (2011), support
the view of a virtuous cycle so that CSP depends on CFP, but CFP also depends on CSP.
30
Bouslah et al. (2013) and Halbritter and Dorfleitner (2015) find support for all three
theories depending on the sustainability dimension, time and sample being examined,
and they identify both a virtuous cycle and unidirectional causality in both directions.
Similarly, Tuppura, Arminen, Pätäri and Jantunen (2016) find evidence of bi-directional
causality for some industries but not for others. In addition, they find that there are
differences in the causal relationship depending on the CFP measures used.
3.8 Summary of the theories regarding the link between CSP and CFP
This chapter has covered the main theories regarding the possible link between CSP and
CFP. The value maximization theory argues that the sole purpose of a business is to
create wealth to its shareholders – any managerial decisions to increase the welfare of
society or the environment beyond what is required by the law would, based on the value
maximization theory, destroy shareholder value.
Although the two theories do not necessarily contradict each other, the stakeholder
theory is often referred to as the main opponent of the value maximization theory.
Stakeholder theory has to do with managing all the stakeholders of a firm and balancing
their demands. The resource-based view and legitimacy theory were also introduced and
are closely related to stakeholder theory. The final theoretical framework that was
presented was the shared value theory, which suggests that firms should do well by doing
good. Namely, several benefits have been argued to stem out of high CSP: improved
efficiency, reduced risk and better access to finance.
Finally, three theories regarding the causal relationship between sustainability and CFP
were introduced: the slack resources theory, the good management theory and the
virtuous cycle.
All the main theories presented in this chapter are summarized in table 1.

31
Table 1 Summary of the theories regarding the CSP–CFP link
Theories for and against the CS business case Main arguments
Value maximization The sole purpose of business is to increase the wealth of shareholders. Sustainability efforts beyond the requirements of the law can therefore be argued to destroy value.
Stakeholder theory Managing and improving stakeholder relationships is good management practice.
Resource-based view CSP is seen as an important resource which in return can provide the company with sustainable competitive advantages
Legitimacy Firms that display values that are congruent with the norms of society in general are seen as more trustworthy and transparent, ensuring long-term stakeholder relationships and the longevity of the firm's cash flows
Shared value Companies can create economic value by creating value for society
Theories regarding the causal relationship between CSP and CFP
Slack resources Do good by doing well
Good management Do well by doing good
Virtuous cycle CSP is both the predictor and the consequence of financial performance
32
4 PREVIOUS STUDIES
Although some studies show a negative CSP-CFP relationship (e.g. Brammer, Brooks &
Pavelin, 2006; Renneboog, Ter Horst & Zhang, 2008; Auer & Schuhmacher, 2016),
Friede et al. (2015) find that about 90 percent of research studying the CSP-CFP link find
a non-negative relationship, with the majority of studies reporting positive results (e.g.
Hart & Ahuja, 1996; Derwall et al., 2005; Kempf & Osthoff, 2007; Edmans, 2011; Khan,
Serafeim & Yoon 2016). These results are in line with those of Peloza (2009), who finds
that 59 percent of the academic literature finds a positive relationship, and that 14
percent of studies report a negative relationship. Halbritter and Serafeim (2015) argue
that the results depend largely on the time period studied, the provider of sustainability
data and the company sample. The results in the academic research literature are
somewhat more negative than the practitioner reports, as 77 percent of the practitioners’
results indicate a positive relationship (Peloza, 2009).
Waddock and Graves (1997), Galema, Plantinga and Scholtens (2008) and Mǎnescu
(2011) all acknowledge the multidimensional aspects of sustainability and have
conducted studies that analyse the CSP–CFP relationship on a deeper level than just
simply using the scores for the environmental, social and governance aspects of firms.
Several other studies are also discussed in section 4.4.
4.1 Waddock, S.A. and Graves, S.B., 1997. The corporate social performance–financial performance link
Waddock and Graves (1997) address two main issues: the sign of the CSP–CFP
relationship and the causal direction of the relationship. The authors hypothesize that
there is a simultaneous direction of causality and that CSP is both a predictor and an
outcome of CFP.
4.1.1 Data & Method
Studying 469 companies, the authors use an aggregated CSP measure based on eight
sustainability dimensions (community relations, employee relations, product
characteristics, environmental impacts, treatment of women and minorities, military
contracting, participation in nuclear power, and activities in South Africa). The CSP data
are gathered from the KLD database for firms that are included in the Standard and
Poor’s 500 (S&P 500) index. The authors use sustainability data for 1990 and financial
performance data from COMPUSTAT for 1989 and 1991, depending on whether CSP or
CFP is used as the dependent variable, so that the independent variables are a lag of the
33
dependent variable. Three accounting-based variables are used to measure CFP: return
on assets (ROA), return on equity (ROE) and return on sales (ROS). Size (measured as
total assets, total sales and number of employees), risk (measured as long-term debt to
total assets) and industry dummies are used as control variables.
4.1.2 Main findings
The authors confirm the hypothesis that CFP both impacts CSP and depends on it
simultaneously, i.e. that there is causality in both directions, in what the authors call a
virtuous cycle. The sign of the relationship is positive in both causal directions. Based on
their findings, Waddock and Graves (1997) draw the conclusion that good CSP is an
indication of good management.
4.1.3 Relevancy for this study
The study by Waddock and Graves (1997) links to my study in two important ways. First
of all, it provides evidence of a (positive) relationship between CSP and operational
performance measures. Second of all, the results indicate that CSP is not only a result of
previous financial performance, but that CSP actually affects the future operational
performance of companies.
4.2 Galema, R., Plantinga, A. and Scholtens, B., 2008. The stocks at stake: Return and risk in socially responsible investment
Galema et al. (2008) investigate the relationship between SRI and stock returns but
argue that the trade-off between CSP and CFP is captured at least partly by the book-to-
market ratio. The authors also point out the problem with aggregate measures for CSP,
as different dimensions of responsibility may have a different impact on CFP.
4.2.1 Data & Method
Sustainability data are obtained from the KLD database, whereas return and accounting
data for monthly returns, market values, company age, R&D expenditures, net sales,
book equity, shares outstanding and net income, are obtained from Datastream. Book-
to-market regressions using yearly observations cover the time period 1991 to 2004 for
all (U.S.) stocks covered by KLD, whereas regressions using monthly data cover June
1992 to July 2006.
Apart from pooled book-to-market regressions, the authors form portfolios based on
the sustainability scores and assess their performance using the Carhart four-factor
model, and they also perform cross-sectional regressions with the six sustainability

34
factors (community, corporate governance, diversity, environment, employee relations
and product) and control variables such as age, explaining the variation in excess returns.
4.2.2 Main findings
The main findings of Galema et al. (2008) are that diversity, product and environment
significantly lower the book-to-market ratios, whereas governance has a positive effect.
Interestingly though, when environment concerns and strengths are treated separately,
they both have a positive impact on the book-to-market ratios. Community and employee
relations have a neutral effect in the main analysis. Employee relations yield significantly
positive excess returns in the robustness checks however.
4.2.3 Relevancy for this study
The study by Galema et al. (2008) is an example of a study showing that different
dimensions of CS affect CFP differently and the authors hypothesize that the
discrepancies in results of previous research could be due to that aggregate scores
eliminate the relationship if underlying factors have opposite effects on CFP. This study
also uses lagged CSP variables.
4.3 Mǎnescu, C., 2011. Stock returns in relation to environmental, social and governance performance: Mispricing or compensation for risk?
Mǎnescu (2011) sets out to determine the trade-off between stock returns and ESG scores
(as well as seven ESG factors: community relations, corporate governance, diversity,
employee relations, environment, human rights, and product safety), and analyse
whether firms with high ESG scores earn abnormal returns (positive or negative) due to
mispricing by the market or as a compensation for risk. The author theorises that a no
effect scenario where there are no significant differences in the risk-adjusted returns of
high ESG firms and low ESG firms, would be in line with the efficient market hypothesis
(EMH). In the case that a firm’s cash flows are affected by sustainability information, but
that this effect is not reflected in the stock price, it would be a mispricing scenario.
Mǎnescu also discusses the possibility of a risk-factor scenario, where higher returns for
firms with lower ESG scores could be explained by a risk premium for non-sustainability
risk.
4.3.1 Data & Method
The author uses the KLD database for the sustainability information, for U.S. firms
included on either the S&P 500 or the Domini Social 400 index (DS400) during 1991 -
35
2008. The final dataset includes between 10 174 and 10 220 firm-year observations. The
financial data are obtained from Datastream.
The Fama-French three-factor model with the momentum factor added (i.e. the Carhart
four-factor model), extended with the aggregate ESG score or the seven ESG factors and
industry dummies, is the main estimation model used. Tests to determine whether
abnormal returns can be explained by mispricing or compensation for risk were also
made, using a low sustainability minus high sustainability (LMH) -risk factor.
4.3.2 Main findings
Mǎnescu (2011) finds that community relations had a positive impact on stock returns
and concludes that this is due to mispricing. Employee relations also had a positive effect
until 2003 but changed so that it had a negative effect between 2003-2008. The author
finds weak evidence that the change from a positive to a negative relationship was due to
compensation for risk. Human rights and product safety on the other hand, had a
negative relationship with stock returns and this was found to be due to mispricing.
4.3.3 Relevancy for this study
Mǎnescu’s (2011) results highlight that the CSP – CFP relationship changes over time as
a result of changes in society. The author also brings forward the notion that CSP affects
the risk of a company.
4.4 Other previous findings
Using a small sample of firms within the paper industry, Bragdon & Marlin (1972) find
that decreasing pollution is likely to increase financial performance, which is measured
as ROE, earnings per share and return on capital (ROC).
Using KLD data for the S&P 500 during 1997-2002, Van der Laan et al. (2008) study the
CSP – CFP relationship using decomposed measures of CSP, and ROA as well as earnings
per share (EPS), as measures of CFP. They find significant results indicating that the
controversies regarding sustainability dimensions relating to primary stakeholders:
employees, consumers and investors, affect CFP negatively, whereas strong investor
relations impact positively on CFP. Both positive and controversial actions on the
environmental dimension impact CFP negatively. The paper also finds strong support
for prospect decision theory, so that controversial CSP is evaluated differently than
positive CSP due to the asymmetry between how people tend to experience and assess

36
losses and gains. More specifically, the authors find that controversial corporate actions
have a negative impact on operating performance, whereas positive sustainability actions
tend to have a more neutral impact on CFP. This study does not control for differences
in industry however, which Cordeiro and Tewari (2015) argue is of great importance,
especially in regard to environmental aspects.
Adegbite et al. (2019), who study a panel of UK firms during the period 2002-2015 using
ROA, ROE and share price performance as measures for CFP, find that the CSP of non-
financial firms significantly impacts CFP. This relationship is found to be more apparent
during the years following the financial crisis. Adegbite et al. (2019) and Barnett and
Salomon (2006) also find a non-linear relationship between CSP and CFP and show that
firms with medium CFP are most likely to engage in CS commitments. Halbritter and
Dorfleitner (2015) in turn find, using the Carhart four factor model, that the
outperformance of high CSP firms has declined over the last years.
Finally, Cavaco and Crifo (2009), who study the complementarity between
environmental, social and governance practices, find that customer- and supplier-
relations have a positive relationship to Tobin’s Q, whereas other dimensions indicate a
neutral relationship between CSP and CFP. They also find that interaction variables,
which look at different sustainability dimensions together, may act as complements or
substitutes, depending on which CS dimensions that are combined.
4.5 Summary of the previous literature
Table 2 summarizes the results of the previous studies discussed here. Albeit the majority
of results from previous studies show a positive CSP–CFP link, the results are somewhat
inconclusive and provide only little guidance to what to expect from the results of this
study.

37
Table 2 Summary of previous research
Author(s)
Bragdon &
Marlin (1972)
Waddock & Graves
(1997)
Galema et al. (2008)
Van der Laan et al.
(2008)
Cavaco & Crifo (2009)
Mǎnescu (2011)
Adegbite et al.
(2019)
Dependent variable(s)
5YAvg. ROE,
5YAvg. ROC, EPS
ROA, ROE, ROS
Stock returns, B/M
ROA, EPS Tobin's
Q Stock returns
ROA, ROE, stock
returns
Aggregate CSP - Positive - Neutr. /
Contr. (-) Neutral Positive
Corporate governance/investor - - Positive Positive Neutral Neutral -
Employee relations - - Neutr. / pos. Controv. (-) - Pos. / Neg. -
Product safety & Consumer relations - - Negative Controv. (-) Positive Negative -
Community - - Neutral Neutral - Positive -
Diversity - - Negative Neutral - Neutral -
Environment Positive - Neg. / pos. Negative Neutral Neutral -
Human rights - - - Neutral Neutral Neutr. / Neg. -
Lagged CSP? NO YES YES NO NO YES YES
Causality theory - Virtuous
cycle Good
management - -
Good management
Virtuous cycle + non-
linearity

38
5 DATA
The screening process used to select the companies to be included in the study was
conducted using Thomson Reuters Eikon. Screening for public companies listed on a
European exchange with data for at least one of the last 17 years on each of the social,
environmental and governance pillars (assuming that these scores are calculated only
when there is sufficient data for a specific company), and excluding the financial sector,
yielded 881 companies. As all firms meeting this criterion are included, the risk of
survivorship bias in the data is reduced. Further excluding companies that are not
headquartered in countries that are members of the European Union (EU) or the
European Free Trade Association (EFTA), reduces the number to 836 companies. As lags
are used in the main regression models, a minimum of 2 consecutive observations per
company is required in practice, reducing the number of companies to 776 for these
models. Summary statistics will therefore be shown only for those companies that are
included in the main models.
There are 9,105 firm-year observations, implying that there are approximately 11.7 firm-
year observations per company. The division of observations over the sample period are
illustrated in Figure 2. The coverage of the Eikon database has increased since the
beginning of the century, which can be seen in the figure. The small number of
observations for 2018 is due to that the data was collected in the beginning of 2019 before
all company information had been published for 2018.
Figure 2 Number of observations per year
250 256
390
477 491529
553579
604633 647 662
685
743 762737
107
0
100
200
300
400
500
600
700
800
900
2002 2003 2004 2005 2006 2007 2008 2009 2010 2011 2012 2013 2014 2015 2016 2017 2018

39
The included companies represent nine economic sectors based on the Thomson Reuters
Business Classification (TRBC) system: basic materials, consumer cyclicals, consumer
non-cyclicals, energy, healthcare, industrials, technology, telecommunications services
and utilities. I choose the TRBC system to divide the companies into sectors for
consistency with the CSP data which are also retrieved from Eikon. The companies are
headquartered in a total of 22 different European countries. The allocation between
countries and economic sectors are illustrated in Table 3. As can be seen, there are a lot
of companies from the United Kingdom included in the sample, with the industrials
sector being the most occurring sector.
Table 3 Allocation between sectors and countries
5.1 CSP data
CSP data was gathered using the Thomson Reuters Eikon (henceforth Eikon) database,
which has an extensive data quantity covering over 7,000 public companies worldwide,
with time series data from 2002 onwards (Dorfleitner et al., 2015; Thomson Reuters,
CountryBasic
Materials
Consumer
Cyclicals
Consumer
Non-
Cyclicals
Energy Healthcare Industrials TechnologyTelecom.
ServicesUtilities
Number of
companies
Austria 4 1 4 1 1 1 12
Belgium 3 1 3 1 4 4 1 3 1 21
Cyprus 1 1 2
Czech Republic 1 1 2
Denmark 1 2 2 1 7 7 1 1 22
Finland 6 4 2 1 1 6 2 2 1 25
France 4 24 6 6 5 23 7 3 3 81
Germany 17 20 4 2 9 18 6 4 5 85
Greece 1 3 1 2 1 1 1 10
Hungary 1 1 1 3
Ireland 4 3 4 1 1 2 15
Italy 1 10 2 4 1 4 1 2 7 32
Luxembourg 2 2 1 1 2 8
Malta 1 1
Netherlands 5 3 4 5 1 7 4 3 32
Norway 2 1 2 7 2 1 15
Poland 2 3 1 4 2 1 1 4 18
Portugal 2 2 1 2 1 8
Spain 2 5 2 4 3 8 2 2 6 34
Sweden 8 11 3 1 4 20 4 2 53
Switzerland 6 6 7 1 8 13 7 2 1 51
United Kingdom 27 70 21 14 15 70 16 5 8 246
Total (number
of companies)98 169 66 59 60 192 53 38 41 776

40
2019). To ensure the best possible quality of the data, both algorithmic and human
processes are used to gather data for more than 400 data points from annual reports,
company and NGO websites, stock exchange filings, CSR reports and various news
sources (Thomson Reuters, 2019). This form of content analysis suggests that the data
are relatively objective and that they in theory can be seen as available to the general
public. Eikon select the 178 most relevant variables and group them into 10 sustainability
dimensions (environmental innovation, emissions, resource use, workforce, human
rights, community, product responsibility, management, shareholders and CSR
strategy), which are then used to calculate the three pillar scores (environmental, social
and governance) as well as the aggregated ESG score (Thomson Reuters, 2019). This
structure of the data is illustrated in Figure 3. The Eikon database is continuously
updated, but company-reported sustainability information is in general updated once a
year, in line with company reporting.
Figure 3 ESG Building blocks
As previously discoursed, there are several problems related to aggregated CSP scores. If
there are systematic errors in the methods used to evaluate corporate sustainability, the
reported inferences of research which is based on these scores may be invalid (Chatterji
et al., 2016). Eikon does not report on how the 178 most relevant data points are selected
and how they are weighted within the different sustainability dimensions, nor do they
show how industry aspects are considered. To gain an in-depth view of which
sustainability performance indicators available to the public that actually have a material
impact on the operational and risk performance measures, and to ensure the
transparency of the methodology, I conduct a principal component analysis (PCA). A
PCA makes a more detailed analysis of the CSP–CFP relationship possible, as the
ESG
Environmental Pillar Social Pillar Governance Pillar
Environmental Innovation Score Workforce Score Management Score
- 37 variables - 64 variables - 64 variables
Emissions Score Human Rights Score Shareholders Score
- 47 variables - 14 variables - 48 variables
Resource Use Score Community Score CSR Strategy Score
- 29 variables - 37 variables - 10 variables
Product Responsibility Score
- 54 variables
41
variables can be grouped into themes. However, there are several potential drawbacks
using this methodology, such as subjective decision-making, exclusion of variables,
dealing with missing values, and so on. To ensure the quality and robustness of the
process and to maintain comparability to previous research, all regressions using the
PCA factors will also be run using Eikon’s readily available sustainability dimension
scores. The results from these regressions can be found in the appendices (appendix 7)
and will not be dealt with separately.
5.1.1 Principal component analysis
Principal component analysis (PCA) is a multivariate statistical method to extract
important information from a set of variables and to compress the data set by grouping
inter-correlated variables into a new set of linearly combined orthogonal variables called
principal components (Abdi & Williams, 2010). It is assumed that the high inter-
correlations mean that the components represent some common underlying factor.
These factors can be used in subsequent analyses (DiStefano, Zhu & Mîndrilă, 2009).
The main purpose of the PCA for this study is therefore to group the raw data points
provided by Eikon into factors that can be used as proxies for companies’ sustainability
performance, using only data that (in theory) is publicly available, as opposed to relying
on readily calculated scores.
5.1.1.1 Variable requirements
The PCA conducted for this thesis is a kind of exploratory factor analysis, where a
statistical software, in this case SPSS, is used to suggest the principal components based
on the variables’ correlation matrix. The variables that are included in the PCA are to be
of the same scale to increase comparability (Li & Wang, 2014), and they should be
positively coded, meaning that higher values indicate higher agreement (SPSS, 2018).
Thus, I include only positively coded binary variables (i.e. variables that assume 1 if true,
and 0 otherwise) in the analysis. Although this exclusion of continuous and other discrete
variables could be seen as a limitation of the methodology used, the vast majority of the
underlying information is covered to some extent by the dummy variables; for instance,
Eikon provides data points regarding tonnes of waste produced by companies, but the
dummy variables cover issues regarding companies’ waste management, waste reduction
policies and targets, etc. Furthermore, only including binary variables increases the
interpretability of the results when the combined components are used in the subsequent
regression analyses.

42
Variables used to determine if a company is a sin stock or not are also excluded, since the
industry sector in which the companies are active is dealt with separately. Instead, a
control for sin companies is included as a robustness check of the main models (see
section 7.13).
5.1.1.2 Dealing with missing values
Several of the data points had a large amount of missing values. This issue was dealt with
using a two-step procedure. First, variables that have fewer observations than 75 percent
of the maximum number of possible observations were omitted. The maximum number
of possible observations is defined as the number of available firm-year observations
obtained for ESG data from the Eikon database (9105 observations). The 75 percent cut-
off rate was selected on the basis that as many data points as possible would be included,
without reducing the number of firm-year observations too much4. This resulted in a
total of 158 included variables in the PCA (compared to 178 variables used by Eikon for
the readily available dimension scores). Second, for those variables that did not have the
maximum number of possible observations (a total of 8 variables, which on average had
11.9 % missing values), missing values were imputed in two steps. In the first step, if a
missing value for a company had the same observation both in the prior and subsequent
years, i.e. the observation for period t-1 is equal to the observation for period t+1, then
this value was set for the missing value at time t for the company. To illustrate with an
example: if the dummy variable observation for company i is 1 in 2015 and 2017, but the
value is missing in 2016, then the value for 2016 is set to 1.
After this, a second round of imputations is made, so that if a company has observations
for more than 50 % of the included time periods and the company is not “dead” (i.e. there
are observations for the same company in the same time period for other variables), then
the missing values are replaced with the mode of the existing observations, i.e. the
variable’s most occurring value for the company in question. Mode imputation is
typically used for categorical data, such as binary data, instead of mean imputation,
which is normally used for continuous data (Chen & Åstebro, 2003). If there are equally
many observations with the value 0 and 1, then the missing value is replaced with 1. The
4 It can be noted here that the majority of the available dummy variables with below 75 percent of the maximum number of observations, were significantly below the cut-off rate (only 6 of the excluded variables had more than 70 percent of the maximum number of observations). Furthermore, to maintain the objectivity when making decisions regarding the appropriate cut-off rate, the variable-names were coded in a way so that the variables could not be identified, thus eliminating the author’s personal views on which data points that should be included or not.
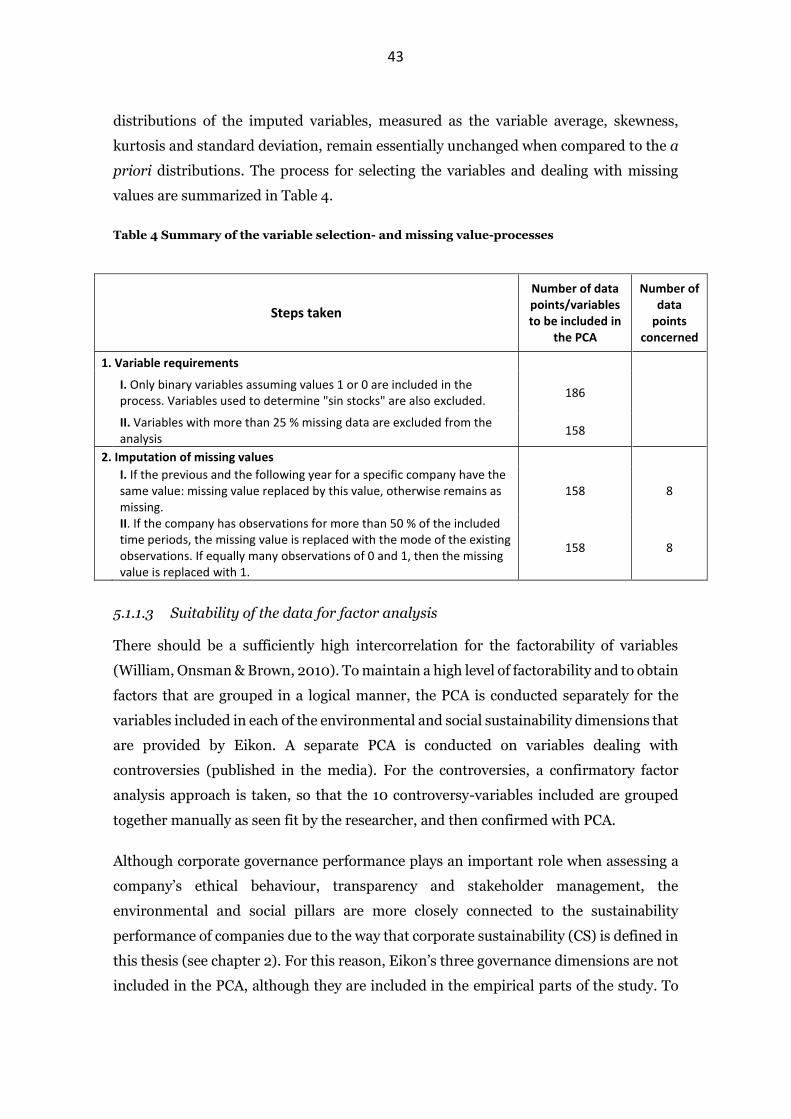
43
distributions of the imputed variables, measured as the variable average, skewness,
kurtosis and standard deviation, remain essentially unchanged when compared to the a
priori distributions. The process for selecting the variables and dealing with missing
values are summarized in Table 4.
Table 4 Summary of the variable selection- and missing value-processes
Steps taken
Number of data points/variables to be included in
the PCA
Number of data
points concerned
1. Variable requirements
I. Only binary variables assuming values 1 or 0 are included in the process. Variables used to determine "sin stocks" are also excluded.
186
II. Variables with more than 25 % missing data are excluded from the analysis
158
2. Imputation of missing values
I. If the previous and the following year for a specific company have the same value: missing value replaced by this value, otherwise remains as missing.
158 8
II. If the company has observations for more than 50 % of the included time periods, the missing value is replaced with the mode of the existing observations. If equally many observations of 0 and 1, then the missing value is replaced with 1.
158 8
5.1.1.3 Suitability of the data for factor analysis
There should be a sufficiently high intercorrelation for the factorability of variables
(William, Onsman & Brown, 2010). To maintain a high level of factorability and to obtain
factors that are grouped in a logical manner, the PCA is conducted separately for the
variables included in each of the environmental and social sustainability dimensions that
are provided by Eikon. A separate PCA is conducted on variables dealing with
controversies (published in the media). For the controversies, a confirmatory factor
analysis approach is taken, so that the 10 controversy-variables included are grouped
together manually as seen fit by the researcher, and then confirmed with PCA.
Although corporate governance performance plays an important role when assessing a
company’s ethical behaviour, transparency and stakeholder management, the
environmental and social pillars are more closely connected to the sustainability
performance of companies due to the way that corporate sustainability (CS) is defined in
this thesis (see chapter 2). For this reason, Eikon’s three governance dimensions are not
included in the PCA, although they are included in the empirical parts of the study. To
44
be consistent however, the variables relating to governance controversies are combined
into a governance controversy score and the remaining variables for each governance
dimension are treated as if they were grouped together using PCA. They are therefore
dealt with in the same manner as the social and environmental factors in every other
way.
For each social and environmental dimension, two tests were used to determine whether
the variables are suitable for factor analysis, namely the Kaiser-Meyer-Olkin (KMO)
measure of sampling adequacy and Bartlett's test of sphericity. The KMO statistic, which
is a measure that shows the proportion of variance that might be common variance,
ranges between 0 and 1 (IBM, n.a.). Values above 0.5 are generally considered to indicate
that the variables are suitable for factor analysis (Williams et al., 2010). Since all KMO
statistics obtained were above this limit (ranging between 0.61 and 0.88 with an average
of 0.80), the data was deemed to be appropriate for PCA.
Bartlett’s test of sphericity is a test of the null hypothesis that the correlation matrix is
an identity matrix, i.e. that the variables included are uncorrelated and thus not suited
for factor analysis. Thus, to reject this null a statistically significant estimate should be
obtained for factor analysis to be suitable. All values for the Bartlett’s test of sphericity
were significant at least at the 0.01 percent level.
5.1.1.4 PCA extraction rules and criteria
To make the most use of the data when conducting the PCA, missing values in the
analysis are dealt with by excluding cases pairwise so that all available cases are used,
opposed to a listwise deletion procedure which requires a full set of data (Zuccolotto,
2012).
A Varimax rotation method (developed by Kaiser, 1958) is used to find the linear
combination of original factors which maximize the variance of the loadings (Abdi,
2003). This generally results in that the original variables are associated with a small
number of factors (ideally only one so that there are no cross-loadings whatsoever),
which makes interpretation easier (Abdi, 2003).
According to Thomson and Daniel (1996) it is often desirable and appropriate to use
several decision rules when determining the number of factors to extract. A commonly
used decision rule is the Kaiser-Guttman criteria, where factors with eigenvalues larger
than 1 are retained as these factors include more information than any of the original

45
variables alone (Jackson, 1993). However, Jackson (1993) finds that this method leads
to the retention of too many components, which is confirmed by Costello and Osborne
(2005), who state that it is among the least accurate methods for selecting the number
of components to retain. A more stringent rule requiring eigenvalues, i.e. the total
variance explained by a component, to be larger than 1.3 was therefore used. The
appropriate number of obtained factors was then confirmed using scree plot analysis,
which is another commonly used stopping rule in PCA (Jackson, 1993). Scree plot
analysis is according to Costello and Osborne (2005) the best choice of method due to its
usability. This method involves plotting the eigenvalues and determining the number of
components to use based on where the largest eigenvalues depart from the line of smaller
eigenvalues, which represent random variation (Jackson, 1993). The number of data
points above the point in the data where the curve flattens out, are seen as the
interpretable components (Jackson, 1993; Costello & Osborne, 2005). For the variables
in Eikon’s product responsibility dimension, an eigenvalue-requirement of at least 1.1
was found to be more suitable based on the scree plot analysis.
5.1.1.5 Interpreting the results of the PCA
To combine the variables into components as suggested by the PCA, a non-refined
method of summing the variable observations is used. This method preserves the
variation in the original data (DiStefano et al., 2009) and makes interpretation of the
subsequent regression results easier. A disadvantage of the method however, is that all
factors are given equal weight, despite the size of the factor loading suggested by the PCA
(DiStefano et al., 2009). As already discussed for instance in section 2.5.1.3 of this paper,
it is practically impossible to estimate lasting optimal weights when sustainability
information is aggregated, and thus assigning equal weights to all variables is in this
paper viewed as the best option among bad alternatives.
Two alternative methods for obtaining the factor scores and combining the variables into
components were also considered for robustness. The first (1) alternative considered is
to normalize the factors, so that the summed factor scores are divided by the number of
variables included in the variable. When these normalized factors are used in the main
regressions of this study, only the regression coefficients vary in size (the R-squared
values, t-statistics, and p-values are identical); the coefficient estimates of the
normalized factors can be calculated by multiplying the regression coefficients obtained
by using the summed scores with the number of variables included in the factor. Thus,
the only implication of using this method as opposed to the summed scores, is that the

46
way the results are interpreted is slightly different. The second (2) option considered is
to use a refined method using a regression method (where the inverse of the variable
correlation matrix is multiplied by the matrix of factor loadings) to aggregate the
variables based on the factor loadings suggested by the PCA (DiStefano et al., 2009). The
factor scores obtained using this approach are highly correlated with the non-refined
method using the summed scores, which is the chosen method for this study: for the
environmental and social factor scores 12 out of 15 factors have a correlation that exceeds
0.9, with a correlation range between 0.73 and 0.99. Consequently, when these factors
are tested for robustness in the main regressions of the study, the results are highly
similar to the results of regressions using the summed scores. Finally, as the method of
using summed scores provides factors that are easier to interpret and because non-
refined factor scores in general can be seen as less dependent on the sample used than
refined methods (DiStefano et al., 2009), it is the method of choice for this study.
The largest observed “cross-loading”, i.e. where factor loading values are high for more
than one component, was 0.41. Any cross-loadings were dealt with so that they were
included only in the component for which they had the highest loading value. As no lower
cut-off values are used for factor loading values either, each original variable selected for
the analysis is included in exactly one component.
After conducting the PCA, two environmental components obtained from Eikon’s
Resource use and Emissions dimensions, and the governance dimension CSR strategy,
were highly correlated. As the variables included in these three dimensions covered
relatively similar issues, a PCA using all these three dimensions instead of combining the
variables in each dimension separately, was conducted to combine them into 2
components. Thus, one of the three governance factors (containing only 4 usable CSR
strategy variables) was combined with the environmental factors. Including the
controversy- and governance- components, a total of 21 factors were obtained: 6
environmental factors, 9 social factors, 4 controversy factors and the 2 governance
factors. All variables included in the analysis and their division into components are
presented in Appendices 1 – 4. The factors will briefly be presented next.
5.1.2 Environmental factors
Corporate sustainability was previously in this thesis defined as a firm’s use of resources
in an ethical manner, which promotes equal opportunity and poverty reduction without
being harmful to the environment or the communities in which a firm operates, and
47
which does not compromise the use of any resources for generations to come. To
measure companies’ performance on environmental aspects, six factors were extracted
using the PCA: environmental impact reduction, resource efficiency, environmental
management, environmental products, ecologically sourced products and green
initiatives. Environmental impact reduction consists of 20 variables and has to do with
the environmental impacts of the company in general, its sustainability strategy, its
policies to reduce the negative effects of the corporate activities on the environment e.g.
by reducing emissions, recycling and setting requirements on suppliers and (sourcing)
partners. The resource efficiency factor is a measure of whether the company in question
has set targets or objectives to be achieved on water efficiency, energy efficiency and
resource efficiency in general. Environmental management is a factor that has to do
closely with the managerial choices that can help improve the firm’s environmental
performance, such as emissions trading, proactive environmental investments and
company-generated initiatives to restore the environment. The environmental products
factor indicates if a company sells products or services that are designed to have positive
effects on the environment when used. Ecologically sourced products on the other hand
measures whether the products and services that a company sells are ecologically
sourced or not, and the factors involves three variables concerning organic products,
labelled wood and forest products, as well as initiatives to reduce animal testing. The
green initiatives factor includes 5 variables and covers the existence of policies and
targets to reduce waste, emissions and toxic chemicals e.g. through the use of
environmentally friendly green sites or offices.
5.1.3 Social factors
The four social dimensions provided by Eikon were divided into 9 social factors that will
be used in this study: employee career opportunities, health & safety management,
workforce, human rights, business ethics, emerging market development, (socially)
responsible products, management systems & certifications, and consumer relations.
The first three factors are closely related with the well-being of a company’s workforce,
while the last three factors have to do with the company-consumer relationship. These
factors are used to measure the ethical aspects of the business activities and the impacts
on the people and communities that are affected by the company’s actions. Employee
career opportunities is the summed score of variables dealing with the skills training and
career development opportunities for a company’s employees. The health & safety factor
has to do with the health and safety of a company’s employees and its suppliers. The
workforce factor can be seen as a general measure of the well-being of a company’s entire
48
workforce. The human rights factor is essentially the same as the Eikon human rights
dimension as only one factor was obtained from the PCA and includes variables that have
to do with respecting human rights in general, avoiding child and forced labour and
ensuring the freedom of association of employees. Business ethics covers topics such as
bribery, corruption, corporate citizenship and being a fair competitor. Emerging market
development only includes two variables and is not used in all of the subsequent
regressions. It has to do with selling products or services at a discount to normal retail
prices in emerging markets, as well as the research and development of drugs against
diseases in the developing world. A high score on the responsible products factor implies
that the company monitors the social impacts of its business activities and that the
offered product line is beneficial to the health and safety of its consumers. The
management systems & certifications factor includes three variables that have to do with
management systems, certifications and other principles that can ensure the quality of
the company’s products and management capabilities. Finally, the consumer relations
factor has to do with ensuring the well-being of a company’s customers.
5.1.4 Governance factors
As mentioned, the three governance dimensions provided by Eikon (management,
shareholder and CSR strategy) were initially not included in the PCA, but to be consistent
each dimension was treated as if it were; the requirements for the variables to be included
in the analysis are the same and the dummy variable observations are summed in a
similar fashion as for the PCA factors. As the CSR strategy factor which included only
four variables, ended up being highly correlated with a couple of the environmental
factors, these were combined in a second round PCA, thus reducing the number of
governance factors by one. The CSR strategy are all included in the environmental
impact reduction factor.
The management factor deals with issues such as the composition, functions,
compensation and experience of the company’s board and executives while the
shareholder factor includes matters that have to do with the fair treatment of the
company’s shareholders.
5.1.5 Controversy factors
The four controversy factors obtained through the confirmatory factor analysis are
controversies published in the media with regards to consumer relations, business ethics,
environmental & social issues and corporate governance. These factors are summed
49
similarly to the other factors, and therefore a higher controversy score is an unwanted
property from a sustainability point of view.
Consumer controversies covers controversies linked to consumer dissatisfaction and
issues with the quality and/or responsibility of a company’s products and services. A
company with a score above zero on the business ethics controversy factor has been
linked to anti-competitive behaviour and/or to bribery, corruption, tax fraud, money
laundering, parallel imports, political contributions or improper lobbying. If a company
has been under the spotlight of the media due to concerns relating to the company’s
impact on the environment or on local communities, or if the company is linked to
human rights infringements or disputes relating to wages or working conditions of the
company, these are captured by the variables included in the environmental & social
controversies factor. Lastly, the governance controversies factor has to do with non-
transparent accounting, share price manipulations and controversies linked to high
board or executive compensation.
5.2 Financial data
Financial data are gathered using Thomson Reuters Datastream, and is complemented
with data from Eikon and Orbis (in respective order of prioritization in case of differing
values between them). Annual data are deemed appropriate and have been used also in
previous studies with similar methods, lag structures and variable compositions as in
this thesis (e.g. Waddock & Graves, 1997; Suto & Takehara, 2016). The data are gathered
for the period 2002–18.
5.2.1 Dependent variables
As a part of the stated purpose of the study is to determine which sustainability
information that has a material impact on corporate operating performance, several
measures of operational performance will be used: return on assets (ROA), operating
cash flow to total assets (CFOTA), sales growth (SG) and gross profit margin (GM). The
definitions for these variables are summarized in panel A of Appendix 5 and are
motivated and presented in the following subsections.
50
5.2.1.1 Return on assets (ROA)
ROA is an asset utilization measure defined as income after taxes for the fiscal year
divided by average total assets5, expressed as a percentage, and describes how well a
company’s management is able to utilize its assets to generate earnings. Opposed to
return on equity (ROE), which is another often used measure, ROA does not depend on
the capital structure of the firm since total assets is used as the denominator.
Although the results are not reported in this study, EBITDA6 to total assets (EBITDA/TA)
was tested as an alternative to ROA, in order to account for the effects of taxes and
differences in accounting between different countries. The results obtained when using
the EBITDA/TA variable were highly similar to those for the regressions using ROA,
which was to be expected as the two variables had a high correlation coefficient of 0.88.
ROA is a more commonly used measure (used for instance by Griffin & Mahon, 1997;
Waddock & Graves, 1997; Van der Laan et al., 2008; Fischer & Sawczyn, 2013; Lins et
al., 2017; Adegbite et al., 2019) and is for that reason also the selected variable for this
study.
5.2.1.2 Cash flows from operations to total assets (CFOTA)
Income after taxes, which is the numerator in ROA, may sometimes be manipulated by
managers, possibly making it a less reliable performance measure than cash flows, which
is less likely to be manipulated (Dechow, 1994). In addition to ROA, Suto and Takehara
(2016) use cash flows from operations7 to total assets (CFOTA) to take the possibility of
earnings manipulation into account. Similarly, CFOTA is used as a second measure of
asset utilization in this study.
5.2.1.3 Sales growth (SG)
Higher revenues can be obtained by selling more products (services), or by setting higher
prices, ceteris paribus. Sales growth, defined as the percentage change in sales from the
previous year, can therefore be seen as a measure of consumer demand. The increased
relevancy of sustainability therefore makes this variable especially interesting, as it can
provide an indication of which CSP factors that consumers find important. This measure
5 Average total assets = ½ × (Total assets at the beginning of the year + total assets at the end of the year) 6 EBITDA = earnings before interests, taxes, depreciation and amortization 7 Cash flows from operations is defined as the sum of net income, depreciation & amortization, deferred taxes, non-cash items, cash receipts, cash payments and cash taxes paid.
51
is also utilized by for instance Lins et al. (2017), who find that companies with high CSP
scores have higher sales growth compared to others, indicating that consumers indeed
do value corporate sustainability.
5.2.1.4 Gross margin (GM)
The gross profit margin (GM) is used as a measure of a firm’s profitability and is defined
as the cost of goods sold deducted from sales, divided by sales, and is expressed as a
percentage. Consequently, a higher margin is the result of either increased revenues or
lower costs of goods sold. Studying sales growth and the gross profit margin together can
give an indication of whether changes in profitability are due to cost efficiencies, for
instance as a result of efficient use of resources, or whether they are a consequence of
changes in sales. Albuquerque, Koskinen and Zhang (2018) find that firms with higher
CSP benefit from higher prices and profit margins as a result of relatively lower price-
elasticity among consumers. Similar results are found for instance by Lins et al. (2017),
who use specifically the gross margin as a measure of profitability.
5.2.1.5 Long-term measures of operational performance and risk
To get a complete picture of the connection between CSP and CFP, I find it motivated to
study the relationship both for the short and mid- to long-term. Thus, 5-year rolling
averages of ROA, CFOTA and GM, as well as the 5-year compound annual growth rate of
sales, are also utilized as dependent variables. These are denoted ROA_5, CFOTA_5,
GM_5 and SG_5, respectively and are referred to as the operative or operational
measures of the 5-year sample. Furthermore, to determine the effects of corporate
sustainability performance (CSP) on the operational risks of companies, which is a part
of the stated purpose, the 5-year standard deviation of ROA, CFOTA, SG, and GM will
also be included. These are denoted ROA_RISK, CFOTA_RISK, SG_RISK and
GM_RISK, respectively and are referred to as risk measures. To improve the statistical
properties of the risk measures, I take the natural logarithm of the variables.
ROA_5, CFOTA_5 and GM_5 are arithmetic averages of the five consecutive
observations8 so that the sum of the five observations between time t and time t-4 are
divided by 5. The compound annual growth rate of sales, SG_5, uses the two observations
at times t and t-5, and is calculated using the following formula:
8 All 5-year variables are calculated using unwinsorized data.
52
SG_5 = ((𝑆𝑎𝑙𝑒𝑠𝑡
𝑆𝑎𝑙𝑒𝑠𝑡−5)
1/5− 1) ∗ 100 %
Because the sales data are year-end values, time t-5 is used instead of t-4, for 5 years of
growth to be obtained. The operative performance measures for the 5-year sample are
summarized in panel B of appendix 5, whereas the risk measures are presented in panel
C of appendix 5. The risk measures are rolling standard deviations of 5 consecutive
observations for the variables between t-4 and t.
The 5-year period is chosen for several reasons. First, using averages over several years
to represent the performance of a firm over time makes it possible to study the long-term
effects of CSP on CFP (corporate financial performance), thus avoiding short-term
instabilities and biases (Bracker, Keats & Pearson, 1988; Krishnan & Moyer, 1997).
Hackston and Milne (1996) argue that CFP measures are more reliable when viewed over
an extended period than when measured over a year. Furthermore, Fama and French
(2000) show that profitability is mean reverting, i.e. that competitive forces make
profitability measures converge with industry means over time (Knapp, Gart &
Chaudhry, 2006). By using averages, any persisting differences in the performance
caused by the CSP factors can be identified. Second, as discussed in section 3.6, there is
often a 1 to 2-year time lag between CSP improvements and noticeable effects in the CFP,
due to up-front investments in employee training, equipment, and so on (Hart & Ahuja,
1996). Only assessing the relationship over the short-term does not take this into
account. However, the effects of CSP on CFP could be difficult to distinguish if a too long
time period would be used for the averages, as a firm’s performance could be affected by
a myriad of other factors and the CSP impact would be lost in this noise. This sets an
upper limit for the long-term analysis. Third, for consistency between the standard
deviations of the risk variables, which require a plurality of observations for the
calculation, and the operative measures of the 5-year sample, I find it motivated to use
the same time period length. Finally, several previous studies have used a 5-year period
for the calculation of averages, compound annual growth rates and/or standard
deviations, to estimate firm operational performance and risk over an extended period
of time: Cochran & Wood (1984); Aupperle, Carroll & Hatfield (1985); Bettis & Mahajan
(1985); Bracker et al. (1988); Krishnan & Moyer (1997); Johnson & Soenen (2003);
Eberhart et al. (2004) and Suto and Takehara (2016), among others.
53
5.2.2 Control variables
The control variables used are firm size, leverage and firm age. Waddock and Graves
(1997) point out that R&D levels vary between industries but that controlling for industry
takes these differences into account. Industry is controlled for in this study by running
separate regressions for the different economic sectors. The inclusion of a dummy
variable, which assumes the value 1 if a company’s R&D to sales value is higher than the
average of the sector in which the company is active and 0 otherwise, was also considered
and tested on the main models used. Because the majority of the adjusted R-squared
values were lower when the R&D dummy was included, and because the variable’s
inclusion reduced the number of observations due to missing values by up to almost 30
percent, the variable was excluded.
5.2.2.1 Size
The size of a company is often used as a control variable for financial measures and is
similarly to e.g. Berger & Ofek (1995), Lee (2009), Suto & Takehara (2016) and Adegbite
et al. (2019), defined as the natural logarithm of the total assets9. Porter (1985) argues
that both small and large firms are able to use the size of the company to their advantage,
whereas mid-sized firms compete at a disadvantage. This applies only to certain
industries where small firms may be able to benefit from niche-markets (Amato &
Amato, 2004). However, larger firms are conventionally found to be more profitable due
to for instance economies of scale, more market power and larger market share, as well
as better access to capital markets (Lee, 2009). The sign of the size-profitability
relationship is therefore expected to be positive, meaning that larger firms are expected
to have higher profitability ratios.
It is argued that small firms do not have the same abilities to raise capital as large
companies due to a lack of collaterals, and that large firms therefore can be seen as safer
(Perez‐Quiros & Timmermann, 2000). The size-risk relationship is therefore expected to
be negative: larger firms are expected to have less risk than smaller firms.
5.2.2.2 Leverage
A firm’s leverage, measured as total debt to total assets, is another commonly used
control variable (used for instance by Waddock & Graves, 1997; Johnson & Soenen,
2003; Abor, 2005; Suto & Takehara, 2016 and Adegbite et al., 2019). The free cash flow
9 The total assets variable is retrieved in thousands of EUR
54
theory proposed by Jensen (1986) suggests that increased leverage can have a
disciplinary effect on managers that reduces agency costs and thereby increases firm
value. This would imply an expected positive sign for the leverage-profitability
relationship. Abor (2005), Margaritis and Psillaki (2010) find evidence in support of the
free cash flow theory. On the other hand, high-risk companies often have lower debt-
levels to withstand a larger variability and according to basic financial theory, higher risk
should be compensated with higher expected returns. Thus, a positive relationship
between leverage and risk is to be expected (leverage effect) (Christie, 1982). Based on
this, as lower risk implies that a company can withstand more leverage, then leverage
can be argued to have a negative effect on profitability: less risk equals lower expected
returns (Gale, 1972). Furthermore, increased leverage can also raise the cost of capital
for the firm (Baxter, 1967), consistent with a negative leverage–profitability relationship.
Waddock & Graves (1997) and Suto & Takehara (2016) both find a negative effect of
leverage on profitability, whereas Johnson & Soenen (2003) find no effect between
leverage and profitability. In line with the leverage effect, Suto and Takehara (2016) also
find a positive relationship between leverage and risk.
To summarize, both negative and positive effects of leverage on profitability are
plausible, whereas I expect the leverage-risk relationship to be positive in line with the
majority of previous research.
5.2.2.3 Age
In a similar fashion to Galema et al. (2008), I define firm age as the natural logarithm of
the difference between each year and the year of a company’s foundation. It can be
argued that older firms benefit from experience and therefore have superior performance
(Majumdar, 1997). On the other hand, older firms may be seen as more prone to inertia,
bureaucracy and lack of flexibility, suggesting a negative age-profitability relationship
(Cochran & Wood, 1984; Majumdar, 1997). Accordingly, most papers find a negative
relationship between firm age and profitability (e.g. Majumdar, 1997; Galema et al.,
2008). Especially when operative performance is measured as the growth of a firm, I
expect a negative age-performance relationship in line with what the traditional view of
the corporate life cycle predicts, so that older and more mature firms obtain lower growth
rates. With regards to the risk, I expect older companies to have lower variability, i.e. a
negative relationship between age and the risk measures.
55
5.3 Descriptive statistics
The descriptive statistics for all variables are presented in table 5. The central tendency
measures, average and median, give an indication of the central location of the variables.
The maximum and minimum are extreme value measures, indicating the respective
largest and smallest observed values. The standard deviation is included as a measure of
the variables’ dispersion and has the same unit as the variable in question, whereas the
skewness and excess kurtosis explain the distribution of the variables. Skewness is a
measure of asymmetry and is equal to 0 for the normal distribution. Kurtosis is a
measure of the fat-tailedness of a distribution and has the value 3 for the univariate
normal distribution. In table 5, the excess kurtosis is presented, meaning that 3 has been
deducted from the kurtosis measure so that a normally distributed variable would obtain
an excess kurtosis of 0.
Outliers are values that do not fit in with the general pattern of the remainder of the data
and that are far away from the rest of the observations, and these can have significant
effects on the results (Brooks, 2014). One way to deal with extreme values is through
winsorization, which means that when the observations are in order from smallest to
largest, the values above and/or below certain cut-off points are replaced by the value at
the cut-off (Ghosh & Vogt, 2012).
Winsorizing all variables at the same level to avoid problems with outliers is used by e.g.
Lins et al. (2017). Similarly, the starting point was that all operative measures would be
winsorized at the 1 percent level, i.e. at 0.5 percent per end. This level was deemed
appropriate as it was the minimum cut-off value for outliers more than 3 standard
deviations above and below the median to be dealt with for all variables. To avoid biased
results however, I winsorize as little as possible so that only values that are clearly
different from the rest of the data are affected, thus avoiding unnecessary manipulation
of the variables. Thus, of the short-term operational measures, ROA and CFOTA are
winsorized at 0.5 percent per end, while SG and GM are only winsorized in the upper
and lower ends, respectively. Similarly, SG_5 and GM_5 are winsorized at the 0.5
percent level in the upper and lower ends, respectively. The 5-year averaging evens out
some extreme observations and therefore CFOTA_5 is not winsorized at all, whereas
ROA_5 is winsorized at 0.25 percent per end.
To illustrate winsorization with an example: for the GM variable, the smallest 0.5 percent
of the observations are replaced by the value at the cut-off, i.e. the 0.5 percentile value.

56
More than 99 percent of GM observations in the data set are equal to or larger than zero,
but in the unwinsorized data, there were observations below -1,000 (minimum value: -
14,131), which are clearly out of the ordinary. Thus, winsorizing the observations in the
negative end is motivated. The unwinsorized maximum value of 100 percent for the gross
profit margin does not need to be winsorized however, as it makes logical sense and
means that there were no costs for the company in that year. A negative value for GM
indicates that costs of goods sold (COGS) exceed the achieved revenues. On average,
companies in the healthcare and technology sectors were able to attain the highest
profitability margins while companies that are active in basic materials, energy,
industrials and utilities sectors had the largest COGS and the lowest margins.
The sales growth (SG) variable included some extreme values (with a maximum value of
38,850 %). The winsorization reduced skewness from 70.0 to 3.0 and excess kurtosis
from 5,269.9 to 16.4. The largest observation decreased to 181.9 percent after the
winorization, meaning that a company’s sales almost tripled from one year to the next,
which is still relatively large. The median annual growth over the whole period is 5.4
percent. Inflation is not accounted for. It can be noted that the sales growth was highest
during the years prior to 2008, with an average annual growth of 8.7 percent. In 2008 it
was negative on average.
For ROA, the winsorization reduced the excess kurtosis from 270.6 to 3.3, and the
skewness from -1.8 to -0.1. For CFOTA, the excess kurtosis changed from 196.8 to 0.3
and the skewness was reduced from 5.0 to 0.9. The mean return on assets (ROA) was 5.7
percent for the entire sample, which is in line with previous research (Waddock & Graves,
1997: 5.6 %; Van der Laan et al., 2008; Nelling & Webb, 2009 and Lins et al., 2017: 3.3
%). That the mean of 10 percent for the CFOTA variable is higher than the mean of ROA
is in line with e.g. Suto & Takehara (2016).
Winsorizing the 5-year average of ROA, ROA_5, brought excess kurtosis down from
140.9 to 2.5. As can be seen in table 5, the 5-year operational variables are in line with
the year-to-year observations.
The relatively high values of excess kurtosis that can be seen for some of the CSP factors
in table 5, especially for the emerging market development and governance
controversies factors, are the result of quite few observations that are different from 0.
This can also be seen by looking at the low variable means and medians of 0.

57
Consequently, these variables are excluded from some of the regressions, which will be
discussed further in the methodology-chapter.
All operative measures in table 3 are in percentage form. The CSP variables are the
summed factor scores as explained in section 5.1.1.5. I take the natural logarithm of all
risk measures, firm size and firm age (marked by an asterisk in table 5) to increase the
statistical properties of the variables. The original values of the variables can be obtained
by taking the mathematical constant e (Napier’s constant, approximately equal to 2.72)
to the power of the logarithmized value. Leverage is winsorized at the upper 0.25
percent. All variables presented in the table are thus in the form in which they are used
in the subsequent regression models, i.e. outliers have been dealt with in the ways
previously discussed.
The median firm has € 3,246 million in total assets and a leverage ratio of 24 percent.
The highest leverage ratios are on average in the capital-intensive telecommunications
services and utilities sectors. A leverage ratio of more than 100 percent means that the
firm has negative equity on its balance sheet. Finally, the median firm age is 42 years for
the whole sample.
A correlation matrix which includes all the independent variables is included in appendix
6. None of the variables have a correlation above 0.7, meaning that multicollinearity, i.e.
correlation between the independent variables, should not be a problem. The
environmental impact reduction factor has rather high correlations with some of the
social factors, indicating that firms with high performance on this factor also tend to be
socially responsible.
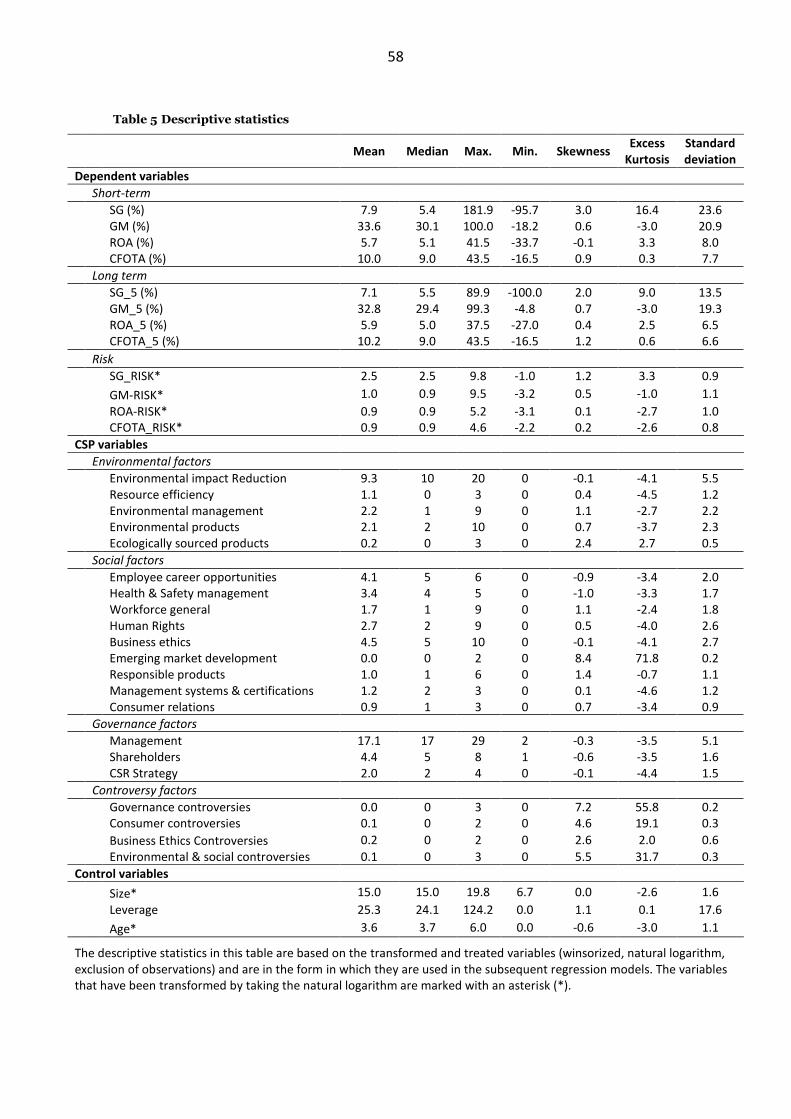
58
Table 5 Descriptive statistics
Mean Median Max. Min. Skewness
Excess Kurtosis
Standard deviation
Dependent variables
Short-term
SG (%) 7.9 5.4 181.9 -95.7 3.0 16.4 23.6
GM (%) 33.6 30.1 100.0 -18.2 0.6 -3.0 20.9
ROA (%) 5.7 5.1 41.5 -33.7 -0.1 3.3 8.0
CFOTA (%) 10.0 9.0 43.5 -16.5 0.9 0.3 7.7
Long term
SG_5 (%) 7.1 5.5 89.9 -100.0 2.0 9.0 13.5
GM_5 (%) 32.8 29.4 99.3 -4.8 0.7 -3.0 19.3
ROA_5 (%) 5.9 5.0 37.5 -27.0 0.4 2.5 6.5
CFOTA_5 (%) 10.2 9.0 43.5 -16.5 1.2 0.6 6.6
Risk
SG_RISK* 2.5 2.5 9.8 -1.0 1.2 3.3 0.9
GM-RISK* 1.0 0.9 9.5 -3.2 0.5 -1.0 1.1
ROA-RISK* 0.9 0.9 5.2 -3.1 0.1 -2.7 1.0
CFOTA_RISK* 0.9 0.9 4.6 -2.2 0.2 -2.6 0.8
CSP variables
Environmental factors
Environmental impact Reduction 9.3 10 20 0 -0.1 -4.1 5.5
Resource efficiency 1.1 0 3 0 0.4 -4.5 1.2
Environmental management 2.2 1 9 0 1.1 -2.7 2.2
Environmental products 2.1 2 10 0 0.7 -3.7 2.3
Ecologically sourced products 0.2 0 3 0 2.4 2.7 0.5
Social factors
Employee career opportunities 4.1 5 6 0 -0.9 -3.4 2.0
Health & Safety management 3.4 4 5 0 -1.0 -3.3 1.7
Workforce general 1.7 1 9 0 1.1 -2.4 1.8
Human Rights 2.7 2 9 0 0.5 -4.0 2.6
Business ethics 4.5 5 10 0 -0.1 -4.1 2.7
Emerging market development 0.0 0 2 0 8.4 71.8 0.2
Responsible products 1.0 1 6 0 1.4 -0.7 1.1
Management systems & certifications 1.2 2 3 0 0.1 -4.6 1.2
Consumer relations 0.9 1 3 0 0.7 -3.4 0.9
Governance factors
Management 17.1 17 29 2 -0.3 -3.5 5.1
Shareholders 4.4 5 8 1 -0.6 -3.5 1.6
CSR Strategy 2.0 2 4 0 -0.1 -4.4 1.5
Controversy factors
Governance controversies 0.0 0 3 0 7.2 55.8 0.2
Consumer controversies 0.1 0 2 0 4.6 19.1 0.3
Business Ethics Controversies 0.2 0 2 0 2.6 2.0 0.6
Environmental & social controversies 0.1 0 3 0 5.5 31.7 0.3
Control variables
Size* 15.0 15.0 19.8 6.7 0.0 -2.6 1.6
Leverage 25.3 24.1 124.2 0.0 1.1 0.1 17.6
Age* 3.6 3.7 6.0 0.0 -0.6 -3.0 1.1
The descriptive statistics in this table are based on the transformed and treated variables (winsorized, natural logarithm, exclusion of observations) and are in the form in which they are used in the subsequent regression models. The variables that have been transformed by taking the natural logarithm are marked with an asterisk (*).
59
5.4 Hypothesis formulation
For each economic sector, the sustainability factors are likely to be of different
importance. For instance, it can be expected that environmental issues are more
important for companies the basic materials and utilities sectors than for the technology
or telecommunications services sectors (Peloza, 2009).
Based on that the majority of previous research finds a positive relationship between CSP
and CFP and based on the theoretical frameworks discussed so far, two main research
hypotheses can be formed:
Research hypothesis 1: CSP is expected to have a positive impact on a firm’s
operational performance
Research hypothesis 2: CSP is expected to have a negative impact on a firm’s
operational risk.
60
6 METHODOLOGY
The choice of empirical method is important as an erroneously specified model can cause
biased results. In this chapter I will present the models used to assess the CSP–CFP
relationship. First, I will motivate the choice of methodology used in this thesis, namely
a fixed effects model. After this, the three variations of the model used to study the
relationship between corporate sustainability performance and corporate financial
performance will be presented. Model 1 examines the CSP–CFP relationship over time,
using the 5-year averages (5-year CAGR in the case of sales growth) and 5-year risk
measures as dependent variables. Model 2 determines the impact of CSP on CFP using
1-year lags of the independent and control variables. Finally, model 3 is used to evaluate
possible changes in the CSP–CFP relationship over time, by using interaction variables
to study three different time periods (2002-07, 2008-13 and 2014-18). Eccles & Serafeim
(2013) argue that whether a sustainability issue significantly can affect long-term value,
depends both on the strategy of the firm and the economic sector in which it operates.
Models 1 and 2 will be used for both the complete sample as well as for each sector,
whereas model 3 will be applied to the complete dataset only.
6.1 Choosing the appropriate panel data regression model
A data set with both a timeseries and a cross-sectional dimension is called panel data or
longitudinal data. Panel data have several advantages compared to pure time series data
or cross-sectional data alone as more complex issues can be dealt with. Individual
heterogeneity can be controlled for when using panel data and a panel of data also
contains more information with more variation than one-dimensional data (Baltagi,
2005). The use of panel data enables the degrees of freedom to be increased compared
to cross-sectional and time series data, which improves the power and efficiency of the
tests and can help with mitigating problems of multicollinearity (Brooks, 2014).
Furthermore, some impacts of the omitted variables bias can be removed when
appropriate panel data models are used (Brooks, 2014). Finally, effects that could not be
identified using one-dimensional data can be identified and measured using panel data
(Baltagi, 2005).
As the data set used for this thesis is not complete so that the number of times series
observations are not the same for all entities in the cross-section, I am dealing with an
unbalanced panel (Brooks, 2014). Unbalanced panels often cause no problems and they
are dealt with in very similar ways as balanced panels (Wooldridge, 2009).

61
To indicate both the time series and the cross-sectional dimensions, panel data
regressions have a double subscript, it, where i denotes the cross-sectional dimension
and t denotes the time dimension (Baltagi, 2005). A fixed effects panel data regression
can be written as:
𝑦𝑖𝑡 = 𝛼 + 𝑋′𝑖𝑡𝛽 + 𝑢𝑖𝑡 𝑖 = 1, … , 𝑁; 𝑡 = 1, … , 𝑇 (𝐸𝑞. 1)
where α is a scalar, 𝛽 is a K × 1 vector, 𝑋′𝑖𝑡 is the ith observation on K explanatory
variables (Baltagi, 2005). In equation 1, 𝑢𝑖𝑡 is the one-way error component:
𝑢𝑖𝑡 = 𝜇𝑖 + 𝜈𝑖𝑡 (𝐸𝑞. 2)
in which 𝜇𝑖𝑡 denotes the time-constant and unobservable individual-specific effects that
are not included in the model (Baltagi, 2005). In other words, 𝜇𝑖 includes everything in
the cross-section that can affect 𝑦𝑖𝑡 but which does not vary over time (Brooks, 2014),
such as industry in which a company operates and a company’s country of headquarters.
In equation 2, 𝜈𝑖𝑡 stands for the remaining disturbance (Baltagi, 2005). Equation 1 could
also be estimated using the least squares dummy variable approach (LSDV) where
dummy variables (𝐷1𝑖 to 𝐷𝑁𝑖) that take the value 1 for all observations on the equivalent
entity (company in this case), and 0 otherwise, are multiplied with 𝜇𝑖:
𝑦𝑖𝑡 = 𝑋′𝑖𝑡𝛽 + 𝐷1𝑖𝜇1 + 𝐷2𝑖𝜇2 + ⋯ + 𝐷𝑁𝑖𝜇𝑁 + 𝜈𝑖𝑡 (𝐸𝑞. 3)
(Brooks, 2014). Here, the intercept term α is excluded to avoid the dummy variable trap.
This way, each cross-sectional element (company) gets its own intercept. If these
intercepts do not vary between the cross-sectional units, a panel approach is not
necessary so that pooled regressions using ordinary least squares regressions (OLS) can
be used. (Brooks, 2014)
The random effects model differs from the fixed effects model so that the heterogeneity,
i.e. variation in the cross-sectional dimension occurs via a common intercept α, plus the
cross-sectional error term 𝜖𝑖, which varies cross-sectionally but is constant over time
(Brooks, 2014: 536):
𝑦𝑖𝑡 = 𝛼 + 𝑋′𝑖𝑡𝛽 + 𝜔𝑖𝑡 , 𝜔𝑖𝑡 = 𝜖𝑖 + 𝜈𝑖𝑡 . (𝐸𝑞. 4)
The parameters are otherwise the same as in equation 1 and 𝜔𝑖𝑡 is the composite error
term.
62
6.1.1 Pooled OLS vs random / fixed effects model
The simplest way to deal with panel data is to estimate pooled regressions. This however
assumes that the relationships between variables and the averages of the variables are
constant over time and across all cross-sectional units (Brooks, 2014: 526-541), i.e. that
all cross-sectional units have a common intercept (Cottrell & Lucchetti, 2019). If this is
the case, or if there is heteroskedasticity present, then the OLS estimator is no longer the
best linear unbiased estimator (BLUE) (Wooldridge, 2009; Cottrell & Lucchetti, 2019).
Consequently, the results may be biased leading to invalid inferences if the
homoskedasticity10 assumption is violated (Breusch & Pagan, 1979).
To test whether a pooled regression is adequate, an F-test with the null hypothesis that
there is a common cross-sectional intercept (H0: 𝜇1 = 𝜇2 = ⋯ = 𝜇𝑁) is used. A Breusch-
Pagan (BP) test, which uses a Lagrange multiplier to determine whether a pooled OLS or
a random effects model should be preferred, is also utilized.
The F-test rejected the null for all dependent variables at the 1 percent level, in favour of
a fixed effects model. Correspondingly, the BP test was significant at the 1 percent level
for all dependents, suggesting that the random effects model is more appropriate than a
pooled model.
6.1.2 Fixed effects model vs. random effects model
Both the F-test and the BP test point towards using either a fixed effects model or a
random effects model. Due to the way the models are specified, fewer parameters need
to be estimated for the random effects model, which saves degrees of freedom and makes
the model more efficient than the fixed effects model. Additionally, the model does not
remove the time-constant explanatory variables. However, in addition to that the
random effects model requires that the cross-sectional error term 𝜖𝑖𝑡 is homoscedastic,
has zero mean and is independent of the remaining disturbance 𝜈𝑖𝑡, the composite error
term 𝜔𝑖𝑡 needs to be uncorrelated with all the explanatory variables (Brooks, 2014:536).
If they are correlated, the fixed effects model is preferred. Furthermore, fixed effects
models control for the effects of unobserved variables (Nelling & Webb, 2009), and they
are less prone to omitted variable bias than OLS regressions (Bajic & Yurtoglu, 2018).
10 The homoskedasticity assumption means that the variance of the error terms is assumed to be constant. If this assumption is not true, they are said to be heteroskedastic (Brooks, 2014:181).
63
To determine whether to use a fixed effects model or a random effects model, a Hausman
test using the regression method is used (see Cottrell & Lucchetti, 2019:179). The null
hypothesis for the Hausman test is that the error terms are uncorrelated with the
explanatory variables (Cottrell & Lucchetti, 2019). The Hausman statistics for all
dependent variables vary between 103.9 and 365.5 and are all significant at the 1 percent
level, meaning that a fixed effects model is the most appropriate panel data regression
model to use for the data set used in this study.
6.2 Panel data regression models
In this section the three versions of the fixed effects model that are used in this thesis
will be presented. All models use firm-level fixed effects.
6.2.1 Examining the long-term CSP – CFP relationship
The first model examines the CSP–CFP relationship over the long term and has either
one of the operational measures, or one of the risk measures as the dependent variable.
These are either 5-year historical averages or their equivalent historical standard
deviations between time t and time t-4. The control variables in the regressions are
included at time t11, whereas all CSP measures will be lagged to t-5, i.e. to the beginning
of year t-4. This is to provide a complete picture of how the CSP factor scores impact on
the CFP over the entire 5-year period. Thus, by lagging the CSP measures to the
beginning of the period, the causality running from CSP to CFP is measured, not vice
versa. The equation for the model used to assess the long-term impacts of CSP on CFP
can be seen in model 1:
𝐶𝐹𝑃_5 𝑖,𝑡 = 𝛼 + 𝛽1𝑆𝐼𝑍𝐸𝑖,𝑡 + 𝛽2𝐿𝐸𝑉𝐸𝑅𝐴𝐺𝐸𝑖,𝑡 + 𝛽3𝐴𝐺𝐸𝑖,𝑡 + 𝜃′𝐶𝑆𝑃𝑖,𝑡−5 + 𝑢𝑖,𝑡 (1)
11 Lags of one and five years were also tested on the control variables. This had no apparent changes on the sustainability factors however, and the adjusted R-squared values were on average lower than when having the control variables at time t (for the 5-year lags of the control variables, a higher adjusted R-squared was obtained for 3 out of 8 measures and the difference in the R-squared values was quite small).
64
where:
This model is applied to the full sample and separately for each of the nine economic
sectors. As already mentioned in section 5.3, some of the CSP factors are excluded from
the economic sector regressions. This is due to that some of the factors had very few
observations for these factors that were different from 0. For a CSP factor to be included
in the sector regressions, a minimum of 20 positive observations were required.
6.2.2 Examining the short-term CSP–CFP relationship
To measure the CSP–CFP relationship over the short-term, one-year lags of the right-
hand-side variables (defined as in model 1) are used. The dependent variables (CFP_1 in
model 2) are the four operative measures described in sections 5.2.1.1 – 5.2.1.4 (sales
growth: SG, gross profit margin: GM, return on assets: ROA, and cash flows from
operations to total assets: CFOTA). To control for the global financial crisis, a dummy
variable denoted Crisis, which assumes value 1 for the years 2008 and 2009 and 0
otherwise, is included. Although the crisis began already in 2007, it can be argued that it
blew into a full-scale international crisis in 2008 with the collapse of Lehman Brothers.
Defining the crisis this way is in line with e.g. Lins et al. (2017). One can expect that the
profitability measures are lower during these years, i.e. that the dummy has a negative
impact on the dependent variables. Model 2 can be written as:
𝐶𝐹𝑃_1 𝑖,𝑡 = 𝛼 + 𝛽1𝑆𝐼𝑍𝐸𝑖,𝑡−1 + 𝛽2𝐿𝐸𝑉𝐸𝑅𝐴𝐺𝐸𝑖,𝑡−1 + 𝛽3𝐴𝐺𝐸𝑖,𝑡−1 + 𝜃′𝐶𝑆𝑃𝑖,𝑡−1 + 𝐶𝑟𝑖𝑠𝑖𝑠 +
𝑢𝑖𝑡 (2).
Similarly to model 1, model 2 is used both for the full sample and for the economic
sectors, with some of the CSP factors excluded from the sector regressions if the
requirement of a minimum number of positive observations is not met.
CFP_5 = 5-year operational performance or risk measure (ROA_5, CFOTA_5, SG_5, GM_5, ROA_RISK, CFOTA_RISK, SG_RISK, or GM_RISK), for company i at time t,
SIZE = Natural logarithm of total assets for company i at time t,
LEVERAGE = Total debt / Total assets for company i at time t,
AGE = Natural logarithm of years since firm inception for company i at time t,
CSP = k × 1 vector of the CSP dimension scores obtained from the PCA for company i at time t-5.
Finally, α is the regression intercept, the βs are the slope coefficients and u is the composite error term. 𝜃 is a k × 1 vector of parameters to be estimated on the CSP factors.
65
6.2.3 Changes in the CSP–CFP relationship over time
As the purpose of the study is to study the impact and materiality of CSP measures on
CFP, I find it motivated to see if the relationships are different over time, for instance
due to changes in societal demands or changes in the legal and economic environment
in which firms operate. Previous studies find that partly due to that more salient
stakeholders have started to assign a positive value to corporate responsibility, the
business case for CSP has grown stronger for more recent time periods (Peloza &
Papania, 2008). Kotsantonis et al. (2016) find that companies with exceptional CSP
actually outperform their competitors in a number of ways during these later time
periods. Ioannou and Serafeim (2015) confirm this hypothesis by reporting results that
show how analysts’ perception of CSR has shifted from a more pessimistic view in the
early 1990s, perceiving CSR as an agency cost, to a more optimistic view over time.
Several other studies have found evidence of changes in the relationship between CSP
and CFP between different time periods as well (e.g. Lins et al., 2017; Adegbite et al.,
2019). I therefore divide the full sample period into three approximately equally large
subperiods: 2002–07, 2008–13, 2014–18. The first period, 2002–07, contains 2,393
firm-year observations, the second period has 3,678 firm-year observations and the third
period includes 3,094 firm-year observations.
The three periods are quite different from each other in terms of the events that have
taken place in Europe while the sustainability issues have grown in importance during
the entire period. The beginning of the 21st century, i.e. the first period covering the years
2002–07, was a period of high growth that followed the economic downswing of the dot-
com bubble, which ended right in the beginning of the century. The second period
covering the years 2008 to 2013 can be seen as a period of economic recession. It includes
both the global financial crisis of 2008–09 and the European sovereign debt crisis that
started shortly after the global financial crisis, where several EU countries were unable
to repay or refinance their government debts. This recession period is of interest because
Lins et al. (2017) show that firms with higher CSR performance outperform firms with
low CSR performance in times of financial crises. Finally, the third period is interesting
as it contains the most recent data. Also, in 2014 new legislation was introduced
requiring companies within the European Union with more than 500 employees to
disclose how ESG-related issues are incorporated in the businesses (European
Parliament, 2014). This is relevant to the studied topic because Ioannou and Serafeim
(2017) report that increases in the disclosure of sustainability issues increase firm value.
66
Empirically, model 3 is a kind of difference-in-differences model, which uses interaction
variables where each CSP factor is multiplied with the three time-period dummies (see
e.g. Wooldridge, 2012: 451-473). The time-period dummies take the value 1 for the years
that are included in each subperiod, and 0 otherwise:
𝐶𝐹𝑃 𝑖,𝑡 = 𝛼 + 𝛽1𝑆𝐼𝑍𝐸𝑖,𝑡 + 𝛽2𝐿𝐸𝑉𝐸𝑅𝐴𝐺𝐸𝑖,𝑡 + 𝛽3𝐴𝐺𝐸𝑖,𝑡 + 𝜃′𝐷2002−2007𝐶𝑆𝑃𝑖,𝑡 +
𝛿′𝐷2008−2013𝐶𝑆𝑃𝑖,𝑡 + 𝛾′𝐷2014−2018𝐶𝑆𝑃𝑖,𝑡 + 𝑢𝑖𝑡 (3).
In model 3, 𝜃, 𝛿 and 𝛾 are the slope coefficients of the interaction variables: k × 1 vectors
of regression parameters to be estimated on the CSP factors.
Because this approach results in a large number of variables which consume a lot of
degrees of freedom, I run the model 3 regression only on the full sample. To be able to
comment on the changes between the time periods, an alternative version of model 3 is
also used:
𝐶𝐹𝑃 𝑖,𝑡 = 𝛼 + 𝛽1𝑆𝐼𝑍𝐸𝑖,𝑡 + 𝛽2𝐿𝐸𝑉𝐸𝑅𝐴𝐺𝐸𝑖,𝑡 + 𝛽3𝐴𝐺𝐸𝑖,𝑡 + 𝜃′𝐶𝑆𝑃𝑖,𝑡 + 𝛿′𝐷2008−2013𝐶𝑆𝑃𝑖,𝑡 +
𝛾′𝐷2014−2018𝐶𝑆𝑃𝑖,𝑡 + 𝑢𝑖𝑡 (3.1).
The results for model 3.1 will not be presented fully, but they are used to assess how the
CSP–CFP relationship has changed in comparison to the base period, in this case 2002-
2007.
6.2.4 Taking company CO2 emissions into consideration
The amount of CO2 that companies produce is often brought up in the discussion
regarding climate change issues and corporate emissions, especially by the media. For
this reason, I run auxiliary regressions using models 1 and 2, where a variable defined as
the natural logarithm of a company’s CO2 emissions12 to the total assets of the company
[Ln(CO2/Assets)] is included. These results are not presented due to that the inclusion
of the variable reduces the amount of observations included in the regression models by
a substantial amount. However, the results for the CO2 variable are included in the
summary tables for the long- and short-term results (table 16 and table 17).
12 Measured as the estimated total CO2 and CO2 equivalents emissions in tonnes
67
6.3 Model diagnostics
Durbin-Watson tests performed on model 1 and model 2 indicate positive
autocorrelation13. Robust estimators that are suitable for panel data are therefore used
(Cottrell & Lucchetti, 2019: 172). The statistics program uses heteroskedasticity and
autocorrelation consistent standard errors for panel data as suggested by Arellano
(2003). As already mentioned and as can be seen in appendix 6, the correlation between
any two independent variables does not exceed 0.7, indicating that multicollinearity
should not be an issue.
13 The test statistics obtained were between 0.3 and 0.8 for the whole sample regressions. The statistics program used does not report the p-values for these statistics (Cottrell & Lucchetti, 2019:180), but the rule-of-thumb that values below 1 indicate serial correlation, was used.
68
7 RESULTS
This chapter will first present the results of the empirical analysis for the full sample and
for the 9 economic sectors. These results are summarised in sections 7.11-12. The chapter
concludes with discussions regarding the robustness of the models and the possible
shortcomings of this study, with suggestions for future research.
7.1 Results for the full sample
Panel A of table 6 shows the results of model 1 using the full sample. In line with
previous research (e.g. Lee, 2009), size seems to have a positive effect on the profitability
of the firms in the sample, possibly due to larger market shares and economies of scale.
As expected, larger firms are found to have less risk. Consistent with the results of for
instance Waddock & Graves (1997) and Suto and Takehara (2016), leverage seems to
have a negative effect on profitability, giving support to the leverage effect. However, the
leverage variable is not significant for the companies in the sample when one of the risk
measures is used as the dependent variable. In accordance with the majority of previous
research, age has a negative impact on firm profitability in general (see e.g. Majumdar,
1997; Galema et al., 2008). Also, in line with what was expected, older firms have lower
firm risk.
A total of 27 significant values are obtained for the CSP factors across the 8 measures
used as dependent variables in panel A. The rest of the parameters estimated for the CSP
factors are insignificant, suggesting neither a negative nor a positive impact on CFP. Out
of the significant values, 17 (i.e. 63 %) are in favour of the CS business case, meaning that
a significant and positive sign is found for the environmental, social and governance
factors or a negative sign in case of the controversies. Of the regressions using a risk
measure as the dependent variable, 9 out of 9 significant factors are in favour of the CS
business case, whereas 8 out of 18 (44 %) of the profitability measures give support to a
positive CSP–CFP relationship. Most of the environmental factors (9 out of 11 significant
results) improve CFP.
The Ecologically sourced products factor is significantly positive for all four profitability
measures and the results are economically significant; if a company attends to one of the
variables included in the factor, both sales growth and the gross profit margin are
estimated to increase by approximately 1.6 percent per year, ROA by 1 percent and
CFOTA by 0.6 percent annually. Also, companies that produce products that are
designed to reduce (increase) negative (positive) environmental impacts, measured by
69
the environmental products factor, experience higher margins and less risk
(CFOTA_RISK). Similarly, firms who sell socially responsible products, tend to have less
gross margin variability.
Environmental management seems to reduce sales growth and ROA but decrease
CFOTA variability, whereas a company’s green initiatives have a lowering impact on
sales growth variability and increase the gross profit margin. Looking after the primary
stakeholders (employees, shareholders and consumers) seem to be costly for firms or
have an insignificant impact. This could perhaps be because there is likely to be a lot of
regulation regarding these parties, resulting in that apparently performing above what is
required is more costly than beneficial from a profitability point-of-view. For instance,
improved performance for employee career opportunities, employee health & safety
management, general workforce issues, management governance and stakeholder
relations, show a mainly negative effect on the profitability measures. However, the
latter two factors reduce sales growth risk.
In line with the results of Van der Laan et al. (2008), the business ethics and
environmental & social controversy factors have a negative impact on profitability and
a positive impact on risk, which supports the view that bad CSP performance has a
negative impact on CFP.
The statistics program used to run the fixed effects regressions report the within R-
squared in place of the adjusted R2 (Cottrell & Lucchetti, 2019). The highest R-squared
is obtained for the SG_5 measure, for which approximately 14 percent of the variation is
explained by the model. The R2 values are similar to those obtained by previous studies
(e.g. Majumdar, 1997; Waddock & Graves, 1997; Nelling & Webb, 2009). Due to the lags
used and due to some missing values, the number of companies included in the full
sample regressions using model 1 varies between 630 and 635. Approximately 5,200
firm-year observations are used.
Panel B of table 6 presents the full sample results using model 2, where all independent
variables, except the crisis dummy, are lagged by 1 year. Contradicting the long-term
results, size seems to have a significantly negative impact on sales growth, ROA and
CFOTA in the short-term. Similar results are obtained by Waddock & Graves (1997) and
Nelling & Webb (2009) when 1-year lags are used. In line with the long-term results there
is support for the leverage effect, as the results indicate that firms with more debt are
less profitable.

70
In the short run, CSP seems to have a slightly negative to neutral impact on the operative
performance measures; the results give support to CSP improving CFP for a total of 6 out
of 15 significant variables (40 %) across the four dependent variables. This is in line with
the results of Hart and Ahuja (1996), and Lopez et al. (2007) who show that it takes time
from the moment that CS investments are initiated (through the purchase of new
production technologies, investments to train employees, etc.) until the bottom-line
benefits are realized.
The majority of the environmental and social factors (6 out of 11, i.e. 55 %) have a positive
impact on the financial performance already in the short-term. Reducing emissions and
waste increases the gross profit margin through increased sales growth, which can be
interpreted as higher customer demand. Firms with a good performance on human
rights issues also experience increased consumer demand already in the short-term.
Environmental management has a lowering impact on sales growth, the gross margin
and ROA in the short-term, however. Management governance and shareholder
relations reduce the operational performance for 2 of the measures each, whereas the
workforce satisfaction and employee career opportunities factors both have a lowering
impact on one of the CFP measures.
Clearly, the financial crisis had a strong and significant negative effect on consumer
buying-power, as the sales growth was significantly lower during 2008 and 2009.
Panel C of table 6 shows how the impact of the CSP factors on CFP has changed over
time, when assessed using model 3. The columns named M3 display the significance
levels for model 3, thus showing whether the obtained coefficient is statistically
significantly different from zero. The coefficients displayed in the table are for model 3.
The columns denoted M3.1 indicate the significance levels for when the variation of
model 3, model 3.1, is used; the significance levels indicate whether the obtained values
are significantly different from the base period 2002-07.
With SG as the dependent variable, the sign of the CSP–CFP relationship changed from
being negative in the period 2002–07 to being positive in 2014–18 for the resource
efficiency, environmental products and ecologically sourced products factors. These
changes are statistically significant and support the view that consumers increasingly try
to make more responsible choices. These results are in line with those of Kotsantonis et
al. (2016), as well as Ioannou and Serafeim (2017), who find that increased regulations
71
for corporate sustainability disclosure have a positive economic effect. Additionally, for
the green initiatives, consumer relations and management governance factors, there is
a positive change in the relationship between the first and the last period, although these
changes are not statistically significant. Similarly, the controversies are penalized more
in the final period compared to the first period, although these are not either significant.
On the contrary however, the change in the relationship is significantly negative for the
environmental management and health & safety management factors.
For the profitability and asset utilization measures, at least half of the significant results
support the CS business case for all three periods. When GM is the dependent variable,
a statistically significant positive change from the first period to the last period can be
seen for the environmental products, ecologically sourced products, green initiatives
and employee career opportunities factors. The health & safety management factor
however, changed from having a significantly positive impact on the gross margin in
2002–07, to having a significantly negative impact in the latest period. Perhaps
regulations and/or general praxis has improved since the beginning of the century so
that investments to improve the health and safety of a company’s employees beyond the
optimal level is in fact value destroying as proposed by Barnea and Rubin (2010) and
Auer and Schuhmacher (2016).
Consistent with Mǎnescu (2011) who finds that employee relations had a negative effect
on CFP between 2003-2008, both employee career opportunities and the workforce
general factors show a mainly negative impact in the first period.
Environmental & social controversies have instead changed from having a positive
impact on ROA in the beginning of the millennia to being value-destroying, which makes
sense on the basis of an increased awareness regarding these issues among customers.
The amplified awareness is further backed up for the ecologically sourced products
factor, which is significantly positive, both economically and statistically, for all CFP
measures during the 2014–18 period, but insignificant prior to that.
Consistent with the results of Lins et al. (2017), the business ethics and socially
responsible products factors are especially important during times of economic
recession. Maintaining shareholder relations has become more and more costly.
Because no time lags are used in model 3, up to 792 companies and almost 8,600 firm-
year observations are included.

72
Table 6 Results for the full sample
Panel A: Long-term (Model 1)
SG_5 SG_RISK GM_5 GM_RISK ROA_5 ROA_RISK CFOTA_5 CFOTA_RISK
Constant -140.42 *** 2.56 * 20.85 7.77 *** -26.51 *** 6.30 *** 8.08 3.66 *** Size 11.05 *** 0.06 1.35 -0.33 *** 2.44 *** -0.38 *** 0.63 -0.14 ** Leverage -0.08 ** 0.00 -0.04 0.00 -0.11 *** 0.00 -0.05 *** 0.00
Age -4.70 ** -0.18 -1.49 -0.52 *** 0.36 0.07 -1.07 -0.15
Resource efficiency 0.13 0.02 0.07 -0.03 -0.03 0.02 0.04 0.01
Environmental management -0.33 * -0.01 -0.23 -0.02 -0.21 *** -0.01 -0.05 -0.03 *** Environmental products -0.08 -0.01 0.24 * 0.01 0.09 -0.02 0.03 -0.01 * Ecologically sourced products 1.57 ** -0.04 1.63 *** -0.07 0.99 *** 0.00 0.61 ** -0.02
Environmental impact reduction -0.03 -0.01 -0.05 0.01 -0.05 0.00 -0.01 0.00
Green initiatives 0.25 -0.05 *** 0.37 * -0.03 -0.04 -0.01 -0.09 0.00
Employee career opportunities -0.03 0.00 -0.13 0.02 -0.09 * 0.00 -0.04 0.00
Health & Safety management -0.39 ** -0.02 0.06 -0.01 -0.06 -0.01 -0.04 0.00
Workforce general -0.35 * 0.01 -0.12 0.02 0.11 0.02 -0.04 -0.02
Human Rights 0.05 0.00 0.04 -0.01 0.06 -0.01 0.05 0.00
Business ethics -0.08 -0.01 0.10 -0.01 -0.07 0.01 -0.01 0.00
Emerging market development -1.23 0.09 -0.61 0.15 0.38 -0.17 0.36 0.01
Responsible products 0.14 -0.01 -0.02 -0.06 * 0.19 0.00 0.20 0.01
Management syst. & Cert. 0.06 0.01 0.25 0.02 0.01 -0.01 -0.12 0.01
Consumer relations 0.15 0.02 -0.25 -0.01 0.05 0.02 -0.02 0.02
Management governance -0.23 *** -0.01 ** -0.05 0.01 -0.18 *** 0.00 -0.11 *** 0.00
Shareholders relations -0.10 -0.04 *** -0.04 0.01 -0.17 ** 0.00 -0.17 *** 0.00
Governance controversies -0.49 -0.02 -0.64 0.05 -0.10 0.03 0.08 0.02
Consumer controversies 0.10 -0.02 0.03 -0.05 0.08 -0.06 0.09 -0.04
Business Ethics Controversies -0.14 0.03 * -0.30 * 0.01 -0.07 0.03 -0.04 0.04 *** Environment & Social Contr. -0.93 0.01 0.03 0.11 * -0.40 * 0.01 -0.17 0.00
Within R-squared 14.1% 11.7% 2.6% 3.7% 17.6% 4.3% 10.8% 6.2% Observations 5240 5182 5228 5228 5193 5193 5258 5258 Cross-sectional units 635 630 634 634 634 634 635 635 Time-series length 12 12 12 12 12 12 12 12 In favour of CS business case % 20% 100% 100% 100% 33% - 33% 100%
In favour of CS business case % is the count of significant (at least at the 10 % level) variables that are in line with a positive CSP - CFP relationship, i.e. that a negative sign is obtained for the controversy factors or a positive sign for the environmental, social and governance factors, divided by the number of CSP factors with significant results. "*" = significant at 10 %; "**" = significant at 5 %; "***" = significant at 1 %
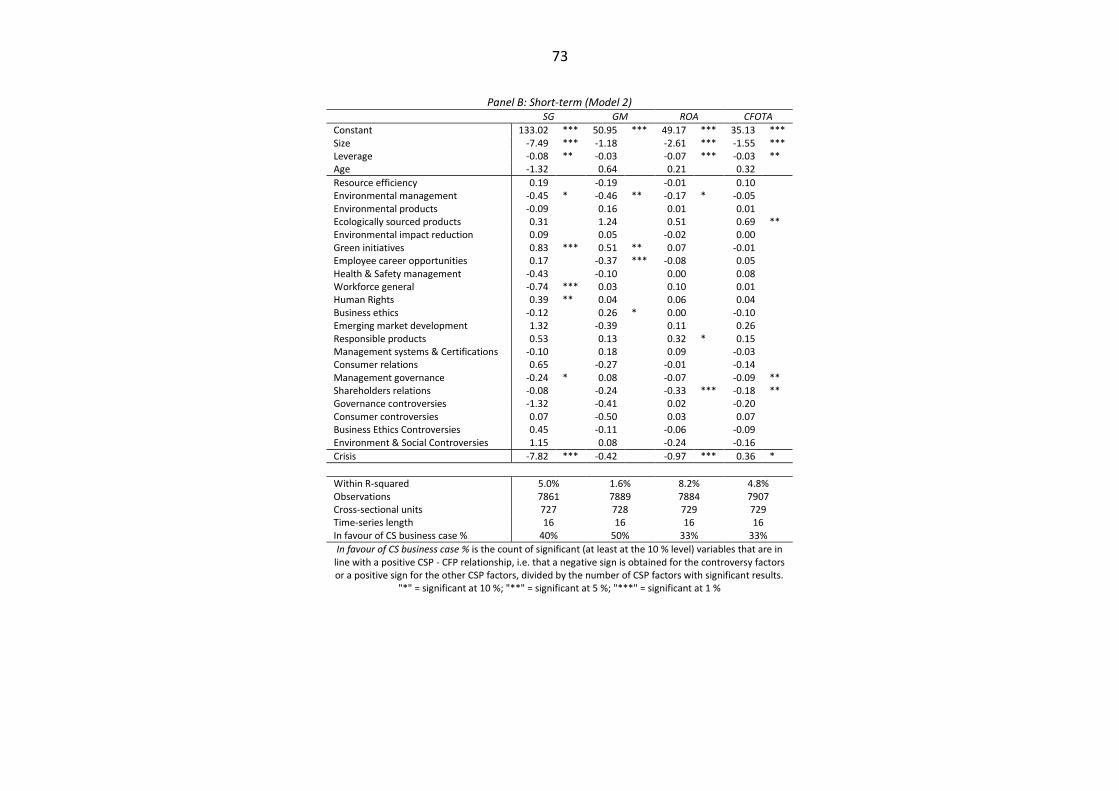
73
Panel B: Short-term (Model 2) SG GM ROA CFOTA
Constant 133.02 *** 50.95 *** 49.17 *** 35.13 *** Size -7.49 *** -1.18 -2.61 *** -1.55 *** Leverage -0.08 ** -0.03 -0.07 *** -0.03 ** Age -1.32 0.64 0.21 0.32
Resource efficiency 0.19 -0.19 -0.01 0.10
Environmental management -0.45 * -0.46 ** -0.17 * -0.05
Environmental products -0.09 0.16 0.01 0.01
Ecologically sourced products 0.31 1.24 0.51 0.69 ** Environmental impact reduction 0.09 0.05 -0.02 0.00
Green initiatives 0.83 *** 0.51 ** 0.07 -0.01
Employee career opportunities 0.17 -0.37 *** -0.08 0.05
Health & Safety management -0.43 -0.10 0.00 0.08
Workforce general -0.74 *** 0.03 0.10 0.01
Human Rights 0.39 ** 0.04 0.06 0.04
Business ethics -0.12 0.26 * 0.00 -0.10
Emerging market development 1.32 -0.39 0.11 0.26
Responsible products 0.53 0.13 0.32 * 0.15
Management systems & Certifications -0.10 0.18 0.09 -0.03
Consumer relations 0.65 -0.27 -0.01 -0.14
Management governance -0.24 * 0.08 -0.07 -0.09 ** Shareholders relations -0.08 -0.24 -0.33 *** -0.18 ** Governance controversies -1.32 -0.41 0.02 -0.20
Consumer controversies 0.07 -0.50 0.03 0.07
Business Ethics Controversies 0.45 -0.11 -0.06 -0.09
Environment & Social Controversies 1.15 0.08 -0.24 -0.16
Crisis -7.82 *** -0.42 -0.97 *** 0.36 *
Within R-squared 5.0% 1.6% 8.2% 4.8% Observations 7861 7889 7884 7907 Cross-sectional units 727 728 729 729 Time-series length 16 16 16 16 In favour of CS business case % 40% 50% 33% 33%
In favour of CS business case % is the count of significant (at least at the 10 % level) variables that are in line with a positive CSP - CFP relationship, i.e. that a negative sign is obtained for the controversy factors or a positive sign for the other CSP factors, divided by the number of CSP factors with significant results.
"*" = significant at 10 %; "**" = significant at 5 %; "***" = significant at 1 %

74
Panel C: Over time (Model 3) SG GM ROA CFOTA
M3 M3.1 M3 M3.1 M3 M3.1 M3 M3.1
Constant -56.772 ** 32.757 ** 11.519 30.135 *** Size 5.997 *** -0.353 -0.189 -1.214 ** Leverage -0.163 *** -0.064 ** -0.164 *** -0.097 *** Age -4.728 ** 1.393 0.611 0.529
Resource efficiency 2002-07 -1.716 *** -0.528 -0.362 * 0.040 2008-13 0.015 *** -0.492 ** 0.115 ** 0.042 2014-18 0.330 *** -0.038 -0.035 0.040 Environmental management 2002-07 0.307 0.034 0.070 0.074 2008-13 0.142 -0.594 *** *** -0.076 -0.085 2014-18 -0.851 ** ** -0.393 -0.331 ** ** -0.068 Environmental products 2002-07 -0.654 -0.274 0.121 0.140 2008-13 -0.510 * -0.089 -0.043 -0.005 2014-18 0.110 * 0.341 * 0.080 0.072 Ecologically sourced products 2002-07 -0.104 1.091 0.154 0.361 2008-13 -0.268 0.309 0.040 0.069 2014-18 2.049 ** * 2.526 *** 1.114 ** * 1.082 *** Environmental impact reduction 2002-07 -0.398 -0.001 -0.039 -0.016 2008-13 0.223 ** -0.061 -0.147 ** -0.048 2014-18 0.081 0.190 0.128 0.115 Green initiatives 2002-07 0.101 0.173 0.684 ** 0.485 * 2008-13 0.728 0.320 0.165 * -0.056 *
2014-18 0.745 * 0.666 * 0.163 -0.176 *
Employee career opportunities 2002-07 -0.192 -0.547 *** -0.069 -0.065 2008-13 -0.470 0.084 ** 0.138 0.222 * **
2014-18 -1.242 *** ** 0.465 ** -0.100 -0.171 Health & Safety management 2002-07 0.239 0.679 *** 0.417 *** 0.201 * 2008-13 -1.361 * ** -0.205 ** 0.037 * 0.135 2014-18 -1.112 * ** -1.219 ** *** 0.000 * 0.156 Workforce general 2002-07 -0.169 -0.066 -0.334 * -0.125 2008-13 -0.352 0.231 -0.003 * 0.049 2014-18 -0.013 -0.126 0.240 ** 0.036 Human Rights 2002-07 0.228 0.058 0.130 0.016 2008-13 0.233 0.050 0.030 -0.022 2014-18 0.110 -0.123 -0.095 0.089 Business ethics 2002-07 -0.093 0.225 -0.075 -0.115 2008-13 0.434 0.444 *** 0.219 ** ** 0.063 *
2014-18 -0.152 0.332 -0.036 -0.081 Emerging market development 2002-07 -2.189 -1.112 -0.053 -0.052 2008-13 -3.414 -0.574 0.186 0.726 2014-18 -1.559 -1.253 -0.463 -0.505 Responsible products 2002-07 1.425 * -0.472 -0.156 -0.308 2008-13 0.875 * 0.469 * 0.520 *** *** 0.274 * **
2014-18 0.505 -0.039 0.150 0.177 Management systems & certifications 2002-07 0.122 0.040 0.287 0.362 ** 2008-13 -0.265 0.182 0.130 -0.089 **
2014-18 -0.603 0.628 0.369 * 0.069

75
7.2 Results for the basic materials sector
Panel A of table 7 presents the results for 83 companies in the basic materials sector14,
using model 1. Size has the expected positive impact on the operative measures and
reduces ROA risk. Larger firms within this sector however, tend to have a slightly higher
sales growth risk than smaller firms. The results that are significant for the leverage and
14 Companies in this economic sector operate with chemicals, construction materials, containers & packaging, metals & mining or paper & forest products.
Consumer relations 2002-07 0.475 0.419 0.306 0.014 2008-13 0.191 -0.293 0.056 -0.100 2014-18 1.122 -0.543 0.092 -0.223 Management governance 2002-07 0.002 0.280 *** 0.057 -0.014 2008-13 -0.287 0.332 *** -0.040 ** -0.031 2014-18 0.103 -0.062 *** -0.017 -0.005 Shareholder relations 2002-07 0.202 -0.020 -0.083 -0.063 2008-13 -0.116 -0.661 *** ** -0.409 *** ** -0.352 *** **
2014-18 -0.090 0.643 -0.562 *** ** -0.485 *** **
Governance controversies 2002-07 -3.078 ** -1.820 * -1.651 *** -0.125 2008-13 1.102 * 1.178 ** 0.407 *** 0.260 2014-18 -4.398 ** -1.473 -1.090 -1.305 ** *
Consumer controversies 2002-07 1.397 0.559 -0.136 -0.174 2008-13 0.998 -0.881 * -0.560 * -0.509 ** 2014-18 0.775 -0.637 0.334 0.517 Business Ethics Controversies 2002-07 -0.264 -0.912 ** -0.404 * -0.289 2008-13 1.196 * 0.362 *** 0.226 * ** -0.154 2014-18 -0.351 -0.440 0.062 -0.389 *** Environmental & Social Controversies 2002-07 4.822 * 0.803 2.122 * 1.225 * 2008-13 0.615 0.378 0.344 0.262 2014-18 0.926 0.027 -0.962 * ** -0.305 *
Within R-squared 4.9% 4.9% 12.6% 8.9%
Observations 8487 8580 8571 8599
Cross-sectional units 786 792 792 792
Time-series length 17 17 17 17 In favour of CS business case 2002-07
50% 80% 71% 75%
In favour of CS business case 2008-13
25% 50% 50% 75%
In favour of CS business case 2014-18
50% 67% 60% 75%
In favour of CS business case % is the count of significant (at least at the 10 % level) variables that are in line with a positive CSP - CFP relationship, i.e. that a negative sign is obtained for the controversy factors or a positive sign for the other CSP factors, divided by the
number of CSP factors with significant results. Columns denoted M3 show the level of significance for model 3, i.e. whether the estimated coefficients are statistically significantly different from 0. Columns denoted M3.1 show whether the CSP-CFP relationship has changed significantly compared to the base period 2002-2007, i.e. whether the change in the relationship compared to the base period
is statistically significant. "*" = significant at 10 %; "**" = significant at 5 %; "***" = significant at 1 %

76
age variables are also in line with previous research. The R-squared values are quite high,
with almost 43 percent of the variability in ROA_5 explained by the model.
For the long-term operative measures, a total of 17 significant results were obtained, of
which 7 (i.e. 41 %) are in favour of a positive impact of CSP on CFP. Of the risk measures,
6 out of a total of 7 significant results were in line with hypothesis 2, that CSP reduces
firm risk. Environmental management for instance has a negative impact on 3 of the 4
operative measures but decreases the firm risk for 3 out of the 4 risk measures.
Environmental products and environmental & social controversies seem to be other
important factors in the basic materials sector, with statistically and economically
significant results for a plurality of the dependent variables, all of which support the
proposed hypotheses. That especially the environmental factors are of importance in this
economic sector is expected, as discussed in section 5.4.
Management systems & certifications is apparently an important factor for sales growth,
with a positive impact. Employee career opportunities, responsible products, resource
efficiency, human rights and management governance on the other hand have a
negative impact on at least one of the firm operational performance and risk measures.
The emerging market development, governance controversies and consumer
controversies factors are excluded due to that they do not meet the requirement of a
minimum of 20 positive observations for the variable in question.
Panel B of table 7 shows the short-term results, using model 2. Again, size has a negative
impact on CFP in the short-term. Both for ROA and CFOTA, leverage has a negative sign
in line with the results of e.g. Suto and Takehara (2016), and Waddock and Graves (1997).
Age is significant only for the sales growth variable, for which it has the anticipated
negative sign.
In the short-term, there are quite few significant results for the CSP factors. Only
management governance and employee career opportunities affect more than one of
the CFP measures, all with a negative impact. Worth mentioning is also the human rights
factor, which has an economically and statistically significant (at the 5 % level) positive
impact on short-term sales growth. Additionally, the crisis dummy is strongly negative
for three of the four performance measures.

77
Table 7 Results for the basic materials sector
Panel A: Long-term (Model 1) SG_5 SG_RISK GM_5 GM_RISK ROA_5 ROA_RISK CFOTA_5 CFOTA_RISK
Constant -77.15 ** -2.25 0.28 0.40 -26.25 9.02 *** 7.83 -2.94
Size 8.74 *** 0.36 * 1.97 0.08 3.09 ** -0.47 *** 0.96 * 0.16
Leverage -0.08 0.01 *** -0.08 * 0.00 -0.12 *** 0.00 -0.10 *** 0.00
Age -13.39 ** -0.13 0.53 -0.12 -2.32 -0.07 -2.41 * 0.43
Resource efficiency 0.68 0.09 * -0.44 -0.06 -0.02 0.02 -0.13 0.04
Environmental management -0.55 -0.05 * -0.59 * -0.05 -0.49 *** -0.06 ** -0.24 ** -0.07 *** Environmental products 0.20 -0.06 ** 0.54 ** -0.01 0.59 *** 0.00 0.19 -0.02
Ecologically sourced products -2.46 -0.03 0.96 0.15 0.16 0.03 -0.06 0.12
Environmental impact reduction 0.25 -0.03 0.05 -0.01 -0.12 0.00 -0.05 -0.01
Green initiatives 1.16 0.03 0.19 -0.17 * 0.03 -0.02 -0.04 0.03
Employee career opportunities -0.62 * 0.02 -0.57 ** 0.05 -0.41 ** -0.01 -0.19 0.00
Health & Safety management -0.19 0.01 0.32 -0.03 0.22 0.01 0.30 * -0.02
Workforce general 0.02 0.03 -0.16 -0.03 -0.21 0.05 0.08 0.00
Human Rights 0.13 -0.03 -0.15 -0.03 -0.22 * 0.01 -0.16 -0.03
Business ethics -0.14 0.03 0.03 -0.02 -0.02 0.00 -0.11 0.00
Emerging market development - - - - - - - -
Responsible products -1.87 * -0.04 0.89 -0.08 0.61 0.01 0.53 -0.03
Management systems & Certifications 1.83 ** -0.03 -0.08 0.01 0.02 -0.08 -0.18 -0.01
Consumer relations -0.92 0.08 0.00 -0.02 0.61 -0.04 0.10 -0.01
Management governance 0.13 -0.01 -0.26 ** 0.02 -0.16 ** 0.00 -0.06 0.00
Shareholders relations -0.07 -0.03 0.53 0.00 -0.05 -0.04 0.11 -0.01
Governance controversies - - - - - - - -
Consumer controversies - - - - - - - -
Business Ethics Controversies -0.24 0.04 0.45 -0.09 0.00 0.02 -0.03 0.01
Environmental & social controversies -1.96 * -0.10 -0.68 0.22 *** -1.47 ** 0.06 -0.57 * 0.02
Within R-squared 15.2% 20.2% 13.9% 8.5% 42.6% 19.8% 28.6% 18.0% Observations 642 638 637 637 637 637 642 642 Cross-sectional units 83 83 83 83 83 83 83 83 Time-series length 12 12 12 12 12 12 12 12 In favour of CS business case % 50% 67% 25% 100% 33% 100% 67% 100%
In favour of CS business case % is the count of significant (at least at the 10 % level) variables that are in line with a positive CSP - CFP relationship, i.e. that a negative sign is obtained for the controversy factors or a positive sign for the other CSP factors, divided by the number of CSP factors with significant results. "*" = significant at 10 %; "**" = significant at 5 %; "***" = significant at 1 %
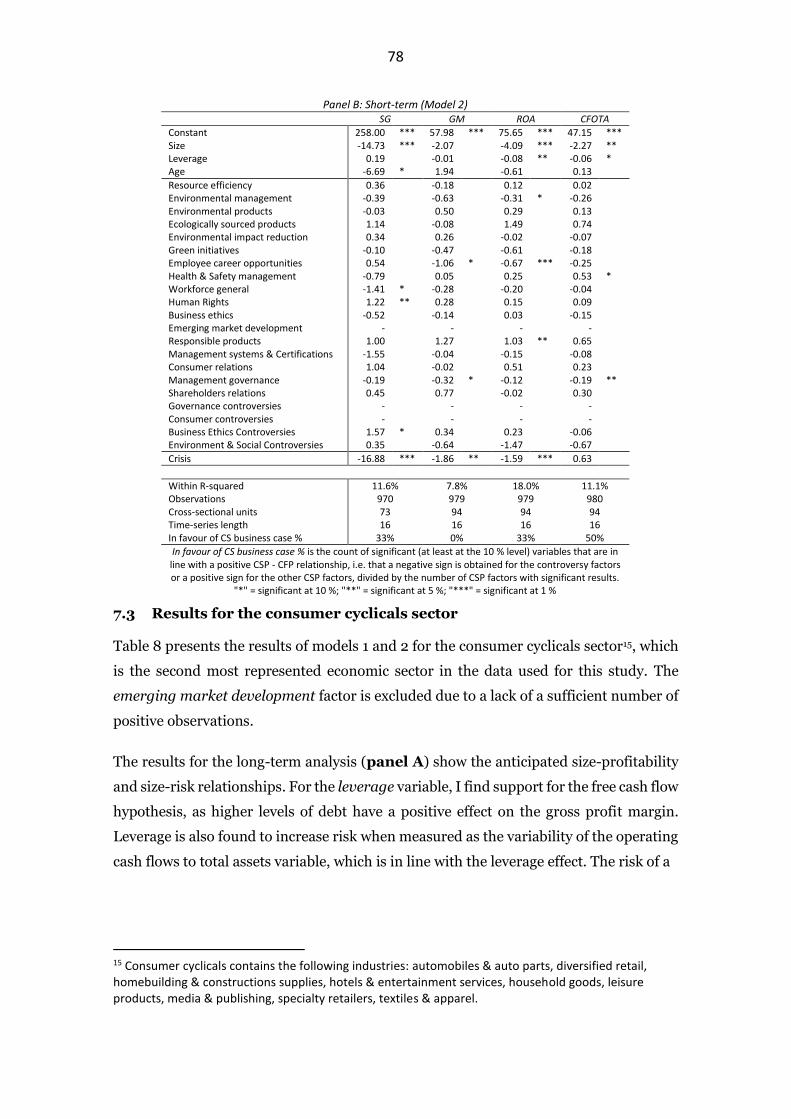
78
7.3 Results for the consumer cyclicals sector
Table 8 presents the results of models 1 and 2 for the consumer cyclicals sector15, which
is the second most represented economic sector in the data used for this study. The
emerging market development factor is excluded due to a lack of a sufficient number of
positive observations.
The results for the long-term analysis (panel A) show the anticipated size-profitability
and size-risk relationships. For the leverage variable, I find support for the free cash flow
hypothesis, as higher levels of debt have a positive effect on the gross profit margin.
Leverage is also found to increase risk when measured as the variability of the operating
cash flows to total assets variable, which is in line with the leverage effect. The risk of a
15 Consumer cyclicals contains the following industries: automobiles & auto parts, diversified retail, homebuilding & constructions supplies, hotels & entertainment services, household goods, leisure products, media & publishing, specialty retailers, textiles & apparel.
Panel B: Short-term (Model 2) SG GM ROA CFOTA
Constant 258.00 *** 57.98 *** 75.65 *** 47.15 *** Size -14.73 *** -2.07 -4.09 *** -2.27 ** Leverage 0.19 -0.01 -0.08 ** -0.06 * Age -6.69 * 1.94 -0.61 0.13
Resource efficiency 0.36 -0.18 0.12 0.02
Environmental management -0.39 -0.63 -0.31 * -0.26
Environmental products -0.03 0.50 0.29 0.13
Ecologically sourced products 1.14 -0.08 1.49 0.74
Environmental impact reduction 0.34 0.26 -0.02 -0.07
Green initiatives -0.10 -0.47 -0.61 -0.18
Employee career opportunities 0.54 -1.06 * -0.67 *** -0.25
Health & Safety management -0.79 0.05 0.25 0.53 * Workforce general -1.41 * -0.28 -0.20 -0.04
Human Rights 1.22 ** 0.28 0.15 0.09
Business ethics -0.52 -0.14 0.03 -0.15
Emerging market development - - - -
Responsible products 1.00 1.27 1.03 ** 0.65
Management systems & Certifications -1.55 -0.04 -0.15 -0.08
Consumer relations 1.04 -0.02 0.51 0.23
Management governance -0.19 -0.32 * -0.12 -0.19 ** Shareholders relations 0.45 0.77 -0.02 0.30
Governance controversies - - - -
Consumer controversies - - - -
Business Ethics Controversies 1.57 * 0.34 0.23 -0.06
Environment & Social Controversies 0.35 -0.64 -1.47 -0.67
Crisis -16.88 *** -1.86 ** -1.59 *** 0.63
Within R-squared 11.6% 7.8% 18.0% 11.1% Observations 970 979 979 980 Cross-sectional units 73 94 94 94 Time-series length 16 16 16 16 In favour of CS business case % 33% 0% 33% 50%
In favour of CS business case % is the count of significant (at least at the 10 % level) variables that are in line with a positive CSP - CFP relationship, i.e. that a negative sign is obtained for the controversy factors or a positive sign for the other CSP factors, divided by the number of CSP factors with significant results.
"*" = significant at 10 %; "**" = significant at 5 %; "***" = significant at 1 %

79
Table 8 Results for the consumer cyclicals sector
Panel A: Long-term (Model 1) SG_5 SG_RISK GM_5 GM_RISK ROA_5 ROA_RISK CFOTA_5 CFOTA_RISK
Constant -213.18 *** 0.94 29.60 10.95 *** -23.87 8.61 *** 10.91 3.68
Size 13.20 *** 0.21 -0.60 -0.32 * 1.03 -0.36 ** -0.22 -0.05
Leverage 0.01 0.00 0.09 * 0.00 -0.04 0.00 -0.02 0.01 **
Age 3.74 -0.36 3.16 -1.44 *** 4.60 * -0.57 1.36 -0.55 *
Resource efficiency 0.03 -0.01 0.02 -0.07 * -0.20 0.02 -0.01 0.01
Environmental management -0.42 -0.01 0.21 -0.05 -0.13 0.06 * -0.01 -0.05 *
Environmental products 0.51 * 0.00 -0.14 -0.02 0.21 -0.04 ** 0.04 -0.03
Ecologically sourced products 1.04 -0.02 0.75 -0.06 -0.13 0.12 -0.27 0.01
Environmental impact reduction 0.28 -0.01 0.01 0.02 -0.05 -0.02 -0.05 -0.01
Green initiatives -0.73 * -0.12 *** 0.69 0.00 -0.12 0.05 -0.10 0.01
Employee career opportunities 0.17 0.00 -0.03 0.00 -0.17 0.01 0.05 0.01
Health & Safety management -0.93 *** -0.01 0.24 0.01 -0.30 * 0.00 -0.19 -0.03
Workforce general -0.19 0.04 -0.87 ** 0.00 0.28 -0.01 0.01 -0.04
Human Rights -0.13 -0.02 0.23 -0.03 0.17 0.00 0.08 0.01
Business ethics -0.22 0.01 -0.08 -0.02 0.00 0.00 0.10 0.03 *
Emerging market development - - - - - - - -
Responsible products -0.04 -0.02 0.41 -0.02 -0.15 0.02 0.20 0.02
Management systems & Certifications -0.50 0.03 1.09 ** 0.04 0.02 -0.02 -0.19 0.00
Consumer relations 0.04 0.10 -1.00 0.12 -0.22 0.02 -0.29 0.06
Management governance 0.12 0.00 0.16 0.00 -0.05 0.00 -0.08 0.01
Shareholders relations 0.28 -0.07 *** -0.40 0.06 * 0.01 -0.01 -0.07 -0.02
Governance controversies -1.26 0.00 -1.25 0.00 0.33 -0.21 *** 0.34 -0.08
Consumer controversies -1.54 -0.16 -0.32 -0.11 -0.23 -0.18 -0.16 -0.16 *
Business Ethics Controversies 0.01 0.03 -1.22 ** -0.06 0.13 0.06 0.32 * 0.06
Environmental & Social Controversies 1.40 0.10 0.55 -0.08 0.16 0.06 -0.01 0.12 *
Within R-squared 23.5% 15.9% 9.1% 9.4% 7.7% 10.1% 4.3% 9.0%
Observations 1169 1155 1171 1171 1150 1150 1177 1177
Cross-sectional units 135 134 134 134 135 135 135 135
Time-series length 12 12 12 12 12 12 12 12
In favour of CS business case % 33% 100% 67% 50% 0% 33% 0% 50%
In favour of CS business case % is the count of significant (at least at the 10 % level) variables that are in line with a positive CSP - CFP relationship, i.e. that a negative sign is obtained for the controversy factors or a positive sign for the other CSP factors, divided by the number of CSP factors with significant results. "*" = significant at 10 %; "**" = significant at 5 %; "***" = significant at 1 %
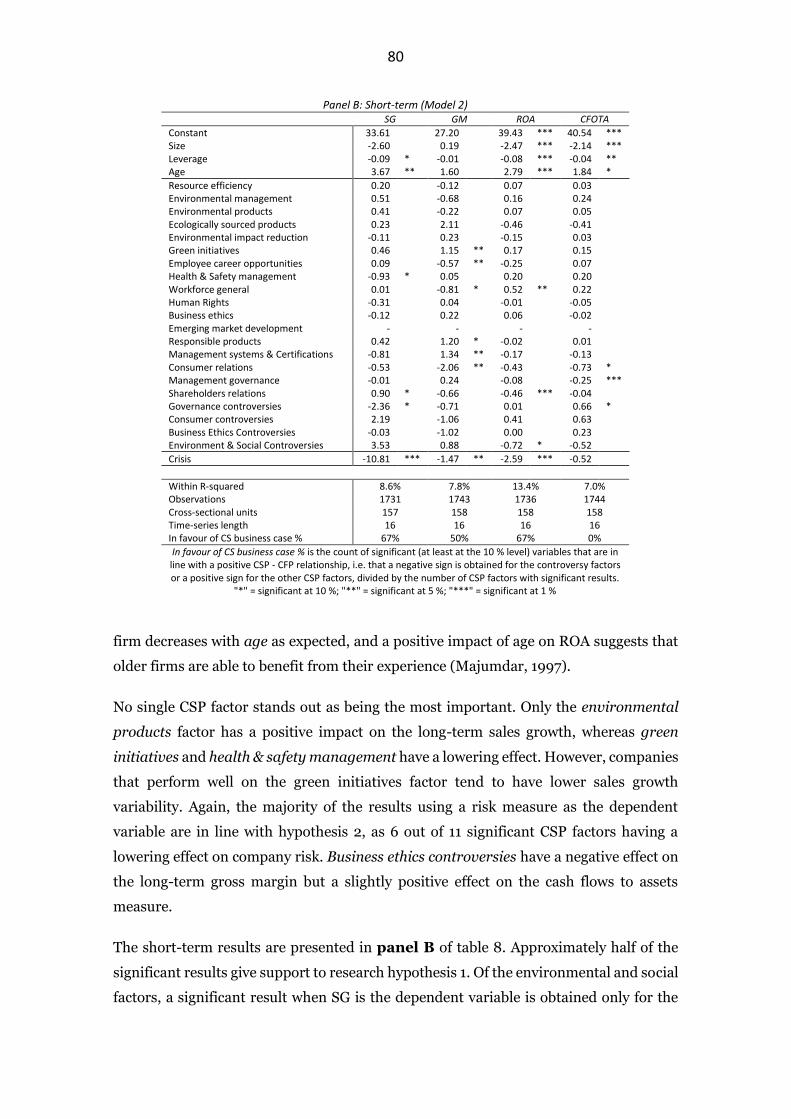
80
firm decreases with age as expected, and a positive impact of age on ROA suggests that
older firms are able to benefit from their experience (Majumdar, 1997).
No single CSP factor stands out as being the most important. Only the environmental
products factor has a positive impact on the long-term sales growth, whereas green
initiatives and health & safety management have a lowering effect. However, companies
that perform well on the green initiatives factor tend to have lower sales growth
variability. Again, the majority of the results using a risk measure as the dependent
variable are in line with hypothesis 2, as 6 out of 11 significant CSP factors having a
lowering effect on company risk. Business ethics controversies have a negative effect on
the long-term gross margin but a slightly positive effect on the cash flows to assets
measure.
The short-term results are presented in panel B of table 8. Approximately half of the
significant results give support to research hypothesis 1. Of the environmental and social
factors, a significant result when SG is the dependent variable is obtained only for the
Panel B: Short-term (Model 2) SG GM ROA CFOTA
Constant 33.61 27.20 39.43 *** 40.54 *** Size -2.60 0.19 -2.47 *** -2.14 *** Leverage -0.09 * -0.01 -0.08 *** -0.04 ** Age 3.67 ** 1.60 2.79 *** 1.84 *
Resource efficiency 0.20 -0.12 0.07 0.03
Environmental management 0.51 -0.68 0.16 0.24
Environmental products 0.41 -0.22 0.07 0.05
Ecologically sourced products 0.23 2.11 -0.46 -0.41
Environmental impact reduction -0.11 0.23 -0.15 0.03
Green initiatives 0.46 1.15 ** 0.17 0.15
Employee career opportunities 0.09 -0.57 ** -0.25 0.07
Health & Safety management -0.93 * 0.05 0.20 0.20
Workforce general 0.01 -0.81 * 0.52 ** 0.22
Human Rights -0.31 0.04 -0.01 -0.05
Business ethics -0.12 0.22 0.06 -0.02
Emerging market development - - - -
Responsible products 0.42 1.20 * -0.02 0.01
Management systems & Certifications -0.81 1.34 ** -0.17 -0.13
Consumer relations -0.53 -2.06 ** -0.43 -0.73 * Management governance -0.01 0.24 -0.08 -0.25 *** Shareholders relations 0.90 * -0.66 -0.46 *** -0.04
Governance controversies -2.36 * -0.71 0.01 0.66 * Consumer controversies 2.19 -1.06 0.41 0.63
Business Ethics Controversies -0.03 -1.02 0.00 0.23
Environment & Social Controversies 3.53 0.88 -0.72 * -0.52
Crisis -10.81 *** -1.47 ** -2.59 *** -0.52
Within R-squared 8.6% 7.8% 13.4% 7.0% Observations 1731 1743 1736 1744 Cross-sectional units 157 158 158 158 Time-series length 16 16 16 16 In favour of CS business case % 67% 50% 67% 0%
In favour of CS business case % is the count of significant (at least at the 10 % level) variables that are in line with a positive CSP - CFP relationship, i.e. that a negative sign is obtained for the controversy factors or a positive sign for the other CSP factors, divided by the number of CSP factors with significant results.
"*" = significant at 10 %; "**" = significant at 5 %; "***" = significant at 1 %
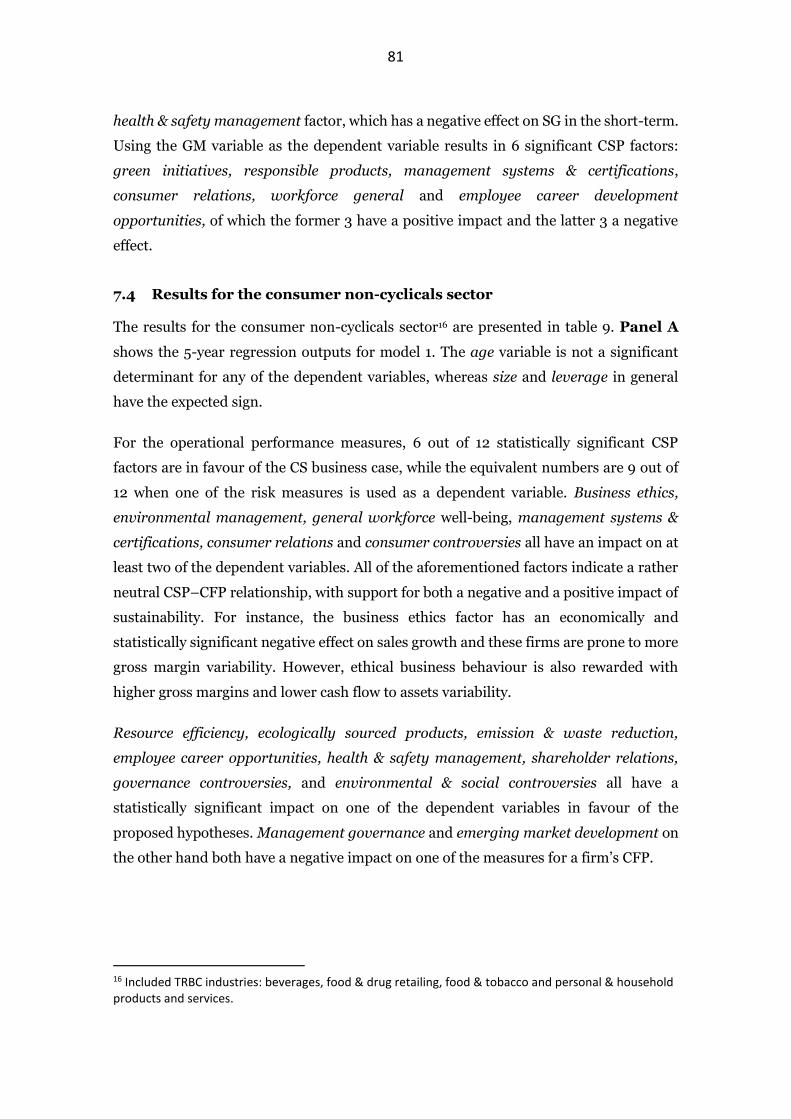
81
health & safety management factor, which has a negative effect on SG in the short-term.
Using the GM variable as the dependent variable results in 6 significant CSP factors:
green initiatives, responsible products, management systems & certifications,
consumer relations, workforce general and employee career development
opportunities, of which the former 3 have a positive impact and the latter 3 a negative
effect.
7.4 Results for the consumer non-cyclicals sector
The results for the consumer non-cyclicals sector16 are presented in table 9. Panel A
shows the 5-year regression outputs for model 1. The age variable is not a significant
determinant for any of the dependent variables, whereas size and leverage in general
have the expected sign.
For the operational performance measures, 6 out of 12 statistically significant CSP
factors are in favour of the CS business case, while the equivalent numbers are 9 out of
12 when one of the risk measures is used as a dependent variable. Business ethics,
environmental management, general workforce well-being, management systems &
certifications, consumer relations and consumer controversies all have an impact on at
least two of the dependent variables. All of the aforementioned factors indicate a rather
neutral CSP–CFP relationship, with support for both a negative and a positive impact of
sustainability. For instance, the business ethics factor has an economically and
statistically significant negative effect on sales growth and these firms are prone to more
gross margin variability. However, ethical business behaviour is also rewarded with
higher gross margins and lower cash flow to assets variability.
Resource efficiency, ecologically sourced products, emission & waste reduction,
employee career opportunities, health & safety management, shareholder relations,
governance controversies, and environmental & social controversies all have a
statistically significant impact on one of the dependent variables in favour of the
proposed hypotheses. Management governance and emerging market development on
the other hand both have a negative impact on one of the measures for a firm’s CFP.
16 Included TRBC industries: beverages, food & drug retailing, food & tobacco and personal & household products and services.
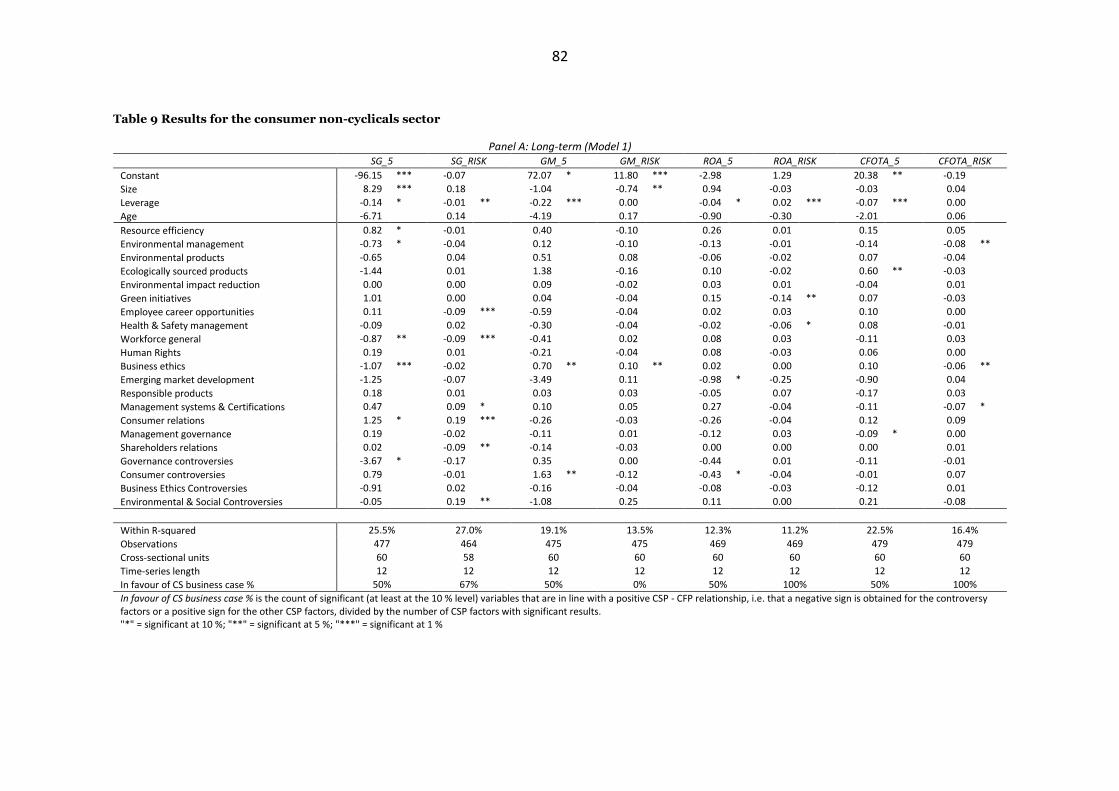
82
Table 9 Results for the consumer non-cyclicals sector
Panel A: Long-term (Model 1) SG_5 SG_RISK GM_5 GM_RISK ROA_5 ROA_RISK CFOTA_5 CFOTA_RISK
Constant -96.15 *** -0.07 72.07 * 11.80 *** -2.98 1.29 20.38 ** -0.19
Size 8.29 *** 0.18 -1.04 -0.74 ** 0.94 -0.03 -0.03 0.04
Leverage -0.14 * -0.01 ** -0.22 *** 0.00 -0.04 * 0.02 *** -0.07 *** 0.00
Age -6.71 0.14 -4.19 0.17 -0.90 -0.30 -2.01 0.06
Resource efficiency 0.82 * -0.01 0.40 -0.10 0.26 0.01 0.15 0.05
Environmental management -0.73 * -0.04 0.12 -0.10 -0.13 -0.01 -0.14 -0.08 **
Environmental products -0.65 0.04 0.51 0.08 -0.06 -0.02 0.07 -0.04
Ecologically sourced products -1.44 0.01 1.38 -0.16 0.10 -0.02 0.60 ** -0.03
Environmental impact reduction 0.00 0.00 0.09 -0.02 0.03 0.01 -0.04 0.01
Green initiatives 1.01 0.00 0.04 -0.04 0.15 -0.14 ** 0.07 -0.03
Employee career opportunities 0.11 -0.09 *** -0.59 -0.04 0.02 0.03 0.10 0.00
Health & Safety management -0.09 0.02 -0.30 -0.04 -0.02 -0.06 * 0.08 -0.01
Workforce general -0.87 ** -0.09 *** -0.41 0.02 0.08 0.03 -0.11 0.03
Human Rights 0.19 0.01 -0.21 -0.04 0.08 -0.03 0.06 0.00
Business ethics -1.07 *** -0.02 0.70 ** 0.10 ** 0.02 0.00 0.10 -0.06 **
Emerging market development -1.25 -0.07 -3.49 0.11 -0.98 * -0.25 -0.90 0.04
Responsible products 0.18 0.01 0.03 0.03 -0.05 0.07 -0.17 0.03
Management systems & Certifications 0.47 0.09 * 0.10 0.05 0.27 -0.04 -0.11 -0.07 *
Consumer relations 1.25 * 0.19 *** -0.26 -0.03 -0.26 -0.04 0.12 0.09
Management governance 0.19 -0.02 -0.11 0.01 -0.12 0.03 -0.09 * 0.00
Shareholders relations 0.02 -0.09 ** -0.14 -0.03 0.00 0.00 0.00 0.01
Governance controversies -3.67 * -0.17 0.35 0.00 -0.44 0.01 -0.11 -0.01
Consumer controversies 0.79 -0.01 1.63 ** -0.12 -0.43 * -0.04 -0.01 0.07
Business Ethics Controversies -0.91 0.02 -0.16 -0.04 -0.08 -0.03 -0.12 0.01
Environmental & Social Controversies -0.05 0.19 ** -1.08 0.25 0.11 0.00 0.21 -0.08
Within R-squared 25.5% 27.0% 19.1% 13.5% 12.3% 11.2% 22.5% 16.4%
Observations 477 464 475 475 469 469 479 479
Cross-sectional units 60 58 60 60 60 60 60 60
Time-series length 12 12 12 12 12 12 12 12
In favour of CS business case % 50% 67% 50% 0% 50% 100% 50% 100%
In favour of CS business case % is the count of significant (at least at the 10 % level) variables that are in line with a positive CSP - CFP relationship, i.e. that a negative sign is obtained for the controversy factors or a positive sign for the other CSP factors, divided by the number of CSP factors with significant results. "*" = significant at 10 %; "**" = significant at 5 %; "***" = significant at 1 %
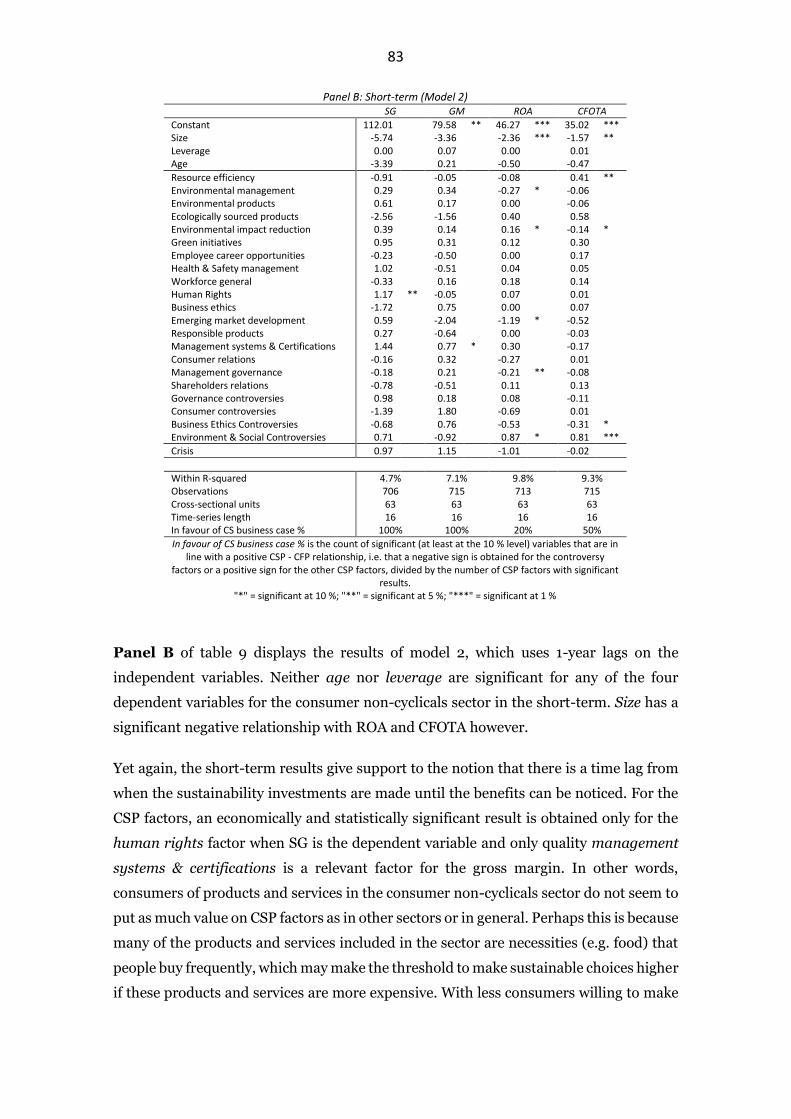
83
Panel B of table 9 displays the results of model 2, which uses 1-year lags on the
independent variables. Neither age nor leverage are significant for any of the four
dependent variables for the consumer non-cyclicals sector in the short-term. Size has a
significant negative relationship with ROA and CFOTA however.
Yet again, the short-term results give support to the notion that there is a time lag from
when the sustainability investments are made until the benefits can be noticed. For the
CSP factors, an economically and statistically significant result is obtained only for the
human rights factor when SG is the dependent variable and only quality management
systems & certifications is a relevant factor for the gross margin. In other words,
consumers of products and services in the consumer non-cyclicals sector do not seem to
put as much value on CSP factors as in other sectors or in general. Perhaps this is because
many of the products and services included in the sector are necessities (e.g. food) that
people buy frequently, which may make the threshold to make sustainable choices higher
if these products and services are more expensive. With less consumers willing to make
Panel B: Short-term (Model 2) SG GM ROA CFOTA
Constant 112.01 79.58 ** 46.27 *** 35.02 *** Size -5.74 -3.36 -2.36 *** -1.57 ** Leverage 0.00 0.07 0.00 0.01
Age -3.39 0.21 -0.50 -0.47
Resource efficiency -0.91 -0.05 -0.08 0.41 ** Environmental management 0.29 0.34 -0.27 * -0.06
Environmental products 0.61 0.17 0.00 -0.06
Ecologically sourced products -2.56 -1.56 0.40 0.58
Environmental impact reduction 0.39 0.14 0.16 * -0.14 * Green initiatives 0.95 0.31 0.12 0.30
Employee career opportunities -0.23 -0.50 0.00 0.17
Health & Safety management 1.02 -0.51 0.04 0.05
Workforce general -0.33 0.16 0.18 0.14
Human Rights 1.17 ** -0.05 0.07 0.01
Business ethics -1.72 0.75 0.00 0.07
Emerging market development 0.59 -2.04 -1.19 * -0.52
Responsible products 0.27 -0.64 0.00 -0.03
Management systems & Certifications 1.44 0.77 * 0.30 -0.17
Consumer relations -0.16 0.32 -0.27 0.01
Management governance -0.18 0.21 -0.21 ** -0.08
Shareholders relations -0.78 -0.51 0.11 0.13
Governance controversies 0.98 0.18 0.08 -0.11
Consumer controversies -1.39 1.80 -0.69 0.01
Business Ethics Controversies -0.68 0.76 -0.53 -0.31 * Environment & Social Controversies 0.71 -0.92 0.87 * 0.81 ***
Crisis 0.97 1.15 -1.01 -0.02
Within R-squared 4.7% 7.1% 9.8% 9.3% Observations 706 715 713 715 Cross-sectional units 63 63 63 63 Time-series length 16 16 16 16 In favour of CS business case % 100% 100% 20% 50%
In favour of CS business case % is the count of significant (at least at the 10 % level) variables that are in line with a positive CSP - CFP relationship, i.e. that a negative sign is obtained for the controversy
factors or a positive sign for the other CSP factors, divided by the number of CSP factors with significant results.
"*" = significant at 10 %; "**" = significant at 5 %; "***" = significant at 1 %

84
these responsible choices, the benefits of CS are also lower for companies in this sector
from a short-term perspective, and when one of the two asset utilization measures are
used as the dependent variable, only 3 out of 9 significant results for the CSP factors
indicate a positive CSP–CFP relationship.
7.5 Results for the energy sector
Looking at panel A of table 10, which shows the long-term results for the energy sector,
the size and leverage variables have their respective positive and negative impacts on the
operational measures, but no impact on firm risk. In other words, large firms with low
levels of debt compete at an advantage. Age is not found to be an important determinant
of the CFP measures used for this sample.
Companies in the energy sector are involved in the coal, oil & gas (plus related equipment
& services), or renewable energy industries. Consistent with research hypothesis 2, CSP
reduces firm risk in the majority of cases: 10 out of 17 significant CSP factors for the
operative risk measures support this notion. For the 5-year operational measures
however, only 29 percent (4/14) of the significant factors are in line with research
hypothesis 1.
Avoiding mishaps towards customers is of the outmost importance, as problems with the
products or services of an energy company can lead to significant losses in sales growth
and increased CFOTA variability. The well-being of the workforce on the other hand is
an important factor for the gross margin.
Panel B of table 10 shows the results for model 2 when applied to the energy sector. The
short-term impacts of CSP on CFP seem to be mainly negative for these companies.
Similarly to the long-term results, companies that have positive observations for the
consumer controversies factor are penalized hard. In the short-term however, the other
controversy factors have a positive impact on SG, so apparently any media attention,
irrelevant if it is good or bad, is good publicity for these companies as long as problems
with the company’s products or services are not revealed.

85
Table 10 Results for the energy sector
Panel A: Long-term (Model 1) SG_5 SG_RISK GM_5 GM_RISK ROA_5 ROA_RISK CFOTA_5 CFOTA_RISK
Constant -158.02 *** -1.09 -110.61 ** 0.71 -69.70 *** 3.44 -14.65 1.21
Size 14.38 *** 0.20 8.70 *** 0.01 5.73 *** -0.13 2.25 ** 0.03
Leverage -0.33 *** 0.00 -0.20 *** 0.00 -0.16 *** 0.01 * -0.12 *** 0.00
Age -11.03 0.33 6.55 0.08 -0.40 -0.17 -0.89 -0.03
Resource efficiency 0.09 -0.01 -0.37 -0.02 -0.29 0.12 *** 0.24 -0.01
Environmental management 0.64 0.03 0.89 -0.03 -0.03 0.01 -0.11 -0.01
Environmental products -0.24 0.05 ** 0.84 -0.07 * 0.18 0.02 -0.07 -0.02
Ecologically sourced products - - - - - - - -
Environmental impact reduction -1.19 ** -0.02 -0.79 * -0.01 -0.41 ** -0.02 0.01 -0.03 **
Green initiatives -0.80 -0.03 0.45 0.01 -0.31 0.03 -0.07 0.03
Employee career opportunities 0.31 -0.01 -0.26 0.02 0.17 0.02 0.13 0.01
Health & Safety management -0.61 -0.03 -1.32 0.05 -0.90 ** -0.08 ** -0.31 0.03
Workforce general 0.06 -0.09 ** 0.97 ** 0.02 0.23 -0.02 0.07 -0.03
Human Rights -0.93 0.00 -0.21 0.07 0.37 0.04 0.09 0.06 *
Business ethics 0.74 0.01 0.06 0.09 *** -0.27 0.04 -0.26 0.02
Emerging market development - - - - - - - -
Responsible products -0.25 0.14 * -0.16 0.04 0.89 * -0.12 -0.13 0.04
Management systems & Certifications 1.34 -0.02 -0.48 -0.06 -1.01 ** 0.05 -0.81 * -0.05
Consumer relations 1.58 -0.03 0.50 -0.06 -0.05 0.04 -0.06 0.00
Management governance -0.75 *** -0.02 -0.53 *** 0.01 -0.22 ** 0.00 -0.03 -0.03 *
Shareholders relations 0.35 0.00 -0.09 -0.04 -0.06 0.06 -0.07 0.04
Governance controversies 2.68 ** 0.25 *** 0.69 -0.23 * 0.18 0.30 *** 0.10 0.22 ***
Consumer controversies -3.01 *** 0.09 -0.78 -0.20 ** -0.04 0.01 0.28 0.22 **
Business Ethics Controversies -0.05 0.04 -0.71 -0.04 -0.40 0.01 -0.47 * 0.02
Environmental & social controversies 0.59 -0.02 -0.80 0.22 ** -0.44 0.01 0.11 -0.08
Within R-squared 34.9% 11.4% 40.6% 17.8% 60.5% 16.8% 35.9% 11.9%
Observations 416 405 415 415 415 415 421 421
Cross-sectional units 52 50 52 52 51 51 52 52
Time-series length 12 12 12 12 12 12 12 12
In favour of CS business case % 25% 50% 33% 40% 20% 67% 50% 80%
In favour of CS business case % is the count of significant (at least at the 10 % level) variables that are in line with a positive CSP - CFP relationship, i.e. that a negative sign is obtained for the controversy factors or a positive sign for the other CSP factors, divided by the number of CSP factors with significant results. "*" = significant at 10 %; "**" = significant at 5 %; "***" = significant at 1 %
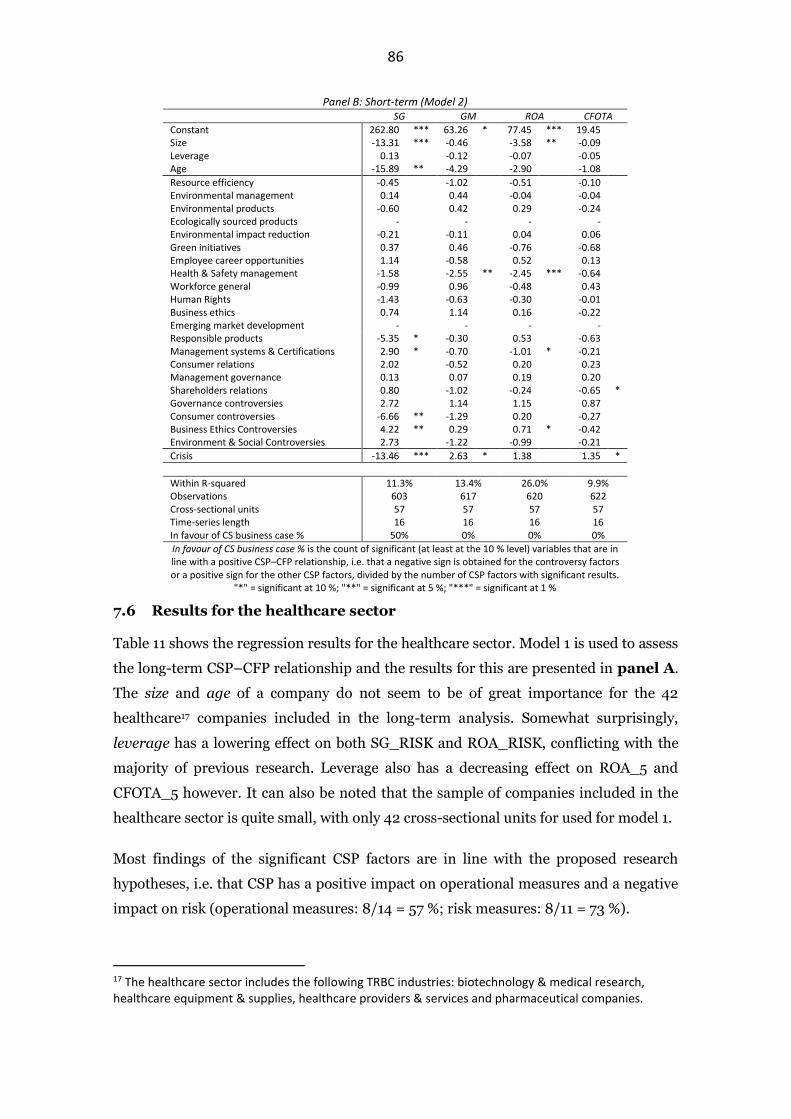
86
7.6 Results for the healthcare sector
Table 11 shows the regression results for the healthcare sector. Model 1 is used to assess
the long-term CSP–CFP relationship and the results for this are presented in panel A.
The size and age of a company do not seem to be of great importance for the 42
healthcare17 companies included in the long-term analysis. Somewhat surprisingly,
leverage has a lowering effect on both SG_RISK and ROA_RISK, conflicting with the
majority of previous research. Leverage also has a decreasing effect on ROA_5 and
CFOTA_5 however. It can also be noted that the sample of companies included in the
healthcare sector is quite small, with only 42 cross-sectional units for used for model 1.
Most findings of the significant CSP factors are in line with the proposed research
hypotheses, i.e. that CSP has a positive impact on operational measures and a negative
impact on risk (operational measures: 8/14 = 57 %; risk measures: 8/11 = 73 %).
17 The healthcare sector includes the following TRBC industries: biotechnology & medical research, healthcare equipment & supplies, healthcare providers & services and pharmaceutical companies.
Panel B: Short-term (Model 2) SG GM ROA CFOTA
Constant 262.80 *** 63.26 * 77.45 *** 19.45
Size -13.31 *** -0.46 -3.58 ** -0.09
Leverage 0.13 -0.12 -0.07 -0.05
Age -15.89 ** -4.29 -2.90 -1.08
Resource efficiency -0.45 -1.02 -0.51 -0.10
Environmental management 0.14 0.44 -0.04 -0.04
Environmental products -0.60 0.42 0.29 -0.24
Ecologically sourced products - - - -
Environmental impact reduction -0.21 -0.11 0.04 0.06
Green initiatives 0.37 0.46 -0.76 -0.68
Employee career opportunities 1.14 -0.58 0.52 0.13
Health & Safety management -1.58 -2.55 ** -2.45 *** -0.64
Workforce general -0.99 0.96 -0.48 0.43
Human Rights -1.43 -0.63 -0.30 -0.01
Business ethics 0.74 1.14 0.16 -0.22
Emerging market development - - - -
Responsible products -5.35 * -0.30 0.53 -0.63
Management systems & Certifications 2.90 * -0.70 -1.01 * -0.21
Consumer relations 2.02 -0.52 0.20 0.23
Management governance 0.13 0.07 0.19 0.20
Shareholders relations 0.80 -1.02 -0.24 -0.65 * Governance controversies 2.72 1.14 1.15 0.87
Consumer controversies -6.66 ** -1.29 0.20 -0.27
Business Ethics Controversies 4.22 ** 0.29 0.71 * -0.42
Environment & Social Controversies 2.73 -1.22 -0.99 -0.21
Crisis -13.46 *** 2.63 * 1.38 1.35 *
Within R-squared 11.3% 13.4% 26.0% 9.9% Observations 603 617 620 622 Cross-sectional units 57 57 57 57 Time-series length 16 16 16 16 In favour of CS business case % 50% 0% 0% 0%
In favour of CS business case % is the count of significant (at least at the 10 % level) variables that are in line with a positive CSP–CFP relationship, i.e. that a negative sign is obtained for the controversy factors or a positive sign for the other CSP factors, divided by the number of CSP factors with significant results.
"*" = significant at 10 %; "**" = significant at 5 %; "***" = significant at 1 %
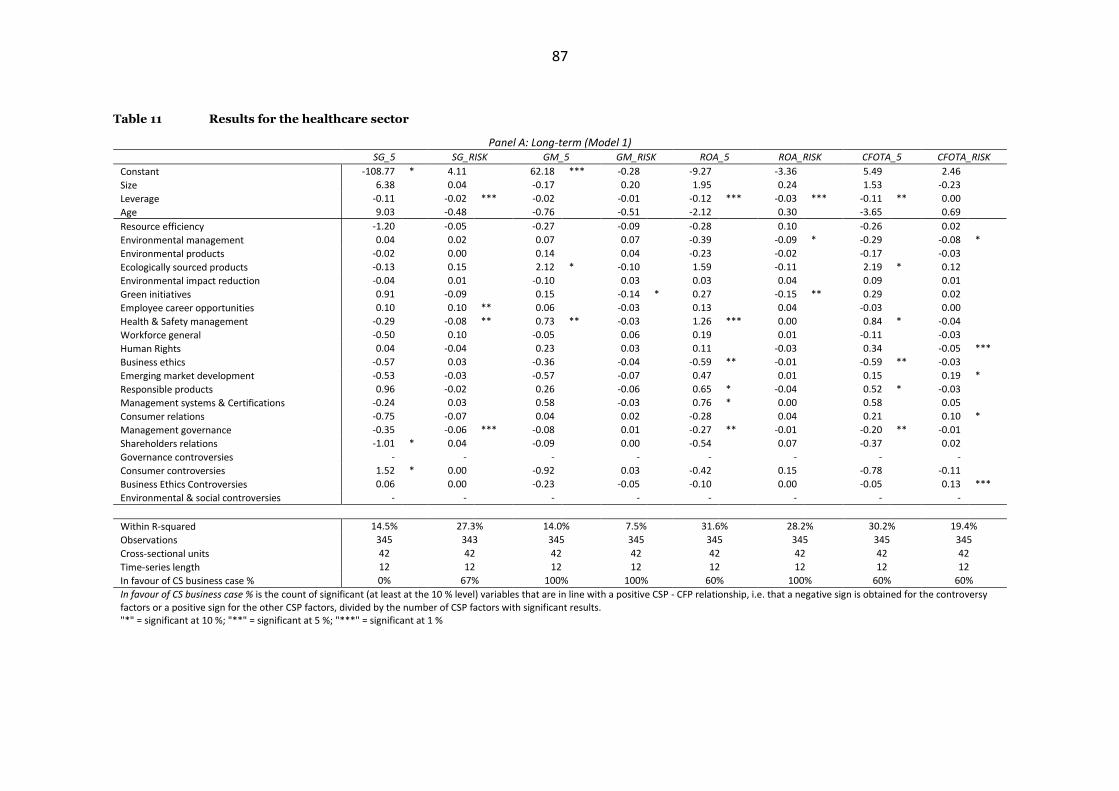
87
Table 11 Results for the healthcare sector
Panel A: Long-term (Model 1) SG_5 SG_RISK GM_5 GM_RISK ROA_5 ROA_RISK CFOTA_5 CFOTA_RISK
Constant -108.77 * 4.11 62.18 *** -0.28 -9.27 -3.36 5.49 2.46
Size 6.38 0.04 -0.17 0.20 1.95 0.24 1.53 -0.23
Leverage -0.11 -0.02 *** -0.02 -0.01 -0.12 *** -0.03 *** -0.11 ** 0.00
Age 9.03 -0.48 -0.76 -0.51 -2.12 0.30 -3.65 0.69
Resource efficiency -1.20 -0.05 -0.27 -0.09 -0.28 0.10 -0.26 0.02
Environmental management 0.04 0.02 0.07 0.07 -0.39 -0.09 * -0.29 -0.08 *
Environmental products -0.02 0.00 0.14 0.04 -0.23 -0.02 -0.17 -0.03
Ecologically sourced products -0.13 0.15 2.12 * -0.10 1.59 -0.11 2.19 * 0.12
Environmental impact reduction -0.04 0.01 -0.10 0.03 0.03 0.04 0.09 0.01
Green initiatives 0.91 -0.09 0.15 -0.14 * 0.27 -0.15 ** 0.29 0.02
Employee career opportunities 0.10 0.10 ** 0.06 -0.03 0.13 0.04 -0.03 0.00
Health & Safety management -0.29 -0.08 ** 0.73 ** -0.03 1.26 *** 0.00 0.84 * -0.04
Workforce general -0.50 0.10 -0.05 0.06 0.19 0.01 -0.11 -0.03
Human Rights 0.04 -0.04 0.23 0.03 0.11 -0.03 0.34 -0.05 ***
Business ethics -0.57 0.03 -0.36 -0.04 -0.59 ** -0.01 -0.59 ** -0.03
Emerging market development -0.53 -0.03 -0.57 -0.07 0.47 0.01 0.15 0.19 *
Responsible products 0.96 -0.02 0.26 -0.06 0.65 * -0.04 0.52 * -0.03
Management systems & Certifications -0.24 0.03 0.58 -0.03 0.76 * 0.00 0.58 0.05
Consumer relations -0.75 -0.07 0.04 0.02 -0.28 0.04 0.21 0.10 *
Management governance -0.35 -0.06 *** -0.08 0.01 -0.27 ** -0.01 -0.20 ** -0.01
Shareholders relations -1.01 * 0.04 -0.09 0.00 -0.54 0.07 -0.37 0.02
Governance controversies - - - - - - - -
Consumer controversies 1.52 * 0.00 -0.92 0.03 -0.42 0.15 -0.78 -0.11
Business Ethics Controversies 0.06 0.00 -0.23 -0.05 -0.10 0.00 -0.05 0.13 ***
Environmental & social controversies - - - - - - - -
Within R-squared 14.5% 27.3% 14.0% 7.5% 31.6% 28.2% 30.2% 19.4%
Observations 345 343 345 345 345 345 345 345
Cross-sectional units 42 42 42 42 42 42 42 42
Time-series length 12 12 12 12 12 12 12 12
In favour of CS business case % 0% 67% 100% 100% 60% 100% 60% 60%
In favour of CS business case % is the count of significant (at least at the 10 % level) variables that are in line with a positive CSP - CFP relationship, i.e. that a negative sign is obtained for the controversy factors or a positive sign for the other CSP factors, divided by the number of CSP factors with significant results. "*" = significant at 10 %; "**" = significant at 5 %; "***" = significant at 1 %

88
Employee health & safety management stands out as an important determining factor
for a healthcare company’s CFP, especially for the operational measures, but also for
SG_RISK. In addition, ecologically sourced products have a major positive impact on
the gross margin and operating cash flows to total assets, whereas responsible products
are another significant determinant for the asset utilization measures ROA_5 and
CFOTA_5.
Environmental management, emission & waste reduction and human rights reduce the
risk of companies, whereas employee career development opportunities, emerging
market development and consumer relations each have a positive sign for their impact
on one of the risk measures. Companies with controversial behaviour regarding business
ethics tend to have more CFOTA variability.
Panel B of table 11 show the results of model 2. Leverage has little importance for the
CFP measures in the short-term and size obtains the negative sign as seen in the short-
term analyses of other economic sectors as well, whereas older firms are able to use their
experience to gain more market share through faster sales growth.
Panel B: Short-term (Model 2) SG GM ROA CFOTA
Constant 124.72 *** 190.34 ** 64.30 *** 53.49 *** Size -9.30 *** -11.42 * -3.41 *** -2.78 ** Leverage -0.02 -0.02 -0.06 -0.02
Age 7.92 * 8.10 -2.07 -0.84
Resource efficiency 1.09 0.41 -0.19 -0.04
Environmental management -0.81 -0.43 -0.66 * -0.23
Environmental products 0.82 0.13 -0.52 -0.40
Ecologically sourced products 4.33 -0.41 2.67 * 2.42 * Environmental impact reduction 0.31 -0.17 0.12 -0.16
Green initiatives 0.98 0.61 0.34 0.75
Employee career opportunities 1.10 0.06 0.14 0.18
Health & Safety management -3.57 * 0.92 ** 0.83 ** 1.05 *** Workforce general -1.36 -0.68 -0.45 -0.73 ** Human Rights 0.16 -0.04 0.31 0.53 * Business ethics 0.33 0.43 -0.26 -0.46
Emerging market development -2.01 -0.03 0.06 -0.44
Responsible products -0.81 -0.04 0.69 0.32
Management systems & Certifications 1.57 0.84 0.58 1.06 ** Consumer relations 2.65 0.22 0.84 0.58
Management governance -0.35 0.36 -0.11 -0.07
Shareholders relations 0.16 0.13 -0.16 -0.11
Governance controversies - - - -
Consumer controversies 3.32 * -0.86 0.33 -0.27
Business Ethics Controversies -1.16 0.00 -0.21 -0.06
Environment & Social Controversies - - - -
Crisis -1.22 -0.79 -3.23 ** -1.56
Within R-squared 8.1% 24.5% 12.8% 12.5% Observations 522 530 529 530 Cross-sectional units 54 54 54 54 Time-series length 16 16 16 16 In favour of CS business case % 0% 100% 67% 80%
In favour of CS business case % is the count of significant (at least at the 10 % level) variables that are in line with a positive CSP - CFP relationship, i.e. that a negative sign is obtained for the controversy factors or a positive sign for the other CSP factors, divided by the number of CSP factors with significant results.
"*" = significant at 10 %; "**" = significant at 5 %; "***" = significant at 1 %

89
Consistently with the long-term results, health & safety management and ecologically
sourced products are important factors also in the short-term. Although health & safety
management is detrimental to sales growth, it increases the other three CFP measures
by almost 1 percent per year for each improvement on one of the variables included in
the factor. Ecologically sourced products improve both asset utilization measures by
approximately 2.5 percent per year for each improvement on the factor performance. A
good performance on the human rights and management systems & certifications
factors is also rewarded, while improving the wellbeing of the workforce or
environmental management policies seem to have a slightly negative impact.
7.7 Results for the industrials sector
Panel A of table 12 presents the results for the industrials18 sector using regression
model 1. This economic sector is the largest sector included in the data set used for this
thesis, and model 1 includes 158 companies in the cross-section. The size variable has the
expected positive impact on the operational performance measures and negative impact
on risk. Leverage in turn has a negative relationship with the operational measures in
line with previous research and a positive effect on risk, in support of the leverage effect.
A company’s age is an insignificant determinant for all CFP measures except for the
CFOTA_5, for which a negative effect is found, similarly to e.g. Galema et al. (2008).
All in all, approximately half of the significant CSP factors have a neutral effect on CFP,
as 13 out of 27 measures give support to a positive CSP–CFP relationship. When looking
at the operative and risk measures separately however, the positive impacts are again
driven foremostly by the risk reduction properties of CSP: 8 out of 11 significant CSP
factors across the risk measures support this view, whereas this is true for only 5 out of
16 CSP factors with an operational dependent variable. Excluding the two governance
factors and the governance controversies provides a slightly more positive view though.
Industrial companies selling ecologically sourced products are clearly sought after, as
an improvement on one of the variables included in this factor improves sales growth
annually by more than 4 percent. The effects of this can also be noticed as higher and
more stable long-term ROA. Of the remaining environmental factors, environmental
18 The following industries are included in the industrials sector: aerospace & defence, construction & engineering, diversified industrial goods wholesalers, freight & logistics services, industrial conglomerates, machinery, tools, heavy vehicles, trains & ships, passenger transportation services, professional & commercial services and transport infrastructure.
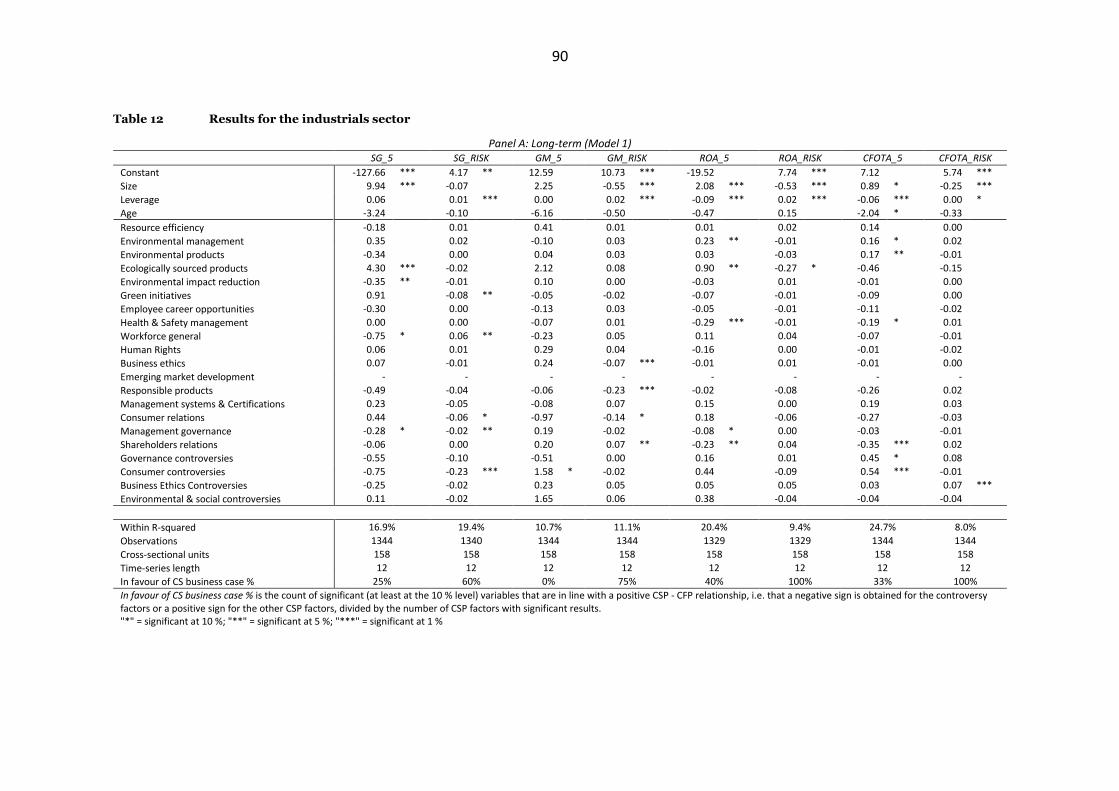
90
Table 12 Results for the industrials sector
Panel A: Long-term (Model 1) SG_5 SG_RISK GM_5 GM_RISK ROA_5 ROA_RISK CFOTA_5 CFOTA_RISK
Constant -127.66 *** 4.17 ** 12.59 10.73 *** -19.52 7.74 *** 7.12 5.74 ***
Size 9.94 *** -0.07 2.25 -0.55 *** 2.08 *** -0.53 *** 0.89 * -0.25 ***
Leverage 0.06 0.01 *** 0.00 0.02 *** -0.09 *** 0.02 *** -0.06 *** 0.00 *
Age -3.24 -0.10 -6.16 -0.50 -0.47 0.15 -2.04 * -0.33
Resource efficiency -0.18 0.01 0.41 0.01 0.01 0.02 0.14 0.00
Environmental management 0.35 0.02 -0.10 0.03 0.23 ** -0.01 0.16 * 0.02
Environmental products -0.34 0.00 0.04 0.03 0.03 -0.03 0.17 ** -0.01
Ecologically sourced products 4.30 *** -0.02 2.12 0.08 0.90 ** -0.27 * -0.46 -0.15
Environmental impact reduction -0.35 ** -0.01 0.10 0.00 -0.03 0.01 -0.01 0.00
Green initiatives 0.91 -0.08 ** -0.05 -0.02 -0.07 -0.01 -0.09 0.00
Employee career opportunities -0.30 0.00 -0.13 0.03 -0.05 -0.01 -0.11 -0.02
Health & Safety management 0.00 0.00 -0.07 0.01 -0.29 *** -0.01 -0.19 * 0.01
Workforce general -0.75 * 0.06 ** -0.23 0.05 0.11 0.04 -0.07 -0.01
Human Rights 0.06 0.01 0.29 0.04 -0.16 0.00 -0.01 -0.02
Business ethics 0.07 -0.01 0.24 -0.07 *** -0.01 0.01 -0.01 0.00
Emerging market development - - - - - - - -
Responsible products -0.49 -0.04 -0.06 -0.23 *** -0.02 -0.08 -0.26 0.02
Management systems & Certifications 0.23 -0.05 -0.08 0.07 0.15 0.00 0.19 0.03
Consumer relations 0.44 -0.06 * -0.97 -0.14 * 0.18 -0.06 -0.27 -0.03
Management governance -0.28 * -0.02 ** 0.19 -0.02 -0.08 * 0.00 -0.03 -0.01
Shareholders relations -0.06 0.00 0.20 0.07 ** -0.23 ** 0.04 -0.35 *** 0.02
Governance controversies -0.55 -0.10 -0.51 0.00 0.16 0.01 0.45 * 0.08
Consumer controversies -0.75 -0.23 *** 1.58 * -0.02 0.44 -0.09 0.54 *** -0.01
Business Ethics Controversies -0.25 -0.02 0.23 0.05 0.05 0.05 0.03 0.07 ***
Environmental & social controversies 0.11 -0.02 1.65 0.06 0.38 -0.04 -0.04 -0.04
Within R-squared 16.9% 19.4% 10.7% 11.1% 20.4% 9.4% 24.7% 8.0%
Observations 1344 1340 1344 1344 1329 1329 1344 1344
Cross-sectional units 158 158 158 158 158 158 158 158
Time-series length 12 12 12 12 12 12 12 12
In favour of CS business case % 25% 60% 0% 75% 40% 100% 33% 100%
In favour of CS business case % is the count of significant (at least at the 10 % level) variables that are in line with a positive CSP - CFP relationship, i.e. that a negative sign is obtained for the controversy factors or a positive sign for the other CSP factors, divided by the number of CSP factors with significant results. "*" = significant at 10 %; "**" = significant at 5 %; "***" = significant at 1 %
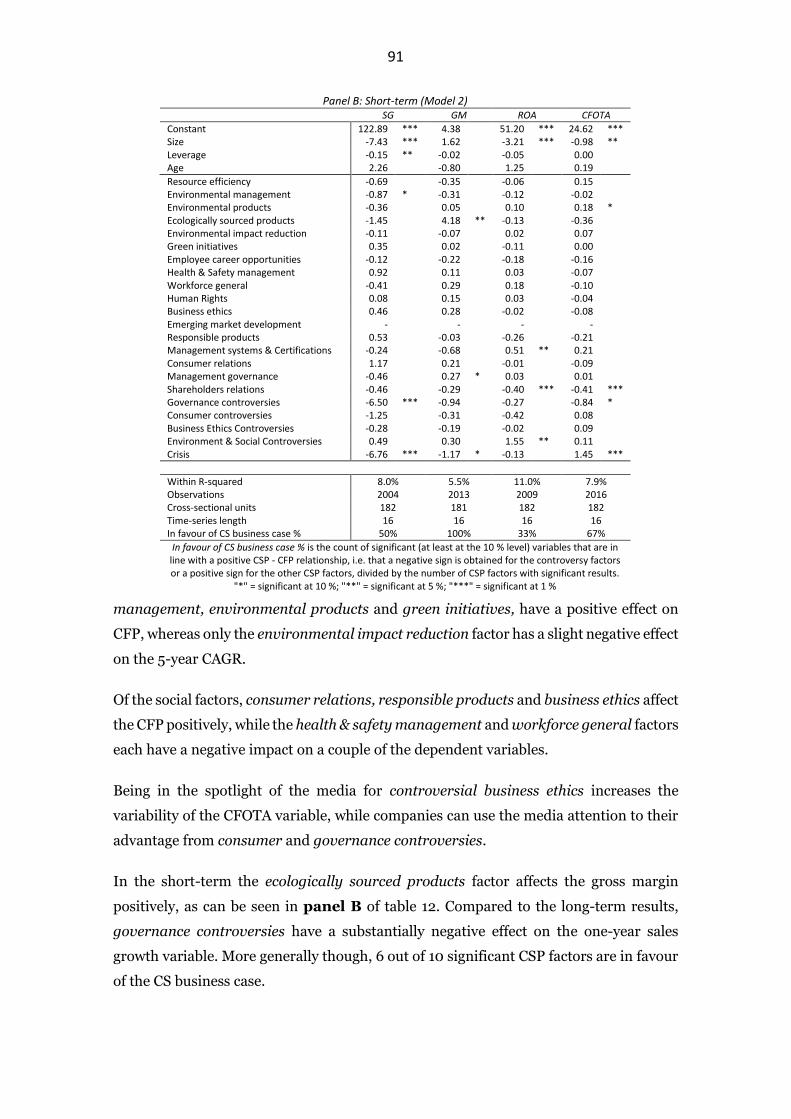
91
management, environmental products and green initiatives, have a positive effect on
CFP, whereas only the environmental impact reduction factor has a slight negative effect
on the 5-year CAGR.
Of the social factors, consumer relations, responsible products and business ethics affect
the CFP positively, while the health & safety management and workforce general factors
each have a negative impact on a couple of the dependent variables.
Being in the spotlight of the media for controversial business ethics increases the
variability of the CFOTA variable, while companies can use the media attention to their
advantage from consumer and governance controversies.
In the short-term the ecologically sourced products factor affects the gross margin
positively, as can be seen in panel B of table 12. Compared to the long-term results,
governance controversies have a substantially negative effect on the one-year sales
growth variable. More generally though, 6 out of 10 significant CSP factors are in favour
of the CS business case.
Panel B: Short-term (Model 2) SG GM ROA CFOTA
Constant 122.89 *** 4.38 51.20 *** 24.62 *** Size -7.43 *** 1.62 -3.21 *** -0.98 ** Leverage -0.15 ** -0.02 -0.05 0.00
Age 2.26 -0.80 1.25 0.19
Resource efficiency -0.69 -0.35 -0.06 0.15
Environmental management -0.87 * -0.31 -0.12 -0.02
Environmental products -0.36 0.05 0.10 0.18 * Ecologically sourced products -1.45 4.18 ** -0.13 -0.36
Environmental impact reduction -0.11 -0.07 0.02 0.07
Green initiatives 0.35 0.02 -0.11 0.00
Employee career opportunities -0.12 -0.22 -0.18 -0.16
Health & Safety management 0.92 0.11 0.03 -0.07
Workforce general -0.41 0.29 0.18 -0.10
Human Rights 0.08 0.15 0.03 -0.04
Business ethics 0.46 0.28 -0.02 -0.08
Emerging market development - - - -
Responsible products 0.53 -0.03 -0.26 -0.21
Management systems & Certifications -0.24 -0.68 0.51 ** 0.21
Consumer relations 1.17 0.21 -0.01 -0.09
Management governance -0.46 0.27 * 0.03 0.01
Shareholders relations -0.46 -0.29 -0.40 *** -0.41 *** Governance controversies -6.50 *** -0.94 -0.27 -0.84 * Consumer controversies -1.25 -0.31 -0.42 0.08
Business Ethics Controversies -0.28 -0.19 -0.02 0.09
Environment & Social Controversies 0.49 0.30 1.55 ** 0.11
Crisis -6.76 *** -1.17 * -0.13 1.45 ***
Within R-squared 8.0% 5.5% 11.0% 7.9% Observations 2004 2013 2009 2016 Cross-sectional units 182 181 182 182 Time-series length 16 16 16 16 In favour of CS business case % 50% 100% 33% 67%
In favour of CS business case % is the count of significant (at least at the 10 % level) variables that are in line with a positive CSP - CFP relationship, i.e. that a negative sign is obtained for the controversy factors or a positive sign for the other CSP factors, divided by the number of CSP factors with significant results.
"*" = significant at 10 %; "**" = significant at 5 %; "***" = significant at 1 %

92
7.8 Results for the technology sector
The results for the technology sector19 are shown in table 13. Panel A shows the results
for the regressions using the long-term dependent variables with the 5-year lagged CSP
factors.
A positive size-growth relationship is found, while increased leverage seems to decrease
firm risk. Company age is also found to have a positive effect on the operative measures,
who apparently are able to make use of experience. These results may also be partially
affected by the small sample size of technology companies.
A clear majority of the significant CSP factors for the regressions using one of the risk
measures as the dependent variable are in favour of the CS business case (7/8 = 88 %)
while this is true for 8 out of 18 factors (44 %) when one of the four operational
performance measures is used as the dependent variable.
The business ethics factor seems to be especially important for the operative
performance of companies, while good shareholder relations have a large decreasing
impact on firm risk. Again, management governance is found to be more costly than
useful. Of the remaining social factors, the factors dealing with employee well-being,
health and safety, and career opportunities also show significant results.
Three environmental factors (resource efficiency, environmental management and
environmental products) are, perhaps surprisingly, found to have a significant impact
on the CFP variables. However, according to a recent newspaper article published by
Finland's national public broadcasting company YLE (Fagerström, 2019), the quickly
growing technology sector already produces tremendous amounts of greenhouse gas-
emissions due to the enormous energy requirements of technological companies.
Pretty much the same CSP factors are found to be of importance for the short-term
regressions as for the long-term regressions, as seen in panel B. The CSP–CFP
relationship is rather neutral when considering all four regressions displayed. The most
important factor from an economic significance point-of-view, is the resource efficiency
factor: an improvement on the factor performance results in increased annual sales
19 The technology sector includes the following TRBC industries: communications & networking, computers, phones & household electronics, electronic equipment & parts, office equipment, semiconductors & semiconductor equipment and software & IT services
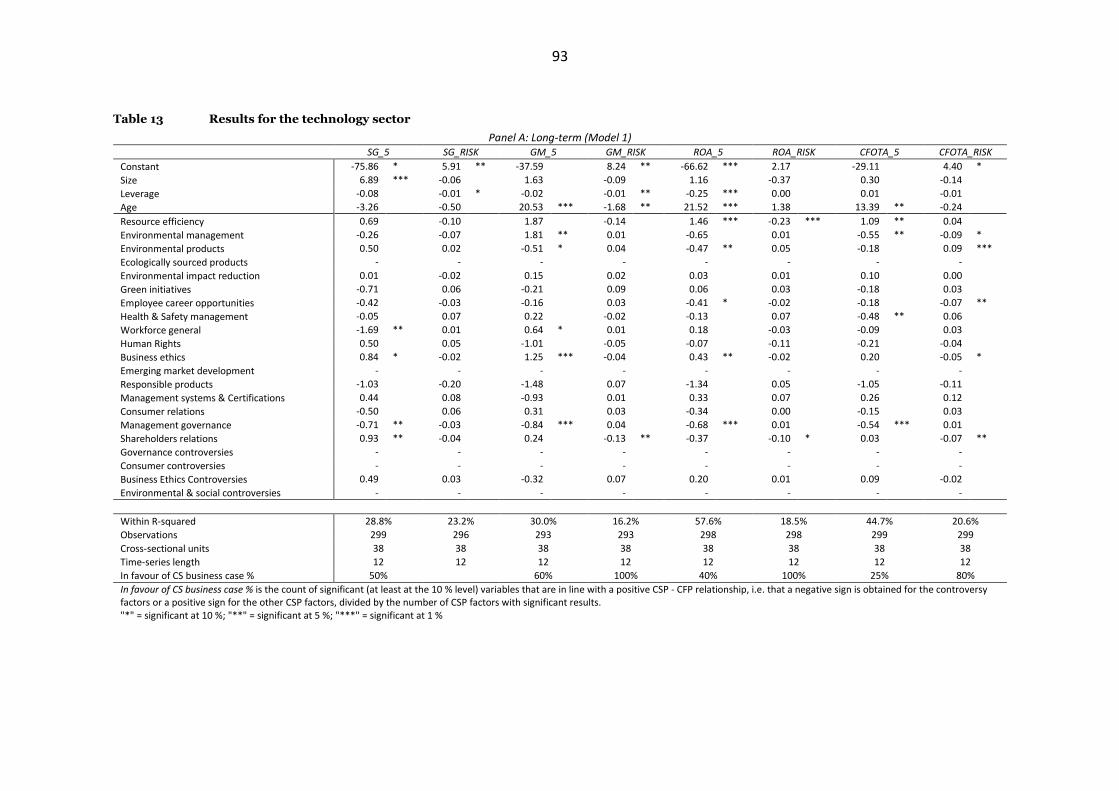
93
Table 13 Results for the technology sector
Panel A: Long-term (Model 1) SG_5 SG_RISK GM_5 GM_RISK ROA_5 ROA_RISK CFOTA_5 CFOTA_RISK
Constant -75.86 * 5.91 ** -37.59 8.24 ** -66.62 *** 2.17 -29.11 4.40 *
Size 6.89 *** -0.06 1.63 -0.09 1.16 -0.37 0.30 -0.14
Leverage -0.08 -0.01 * -0.02 -0.01 ** -0.25 *** 0.00 0.01 -0.01
Age -3.26 -0.50 20.53 *** -1.68 ** 21.52 *** 1.38 13.39 ** -0.24
Resource efficiency 0.69 -0.10 1.87 -0.14 1.46 *** -0.23 *** 1.09 ** 0.04
Environmental management -0.26 -0.07 1.81 ** 0.01 -0.65 0.01 -0.55 ** -0.09 *
Environmental products 0.50 0.02 -0.51 * 0.04 -0.47 ** 0.05 -0.18 0.09 ***
Ecologically sourced products - - - - - - - -
Environmental impact reduction 0.01 -0.02 0.15 0.02 0.03 0.01 0.10 0.00
Green initiatives -0.71 0.06 -0.21 0.09 0.06 0.03 -0.18 0.03
Employee career opportunities -0.42 -0.03 -0.16 0.03 -0.41 * -0.02 -0.18 -0.07 **
Health & Safety management -0.05 0.07 0.22 -0.02 -0.13 0.07 -0.48 ** 0.06
Workforce general -1.69 ** 0.01 0.64 * 0.01 0.18 -0.03 -0.09 0.03
Human Rights 0.50 0.05 -1.01 -0.05 -0.07 -0.11 -0.21 -0.04
Business ethics 0.84 * -0.02 1.25 *** -0.04 0.43 ** -0.02 0.20 -0.05 *
Emerging market development - - - - - - - -
Responsible products -1.03 -0.20 -1.48 0.07 -1.34 0.05 -1.05 -0.11
Management systems & Certifications 0.44 0.08 -0.93 0.01 0.33 0.07 0.26 0.12
Consumer relations -0.50 0.06 0.31 0.03 -0.34 0.00 -0.15 0.03
Management governance -0.71 ** -0.03 -0.84 *** 0.04 -0.68 *** 0.01 -0.54 *** 0.01
Shareholders relations 0.93 ** -0.04 0.24 -0.13 ** -0.37 -0.10 * 0.03 -0.07 **
Governance controversies - - - - - - - -
Consumer controversies - - - - - - - -
Business Ethics Controversies 0.49 0.03 -0.32 0.07 0.20 0.01 0.09 -0.02
Environmental & social controversies - - - - - - - -
Within R-squared 28.8% 23.2% 30.0% 16.2% 57.6% 18.5% 44.7% 20.6%
Observations 299 296 293 293 298 298 299 299
Cross-sectional units 38 38 38 38 38 38 38 38
Time-series length 12 12 12 12 12 12 12 12
In favour of CS business case % 50% 60% 100% 40% 100% 25% 80%
In favour of CS business case % is the count of significant (at least at the 10 % level) variables that are in line with a positive CSP - CFP relationship, i.e. that a negative sign is obtained for the controversy factors or a positive sign for the other CSP factors, divided by the number of CSP factors with significant results. "*" = significant at 10 %; "**" = significant at 5 %; "***" = significant at 1 %
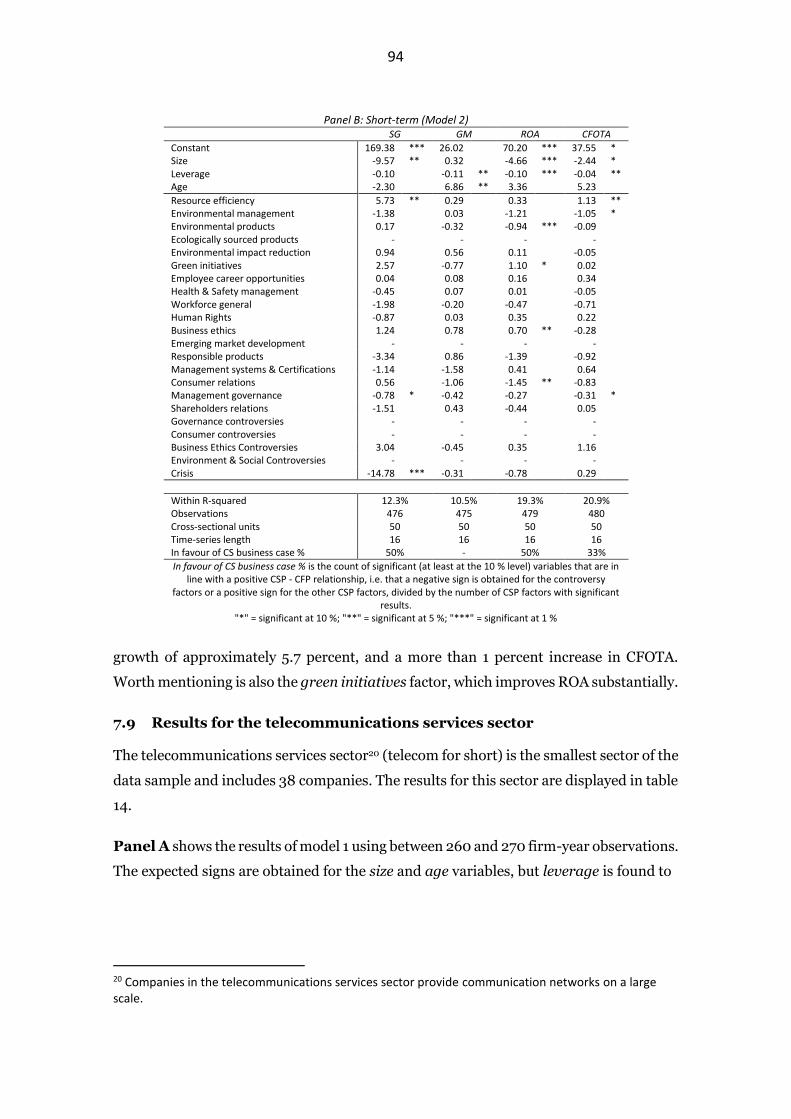
94
Panel B: Short-term (Model 2) SG GM ROA CFOTA
Constant 169.38 *** 26.02 70.20 *** 37.55 * Size -9.57 ** 0.32 -4.66 *** -2.44 * Leverage -0.10 -0.11 ** -0.10 *** -0.04 ** Age -2.30 6.86 ** 3.36 5.23
Resource efficiency 5.73 ** 0.29 0.33 1.13 ** Environmental management -1.38 0.03 -1.21 -1.05 * Environmental products 0.17 -0.32 -0.94 *** -0.09
Ecologically sourced products - - - -
Environmental impact reduction 0.94 0.56 0.11 -0.05
Green initiatives 2.57 -0.77 1.10 * 0.02
Employee career opportunities 0.04 0.08 0.16 0.34
Health & Safety management -0.45 0.07 0.01 -0.05
Workforce general -1.98 -0.20 -0.47 -0.71
Human Rights -0.87 0.03 0.35 0.22
Business ethics 1.24 0.78 0.70 ** -0.28
Emerging market development - - - -
Responsible products -3.34 0.86 -1.39 -0.92
Management systems & Certifications -1.14 -1.58 0.41 0.64
Consumer relations 0.56 -1.06 -1.45 ** -0.83
Management governance -0.78 * -0.42 -0.27 -0.31 * Shareholders relations -1.51 0.43 -0.44 0.05
Governance controversies - - - -
Consumer controversies - - - -
Business Ethics Controversies 3.04 -0.45 0.35 1.16
Environment & Social Controversies - - - -
Crisis -14.78 *** -0.31 -0.78 0.29
Within R-squared 12.3% 10.5% 19.3% 20.9% Observations 476 475 479 480 Cross-sectional units 50 50 50 50 Time-series length 16 16 16 16 In favour of CS business case % 50% - 50% 33%
In favour of CS business case % is the count of significant (at least at the 10 % level) variables that are in line with a positive CSP - CFP relationship, i.e. that a negative sign is obtained for the controversy
factors or a positive sign for the other CSP factors, divided by the number of CSP factors with significant results.
"*" = significant at 10 %; "**" = significant at 5 %; "***" = significant at 1 %
growth of approximately 5.7 percent, and a more than 1 percent increase in CFOTA.
Worth mentioning is also the green initiatives factor, which improves ROA substantially.
7.9 Results for the telecommunications services sector
The telecommunications services sector20 (telecom for short) is the smallest sector of the
data sample and includes 38 companies. The results for this sector are displayed in table
14.
Panel A shows the results of model 1 using between 260 and 270 firm-year observations.
The expected signs are obtained for the size and age variables, but leverage is found to
20 Companies in the telecommunications services sector provide communication networks on a large scale.

95
Table 14 Results for the telecommunications services sector
Panel A: Long-term (Model 1) SG_5 SG_RISK GM_5 GM_RISK ROA_5 ROA_RISK CFOTA_5 CFOTA_RISK
Constant -150.79 5.16 102.57 *** 8.62 ** -36.42 * 11.70 *** 31.10 6.58 **
Size 13.11 ** -0.19 -1.58 -0.49 ** 3.70 *** -0.68 *** -0.07 -0.33 *
Leverage 0.20 -0.01 * -0.05 -0.02 *** 0.05 * 0.00 0.10 *** -0.01
Age -17.62 ** 0.10 -9.59 ** 0.56 -4.37 0.04 -4.27 0.03
Resource efficiency -0.29 0.08 0.08 -0.01 -0.36 -0.08 -0.36 -0.07
Environmental management -0.19 0.05 0.38 -0.03 0.04 0.05 -0.02 0.07
Environmental products -0.77 -0.06 * -0.42 0.19 *** -0.43 * -0.01 -0.25 -0.03
Ecologically sourced products - - - - - - - -
Environmental impact reduction -0.26 0.01 0.13 -0.03 -0.02 -0.03 -0.16 0.02
Green initiatives 0.07 -0.02 -0.92 -0.19 ** -0.39 -0.05 -0.51 -0.04
Employee career opportunities -0.37 0.00 0.11 0.01 0.09 0.03 0.11 0.03
Health & Safety management 0.74 -0.17 *** 0.13 -0.07 0.10 -0.05 0.19 -0.08
Workforce general -0.71 0.03 -0.22 0.05 -0.06 0.05 -0.15 0.02
Human Rights -0.13 0.05 0.63 0.03 0.14 -0.02 0.21 0.00
Business ethics 1.06 * -0.01 -0.24 0.04 0.27 -0.04 0.35 -0.05
Emerging market development - - - - - - - -
Responsible products 1.33 -0.11 -1.11 -0.09 0.31 -0.31 *** -0.29 -0.02
Management systems & Certifications -0.41 0.22 ** 0.46 -0.18 -0.65 0.23 ** 0.19 0.05
Consumer relations -0.54 -0.04 0.45 0.01 0.36 0.15 *** 0.24 0.07
Management governance -0.04 0.03 0.24 -0.02 -0.21 *** 0.02 -0.15 -0.03
Shareholders relations -1.11 ** -0.06 0.13 -0.05 -0.37 0.00 -0.35 0.04
Governance controversies 0.23 0.00 -1.76 0.31 * -0.64 0.00 -0.39 -0.05
Consumer controversies 2.70 *** 0.04 -0.12 -0.18 1.22 ** -0.11 0.64 0.05
Business Ethics Controversies 0.53 -0.02 -0.67 0.07 -0.20 0.04 -0.03 0.03
Environmental & social controversies - - - - - - - -
Within R-squared 47.9% 17.1% 21.7% 24.1% 55.7% 36.6% 35.3% 21.8%
Observations 264 262 264 264 267 267 267 267
Cross-sectional units 33 33 33 33 33 33 33 33
Time-series length 12 12 12 12 12 12 12 12
In favour of CS business case % 33% 67% - 67% 0% 33% - -
In favour of CS business case % is the count of significant (at least at the 10 % level) variables that are in line with a positive CSP - CFP relationship, i.e. that a negative sign is obtained for the controversy factors or a positive sign for the other CSP factors, divided by the number of CSP factors with significant results. "*" = significant at 10 %; "**" = significant at 5 %; "***" = significant at 1 %
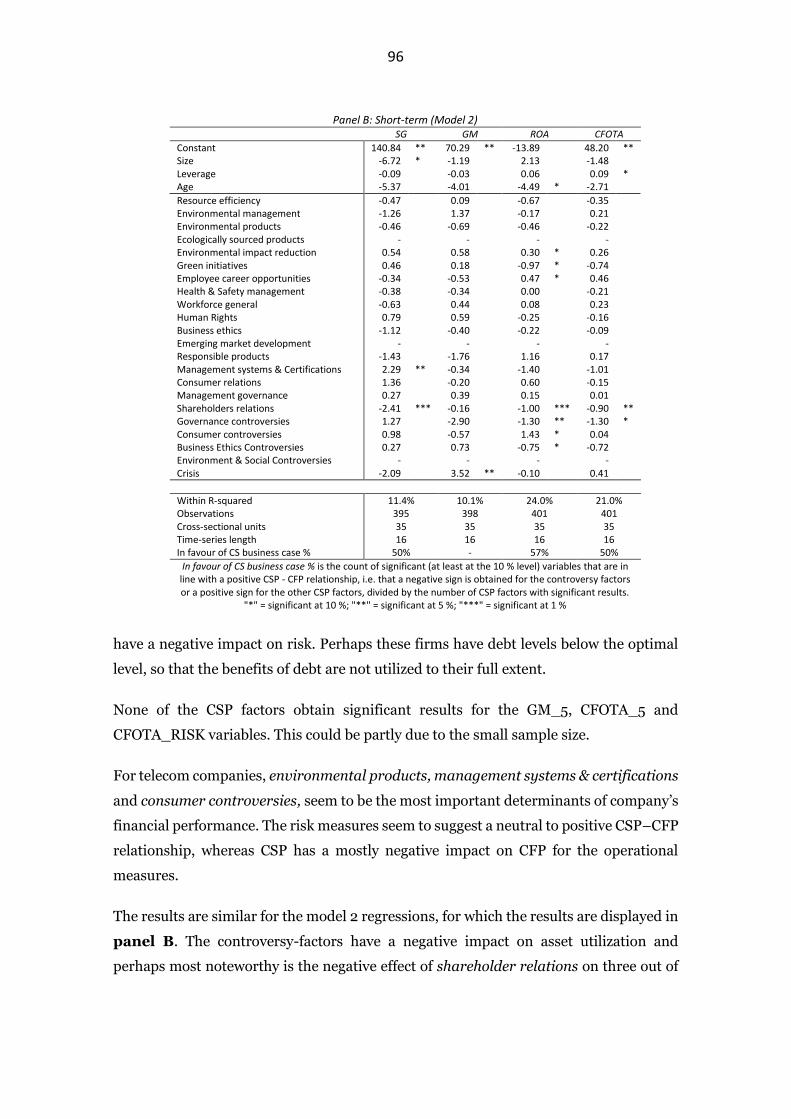
96
Panel B: Short-term (Model 2) SG GM ROA CFOTA
Constant 140.84 ** 70.29 ** -13.89 48.20 ** Size -6.72 * -1.19 2.13 -1.48
Leverage -0.09 -0.03 0.06 0.09 * Age -5.37 -4.01 -4.49 * -2.71
Resource efficiency -0.47 0.09 -0.67 -0.35
Environmental management -1.26 1.37 -0.17 0.21
Environmental products -0.46 -0.69 -0.46 -0.22
Ecologically sourced products - - - -
Environmental impact reduction 0.54 0.58 0.30 * 0.26
Green initiatives 0.46 0.18 -0.97 * -0.74
Employee career opportunities -0.34 -0.53 0.47 * 0.46
Health & Safety management -0.38 -0.34 0.00 -0.21
Workforce general -0.63 0.44 0.08 0.23
Human Rights 0.79 0.59 -0.25 -0.16
Business ethics -1.12 -0.40 -0.22 -0.09
Emerging market development - - - -
Responsible products -1.43 -1.76 1.16 0.17
Management systems & Certifications 2.29 ** -0.34 -1.40 -1.01
Consumer relations 1.36 -0.20 0.60 -0.15
Management governance 0.27 0.39 0.15 0.01
Shareholders relations -2.41 *** -0.16 -1.00 *** -0.90 ** Governance controversies 1.27 -2.90 -1.30 ** -1.30 * Consumer controversies 0.98 -0.57 1.43 * 0.04
Business Ethics Controversies 0.27 0.73 -0.75 * -0.72
Environment & Social Controversies - - - -
Crisis -2.09 3.52 ** -0.10 0.41
Within R-squared 11.4% 10.1% 24.0% 21.0% Observations 395 398 401 401 Cross-sectional units 35 35 35 35 Time-series length 16 16 16 16 In favour of CS business case % 50% - 57% 50%
In favour of CS business case % is the count of significant (at least at the 10 % level) variables that are in line with a positive CSP - CFP relationship, i.e. that a negative sign is obtained for the controversy factors or a positive sign for the other CSP factors, divided by the number of CSP factors with significant results.
"*" = significant at 10 %; "**" = significant at 5 %; "***" = significant at 1 %
have a negative impact on risk. Perhaps these firms have debt levels below the optimal
level, so that the benefits of debt are not utilized to their full extent.
None of the CSP factors obtain significant results for the GM_5, CFOTA_5 and
CFOTA_RISK variables. This could be partly due to the small sample size.
For telecom companies, environmental products, management systems & certifications
and consumer controversies, seem to be the most important determinants of company’s
financial performance. The risk measures seem to suggest a neutral to positive CSP–CFP
relationship, whereas CSP has a mostly negative impact on CFP for the operational
measures.
The results are similar for the model 2 regressions, for which the results are displayed in
panel B. The controversy-factors have a negative impact on asset utilization and
perhaps most noteworthy is the negative effect of shareholder relations on three out of
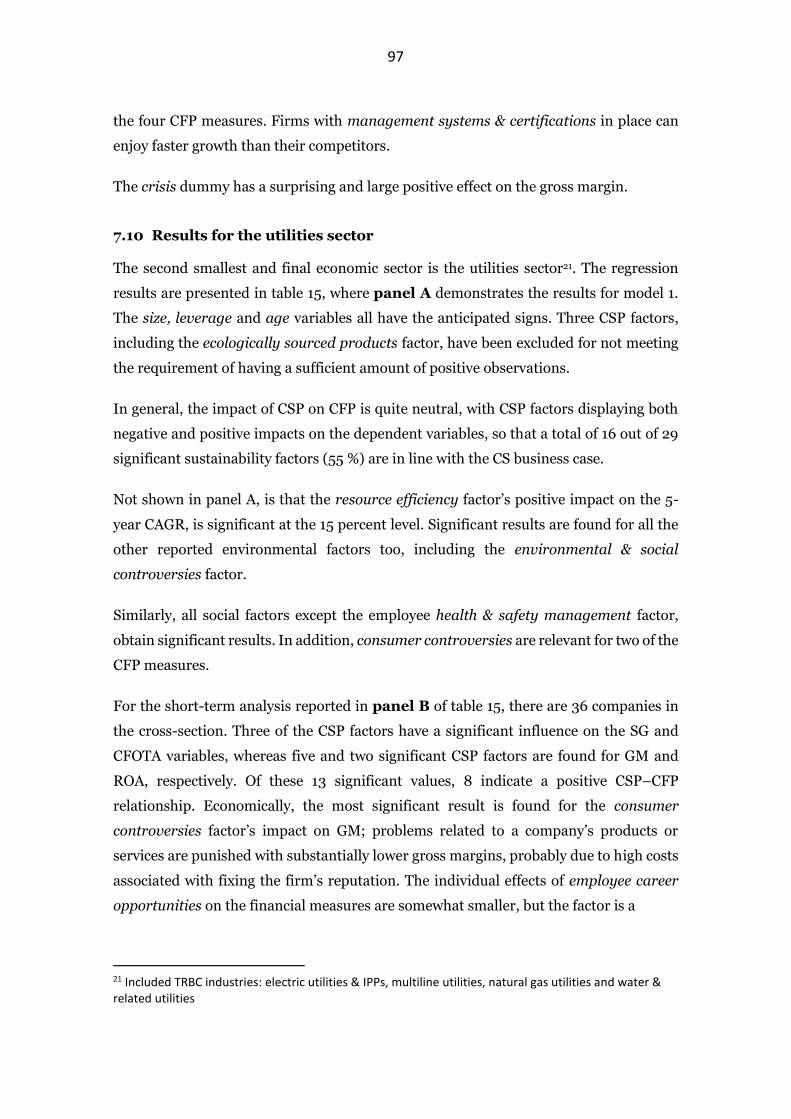
97
the four CFP measures. Firms with management systems & certifications in place can
enjoy faster growth than their competitors.
The crisis dummy has a surprising and large positive effect on the gross margin.
7.10 Results for the utilities sector
The second smallest and final economic sector is the utilities sector21. The regression
results are presented in table 15, where panel A demonstrates the results for model 1.
The size, leverage and age variables all have the anticipated signs. Three CSP factors,
including the ecologically sourced products factor, have been excluded for not meeting
the requirement of having a sufficient amount of positive observations.
In general, the impact of CSP on CFP is quite neutral, with CSP factors displaying both
negative and positive impacts on the dependent variables, so that a total of 16 out of 29
significant sustainability factors (55 %) are in line with the CS business case.
Not shown in panel A, is that the resource efficiency factor’s positive impact on the 5-
year CAGR, is significant at the 15 percent level. Significant results are found for all the
other reported environmental factors too, including the environmental & social
controversies factor.
Similarly, all social factors except the employee health & safety management factor,
obtain significant results. In addition, consumer controversies are relevant for two of the
CFP measures.
For the short-term analysis reported in panel B of table 15, there are 36 companies in
the cross-section. Three of the CSP factors have a significant influence on the SG and
CFOTA variables, whereas five and two significant CSP factors are found for GM and
ROA, respectively. Of these 13 significant values, 8 indicate a positive CSP–CFP
relationship. Economically, the most significant result is found for the consumer
controversies factor’s impact on GM; problems related to a company’s products or
services are punished with substantially lower gross margins, probably due to high costs
associated with fixing the firm’s reputation. The individual effects of employee career
opportunities on the financial measures are somewhat smaller, but the factor is a
21 Included TRBC industries: electric utilities & IPPs, multiline utilities, natural gas utilities and water & related utilities
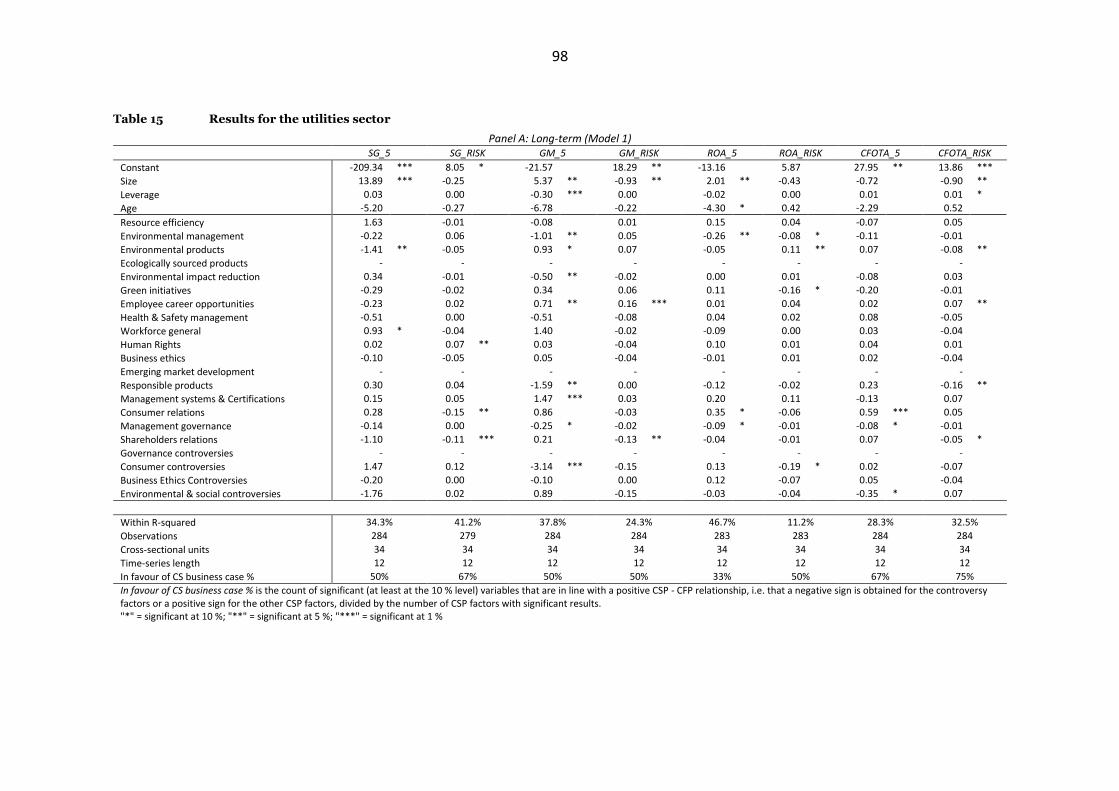
98
Table 15 Results for the utilities sector
Panel A: Long-term (Model 1) SG_5 SG_RISK GM_5 GM_RISK ROA_5 ROA_RISK CFOTA_5 CFOTA_RISK
Constant -209.34 *** 8.05 * -21.57 18.29 ** -13.16 5.87 27.95 ** 13.86 ***
Size 13.89 *** -0.25 5.37 ** -0.93 ** 2.01 ** -0.43 -0.72 -0.90 **
Leverage 0.03 0.00 -0.30 *** 0.00 -0.02 0.00 0.01 0.01 *
Age -5.20 -0.27 -6.78 -0.22 -4.30 * 0.42 -2.29 0.52
Resource efficiency 1.63 -0.01 -0.08 0.01 0.15 0.04 -0.07 0.05
Environmental management -0.22 0.06 -1.01 ** 0.05 -0.26 ** -0.08 * -0.11 -0.01
Environmental products -1.41 ** -0.05 0.93 * 0.07 -0.05 0.11 ** 0.07 -0.08 **
Ecologically sourced products - - - - - - - -
Environmental impact reduction 0.34 -0.01 -0.50 ** -0.02 0.00 0.01 -0.08 0.03
Green initiatives -0.29 -0.02 0.34 0.06 0.11 -0.16 * -0.20 -0.01
Employee career opportunities -0.23 0.02 0.71 ** 0.16 *** 0.01 0.04 0.02 0.07 **
Health & Safety management -0.51 0.00 -0.51 -0.08 0.04 0.02 0.08 -0.05
Workforce general 0.93 * -0.04 1.40 -0.02 -0.09 0.00 0.03 -0.04
Human Rights 0.02 0.07 ** 0.03 -0.04 0.10 0.01 0.04 0.01
Business ethics -0.10 -0.05 0.05 -0.04 -0.01 0.01 0.02 -0.04
Emerging market development - - - - - - - -
Responsible products 0.30 0.04 -1.59 ** 0.00 -0.12 -0.02 0.23 -0.16 **
Management systems & Certifications 0.15 0.05 1.47 *** 0.03 0.20 0.11 -0.13 0.07
Consumer relations 0.28 -0.15 ** 0.86 -0.03 0.35 * -0.06 0.59 *** 0.05
Management governance -0.14 0.00 -0.25 * -0.02 -0.09 * -0.01 -0.08 * -0.01
Shareholders relations -1.10 -0.11 *** 0.21 -0.13 ** -0.04 -0.01 0.07 -0.05 *
Governance controversies - - - - - - - -
Consumer controversies 1.47 0.12 -3.14 *** -0.15 0.13 -0.19 * 0.02 -0.07
Business Ethics Controversies -0.20 0.00 -0.10 0.00 0.12 -0.07 0.05 -0.04
Environmental & social controversies -1.76 0.02 0.89 -0.15 -0.03 -0.04 -0.35 * 0.07
Within R-squared 34.3% 41.2% 37.8% 24.3% 46.7% 11.2% 28.3% 32.5%
Observations 284 279 284 284 283 283 284 284
Cross-sectional units 34 34 34 34 34 34 34 34
Time-series length 12 12 12 12 12 12 12 12
In favour of CS business case % 50% 67% 50% 50% 33% 50% 67% 75%
In favour of CS business case % is the count of significant (at least at the 10 % level) variables that are in line with a positive CSP - CFP relationship, i.e. that a negative sign is obtained for the controversy factors or a positive sign for the other CSP factors, divided by the number of CSP factors with significant results. "*" = significant at 10 %; "**" = significant at 5 %; "***" = significant at 1 %

99
statistically significant determinant for three of the four dependent variables.
7.11 Summary of the long-term results
To get an overview of the results presented in sections 7.1-10, table 16 summarizes all the
long-term regression results. The results for the impact of the CO2 variable mentioned
in section 6.2.4 is also included in the table as an additional environmental factor.
The light grey colour in panel A of table 16 indicates that one significant result is obtained
for the sustainability measure in the given economic sector. A dark grey colour with
bolded text means that the sustainability measure has a significant impact on at least 2
out of the 4 operational/risk measures. The green (red) colour highlights the CSP factors
for which the majority of both the operational and the risk measures are in favour of
(against) the CS business case. Positive implies that more than 50 % of the significant
results are in favour of the CS business case, negative means that less than 50 % of the
significant results are against the CS business case and neutral implies that 50 % (i.e. 1
out of 2 or 2 out of 4) significant results are in favour of the business case. A positive
Panel B: Short-term (Model 2) SG GM ROA CFOTA
Constant 104.61 ** 13.16 53.81 *** 27.09 ** Size -5.76 * 1.46 -2.87 *** -1.08
Leverage 0.03 0.08 0.06 0.07 * Age 0.55 -1.12 -1.48 -1.04
Resource efficiency 0.65 0.98 * 0.17 0.20
Environmental management -0.52 -0.96 * -0.08 0.13
Environmental products -0.21 0.40 -0.03 -0.13
Ecologically sourced products - - - -
Environmental impact reduction 0.66 -0.77 *** -0.08 -0.20 * Green initiatives 0.57 -0.20 0.25 -0.20
Employee career opportunities -0.92 0.88 * 0.29 ** 0.34 ** Health & Safety management -1.44 -0.42 -0.20 -0.19
Workforce general -0.29 1.17 -0.14 0.02
Human Rights 1.67 * 0.15 0.10 0.08
Business ethics -0.89 0.66 0.06 0.11
Emerging market development - - - -
Responsible products 0.54 -1.96 0.04 -0.14
Management systems & Certifications 1.06 1.69 0.36 -0.18
Consumer relations -2.65 * 1.13 -0.14 0.56 * Management governance 0.52 -0.37 0.03 -0.03
Shareholders relations -1.72 * -0.33 -0.03 -0.19
Governance controversies - - - -
Consumer controversies 1.66 -3.06 *** -0.63 * 0.11
Business Ethics Controversies 0.45 -0.97 -0.06 -0.25
Environment & Social Controversies -1.12 1.25 0.00 0.11
Crisis 3.34 * -0.11 0.23 -0.39
Within R-squared 11.2% 15.3% 20.8% 11.3% Observations 416 419 418 419 Cross-sectional units 36 36 36 36 Time-series length 16 16 16 16 In favour of CS business case % 33% 60% 100% 67%
In favour of CS business case % is the count of significant (at least at the 10 % level) variables that are in line with a positive CSP - CFP relationship, i.e. that a negative sign is obtained for the controversy
factors or a positive sign for the other CSP factors, divided by the number of CSP factors with significant results.
"*" = significant at 10 %; "**" = significant at 5 %; "***" = significant at 1 %
100
result for the CO2 factor would imply, similarly to the controversies factors, that a
reduction of CO2 improves the operational performance of a company or that it
decreases the company’s risk profile. The blanks indicate that no significant results were
obtained for the CSP factor in question in the given sector, indicating that CS neither
destroys nor adds value.
For the environmental factors for instance, panel A suggests that the environmental
products factor has a positive effect for the basic materials and consumer cyclicals
sectors, but a negative impact on technological companies. Ecologically sourced
products have a positive influence for industrial firms and resource efficiency affects
technological companies positively. Reducing CO2 emissions is found to have a positive
impact on firms in the utilities sector, but companies in the consumer cyclicals and
healthcare sectors still benefit from the possibly higher productivity that higher CO2
emissions entail. For the full sample, CO2 emissions have a strong negative effect on
operational performance but a weakly positive impact on a firm’s risk profile. This both
negative and positive finding is similar to that of Galema et al. (2008), but also to Cavaco
& Crifo (2009) and Mǎnescu (2011), who find a neutral environment-CFP association.
The both negative and positive findings also for the governance factors show that the
financial performance depends largely on how financial performance is measured. High
levels of governance seem to make managers risk-averse, thereby resulting in lower
operational performance. Similarly, keeping shareholders happy is costly, but results in
a more stable performance.
The bottom row of panel A, denoted in favour of CS business case, is calculated based on
the number of significant CSP factors obtained that are in line with a positive CSP–CFP
relationship for the operational/risk measures, divided by the total amount of significant
cases for the CSP factors. For instance, as presented in section 7.1 for the full sample, all
9 out of 9 significant factors with a risk measure as the dependent variable are in favour
of the CS business case. This can be seen as the 100 % figure at the bottom of the ALL-
column, under risk.
Panel B is included to add clarity to panel A and provides key take-aways of the CSP–
CFP relationship on a general level. It is essentially a count of the positive, neutral and

101
Table 16 Summary of the long-term regression results
Oper. Risk Oper. Risk Oper. Risk Oper. Risk Oper. Risk Oper. Risk Oper. Risk Oper. Risk Oper. Risk Oper. Risk
Resource efficiency Negative Positive Positive Negative Positive Positive
Environmental management Negative Positive Negative Positive Neutral Negative Positive Positive Positive Neutral Positive Negative Positive
Environmental products Positive Positive Positive Positive Positive Positive Neutral Positive Negative Negative Negative Neutral Neutral Neutral
Ecologically sourced products Positive Positive Positive Positive Positive
Environmental impact reduction Negative Positive Negative Negative
Emission & waste reduction Positive Positive Positive Negative Positive Positive Positive Positive Positive Positive
CO2 Emissions Negative Positive Negative Negative Negative Negative Negative Neutral Negative Negative Positive Positive Negative Positive Positive
Employee career opportunities Negative Negative Positive Negative Negative Positive Positive Negative
Health & Safety management Negative Positive Negative Positive Negative Positive Positive Positive Negative Negative Positive
Workforce general Negative Negative Negative Positive Positive Positive Negative Negative Neutral Positive
Human Rights Negative Negative Positive Negative
Business ethics Negative Neutral Neutral Negative Negative Positive Positive Positive Positive
Emerging market development Negative Negative
Responsible products Positive Negative Positive Negative Positive Positive Positive Negative Positive
Management systems & Certifications Positive Positive Neutral Negative Positive Negative Positive
Consumer relations Positive Negative Negative Positive Negative Positive Positive
Management governance Negative Positive Negative Negative Negative Positive Negative Positive Negative Positive Negative Negative Negative
Shareholders relations Negative Positive Neutral Positive Negative Negative Negative Positive Positive Negative Positive
Governance controversies Negative Positive Negative Positive Negative Positive
Consumer controversies Negative Neutral Positive Neutral Negative Negative Negative Negative Positive Negative
Business Ethics Controversies Positive Positive Neutral Positive Positive Positive
Environment & Social Controversies Positive Positive Positive Positive Positive Positive Positive Positive
In favour of CS Business case: 44% 100% 41% 86% 38% 55% 50% 75% 29% 59% 57% 73% 31% 73% 44% 88% 17% 56% 50% 62%
Panel A: Long-term (Model 1)
A light grey colour indicates that a significant result is obtained for the sustainability measure in the given economic sector. A dark grey colour with bolded text means that the sustainability measure has a significant impact on at least 2 out of the 4 operational /
risk measures. A green colour highlights those CSP factors for which both the operative performance and risk measures are in favour of the CS business case. A red colour highlights those CSP factors for which both the operative performance and risk measures are
against the CS business case.
Positive implies that more than 50 % of the significant results are in favour of the CS business case.
Negative impliest that less than 50 % of the significant results are against the CS business case.
Neutral implies that 50 % (i.e. 1 out of 2 or 2 out of 4) significant results are in favour of the business case.
Healthcare Industrials Tech Telecom UtilitiesALL Basic MaterialsConsumer
cyclicals
Consumer non-
cyclicalsEnergy

102
Panel B: general on the CSP-CFP relationship
Environmental factors Governance factors
Positive Neutral Negative Non-neg % Positive Neutral Negative Non-neg %
Profitability 11 2 15 46% Profitability 1 0 11 8% Risk 20 5 5 83% Risk 6 1 1 88% Total 31 7 20 66% Total 7 1 12 40%
Social factors Controversies
Positive Neutral Negative Non-neg % Positive Neutral Negative Non-neg %
Profitability 15 2 15 53% Profitability 6 2 5 62% Risk 16 2 13 58% Risk 8 1 4 69% Total 31 4 28 56% Total 14 3 9 65%
negative findings as summarized in panel A, where the full sample, i.e. the ALL-column,
is excluded to avoid double counting. For instance, panel B shows that the environmental
and social factors in general have a positive to neutral impact on firm operational
performance, that governance factors tend to have a negative effect on operational
performance but lowering effect on risk, and that controversial business actions are
punished, in line with the CS business case. Based on this, using a composite measure
for CSP would clearly make no sense. Furthermore, the results for the controversy factors
support the finding of Van der Laan et al. (2008), that prospect theory can also be applied
to CSP issues since controversial CSP is evaluated differently than positive CSP.
Similarly, panel B shows that especially environmental and governance factors, but also
social factors, decrease company risk while sustainability-related controversies increase
risk, in line with a positive CSP–CFP relationship. That CSP reduces risk is consistent
with the results of e.g. Sassen et al. (2016), although they do not detect a significant effect
of corporate governance on firm risk.
7.12 Summary of the short-term results
Table 17 summarizes the short-term results. Models used by the majority of previous
research to study how CSP affects CFP are most similar to model 2 used in this thesis,
and therefore the short-term results can be argued to be more comparable to previous
findings than the other results obtained.
On a general level, the environmental, social and controversies factors have a rather
neutral effect on CFP with both negative and positive results, whereas governance is
found to impact CFP more negatively. However, as mentioned previously, governance is
found to mainly reduce the risk of a company and risk is not considered here.
Furthermore, as previously mentioned it may take a while before the effects of CSP
investments have an impact, and therefore it may be beneficial to view the short-term
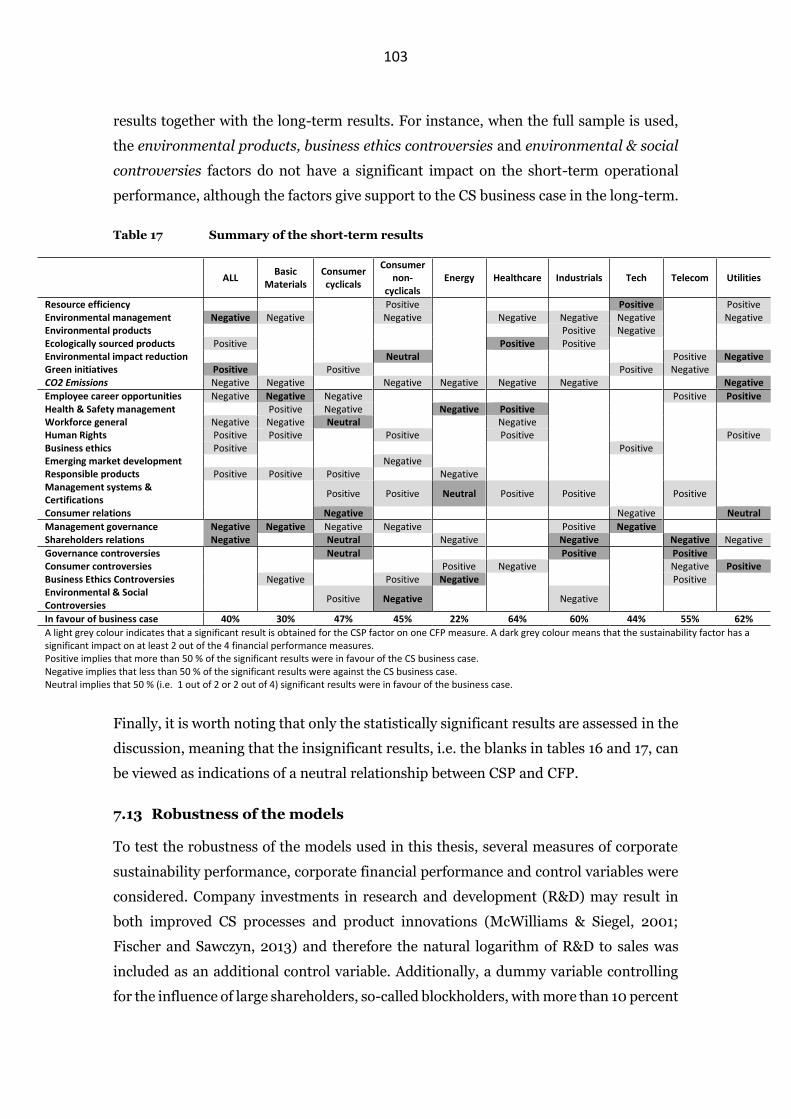
103
results together with the long-term results. For instance, when the full sample is used,
the environmental products, business ethics controversies and environmental & social
controversies factors do not have a significant impact on the short-term operational
performance, although the factors give support to the CS business case in the long-term.
Table 17 Summary of the short-term results
ALL Basic
Materials Consumer cyclicals
Consumer non-
cyclicals Energy Healthcare Industrials Tech Telecom Utilities
Resource efficiency Positive Positive Positive Environmental management Negative Negative Negative Negative Negative Negative Negative Environmental products Positive Negative
Ecologically sourced products Positive Positive Positive
Environmental impact reduction Neutral Positive Negative Green initiatives Positive Positive Positive Negative
CO2 Emissions Negative Negative Negative Negative Negative Negative Negative
Employee career opportunities Negative Negative Negative Positive Positive Health & Safety management Positive Negative Negative Positive
Workforce general Negative Negative Neutral Negative
Human Rights Positive Positive Positive Positive Positive Business ethics Positive Positive
Emerging market development Negative
Responsible products Positive Positive Positive Negative
Management systems & Certifications
Positive Positive Neutral Positive Positive Positive
Consumer relations Negative Negative Neutral
Management governance Negative Negative Negative Negative Positive Negative
Shareholders relations Negative Neutral Negative Negative Negative Negative
Governance controversies Neutral Positive Positive
Consumer controversies Positive Negative Negative Positive Business Ethics Controversies Negative Positive Negative Positive
Environmental & Social Controversies
Positive Negative Negative
In favour of business case 40% 30% 47% 45% 22% 64% 60% 44% 55% 62%
A light grey colour indicates that a significant result is obtained for the CSP factor on one CFP measure. A dark grey colour means that the sustainability factor has a significant impact on at least 2 out of the 4 financial performance measures. Positive implies that more than 50 % of the significant results were in favour of the CS business case. Negative implies that less than 50 % of the significant results were against the CS business case. Neutral implies that 50 % (i.e. 1 out of 2 or 2 out of 4) significant results were in favour of the business case.
Finally, it is worth noting that only the statistically significant results are assessed in the
discussion, meaning that the insignificant results, i.e. the blanks in tables 16 and 17, can
be viewed as indications of a neutral relationship between CSP and CFP.
7.13 Robustness of the models
To test the robustness of the models used in this thesis, several measures of corporate
sustainability performance, corporate financial performance and control variables were
considered. Company investments in research and development (R&D) may result in
both improved CS processes and product innovations (McWilliams & Siegel, 2001;
Fischer and Sawczyn, 2013) and therefore the natural logarithm of R&D to sales was
included as an additional control variable. Additionally, a dummy variable controlling
for the influence of large shareholders, so-called blockholders, with more than 10 percent

104
of the company’s shares was tested for. Both of these controls reduced the adjusted R-
squared values for the majority of the regressions when tested for using model 1 and
especially the R&D variable reduced the number of observations drastically. The
inclusion of these controls did not change the signs of the results, nor did they alter the
general inferences of the results, suggesting that the models used are robust to these
controls.
As the data for this study were gathered in the beginning of 2019 so that some data is
missing for 2018, I run regressions where the year 2018 is excluded entirely. This is done
to ensure that the limited data of the final year does not tilt the results in any direction,
causing biases. With 2018 excluded, for the short-term model (model 2), the ecologically
sourced products factor increases in significance from the 15 % level to the 10 % level
when ROA is the dependent variable. No other noticeable changes in significance or in
the signs of the relationships are found. Similarly, for the long-term regressions (using
model 1), p-values change in general between 0.05 and 0.1, implying small changes in
the significance of some variables but without causing noteworthy changes.
As mentioned in section 5.1.1.1, sin stocks are not controlled for in the main models. A
dummy variable controlling for stocks with activities related to alcohol, gambling,
tobacco, military armaments or pornography were therefore included in models 1 and 2
using the full sample, to see if it changes any of the results. For model 2, the sin dummy
was not significant for any of the dependent variables and both the signs of the
relationships, the R-squared values and the number of significant results remained
essentially unchanged. For model 1, sin stocks were found to increase sales growth and
reduce sales growth variability. The results remained essentially unchanged for the other
variables in support of the models being robust to this control.
Since companies from several countries with differing tax codes are included in the
sample, ROA defined as income after taxes may be criticized. To test for any effects of
taxes, depreciation and amortization, earnings before interests, taxes, depreciation and
amortization to total assets (EBITDA/TA) was also used as a dependent variable. ROA,
ROA_5 and ROA_RISK were all highly correlated with the equivalent EBITDA/TA -
measure (correlation coefficients of 0.88; 0.87 and 0.88 respectively), and the regression
results were in general very similar.
One of the ways that this paper contributes to the existing literature is that it provides a
more detailed insight of the CSP–CFP relationship, as more CSP factors are used than in
105
previous studies, and as the construction of these factors is more transparent than using
readily available sustainability dimensions from one of the ESG data providers. To test
the robustness of the methods used in this paper for the construction of the CSP factors,
I run regressions using the readily available sustainability dimensions provided by
Eikon. It can be noted that, ceteris paribus, the adjusted R-squared values are lower for
the regressions that use the sustainability dimensions from Eikon than for regressions
using the CSP factors constructed in this paper. This suggests that dividing Eikon’s CSP
dimensions further into factors can provide new and more detailed information
regarding the relationships between sustainability factors and CFP. Alternatively, the
weights used to calculate Eikon’s sustainability dimensions may not be optimal. The
interested reader finds the results for the regressions using model 1 with CSP variables
provided by Eikon summarized in appendix 7. The table aggregates the regressions using
operative and risk measures as dependent variables, but similarly to the other results in
this study, CSP is found to reduce company risk. This is consistent with previous research
(see e.g. Lee & Faff, 2009).
Finally, to test whether financial performance in fact is the determinant of CSP, I run
similar regressions as those of Waddock and Graves (1997), where a composite CSP score
is used as the dependent variable. One of the financial performance measures (SG, GM,
ROA, CFOTA), lagged by one year, is used as the independent variable, while controlling
for size, debt and age. The aggregated CSP measure is the sum of all environmental,
social and governance factor scores, deducted by the controversy factor scores. I also run
the regressions using the ESG scores provided by Eikon, which provides similar results.
The results indicate that lagged sales growth and lagged gross margin are predictors of
CSP. The results for the ROA and CFOTA variables are insignificant. Thus, there are
indications that support both the virtuous cycle and good management theories. This is
consistent with the findings of Tuppura et al. (2016) who show that there are differences
in the causal relationship depending on the CFP measures used.
7.14 Limitations of the study and suggestions for future research
As most empirical research, this study is likely to suffer from shortcomings that may
influence the inferences of the results. For instance, Adegbite et al. (2019) find that there
is a non-linear relationship between CSP and CFP. The authors show that medium levels
of CSP reduce financial performance, while both firms with high and low levels of CS
performance improve CFP. Indications of this is also found in the robustness checks of
this study, as sin stocks also seem to improve CFP. More advanced econometric models
106
could perhaps take the possible non-linearity into account. Also, for instance dynamic
panel models and /or additional control variables could also be useful.
As discoursed in section 3.6.3, European companies’ cost of capital would be an
especially interesting variable to include, due to the support of the European Union to
build a sustainable financial system within the union.
In line with several previous studies, I find that it is necessary to assess the CSP–CFP
relationship using several dimensions of sustainability. The results of this study indicate
that it would be useful to take even more aspects into account than has previously been
done. Hence, constructing own CSP factors in a transparent way could be interesting also
for future studies, perhaps using more advanced methods which could allow for
additional information to be used, for instance so that other variables than binary
variables would be included as well. Also, this paper has a rather general approach as
only variables that have a sufficient amount of observations for the full sample are
included. I therefore suggest that more industry-specific studies would be conducted, so
that industry-specific variables that aren’t applicable to all companies could be used. This
would enable a more in-depth view of which CSP variables that are of the highest
relevance in different industries and it would add to the research regarding material
sustainability factors. Furthermore, I suggest that future studies addressing the CSP–
CFP link move towards in-depth analysis of the relationship and away from the aggregate
scores and the categorisations of a firm being either sustainable or not.
As discoursed in chapter 2, only 35 % of major USA corporations can prove that they
follow their sustainability commitments (Parisi & Maraghini, 2010) Additionally, only 2
percent of companies actually achieve or exceed their sustainability transformation goals
in times of corporate transformation (Davis-Peccoud et al., 2016). Studies that would
control for companies that truly take action on sustainability related issues into account
and separate them from those that are not able to walk the talk, would surely be of high
value as well.
Finally, a major limitation of this study is that the positive externalities that high levels
of CSP encompass are not taken into account. In other words, as only the financial
impacts of CSP are measured, the total utility that higher CSP can provide is not
considered. Also, costs that are simply an unavoidable part of doing business (as
suggested by Ruf et al., 2001), have not been controlled for.
107
8 SUMMARY AND CONCLUSIONS
Aggregating a firm’s sustainability performance into a composite measure was
previously common praxis in research studying the CSP-CFP relationship. As some more
recent studies suggest however, CSP is a complex construct that should not be aggregated
into only one measure. In a world where sustainability issues have become ever more
important, determining the economically most relevant CSP factors is interesting to
several stakeholders. Thus, in order to add to the existing sustainability-financial
performance literature, the purpose of this study was to study the impact and materiality
of different sustainability dimensions on corporate operational performance and risk.
Because sustainability is multifaceted and difficult to measure and define accurately, an
entire industry with companies providing their estimates of how well firms perform on
sustainability issues has developed. The calculation methods behind the sustainability
scores often lack transparency and the scores have been shown to be inconsistent
between different providers. To construct the sustainability measures in a transparent
way, I use raw data points regarding the performance of European companies on several
sustainability issues between 2002 and 2018 and combine them into 21 CSP factors using
principal component analysis. These factors are then used in 3 separate regression
models with several different measures of corporate operational performance and risk as
dependent variables, to assess how CSP influences CFP in the long-term, in the short-
term and over different time-periods, for several economic sectors.
Businesses play a crucial role in the strive for a sustainable future by reducing their own
environmental and social impacts and by innovating new and sustainable products and
services. In general, the results of this study indicate that the CSP–CFP relationship is
non-negative and that the economic benefits from improving a company’s performance
on sustainability issues are shown to mainly stem from reduced firm risk. Especially
firms with a high performance on environmental and corporate governance factors are
found to be less prone to risk. When the operational and risk measures are aggregated,
66 percent of the significant results for the environmental factors, 56 percent of the
results for the social factors and 40 percent of the results for the governance factors
indicate a non-negative impact on corporate financial performance in the long-term.
Similarly, 65 percent of the significant controversy factors support the notion that
controversial activities on sustainability indicators decrease the financial performance of
a company. These percentages are only based on the statistically significant results,
108
meaning that the proportion of sustainability factors that do not affect financial
performance significantly are not considered.
For the full sample I find that companies that provide ecologically sourced products,
companies that report on green initiatives and companies that avoid environmental &
social controversies, as well as controversies related to business ethics, have both higher
operational performance and lower risk in the long-term. The results can to some extent
be seen as being in line with the resource-based view and shared value: strong corporate
sustainability competences can provide advantages in a firm’s competitive environment.
Thus, improving a firm’s corporate sustainability performance should not be seen as
managerial self-interest, since the financial impacts are generally non-negative.
Furthermore, it can be argued that support for the legitimacy theory is also found to some
extent, as firms with controversial activities are punished with lower financial
performance than their competitors. That controversial companies have higher risk is
also in line with the results of Chava (2014), who shows that obtaining equity capital for
these companies can be seen as more difficult and costlier than for others.
Additionally, I find statistically significant positive changes between the first period
(2002–07) and the last period (2014–18) for the resource efficiency, environmental
products and ecologically sourced products factors. This gives support to the view that
consumers increasingly try to make more environmentally responsible choices.
Contradicting the results of Edmans (2011), who finds that employee satisfaction
increases financial performance, I find that maintaining the health, safety, well-being
and satisfaction of a company’s workforce has a negative to neutral impact on the
financial performance. Although costly, investing in employee relations may have other
positive consequences that are not identified in this study however. It might also be that
the alternative of an unhappy workforce is detrimental in the long run and therefore,
investments in the workforce are simply an unavoidable cost of business. Another
possible explanation is that the workforce is so well protected through legislation etc.,
that investments beyond what is required is simply not value-enhancing, as suggested by
Auer and Schuhmacher (2016). Furthermore, the factors related to a company’s
workforce change quite a lot depending on the time period analysed. This is in line with
the results of Mǎnescu (2011), who finds that employee relations had a positive effect
prior to 2003 but a negative effect in later time periods. The results obtained can
therefore neither confirm nor reject the stakeholder theory, as mixed results are obtained
109
especially for those CSP factors that concern stakeholders, such as employee,
shareholder and consumer relations.
In the short-term results the share of significant outcomes in line with a positive CSP–
CFP relationship is 41 percent, 65 percent, 17 percent and 57 percent for the
environmental, social, governance and controversy factors, respectively. The slightly
more negative effects of environmental and corporate governance factors in the short-
term has two possible explanations. First, as has been proposed by the previous
literature, there may be a time lag from when the corporate sustainability investments
are initiated until the benefits are realized in the bottom line due to up-front
expenditures. A second explanation to that specifically the environmental and
governance factors are somewhat more negative in the short-term analysis, is that a high
performance on these sustainability pillars is found to mainly reduce firm risk (see panel
B of table 16), which is not measured in the short-term analyses.
Finally, many previous studies have found inconclusive results regarding the
sustainability-performance relationship. The results of this study can partly explain
these inconsistencies, as I find that the sign of the relationship is highly dependent on
several contextual factors: 1) which sustainability issues that are measured, 2) the
measures used as proxies for the financial performance, 3) the time period being
analysed, 4) the timing of the impact (long-term vs. short-term) and 5) the industry in
which a firm competes. Since the time-period being analysed is an important
determinant of the relationship it may be difficult to obtain a complete and permanent
picture of which sustainability matters that are materially important. For instance, as
demand increases from consumers and society at large for firms to become more
sustainable, it is likely that companies learn to take better advantage of the new
circumstances. Thus, I find it motivated to continuously update the knowledge about the
relationship between CSP and CFP, which seems to be dynamic in nature.
110
REFERENCES
Abdi, H., 2003. Factor rotations in factor analyses. Encyclopedia for Research Methods for the Social Sciences. Sage: Thousand Oaks, CA, pp.792-795.
Abdi, H. and Williams, L.J., 2010. Principal component analysis. Wiley interdisciplinary reviews: computational statistics, 2(4), pp.433-459.
Abor, J., 2005. The effect of capital structure on profitability: an empirical analysis of listed firms in Ghana. The journal of risk finance, 6(5), pp.438-445.
Adegbite, E., Guney, Y., Kwabi, F. and Tahir, S., 2019. Financial and corporate social performance in the UK listed firms: the relevance of non-linearity and lag effects. Review of Quantitative Finance and Accounting, pp.1-54.
Albuquerque, R., Koskinen, Y. and Zhang, C., 2018. Corporate social responsibility and firm risk: Theory and empirical evidence. Management Science. Articles in Advance, pp. 1–19.
Amato, L.H. and Amato, C.H., 2004. Firm size, strategic advantage, and profit rates in US retailing. Journal of Retailing and Consumer Services, 11(3), pp.181-193.
Amel-Zadeh, A. and Serafeim, G., 2018. Why and How Investors Use ESG Information: Evidence from a Global Survey. Financial Analysts Journal, 74(3), pp.1-17.
Arellano, M. (2003) Panel Data Econometrics, Oxford: Oxford University Press.
Artiach, T., Lee, D., Nelson, D. and Walker, J., 2010. The determinants of corporate sustainability performance. Accounting & Finance, 50(1), pp.31-51.
Auer, B.R. and Schuhmacher, F., 2016. Do socially (ir) responsible investments pay? New evidence from international ESG data. The Quarterly Review of Economics and Finance, 59, pp.51-62.
Aupperle, K.E., Carroll, A.B. and Hatfield, J.D., 1985. An empirical examination of the relationship between corporate social responsibility and profitability. Academy of management Journal, 28(2), pp.446-463.
Bajic, S. and Yurtoglu, B., 2018. Which aspects of CSR predict firm market value?. Journal of Capital Markets Studies, 2(1), pp.50-69
Baltagi, B., 2005. Econometric analysis of panel data. 3rd edition. John Wiley & Sons.
Banerjee, S.B., 2003. Who sustains whose development? Sustainable development and the reinvention of nature. Organization studies, 24(1), pp.143-180.

111
Banerjee, S. B. 2007. Corporate social responsibility: The good, the bad and the ugly. Cheltenham, Glos, UK; Northampton, MA: Edward Elgar.
Bansal, P., 2005. Evolving sustainably: A longitudinal study of corporate sustainable development. Strategic management journal, 26(3), pp.197-218.
Bansal, P. and DesJardine, M.R., 2014. Business sustainability: It is about time. Strategic Organization, 12(1), pp.70-78.
Barnett, M.L. and Salomon, R.M., 2006. Beyond dichotomy: The curvilinear relationship between social responsibility and financial performance. Strategic Management Journal, 27(11), pp.1101-1122.
Bassen, A. and Kovács, A.M., 2008. Environmental, Social and Governance Key Performance-Indicators from a Capital Market Perspective. Zeitschrift für Wirtschafts-und Unternehmensethik-Journal for Business, Economics & Ethics, 9(2), pp.182-192.
Baxter, N.D., 1967. Leverage, risk of ruin and the cost of capital. The Journal of Finance, 22(3), pp.395-403.
Berger, P.G. and Ofek, E., 1995. Diversification's effect on firm value. Journal of financial economics, 37(1), pp.39-65.
Bettis, R.A. and Mahajan, V., 1985. Risk/return performance of diversified firms. Management Science, 31(7), pp.785-799.
Bird, R., Hall, A.D., Momentè, F. and Reggiani, F., 2007. What corporate social responsibility activities are valued by the market?. Journal of business ethics, 76(2), pp.189-206.
Bird, R., Momenté, F. and Reggiani, F., 2012. The market acceptance of corporate social responsibility: a comparison across six countries/regions. Australian Journal of Management, 37(2), pp.153-168.
Borgers, A.C. and Pownall, R.A., 2014. Attitudes towards socially and environmentally responsible investment. Journal of Behavioral and Experimental Finance, 1, pp.27-44.
Bouslah, K., Kryzanowski, L. and M’Zali, B., 2013. The impact of the dimensions of social performance on firm risk. Journal of Banking & Finance, 37(4), pp.1258-1273.
Bowen, H. R. (1953). Social responsibilities of the businessman. New York: Harper & Row.
112
Bracker, J.S., Keats, B.W. and Pearson, J.N., 1988. Planning and financial performance among small firms in a growth industry. Strategic management journal, 9(6), pp.591-603.
Bragdon, J.H. and Marlin, J., 1972. Is pollution profitable. Risk management, 19(4), pp.9-18.
Brammer, S., Brooks, C. and Pavelin, S., 2006. Corporate social performance and stock returns: UK evidence from disaggregate measures. Financial management, 35(3), pp.97-116.
Breusch, T.S. and Pagan, A.R., 1979. A simple test for heteroscedasticity and random coefficient variation. Econometrica: Journal of the Econometric Society, pp.1287-1294.
Brooks, C. 2014. Introductory econometrics for finance. 3rd ed. Cambridge: Cambridge University Press.
Buchanan, B., Cao, C.X. and Chen, C., 2018. Corporate social responsibility, firm value, and influential institutional ownership. Journal of Corporate Finance, 52, pp.73-95.
Carroll, A.B., 1979. A three-dimensional conceptual model of corporate performance. Academy of management review, 4(4), pp.497-505.
Carroll, A.B., 1999. Corporate social responsibility: Evolution of a definitional construct. Business & society, 38(3), pp.268-295.
Carroll, A.B. and Shabana, K.M., 2010. The business case for corporate social responsibility: A review of concepts, research and practice. International journal of management reviews, 12(1), pp.85-105.
Cavaco, S. and Crifo, P., 2009. The CSP-CFP missing link: complementarity between environmental, social and governance practices?. Journal of Economic Literature, 14(L21), p.C33.
Chatterji, A.K., Durand, R., Levine, D.I. and Touboul, S., 2016. Do ratings of firms converge? Implications for managers, investors and strategy researchers. Strategic Management Journal, 37(8), pp.1597-1614.
Chava, S., 2014. Environmental externalities and cost of capital. Management Science, 60(9), pp.2223-2247.
Chen, C.M. and Delmas, M., 2011. Measuring corporate social performance: An efficiency perspective. Production and Operations Management, 20(6), pp.789-804.
113
Chen, G. and Åstebro, T., 2003. How to deal with missing categorical data: Test of a simple Bayesian method. Organizational Research Methods, 6(3), pp.309-327.
Cheng, B., Ioannou, I. and Serafeim, G., 2014. Corporate social responsibility and access to finance. Strategic management journal, 35(1), pp.1-23.
Christie, A.A., 1982. The stochastic behavior of common stock variances: Value, leverage and interest rate effects. Journal of financial Economics, 10(4), pp.407-432.
Cochran, P.L. and Wood, R.A., 1984. Corporate social responsibility and financial performance. Academy of management Journal, 27(1), pp.42-56.
Consolandi, C., Jaiswal-Dale, A., Poggiani, E. and Vercelli, A., 2009. Global standards and ethical stock indexes: The case of the Dow Jones Sustainability Stoxx Index. Journal of Business Ethics, 87(1), pp.185-197.
Cordeiro, J.J. and Tewari, M., 2015. Firm characteristics, industry context, and investor reactions to environmental CSR: A stakeholder theory approach. Journal of Business Ethics, 130(4), pp.833-849.
Costello, A.B. and Osborne, J.W., 2005. Best Practices in Exploratory Factor Analysis: Four Recommendations for Getting the Most From Your Analysis. Practical Assessment Research & Evaluation, 10(7), p.2.
Dahl, R. (2010). Greenwashing: Do You Know What You're Buying? Environmental Health Perspectives, 118(6), pp. 246–252.
Davenport, K., 2000. Corporate citizenship: A stakeholder approach for defining corporate social performance and identifying measures for assessing it. Business & Society, 39(2), pp.210-219.
Dechow, P.M., 1994. Accounting earnings and cash flows as measures of firm performance: The role of accounting accruals. Journal of accounting and economics, 18(1), pp.3-42.
Derwall, J., Günster, N., Bauer, R. and Koedijk, K., 2005. The eco-efficiency premium puzzle. Financial Analysts Journal, pp.51-63.
DiStefano, C., Zhu, M. and Mîndrilă, D., 2009. Understanding and using factor scores: Considerations for the applied researcher. Practical assessment, research & evaluation, 14(20), pp.1-11.
Dorfleitner, G., Halbritter, G. and Nguyen, M., 2015. Measuring the level and risk of corporate responsibility–An empirical comparison of different ESG rating approaches. Journal of Asset Management, 16(7), pp.450-466.
114
Dyllick, T. and Hockerts, K., 2002. Beyond the business case for corporate sustainability. Business strategy and the environment, 11(2), pp.130-141.
Eberhart, A.C., Maxwell, W.F. and Siddique, A.R., 2004. An examination of long‐term abnormal stock returns and operating performance following R&D increases. The Journal of Finance, 59(2), pp.623-650.
Eccles, R.G., Krzus, M.P., Rogers, J. and Serafeim, G., 2012. The need for sector‐specific materiality and sustainability reporting standards. Journal of Applied Corporate Finance, 24(2), pp.65-71.
Eccles, R.G., Serafeim, G. and Krzus, M.P., 2011. Market interest in nonfinancial information. Journal of Applied Corporate Finance, 23(4), pp.113-127.
Eccles, R., & G., Serafeim. 2013. The Performance Frontier: Innovating for a Sustainable Strategy. Harvard Business Review 91, no. 5: 50–60.
Edmans, A., 2011. Does the stock market fully value intangibles? Employee satisfaction and equity prices. Journal of Financial economics, 101(3), pp.621-640.
Escrig-Olmedo, E., Muñoz-Torres, M.J. and Fernandez-Izquierdo, M.A., 2010. Socially responsible investing: sustainability indices, ESG rating and information provider agencies. International journal of sustainable economy, 2(4), pp.442-461.
Etzion, D. and Ferraro, F., 2010. The role of analogy in the institutionalization of sustainability reporting. Organization Science, 21(5), pp.1092-1107.
Fama, E.F. and French, K.R., 2000. Forecasting profitability and earnings. The Journal of Business, 73(2), pp.161-175.
Figge, F. and Hahn, T., 2004. Sustainable value added—measuring corporate contributions to sustainability beyond eco-efficiency. Ecological economics, 48(2), pp.173-187.
Fischer, T.M. and Sawczyn, A.A., 2013. The relationship between corporate social performance and corporate financial performance and the role of innovation: Evidence from German listed firms. Journal of Management Control, 24(1), pp.27-52.
Frederick, W.C., 1994. From CSR1 to CSR2: The maturing of business-and-society thought. Business & Society, 33(2), pp.150-164.
Freeman, R. E. 1984. Strategic management: A stakeholder approach. Boston: Pitman.
Freeman, R.E., 1994. The politics of stakeholder theory: Some future directions. Business ethics quarterly, pp.409-421.

115
Friede, G., Busch, T. & Bassen, A. (2015). ESG and financial performance: aggregated evidence from more than 2000 empirical studies. Journal of Sustainable Finance & Investment, vol. 5, no. 4, pp. 210-233.
Friedman, M., 1970. The social responsibility of business is to increase its profits. New York Times Magazine, September 13: 32-33, 122, 124, 126.
Gale, B.T., 1972. Market share and rate of return. The Review of Economics and Statistics, pp.412-423.
Galema, R., Plantinga, A. and Scholtens, B., 2008. The stocks at stake: Return and risk in socially responsible investment. Journal of Banking & Finance, 32(12), pp.2646-2654.
Ghosh, D. and Vogt, A., 2012, July. Outliers: An evaluation of methodologies. In Joint statistical meetings (pp. 3455-3460). San Diego, CA: American Statistical Association.
Ghoul, S., Guedhami, O., Kwok, C.C. and Mishra, D.R., 2011. Does corporate social responsibility affect the cost of capital?. Journal of Banking & Finance, 35(9), pp.2388-2406.
Gibson, R.B., 2006. Beyond the pillars: sustainability assessment as a framework for effective integration of social, economic and ecological considerations in significant decision-making. Journal of Environmental Assessment Policy and Management, 8(03), pp.259-280.
Goodland, R., 1995. The concept of environmental sustainability. Annual review of ecology and systematics, 26(1), pp.1-24.
Goodland, R. and Daly, H., 1996. Environmental sustainability: universal and non‐negotiable. Ecological applications, 6(4), pp.1002-1017.
Goss, A. and Roberts, G.S., 2011. The impact of corporate social responsibility on the cost of bank loans. Journal of Banking & Finance, 35(7), pp.1794-1810.
Griffin, J.J. and Mahon, J.F., 1997. The corporate social performance and corporate financial performance debate: Twenty-five years of incomparable research. Business & society, 36(1), pp.5-31.
Hackston, D. and Milne, M.J., 1996. Some determinants of social and environmental disclosures in New Zealand companies. Accounting, Auditing & Accountability Journal, 9(1), pp.77-108.
Halbritter, G. and Dorfleitner, G., 2015. The wages of social responsibility—where are they? A critical review of ESG investing. Review of Financial Economics, 26, pp.25-35.
116
Hammond, G.P., 2006, February. ‘People, planet and prosperity’: the determinants of humanity's environmental footprint. In Natural Resources Forum (Vol. 30, No. 1, pp. 27-36). Oxford, UK: Blackwell Publishing Ltd.
Hart, S.L. and Ahuja, G., 1996. Does it pay to be green? An empirical examination of the relationship between emission reduction and firm performance. Business strategy and the Environment, 5(1), pp.30-37.
Hillman, A.J. and Keim, G.D., 2001. Shareholder value, stakeholder management, and social issues: what's the bottom line?. Strategic management journal, 22(2), pp.125-139.
Heikkurinen, P., 2010. Image differentiation with corporate environmental responsibility. Corporate social responsibility and environmental management, 17(3), pp.142-152.
Hong, H. and Kacperczyk, M., 2009. The price of sin: The effects of social norms on markets. Journal of Financial Economics, 93(1), pp.15-36.
Ioannou, I., Serafeim, G., 2017. The Consequences of Mandatory Corporate Sustainability Reporting. Harvard Business School Research, Working Paper No. 11-100.
Jackson, D.A., 1993. Stopping rules in principal components analysis: a comparison of heuristical and statistical approaches. Ecology, 74(8), pp.2204-2214.
Jensen, M.C., 1986. Agency costs of free cash flow, corporate finance, and takeovers. The American economic review, 76(2), pp.323-329.
Jensen, M.C., 2001. Value maximization, stakeholder theory, and the corporate objective function. Journal of applied corporate finance, 14(3), pp.8-21.
Jo, H. and Harjoto, M.A., 2012. The causal effect of corporate governance on corporate social responsibility. Journal of business ethics, 106(1), pp.53-72.
Johnson, R. and Soenen, L., 2003. Indicators of successful companies. European Management Journal, 21(3), pp.364-369.
Jones, T.M., 1995. Instrumental stakeholder theory: A synthesis of ethics and economics. Academy of management review, 20(2), pp.404-437.
Kaiser, H.F., 1958. The varimax criterion for analytic rotation in factor analysis. Psychometrika, 23(3), pp.187-200.
Kang, Y.C., 1995. Before-profit corporate social responsibility and stakeholder management systems. Unpublished doctoral dissertation, University of Pittsburgh.

117
Kempf, A. and Osthoff, P., 2007. The effect of socially responsible investing on portfolio performance. European Financial Management, 13(5), pp.908-922.
Ketola, T., 2010. Five leaps to corporate sustainability through a corporate responsibility portfolio matrix. Corporate Social Responsibility and Environmental Management, 17(6), pp.320-336.
Khan, M., Serafeim, G. and Yoon, A., 2016. Corporate sustainability: First evidence on materiality. The accounting review, 91(6), pp.1697-1724.
Knapp, M., Gart, A. and Chaudhry, M., 2006. The impact of mean reversion of bank profitability on post-merger performance in the banking industry. Journal of Banking & Finance, 30(12), pp.3503-3517.
Kotsantonis, S., Pinney, C. and Serafeim, G., 2016. ESG integration in investment management: Myths and realities. Journal of Applied Corporate Finance, 28(2), pp.10-16.
Kramer, M.R. and Porter, M., 2011. Creating shared value. Harvard business review, 89(1/2), pp.62-77.
Krishnan, V.S. and Moyer, R.C., 1997. Performance, capital structure and home country: an analysis of Asian corporations. Global Finance Journal, 8(1), pp.129-143.
Lanis, R. and Richardson, G., 2012. Corporate social responsibility and tax aggressiveness: a test of legitimacy theory. Accounting, Auditing & Accountability Journal, 26(1), pp.75-100.
Lee, J., 2009. Does size matter in firm performance? Evidence from US public firms. International Journal of the economics of Business, 16(2), pp.189-203.
Lee, D.D. and Faff, R.W., 2009. Corporate sustainability performance and idiosyncratic risk: A global perspective. Financial Review, 44(2), pp.213-237.
Liang, H. and Renneboog, L., 2017. On the foundations of corporate social responsibility. The Journal of Finance, 72(2), pp.853-910.
Lins, K.V., Servaes, H. and Tamayo, A., 2017. Social capital, trust, and firm performance: The value of corporate social responsibility during the financial crisis. The Journal of Finance, 72(4), pp.1785-1824.
Litz, R.A., 1996. A resource-based-view of the socially responsible firm: Stakeholder interdependence, ethical awareness, and issue responsiveness as strategic assets. Journal of Business Ethics, 15(12), pp.1355-1363.
118
Lopatta, K. and Kaspereit, T., 2014. The world capital markets’ perception of sustainability and the impact of the financial crisis. Journal of Business Ethics, 122(3), pp.475-500.
Lopez, V. M., Garcia, A., & Rodriguez, L. 2007. Sustainable development and corporate performance: A study based on the Dow Jones Sustainability Index. Journal of Business Ethics, 75: 285-300.
Majumdar, S.K., 1997. The impact of size and age on firm-level performance: some evidence from India. Review of industrial organization, 12(2), pp.231-241
Mǎnescu, C., 2011. Stock returns in relation to environmental, social and governance performance: Mispricing or compensation for risk?. Sustainable development, 19(2), pp.95-118.
Margaritis, D. and Psillaki, M., 2010. Capital structure, equity ownership and firm performance. Journal of banking & finance, 34(3), pp.621-632.
Margolis, J.D. and Walsh, J.P., 2003. Misery loves companies: Rethinking social initiatives by business. Administrative science quarterly, 48(2), pp.268-305.
McWilliams, A. and Siegel, D., 2001. Corporate social responsibility: A theory of the firm perspective. Academy of management review, 26(1), pp.117-127.
Miller, K. and Serafeim, G., 2014. Chief sustainability officers: Who are they and what do they do?. Working paper.
Montiel, I., 2008. Corporate social responsibility and corporate sustainability: Separate pasts, common futures. Organization & Environment, 21(3), pp.245-269.
Montiel, I. and Delgado-Ceballos, J., 2014. Defining and measuring corporate sustainability: Are we there yet?. Organization & Environment, 27(2), pp.113-139.
Moskowitz, M., 1972. Choosing socially responsible stocks. Business and Society Review, 1(1), pp.71-75.
Nelling, E. and Webb, E., 2009. Corporate social responsibility and financial performance: the “virtuous circle” revisited. Review of Quantitative Finance and Accounting, 32(2), pp.197-209
Oikonomou, I., Brooks, C. and Pavelin, S., 2012. The impact of corporate social performance on financial risk and utility: A longitudinal analysis. Financial Management, 41(2), pp.483-515.
Orlitzky, M., Schmidt, F.L. and Rynes, S.L., 2003. Corporate social and financial performance: A meta-analysis. Organization studies, 24(3), pp.403-441.

119
Parisi, C. and Maraghini, M.P., 2010. Operationalising sustainability: How small and medium sized enterprises translate social and environmental issues into practice. Business Performance Measurement and Management (pp. 131-147). Springer, Berlin, Heidelberg.
Peloza, J. and Papania, L., 2008. The missing link between corporate social responsibility and financial performance: Stakeholder salience and identification. Corporate Reputation Review, 11(2), pp.169-181.
Peloza, J., 2009. The challenge of measuring financial impacts from investments in corporate social performance. Journal of Management, 35(6), pp.1518-1541.
Perez‐Quiros, G. and Timmermann, A., 2000. Firm size and cyclical variations in stock returns. The Journal of Finance, 55(3), pp.1229-1262.
Perrini, F., Russo, A., Tencati, A. and Vurro, C., 2011. Deconstructing the relationship between corporate social and financial performance. Journal of Business Ethics, 102(1), pp.59-76.
Porter, M.E. and Advantage, C., 1985. Creating and sustaining superior performance. Competitive advantage, 167.
Porter, M.E. and Kramer, M.R., 2006. The link between competitive advantage and corporate social responsibility. Harvard business review, 84(12), pp.78-92.
Rehbein, K., Waddock, S. and Graves, S.B., 2004. Understanding shareholder activism: Which corporations are targeted?. Business & Society, 43(3), pp.239-267.
Renneboog, L., Ter Horst, J. and Zhang, C., 2008. The price of ethics and stakeholder governance: The performance of socially responsible mutual funds. Journal of Corporate Finance, 14(3), pp.302-322.
Ross, S.A., 1973. The economic theory of agency: The principal's problem. The American economic review, 63(2), pp.134-139.
Rowley, T. and Berman, S., 2000. A brand new brand of corporate social performance. Business & society, 39(4), pp.397-418.
Ruf, B.M., Muralidhar, K., Brown, R.M., Janney, J.J. and Paul, K., 2001. An empirical investigation of the relationship between change in corporate social performance and financial performance: A stakeholder theory perspective. Journal of business ethics, 32(2), pp.143-156.
Sassen, R., Hinze, A.K. and Hardeck, I., 2016. Impact of ESG factors on firm risk in Europe. Journal of business economics, 86(8), pp.867-904.
Schreck, P., 2011. Reviewing the business case for corporate social responsibility: New evidence and analysis. Journal of Business Ethics, 103(2), p.167.
120
Schuler, D.A. and Cording, M., 2006. A corporate social performance–corporate financial performance behavioral model for consumers. Academy of Management Review, 31(3), pp.540-558.
Sen, S., Bhattacharya, C. B., & Korschun, D. 2006. The role of corporate social responsibility in strengthening multiple stakeholder relationships: A field experiment. Journal of the Academy of Marketing Science, 34: 158-166.
Servaes, H. and Tamayo, A., 2013. The impact of corporate social responsibility on firm value: The role of customer awareness. Management science, 59(5), pp.1045-1061.
Sprinkle, G.B. and Maines, L.A., 2010. The benefits and costs of corporate social responsibility. Business Horizons, 53(5), pp.445-453.
Suchman, M.C., 1995. Managing legitimacy: Strategic and institutional approaches. Academy of management review, 20(3), pp.571-610.
Suto, M. and Takehara, H., 2016. The link between corporate social performance and financial performance: Empirical evidence from Japanese firms. International Journal of Corporate Strategy and Social Responsibility, 1(1), pp.4-25.
Tuppura, A., Arminen, H., Pätäri, S. and Jantunen, A., 2016. Corporate social and financial performance in different industry contexts: the chicken or the egg?. Social Responsibility Journal, 12(4), pp.672-686.
Turban, D.B. and Greening, D.W., 1997. Corporate social performance and organizational attractiveness to prospective employees. Academy of management journal, 40(3), pp.658-672.
Van der Laan, G., Van Ees, H. and Van Witteloostuijn, A., 2008. Corporate social and financial performance: An extended stakeholder theory, and empirical test with accounting measures. Journal of Business Ethics, 79(3), pp.299-310.
Van Marrewijk, M., 2003. Concepts and definitions of CSR and corporate sustainability: Between agency and communion. Journal of business ethics, 44(2-3), pp.95-105.
Waddock, S.A. and Graves, S.B., 1997. The corporate social performance–financial performance link. Strategic management journal, 18(4), pp.303-319.
Wagner, M., 2010. The role of corporate sustainability performance for economic performance: A firm-level analysis of moderation effects. Ecological Economics, 69(7), pp.1553-1560.
Walker, K. and Wan, F., 2012. The harm of symbolic actions and green-washing: Corporate actions and communications on environmental performance and their financial implications. Journal of business ethics, 109(2), pp.227-242.
121
Wartick, S.L. and Cochran, P.L., 1985. The evolution of the corporate social performance model. Academy of management review, 10(4), pp.758-769.
Wernerfelt, B., 1984. A resource‐based view of the firm. Strategic management journal, 5(2), pp.171-180.
Williams, B., Onsman, A. and Brown, T., 2010. Exploratory factor analysis: A five-step guide for novices. Australasian Journal of Paramedicine, 8(3).
Wimmer, M., 2013. ESG-persistence in Socially Responsible Mutual Funds. Journal of Management and Sustainability, 3(1), p.9.
Wood, D.J., 1991. Corporate social performance revisited. Academy of management review, 16(4), pp.691-718.
Wood, D.J., 2010. Measuring corporate social performance: A review. International Journal of Management Reviews, 12(1), pp.50-84.
Wood, D.J. and Jones, R.E., 1995. Stakeholder mismatching: A theoretical problem in empirical research on corporate social performance. The International Journal of Organizational Analysis, 3(3), pp.229-267.
Wooldridge, J. M. 2009. Introductory econometrics: A modern approach. 4th ed. Mason, Ohio: South-Western.
Wooldridge, J. M. 2012. Introductory econometrics: A modern approach. 5th ed. Mason, Ohio: South-Western.
Zuccolotto, P., 2012. Principal component analysis with interval imputed missing values. Advances in Statistical Analysis, 96(1), pp.1-23.
ELECTRONIC REFERENCES
Cottrell, A. and Lucchetti, R., 2019. Gretl user’s guide. Available at: gretl.sourceforge.net/gretl-help/gretl-guide.pdf. [Accessed 18 Jun. 2019].
Davis-Peccoud, J., Stone, P. and Tovey, C. (2016). Achieving Breakthrough Results in Sustainability. [online] Bain. Available at: https://www.bain.com/insights/achieving-breakthrough-results-in-sustainability [Accessed 3 Mar. 2019].
DVFA/EFFAS (Deutsche Vereinigung für Finanzanalyse und Asset Management /The European Federation Of Financial Analysts Societies), 2009. KPIs for ESG. A guideline for the integration of ESG into financial analysis and corporate valuation. Version, 1.2. Available at:
122
https://ec.europa.eu/docsroom/documents/1547/attachments/1/translations/en/renditions/pdf. [Accessed 19 Feb. 2019].
European Commission, 2001. Green paper: Promoting a European framework for Corporate Social Responsibility. Brussels 18.7.2001: DOC/01/9. Available at: http://ec.europa.eu/transparency/regdoc/rep/1/2001/EN/1-2001-366-EN-1-0.Pdf. [Accessed 20 Mar. 2019].
European Commission (2011). A renewed EU strategy 2011-14 for Corporate Social Responsibility, European Parliament. Brussels: European Commission. Available at: http://www.europarl.europa.eu/meetdocs/2009_2014/documents/com/com_com(2011)0681_/com_com(2011)0681_en.pdf. [Accessed 3 Mar. 2019].
European Commission, 2019. Sustainable finance. Available at: https://ec.europa.eu/info/business-economy-euro/banking-and-finance/sustainable-finance_en#overview. [Accessed 27 Jun. 2019].
European Parliament (2014). Directive 2014/95/EU of the European Parliament and of the Council. Strasbourg: European Parliament. Available at: https://eur-lex.europa.eu/legal-content/EN/TXT/?uri=CELEX:32014L0095. [Accessed 20 Feb. 2019].
Eurosif, 2018. European SRI study 2018. November 19, 2018. Available at: www.eurosif.org/wp-content/uploads/2018/11/European-SRI-2018-Study-LR.pdf. [Accessed 27 Jun. 2019].
Eurostat, 2018. Environmental protection expenditure accounts. Available at: https://ec.europa.eu/eurostat/statistics-explained/index.php/Environmental_protection_expenditure_accounts. [Accessed 15 Apr. 2019].
Fagerström, N., 26.6.2019. Ett fyra dagars filmmaraton motsvarar en persons flygresa från Helsingfors till Stockholm: “Det är en obekväm sanning man inte vill tala om”. YLE. Available at: https://svenska.yle.fi/artikel/2019/06/26/ett-fyra-dagars-filmmaraton-motsvarar-en-persons-flygresa-fran-helsingfors-till. [Accessed 27 Jun 2019]
GreenBiz, 2018. State of the Profession 2018. Available at: https://info.greenbiz.com/rs/211-NJY-165/images/State%20of%20the%20Profession%202018%20Report.pdf?mkt_tok=eyJpIjoiT0dNNFlXSm1ZemRrWlRSaSIsInQiOiJUUFZZNUF6TFZTM2tvNUw5dytrY2JydWJiTUpqT1R5MEJJTnY4NThhaHZzcmxmSXkrRDdDZzZOTXJ5ZXE0T05zUmdUZXZqRlh3KytJYWZRaUlrQlFOU0N0ajVLYWFRNXhaakpzOFRmeEVcLzJXekFqWHhZbVRPVWxGa2dSbDRuemMifQ%3D%3D. [Accessed 14 Feb. 2019].
IBM, n.a. KMO and Bartlett’s test. IBM Knowledge Center. Available at: https://www.ibm.com/support/knowledgecenter/SSLVMB_26.0.0/statistics_c
123
asestudies_project_ddita/spss/tutorials/fac_telco_kmo_01.html. [Accessed 30 May 2019].
Intergovernmental Panel on Climate Change (2018). IPCC Special Report on Global Warming of 1.5 °C. Incheon: IPCC. Available at: http://ipcc.ch/report/sr15/. [Accessed 19 Feb. 2019].
International Organization for Standardization (2018). ISO 26000 Social responsibility. [online] Available at: https://iso26000.info/iso26000/. [Accessed 20 Mar. 2019].
Lacy, P., Cooper, T., Hayward, R., & Neuberger, L. 2010. A new era of sustainability: UN Global Compact – Accenture CEO study 2010. Available at: https://www.unglobalcompact.org/docs/news_events/8.1/UNGC_Accenture_CEO_Study_2010.pdf. [Accessed 3 Mar. 2019].
Li, C., and Wang, B., 2014. Principal component analysis. Available at: https://www.google.com/url?sa=t&rct=j&q=&esrc=s&source=web&cd=2&cad=rja&uact=8&ved=2ahUKEwjst5ym9JrjAhWypYsKHV4gAuMQFjABegQIAhAC&url=http%3A%2F%2Fwww.ccs.neu.edu%2Fhome%2Fvip%2Fteach%2FMLcourse%2F5_features_dimensions%2Flecture_notes%2FPCA%2FPCA.pdf&usg=AOvVaw2SzWEaL4RPYGUqlLsnb6kS. [Accessed 4 Jul. 2019].
Lydenberg, S.D., Rogers, J. and Wood, D., 2010. From transparency to performance: Industry-based sustainability reporting on key issues. Cambridge, MA: Hauser Center for Nonprofit Organizations. Available at: https://iri.hks.harvard.edu/files/iri/files/iri_transparency-to-performance.pdf. [Accessed 19 Feb. 2019].
Principles for Responsible Investment, 2018. Annual Report. Available at: https://www.unpri.org/Uploads/z/b/u/pri_ar2018_761642.pdf. [Accessed 3 Mar. 2019].
RobecoSam, 2019. Country Sustainability Ranking Update – November 2018. Available at: https://www.robecosam.com/media/9/7/2/97240b9afc893d103d558ce50f066bc5_2018-11-robecosam-country-sustainability-ranking-en_tcm1011-16188.pdf. [Accessed 27 Jun. 2019].
Sitawi, 2016. Materiality of ESG KPIs: A Perspective From Brazil. Available at: https://www.sitawi.net/wp-content/uploads/2016/01/Sitawi_Materiality-of-ESG-PIs.pdf. [Accessed 19 Feb. 2019].
SPSS, 2018. SPSS Factor Analysis – Beginners Tutorial. SPSS-Tutorials. Available at: https://www.spss-tutorials.com/spss-factor-analysis-tutorial/. [Accessed 29 May 2019].

124
United Nations, 2019. About the Sustainable Development Goals. Available at: https://www.un.org/sustainabledevelopment/sustainable-development-goals/. [Accessed 27 Jun. 2019].
World Commission for Environmental and Development (1987). Our common future. New York, NY: Oxford University Press. Available at: http://www.un-documents.net/wced-ocf.htm. [Accessed 8 Apr. 2019].

125
APPENDIX 1 VARIABLES INCLUDED IN THE ENVIRONMENTAL FACTORS
Resource efficiency 1. Has the company set targets or objectives to be achieved on energy efficiency? 2. Does the company set specific objectives to be achieved on resource efficiency? 3. Has the company set targets or objectives to be achieved on water efficiency?
Environmental management 1. Does the company report on its environmental expenditures or does the company report to make proactive environmental investments to reduce future risks or increase future opportunities? 2. Does the company report on initiatives to reduce, reuse, recycle, substitute, or phase out SOx (sulfur oxides) or NOx (nitrogen oxides) emissions? 3. Does the company report on making proactive environmental investments or expenditures to reduce future risks or increase future opportunities? 4. Does the company report on its participation in any emissions trading initiative? 5. Does the company report on its impact on biodiversity or on activities to reduce its impact on the native ecosystems and species, as well as the biodiversity of protected and sensitive areas? 6. Does the company report on initiatives to reduce, substitute, or phase out particulate matter less than ten microns in diameter (PM10)? 7. Does the company report or provide information on company-generated initiatives to restore the environment? 8. Does the company claim to have an ISO 14000 or EMS certification? 9. Does the company report on initiatives to reduce, substitute, or phase out volatile organic compounds (VOC)?
Environmental products 1. Does the company report about product features and applications or services that will promote responsible, efficient, cost-effective and environmentally preferable use? 2. Does the company reports about take-back procedures and recycling programmes to reduce the potential risks of products entering the environment or does the company report about product features or services that will promote responsible and environmentally preferable use? 3. Does the company report on at least one product line or service that is designed to have positive effects on the environment or which is environmentally labeled and marketed? 4. Does the company report on specific products which are designed for reuse, recycling or the reduction of environmental impacts? 5. Does the company develop products or technologies for use in the clean, renewable energy (such as wind, solar, hydro and geo-thermal and biomass power)? 6. Does the company develop new products that are marketed as reducing noise emissions? 7. Does the company develop products and services that improve the energy efficiency of buildings? 8. Does the company develop products or technologies that are used for water treatment, purification or that improve water use efficiency? 9. Does the company reports about take-back procedures and recycling programs to reduce the potential risks of products entering the environment? 10. Is the company developing hybrid vehicles?
126
Ecologically sourced products 1. Does the company report or show initiatives to produce or promote organic food or other products? 2. Does the company claim to produce, source or distribute wood or forest products that are labeled (e.g., Forest Stewardship Council (FSC))? 3. Has the company established a program or an initiative to reduce, phase out or substitute for animal testing?
Environmental impact reduction 1. Is the company aware that climate change can represent commercial risks and/or opportunities? 2. Does the company report on partnerships or initiatives with specialized NGOs, industry organizations, governmental or supra-governmental organizations, which are focused on improving environmental issues? 3. Does the company explain how it engages with its stakeholders? 4. Does the company have a CSR committee or team? 5. Does the company publish a separate CSR/H&S/Sustainability report or publish a section in its annual report on CSR/H&S/Sustainability? 6. Does the company have a policy to improve emission reduction? 7. Does the company make use of renewable energy? 8. Does the company use environmental criteria (ISO 14000, energy consumption, etc) in the selection process of its suppliers or sourcing partners? 9. Does the company have a policy to improve its water efficiency? 10. Does the company have a policy to include its supply chain in the company's efforts to lessen its overall environmental impact? 11. Does the company have an environmental management team? 12. Does the company train its employees on environmental issues? 13. Does the company have a policy to improve its energy efficiency? 14. Does the company have a policy for reducing the use of natural resources or to lessen the environmental impact of its supply chain? 15. Has the company signed the UN Global Compact? 16. Has the company set targets or objectives to be achieved on emission reduction? 17. Does the company report on initiatives to recycle, reduce, reuse, substitute, treat or phase out total waste? 18. Does the company claim to use environmental criteria (e.g., life cycle assessment) to source or eliminate materials? 19. Does the company report or show to be ready to end a partnership with a sourcing partner, if environmental criteria are not met? 20. Does the company report on initiatives to reduce the environmental impact on land owned, leased or managed for production activities or extractive use?
Green initiatives 1. Does the company report on initiatives to reduce the environmental impact of transportation used for its staff? 2. Does the company report on initiatives to recycle, reduce, reuse, substitute, treat or phase out e-waste? 3. Does the company have a policy to improve its use of sustainable packaging? 4. Does the company report about environmentally friendly or green sites or offices? 5. Does the company report on initiatives to reduce, reuse, substitute or phase out toxic chemicals or substances?
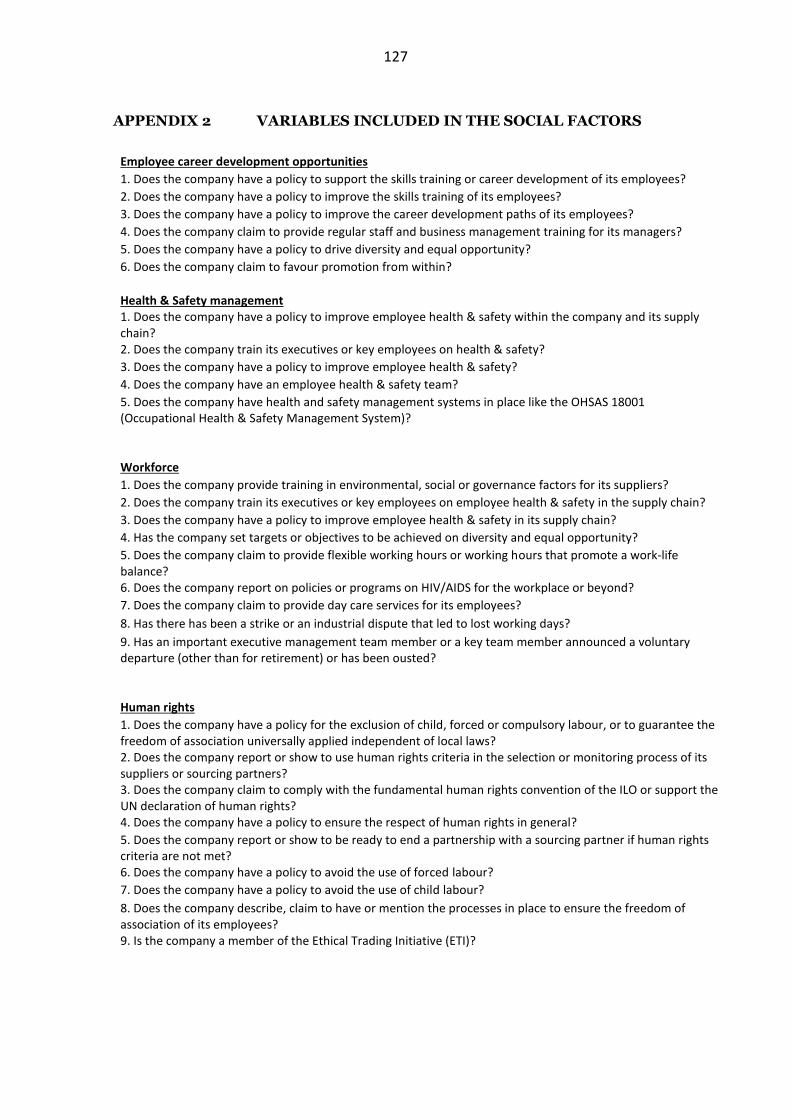
127
APPENDIX 2 VARIABLES INCLUDED IN THE SOCIAL FACTORS
Employee career development opportunities
1. Does the company have a policy to support the skills training or career development of its employees?
2. Does the company have a policy to improve the skills training of its employees?
3. Does the company have a policy to improve the career development paths of its employees?
4. Does the company claim to provide regular staff and business management training for its managers?
5. Does the company have a policy to drive diversity and equal opportunity?
6. Does the company claim to favour promotion from within?
Health & Safety management 1. Does the company have a policy to improve employee health & safety within the company and its supply chain? 2. Does the company train its executives or key employees on health & safety?
3. Does the company have a policy to improve employee health & safety?
4. Does the company have an employee health & safety team?
5. Does the company have health and safety management systems in place like the OHSAS 18001 (Occupational Health & Safety Management System)?
Workforce
1. Does the company provide training in environmental, social or governance factors for its suppliers?
2. Does the company train its executives or key employees on employee health & safety in the supply chain?
3. Does the company have a policy to improve employee health & safety in its supply chain?
4. Has the company set targets or objectives to be achieved on diversity and equal opportunity?
5. Does the company claim to provide flexible working hours or working hours that promote a work-life balance? 6. Does the company report on policies or programs on HIV/AIDS for the workplace or beyond?
7. Does the company claim to provide day care services for its employees?
8. Has there has been a strike or an industrial dispute that led to lost working days?
9. Has an important executive management team member or a key team member announced a voluntary departure (other than for retirement) or has been ousted?
Human rights
1. Does the company have a policy for the exclusion of child, forced or compulsory labour, or to guarantee the freedom of association universally applied independent of local laws? 2. Does the company report or show to use human rights criteria in the selection or monitoring process of its suppliers or sourcing partners? 3. Does the company claim to comply with the fundamental human rights convention of the ILO or support the UN declaration of human rights? 4. Does the company have a policy to ensure the respect of human rights in general?
5. Does the company report or show to be ready to end a partnership with a sourcing partner if human rights criteria are not met? 6. Does the company have a policy to avoid the use of forced labour?
7. Does the company have a policy to avoid the use of child labour?
8. Does the company describe, claim to have or mention the processes in place to ensure the freedom of association of its employees? 9. Is the company a member of the Ethical Trading Initiative (ETI)?
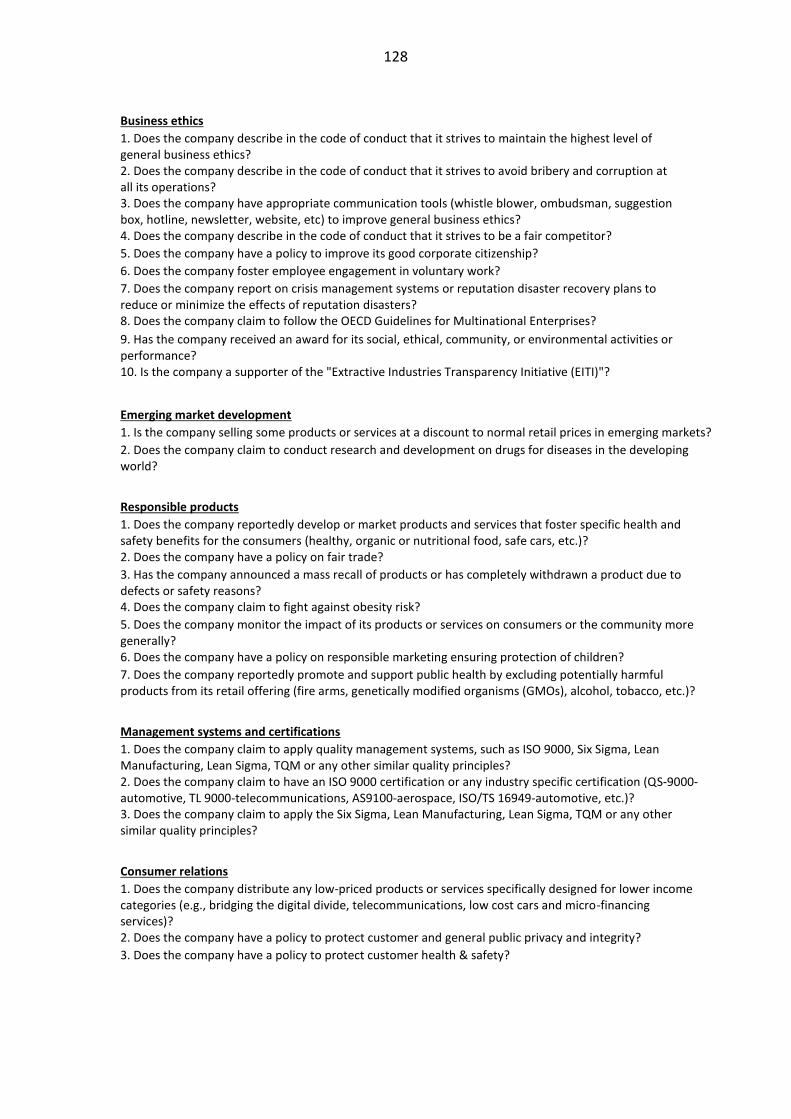
128
Business ethics
1. Does the company describe in the code of conduct that it strives to maintain the highest level of general business ethics? 2. Does the company describe in the code of conduct that it strives to avoid bribery and corruption at all its operations? 3. Does the company have appropriate communication tools (whistle blower, ombudsman, suggestion box, hotline, newsletter, website, etc) to improve general business ethics? 4. Does the company describe in the code of conduct that it strives to be a fair competitor?
5. Does the company have a policy to improve its good corporate citizenship?
6. Does the company foster employee engagement in voluntary work?
7. Does the company report on crisis management systems or reputation disaster recovery plans to reduce or minimize the effects of reputation disasters? 8. Does the company claim to follow the OECD Guidelines for Multinational Enterprises?
9. Has the company received an award for its social, ethical, community, or environmental activities or performance? 10. Is the company a supporter of the "Extractive Industries Transparency Initiative (EITI)"?
Emerging market development
1. Is the company selling some products or services at a discount to normal retail prices in emerging markets?
2. Does the company claim to conduct research and development on drugs for diseases in the developing world?
Responsible products
1. Does the company reportedly develop or market products and services that foster specific health and safety benefits for the consumers (healthy, organic or nutritional food, safe cars, etc.)? 2. Does the company have a policy on fair trade?
3. Has the company announced a mass recall of products or has completely withdrawn a product due to defects or safety reasons? 4. Does the company claim to fight against obesity risk?
5. Does the company monitor the impact of its products or services on consumers or the community more generally? 6. Does the company have a policy on responsible marketing ensuring protection of children?
7. Does the company reportedly promote and support public health by excluding potentially harmful products from its retail offering (fire arms, genetically modified organisms (GMOs), alcohol, tobacco, etc.)?
Management systems and certifications
1. Does the company claim to apply quality management systems, such as ISO 9000, Six Sigma, Lean Manufacturing, Lean Sigma, TQM or any other similar quality principles? 2. Does the company claim to have an ISO 9000 certification or any industry specific certification (QS-9000-automotive, TL 9000-telecommunications, AS9100-aerospace, ISO/TS 16949-automotive, etc.)? 3. Does the company claim to apply the Six Sigma, Lean Manufacturing, Lean Sigma, TQM or any other similar quality principles?
Consumer relations
1. Does the company distribute any low-priced products or services specifically designed for lower income categories (e.g., bridging the digital divide, telecommunications, low cost cars and micro-financing services)? 2. Does the company have a policy to protect customer and general public privacy and integrity?
3. Does the company have a policy to protect customer health & safety?
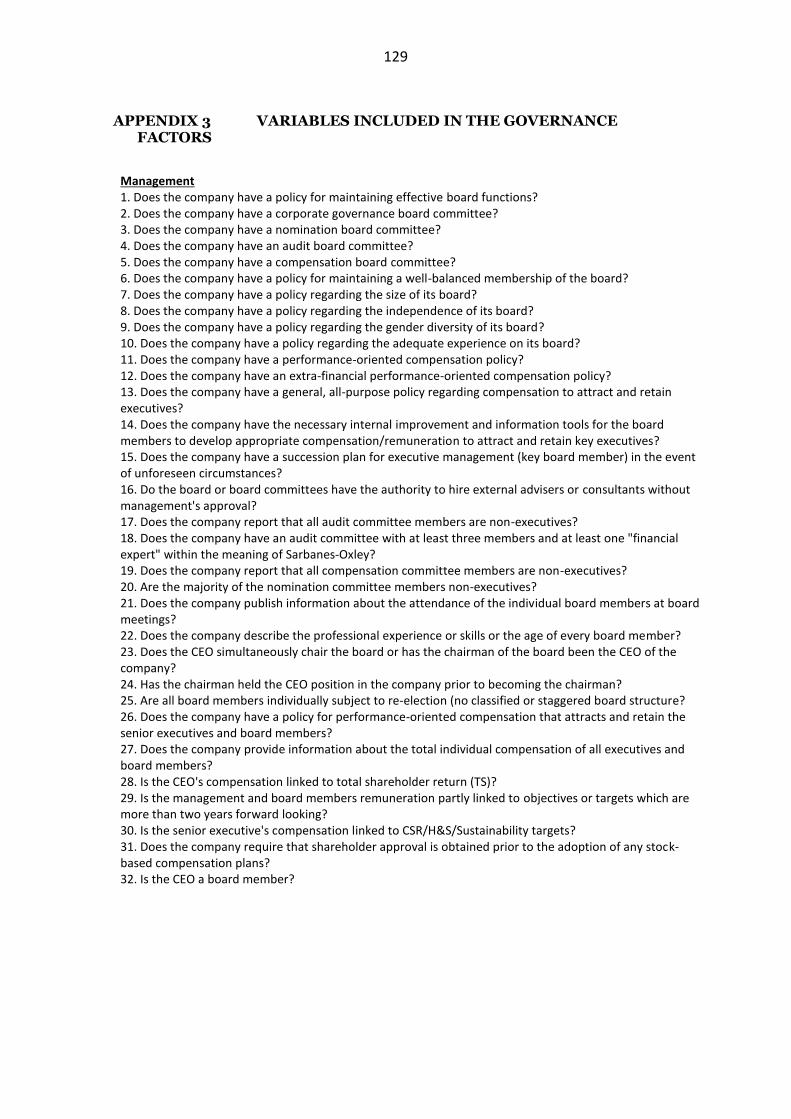
129
APPENDIX 3 VARIABLES INCLUDED IN THE GOVERNANCE FACTORS
Management 1. Does the company have a policy for maintaining effective board functions? 2. Does the company have a corporate governance board committee? 3. Does the company have a nomination board committee? 4. Does the company have an audit board committee? 5. Does the company have a compensation board committee? 6. Does the company have a policy for maintaining a well-balanced membership of the board? 7. Does the company have a policy regarding the size of its board? 8. Does the company have a policy regarding the independence of its board? 9. Does the company have a policy regarding the gender diversity of its board? 10. Does the company have a policy regarding the adequate experience on its board? 11. Does the company have a performance-oriented compensation policy? 12. Does the company have an extra-financial performance-oriented compensation policy? 13. Does the company have a general, all-purpose policy regarding compensation to attract and retain executives? 14. Does the company have the necessary internal improvement and information tools for the board members to develop appropriate compensation/remuneration to attract and retain key executives? 15. Does the company have a succession plan for executive management (key board member) in the event of unforeseen circumstances? 16. Do the board or board committees have the authority to hire external advisers or consultants without management's approval? 17. Does the company report that all audit committee members are non-executives? 18. Does the company have an audit committee with at least three members and at least one "financial expert" within the meaning of Sarbanes-Oxley? 19. Does the company report that all compensation committee members are non-executives? 20. Are the majority of the nomination committee members non-executives? 21. Does the company publish information about the attendance of the individual board members at board meetings? 22. Does the company describe the professional experience or skills or the age of every board member? 23. Does the CEO simultaneously chair the board or has the chairman of the board been the CEO of the company? 24. Has the chairman held the CEO position in the company prior to becoming the chairman? 25. Are all board members individually subject to re-election (no classified or staggered board structure? 26. Does the company have a policy for performance-oriented compensation that attracts and retain the senior executives and board members? 27. Does the company provide information about the total individual compensation of all executives and board members? 28. Is the CEO's compensation linked to total shareholder return (TS)? 29. Is the management and board members remuneration partly linked to objectives or targets which are more than two years forward looking? 30. Is the senior executive's compensation linked to CSR/H&S/Sustainability targets? 31. Does the company require that shareholder approval is obtained prior to the adoption of any stock-based compensation plans? 32. Is the CEO a board member?

130
Shareholders
1. Does the company have a policy for ensuring equal treatment of minority shareholders, facilitating shareholder engagement or limiting the use of anti-takeover devices? 2. Does the company have a policy to apply the one-share, one-vote principle?
3. Does the company have a policy to facilitate shareholder engagement, resolutions or proposals?
4. Does the company have shares with different voting right?
5. Does the company treat all shareholders equally?
6. Does the company have shares with a voting cap (ceiling? clause, ownership ceilings or control share acquisition provision? 7. Has the company set requirements for a minimum number of shares to vote?
8. Are the company's board members generally elected with a majority vote?
9. Do the company's shareholders have the right to vote on executive compensation?
10. Is the company in the process of a material earnings restatement?
11. Has the company issued a profit warning during the year?
12. Does the company have a classified board structure? Classified board structure is one in which different classes of directors serve for different term lengths. Board terms are often classified in order to thwart unfriendly takeover attempts, since potential acquirers would have to wait longer before they could take control of a company's board through the normal voting procedure.
CSR Strategy 1. Does the company have a CSR committee or team?
2. Has the company signed the UN Global Compact?
3. Does the company explain how it engages with its stakeholders?
4. Does the company publish a separate CSR/H&S/Sustainability report or publish a section in its annual report on CSR/H&S/Sustainability?
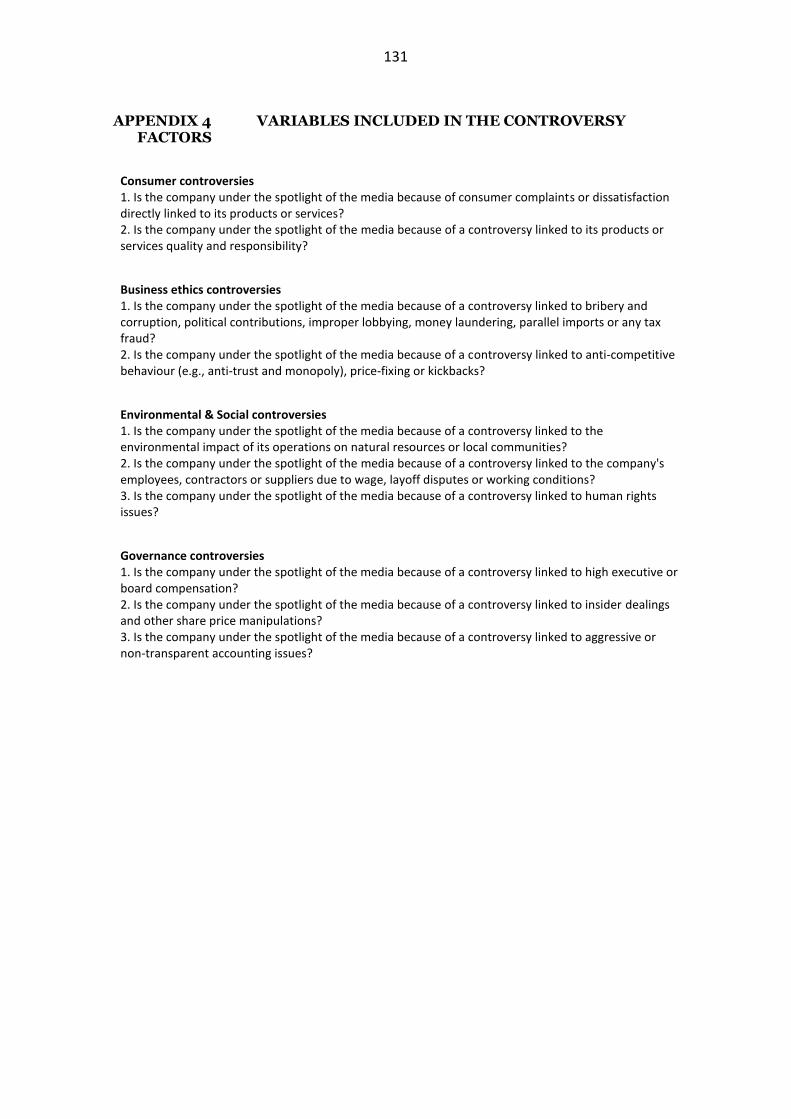
131
APPENDIX 4 VARIABLES INCLUDED IN THE CONTROVERSY FACTORS
Consumer controversies 1. Is the company under the spotlight of the media because of consumer complaints or dissatisfaction directly linked to its products or services? 2. Is the company under the spotlight of the media because of a controversy linked to its products or services quality and responsibility?
Business ethics controversies 1. Is the company under the spotlight of the media because of a controversy linked to bribery and corruption, political contributions, improper lobbying, money laundering, parallel imports or any tax fraud? 2. Is the company under the spotlight of the media because of a controversy linked to anti-competitive behaviour (e.g., anti-trust and monopoly), price-fixing or kickbacks?
Environmental & Social controversies 1. Is the company under the spotlight of the media because of a controversy linked to the environmental impact of its operations on natural resources or local communities? 2. Is the company under the spotlight of the media because of a controversy linked to the company's employees, contractors or suppliers due to wage, layoff disputes or working conditions? 3. Is the company under the spotlight of the media because of a controversy linked to human rights issues?
Governance controversies 1. Is the company under the spotlight of the media because of a controversy linked to high executive or board compensation? 2. Is the company under the spotlight of the media because of a controversy linked to insider dealings and other share price manipulations? 3. Is the company under the spotlight of the media because of a controversy linked to aggressive or non-transparent accounting issues?

132
APPENDIX 5 VARIABLE DEFINITIONS
Panel A: Short-term dependent variables
Measure of Operative measure
Abbreviation Formula used
Demand Sales
Growth SG (
𝐶𝑢𝑟𝑟𝑒𝑛𝑡 𝑦𝑒𝑎𝑟′𝑠 𝑠𝑎𝑙𝑒𝑠
𝑃𝑟𝑒𝑣𝑖𝑜𝑢𝑠 𝑦𝑒𝑎𝑟′𝑠 𝑠𝑎𝑙𝑒𝑠− 1) × 100%.
Profitability Gross
Margin GM 𝑁𝑒𝑡 𝑠𝑎𝑙𝑒𝑠 − 𝑐𝑜𝑠𝑡𝑠 𝑜𝑓 𝑔𝑜𝑜𝑑𝑠 𝑠𝑜𝑙𝑑 (𝐶𝑂𝐺𝑆)
𝑁𝑒𝑡 𝑠𝑎𝑙𝑒𝑠× 100 %
Asset utilization
Return on assets
ROA 𝐼𝑛𝑐𝑜𝑚𝑒 𝑎𝑓𝑡𝑒𝑟 𝑡𝑎𝑥𝑒𝑠
𝐴𝑣𝑒𝑟𝑎𝑔𝑒 𝑡𝑜𝑡𝑎𝑙 𝑎𝑠𝑠𝑒𝑡𝑠× 100%
Asset utilization
Operating cash flows
to total assets
CFOTA 𝐶𝑎𝑠ℎ 𝑓𝑙𝑜𝑤𝑠 𝑓𝑟𝑜𝑚 𝑜𝑝𝑒𝑟𝑎𝑡𝑖𝑛𝑔 𝑎𝑐𝑡𝑖𝑣𝑖𝑡𝑖𝑒𝑠
𝑇𝑜𝑡𝑎𝑙 𝑎𝑠𝑠𝑒𝑡𝑠× 100%
Panel B: Operative measures for the 5-year sample
Measure of Operative measure
Abbreviation 5-year equivalent calculated as
Demand Sales CAGR
SG_5 ((𝑆𝑎𝑙𝑒𝑠𝑡
𝑆𝑎𝑙𝑒𝑠𝑡−5)
1/5
− 1) × 100 %
Profitability Gross
Margin GM_5
Arithmetic average of observations between time t and t-4
Asset utilization
Return on assets
ROA_5 Arithmetic average of observations between time
t and t-4
Asset utilization
Operating cash flows
to total assets
CFOTA_5 Arithmetic average of observations between time
t and t-4
Panel C: Risk measures for the 5-year sample
Measure of
Measure of
operative risk
Abbreviation 5-year equivalent calculated as
Demand Sales
growth variability
SG_RISK Ln(Standard deviation of SG from time t-4 to
time t)
Profitability GM
variability GM_RISK
Ln(Standard deviation of GM from time t-4 to time t)
Asset utilization
ROA variability
ROA_RISK Ln(Standard deviation of ROA from time t-4 to
time t)
Asset utilization
CFOTA variability
CFOTA_RISK Ln(Standard deviation of CFOTA from time t-4
to time t)

133
APPENDIX 6 CORRELATION MATRIX OF INDEPENDENT VARIABLES
Size Leverage Age Resource
efficiency
Environmen
tal
manageme
nt
Environmen
tal products
Ecologically
sourced
products
Environmen
tal impact
reduction
Emission &
waste
reduction
Employee
career
opportuniti
es
Health &
Safety
manageme
nt
Workforce
general
Human
Rights
Business
ethics
Emerging
market
developme
nt
Responsibl
e products
Manageme
nt systems
&
Certificatio
ns
Consumer
relations
Manageme
nt
governance
Shareholde
rs relations
Governance
controversi
es
Consumer
controversi
es
Business
Ethics
Controversi
es
Environmen
t & Social
Controversi
es
Size 1
Leverage 0.2 1
Age 0.18 0 1
Resource efficiency 0.38 0.02 0.14 1
Environmental management 0.56 0.08 0.13 0.35 1
Environmental products 0.34 0 0.19 0.28 0.4 1
Ecologically sourced products 0.13 0 0.07 0.27 0.11 0.11 1
Environmental impact reduction 0.5 0.04 0.16 0.48 0.61 0.58 0.3 1
Emission & waste reduction 0.25 0 0.11 0.28 0.22 0.4 0.29 0.54 1
Employee career opportunities 0.3 0.03 0.13 0.22 0.38 0.47 0.18 0.67 0.43 1
Health & Safety management 0.29 0.02 0.07 0.25 0.48 0.44 0.13 0.66 0.31 0.57 1
Workforce general 0.53 0.02 0.12 0.41 0.45 0.41 0.24 0.62 0.45 0.44 0.4 1
Human Rights 0.37 0 0.14 0.31 0.38 0.44 0.24 0.66 0.44 0.51 0.46 0.6 1
Business ethics 0.43 0.07 0.09 0.3 0.46 0.51 0.15 0.69 0.43 0.6 0.59 0.53 0.62 1
Emerging market development 0.17 0 0.01 0.15 0.15 0.07 0.17 0.13 0.18 0.07 0.06 0.23 0.15 0.15 1
Responsible products 0.28 0.08 0.15 0.3 0.32 0.31 0.34 0.45 0.37 0.34 0.32 0.39 0.38 0.36 0.13 1
Management systems & Certifications 0.18 0.03 0.1 0.15 0.36 0.37 0 0.35 0.19 0.32 0.37 0.2 0.25 0.34 0.01 0.48 1
Consumer relations 0.35 0.07 0.07 0.24 0.29 0.38 0.22 0.53 0.43 0.45 0.35 0.48 0.51 0.57 0.24 0.41 0.19 1
Management governance 0.08 0 0 0.11 0.16 0.26 0.13 0.42 0.29 0.42 0.45 0.28 0.37 0.53 0.09 0.18 0.05 0.37 1
Shareholders relations 0.08 0 0.01 0.06 0.15 0.27 0.05 0.35 0.2 0.41 0.39 0.27 0.34 0.45 0.04 0.2 0.14 0.34 0.58 1
Governance controversies 0.14 0 0 0.06 0.04 0 0.04 0.04 0.02 0 0 0.09 0.04 0.03 0.04 0.01 0 0.05 0.02 0.02 1
Consumer controversies 0.28 0.03 0.03 0.13 0.16 0.13 0.13 0.18 0.2 0.11 0.1 0.27 0.18 0.18 0.22 0.19 0.02 0.24 0.13 0.12 0.13 1
Business Ethics Controversies 0.38 0.01 0.04 0.16 0.25 0.19 0.06 0.24 0.15 0.14 0.15 0.31 0.23 0.23 0.16 0.14 0.07 0.23 0.1 0.1 0.14 0.3 1
Environment & Social Controversies 0.25 0 0.02 0.1 0.22 0.12 0.02 0.18 0.08 0.1 0.12 0.28 0.18 0.17 0.03 0.12 0.05 0.13 0.14 0.11 0.1 0.21 0.25 1
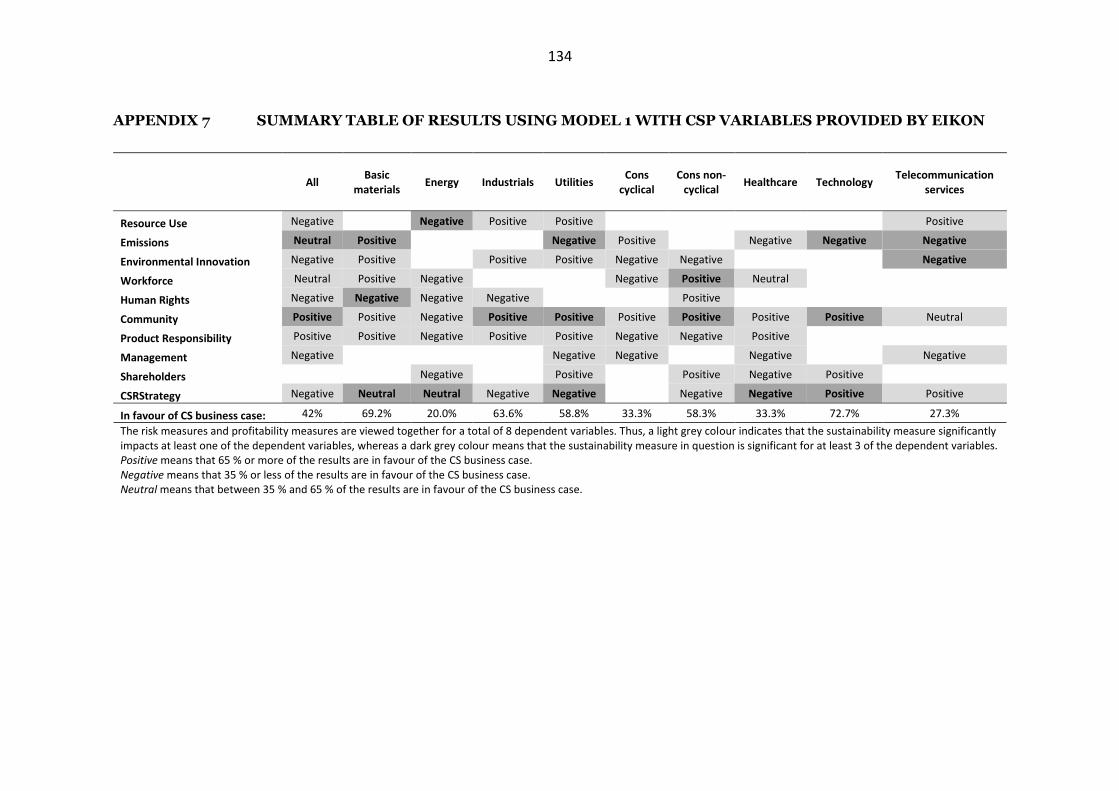
134
APPENDIX 7 SUMMARY TABLE OF RESULTS USING MODEL 1 WITH CSP VARIABLES PROVIDED BY EIKON
All Basic
materials Energy Industrials Utilities
Cons cyclical
Cons non-cyclical
Healthcare Technology Telecommunication
services
Resource Use Negative Negative Positive Positive Positive
Emissions Neutral Positive Negative Positive Negative Negative Negative
Environmental Innovation Negative Positive Positive Positive Negative Negative Negative
Workforce Neutral Positive Negative Negative Positive Neutral
Human Rights Negative Negative Negative Negative Positive
Community Positive Positive Negative Positive Positive Positive Positive Positive Positive Neutral
Product Responsibility Positive Positive Negative Positive Positive Negative Negative Positive
Management Negative Negative Negative Negative Negative
Shareholders Negative Positive Positive Negative Positive
CSRStrategy Negative Neutral Neutral Negative Negative Negative Negative Positive Positive
In favour of CS business case: 42% 69.2% 20.0% 63.6% 58.8% 33.3% 58.3% 33.3% 72.7% 27.3%
The risk measures and profitability measures are viewed together for a total of 8 dependent variables. Thus, a light grey colour indicates that the sustainability measure significantly impacts at least one of the dependent variables, whereas a dark grey colour means that the sustainability measure in question is significant for at least 3 of the dependent variables. Positive means that 65 % or more of the results are in favour of the CS business case. Negative means that 35 % or less of the results are in favour of the CS business case. Neutral means that between 35 % and 65 % of the results are in favour of the CS business case.