Embed Size (px)
Citation preview

Mon. Not. R. Astron. Soc. (2012) doi:10.1111/j.1745-3933.2012.01299.x
Determining the Hubble constant using giant extragalactic H II regionsand H II galaxies
Ricardo Chavez,1� Elena Terlevich,1† Roberto Terlevich,1,2† Manolis Plionis,1,3
Fabio Bresolin,4 Spyros Basilakos5,6 and Jorge Melnick7
1Instituto Nacional de Astrofısica, Optica y Electronica, AP 51 y 216, 72000, Puebla, Mexico2Institute of Astronomy, University of Cambridge, Madingley Rd, CB3 OHA, Cambridge3Institute of Astronomy & Astrophysics, National Observatory of Athens, Thessio, 11810 Athens, Greece4Institute for Astronomy of the University of Hawaii, 2680 Woodlawn Drive, 96822 Honolulu, HI, USA5Academy of Athens Research Center for Astronomy & Applied Mathematics, Soranou Efessiou 4, 11-527 Athens, Greece6High Energy Physics Group, Department ECM, Universitat de Barcelona, Av. Diagonal 647, E-08028 Barcelona, Spain7European Southern Observatory, Alonso de Cordova 3107, Santiago de Chile 19, Chile
Accepted 2012 June 8. Received 2012 June 8; in original form 2012 March 28
ABSTRACTWe report the first results of a long-term programme aiming to provide accurate indepen-dent estimates of the Hubble constant (H0) using the L(Hβ)–σ distance estimator for giantextragalactic H II regions (GEHR) and H II galaxies.
We have used Very Large Telescope and Subaru high-dispersion spectroscopic observationsof a local sample of H II galaxies, identified in the Sloan Digital Sky Survey Data Release 7(SDSS DR7) catalogue in order to redefine and improve the L(Hβ)–σ distance indicator and todetermine the Hubble constant. To this end, we utilized as local calibration or ‘anchor’ of thiscorrelation GEHR in nearby galaxies which have accurate distance measurements determinedvia primary indicators. Using our best sample of 69 nearby H II galaxies and 23 GEHR innine galaxies, we obtain H0 = 74.3 ± 3.1 (statistical) ± 2.9 (systematic) km s−1 Mpc−1, inexcellent agreement with, and independently confirming, the most recent Type Ia supernovaebased results.
Key words: H II regions – cosmological parameters – distance scale.
1 IN T RO D U C T I O N
The accurate determination of the Hubble constant, H0, is con-sidered one of the most fundamental tasks in the interface betweenastronomy and cosmology. The importance of measuring the expan-sion rate of the Universe to high precision stems from the fact thatH0, besides providing cosmic distances, is also a prerequisite forindependent constraints on the mass-energy content of the Universe(e.g. Suyu et al. 2012).
The direct determination of the Hubble constant can only be ob-tained by measuring cosmic distances and mapping the local expan-sion of the Universe, since the Hubble relation, cz = H0 d, is validand independent of the mass-energy content of the Universe onlylocally (z � 0.15). A variety of methods have been used to estimateH0, based on Cepheids, surface brightness fluctuations, masers, thetip of the red giant branch (TRGB) or Type Ia supernovae (SNe Ia;for general reviews, see Jackson 2007; Tammann, Sandage & Reindl2008; Freedman & Madore 2010). In particular, the use of SNe Ia
�E-mail: [email protected]†Visiting Professor UAM, Madrid.
to measure the Hubble constant has a long history in astronomy(e.g. Sandage & Tammann 1982, 1990). The subsequent discoveryof the correlation between the magnitude at peak brightness and therate at which it declines thereafter (e.g. Phillips 1993) allowed thereduction of the distance determination intrinsic scatter. However,one has to remember that SNe Ia are secondary indicators and theiruse relies on the determination of well-established local calibrators,such as the Large Magellanic Cloud (LMC), Galactic Cepheids andthe ‘maser’ galaxy NGC 4258 (cf. Riess et al. 2011).
Indirect methods to measure H0 have also been developed (e.g.Bonamente et al. 2006; Suyu et al. 2010; Beutler et al. 2011);however, all of the indirect methods use as priors other cosmologicalparameters, and thus the resulting H0 determinations are modeldependent.
Returning to the direct method to estimate H0, an importantbreakthrough occurred a decade or so ago by the Hubble SpaceTelescope (HST) Calibration programme (Saha et al. 2001; Sandageet al. 2006), which found Cepheids in local galaxies that host SNe Iaand provided a Cepheid-based zero-point calibration, and by theHST Key project (Freedman et al. 2001), which furnished a valueof H0 = 72 ± 2(random) ± 7 (systematic) km s−1 Mpc−1, based onCepheid distances of external galaxies and the LMC as the first rung
C© 2012 The AuthorsMonthly Notices of the Royal Astronomical Society C© 2012 RAS
L2 R. Chavez et al.
of the distance ladder. This value was recently revised by the sameauthors, using a new Cepheid zero-point (Benedict et al. 2007) andthe new SNe Ia of Hicken et al. (2009), to a similar but less uncertainvalue of H0 = 73 ± 2 (random) ± 4 (systematic) km s−1 Mpc−1 (seeFreedman & Madore 2010). Tammann et al. (2008) used a variety oflocal calibrators to recalibrate the SNe Ia and found a significantlylower value of H0 = 62.3 ± 4 km s−1 Mpc−1. The difference hassince been explained as being due to a variety of external causes,among which are the use of heavily reddened Galactic Cepheidsand of less accurate photographic data (Riess et al. 2009a,b).
The most recent analysis of Riess et al. (2011) uses new HSToptical and infrared observations of 600 Cepheid variables to de-termine the distance to eight galaxies hosting recent SNe Ia. Theresulting best estimate for the Hubble constant is H0 = 73.8 ±2.4 km s−1 Mpc−1 including random and systematic errors.
From the above discussion, it becomes clear that SNe Ia are theonly tracers of the Hubble expansion utilized to date, over a rel-atively wide redshift range (0 � z � 1.5). Therefore, due to thegreat importance of direct determinations of the Hubble constantfor cosmological studies (e.g. Suyu et al. 2012), it is highly desir-able to independently confirm the SNe Ia-based H0 value by usingan alternative tracer.
H II galaxies have been proposed as such an alternative. Theyare massive and compact (in many cases unresolved) bursts of starformation in dwarf galaxies. The luminosity of H II galaxies is com-pletely overpowered by that of the starburst. As a consequence, theyshow the spectrum of a young H II region, which indeed is what theyare, hence their name. Their similarity with giant extragalactic H II
regions (GEHR) is underlined by the fact that the first examples ofprototype H II galaxies, I Zw18 and II Zw40, were called ‘isolatedextragalactic H II regions’ and found to be observationally indistin-guishable from GEHR in nearby galaxies (Sargent & Searle 1970).They are discovered mainly in spectroscopic surveys due to theirstrong narrow emission lines, i.e. very large equivalent widths.
It is important to emphasize that the optical properties of H II
galaxies are those of the young burst with almost no information (orcontamination) from the parent galaxy. This is a direct consequenceof selecting H II galaxies as those systems with the largest equivalentwidth (W) in their emission lines, i.e. W(Hβ) > 50 Å.
Because the starburst component can reach very high luminosity,H II galaxies can be observed at large redshifts (z > 3). What makesthese galaxies interesting as cosmological distance probes (cf.Melnick, Terlevich & Terlevich 2000; Siegel et al. 2005) is the factthat as the mass of the starburst component increases, both the num-ber of ionizing photons and the turbulent velocity of the gas, which isdominated by the star and gas gravitational potential, also increase.This induces a correlation between the luminosity of recombinationlines, e.g. L(Hβ), and the ionized gas velocity dispersion σ (seeTerlevich & Melnick 1981; Hippelein 1986; Melnick, Terlevich &Moles 1988; Fuentes-Masip et al. 2000; Melnick et al. 2000; Telles,Munoz-Tunon & Tenorio-Tagle 2001; Bosch, Terlevich & Terlevich2002; Siegel et al. 2005; Bordalo & Telles 2011).
A first attempt to estimate H0, using H II galaxies and GEHRas local calibrators, was presented in Melnick et al. (1988). Theuse of H II galaxies as deep cosmological tracers was discussed byMelnick et al. (2000) and Siegel et al. (2005). Recently, we presenteda thorough investigation of the viability of using H II galaxies toconstrain the dark energy equation of state, accounting also forthe effects of gravitational lensing, which are expected to be non-negligible for very high redshift ‘standard candles’ and we showedthat indeed H II galaxies can provide an important cosmologicalprobe (Plionis et al. 2011).
The aim of the current Letter is to use H II galaxies and a localcalibration of the L(Hβ)–σ relation based on GEHR of nearbygalaxies, as an alternative direct approach for estimating the Hubbleconstant over a redshift range of 0.01 < z < 0.16.
2 SA M P L E SE L E C T I O N A N D O B S E RVATI O N S
A sample of 128 H II galaxies was selected from the SDSS DR7spectroscopic data release (Abazajian et al. 2009) within a redshiftrange 0.01 < z < 0.16, chosen for being compact (D < 5 arcsec),having large Balmer emission line fluxes and equivalent widths.A lower limit for the equivalent width of Hβ of 50 Å was chosento avoid starbursts that are either evolved or contaminated by anunderlying older stellar population component (cf. Melnick et al.2000). The redshift lower limit was chosen to minimize the effectsof local peculiar motions relative to the Hubble flow and the upperlimit to minimize any possible Malmquist bias and to avoid grosscosmological effects.
In order to improve the parameters of the L(Hβ)–σ relation ob-tained from previous work, high-resolution echelle spectroscopyfor the H II galaxy sample was performed at 8-m class telescopes.We used the Ultraviolet and Visual Echelle Spectrograph (UVES;Dekker et al. 2000) at the European Southern Observatory VeryLarge Telescope (VLT) in Chile and the High Dispersion Spectro-graph (HDS; Noguchi et al. 2002; Sato et al. 2002) at the NationalAstronomical Observatory of Japan Subaru Telescope on MaunaKea, Hawaii. The chosen set-ups provided UVES spectra centredat 5800 Å with a slit width of 2 arcsec, giving a spectral resolutionof ∼22 000. The HDS spectra were centred at ∼5400 Å, and with aslit width of 4 arcsec the spectral resolution obtained was ∼9000.
To obtain accurate total Hβ fluxes for the H II galaxy sample,we performed long-slit spectrophotometry at 2-m class telescopesunder photometric conditions and using a slit width (8 arcsec) largerthan the upper limit of the H II galaxies size in our sample. We usedthe Boller and Chivens spectrographs at the 2.1-m telescope of theObservatorio Astronomico Nacional in San Pedro Martir and at the2.1-m telescope of the Observatorio Astrofısico Guillermo Haro inCananea, both in Mexico.
Full details of the sample selection, observations and data reduc-tion and analysis are given elsewhere (Chavez et al., in preparation).Here we summarize the relevant results regarding the determinationof the distance estimator and H0.
Hβ and [O III] λλ4959, 5007 line widths were measured by fittingsingle Gaussians to the line profiles. As previously found, most H II
galaxies show line profiles that are well fitted by single Gaussians(e.g. Melnick et al. 1988; Bordalo & Telles 2011). We cleaned thesample by first removing from the original list those H II galaxieswith either asymmetric or double/multiple line profile. We alsoremoved those H II galaxies showing rotation or large photometricerrors in their Hβ fluxes or with an uncertain reddening correction.It reduced the sample from 128 to 69 H II galaxies.
The values of the observed velocity dispersions, σ o, were cor-rected for thermal (σ t) and instrumental (σ i) broadening, and thefinal corrected dispersion was estimated according to
σ = (σ 2o − σ 2
t − σ 2i )1/2 . (1)
The 1σ uncertainties of the velocity dispersion were estimatedfrom multiple observations computing the variance over the re-peated measurements, or as the mean value of the obtained relativeerrors.
Hβ integrated fluxes were measured by fitting a single Gaussianto the long-slit spectra, while their 1σ uncertainties were estimated
C© 2012 The AuthorsMonthly Notices of the Royal Astronomical Society C© 2012 RAS

H II galaxies and the Hubble constant L3
Figure 1. L(Hβ)–σ relation for the GEHR sample. The correlation param-eters and the adopted individual distance moduli are given in the inset. Theline is the best fit for the slope determined by the fit to the H II galaxies (seeequation 3).
from the expression (e.g. Tresse et al. 1999)
σF = σcD(2Npix + W/D)1/2 , (2)
where σ c is the mean standard deviation per pixel of the continuumon each side of the line, D is the spectral dispersion, Npix is thenumber of pixels covered by the line and W is the line equivalentwidth.
Heliocentric redshifts and their uncertainties were obtained fromthe SDSS DR7 spectroscopic data when available, otherwise fromour echelle data or the spectrophotometric catalogue of H II galax-ies (Terlevich et al. 1991). The redshifts have been transformedfrom the heliocentric to the Local Group reference frames follow-ing Courteau & van den Bergh (1999) and corrected for the localbulk flow using the model of Basilakos & Plionis (1998). The 1σ
uncertainties were propagated using a Monte Carlo procedure.To determine the zero-point for the L(Hβ)–σ relation, we ob-
tained data from the literature for a sample of 23 GEHR in ninenearby galaxies whose distances have been measured by means ofwell-tested primary distance indicators.
The details of the GEHR data will also be given in Chavez et al. (inpreparation). For these objects, velocity dispersions have been takenfrom Melnick et al. (1987), whereas distance moduli have beenobtained by averaging over the available measurements publishedafter 1995, selecting only those based on Cepheids, RR Lyrae,Mira variables and eclipsing binaries except for those in IC 2574and NGC 4236 for which only TRGB measurements are available.The adopted distance moduli (μ) are listed as an inset in Fig. 1.The global integrated Hβ fluxes and corresponding extinction wereobtained from the values reported by Melnick et al. (1987).
3 D E T E R M I NAT I O N O F H0
The procedure we use to estimate the Hubble constant comprisesthe following three steps.
(i) First we determine the slope of the L(Hβ)–σ relation for H II
galaxies. Since the slope is independent of H0, we use an arbitrary
Figure 2. L(Hβ)–σ relation for the joint H II galaxies and GEHR samples.The least-square fit considers the errors in both axes.
value of H0 to determine luminosities from the observed Hβ fluxand the Hubble distance.1
(ii) We then determine the intercept of the relation from a fit tothe ‘anchor’ GEHR sample, but fixing the slope to that determinedin step (i), i.e. that based on H II galaxies. Fig. 1 shows the L(Hβ)–σ relation for the GEHR sample. The slope of the correlation hasbeen fixed to the value obtained from the H II galaxies sample fittingin (i).
The resulting L(Hβ)–σ correlation for the joint sample of GEHRand H II galaxies is
log10 L(Hβ) = (4.97 ± 0.10) log10 σ + (33.25 ± 0.15), (3)
which has rms of log10L(Hβ) = 0.236 (shown in Fig. 2).(iii) Finally, we determine the value of H0 by minimizing, over
a grid of H0 values, the function
χ2(H0) =n∑
i=1
[Li(σi) − Li(H0, fi, zi)]2
�2L,i + �2
L,i
, (4)
where the summation is over the H II galaxies, σ i are the measuredvelocity dispersions (equation 1), Li(σ ) are the luminosities esti-mated from the ‘distance indicator’ as defined in equation (3), �L,i
are their errors propagated from the uncertainties in σ and the slopeand intercept of the relation. Li(H0, fi, zi) are the luminosities ob-tained from the measured fluxes and redshifts by using a particularvalue of H0 in the Hubble law to estimate distances, and �L,i arethe errors in this last estimation of luminosities, propagated fromthe uncertainties in the fluxes and redshifts.
Fig. 3 shows the resulting χ2 for the range of H0 values used,with the solid line being a cubic fit to the points. The 1σ confidencelimits of H0 were obtained from the values for which χ2 −χ2
min = 1since the fit has only one degree of freedom (see the inset panel inFig. 3).
The value obtained for H0 using the above described procedureis
H0 = 74.3+3.1−3.0 km s−1 Mpc−1 . (5)
1 We have verified that the initial choice for the value of H0 does not alterthe determined slope value.
C© 2012 The AuthorsMonthly Notices of the Royal Astronomical Society C© 2012 RAS

L4 R. Chavez et al.
Figure 3. Values of χ2 for the grid of H0. The solid line is a cubic fit to thepoints. The inset panel shows the value of χ2 − χ2
min.
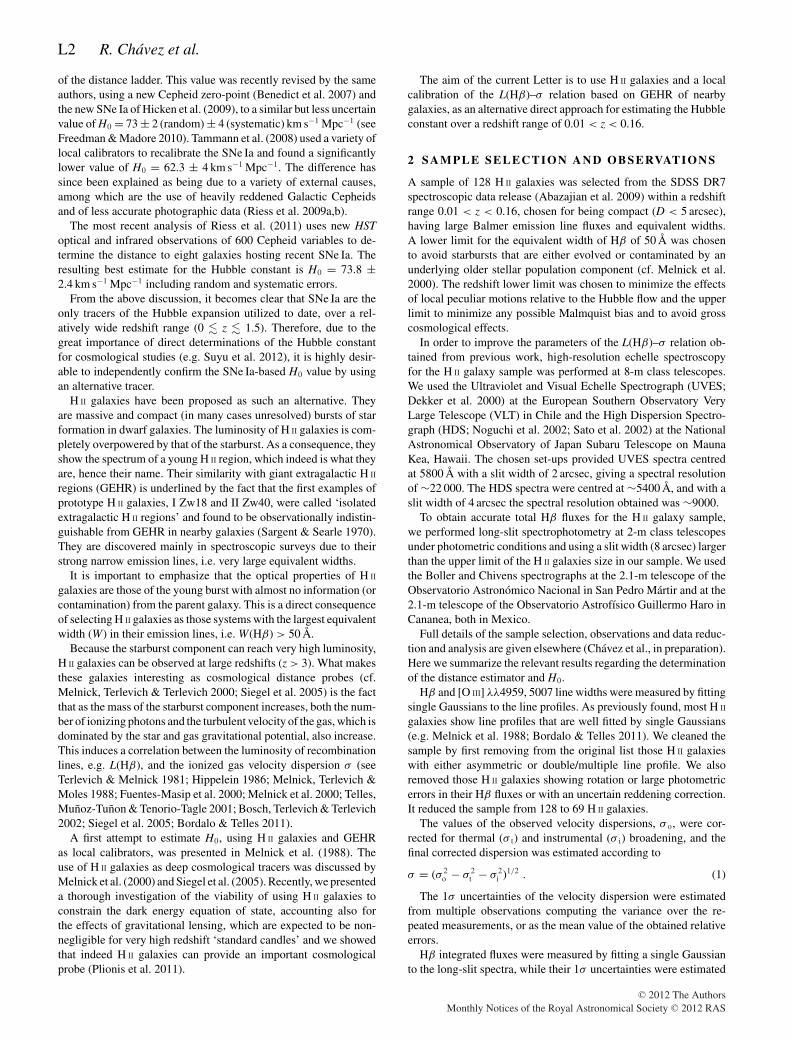
Figure 4. Hubble diagram for our sample of 69 H II galaxies. The thickpoints are the mean values for bins of 0.01 in redshift. The solid line showsthe run with redshift of the distance modulus for H0 = 74.3. Residuals areplotted in the bottom panel and their distribution is shown in the inset. Therms value is 0.57 mag.
Fig. 4 shows the Hubble diagram for the sample of H II galaxiesused for the H0 value determination. The continuous line showsthe redshift run of the distance modulus, obtained from the linearHubble law and the fitted H0 value, whereas the points correspondto the individual H II galaxy distance moduli obtained through theL(Hβ)–σ correlation.
The quoted Hubble constant uncertainty in equation (5) reflectsonly the random errors, while systematic errors can also affect themean value as well as the overall H0 uncertainty. We have identi-fied as potential sources of systematic errors the following: (a) thebroadening of the emission lines, being contaminated by a rota-tional velocity component; (b) the internal structure/multiplicity ofGEHR and H II galaxies; (c) stellar winds affecting the line profiles;(d) internal extinction; (e) coherent or peculiar motions affectingthe redshifts of nearby H II galaxies; (f) the age of GEHR and H II
galaxies; (g) the Malmquist bias and (h) variations in the initial massfunction (IMF). The detailed discussion of these systematics is animportant aspect of the H0 determination and will be presented in a
Table 1. Systematic error budget on the H0 determination.
Symbol Source Error (km s−1 Mpc−1)
σ a, b Rotation, multiplicity 0.7σ c Stellar winds 1.1σ d Internal extinction 0.7σ f Object’s age 1.4σ g Malmquist bias 2.1σ h IMF –
Total 2.9
future paper (Chavez et al., in preparation). Here we briefly discussthese systematics, and the procedures used to minimize them.
(a, b) To minimize the rotation and multiple component system-atic effect, we have used in our correlation only those objects withemission line profiles that are Gaussian and show no multiple com-ponents (for a discussion, see Bosch et al. 2002).
(c) The presence of weak extended (non-Gaussian) wings in theemission line profiles introduces a small systematic effect. Theseweak wings are probably associated with stellar winds. The resultingeffect is that, taking into account the wings in the fit, the final fullwidth at half-maximum tends to be slightly smaller. This shouldaffect similarly both GEHR and H II galaxies. We estimate that thismay introduce a systematic error of about 2 per cent in H0.
(d) The extinction has always been estimated using the Balmerdecrement method. We do not expect a sizeable systematic effectassociated with this correction.
(e) H II galaxies tend to populate the voids, so local peculiarmotions should be relatively small. Furthermore, to minimize theeffects of coherent bulk flows on the redshifts of the H II galaxies, weimposed a lower radial velocity limit of 3000 km s−1. In any case,we have also computed H0 including a local bulk flow correctionand found no overall effect.
(f) The age of the GEHR and H II galaxies affects their mass-to-light ratio (M/L) and therefore the zero-point of the L(Hβ)–σ
relationship. To minimize this effect, we have specifically selectedobjects with W(Hβ) > 50 Å. This guarantees that the age of thestar-forming region is less than 6 Myr, thus minimizing the effect ofevolution (Leitherer et al. 1999). We estimate that at most a plausiblesystematic difference in ages between GEHR and H II galaxies mayaffect H0 at a 2 per cent level.
(g) We have calculated the Malmquist bias following the proce-dure proposed by Giraud (1987) adopting a power-law luminosityfunction, with a slope α = −1.7. We have obtained a value of2.1 km s−1 Mpc−1 at z = 0.16, which we consider as one of thesystematic error components.
(h) The L(Hβ)–σ distance estimator relies on the universality ofthe IMF. Any systematic variation in the IMF will affect directlythe M/L and therefore the slope and zero-point of the relation. Thefact that our estimates of the Hubble constant are in agreement withthose from SN Ia supports the hypothesis of a universal IMF.
Table 1 shows the systematic error budget on the H0 determina-tion.
4 C O N C L U S I O N S
It is indisputable that in the epoch of intense studies aimed at mea-suring the dark energy equation of state, it is of paramount im-portance to minimize the amount of priors needed to successfullycomplete such a task. One such prior is the Hubble constant H0 and
C© 2012 The AuthorsMonthly Notices of the Royal Astronomical Society C© 2012 RAS

H II galaxies and the Hubble constant L5
its measurement at the ∼1 per cent accuracy level has been iden-tified as a necessary prerequisite for putting effective constraintson the dark energy, on neutrino physics and even on tests, at cos-mological scales, of general relativity (see Suyu et al. 2012). Fur-thermore, it is highly desirable to have independent determinationsof H0, since this will help understand and control systematic ef-fects that may affect individual methods and tracers of the Hubbleexpansion.
It is within this latter strategy that our current work falls. We havecarried out VLT and Subaru observations of a sample of nearby H II
galaxies identified in the SDSS DR7 catalogue and 2-m class tele-scopes spectrophotometry, in order to define their L(Hβ)–σ correla-tion, which we use to estimate the value of the Hubble constant. Thisis achieved by determining the zero-point of the distance indicatorusing GEHR in nearby galaxies, for which accurate independentdistance measurements exist (based on Cepheids, RR Lyrae, TRGBand eclipsing binaries).
Using our sample of 92 objects (69 H II galaxies with z � 0.16 and23 GEHR in nine galaxies with distances determined via primaryindicators), we obtain
H0 = 74.3 ± 3.1(random) ±2.9 (systematic) km s−1 Mpc−1, inexcellent agreement with, and independently confirming, the recentSNe Ia-based results of Riess et al. (2011).
AC K N OW L E D G M E N T S
The authors thank the support by VLT, Subaru, San Pedro Martirand Cananea Observatories staff and the hospitality of the De-partamento de Fısica Teorica of the Universidad Autonoma deMadrid, where part of this work was done. RC, RT, ET and MPacknowledge the Mexican Research Council CONACYT for fi-nancial support through grants CB-2005-01-49847, CB-2007-01-84746 and CB-2008-103365-F. FB acknowledges partial supportfrom the National Science Foundation grants AST-0707911 andAST-1008798. SB and RT acknowledge financial support from theSpanish Ministry of Education, within the programme of Estanciasde Profesores e Investigadores Extranjeros en Centros Espanoles(SAB2010-0118 and SAB2010-0103). We thank the anonymousreferee whose suggestions greatly improved the clarity of thisLetter.
R E F E R E N C E S
Abazajian K. N. et al., 2009, ApJS, 182, 543Basilakos S., Plionis M., 1998, MNRAS, 299, 637Benedict G. F. et al., 2007, AJ, 133, 1810Beutler F. et al., 2011, MNRAS, 416, 3017
Bonamente M., Joy M. K., LaRoque S. J., Carlstrom J. E., Reese E. D.,Dawson K. S., 2006, ApJ, 647, 25
Bordalo V., Telles E., 2011, ApJ, 735, 52Bosch G., Terlevich E., Terlevich R., 2002, MNRAS, 329, 481Courteau S., van den Bergh S., 1999, AJ, 118, 337Dekker H. et al., 2000, Proc. SPIE, 4008, 534Freedman W. L., Madore B. F., 2010, ARA&A, 48, 673Freedman W. L. et al., 2001, ApJ, 553, 47Fuentes-Masip O., Munoz-Tunon C., Castaneda H. O., Tenorio-Tagle G.,
2000, AJ, 120, 752Giraud E., 1987, A&A, 174, 23Hicken M., Wood-Vasey W. M., Blondin S., Challis P., Jha S., Kelly P. L.,
Kirschner R. P., 2009, ApJ, 700, 1097Hippelein H. H., 1986, A&A, 160, 374Jackson N., 2007, Living Rev. Relativ., 10, 4Leitherer C. et al., 1999, ApJS, 123, 3Melnick J., Moles M., Terlevich R., Garcia-Pelayo J., 1987, MNRAS, 226,
849Melnick J., Terlevich R., Moles M., 1988, MNRAS, 235, 297Melnick J., Terlevich R., Terlevich E., 2000, MNRAS, 311, 629Noguchi S. et al., 2002, PASJ, 54, 855Phillips M. M., 1993, ApJ, 413, L105Plionis M., Terlevich R., Basilakos S., Bresolin F., Terlevich E., Melnick J.,
Chavez R., 2011, MNRAS, 416, 2981Riess A. G. et al., 2009a, ApJ, 699, 539Riess A. G. et al., 2009b, ApJS, 183, 109Riess A. G. et al., 2011, ApJ, 730, 119 (erratum: ApJ, 732, 129)Saha A., Sandage A., Tammann G. A., Dolphin A. E., Christensen J., Panagia
N., Macchetto F. D., 2001, ApJ, 562, 314Sandage A., Tammann G. A., 1982, ApJ, 265, 339Sandage A., Tammann G. A., 1990, ApJ, 365, 1Sandage A., Tammann G. A., Saha A., Reindl B., Macchetto F. D., Panagia
N., 2006, ApJ, 653, 843Sargent W. L. W., Searle L., 1970, ApJ, 162, L155Sato B. et al., 2002, PASJ, 54, 873Siegel E. R. et al., 2005, MNRAS, 356, 1117Suyu S. H., Marshall P. J., Auger M. W., Hilbert S., Blandford R. D.,
Koopmans L. V. E., Fassnacht C. D., Treu T., 2010, ApJ, 711, 201Suyu S. H. et al., 2012, preprint (arXiv:1202.4459)Tammann G. A., Sandage A. R., Reindl B., 2008, A&AR, 15, 289Telles E., Munoz-Tunon C., Tenorio-Tagle G., 2001, ApJ, 548, 671Terlevich R., Melnick J., 1981, MNRAS, 195, 839Terlevich R., Melnick J., Masegosa J., Moles M., Copetti M. V. F., 1991,
A&AS, 91, 285Tresse L., Maddox S., Loveday J., Singleton C., 1999, MNRAS, 310, 262
This paper has been typeset from a TEX/LATEX file prepared by the author.
C© 2012 The AuthorsMonthly Notices of the Royal Astronomical Society C© 2012 RAS


![Evolution Extragalactic Radio Sources [2nd piece]](https://img.pdfslide.us/doc/110x75/577d36561a28ab3a6b92ca79/evolution-extragalactic-radio-sources-2nd-piece.jpg)