Embed Size (px)
Citation preview

This report represents the work of one or more WPI undergraduate students.
Submitted to the faculty as evidence of completion of a degree requirement.
WPI routinely publishes these reports on its web site without editorial or peer review.
INTELLIGENT TRANSPORTATION IN ACADIA NATIONAL PARK
Determining the feasibility of smart systems to reduce traffic congestion
An Interactive Qualifying Project Report
submitted to the Faculty
of the
WORCESTER POLYTECHNIC INSTITUTE
in partial fulfillment of the requirements for the
Degree of Bachelor of Science
by
Angela Calvi Colin Maki
Mingqi Shuai Jackson Peters
Daniel Wivagg
Date: July 28, 2017
Approved:
______________________________________
Professor Frederick Bianchi, Advisor

i
Abstract
The goal of this project was to assess the feasibility of implementing an intelligent
transportation system (ITS) in Acadia National Park. To this end, the features of an ITS were
researched and discussed. The components of Acadia’s previous ITS were recorded and their
effects evaluated. New technologies to implement, replace, or upgrade the existing ITS were
researched and the companies providing these technologies were contacted and questioned for
specifications regarding their devices. From this research, three sensor systems were identified as
possibilities. These sensors were magnetometers, induction loops, and cameras. Furthermore,
three methods of information dissemination were identified as useful to travelers. Those methods
were dynamic message signs, websites, and mobile applications. The logistics of implementing
these systems were researched and documented. A cost analysis was created for each system.
The TELOS model of feasibility was then used to compare the strengths of each sensor in five
categories: Technical, Economic, Legal, Operational and Schedule. Based on the results of the
TELOS and cost analyses, the sensors were ranked in terms of feasibility; magnetometers were
found to be the most feasible, followed by induction loop sensors and then camera-based systems.
The team recommended implementation of an intelligent transportation system using
magnetometer sensors to monitor the Sand Beach parking lot, a dynamic message sign at the
entrance station to display collected parking data, and a website to inform guests before entering
the park. If the proposed system works well, it can be expanded to other popular locations in the
future.

ii
Acknowledgements
The team thanks Charlie Jacobi, Dr. Abraham Miller-Rushing, and John Kelly from the
National Park Service for answering questions and providing helpful guidance from managerial
perspectives. The team also thanks Paul Murphy from Downeast Transportation for answering
questions about the company’s role in transportation on the island. The team thanks Professor
Nicola Bulled for her instrumental role in forming the introduction, background, and methods of
this project. Finally, the team thanks Professor Frederick Bianchi for his advisorship and for
providing guidance along every step of the way.

iii
Executive Summary
Acadia National Park, located on Mount Desert Island in Maine, is the eighth most
popular national park in America. Acadia is also the 13th smallest national park, which means
that the density of tourists during peak season is quite high. Since 90% of visitors bring private
vehicles, the park has to deal with significant traffic congestion (Zimmerman, Coleman, &
Daigle, 2003).
In 2001, Acadia staff attempted to address the growing problem with the implementation
of an intelligent transportation system (ITS). An intelligent transportation system is a system for
collecting, analyzing, and disseminating traffic information in real time. The system aims to
mitigate traffic by informing travelers about congested areas. An example of how an ITS can
work is shown in Figure 1 below.
Figure 1: Example components for information collection and dissemination in an ITS
The system in Acadia had many components which can be found in Table 1. The original
ITS included additional components for the public transportation system called the Island

iv
Explorer shuttle. The system also included sensors at park entrances to determine visitor counts,
cameras to monitor the Sand Beach and Blackwoods Campground parking lots, static signs to
display if parking lots were full, and a visitor information phone line.
Island Explorer
Two-way Voice
Communications
Automatic
Vehicle Locator
for Island
Explorer
Departure Sign
for Island
Explorer
Automated
Annunciator for
Island Explorer
Passenger
Counter for
Island Explorer
Parking Lot
Monitoring
Automatic
Ranger/Vehicle
Geo-Location
Entrance Traffic
Volume Recorder
Traveler
Information
Systems
Table 1: Components from the ITS implemented in Acadia National Park in 2002
The objectives of this team were to evaluate the functionality of the 2002 intelligent
transportation system, investigate the capabilities of current intelligent transportation
technologies, and assess the logistics of implementing these technologies.
For this project the team focused on monitoring parking lots and providing that
information to visitors. This would allow visitors to make more informed decisions about what
attractions to visit and when to visit them.
To facilitate monitoring, several methods of car counting were investigated. Each method
needed to be able to accurately provide the current number of spaces available. Three methods in
particular were investigated: magnetometer sensors, induction loop sensors, and cameras.
Magnetometers work by detecting the change in magnetic field caused by passing
vehicles. Sensors are typically mounted on a post at engine level or below the road surface. The
sensors do not detect direction so one sensor is needed for each entry or exit to a parking lot.
Induction loop sensors function in a similar manner to magnetometers. However,
induction loops are always buried in the pavement and then sealed. Cars passing over the sensor
induce an electric current; this change in current alerts the sensor that a car has passed overhead.

v
Camera based systems function differently. Camera-based systems rely on image
recognition software to determine if a parking space is empty or full. For a camera-based system
to work, the camera has to have line of sight to every parking space. For some irregularly shaped
parking lots, this makes camera-based systems highly undesirable as many cameras would be
required to see every space available.
Once the information has been collected, dissemination of the information to park visitors
is necessary. Three methods were examined for communicating information including dynamic
message signs, websites, and mobile applications.
Dynamic message signs displaying the number of spaces available in a given parking lot
should be placed a few hundred yards before the parking area to give visitors adequate time to
make parking decisions. These signs can also help reduce roadside parking by providing
advanced warning of space availability.
A website displaying parking information and predicted congestion levels can allow
visitors to make informed decisions before getting on the road and allow people to plan out
where and when they want to go to avoid traffic.
A mobile application would provide the same benefits as a website but can provide
visitors with static information when visitors lack data service.
Data gathered from the system can be stored in the long term to provide useful trends to
the park and visitors. Predictive models can be compiled using the collected data, date, time,
weather conditions, and more.
The recommendation of this team is to implement an intelligent transportation system to
monitor the parking conditions at Sand Beach using magnetometer sensors and expand the
system after observing its success. The system should include a dynamic message sign near the
Park Loop Road entrance station displaying the number of parking spaces remaining. This
information should also be displayed on a new website and mobile application.

vi
Authorship
Angela Calvi—Edited the entire paper thoroughly for grammar, syntax, and continuity. Authored
Background: Smart solutions to tourist related traffic congestion; Background: Intelligent
transportation systems in Acadia National Park; Recommendations.
Colin Maki—Edited for continuity and flow. Authored Background: Traffic management in
national parks; Contributed to Results and Analysis: Objective 3.
Jackson Peters—Edited for content. Authored Abstract; Executive Summary; Introduction;
Background: Tourism and subsequent traffic congestion in Acadia National Park.
Mingqi Shuai—Edited for content. Authored Background: Traffic management in national parks;
Background: Intelligent transportation systems in Acadia National Park; Results and Analysis:
Objective 1; Results and Analysis: Objective 2; Results and Analysis: Objective 3.
Daniel Wivagg—Edited for structure and content. Authored Background: Tourism and
subsequent traffic congestion in Acadia National Park; Methods; Results and Analysis: Objective
1; Results and Analysis: Objective 3; Results and Analysis: Implementation logistics at Sand
Beach; Conclusion.

vii
Table of Contents
Abstract ............................................................................................................................................ i
Acknowledgements ......................................................................................................................... ii
Executive Summary ....................................................................................................................... iii
Authorship...................................................................................................................................... vi
Table of Figures ........................................................................................................................... viii
List of Tables ............................................................................................................................... viii
Introduction ..................................................................................................................................... 1
Background ..................................................................................................................................... 3
Tourism and Subsequent Traffic Congestion in Acadia National Park ...................................... 3
Traffic management in national parks ........................................................................................ 6
Traffic solutions in Acadia National Park .............................................................................. 6
Traffic solutions implemented in other parks ....................................................................... 11
Smart solutions to tourist-related traffic congestion ................................................................. 13
Intelligent transportation systems in Acadia National Park ...................................................... 13
Methods......................................................................................................................................... 16
Objective 1: Evaluate remaining components of the original ITS in Acadia National Park .... 16
Objective 2: Investigate the capabilities of current ITS technologies ...................................... 17
Objective 3: Assess the feasibility and logistics of implementing an ITS in Acadia National
Park ...................................................................................................................... 18
Results and Analysis ..................................................................................................................... 20
Objective 1: The current deployment of ITS in Acadia ............................................................ 20
Promotion of ITS on Mount Desert Island ........................................................................... 23
Objective 2: Capabilities of modern ITS technologies ............................................................. 24
Parking Lot Monitoring ........................................................................................................ 25
Traveler information systems ............................................................................................... 27
Data Analytics ....................................................................................................................... 28
Objective 3: Feasibility and logistics of ITS implementation .................................................. 28
Implementation logistics at Sand Beach ............................................................................... 30
Recommendations ......................................................................................................................... 37
Conclusions ................................................................................................................................... 41
Bibliography ................................................................................................................................. 43
Appendix A: Hotels that promote ITS .......................................................................................... 45
Appendix B: Mock-up travel website ........................................................................................... 48

viii
Table of Figures
Figure 1: Example components for information collection and dissemination in an ITS ............. iii
Figure 2: Map of parking lots along Park Loop Road, including Cadillac Mountain .................... 5
Figure 3: A map of Mount Desert Island detailing the seven Island Explorer bus routes .............. 8
Figure 4: Mount Desert Island concepts for traffic management ................................................. 10
Figure 5: A visual representation of existing ITS in Acadia and how to address the status of each
component .................................................................................................................... 18
Figure 6: Map of automated departure signs on Mount Desert Island ......................................... 22
Figure 7: Hotel promotion of traveler information ....................................................................... 24
Figure 8: Industrial grade magnetometer sensor ........................................................................... 25
Figure 9: Basic induction loop installation ................................................................................... 26
Figure 10: Software processing of camera video feed .................................................................. 27
Figure 11: Dynamic parking sign that shows multiple parking lots ............................................. 28
Figure 12: Commercial cell towers on and around Mount Desert Island ..................................... 29
Figure 13: Future locations for ITS implementation .................................................................... 40
Figure 14: Mock-up travel website homepage.............................................................................. 48
Figure 15: Close-up of homepage sidebar .................................................................................... 48
Figure 16: Close-up of traffic forecast with drop-down information ........................................... 49
Figure 17: Responsive design of the mock-up website ................................................................ 49
Figure 18: Mock-up parking information webpage ...................................................................... 50
List of Tables
Table 1: Components from the ITS implemented in Acadia National Park in 2002 ..................... iv
Table 2: Parking Lot Percentage Full vs. Time of Day .................................................................. 4
Table 3: Positive and Negative Effects of Implemented Components ......................................... 11
Table 4: The state of existing ITS components in Acadia National Park ..................................... 21
Table 5: Ideal characteristics of a feasible ITS component in Acadia National Park ................... 30
Table 6: Cost analysis of magnetometer sensors .......................................................................... 32
Table 7: Cost analysis of induction loop sensors .......................................................................... 33
Table 8: Cost analysis of cameras ................................................................................................. 34
Table 9: Cost analysis of traveler information systems ................................................................ 36
1
Introduction
In the United States, national parks are meant to be the answer to environmental
degradation: a series of land parcels set aside and preserved in their natural state, protecting these
areas for future generations. While the purpose of the parks is for preservation, a significant
amount of infrastructure including roads, bridges, and parking lots was built in and around each
park for visitor access soon after the inception of the parks. In Acadia National Park, located
primarily on Mount Desert Island, Maine, the number of annual visitors, and thus the number of
cars has been steadily increasing; this has overwhelmed the infrastructure that was created to
accommodate visitors in the 1930s and 1940s. Overhauling the infrastructure by expanding roads
and parking lots would destroy protected land and cannot solve the problem of growing
congestion indefinitely. A flexible, park-friendly solution is necessary: one that maximizes
tourist capacity and minimizes environmental impact.
Some parks in the U.S. have made attempts to solve their traffic problems, with places
like Zion National Park in Utah having entirely banned cars for private use within the park's
boundaries and requiring visitors to use the park shuttle (Mace, Marquit, and Bates, 2013). Other
parks are also using shuttles to reduce traffic: Rocky Mountain National Park and Grand Canyon
National Park have been utilizing signs to inform visitors of their shuttle system and encourage
ridership (Villwock-Witte, Eidswick and Miskimins, 2014; Ye et al, 2010). The traffic
management technology used in some parks is modeled after systems used in other notoriously
crowded areas. The city of Seattle, Washington encourages a mixture of traffic management and
public transit using an intelligent transportation system (ITS), which is the broad name for a
traffic management system that processes transportation data in real time. ITS allows the Seattle
Department of Transportation to make real-time updates on traffic conditions by using
changeable advisory signs to alert travelers of car crashes and suggest alternative routes.
Like Zion, Rocky Mountain, and Grand Canyon, Acadia National Park has implemented
its own shuttle system called the Island Explorer which runs a series of nine routes around Mount
Desert Island and the Schoodic Peninsula (Downeast Transportation, 2017). In a study of the
Island Explorer, Robert Manning, a renowned author of countless studies on Acadia National
Park, and his associates discovered that tourists were more likely to take the shuttle when

2
parking conditions were displayed online (Manning, 2009). Since then, the shuttle system has
incorporated online tracking and electronic signs at many of its stops to inform visitors of bus
locations and arrival times, making use of the Island Explorer both practical and efficient. In his
research, Manning also surveyed business owners in Bar Harbor about their thoughts on a new
system to ease traffic. Of those interviewed, 85% supported a monitoring system that tracked
available parking and updated this information through a website. While Acadia has
implemented a highly utilized shuttle system, other ITS technology like a monitoring system that
tracks available parking spaces have yet to be incorporated into the park.
This project was intended to assist Acadia National Park in addressing the issue of traffic
congestion by providing an analysis of the overall feasibility and implementation logistics of
additional ITS components. The team evaluated the remaining components of Acadia’s original
ITS, investigated the capabilities of commercially available ITS technologies, and assessed the
feasibility of several potential systems.

3
Background
Tourism and Subsequent Traffic Congestion in Acadia National Park
The visitor experience in Acadia National Park is diminished by overcrowding and traffic.
Robert Manning, author of countless research studies in Acadia, reported that “more than one-
quarter of the summer visitors…generally find the park too crowded” (U.S. Department of the
Interior, 1991, p. 23). According to the statistics of the National Park Service’s Integrated
Resource Management Applications Portal on visitor use, annual visitation levels have exceeded
two million people every year since 1966, and have risen steadily in the past 3 years to surpass
three million in 2016 (National Park Service, 2017). Of these three million visitors, over 90%
bring their personal vehicles to the park annually (Zimmerman, Coleman, & Daigle, 2003).
Vehicular traffic is concentrated on Park Loop Road, especially the segment of road known as
Ocean Drive, and obstructs natural scenery and landscape, further reducing visitor satisfaction
(Steinitz, 1990, Hallo and Manning, 2010). Due to the increase in tourist counts and associated
vehicular traffic, visitors are unable to enjoy the solitude, landscape, and scenery of the park that
attracted them in the first place.
Vehicular traffic drastically affects perceived congestion in the park. In 2003, Robert
Manning and his colleagues attempted to quantify how many people visitors expected to see in
different areas around the Schoodic Peninsula. Their results indicated that visitor satisfaction
began to suffer once the number of people was twice what a visitor expected. Furthermore, when
vehicles are parked on the roadside, the perceived congestion within the park doubles (Bacon et.
al, 2003). Thus, car traffic can very easily diminish the visitor experience by making it seem like
the park is more crowded than it is. During the peak season when traffic and roadside parking
seem to be ubiquitous, these effects have their worst impact on visitors.
The most frequented areas of the park are the most prone to damage and destruction. Park
Loop Road, which circuits the park, was designed as a scenic road to showcase some of the most
beautiful views the park has to offer (U.S. Department of the Interior, 1991). As a result, there is
an excess of roadside parking and congestion as drivers pull over to admire the scenery.
Additionally, popular attractions with parking lots nearby are prone to overcrowding in the lots.
In 2016, a research team at Acadia National Park determined how full each parking lot around
Park Loop Road was during three time periods throughout the day. Their research, shown in

4
Table 2, indicated that certain attractions (highlighted) remained full for most of the day while
others had little visitation. The following areas were most popular: Sand Beach, Jordan Pond
House, Cadillac Mountain, and Gorham Mountain (Dziuban et al. 2016). These areas, shown in
Figure 2, are the most well-known attractions on Park Loop Road. Fifteen of the twenty-one
locations shown in Figure 2 were observed and reported in Table 2.
Location Average Percentage Full (%)
10:00-11:00 12:30-1:30 7:00-8:00
Schooner Head Overlook 12.7 26.0 3.0
Sand Beach Lot 94.3 97.0 20.5
Sand Beach Upper 87.9 100.0 6.8
Ocean Path 1 52.7 81.1 1.4
Ocean Path 2 25.0 71.4 0.0
Thunder Hole 45.0 59.4 18.3
Gorham Mountain Trail 98.7 92.0 6.0
Ocean Path 3 62.5 77.5 2.5
Fabbri Picnic Area 25.0 69.2 7.7
Fabbri Memorial 20.0 15.0 5.0
Otter Cliff 95.0 61.7 32.5
Jordan Pond House Main 98.6 106.5 49.3
Jordan Pond House Auxiliary 98.1 107.1 10.8
Blue Hill Overlook 46.1 21.2 130.3
Cadillac Mountain Summit 74.5 69.6 94.6
Table 2: Parking Lot Percentage Full vs. Time of Day (Dziuban et al. 2016)

5
Figure 2: Map of parking lots along Park Loop Road, including Cadillac Mountain
(Dziuban et al. 2016)
Acadia’s small size compared to other parks of similar popularity makes congestion
issues even more challenging. According to National Park Service statistics, Acadia is the 8th
most visited park, but 13th smallest out of 59 national parks in America (National Park Service,
2017). Of the top ten most popular national parks, Acadia is the smallest (National Park Service,
2017). The park is only 42,000 acres large, but welcomed 3.3 million visitors in 2016. The next
largest park is Zion National Park, which is three times as large and accommodated 4.2 million
visitors, only a million more than Acadia, in 2016 (National Park Service, 2017). Rocky
Mountain National Park is over five times as large as Acadia and had only about 4.5 million

6
visitors in 2016 (National Park Service, 2017). The tourist congestion experienced by Acadia
magnifies the impact of visitors on the environment and park officials need to make a concerted
effort to reduce this impact.
Traffic management in national parks
In most cases, the solution to visitor and traffic congestion is simple: expand
infrastructure around the attraction and add more space for visitors. This could include widening
roads, building additional entry and exit points, or adding additional parking (National Park
Service, 2014). Expanding infrastructure, however, is not a viable option for Acadia. In order to
build more parking lots or expand roads, national forest would have to be cut down, construction
equipment and materials brought in, and a large section of land excavated. In addition, this
approach only provides a solution if numbers of tourists does not continue to increase in coming
years. Since these traditional approaches to tourist congestion management are not appropriate
for a natural setting, the National Park Service provided a guidebook for transportation planning
to park managers in 1999. This guidebook suggested roadway modifications, traffic restrictions,
promotion of off-peak park use, reservation systems, and intelligent transportation systems as
possible solutions (National Park Service, 1999). Moving forward, Acadia National Park must
consider appropriate solutions that align with the National Park Service guidelines and do not
worsen the impact of traffic congestion.
Traffic solutions in Acadia National Park
Previously implemented solutions for traffic congestion in Acadia National Park have
found some success, but none have completely addressed the growing traffic problem. The most
prominent example of these implemented solutions is the Island Explorer, a free shuttle service
that traverses Mount Desert Island implemented in 1999 (Hallo and Manning, 2009). The shuttle
operates from June 23rd to Columbus Day, with reduced service after September 1st (Downeast
Transportation Inc., 2017). One of the benefits of this service is that it removes some private
vehicles from park roads. Unfortunately, the Island Explorer system is underutilized on some
routes and is not large enough to accommodate the number of tourists who want to ride on others.
In 2016, only 17.4% of the 3.3 million visitors rode the Island Explorer (National Park Service,
2017). The shuttle’s frequency depends on the destination, with most wait times at locations

7
around the park ranging between 30 and 60 minutes (Downeast Transportation Inc., 2017). The
Island Explorer route map is shown in Figure 3.
Another approach to managing traffic congestion within Acadia is the use of manual
signs to indicate whether or not a parking lot is full. In past years, the signs were posted at the
Visitor Center and the entrances to two campgrounds (Zimmerman, Coleman, & Daigle, 2003).
However, due to the number of responsibilities of park staff during peak visitor hours, the signs
were not usually updated in a timely fashion and were sometimes entirely absent (Zimmerman,
Coleman, & Daigle, 2003). Of visitors who saw the parking lot signs in front of Sand Beach and
Blackwoods Campground, 74% said the information made it easier to get around (Zimmerman,
Coleman, & Daigle, 2003). A sign-based system may prove to be very effective at managing
private vehicle parking in Acadia if the information were displayed in a variety of locations
outside of parking lots and could be updated in real time to prevent overcrowding.
The most recently implemented solution to tourist-related traffic congestion is Acadia’s
car-free days. In 2015, Acadia National Park began to hold two car-free days per year (Kelly,
2015). The first car-free day takes place in May and lasts from midnight to noon, and the second
is in September and lasts all day in celebration of National Public Lands Day (Kelly, 2015).
These car-free days enable visitors to enjoy the park through a more natural lens with reduced
congestion and noise pollution. While successful in addressing the issue of tourist-related traffic
congestion, the infrequency of these events limits their contribution to solving the problem.

8
Figure 3: A map of Mount Desert Island detailing the seven Island Explorer bus routes on the main island
(System map retrieved from http://www.exploreacadia.com/fullmap.htm)
In addition to shuttles, signs, and car-free days, Acadia National Park has developed four
new preliminary concepts to address traffic management on Park Loop Road (National Park

9
Service, 2016). The first of these involves bolstering the public transit system and reducing
parking on the side of roads while introducing a new parking lot. This plan would also require
visitors to make reservations during peak season for Cadillac Mountain, Jordan Pond House, and
Sand Beach. The second plan involves a metering system at the entrance to the Ocean Drive
segment of Park Loop Road that would allow private vehicles onto the road until a
predetermined threshold is reached. This plan would also require reservations during the peak
season for Cadillac Mountain and Jordan Pond House. The third plan involves repainting Park
Loop Road as a one-way counterclockwise route, in the opposite direction of its current traffic
flow. This plan includes new stops for public transit, new parking lots, and requires reservations
for private vehicle access on Park Loop Road in the peak season. The fourth plan would make
Park Loop Road two-way along its entire length. It proposes new parking and transit stops but
does not allow private vehicles to use Park Loop Road during the peak season. The key locations
in each plan are illustrated in Figure 4. The positive and negative aspects of the proposed
components are outlined in Table 3.
Based on Table 3, the proposed components which will be most useful for mitigating
traffic congestion while improving visitor experience are increased public transit and the removal
of right lane parking. Components that will likely be avoided include eliminating private vehicle
use, reversing the direction of Park Loop Road, and making Park Loop Road two-way. The
solutions involving repainting the lanes of Park Loop Road will not reduce the number of cars
traversing the park; they will only alter the distribution of traffic instead of reducing it. The
solution of preventing private vehicles from entering the park is also suboptimal since many
visitors still wish to view the park from their own vehicle (Hallo and Manning, 2009). The
solutions involving a metering or reservation system could have positive impacts on visitor
experience, but would need to be expanded as to not limit the number of visitors the park
receives.

10
Figure 4: Mount Desert Island concepts for traffic management (Map retrieved from Google Maps)

11
Proposed
Component Positive Negative
Increase Public
Transit
Increases availability of areas
accessed by reducing right lane
parking
Expensive investment by the
park and donors
Remove Right Lane
Parking
Vehicles can maneuver the
roads more easily
Improved safety for cyclists and
pedestrians
Less parking within the park,
especially on Ocean Drive
New Parking Lot Reduces informal parking at
Eagle Lake
Causes damage to the
environment
Reservation System Reduces the number of vehicles
and improves traffic flow
Limits the number of visitors to
those with a reservation
Metering System Will not allow Ocean Drive to
exceed its carrying capacity
Will cause a buildup of cars
waiting to access the park
Reverse One-Way,
Park Loop Road
Improves safety for cyclists and
pedestrians
Allows for better scenic views
for slower moving traffic
Will not reduce the amount of
traffic
Two-Way, Park
Loop Road
Increase vehicle
maneuverability throughout the
park
Traffic flow must be balanced
between the two directions
Drivers want to enjoy scenery
without worrying about
oncoming traffic
Stop Private Vehicle
Use
Clears the roads of all
congestion
The vast majority of park
visitors use private vehicles
Table 3: Positive and Negative Effects of Implemented Components
Traffic solutions implemented in other parks
Banning private vehicle access to park roads is a common method of reducing tourist
congestion in national parks. In Zion National Park, a mandatory shuttle was implemented in
2000 to manage the large number of visitors and traffic at the park. A longitudinal study showed
that over 10 years the visitor response and assessment of the shuttle service had improved greatly
(Mace, Marquit, and Bates, 2013). The continuous feedback between 2000 and 2010 shows that
“improvements [in the shuttle service] were greatest for freedom, accessibility, and efficiency”

12
(Mace, Marquit, and Bates, 2013). However, the public only accepted the mandatory system
after the benefits had been carefully designed and well promoted (Mace, Marquit, and Bates,
2013). Like visitors to Acadia, visitors to Zion were first concerned with losing the advantages of
using their personal vehicles. Mandatory shuttle services have been adopted less frequently than
optional systems as they reduce visitor freedom and inconvenience the elderly, the disabled, and
people carrying large amounts of cargo (Mace, Marquit, and Bates, 2013). Furthermore, using
mandatory shuttle systems requires the closing of roadways which leads to complaints from local
residents who make use of these roads for non-tourist activities (Holding and Kreutner 1998).
Because of these effects, local business owners in the Bar Harbor community have been wary of
removing cars in the past (Zimmerman, Daigle, & Pol, 2004). The latest reports from park
officials indicate that they are searching for a solution that is car-friendly to account for visitor
and resident demands (National Park Service, 2016).
Rather than banning personal vehicles, U.S. national parks have tried to encourage
alternative modes of travel by implementing intelligent transportation systems (ITS). The
deployment of ITS components such as dynamic message signs (DMS) and highway advisory
radio (HAR) stations has been successful in disseminating travel information and alleviating
congestion. During 2011 and 2013, Rocky Mountain National Park, the most visited park in
Colorado, collaborated with the Town of Estes Park to implement DMS and HAR in an attempt
to encourage visitors to use the Park-and-Ride shuttle (Villwock-Witte, Eidswick and Miskimins,
2014). DMS displayed short messages about the shuttle information and how to access the HAR
station. HAR broadcasted longer messages about road conditions, parking lot capacity, and
shuttle services (Collum, 2012). In a survey conducted on Rocky Mountain National Park
shuttles, 80% of respondents said that they chose to ride the shuttle because they saw the DMS
and 28% of visitors on the shuttle said that they tuned into the HAR station before choosing to
take public transport (Collum, 2012). Ninety-two percent of the people who used the shuttle were
satisfied with the shuttle service (Collum, 2012). A similar boost in shuttle ridership occurred in
Grand Canyon National Park, where usage increased by 30% following the implementation of
DMS and HAR (Ye et al, 2008).

13
Smart solutions to tourist-related traffic congestion
Intelligent transportation systems are becoming increasingly popular as smart ways to
mitigate traffic and disseminate real-time data to users. These smart systems are traditionally
used in urban environments but are expanding to natural ones. In places like national parks,
where tourists crowd the natural land, ITS can boost visitor satisfaction and protect the earth.
They have the ability to direct tourists less crowded locations and dissuade off-road parking by
promoting other options.
The implementation of ITS to resolve traffic issues has proven to be beneficial to both
clients and users. The Seattle Department of Transportation has implemented an ITS to
streamline the traffic management process while overseeing transportation throughout the city
remotely from their transportation operations center (Seattle Department of Transportation,
2015). This is achieved using infrastructure such as traffic cameras, DMS, and a publicly
accessible traffic monitoring website.
Intelligent transportation systems in Acadia National Park
An ITS field operational test was conducted in Acadia from 2000 to 2003 during which
nine ITS components were evaluated. The components included in the original plan are
displayed in Table 1. The two-way voice communication on the Island Explorer is used for
communication between vehicles and the dispatch center. Automatic vehicle locators are used to
transmit real-time bus locations. The departure signs compute bus departure time automatically
and display this information to travelers at select bus stops. Automated annunciators verbalize
next stops to the riders. Passenger counters record the number of passengers getting on and off
the bus. Parking lot monitoring systems recorded provided a video feed of the Sand Beach
parking lot and Blackwoods Campground. Components associated with automatic ranger/vehicle
geo-location compute and relay ranger locations. Entrance traffic volume recorders count the
number of vehicles entering and exiting Park Loop Road. A traveler information system
disseminates information to travelers; in Acadia, this included the 511 phone system and trip
planning website. The implementation of this ITS was incomplete. Automatic ranger/vehicle
geo-location and real-time traffic volume recorders were never implemented due to lack of
budget and technical difficulties. Although parking lot monitoring and traveler information
systems were implemented, they stopped working after the field operational test due to lack of

14
maintenance. Although this ITS was only tested for a short period of time, it was effective. The
following statistics were gathered while the original ITS was functional:
44% of bus riders said that parking information from the trip planning website influenced
their decision to ride the bus (Zimmerman, Coleman, & Daigle, 2003).
67% of visitors using private transportation either changed the time they visited a
destination or changed their destination entirely (Zimmerman, Coleman, & Daigle, 2003).
74% of visitors who saw the parking lot signs in front of Sand Beach and Blackwoods
Campground said the information made it easier to get around (Zimmerman, Coleman, &
Daigle, 2003).
87% of visitors agreed that traffic information such as live bus tracking was valuable or
very valuable (Zimmerman and Burt, 2005).
Using current technology, the ITS can be updated and expanded to help Acadia manage
traffic problems.
Island Explorer
Two-way Voice
Communications
Automatic
Vehicle Locator
for Island
Explorer
Departure Sign
for Island
Explorer
Automated
Annunciator for
Island Explorer
Passenger
Counter for
Island Explorer
Parking Lot
Monitoring
Automatic
Ranger/Vehicle
Geo-Location
Entrance Traffic
Volume Recorder
Traveler
Information
Systems
Table 1: Components from the ITS implemented in Acadia National Park in 2002
Any proposed system should take existing components into account and use them to the
best of their abilities. For example, in an early report on the feasibility of intelligent transport
implementation, it was noted that any solution should encourage more people to use the Island
Explorer shuttle as this would reduce the number of cars trying to use park roads (Zimmerman,
Coleman, & Daigle, 2003). This system is meant to work in conjunction with private transport

15
since studies have indicated that banning personal cars entirely would be incongruent with visitor
preferences (Hallo and Manning, 2009).
As shown in Figure 1, information in an ITS can be collected from parking lot sensors,
traffic cameras, car counters, and bus trackers. From there, it is sent to a control center where
feeds are autonomously monitored and data is stored. Finally, it is disseminated to tourists via
DMS, online video feeds, and mobile traffic and transit apps. It is also collected and monitored
by officials for the strategic deployment of staff and long-term data analytics.
Figure 1: Example components for information collection and dissemination in an ITS

16
Methods
This project was intended to assist Acadia National Park in addressing the increasing
amount of traffic congestion in the park by providing an analysis of the feasibility and
implementation logistics of a real-time intelligent transportation system (ITS). The team aimed
to achieve the following objectives:
Evaluate remaining components of the original ITS in Acadia National Park.
Investigate the capabilities of current ITS technologies.
Assess the feasibility and logistics of implementing an ITS in Acadia National Park.
The outcomes of the methods described below will be summarized and presented to park
officials.
Objective 1: Evaluate remaining components of the original ITS in Acadia
National Park
To best understand what new ITS components would be of use in Acadia, an inventory of
existing components and their functionality was created. The data for the inventory was gathered
online, through first-hand observation, and through consultation with park officials. The
inventory checklist was obtained from the park’s ITS Field Operational Test Final Report from
2003. The team determined whether or not each component was implemented, presently working,
and being utilized by the park. These distinctions were significant because not all components
were implemented in the deployment of the original ITS and others had ceased to work properly
or were left unused. The assessment of these components was critical to ensure that future ITS
recommendations did not ignore past work.
Another aspect of the old system to examine was how well the existing system was
promoted in the areas surrounding the park. An important factor in the success of any ITS is how
many of the intended users are aware of its existence. At the conclusion of the original ITS
implementation in 2003, researchers stated that educating local businesses and enlisting their
help to market the system to tourists were necessary steps for the future (Zimmerman, Coleman,
& Daigle, 2003). Since an estimated 72% of visitors to Mount Desert Island stay on the island
for at least one night, places of lodging have a large role in such marketing to tourists (Manni,
Littlejohn, & Hollenhorst, 2009). To determine if these efforts have been made successfully

17
since then, team members visited 70 of the places to stay around Bar Harbor. Each location was
checked for visible advertisements about the Island Explorer, the Chimani Acadia app, and the
MyStop Mobile app. The Chimani Acadia app is a general information app for the park which
includes the Island Explorer bus schedule. The MyStop Mobile app provides visitors with real-
time bus tracking and bus passenger counts.
Objective 2: Investigate the capabilities of current ITS technologies
When the inventory of ITS components in Acadia was completed, the team used this list
to develop an idea of what new technology would be useful in the park. First, the ITS
components that were missing, unused, or broken were identified in the inventory. As shown in
Figure 5, the status of a given category suggested the appropriate course of action for those
components within. In general, components that were missing or excluded from the original ITS
should be implemented. Those that were implemented but not functioning could be fixed or
upgraded to newer technologies that were less likely to break and easier to service. Ones that
were implemented and functioning were considered for upgrades but generally left to continue
operation.
The list of technologies intended to implement, upgrade, or replace old and missing ITS
components was used to search for specific providers and solutions. For each type of component,
the team identified as many different technologies or companies as possible that fit the
requirements of the park. Web searches, case studies, conference proceedings, and
advertisements provided leads to a variety of products that met the criteria.

18
Figure 5: A visual representation of existing ITS in Acadia and how to address the status of each component
Objective 3: Assess the feasibility and logistics of implementing an ITS in Acadia
National Park
After a list of possible components was compiled, impractical solutions were
immediately ruled out. The remaining possibilities were assessed with the TELOS model in mind.
In this model, the technical, economic, legal, operational, and scheduling factors of a potential
system are analyzed to assess the challenges of implementation and the value gained from each
system. The technical factors of each component are the infrastructure, logistics, specifications,
and resources relevant to the component. Economic factors are the financial costs, possible
funding sources, and monetary return provided by the system. Legal feasibility pertains to any
permits or permissions required to implement a system as well as relevant regulations and
contract obligations. The operational feasibility addresses the effectiveness and long-term
reliability of the system. Lastly, scheduling factors deal with the amount of time required to
implement a component and the amount of time it takes to make a noticeable impact. Based on
the categories described above, feasibility criteria were determined. These criteria were used
later on to assess different components and make recommendations. This feasibility assessment
identified the potential strong and weak areas of each component. It also showed where
ITS components that the park has according to the FOT in 2004 and official interviews
Implement missing
components
Re-evaluate needs and eliminate
uneccessary components
ITS components that are currently implemented in the park
Fix broken components
Upgrade to newer techs
Re-evaluate needs
ITS components that are implemented and work properly
Expand services to meet growing
demand
Continue operating well working
programs
Streamline and centralize
information processing

19
information about a specific component was missing. If part of a category could not be addressed,
it was noted so the team could conduct additional research. Overall, the TELOS model helped
the team obtain as much information as possible about each solution and ensure that no
important considerations were omitted.
After the TELOS model was used to analyze initial feasibility, a cost analysis for each
feasible solution was conducted. ITS companies were contacted to obtain more information
about unanswered questions and costs. Customer service representatives provided helpful
information that was missing and price estimates for components. The cost analysis provided the
final insights that allowed systems to be ranked and categorized as feasible or infeasible.

20
Results and Analysis
Objective 1: The current deployment of ITS in Acadia
The first objective of this project was to assess and classify the current state of the
original intelligent transportation system (ITS) implemented as part of Acadia National Park’s
Field Operational Test in 2002. Nine components were proposed for the system. Each of the five
Island Explorer-related components were designed to make riding the bus an easier, more
attractive option, thereby reducing the number of cars on the road. These components included
two-way voice communications, automated vehicle location (AVL), real-time departure signs, an
automated next-stop annunciator, and passenger counting sensors. The other four components
proposed for the ITS were meant to manage traffic issues by providing drivers with information
that might influence their decisions and allowing management to monitor conditions in the park.
These included parking lot monitoring, automatic ranger/vehicle geo-location, entrance traffic
volume recorders, and traveler information systems. The status of the current ITS is shown in
Table 4.
Component Details Implemented? Working? In use?
Island Explorer
Two-way Voice
Communications
Used for contact between vehicles and
dispatch center. Source of traffic
information for park staff.
YES YES YES
Automatic Vehicle
Locator for Island
Explorer
Transmits location, integrated with
departure signs, website, and
annunciator.
YES YES YES
Departure Sign for
Island Explorer
Computes and displays upcoming
departures for riders' information. YES YES YES
Automated
Annunciator for
Island Explorer
Determines the location and next stop
and automatically announces this
information to passengers.
YES YES YES
Passenger Counter
for Island Explorer
Automatically counts boardings and
dismounts at stops for planning and data
purposes.
YES YES YES
Parking Lot
Monitoring
Records the number of entering and
exiting vehicles, displays video feed to
park officials for management
YES NO NO

21
Automatic
Ranger/Vehicle
Geo-Location
Computes and relays ranger locations for
improved deployment and management
of rangers and resources.
NO N/A N/A
Entrance Traffic
Volume Recorder
Records and transmits the number of
vehicles entering and exiting for data
storage.
NO N/A N/A
Traveler
Information System
Collects, integrates, and disseminates
data to travelers via 511 system, Internet,
and parking lot status signs.
PARTIALLY YES* YES*
Table 4: The state of existing ITS components in Acadia National Park
(*Indicates that only the remaining bus tracking service works and is in use.)
All five categories of ITS components for the Island Explorer were deployed in 2002 or
prior and are still in use now. According to Downeast Transportation, the company that owns
and operates the buses, ITS has been used to align the bus schedule with peak tourist season and
traffic flow. Many of the ITS components have been updated recently or will be updated in 2018,
accompanying the replacement of the current bus fleet. The technical information about each
component and a history of any updates performed were obtained through research articles and
contact with Downeast Transportation. This information is as follows:
The two-way voice communication for the Island Explorer utilizes a repeater in the park
and radios in each bus. They are used for communications between buses and from buses
to the dispatch center. After the original implementation, bus drivers reported that there
were some dark areas on the island where they could not receive radio signal. In 2016,
the radio system was updated to a higher frequency, which mostly eliminated the issue.
Passenger counters were installed on each bus and can detect if a passenger is boarding or
dismounting the bus. They provide data to help bus managers adjust bus routes during the
off-season and cope with increasing demand. This data is also displayed on MyStop;
however, the sensors occasionally miscount and display an incorrect number of
passengers.
The AVL for the Island Explorer buses utilizes GPS to compute vehicle location. This
information is used to determine if the bus is running early, late, or on time. The locator
also transmits the data to departure signs. Finally, the real-time location is transmitted to
MyStop every couple of minutes and used by the automated annunciator to notify
passengers when the bus is approaching a stop. Very occasional errors with the AVL are

22
caused by GPS wobble, a rare phenomenon that is unavoidable in this kind of tracking
system that causes the sensor to return incorrect coordinates.
The departure signs are relatively accurate and are located at popular bus stops. Though
the departure signs were deployed at only the most frequented locations throughout the
park, shown in Figure 6, they have been a key component in encouraging bus usage
because long, unpredictable wait times make visitors less likely to ride (Holly, 2009).
Figure 6: Map of automated departure signs on Mount Desert Island (Map retrieved from Google Maps)
Traffic management solutions have been less successful for various reasons. Due to
technical issues and lack of budget, the automatic ranger/vehicle geo-location and the real-time
entrance traffic volume recorder were never deployed in the park. While a system for traffic
volume recording does exist it does not operate or transmit information in real time and therefore
is not considered a component of ITS.
The parking lot monitoring system included video cameras which streamed live feeds to a
website and park headquarters. The parking lot monitoring cameras were only installed at Sand

23
Beach and Blackwoods Campground and required too much staffing and communication to be
practical. The traveler information system was only partially deployed; a website showed only
the parking lot information for two parking lots. When congestion peaked, static signs were
displayed at parking lot entrances stating that the lot was full.
Although the statewide 511 telephone information system was deployed in 2003, it was
then moved to newengland511.org in 2016 and no longer has information about Acadia.
While the deployment of parking lot monitoring and traveler information systems was
short lived, data collected while the systems were in place show that they had the desired effects.
Statistics gathered based on the success of the original system is as follows:
44% of bus riders said that parking information from the trip planning website influenced
their decision to ride the bus (Zimmerman, Coleman, & Daigle, 2003).
67% of visitors using private transportation either changed the time they visited a
destination or changed their destination entirely (Zimmerman, Coleman, & Daigle, 2003).
74% of visitors who saw the parking lot signs in front of Sand Beach and Blackwoods
Campground said the information made it easier to get around (Zimmerman, Coleman, &
Daigle, 2003).
87% of visitors agreed that traffic information such as live bus tracking was valuable or
very valuable (Zimmerman and Burt, 2005).
Promotion of ITS on Mount Desert Island
Of the 70 places of lodging the team examined, 57 had a printed schedule, handout, or
posting about the Island Explorer. Most of those places handed out a single-page newsprint
bulletin with a map of the bus system and a timetable for each route’s arrivals and departures.
These bulletins were also found all around town and made a brief and conspicuous mention of
MyStop, the bus tracking service. Thirteen places of lodging had a business card or flyer
advertising the Chimani app for general information about Acadia and includes Island Explorer
bus schedules. None of the places visited had any information about the MyStop service for real-
time bus tracking. Each of these values, shown as a percentage, is shown in Figure 7.
Additionally, detailed information about each place visited is located in Appendix A. Since the

24
success of information dissemination relies on visitor knowledge of the tools at their disposal,
there is room for improvement in the promotion of the current ITS.
Figure 7: Hotel promotion of traveler information
Objective 2: Capabilities of modern ITS technologies
Since the Island Explorer components were recently upgraded or will be in 2018, they
were not considered for upgrades. No new technologies are necessary to enhance the Island
Explorer service; rather, the current ITS components for the bus must be promoted more
effectively.
The components for parking lot monitoring, ranger/vehicle geo-location, real-time
entrance traffic volume recording, and traveler information systems are currently not
implemented in the park. Parking lot monitoring was considered a high priority need because it
allows for real-time information on congestion in the park. This information allows for smarter
decisions when in the hands of tourists, making traveler information systems another high
priority. Entrance traffic volume was not considered for upgrades because parking lot monitoring
gives similar, more specific information about tourists movements in the park. Ranger/vehicle

25
geo-location was excluded from further consideration in this project because it was not deemed
critical for managing tourist traffic.
Data analytics are an important part of modern ITS that was not included in Acadia’s
original system. Long-term analytics offer many capabilities, of which only a few are currently
possible with the non-real-time car counting sensors in place in the park. Because data can be
used to help the park make adjustments over time based on concrete trends, this category of ITS
technologies was added for consideration.
Parking Lot Monitoring
Parking lot monitoring systems utilize ITS to collect and process information about
parking lot status on a real-time basis. The commercially available systems for parking lot
monitoring can use a variety of sensors to count the number of vehicles entering and exiting the
parking lots and use ancillary software to calculate the number of empty spaces left. Sensors can
count cars using infrared, radar, acoustics, pneumatic tube, magnetic field, electric current and
video feed. The team found that magnetometers, induction loops, and cameras were the most
successful of the car counting devices and focused continued research on these devices.
A magnetometer sensor detects distortions in the local magnetic field when large masses
of metal pass by. These sensors are approximately fist-sized and are easy to install. Sensors are
either mounted in the roadway or on a post at the side of the road. Commercial magnetometer
sensors are enclosed in weatherproof cases to allow them to withstand outdoor environments.
The sensors can be powered using existing power lines, batteries, or solar panels. They can
transmit data wirelessly via 3G or cellular signal.
Figure 8: Industrial grade magnetometer sensor (Monnit, 2017)

26
Induction loop sensors detect passing vehicles by way of induction; as a vehicle passes
overhead, the change in magnetic field induces an electric current in a loop of wire installed in
the roadway and the event is accounted for. They are accurate within 5% of the expected result.
The induction loop sensors on the market today consist of the loop itself, an extension cable, and
a detector module. The detector module is usually enclosed in a case and mounted near the
roadway and distributes power to the loops. To protect the loops from wear and tear, they are
insulated and embedded no less than one inch from the road surface. This process makes
installation much more difficult and expensive for induction loop sensors compared to other
sensors. Their life spans are approximately fifteen years because they have no direct contact with
the environment.
Figure 9: Basic induction loop installation (Diamond Traffic, 2017)
Cameras can also be utilized for parking lot monitoring. Since cameras receive visual
information, they require line of sight to every parking space and should be installed on high
poles. With the aid of additional video detection software, camera feeds can be analyzed in real
time to calculate the current number of spaces available in a lot. Cameras can be powered using
existing power lines or solar panels. Collected data can be sent to a central processing software
via ethernet or wireless signals. Cameras provide the most detailed information among all the
parking lot monitoring sensors. Unfortunately, they are delicate devices that need regular
maintenance and the quality of video feeds are easily affected by bad weather such as fog and
storms. Furthermore, cameras require a stronger data connection than the other sensors because
cameras transmit video which is more data-intensive.

27
Figure 10: Software processing of camera video feed (AutoDeft, 2017)
Traveler information systems
A traveler information system refers to any media that disseminates real-time information
to travelers. Some of the common platforms for disseminating parking information include
dynamic message signs, websites and mobile apps.
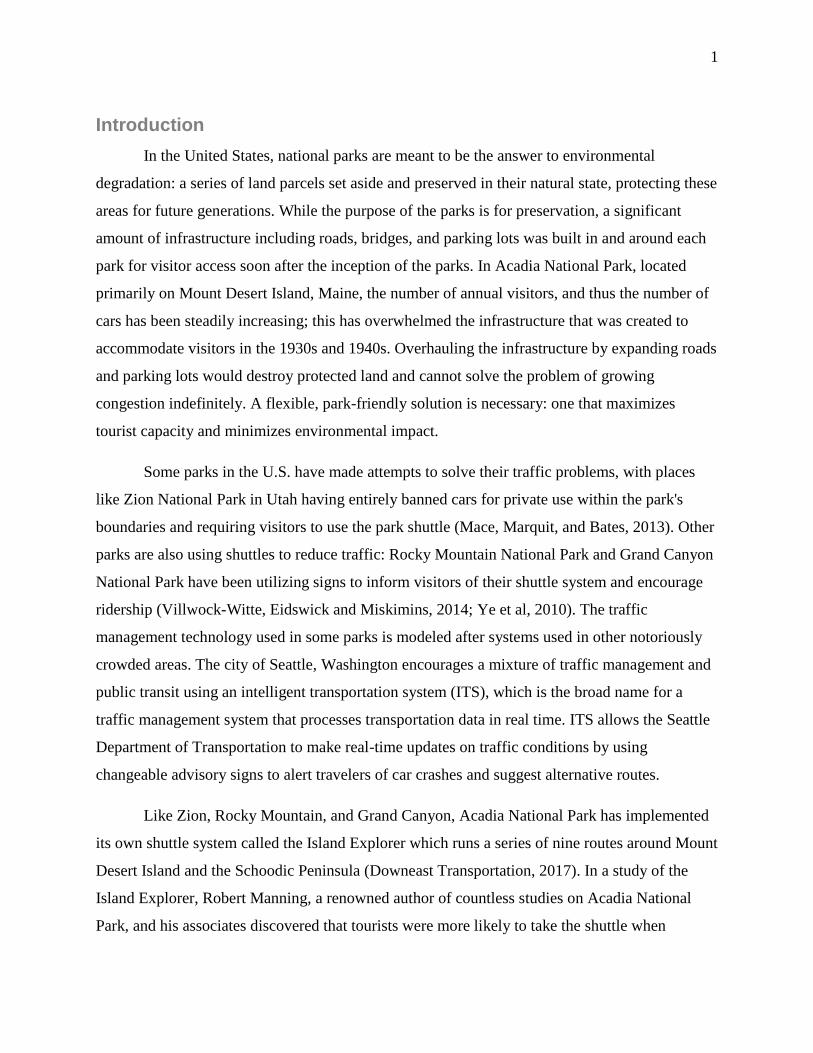
Dynamic message signs are electronic signs which use LEDs to display
information by the roadside. The signs that were investigated display the number of spaces
available for multiple parking lots. These are usually large, permanent signs that require
hardwired power and data lines. The signs are usually placed a few hundred yards before the
parking lots. Permanent signs include a corrosion resistant frame and moisture absorbing
material inside to ensure that these signs can tolerate outdoor environments. In Acadia, 74% of
visitors agreed that real-time information of parking availability made it easier to get around
when the original ITS was functional. By deploying real-time parking availability signs, visitors
can better navigate during their trips.
28
Figure 11: Dynamic parking sign that shows multiple parking lots (Signal-Tech, 2017)
Websites can be added to traveler information systems to display parking data. Combined
with general descriptions of tourist attractions, real-time information can be integrated into a trip-
planning website. Visitors can access this information before their trip and make plans in
advance to avoid crowding and congestion. Additionally, companion apps can be developed to
work in sync with websites. Although mobile apps have similar contents as websites, they are
accessible wherever tourists bring their phones. Thus, most visitors can check real-time traffic
and parking information at any time. One benefit of a companion app would be the ability to
obtain real-time information when users have data service and static information when they do
not.
Data Analytics
Although the key to ITS is collecting, processing and disseminating information
in real time, they can also assist data analytics in the long run. When combined with additional
data, such as the date, time, and weather, parking data can be extrapolated to form historical and
predictive trends. Results can be provided to managers to anticipate problems. These results can
also be integrated into traveler information systems to help visitors make more informed
decisions.
Objective 3: Feasibility and logistics of ITS implementation
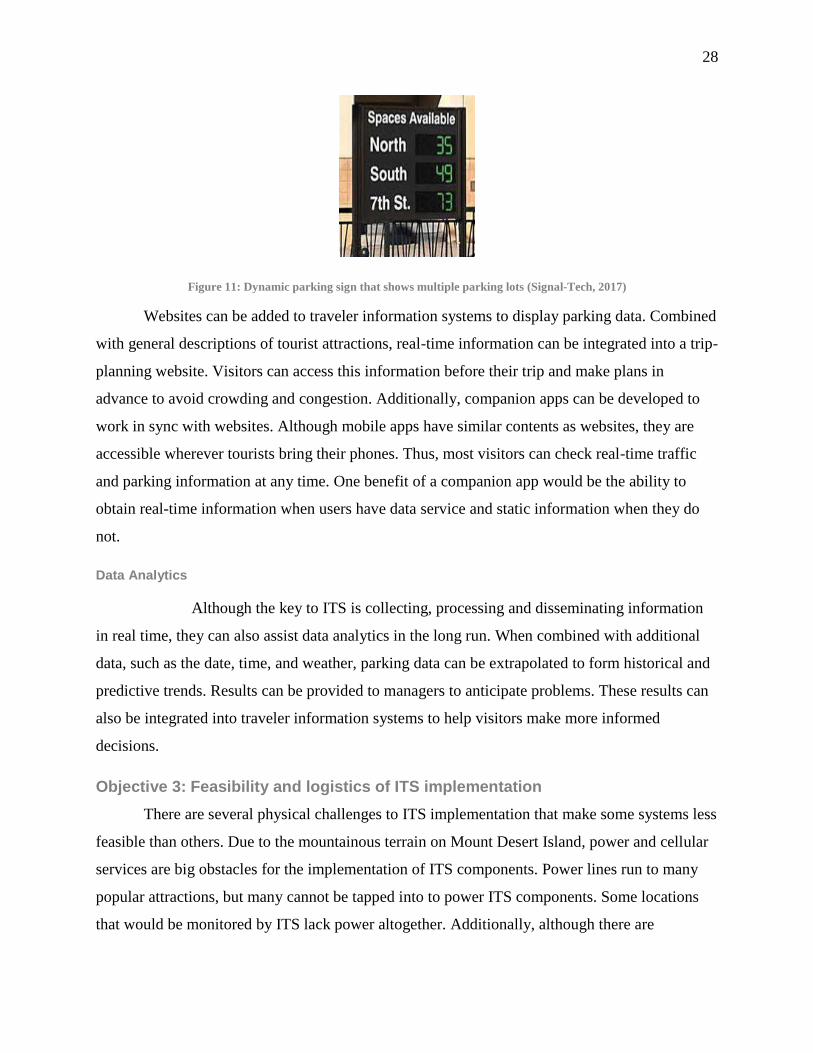
There are several physical challenges to ITS implementation that make some systems less
feasible than others. Due to the mountainous terrain on Mount Desert Island, power and cellular
services are big obstacles for the implementation of ITS components. Power lines run to many
popular attractions, but many cannot be tapped into to power ITS components. Some locations
that would be monitored by ITS lack power altogether. Additionally, although there are
29
commercial cell towers on Mount Desert Island, there are still dark areas where there is no
service. Cell tower locations can be found in Figure 12. Lastly, digging and cutting or trimming
trees are undesirable requirements for some systems to work. Since the natural aspects of the
park are meant to be protected, alternative ways to implement these systems must be found.
Figure 12: Commercial cell towers on and around Mount Desert Island (Map retrieved from Google Maps)
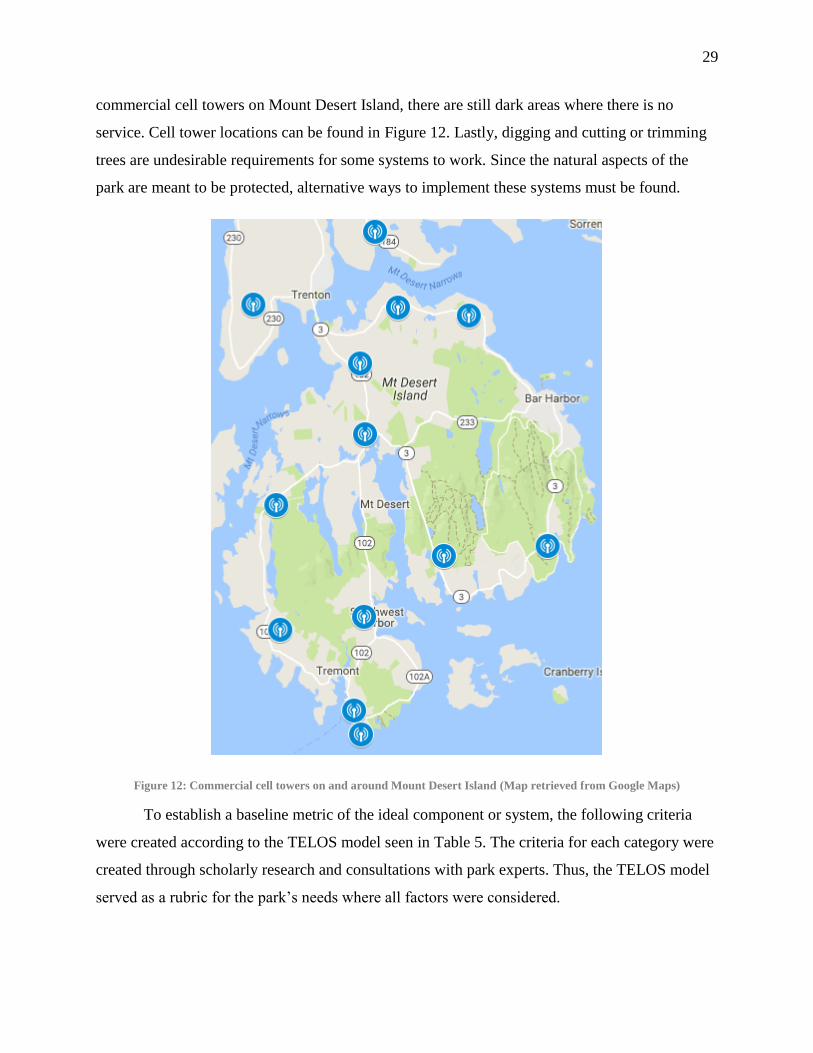
To establish a baseline metric of the ideal component or system, the following criteria
were created according to the TELOS model seen in Table 5. The criteria for each category were
created through scholarly research and consultations with park experts. Thus, the TELOS model
served as a rubric for the park’s needs where all factors were considered.
30
Category Ideal qualities
T
The system can be implemented and repaired using existing staff and knowledge at
the park. It can be monitored with few or no staff members such that additional
people need not be hired to reap the benefits of the system. It does not falter when
faced with the challenges of Acadia's geography and can run mostly on existing
infrastructure such as radio towers. The system is rugged for inclement weather and
runs on low power resources.
E
The equipment is less expensive than similar technologies but still reliable. Any
economic returns are perks, but traceable and predictable returns on investment are
not expected. If a company offers to sponsor or discount the product in any way, this
is a clear benefit.
L
Minimal legal work will be required to install the system. It runs on existing radio
frequencies, it does not require special permits to work on wetlands or natural land
for installation, and it does not violate any commitments Acadia has to Bar Harbor
and the community. Acadia is not bound by an overbearing contract to pay for
services related to the equipment and installation will not breach existing contracts
with other companies.
O
The system has a clear track record of mitigating traffic problems, perhaps in tourist
areas as well as others. Information dissemination to park management and visitors is
intuitive and occurs in a variety of ways, from dynamic signs to mobile apps, web
interfaces, and a control center for officials to access. The system advises tourists to
avoid crowded places and encourages transit use to reduce traffic. The system
functions as a deployment tool for rangers and personnel.
S
The system can be implemented in less than a year, preferably during the off-season,
and through good promotion, will immediately start to spread out the impacts of
traffic in its first season of use. Long-term data analytics will be useful within a few
years of data collection, and show a clear trend of improvement.
Table 5: Ideal characteristics of a feasible ITS component in Acadia National Park
Implementation logistics at Sand Beach
Sand Beach was selected for preliminary analysis because of its role in the original Field
Operational Test. Since the original ITS in Acadia used a camera at Sand Beach, the team
decided that the best first step would be to attempt to monitor that parking lot again with new
technology. The logistics below are described in detail for Sand Beach, but can be extrapolated
to any destination in the park.

31
Magnetometer implementation logistics
For Sand Beach, four magnetometer sensors would be required: one for each lane of
traffic in and out of each parking lot. Small solar cells can be used to recharge the batteries of
each sensor. The cellular access point sold alongside the sensors can receive data from all four of
these sensors at once, so only one is necessary. The range between the magnetometers and access
point is adequate; the signal can travel up to one thousand feet or more with a line of sight
between the sensors and the access point. Thus, the access point can be placed anywhere along
Park Loop Road within the vicinity of Sand Beach where there is power and cellular reception.
Depending on the cellular provider, there is likely to be basic cell coverage at either Sand Beach
itself or at the entrance station, which is within range. As a backup plan, an ethernet access point
can be installed at the entrance station, which serves the same purpose but transmits data via a
hard-wired internet connection instead of the cellular network. The magnetometer sensors are
marketed as rugged and reliable. However, due to their low price, they can be easily replaced. If
sensors are replaced on a rolling basis when they become faulty or damaged, the lifespan of the
entire system would be indefinite.
The Monnit Corporation provides magnetometers along with all of the necessary
components and software to make them work. The parts are sold in an online store where
representatives can assist in putting together a complete package. Magnetometer sensors from
Monnit cost $220 per unit with a solar panel included. A cellular access point is provided by
Monnit with a data plan from one of several providers and is integrated with the sensors.
Software from Monnit provides access to online time-stamped data about car counts. It includes
an API for development with third parties which Acadia would make use of to disseminate the
information about traffic on an external website. This software API would be the gateway
between Monnit’s data and a public interface (Monnit, 2017). Installation costs of about $1,500
were estimated based on additional hardware needed to install the system. This includes poles or
posts for mounting sensors with all of the associated supplies and costs. The installation cost also
includes any potential hardware that might be necessary to purchase from Monnit, such as range
extenders for the sensors if the access points must be situated too far away. Exact costs are rather
unpredictable but the $1,500 is assumed to cover all potential fees. Lastly, maintenance costs are
estimated at $400 annually for a complete system at Sand Beach. If a sensor breaks, replacing it
with a new one would be included in the maintenance fee, rather than trying to fix it. Otherwise,

32
this fee covers touch-ups and small fixes that must be made to the system over time such as
replacement of posts and screws, or removal of branches that obstruct solar panels. Again,
maintenance fees cannot be precisely predicted, but the sensors are rugged and inexpensive so
yearly maintenance should not be very costly or elaborate.
Part Quantity Unit Cost Total Cost Annual Unit
Cost
Annual Total
Cost
Magnetometer
Sensor 4 $220 $880 $0 $0
Cellular Access
Point 1 $340 $340 $120 $120
Software
Subscription 1 $0 $0 $40 $40
Installation 1 $1,500 $1,500 $0 $0
Maintenance 1 $0 $0 $400 $400
Total Initial
Cost: $2,720
Total Annual
Cost: $560
Table 6: Cost analysis of magnetometer sensors (Monnit, 2017)
Induction loop implementation logistics
Induction loops are similar to magnetometers in that one would be required per lane of
traffic entering and exiting the parking lots. However, the sensors themselves are large and must
be buried underneath the roadway, so excavation, paving, and sealing would need to be done for
each of the four lanes. Additionally, poles or posts must be erected at the roadside to hold
additional electronics for sensing and communication as well as solar panels for power.
The average cost of an induction loop is only $3,000 per site (John A. Volpe Center,
2011). However, since the installation of induction loop sensors include repaving the roadway,
the cost of installation is relatively high. T2 is a company that provides induction loop sensors as
a solution to vehicle counting and the costs of one induction loop sensor, its companion software,
and its installation is $10,000 (T2 Systems, 2017). Two sets of sensors need to be installed to
monitor Sand Beach parking lot, thus the cost would be $40,000. One cellular access point will
suffice for data transmission which is estimated to cost about $500 for the hardware and an has

33
annual fee of $120. Although induction loop sensors have a life span of fifteen years and are very
unlikely to break, the team estimated the maintenance cost to total of $4,000 per year.
Part Quantity Unit Cost Total Cost Annual Unit
Cost
Annual Total
Cost
Induction Loop
Sensor
4 $10,000 $40,000 $0 $0 Software license
Installation
Cellular Access
Point 1 $500 $500 $120 $120
Maintenance 1 $0 $0 $1,000 $4,000
Total Initial
Cost: $40,500
Total Annual
Cost: $4,120
Table 7: Cost analysis of induction loop sensors (John A. Volpe, 2011)
Camera implementation logistics
A new camera at Sand Beach could be mounted in place of the old one, which has a good
line of sight over the whole parking lot and is already mounted on a pole where solar power is
available. A second camera for the auxiliary lot would not be able to see the entire lot at once but
could be mounted to track cars entering and exiting the parking lot instead. This would require
the installation of another pole for mounting with solar panels for power. A cellular access point
is required in order to send data to the cloud for aggregation. Software for video analysis needs
to be configured and installed on a central computer at Park Headquarters.
Cameras on the market, such as stand-alone cameras from Axis, Honeywell, or Sony, can
be used for information collection. The variation of commercial cameras and their qualities leads
to a large range of costs varying from $55 for the simplest one to $83,000 for infrared cameras
(John A. Volpe, 2011). The cost for one camera at the Sand Beach parking lot and its installation
was estimated to be $25,000. If the auxiliary lot is taken into consideration, the cost for two
cameras would be doubled. One cellular access point would be required at Sand Beach to
transmit data. Since the video collected from the camera contains large amount of information,
the cost of the cellular access point is estimated to be $500 with an additional data plan of $120
per year. The team consulted TrafficVision which is a company that aims to provide real-time

34
traffic information by analyzing video streams. The software needs to be configured and costs
about $2,000 per camera per year (Traffic Vision, 2017). The estimated maintenance fee is
$2,500 for each camera per year (John A. Volpe, 2011). As a result, the camera-based system for
Sand Beach would cost $25,500 initially with an annual fee of $4,620. Should the system include
the auxiliary parking lot, the initial cost would be raised to $50,500 and the annual cost would be
raised to $9,120.
Part Quantity Unit Cost Total Cost Annual Unit
Cost
Annual Total
Cost
Camera 2 $50,000 $50,000 $0 $0
Installation
Cellular Access
Point 1 $500 $500 $120 $120
Software
Subscription 2 $0 $0 $2,000 $4,000
Maintenance 2 $0 $0 $2,500 $5,000
Total Initial
Cost: $50,500
Total Annual
Cost: $9,120
Table 8: Cost analysis of cameras (John A. Volpe, 2011)
Traveler information systems implementation logistics
A permanent, customized dynamic message sign could be placed near the Sand Beach
entrance station showing the number of available spaces in parking lots around Park Loop Road.
The sign must be positioned several hundred feet after the entrance station to give drivers ample
time to make a decision before they reach Sand Beach. The sign can be powered by the entrance
station and data can be transmitted using ethernet cable. The cost of a permanent LED
changeable message sign ranges from $4,000 to $283,000 (John A. Volpe, 2011). For a sign
large enough to display counts for several parking lots, the team estimated the cost to be
$100,000 with an annual maintenance cost of $5,000.
An integrated, centralized website for travel and trip planning would be the best way to
adjust visitors’ behavior before and during their visits. The mock-up shown in Appendix B,
Figure 14 includes some of the most important features such a website would include. The site
could have internal pages for trip planning and parking lot information, as well as links to

35
external services such as MyStop for bus tracking and exploreacadia.com for details about the
Island Explorer. A website would also be an important promotional tool. Important keywords
like “See more...on the free Island Explorer,” “reduce stress,” and “simplify parking” are derived
from research about encouraging visitors to use ITS (Collum and Daigle, 2015). These words are
all emphasized on the homepage, as seen in Appendix B, Figure 15. A traffic forecast system
where destinations are assigned a color based on their predicted traffic situation on a given day
would make use of historical data. Drop-down menus would give a more broken down prediction
for each location, as shown in Appendix B, Figure 16. The website could have responsive design
so that it is easy to use on mobile devices. Figure 17 shows the mock-up web page in a mobile
browser window. Additionally, a mobile application could be created with the same look and feel
of the website so that information can be easily accessed across multiple devices. A mobile
application would be able to provide users with mobile, real time data as long as they have
cellular service and static data when they do not.
Results from data analytics could also be integrated into the website. For example, graphs
showing parking availability trends from the past 24 hours as well as the prediction for the next
24 hours, as shown in Appendix B, Figure 18. Weather information can also be added to refine
the prediction. The sidebar showing the weather forecast could help visitors make better
decisions. This forecast could be updated with helpful advice based on correlations between
weather and traffic. Data analytics for both park managers and visitors would come from the
software provided with the parking lot sensors.
One-time development fees for both a website and a mobile app would roughly total
$220,000. No annual fees are included because the only required upkeep would be data inputs
from park staff. Also, the design is assumed to last for five to ten years after development before
an update would be desired. A server that could handle the volume of web traffic from the
website and the app would cost approximately $25,000 each year. Server space would be
provided off-site by a third-party company so that minimal technical knowledge or setup is
required.

36
Part Quantity Unit Cost Total Cost Yearly Unit Cost Yearly Total
Cost
Dynamic
Parking Sign 1 $100,000 $100,000 $0 $0
DMS
Maintenance 1 $0 $0 $5,000 $5,000
Website 1 $150,000 $150,000 $0 $0
Mobile App 1 $70,000 $70,000 $0 $0
Server Hosting 1 $0 $0 $25,000 $25,000
Total Initial
Cost: $320,000
Total Annual
Cost: $30,000
Table 9: Cost analysis of traveler information systems

37
Recommendations
The recommendations detailed below are divided into two subgroups: a selection of ITS
components with implementation logistics and a few suggestions for improving ITS as it
currently exists in the park. Recommendations for ITS components are based on the results of the
TELOS model and a cost analysis. Suggestions for ITS improvements are based on research
done in Acadia and the surrounding communities.
The team’s most favorable recommendation to the park was a magnetometer-based
system. Should this plan be implemented, each magnetometer would be mounted at engine block
height facing an individual lane at every location. Magnetometers would count cars entering and
exiting the lots; this information would then be broadcasted back to park headquarters and
displayed on signs far enough ahead of parking lot turn-offs to allow visitors to make informed
travel decisions. The same information would also be uploaded to a website to inform visitors of
historical and real-time parking conditions before they embark for the day. Magnetometers
became the team’s first recommendation because of their ease of installation, relatively low cost,
and seven year lifespan. This system can be installed by park staff and runs autonomously.
Additionally, the sensors are rugged and would run off-grid with low power. Magnetometers are
packaged with all hardware necessary for installation with the exception of poles and are
designed to be incredibly simple to install. The team viewed these traits as extremely favorable
because they would reduce installation costs by eliminating the need for an outside contractor.
The initial cost calculated for this recommendation was $2,720 with an annual cost of $560 for
implementation at Sand Beach.
If magnetometers were deemed to be inadequate by the park, the team’s second
recommendation was an induction loop-based system. Induction loops are similar to
magnetometers in the way that they count cars but are significantly more expensive. An
induction loop is a loop of wire that is embedded in the roadway. As cars pass over the loop, the
magnetic field is disturbed by the car inducing a current in the loop; this event is then accounted
for within a post-mounted counter beside the road. Similar to the magnetometers, induction loops
can send data to be broadcasted on dynamic message signs and websites. Since induction loops
are already in use in several parts of the park, management is familiar with their installation and
maintenance. Induction loops come second to magnetometers because the installation for each

38
unit is much more expensive but not much more beneficial, even when taking into account that
the lifespan of an induction loop setup is twice that of a magnetometer setup. The calculated
initial cost for implementation of an induction loop system at Sand Beach totalled $40,500 with
an annual cost of $4,120.
A camera-based solution was the third and final recommendation that was presented to
the park. With the right software, cameras would be able to provide a video feed as well as video
analytics that can count the number of available spaces. While cameras would be able to provide
a visceral idea of the extent of overcrowding, they are also the most expensive option and must
overcome several obstacles that are particularly difficult to handle in a natural area. Because
cameras are sight-based, complications such as trees, fog, and irregularly shaped parking lots
pose unique challenges. It is for these reasons that cameras were the least desirable system to be
recommended. The initial cost for a camera-based system at Sand Beach totalled $25,500 with an
annual cost of $4,620 or an initial cost of $50,500 with an annual cost of $9,120 if a second
camera is installed to monitor the smaller, auxiliary parking lot at that location.
In addition to each sensor recommendation, the team suggested that dynamic message
signs should be placed at an appropriate distance before each monitored parking lot entrance to
display real-time space availability. A sign placed soon after the Park Loop Road entrance
station could display space counts for the nearest few monitored lots. Dynamic message signs
would be beneficial because they would provide visitors with real-time data immediately before
approaching their destination. A custom sign displaying multiple parking space availability
counts was estimated to cost $100,000 with $5,000 annual maintenance.
One of the most crucial components of the team’s proposal was a comprehensive parking
and travel data website. A website could include historical and predictive data to give visitors an
idea of how difficult it may be to find parking in various locations. Such information has been
proven to convince visitors to take the Island Explorer, change their destination, or change the
time they choose to visit their original destination. Because the internet is an ever-expanding
resource that is available to almost every visitor to the park, a website would provide a key
opportunity for disseminating travel-oriented information to those who can take advantage of it.
An advanced trip planning website was estimated to cost $150,000. Server hosting would cost
about $25,000 annually.

39
In addition to a website, a companion mobile application with a similar look and feel
could be created so that the same information would be easily accessible across multiple devices.
The application would serve the same purpose as the website but would be formatted for mobile
devices; it could provide real-time information when visitors have cellular data service and static
information when they do not. A companion application was estimated to cost $70,000 and could
share the server for the trip planning website.
Software for analytics would be included with any of the recommended systems and is
crucial to reap the benefits of ITS. Analytics could provide parking data, turnover rates, peak
times, weather-based predictions, advanced warning, and carrying capacities for each monitored
location. Any analytic software would also function autonomously to minimize the time and
effort required by park staff to utilize the information.
Perhaps the most essential piece of the team’s recommendation was for the park to
adequately promote existing infrastructure and any newly implemented technology. Counting
open parking spaces will never influence visitor behavior unless that information is disseminated
properly, and the disseminated information is useless if visitors are unaware of its existence. The
proposed website should advertise the Island Explorer and use research-based keywords and
concepts to convince visitors to take advantage of available services.
Though the team’s recommendation was limited to the pilot location of Sand Beach,
several other attractions throughout the park could benefit from the implementation of ITS
components. After the implementation of ITS at Sand Beach, results should be observed. If the
new ITS proves effective in monitoring and mitigating congestion, the park should expand the
system to other locations. The team recommends that the Cadillac Mountain parking lot is next
to be monitored so that park staff can remotely monitor the crowding that often reaches
dangerous levels. Jordan Pond House is another extremely popular location that can benefit from
the implementation of an ITS. The Visitor Center parking lot would follow since visitors are
encouraged to go there but space is limited. These locations are identified in Figure 13. Because
the infrastructure such as dynamic parking signs, a website, a mobile app and data analytic
software will have already been implemented, each expansion only requires additional hardware
installation. Visitors will have grown accustomed to utilizing the system at Sand Beach, and will
be accepting and welcoming of its expansion.
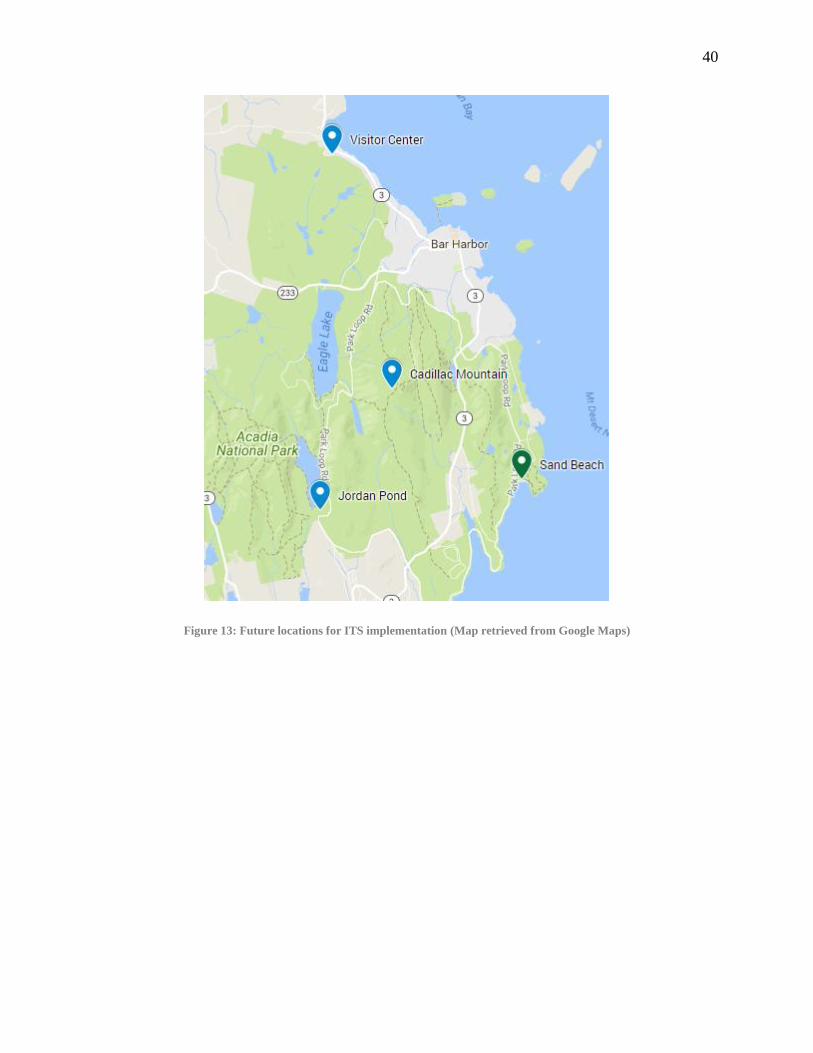
40
Figure 13: Future locations for ITS implementation (Map retrieved from Google Maps)

41
Conclusions
In this report, the feasibility of implementing an intelligent transportation system in
Acadia National Park was assessed and logistics for installation were discussed. The key features
of the recommended system are parking lot monitoring sensors, dynamic message signs, an
online traveler information service, and data analytic software. It was found that magnetometers
would be the most effective parking lot sensors in Acadia since they are the most cost-effective
and easiest to install of the components considered. Logistically, these sensors require minimal
new infrastructure since they are completely wireless. Dynamic signs are much more costly and
will likely require physical cabling for power and data, but these signs would be very helpful to
park visitors. A mock-up web service for trip planning in Acadia was designed by the team to
showcase what features and keywords must be used to change visitor behavior based on research.
An app would be developed alongside the website to give mobile users easy access to
information at all stages of their trips. Lastly, data analytics would provide historical trends and
future predictions to park managers and visitors alike. It was determined that Sand Beach was the
optimal location to pilot the physical components of a system, while Acadia should have a
central online platform for travel information as soon as possible. If the system is successful in
its initial years, expansion to other notoriously crowded areas will be easier because of the
precedent set for installation, software, and third-party contracting.
From this project, it was concluded that intelligent transportation systems have an
important role in keeping Acadia park open to the increasing number of tourists who visit each
year. When all of the proposed ITS components are working together in a system, visitors to the
park will be able to make better decisions about how to plan their trips. Managers will be able to
anticipate overcrowding problems before they arise. These benefits will make Acadia more
accessible and easier to navigate for everyone. The long-term effects of such a system are less
environmental damage and greater levels of visitor satisfaction. Adjustments to travel in the park
can be made based on concrete data and trends. While an overwhelming amount of technology in
our daily lives might be why countless tourists seek the natural solace of Acadia each year, the
technology is destined to follow them there. Without an ITS, access to the beauty of the park
might have to be restricted in future years because current means cannot effectively manage
traffic. Although the creators of ITS technologies probably did not envision their inventions

42
solving traffic problems in national parks, the need for data analytics and traffic redistribution
dictates the use of technology. In a world that is increasingly connected, even parks must adapt
to make the most of the information age.

43
Bibliography
Autodeft. (2017). Camera software for parking monitoring.
Bacon, J., Manning, R., Lawson, S., Valliere, W., & Laven, D. (2003). Indicators and standards
of quality for the schoodic peninsula section of acadia national park, NE-302 279-85.
Collum, K. K., & Daigle, J. J. (2015). Combining attitude theory and segmentation analysis to
understand travel mode choice at a national park. Journal of Outdoor Recreation and
Tourism, 9, 17-25.
Diamond Traffic. (2017). Loop sensor technology.
Downeast Transportation Inc. (2017). Island explorer home. Retrieved from
http://www.exploreacadia.com/
Dziuban, W., Leahy, A., Sengstaken, J., & Whittle, D. (2016). Tourist impact in acadia national
park.
Hallo, J. C., & Manning, R. E. (2009). Transportation and recreation: A case study of visitors
driving for pleasure at acadia national park. Journal of Transport Geography, 17(6), 491-
499.
Hallo, J. C., & Manning, R. E. (2010). Analysis of the social carrying capacity of a national park
scenic road. International Journal of Sustainable Transportation, 4(2), 75-94.
Holding, D. M., & Kreutner, M. (1998). Achieving a balance between “carrots” and “sticks” for
traffic in national parks: The bayerischer wald project.
Holly, F. M. (2009). Incentives and disincentives for day visitors to park and ride public
transportation at acadia national park.
John A. Volpe Center. (2011). Intelligent transportation systems in the national parks system
and other federal public lands - 2011 update.
Kelly, J. (2015). Acadia national park to offer car-free mornings. Retrieved from
https://www.nps.gov/acad/learn/news/acadia-national-park-to-offer-car-free-
mornings.htm
Mace, B. L., Marquit, J. D., & Bates, S. C. (2013). Visitor assessment of the mandatory
alternative transportation system at zion national park. Environmental Management,
52(5), 1271-1285.
Manning, R. (2009). Design and assessment of transportation systems on mount desert island.
Parks and people. Burlington, Vermont: University press on New England.
Manni, M. F., Littlejohn, M., & Hollenhorst, S. J. (2010). Acadia national park visitor study,
summer 2009. Idaho: National Park Service.
Monnit. Retrieved from www.Monnit.com
Monnit. (2017). Magnetometer sensor.
National Park Service. (1999). The national park service transportation planning guidebook
(First ed.). United States: Park Facility Management Division.

44
National Park Service. (2014). Congestion management toolkit. US Department of Interior.
National Park Service. (2016). Acadia transportation plan preliminary concepts. Bar Harbor:
National Park Service.
National Park Service. (2017). National park service visitor use statistics. Retrieved from
https://irma.nps.gov/Stats/Reports/Park/ACAD
Seattle Department of Transportation. (2015). Intelligent transportation systems (ITS). Retrieved
from http://www.seattle.gov/transportation/its.htm
Signal-Tech. (2017). Outdoor LED parking garage sign.
Steinitz, C. (1990). Toward a sustainable landscape with high visual preference and high
ecological integrity: The loop road in acadia national park, U.S.A. The Netherlands:
Elsevier.
T2 systems. Retrieved from www.t2systems.com
TrafficVision. Retrieved from http://www.trafficvision.com
U.S. Department of the Interior. (1991). General management plan, environmental assessment :
Acadia national park, maine: Public review draft. Retrieved from
http://hdl.handle.net/2027/mdp.39015024891072
Villwock-Witte, N., Eidswick, J., & Miskimins, L. (2014). Rocky mountain national park: 3
years of ITS. Retrieved from https://trid.trb.org/view.aspx?id=1337210
Ye, Z., Albert, S., Eidswick, J., & Law, S. (2010). Improving shuttle ridership using intelligent
transportation system technologies. Transportation Research Record: Journal of the
Transportation Research Board, 2174, 44-50.
Zimmerman, C. A., & Burt, M. (2004). Traveler information and tourism:Assessment of traveler
information and 511 impacts upon tourist destinations and national parks.
Zimmerman, C. A., Coleman, T. G., & Daigle, J. J. (2003). Evaluation of acadia national park
ITS field operational test. Washington, DC: ITS Joint Program Office.
Zimmerman, C., Daigle, J., & Pol, J. (2004). Tourism business and intelligent transportation
systems: Acadia national park, Maine. Transportation Research Record: Journal of the
Transportation Research Board, 1895, 182-187.
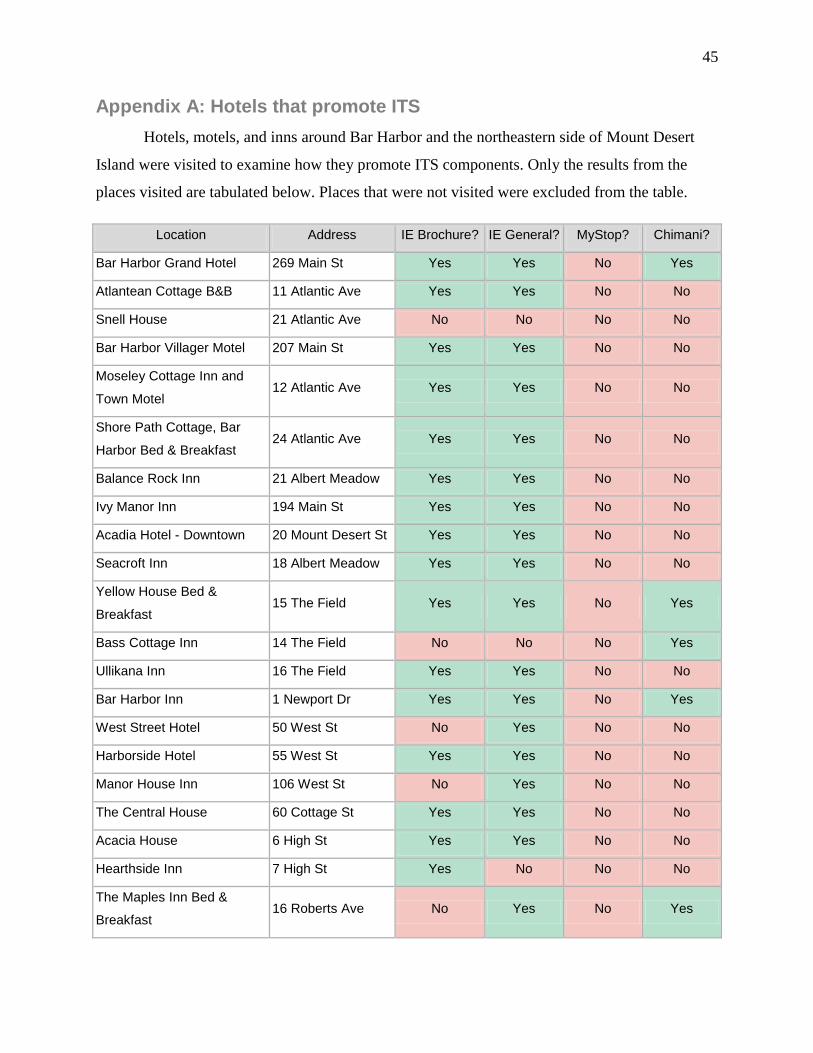
45
Appendix A: Hotels that promote ITS
Hotels, motels, and inns around Bar Harbor and the northeastern side of Mount Desert
Island were visited to examine how they promote ITS components. Only the results from the
places visited are tabulated below. Places that were not visited were excluded from the table.
Location Address IE Brochure? IE General? MyStop? Chimani?
Bar Harbor Grand Hotel 269 Main St Yes Yes No Yes
Atlantean Cottage B&B 11 Atlantic Ave Yes Yes No No
Snell House 21 Atlantic Ave No No No No
Bar Harbor Villager Motel 207 Main St Yes Yes No No
Moseley Cottage Inn and
Town Motel 12 Atlantic Ave Yes Yes No No
Shore Path Cottage, Bar
Harbor Bed & Breakfast 24 Atlantic Ave Yes Yes No No
Balance Rock Inn 21 Albert Meadow Yes Yes No No
Ivy Manor Inn 194 Main St Yes Yes No No
Acadia Hotel - Downtown 20 Mount Desert St Yes Yes No No
Seacroft Inn 18 Albert Meadow Yes Yes No No
Yellow House Bed &
Breakfast 15 The Field Yes Yes No Yes
Bass Cottage Inn 14 The Field No No No Yes
Ullikana Inn 16 The Field Yes Yes No No
Bar Harbor Inn 1 Newport Dr Yes Yes No Yes
West Street Hotel 50 West St No Yes No No
Harborside Hotel 55 West St Yes Yes No No
Manor House Inn 106 West St No Yes No No
The Central House 60 Cottage St Yes Yes No No
Acacia House 6 High St Yes Yes No No
Hearthside Inn 7 High St Yes No No No
The Maples Inn Bed &
Breakfast 16 Roberts Ave No Yes No Yes

46
Aysgarth Station 20 Roberts Ave Yes Yes No Yes
Thornhedge Inn 47 Mt Desert St Yes Yes No Yes
Anchorage Motel 51 Mt Desert St Yes Yes No No
Anne's White Columns Inn 57 Mt Desert St Yes Yes No No
Stone Throw Cottage Inn 67 Mt Desert St Yes Yes No No
Mira Monte Inn 69 Mt Desert St Yes Yes No No
Mount Desert Street Motel 68 Mt Desert St Yes Yes No No
Holbrook House Bed &
Breakfast 74 Mt Desert St Yes Yes No Yes
Primrose Inn 73 Mt Desert St Yes Yes No Yes
Primrose Place 51 Holland Ave Yes Yes No Yes
Quality Inn 40 Kebo St Yes Yes No Yes
Bar Harbor Manor 47 Holland Ave No Yes No No
Castlemaine Inn 39 Holland Ave No No No Yes
The Elmhurst Inn 40 Holland Ave Yes Yes No No
Holland Inn 35 Holland Ave Yes Yes No No
Quimby House Inn 109 Cottage St Yes Yes No No
Saltair Inn 121 West St Yes Yes No No
Wonder View Inn 50 Eden St Yes Yes No Yes
Hampton Inn Bar Harbor 12 Norman Rd No No No No
Atlantic Eyrie Lodge 6 Norman Rd Yes No No No
The Bluenose Inn 90 Eden St Yes Yes No No
Cleftstone 92 Eden St Yes Yes No No
Highbrook Motel 94 Eden St Yes Yes No No
Edenbrook Motel 96 Eden St Yes Yes No No
Bar Harbor Motel 100 Eden St Yes Yes No Yes
Days Inn Bar Harbor 120 Eden St Yes No No No
Holiday Inn Resort Bar
Harbor 123 Eden St Yes Yes No No
The Colony Cottages 20 ME-3 Yes Yes No No

47
Gallagher's Travels Motel &
Cabins 122 ME-3 Yes Yes No No
Hanscom's Motel 273 ME-3 Yes Yes No No
Hinckleys Dreamwood
Cottages 318 ME-3 No Yes No No
High Seas Motel 339 ME-3 Yes Yes No No
Acadia Pines Motel 389 ME-3 Yes Yes No No
Robbins Motel 396 ME-3 Yes No No No
Emery's Cottages On the
Shore 181 Sand Point Rd No Yes No No
Best Western Acadia Park
Inn 452 ME-3 Yes Yes No No
Bay Meadow Cottages 126 Old Bar Harbor
Rd Yes Yes No No
Bar Harbor Cottages &
Suites
144 Old Bar Harbor
Rd Yes Yes No Yes
Woodland Park Cottages 3 Woodland Loop Yes No No No
Coach Stop Inn Bed and
Breakfast 715 ME-3 Yes Yes No No
Rose Eden Cottage 864 ME-3 Yes No No No
Hadley's Point Campground 33 Hadley Point Rd Yes Yes No No
Belle Isle Motel 910 ME-3 Yes Yes No No
Heathwood Inn 6 Long & Winding
Rd No No No No
Mt Desert Narrows Camping
Resort 1219 ME-3 Yes Yes No Yes
Sunnyside Motel & Cottages 1441 ME-3 Yes Yes No No
Bar Harbor / Oceanside
KOA 136 County Rd No No No No
Windward Cottages 28 Western Bay Rd Yes Yes No No
Seaside Cottages On the
Shore 1500 ME-102 Yes Yes No No

48
Appendix B: Mock-up travel website
The following web pages were created by the team as a mock-up centralized travel
platform to showcase the most important features such a website should have.
Figure 14: Mock-up travel website homepage
Figure 15: Close-up of homepage sidebar

49
Figure 16: Close-up of traffic forecast with drop-down information
Figure 17: Responsive design of the mock-up website

50
Figure 18: Mock-up parking information webpage