Embed Size (px)
Citation preview
International Journal of Science and Research (IJSR) ISSN (Online): 2319-7064
Impact Factor (2014): 3.358
Volume 3 Issue 10, October 2014 www.ijsr.net
Licensed Under Creative Commons Attribution CC BY
Determining the Fatigue Characteristics of the Vehicle Cardanic Joint
Eugen Avrigean1
1Lucian Blaga University, Engineering Faculty, Emil Cioran Street, no. 4, Sibiu, 550025
Abstract: The present paper aims to develop a study model for all cardanic joints, establishing the main fatigue characteristics, namely the number of life cycles and the safety factor. The study was the result of another experimental study developed in Sibiu, at the Compa society, which tried to make these measurements using an experimental stand designed to observe the functioning of the cardanic transmission in various road conditions. Following this study, we modeled the cardanic joint and defined the main characteristics of the cardanic joint, by using Solidworks and Cosmos programs. Keywords: experimental stand, cardanic joint, fatigue measurements. 1. Introduction The cardanic transmission of the motor vehicles and various industrial machines form the kinematic chain of transmitting the rotary motion from the engine to the drive wheels or the moving parts, The cardanic transmission refers to an assembly of machine parts (joints, arbors, intermediate bearings etc.) used for the remote transmission of the mechanical energy by rotation without torque gain between units with variable or invariable position in space. By judicious design of these machine parts and of the execution technology, it is ensured an increase in the operational reliability and a low metal consumption. [1] From a constructive point of view, the cardanic transmissions are mechanisms made of a combination of machine parts - shafts, cardan joints, safety couplings, dampers, intermediate bearings etc., which constitute an independent functional unit and serve in the distance transmission without amplification of the torque between different parts of the same machine or between different machines, their relative position being variable. [2] 2. Experimental Determinations Conducted at SC Compa SA – Sibiu [6] 2.1 The Experimental Stand The tests were carried out in the mechanical testing laboratory on a stand specifically built for this trial (stresses in high points). A photo of this stand is presented in picture 1. This stand consists of two supports where two base plates are rigidly mounted. On these two plates, by means of two roller bearings (so that the torque should not be transmitted toward these plates) two connecting flanges are mounted, each having an actuator arm. The cardanic transmission to be tested is rigidly mounted between these flanges, through the attachment screws tightened at torque 35 [Nm]. The two arms of the connecting flanges head touch the force cells mounted on each pair of hydraulic cylinders (one on each side of the cardan).
Figure 1: Testing Stand [6]
Knowing that the length of the arm (the force) is 800 [mm], we made a cylinder act with a predetermined force, calculated according to the required torque, and copied by an arm equal in length with the first, in the second cylinder. We chose this solution in order to control the active cylinder by the reaction force measured on the force cell of the second cylinder, thus avoiding measurement and conducting errors due to the inertia of the moving force cell. In this way the force cell remains motionless, therefore the inertial forces are null, so that the torques in the cardanic transmission may be controlled. The oscilloscope observation revealed the accuracy of the lead and response sinusoidal wave of the actuator that stressed the cardanic transmission. When testing the cardanic transmission at low moments (300 and 500 [Nm]) it was possible to perform a test on the ETS ROZARY stand at the frequency of 50 Hz. 2.2 Measuring Instruments and Devices
Cardanic breakage stand; hydraulic cylinders GMW stand; GMW stand control console equipped with cycle rate
counter; force cells with the maximum domain of 25 [kN] and
accuracy of 1 %.
Paper ID: OCT14577 1681
International Journal of Science and Research (IJSR) ISSN (Online): 2319-7064
Impact Factor (2014): 3.358
Volume 3 Issue 10, October 2014 www.ijsr.net
Licensed Under Creative Commons Attribution CC BY
2.3 Experimental Determinations For these tests we used a number of 12 cardanic transmissions, and we traced the Wöhler curve in semi-logarithmic coordinates (the axis of the number of cycles is logarithmic), among the breaking points marked on the graph. Following the tests, a total of three cardanic transmissions collapsed during operation. After the analysis of the Wöhler curve obtained from the performed tests, we can conclude that: the curve was determined for a small number of
experiments and cannot be subjected to deeper static analyses;
for a more relevant Wöhler curve many more experiments are necessary (minimum 30 cardanic transmissions).
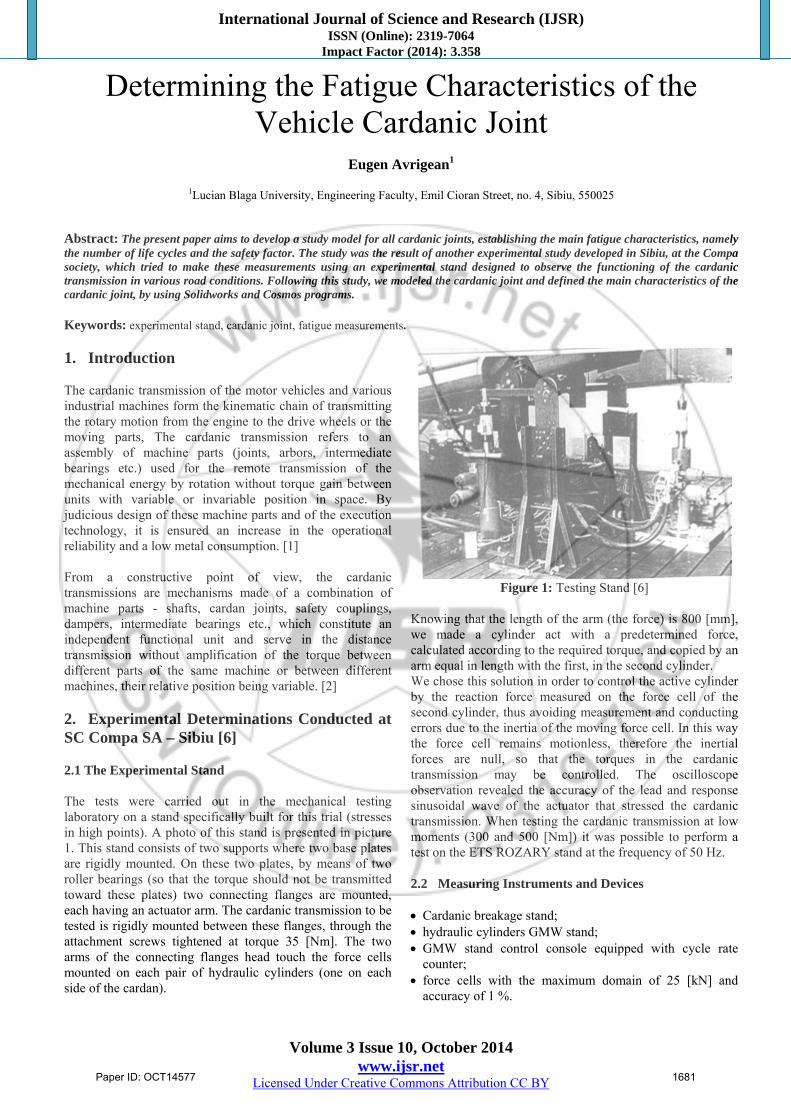
We notice that the value of the fatigue safety factor is M-1, which is identical with the nominal time of the transmission, namely 800 [Nm].
Figure 2: Photos of the Break Areas in the Cardanic
Transmission [6]
The applied pulse charging cycle coating can be considered sufficient, but in order to be confirmed, it is required to record the efforts of the cardanic transmission on representative roads. Concerning the conditions under which the tests were conducted, we must mention the following issues: the test pick-ups that we used were Dacia 1304; the stress used was 300 [N]; Regarding the means of straining the transmission, two types of routes were used: 1) A special endurance trail in the range, extended with an
„escape” trail; 2) A “client type” endurance trail The stress regime was chosen in the following way:
a. On the special range trail, a run was performed both on the special "attire" and on the smooth area, under a forced regime, in terms of straining the transmission (motor brake, inrush, gear, etc.). Only two pick-ups operated in this regime;
b. On the “client type” endurance trail, the samples replicate a normal function of the vehicles in practice.
Following these endurance trials, we recorded the following: the flanges used for fixing the gearbox are different from
the solution which has been used so far and create problems regarding the interchangeability;
for mounting the gearbox flange, other four holes were dug and a centering ring was inserted, and the bevel gear flange (the differential on the rear axle) was replaced with a new one which would ensure the correct fixation on the cardan;
after approximately 120 km traveled on the endurance trail in the range, a bearing cap on the cardan cross on the rear axle broke. The incident is similar to the one encountered on the testing stand, and that respective part was manufactured by SC COMPA – S.A. SIBIU for detailed analyses.
the deflector protecting the relay and the bearing grinds against the rubber holder, producing noise. The incident was recorded on all three tested cardanic transmissions and the cut in the rubber is located at the bottom, therefore at the end of the transmission in maximum relaxation, when the angle between the shafts is large;
for the current covered distance, no slack has been detected in the joints.
We also noticed in these endurance tests that the level of vibration transmitted to the structure of the pick-up is slightly higher in the tested transmissions, perhaps because of the greater transmissibility of the intermediate relay, due to the radial flexibility which is lower than that used on serial devices. The endurance tests on the vehicle are required to be continued according to the “client type” test program (80,000 km) and (20,000 km) in the range. Other conclusions which are worth mentioning, following these tests, are these: the outer flanges of the cardanic transmission (towards the
gearbox and the bevel gear) must be compatible with the actual flanges of the gearbox and of the bevel gear in order to avoid problems of interchangeability;
it is necessary to increase the radial flexibility of the intermediate relay;
the bearing caps of the crosses break while functioning; -the stand testes prove a sufficient durability, but these
tests must be confirmed based on the findings in real road conditions;
up to the present day, there have been no incidents during the circulation, apart from the breaking of the bearing caps in the cardan cross. [6]
Paper ID: OCT14577 1682
International Journal of Science and Research (IJSR) ISSN (Online): 2319-7064
Impact Factor (2014): 3.358
Volume 3 Issue 10, October 2014 www.ijsr.net
Licensed Under Creative Commons Attribution CC BY
3. Finite Elements Modeling of the Cardanic Joint The CAE Module (Computer Aided Engineering) appeared as a module in the composition of the CIM systems (Computer Integrated Manufacturing) after the emergence of the CAD module (Computer Aided Design); it actually appeared at the same time with the finite element method. The method was initially used in the mechanical calculation of aircraft structures, but later it has widely extended to all material continuum problems. In these situations it is intended to determine in an acknowledged domain, the values of one or more unknown functions, such as: displacements, gears, temperatures, tensions, specific strains and so on, depending on the nature of the researched problem. Within the chapter intended for the numerical simulations of the behavior of the cardanic transmission using the finite element method, we will refer only to those problems approaching the structural behavior, namely to the behavior analyses in terms of resistance. These tests intend to determine certain measurements (nodal displacements, stresses, strains) in terms of applying different types of charges. The charges that may apply are forces, pressures and moments. The physical phenomena of this type are described by differential equations, and the precise solution is obtained by integrating them under given limit conditions. Thus, the value of the unknown function or functions can be calculated in any point of the studied domain. This is the analytical way, the usual way of solving this, however applicable only for the simple problems. The problems occurring in the practical engineering activity are not simple problems, but, most often, they are complex both in terms of physical, geometrical construction of the part and on the charging conditions, which are limit conditions. In this case, it is no longer possible to solve the differential equations. Currently, there are two solving alternatives: creating a simplified model of the real model and solving
the differential equations on that model in order to obtain the exact solution on a simplified model;
obtaining an approximate solution of the real problem. The approximate solutions obtained through numerical methods often reflect the reality better than the exact solutions on simplified models. The applications of the finite element method can be grouped according to the type of the charges applied as follows: Balance problems or stationary regime problems, where
the unknown function or functions do not depend on time. This group includes the study of the elastic behavior of bodies in static regime.
Eigenvalue problems where the unknown functions are also independent of time and where certain critical values are determined while respecting the equilibrium configuration. This group includes the modal analyses or the calculation of the natural frequencies of bodies;
Propagation problems or phase regime problems, where the unknown functions depend on time. This group includes the dynamic study of the elastic or inelastic behavior. [3,4,5]
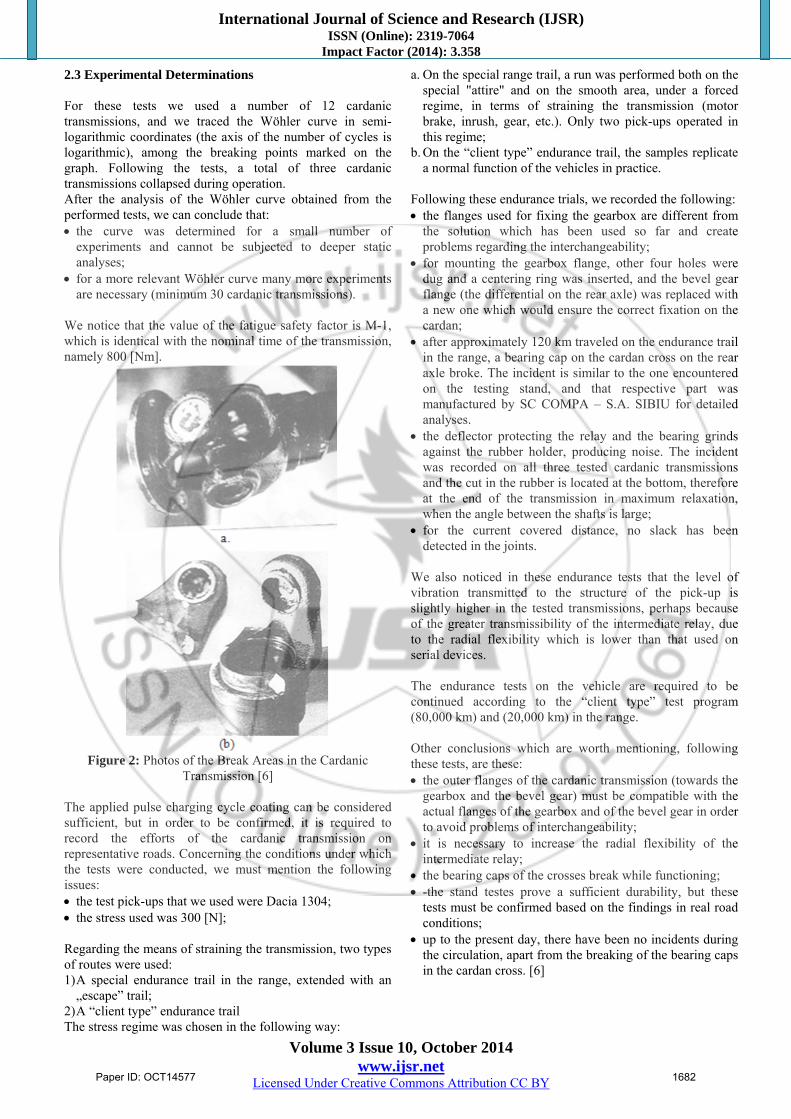
According to this classification, in this chapter we will cover the static analyses and the fatigue analysis. The cardanic joint assembly of the Dacia vehicle was modeled on the main components: the hub fork 2, the cardan cross 2 and the flanged fork at the end towards the differential and then the entire model was assembled. We also modeled the bearings which are mounted on the ends of the cardan crosses. Figure 1 and 2 present the model of the closed loop transmission.
Figure 3: The Cardanic Transmission Assembly Modeled
with Solidworks (general view)
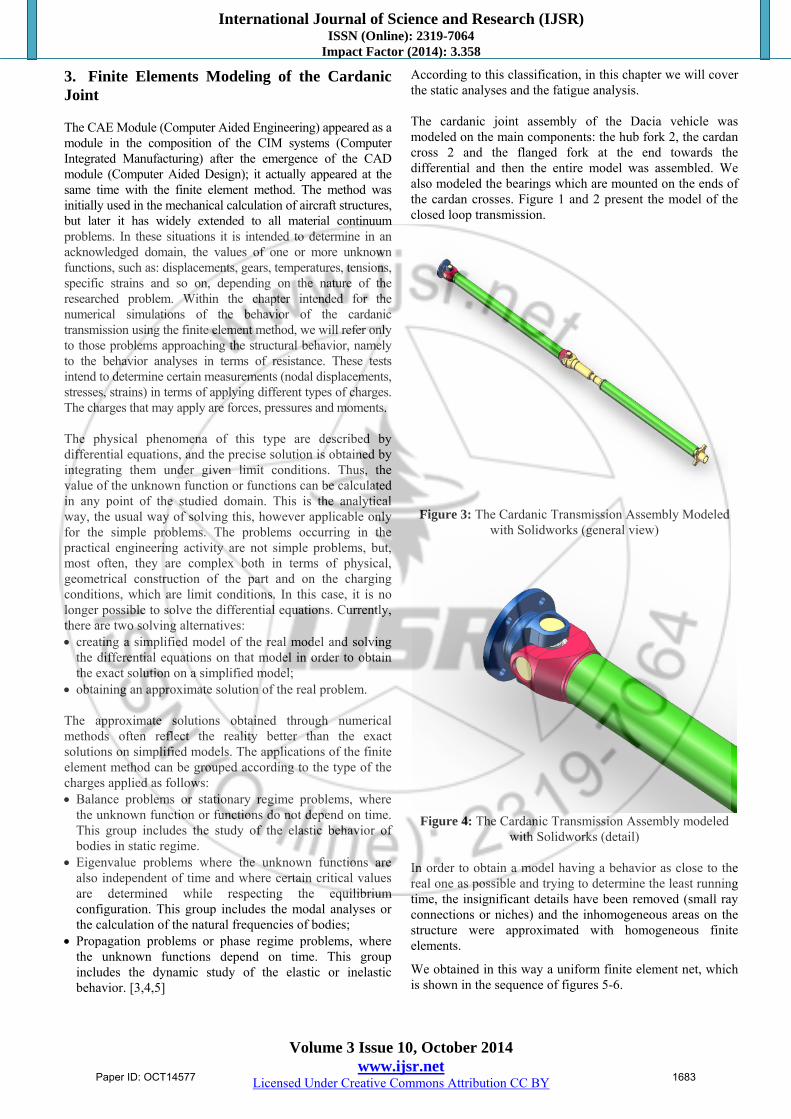
Figure 4: The Cardanic Transmission Assembly modeled
with Solidworks (detail) In order to obtain a model having a behavior as close to the real one as possible and trying to determine the least running time, the insignificant details have been removed (small ray connections or niches) and the inhomogeneous areas on the structure were approximated with homogeneous finite elements.
We obtained in this way a uniform finite element net, which is shown in the sequence of figures 5-6.
Paper ID: OCT14577 1683
International Journal of Science and Research (IJSR) ISSN (Online): 2319-7064
Impact Factor (2014): 3.358
Volume 3 Issue 10, October 2014 www.ijsr.net
Licensed Under Creative Commons Attribution CC BY
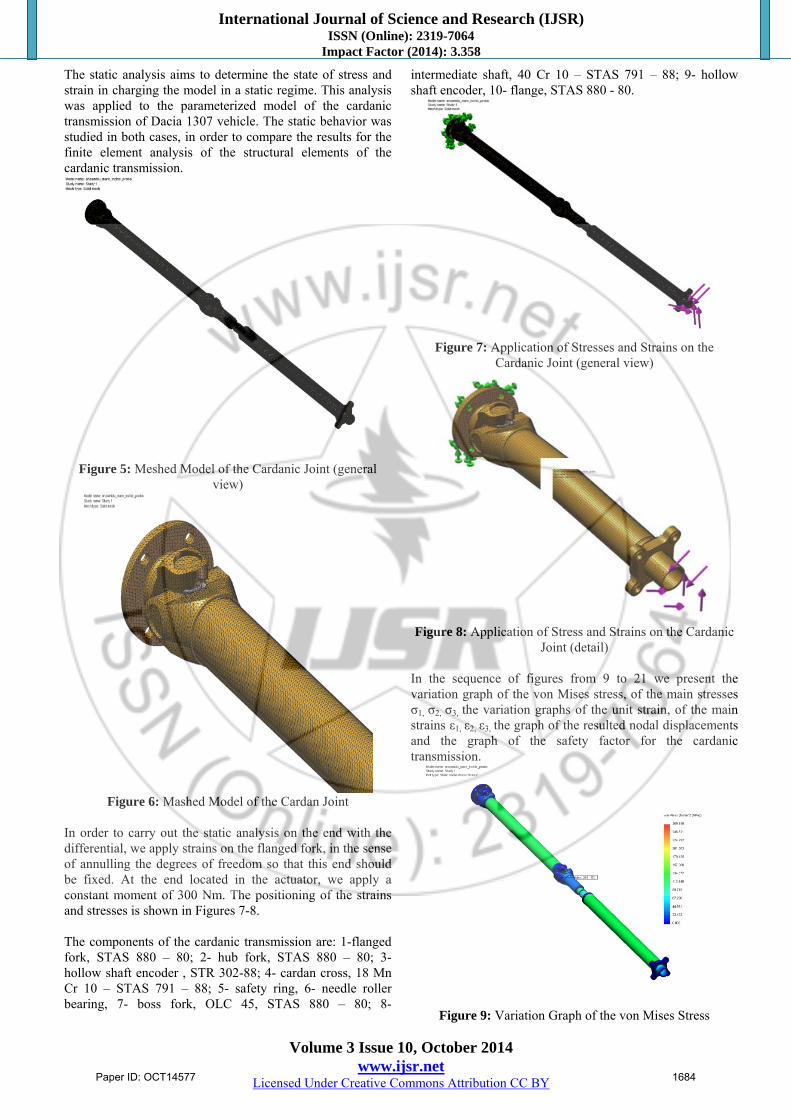
The static analysis aims to determine the state of stress and strain in charging the model in a static regime. This analysis was applied to the parameterized model of the cardanic transmission of Dacia 1307 vehicle. The static behavior was studied in both cases, in order to compare the results for the finite element analysis of the structural elements of the cardanic transmission.
Figure 5: Meshed Model of the Cardanic Joint (general
view)
Figure 6: Mashed Model of the Cardan Joint
In order to carry out the static analysis on the end with the differential, we apply strains on the flanged fork, in the sense of annulling the degrees of freedom so that this end should be fixed. At the end located in the actuator, we apply a constant moment of 300 Nm. The positioning of the strains and stresses is shown in Figures 7-8. The components of the cardanic transmission are: 1-flanged fork, STAS 880 – 80; 2- hub fork, STAS 880 – 80; 3- hollow shaft encoder , STR 302-88; 4- cardan cross, 18 Mn Cr 10 – STAS 791 – 88; 5- safety ring, 6- needle roller bearing, 7- boss fork, OLC 45, STAS 880 – 80; 8-
intermediate shaft, 40 Cr 10 – STAS 791 – 88; 9- hollow shaft encoder, 10- flange, STAS 880 - 80.
Figure 7: Application of Stresses and Strains on the
Cardanic Joint (general view)
Figure 8: Application of Stress and Strains on the Cardanic
Joint (detail)
In the sequence of figures from 9 to 21 we present the variation graph of the von Mises stress, of the main stresses σ1, σ2, σ3, the variation graphs of the unit strain, of the main strains ε1, ε2, ε3, the graph of the resulted nodal displacements and the graph of the safety factor for the cardanic transmission.
Figure 9: Variation Graph of the von Mises Stress
Paper ID: OCT14577 1684
International Journal of Science and Research (IJSR) ISSN (Online): 2319-7064
Impact Factor (2014): 3.358
Volume 3 Issue 10, October 2014 www.ijsr.net
Licensed Under Creative Commons Attribution CC BY
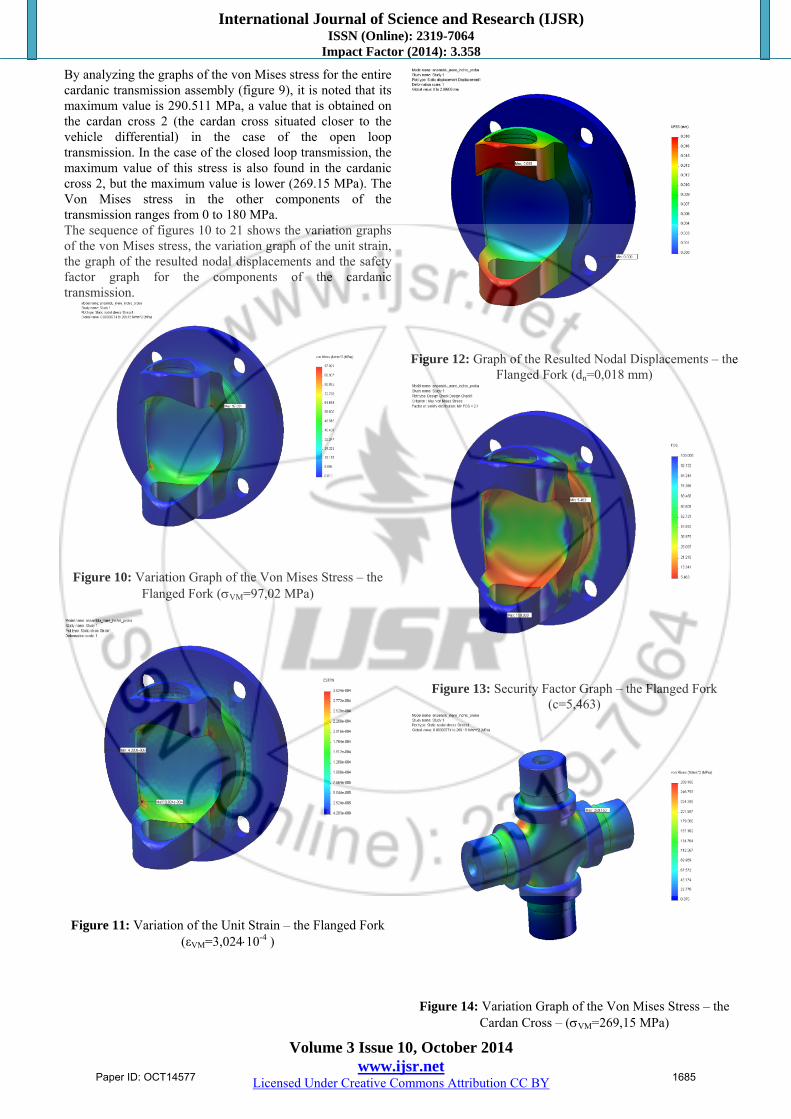
By analyzing the graphs of the von Mises stress for the entire cardanic transmission assembly (figure 9), it is noted that its maximum value is 290.511 MPa, a value that is obtained on the cardan cross 2 (the cardan cross situated closer to the vehicle differential) in the case of the open loop transmission. In the case of the closed loop transmission, the maximum value of this stress is also found in the cardanic cross 2, but the maximum value is lower (269.15 MPa). The Von Mises stress in the other components of the transmission ranges from 0 to 180 MPa. The sequence of figures 10 to 21 shows the variation graphs of the von Mises stress, the variation graph of the unit strain, the graph of the resulted nodal displacements and the safety factor graph for the components of the cardanic transmission.
Figure 10: Variation Graph of the Von Mises Stress – the
Flanged Fork (VM=97,02 MPa)
Figure 11: Variation of the Unit Strain – the Flanged Fork
(εVM=3,02410-4 )
Figure 12: Graph of the Resulted Nodal Displacements – the
Flanged Fork (dn=0,018 mm)
Figure 13: Security Factor Graph – the Flanged Fork
(c=5,463)
Figure 14: Variation Graph of the Von Mises Stress – the
Cardan Cross – (VM=269,15 MPa)
Paper ID: OCT14577 1685
International Journal of Science and Research (IJSR) ISSN (Online): 2319-7064
Impact Factor (2014): 3.358
Volume 3 Issue 10, October 2014 www.ijsr.net
Licensed Under Creative Commons Attribution CC BY
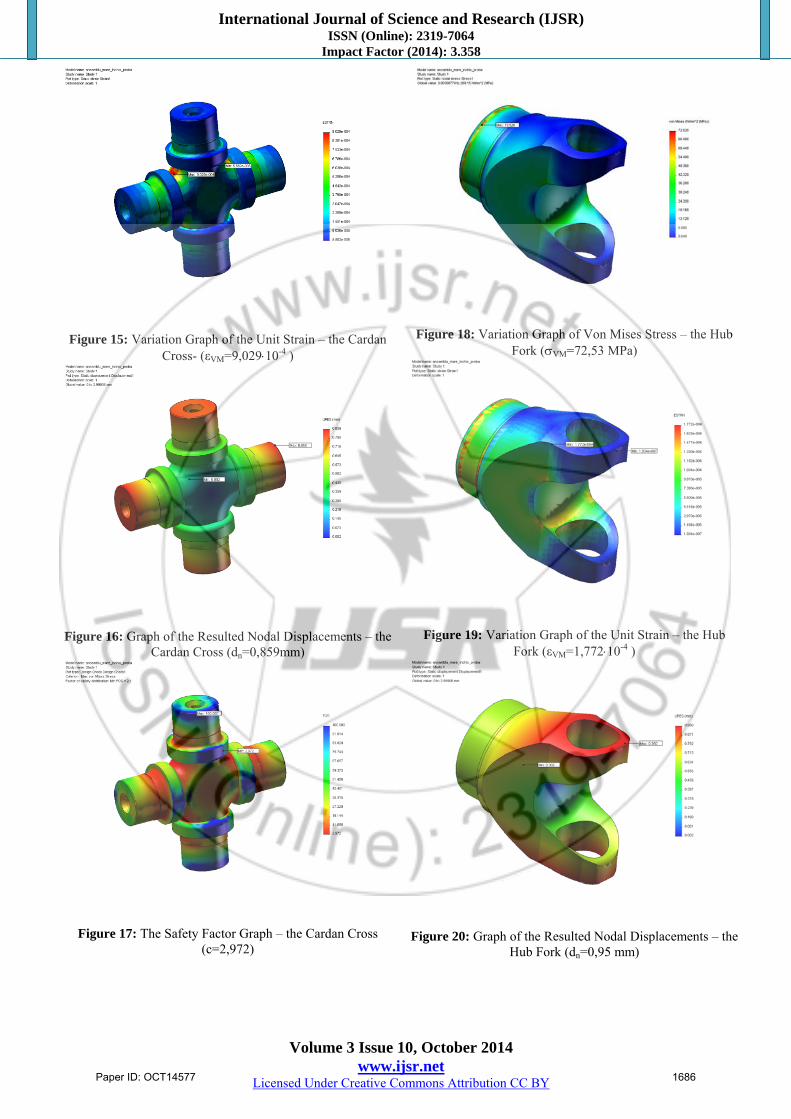
Figure 15: Variation Graph of the Unit Strain – the Cardan
Cross- (εVM=9,02910-4 )
Figure 16: Graph of the Resulted Nodal Displacements – the
Cardan Cross (dn=0,859mm)
Figure 17: The Safety Factor Graph – the Cardan Cross
(c=2,972)
Figure 18: Variation Graph of Von Mises Stress – the Hub
Fork (VM=72,53 MPa)
Figure 19: Variation Graph of the Unit Strain – the Hub
Fork (εVM=1,77210-4 )
Figure 20: Graph of the Resulted Nodal Displacements – the
Hub Fork (dn=0,95 mm)
Paper ID: OCT14577 1686
International Journal of Science and Research (IJSR) ISSN (Online): 2319-7064
Impact Factor (2014): 3.358
Volume 3 Issue 10, October 2014 www.ijsr.net
Licensed Under Creative Commons Attribution CC BY
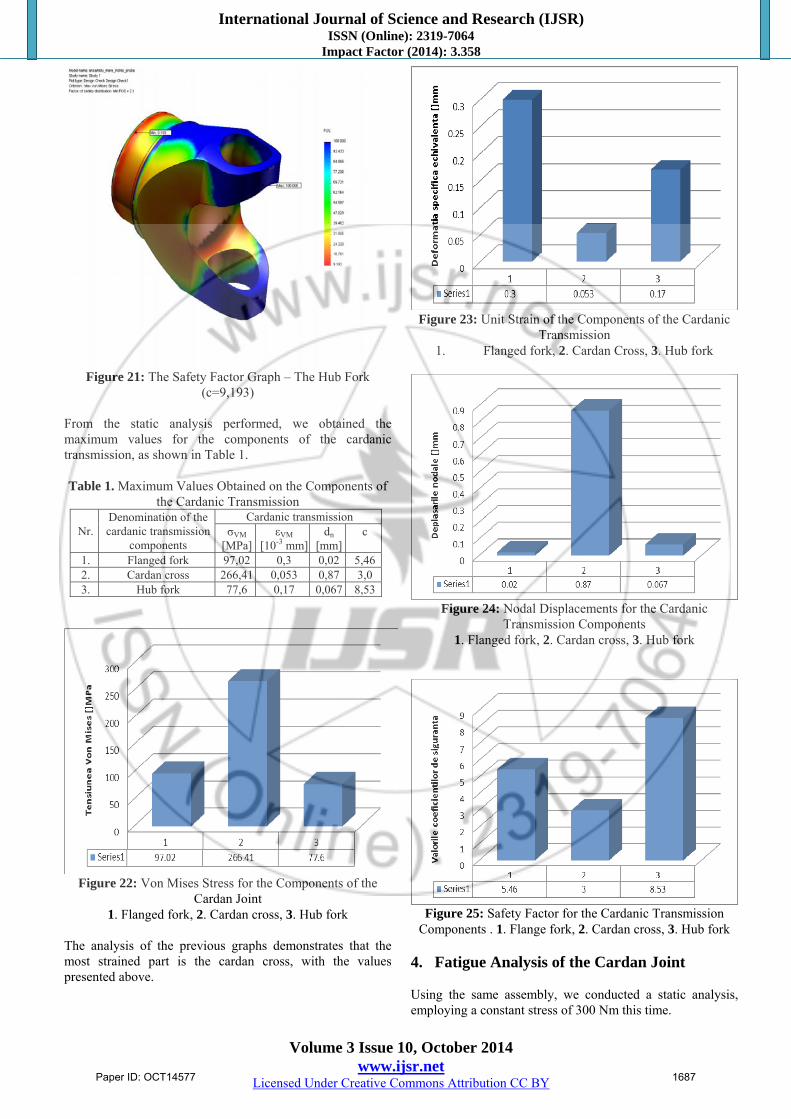
Figure 21: The Safety Factor Graph – The Hub Fork
(c=9,193) From the static analysis performed, we obtained the maximum values for the components of the cardanic transmission, as shown in Table 1. Table 1. Maximum Values Obtained on the Components of
the Cardanic Transmission
Nr. Denomination of the cardanic transmission
components
Cardanic transmission σVM
[MPa] εVM
[10-3 mm] dn
[mm]c
1. Flanged fork 97,02 0,3 0,02 5,462. Cardan cross 266,41 0,053 0,87 3,0 3. Hub fork 77,6 0,17 0,067 8,53
Figure 22: Von Mises Stress for the Components of the
Cardan Joint 1. Flanged fork, 2. Cardan cross, 3. Hub fork
The analysis of the previous graphs demonstrates that the most strained part is the cardan cross, with the values presented above.
Figure 23: Unit Strain of the Components of the Cardanic
Transmission 1. Flanged fork, 2. Cardan Cross, 3. Hub fork
Figure 24: Nodal Displacements for the Cardanic
Transmission Components 1. Flanged fork, 2. Cardan cross, 3. Hub fork
Figure 25: Safety Factor for the Cardanic Transmission
Components . 1. Flange fork, 2. Cardan cross, 3. Hub fork 4. Fatigue Analysis of the Cardan Joint Using the same assembly, we conducted a static analysis, employing a constant stress of 300 Nm this time.
Paper ID: OCT14577 1687
International Journal of Science and Research (IJSR) ISSN (Online): 2319-7064
Impact Factor (2014): 3.358
Volume 3 Issue 10, October 2014 www.ijsr.net
Licensed Under Creative Commons Attribution CC BY
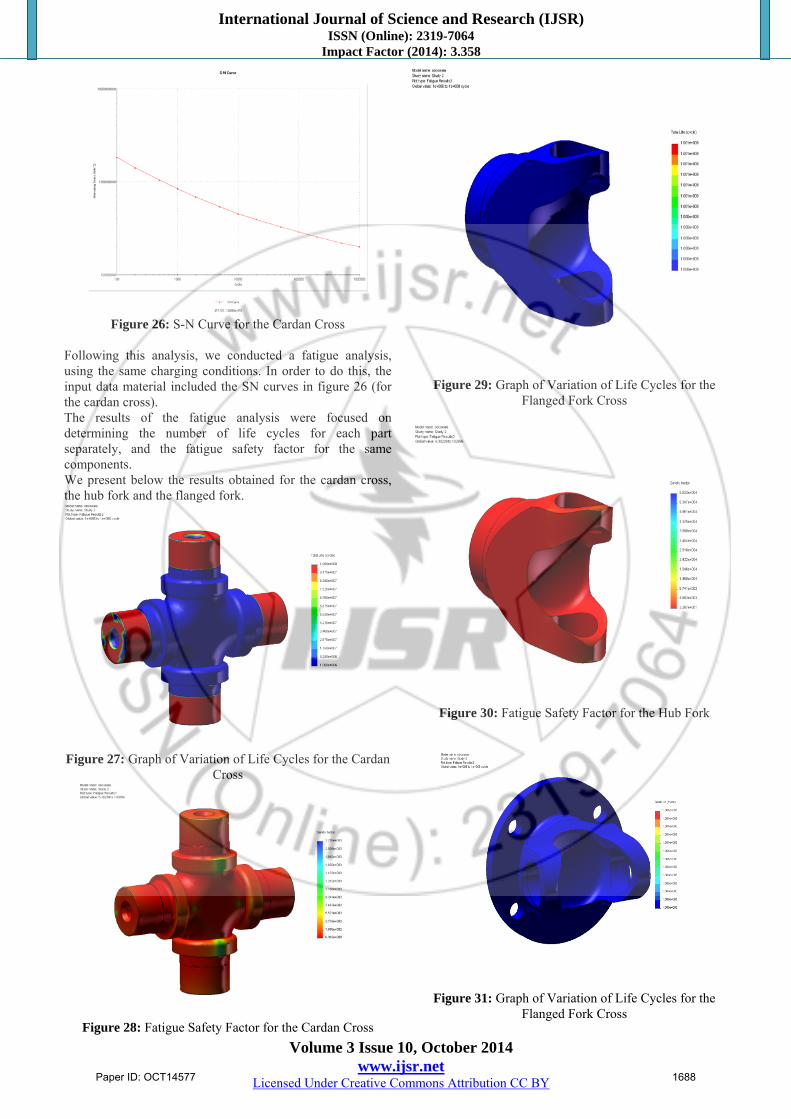
Figure 26: S-N Curve for the Cardan Cross
Following this analysis, we conducted a fatigue analysis, using the same charging conditions. In order to do this, the input data material included the SN curves in figure 26 (for the cardan cross). The results of the fatigue analysis were focused on determining the number of life cycles for each part separately, and the fatigue safety factor for the same components. We present below the results obtained for the cardan cross, the hub fork and the flanged fork.
Figure 27: Graph of Variation of Life Cycles for the Cardan
Cross
Figure 28: Fatigue Safety Factor for the Cardan Cross
Figure 29: Graph of Variation of Life Cycles for the
Flanged Fork Cross
Figure 30: Fatigue Safety Factor for the Hub Fork
Figure 31: Graph of Variation of Life Cycles for the
Flanged Fork Cross
Paper ID: OCT14577 1688
International Journal of Science and Research (IJSR) ISSN (Online): 2319-7064
Impact Factor (2014): 3.358
Volume 3 Issue 10, October 2014 www.ijsr.net
Licensed Under Creative Commons Attribution CC BY
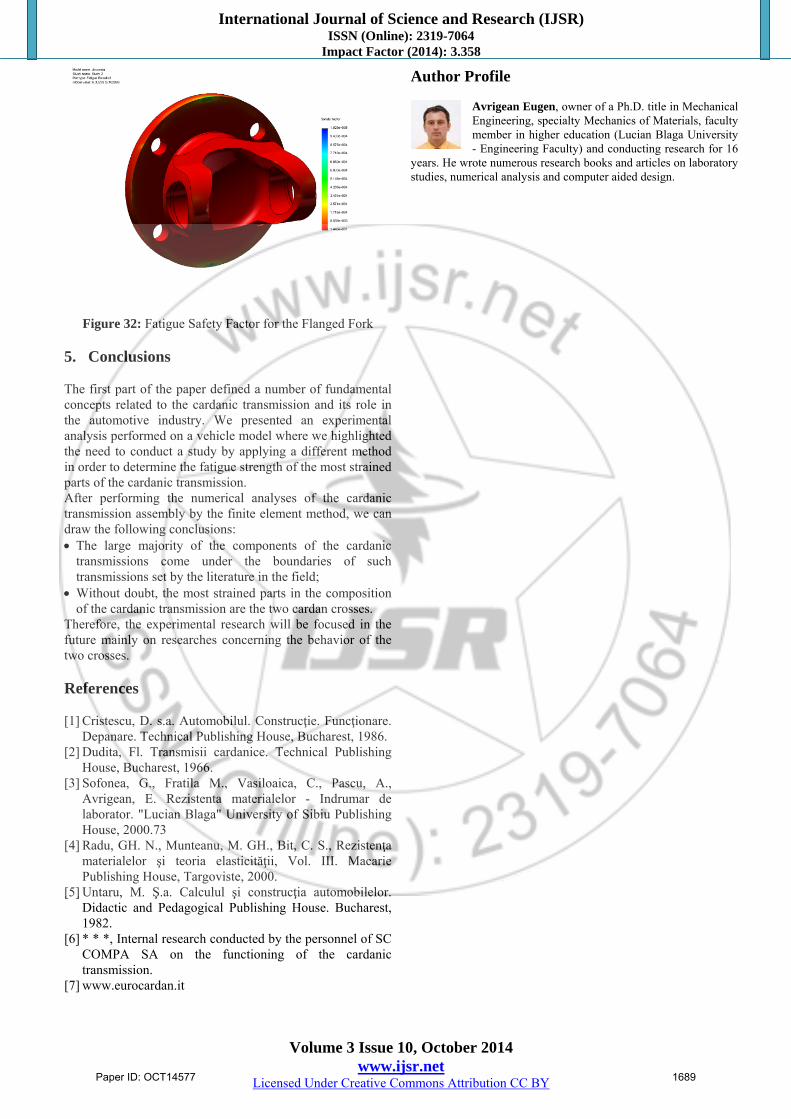
Figure 32: Fatigue Safety Factor for the Flanged Fork
5. Conclusions The first part of the paper defined a number of fundamental concepts related to the cardanic transmission and its role in the automotive industry. We presented an experimental analysis performed on a vehicle model where we highlighted the need to conduct a study by applying a different method in order to determine the fatigue strength of the most strained parts of the cardanic transmission. After performing the numerical analyses of the cardanic transmission assembly by the finite element method, we can draw the following conclusions: The large majority of the components of the cardanic
transmissions come under the boundaries of such transmissions set by the literature in the field;
Without doubt, the most strained parts in the composition of the cardanic transmission are the two cardan crosses.
Therefore, the experimental research will be focused in the future mainly on researches concerning the behavior of the two crosses. References [1] Cristescu, D. s.a. Automobilul. Construcţie. Funcţionare.
Depanare. Technical Publishing House, Bucharest, 1986. [2] Dudita, Fl. Transmisii cardanice. Technical Publishing
House, Bucharest, 1966. [3] Sofonea, G., Fratila M., Vasiloaica, C., Pascu, A.,
Avrigean, E. Rezistenta materialelor - Indrumar de laborator. "Lucian Blaga" University of Sibiu Publishing House, 2000.73
[4] Radu, GH. N., Munteanu, M. GH., Bit, C. S., Rezistenţa materialelor şi teoria elasticităţii, Vol. III. Macarie Publishing House, Targoviste, 2000.
[5] Untaru, M. Ş.a. Calculul şi construcţia automobilelor. Didactic and Pedagogical Publishing House. Bucharest, 1982.
[6] * * *, Internal research conducted by the personnel of SC COMPA SA on the functioning of the cardanic transmission.
[7] www.eurocardan.it
Author Profile
Avrigean Eugen, owner of a Ph.D. title in Mechanical Engineering, specialty Mechanics of Materials, faculty member in higher education (Lucian Blaga University - Engineering Faculty) and conducting research for 16
years. He wrote numerous research books and articles on laboratory studies, numerical analysis and computer aided design.
Paper ID: OCT14577 1689