Embed Size (px)
Citation preview

Determining Silage Density
World Dairy ExpoOctober 1, 2008
Brian J. Holmes, Ph.D.
Professor andExtension Agricultural Engineer Biological Systems Engineering Dept.Univ. of Wisconsin - Madison

Why Know Silage Density?
1. Inventory feed suppliesHow long feed will lastEstimate yieldsHow much is sold/bought
2. Dry matter loss is related3. Storage capacity is related
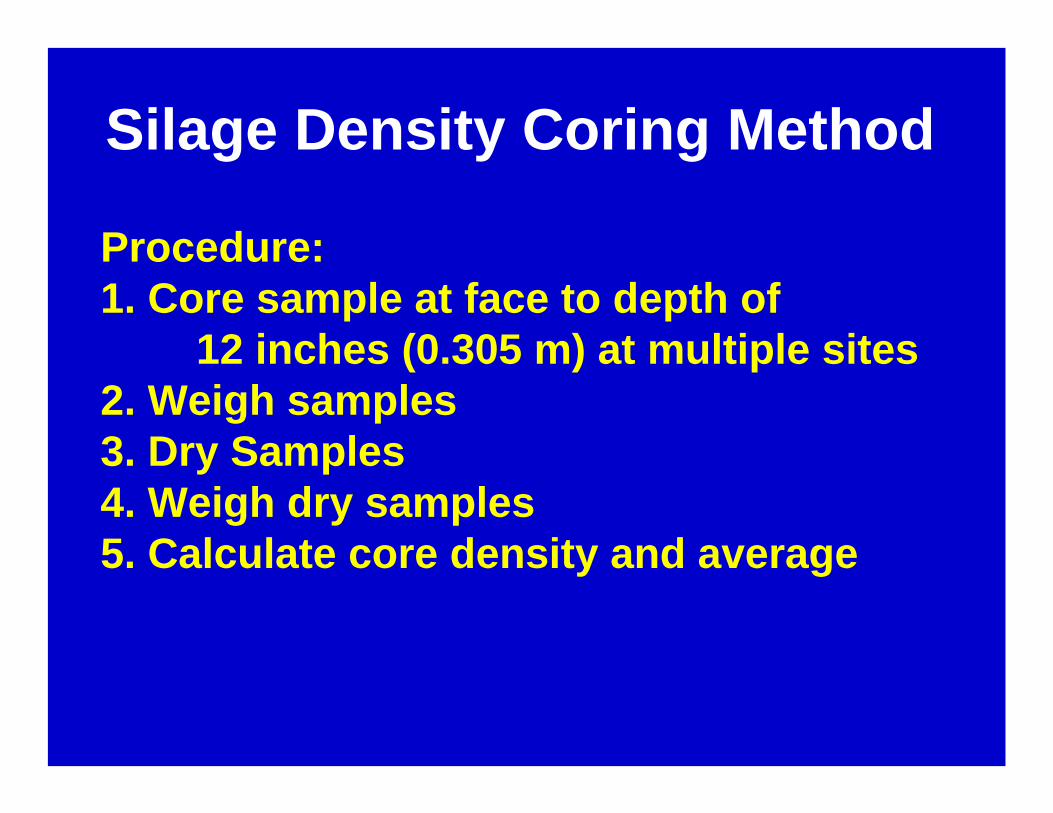
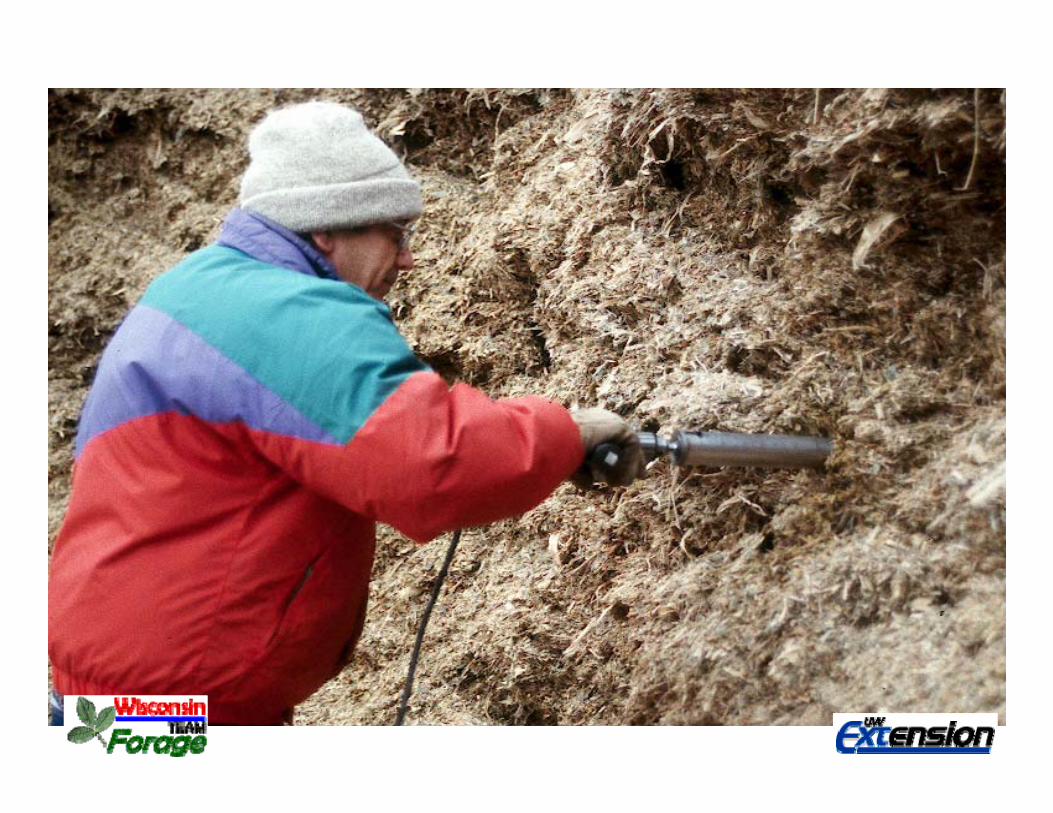
Silage Density Coring Method
Procedure:1. Core sample at face to depth of
12 inches (0.305 m) at multiple sites2. Weigh samples3. Dry Samples4. Weigh dry samples5. Calculate core density and average

Maximum Height (ft)
WallHeight (ft)
XXX X
XXX X
XXX X
Suggested Coring Locations

Silage Face Coring Method
Benefits Limitations
1. Dangerous1. Accurate at point 2. Site specific
HeightWallsFissures
3. Requires special tools4. Time consuming5. Many cores required6. After filling/removal
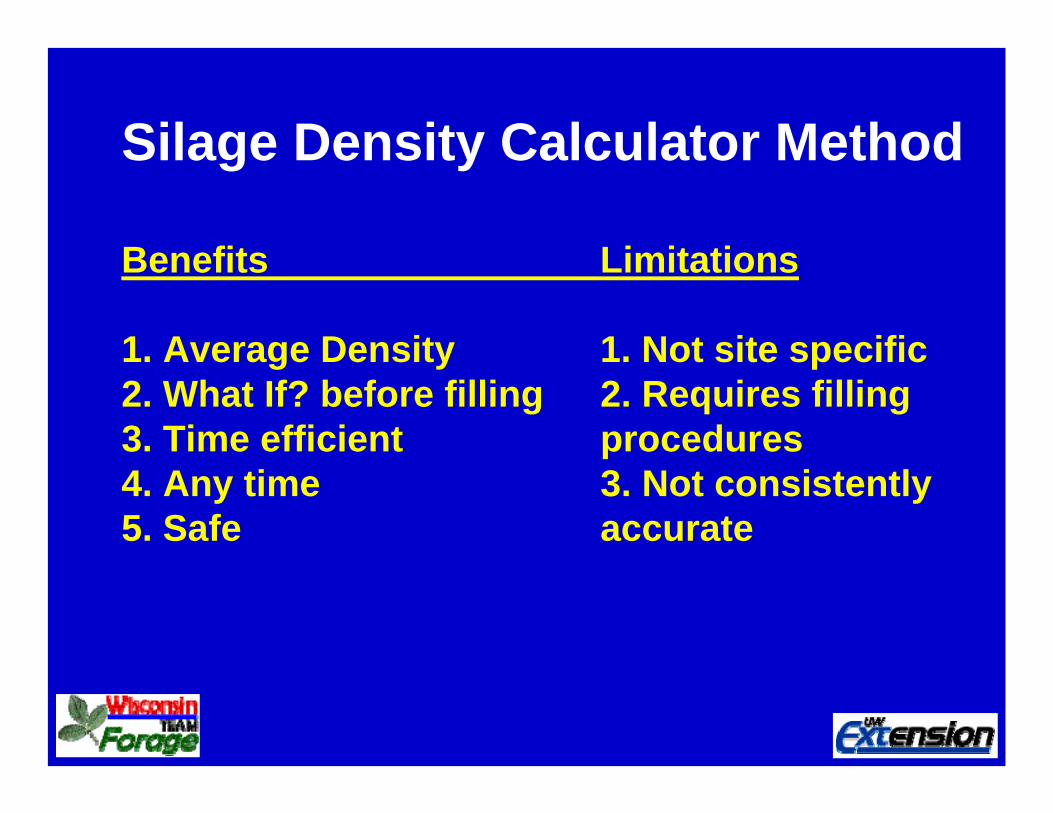
Silage Density Calculator Method

0
50
100
150
200
250
300
350
400
450
500
0 1000 2000 3000 4000 5000 6000 7000 8000
Packing Factor
Adjusted Density, kg/cu.
m
XY (Scatter) 1SingleDual RearAll Duals
Adjusted Density in Relation to the Packing Factor
6.2
12.5
18.7
24.9
31.2
Lbs
/cu
ft
0(SI Units)
0 135 269 404 539 673 808 942 1077 English Units

Combined Packing Factor• Looked at various combinations of factors to
find the best explanation of variability in density
DTLW
⋅
W = Avg. Tractor Weight (lbs or Kg)L = Initial Layer Thickness (inches or cm)T = Packing Time,
Tractor Hours/Tonne or Ton As FedD = Dry Matter Content (decimal)
PF =
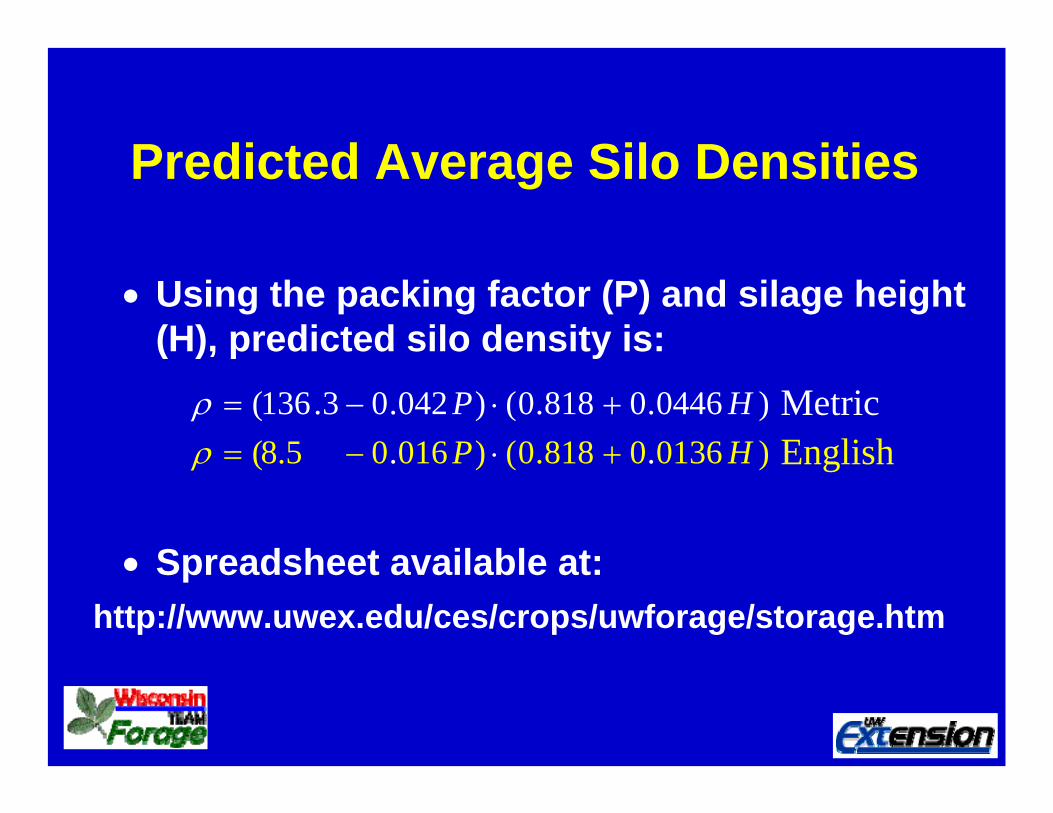
Predicted Average Silo Densities
• Using the packing factor (P) and silage height (H), predicted silo density is:
• Spreadsheet available at:
)0446.0818.0()042.03.136( HP +⋅−=ρ
http://www.uwex.edu/ces/crops/uwforage/storage.htm
)0136.0818.0()016.08.5( HP +⋅−=ρMetricEnglish

Silage Density Calculator MethodProcedure:1. Establish packing procedure:
Tractor weight(s)Number TractorsPercent packing timeLayer thicknessHarvest rateDry matter contentWall heightPeak height
2. Calculate average density with spreadsheet
Silage Density Calculator Method
Benefits Limitations
1. Average Density 1. Not site specific2. What If? before filling 2. Requires filling 3. Time efficient procedures4. Any time 3. Not consistently5. Safe accurate

Est Density VS Measured Density
0
5
10
15
20
0 5 10 15 20Measured Density (lbs/cu ft)
Est.
Den
sity
(lbs
/cu
ft)
.
Pennsylvania Results Y = X
Underestimate
Overestimate
2004 Dauphin Co. Study

Silage Density Feed Out Method
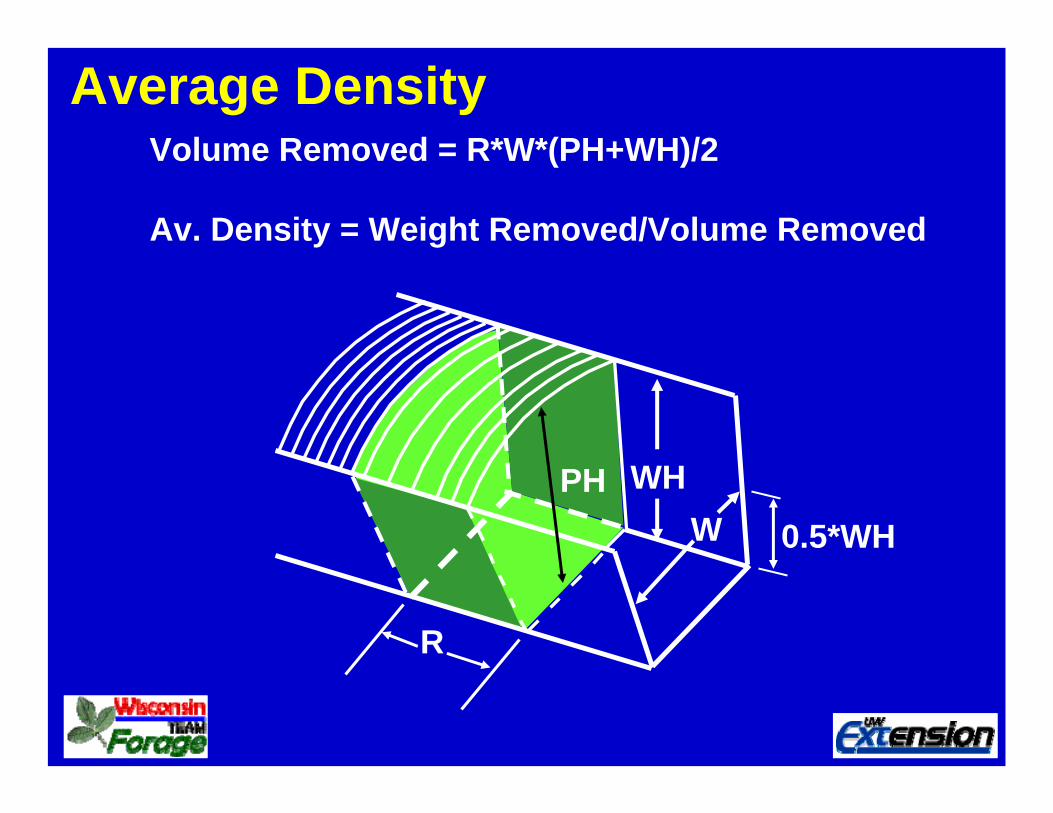
Average Density
R
W 0.5*WHPH
Volume Removed = R*W*(PH+WH)/2
Av. Density = Weight Removed/Volume Removed
WH


Silage Density Feed Out MethodProcedure:1. Mark location of feed out face day #1 2. Feed out for several days and weigh
feed into each load3. Measure distance face moves4. Measure face dimensions (wall height,
peak height, average width, etc.)5. Calculate volume removed6. Sum weights removed7. Divide weight removed by volume removed
to get average AF density8. For DM density, moisture sampling is needed

Example Average Density
12
40 0.5*WH15
Volume Removed = 12’*40’*(15’+10’)/2 = 6,000 cu ft
Av. Density = 90,000 lb DM/6,000 cu ft = 15 lbs DM/cu ft
10
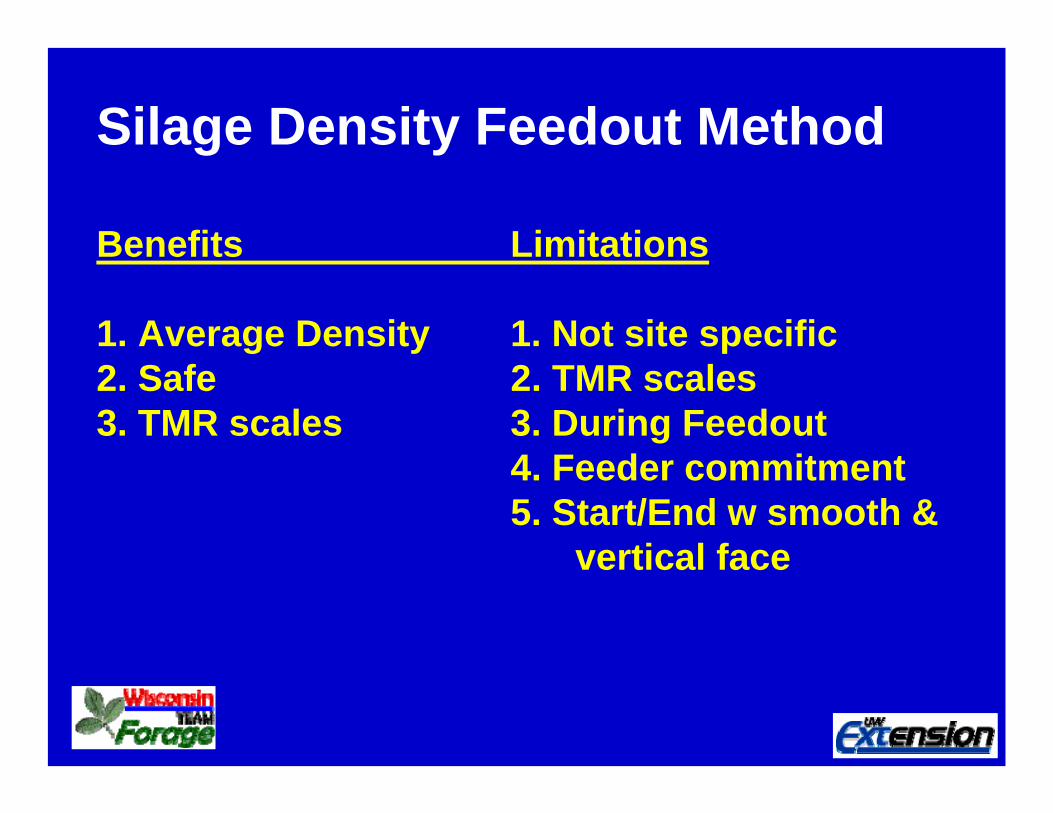
Silage Density Feedout Method
Benefits Limitations
1. Average Density 1. Not site specific2. Safe 2. TMR scales3. TMR scales 3. During Feedout
4. Feeder commitment5. Start/End w smooth &
vertical face

Comparing three different methods for assessing corn silage density.
R.J. Norell, M. Chahine, S. Hines, T. Fife, M. De Hario, and S. C. Parkinson
University of Idaho
MethodsEighteen storages were studied.
Three core samples were collected twice.
Core samples were collected at mid height at the center, left, and right of the silage face.
Inputs for the Silage Density Calculator were obtained.

MethodsSilage face measurements and face location were obtained during three farm visits (10 to 14 day intervals).
Area calculated using digital image.
Silage weight removed was the sum of weight specified for each load on the load sheet for one day.
Density was calculated by dividing the weight of silage fed by the volume of silage removed during the interval between farm visits.

Calibration Board

Calculator Density vs Probed Density
050
100150200250300350400450500
0 50 100 150 200 250 300
Probed Density (Kg/cu m) .
Cal
cula
tor D
ensi
ty (K
g/cu
m)
BunkerBunker/PilePile
12.5 Lb/cu ft 18.7 Lb/cu ft

Feedout Density vs Probed Density
0
50
100
150
200
250
300
350
400
0 50 100 150 200 250 300
Probed Density (Kg/cu m) .
Feed
Out
Den
sity
(Kg/
cu m
)
BunkersPilesBunker/Pile
12.5 Lb/cu ft 18.7 Lb/cu ft
Results• Variation in density between storages was significantly higher for Feedout method than core sampling or calculator methods (p<0.001).
• Core density measurements were highly correlated with Calculator estimates (r = 0.71, p<0.001) but not with Feedout density estimates (r = -0.06, p<0.82).

Results
• Feedout method did not perform satisfactorily due to non-uniform silage faces and the inherent challenges in measuring volume of silage fed at the farm level .
• Feedout method may provide more reliable estimates on operations utilizing silage facers (more uniform face).
• It is challenging to obtain reliable inputs for the calculator method at the farm level.

Conclusions•Core sampling and calculator methods provide reasonably similar estimates of silage density.
•Collecting duplicate samples is needed to accurately assess core sample density.
•Feedout method was a poor predictor of silage density and is not recommended.

Conclusions
Taking care to keep a vertical uniform face and weigh all loads with TMR scales will improve accuracy significantly.
-- BJH

Conclusions•Core sampling is recommended for directly assessing silage density and the calculator method is recommended for evaluating alternative management strategies during the filling and packing process.

Run Silage Stored Density Spreadsheet?
YES NO

http://www.uwex.edu/ces/crops/teamforage/index.html

QUESTIONS?