Embed Size (px)
Citation preview
Determining Private Equity Fund Risk: An Empirical Study of Fund Characteristics
Jan M. Smolarski
University of Texas Pan American
Jose G. Vega University of Texas San Antonio
Using a sample of European private equity funds, we investigate the effect of fund type and size on risk using three two-way ANOVA models and two regression models. The main finding is that large buy-out funds are the least risky of the fund types whereas medium-sized buy-out funds carry the most risk. Venture capital funds are not as risky as smaller buy-out funds but riskier than large buy-out funds. Risk increases as the size of a venture capital fund increases. INTRODUCTION
Although risk management as it relates to the private equity is important, it has received comparatively little attention in the literature (Braun, et al., 2011; Cochrane, 2005) and many dimensions of risk surrounding venture capitalists and buy-out funds remain unexplored. Part of the problem stems from the illiquid nature of private equity markets and lack of observable data (Braun et al., 2011). To a large extent, research in private equity has failed to tackle several widely accepted truisms (Dimov and Murray, 2008), including basic risk management both from the perspective of the fund manager and fund sponsor. Recently, risk management from a transaction perspective has appeared in the literature. These studies focus mostly on the leveraged nature of most private equity transactions (Groh et al., 2008; Achleitner et al. 2012; Colla et al., 2012). A related stream of research of recent origin is that of value and return drivers in private equity (Guo et al., 2011; Diller and Kaserer, 2009). It is especially noteworthy that existing research have even failed to tackle the most basic risk management aspects of the private equity asset class. In this study, we contribute to the previous literature by analyzing how risk differs according to fund type and fund size. Dimov and Murray (2008) find a negative relationship between venture capital fund size and certain fund activities suggesting that fund size has a number of effects on fund activities. Diller and Kaserer (2009) show that increases in funds flow has a negative impact on performance. The effect is stronger for venture capital funds and robust with respect to size. Braun et al. (2011) find that fund sponsors’ risk appetite is negatively related to the ownership stake in the target firm. Franzoni et al. (2009) show that private equity diversification benefits are not as large as previously thought.
This study is important for fund managers, fund sponsors and policy makers. Our findings will help fund managers structure their funds to minimize risk and fund sponsors can avoid investing in funds with
Journal of Accounting and Finance vol. 13(1) 2013 35
unfavorable risk and return characteristics. Policy makers may be able to develop programs that take into account fund risk.
Our main finding is that large buy-out funds are the least risky of the fund types analyzed in this study whereas medium-sized buy-out funds carry most risk. We argue that large buy-out funds benefit from being more diversified. Venture capital funds are not as risky as smaller buy-out funds but riskier than large buy-out funds. Risk increases as the size of a venture capital fund increases. This may be partially mitigated by different types of diversification (Knill, 2009). Smaller venture funds may be able to rely on specialization as an alternative to diversification. This alternative is unlikely to be available as fund size increases. An alternative explanation is related to fund inflows. Kaplan and Schoar (2005) show that successful funds tend to raise more money to increase the number of investments resulting in lower average investment quality. As a result of the perception of diminishing returns, successful funds may voluntarily restrict their fund size (Kaplan and Schoar, 2005). Diller and Kaserer (2009) also show that fund inflow has a negative effect on fund performance.
The rest of the paper is organized as follows. In the next section, we provide a brief introduction to the private equity industry, especially in the area of risk management, as well as the relevant literature not already covered. This is followed by a section covering data and methodology after which we discuss the results. Finally, we offer concluding remarks. THE PRIVATE EQUITY INDUSTRY
Private equity is divided into two distinct branches, namely venture capital funds and buy-out funds. These funds invest on behalf of institutional and wealthy individual investors. Venture Capital is a pool of money organized as a limited partnership or similar tax efficient vehicle where the managing partner invests in non-public firms expecting high rates of returns in less than 10 years (Ferrary, 2009). A large part of venture capital returns comes from rapidly growing small firms where the venture capital manager’s skill and money has a significant effect on the exit value. Cash flow distribution in the form of dividends and refinancing play a small or non-existent role in the real return of the fund whereas trade-sales or initial public offering of portfolio firms may yield a substantial return, sometimes exceeding 100 percent. Buy-out funds attempt to earn superior returns by investing in and radically transform mid-size or larger firms (Wright and Robbie, 1998). Venture capital funds take minority stakes whereas buy-out funds normally take majority stakes. Leverage is a prominent feature of almost all buy-out transactions but remain largely absent in venture capital investments. Venture capitalists tend to invest in newer firms while buy-out funds focus on established firms in need of expansion or restructuring.
Fund managers in both types of funds attempt to earn superior returns through the selection, management and liquidation of their portfolio investments on behalf of their fund sponsors (Koryak and Smolarski, 2008). Venture capital funds attempt to earn superior returns based on their specialized skills in identifying, investing and managing start-up, early-stage or late stage small firms. Buy-out funds, on the other hand, normally focus on efficiency gains. An important difference between the two fund types is managerial involvement. Venture fund managers are actively involved in their investee firms whereas managers in buy-out funds do not normally become active managers involved in the day-to-day operations of the firm. Thus, operationally, there are differences between the two major types of funds. RISK MANAGEMENT IN PRIVATE EQUITY FUNDS
Venture capital and buy-out investments are subject to a substantial number of risks (e.g. Cochrane, 2005). These may be classified as external or internal risks. Examples of external risks include competition, barriers to market entry and resource constrains. Internal risks are, to a larger extent, based on agency issues (Jensen and Meckling, 1976). Within an agency theory framework, both venture capital and buy-out markets are characterized by substantial goal conflicts between the agent (manager) and principal (venture or buy-out fund manager), managerial task uncertainty and outcome uncertainty. Interestingly, these conflicts exist even though both managers and the funds have equity stakes in the
36 Journal of Accounting and Finance vol. 13(1) 2013
investee company. As we previously pointed out, there are differences in how buy-out and venture capital funds invest in firms. In buy-out investments, managers tend to have large majority stakes compared to venture investments where the owners often maintain a majority stake. In addition, the use of leverage differs between the two fund types.
In their capacity as principals, investors try to mitigate the inherent agency risks through various pre-screening and post-investment mechanisms. These include pre-screening potential investee companies; the use of behavior and outcome based contracts, as well as convertible securities and staged finance (e.g. Gompers and Lerner, 1998). Convertible securities allow the investor to convert debt instruments into common stock at a pre-determined price when the investment is doing well while allowing fund managers to maintain liquidation preference in the case of poor performance. Staged financing is commonly used since it gives a fund manager the option to withhold future draw-downs on previously agreed-upon funding if the agent doesn’t meet pre-agreed upon goals (Whang and Zhou, 2002).
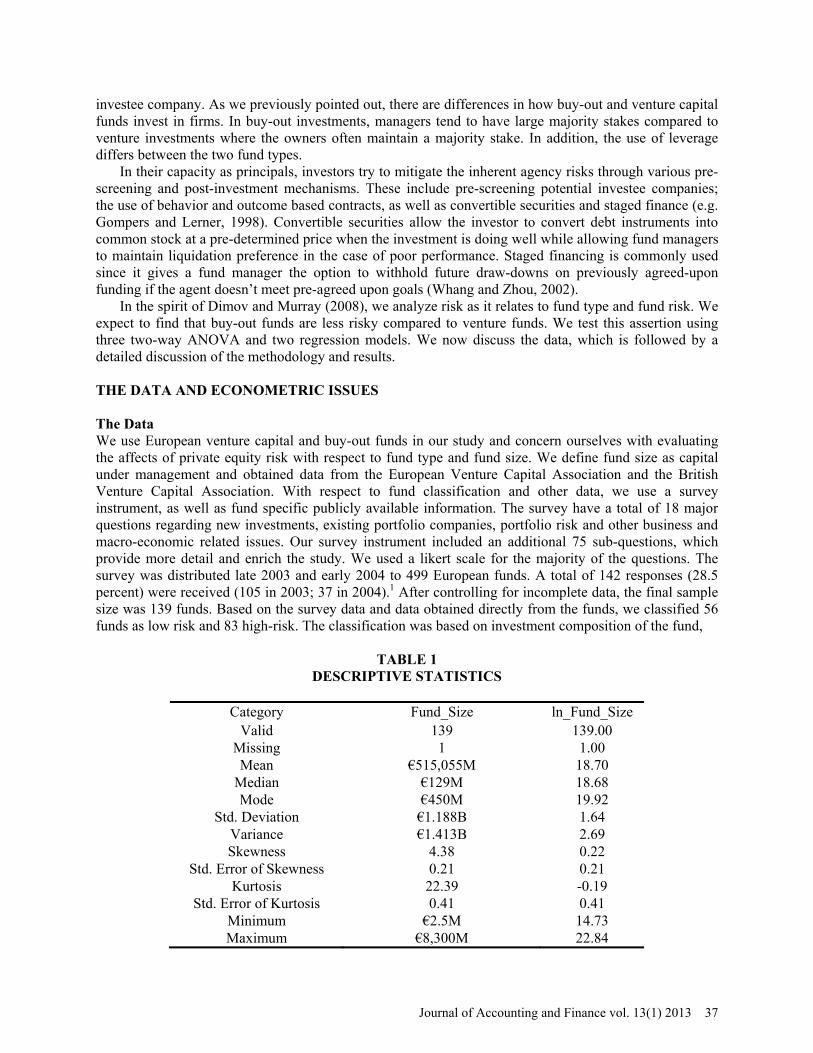
In the spirit of Dimov and Murray (2008), we analyze risk as it relates to fund type and fund risk. We expect to find that buy-out funds are less risky compared to venture funds. We test this assertion using three two-way ANOVA and two regression models. We now discuss the data, which is followed by a detailed discussion of the methodology and results. THE DATA AND ECONOMETRIC ISSUES The Data We use European venture capital and buy-out funds in our study and concern ourselves with evaluating the affects of private equity risk with respect to fund type and fund size. We define fund size as capital under management and obtained data from the European Venture Capital Association and the British Venture Capital Association. With respect to fund classification and other data, we use a survey instrument, as well as fund specific publicly available information. The survey have a total of 18 major questions regarding new investments, existing portfolio companies, portfolio risk and other business and macro-economic related issues. Our survey instrument included an additional 75 sub-questions, which provide more detail and enrich the study. We used a likert scale for the majority of the questions. The survey was distributed late 2003 and early 2004 to 499 European funds. A total of 142 responses (28.5 percent) were received (105 in 2003; 37 in 2004).1 After controlling for incomplete data, the final sample size was 139 funds. Based on the survey data and data obtained directly from the funds, we classified 56 funds as low risk and 83 high-risk. The classification was based on investment composition of the fund,
TABLE 1
DESCRIPTIVE STATISTICS
Category Fund_Size ln_Fund_Size Valid 139 139.00
Missing 1 1.00 Mean €515,055M 18.70
Median €129M 18.68 Mode €450M 19.92
Std. Deviation €1.188B 1.64 Variance €1.413B 2.69 Skewness 4.38 0.22
Std. Error of Skewness 0.21 0.21 Kurtosis 22.39 -0.19
Std. Error of Kurtosis 0.41 0.41 Minimum €2.5M 14.73 Maximum €8,300M 22.84
Journal of Accounting and Finance vol. 13(1) 2013 37
investment stage focus and sector focus. Based on analyzing fund focus, 70 funds are classified as venture capital funds and 69 as buy-out funds. Four venture capital funds were classified as low-risk, 52 buy-out funds were classified as low-risk, 66 venture capital funds were classified as high-risk and 17 buy-out funds as high-risk.
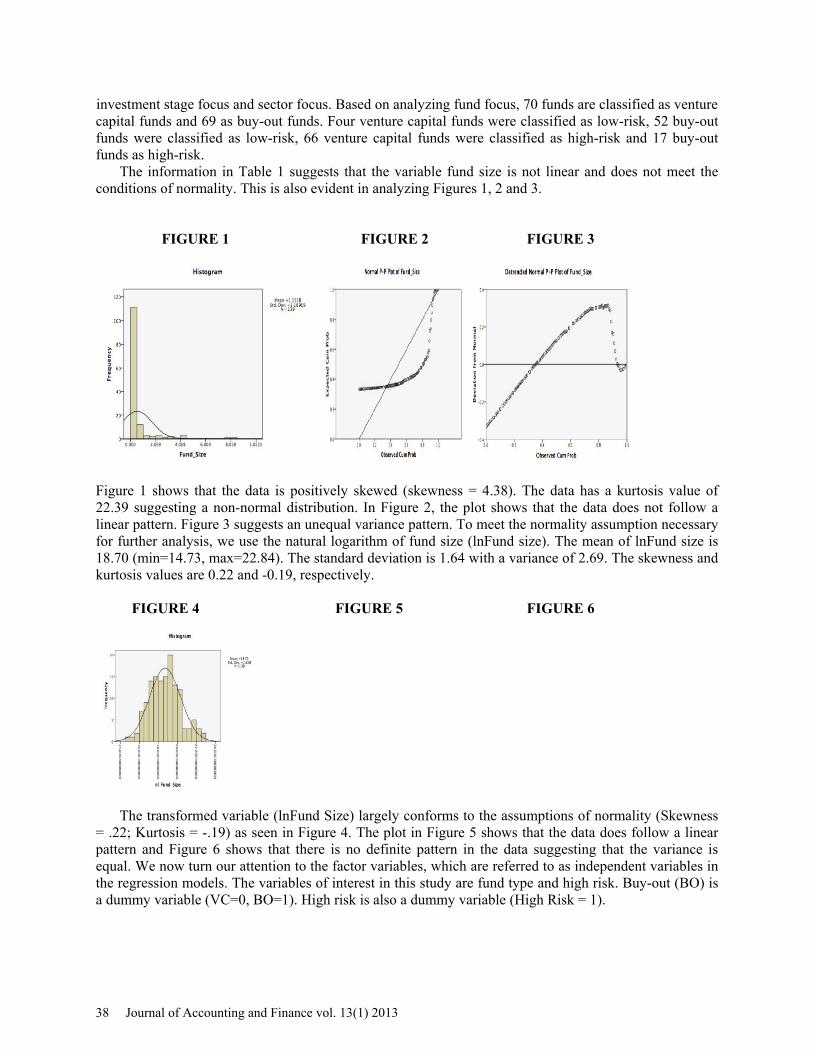
The information in Table 1 suggests that the variable fund size is not linear and does not meet the conditions of normality. This is also evident in analyzing Figures 1, 2 and 3.
FIGURE 1 FIGURE 2 FIGURE 3
Figure 1 shows that the data is positively skewed (skewness = 4.38). The data has a kurtosis value of 22.39 suggesting a non-normal distribution. In Figure 2, the plot shows that the data does not follow a linear pattern. Figure 3 suggests an unequal variance pattern. To meet the normality assumption necessary for further analysis, we use the natural logarithm of fund size (lnFund size). The mean of lnFund size is 18.70 (min=14.73, max=22.84). The standard deviation is 1.64 with a variance of 2.69. The skewness and kurtosis values are 0.22 and -0.19, respectively.
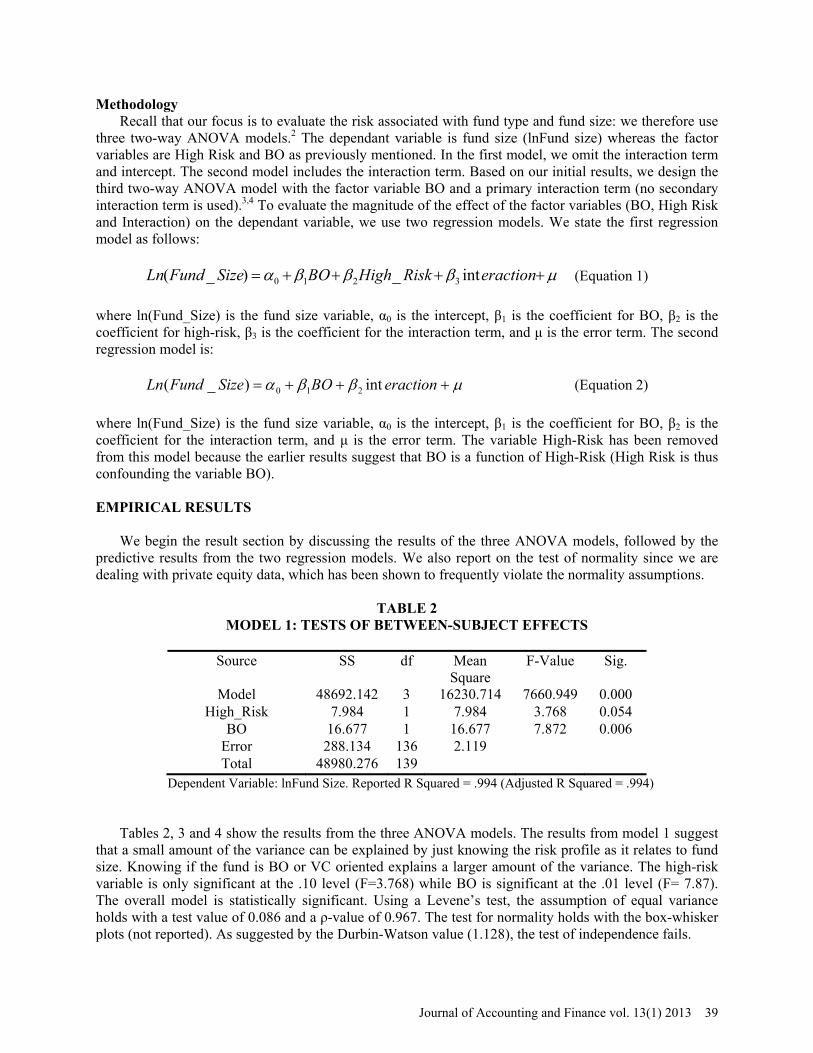
FIGURE 4 FIGURE 5 FIGURE 6
The transformed variable (lnFund Size) largely conforms to the assumptions of normality (Skewness = .22; Kurtosis = -.19) as seen in Figure 4. The plot in Figure 5 shows that the data does follow a linear pattern and Figure 6 shows that there is no definite pattern in the data suggesting that the variance is equal. We now turn our attention to the factor variables, which are referred to as independent variables in the regression models. The variables of interest in this study are fund type and high risk. Buy-out (BO) is a dummy variable (VC=0, BO=1). High risk is also a dummy variable (High Risk = 1).
38 Journal of Accounting and Finance vol. 13(1) 2013
Methodology Recall that our focus is to evaluate the risk associated with fund type and fund size: we therefore use
three two-way ANOVA models.2 The dependant variable is fund size (lnFund size) whereas the factor variables are High Risk and BO as previously mentioned. In the first model, we omit the interaction term and intercept. The second model includes the interaction term. Based on our initial results, we design the third two-way ANOVA model with the factor variable BO and a primary interaction term (no secondary interaction term is used).3,4 To evaluate the magnitude of the effect of the factor variables (BO, High Risk and Interaction) on the dependant variable, we use two regression models. We state the first regression model as follows:
eractionRiskHighBOSizeFundLn int_)_( 3210 (Equation 1)
where ln(Fund_Size) is the fund size variable, α0 is the intercept, β1 is the coefficient for BO, β2 is the coefficient for high-risk, β3 is the coefficient for the interaction term, and μ is the error term. The second regression model is:
eractionBOSizeFundLn int)_( 210 (Equation 2)
where ln(Fund_Size) is the fund size variable, α0 is the intercept, β1 is the coefficient for BO, β2 is the coefficient for the interaction term, and μ is the error term. The variable High-Risk has been removed from this model because the earlier results suggest that BO is a function of High-Risk (High Risk is thus confounding the variable BO). EMPIRICAL RESULTS
We begin the result section by discussing the results of the three ANOVA models, followed by the predictive results from the two regression models. We also report on the test of normality since we are dealing with private equity data, which has been shown to frequently violate the normality assumptions.
TABLE 2 MODEL 1: TESTS OF BETWEEN-SUBJECT EFFECTS
Source SS df Mean
Square F-Value Sig.
Model 48692.142 3 16230.714 7660.949 0.000 High_Risk 7.984 1 7.984 3.768 0.054
BO 16.677 1 16.677 7.872 0.006 Error 288.134 136 2.119 Total 48980.276 139
Dependent Variable: lnFund Size. Reported R Squared = .994 (Adjusted R Squared = .994)
Tables 2, 3 and 4 show the results from the three ANOVA models. The results from model 1 suggest that a small amount of the variance can be explained by just knowing the risk profile as it relates to fund size. Knowing if the fund is BO or VC oriented explains a larger amount of the variance. The high-risk variable is only significant at the .10 level (F=3.768) while BO is significant at the .01 level (F= 7.87). The overall model is statistically significant. Using a Levene’s test, the assumption of equal variance holds with a test value of 0.086 and a ρ-value of 0.967. The test for normality holds with the box-whisker plots (not reported). As suggested by the Durbin-Watson value (1.128), the test of independence fails.
Journal of Accounting and Finance vol. 13(1) 2013 39
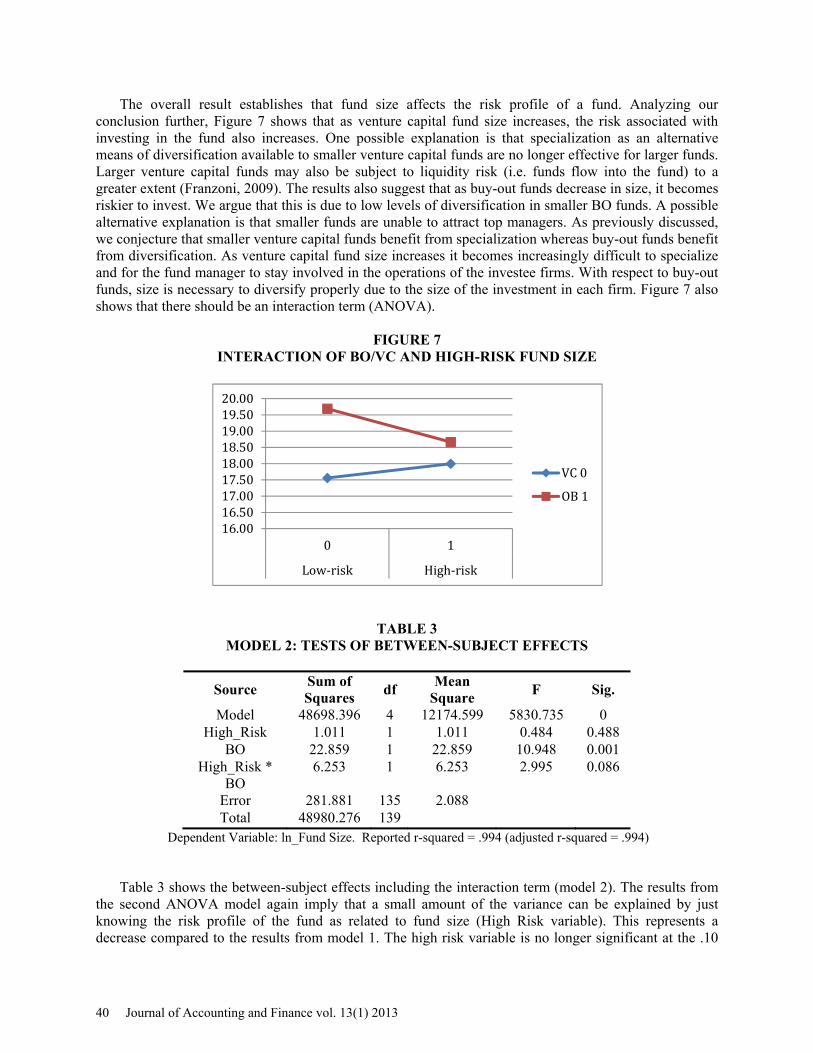
The overall result establishes that fund size affects the risk profile of a fund. Analyzing our conclusion further, Figure 7 shows that as venture capital fund size increases, the risk associated with investing in the fund also increases. One possible explanation is that specialization as an alternative means of diversification available to smaller venture capital funds are no longer effective for larger funds. Larger venture capital funds may also be subject to liquidity risk (i.e. funds flow into the fund) to a greater extent (Franzoni, 2009). The results also suggest that as buy-out funds decrease in size, it becomes riskier to invest. We argue that this is due to low levels of diversification in smaller BO funds. A possible alternative explanation is that smaller funds are unable to attract top managers. As previously discussed, we conjecture that smaller venture capital funds benefit from specialization whereas buy-out funds benefit from diversification. As venture capital fund size increases it becomes increasingly difficult to specialize and for the fund manager to stay involved in the operations of the investee firms. With respect to buy-out funds, size is necessary to diversify properly due to the size of the investment in each firm. Figure 7 also shows that there should be an interaction term (ANOVA).
FIGURE 7 INTERACTION OF BO/VC AND HIGH-RISK FUND SIZE
TABLE 3 MODEL 2: TESTS OF BETWEEN-SUBJECT EFFECTS
Source Sum of Squares
df Mean
Square F Sig.
Model 48698.396 4 12174.599 5830.735 0 High_Risk 1.011 1 1.011 0.484 0.488
BO 22.859 1 22.859 10.948 0.001 High_Risk *
BO 6.253 1 6.253 2.995 0.086
Error 281.881 135 2.088 Total 48980.276 139
Dependent Variable: ln_Fund Size. Reported r-squared = .994 (adjusted r-squared = .994)
Table 3 shows the between-subject effects including the interaction term (model 2). The results from the second ANOVA model again imply that a small amount of the variance can be explained by just knowing the risk profile of the fund as related to fund size (High Risk variable). This represents a decrease compared to the results from model 1. The high risk variable is no longer significant at the .10
16.0016.5017.0017.5018.0018.5019.0019.5020.00
0 1
Low‐risk High‐risk
VC0
OB1
40 Journal of Accounting and Finance vol. 13(1) 2013
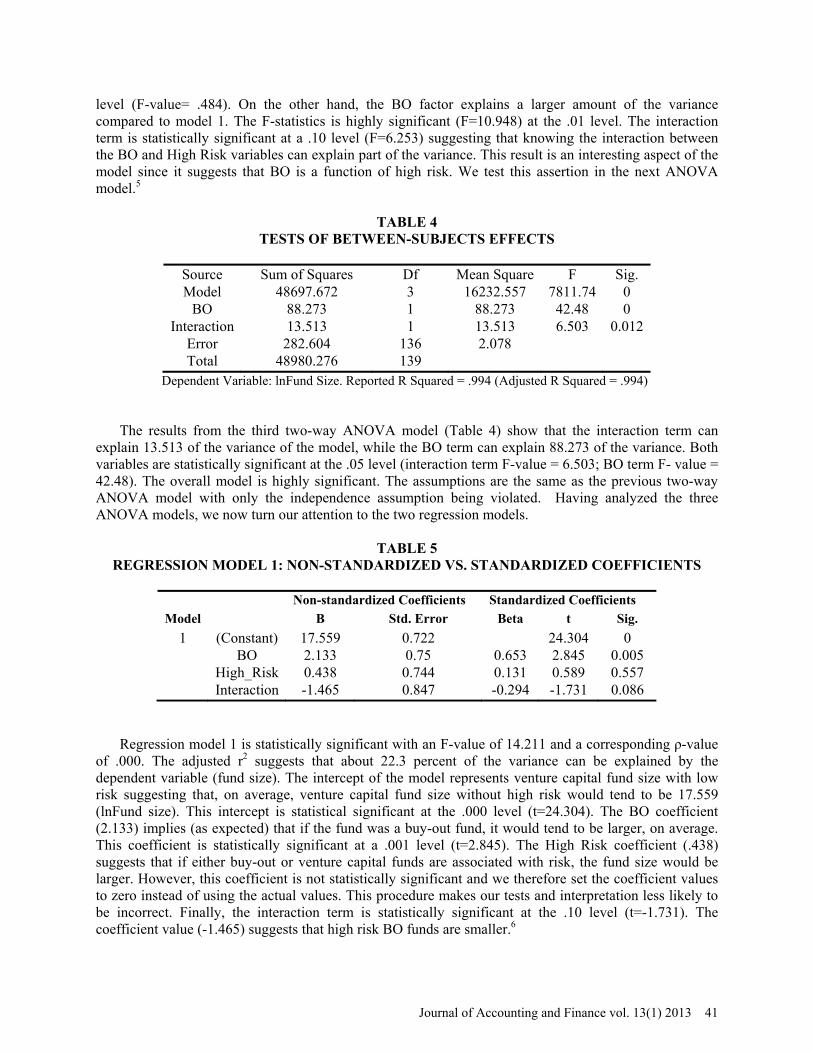
level (F-value= .484). On the other hand, the BO factor explains a larger amount of the variance compared to model 1. The F-statistics is highly significant (F=10.948) at the .01 level. The interaction term is statistically significant at a .10 level (F=6.253) suggesting that knowing the interaction between the BO and High Risk variables can explain part of the variance. This result is an interesting aspect of the model since it suggests that BO is a function of high risk. We test this assertion in the next ANOVA model.5
TABLE 4 TESTS OF BETWEEN-SUBJECTS EFFECTS
Source Sum of Squares Df Mean Square F Sig. Model 48697.672 3 16232.557 7811.74 0
BO 88.273 1 88.273 42.48 0 Interaction 13.513 1 13.513 6.503 0.012
Error 282.604 136 2.078 Total 48980.276 139
Dependent Variable: lnFund Size. Reported R Squared = .994 (Adjusted R Squared = .994)
The results from the third two-way ANOVA model (Table 4) show that the interaction term can explain 13.513 of the variance of the model, while the BO term can explain 88.273 of the variance. Both variables are statistically significant at the .05 level (interaction term F-value = 6.503; BO term F- value = 42.48). The overall model is highly significant. The assumptions are the same as the previous two-way ANOVA model with only the independence assumption being violated. Having analyzed the three ANOVA models, we now turn our attention to the two regression models.
TABLE 5 REGRESSION MODEL 1: NON-STANDARDIZED VS. STANDARDIZED COEFFICIENTS
Non-standardized Coefficients Standardized Coefficients
Model B Std. Error Beta t Sig.
1 (Constant) 17.559 0.722 24.304 0 BO 2.133 0.75 0.653 2.845 0.005 High_Risk 0.438 0.744 0.131 0.589 0.557 Interaction -1.465 0.847 -0.294 -1.731 0.086
Regression model 1 is statistically significant with an F-value of 14.211 and a corresponding ρ-value of .000. The adjusted r2 suggests that about 22.3 percent of the variance can be explained by the dependent variable (fund size). The intercept of the model represents venture capital fund size with low risk suggesting that, on average, venture capital fund size without high risk would tend to be 17.559 (lnFund size). This intercept is statistical significant at the .000 level (t=24.304). The BO coefficient (2.133) implies (as expected) that if the fund was a buy-out fund, it would tend to be larger, on average. This coefficient is statistically significant at a .001 level (t=2.845). The High Risk coefficient (.438) suggests that if either buy-out or venture capital funds are associated with risk, the fund size would be larger. However, this coefficient is not statistically significant and we therefore set the coefficient values to zero instead of using the actual values. This procedure makes our tests and interpretation less likely to be incorrect. Finally, the interaction term is statistically significant at the .10 level (t=-1.731). The coefficient value (-1.465) suggests that high risk BO funds are smaller.6
Journal of Accounting and Finance vol. 13(1) 2013 41
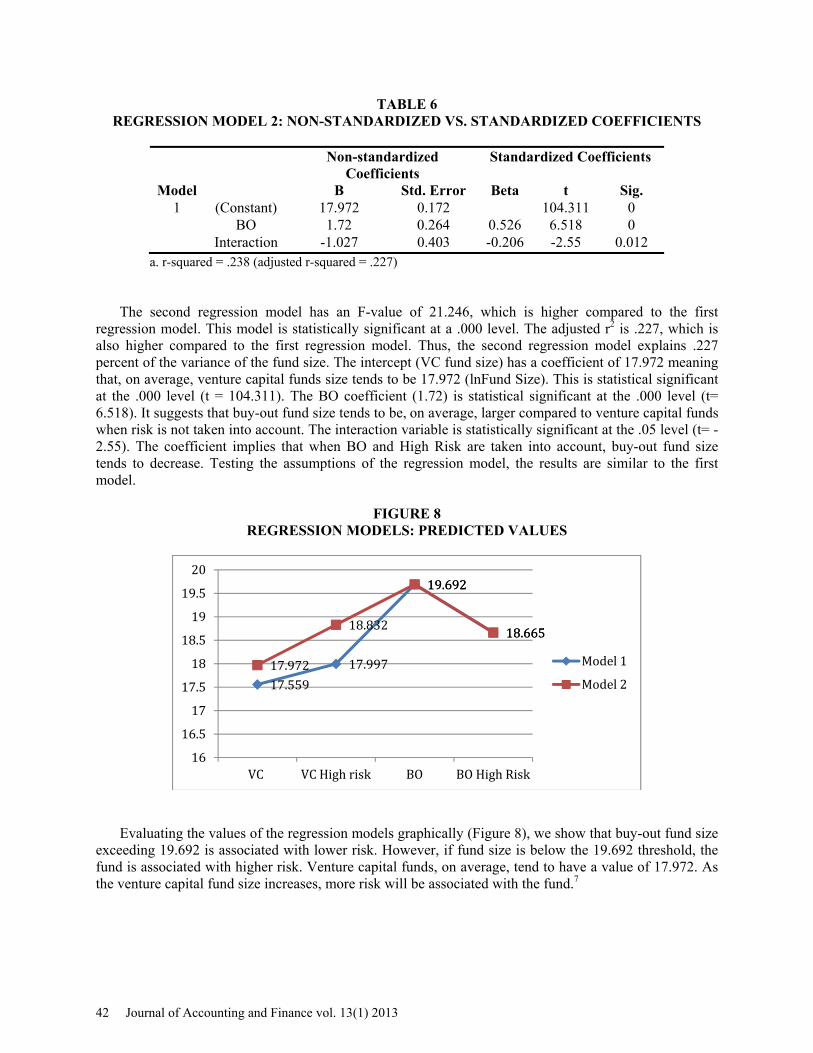
TABLE 6 REGRESSION MODEL 2: NON-STANDARDIZED VS. STANDARDIZED COEFFICIENTS
Non-standardized
Coefficients Standardized Coefficients
Model B Std. Error Beta t Sig. 1 (Constant) 17.972 0.172 104.311 0 BO 1.72 0.264 0.526 6.518 0 Interaction -1.027 0.403 -0.206 -2.55 0.012
a. r-squared = .238 (adjusted r-squared = .227)
The second regression model has an F-value of 21.246, which is higher compared to the first regression model. This model is statistically significant at a .000 level. The adjusted r2 is .227, which is also higher compared to the first regression model. Thus, the second regression model explains .227 percent of the variance of the fund size. The intercept (VC fund size) has a coefficient of 17.972 meaning that, on average, venture capital funds size tends to be 17.972 (lnFund Size). This is statistical significant at the .000 level (t = 104.311). The BO coefficient (1.72) is statistical significant at the .000 level (t= 6.518). It suggests that buy-out fund size tends to be, on average, larger compared to venture capital funds when risk is not taken into account. The interaction variable is statistically significant at the .05 level (t= -2.55). The coefficient implies that when BO and High Risk are taken into account, buy-out fund size tends to decrease. Testing the assumptions of the regression model, the results are similar to the first model.
FIGURE 8 REGRESSION MODELS: PREDICTED VALUES
Evaluating the values of the regression models graphically (Figure 8), we show that buy-out fund size
exceeding 19.692 is associated with lower risk. However, if fund size is below the 19.692 threshold, the fund is associated with higher risk. Venture capital funds, on average, tend to have a value of 17.972. As the venture capital fund size increases, more risk will be associated with the fund.7
17.559
17.997
19.692
18.665
17.972
18.832
19.692
18.665
16
16.5
17
17.5
18
18.5
19
19.5
20
VC VCHighrisk BO BOHighRisk
Model1
Model2
42 Journal of Accounting and Finance vol. 13(1) 2013
CONCLUSION The results of this study suggest risk is associated with fund type and size. Thus, knowing fund type
and size would allow fund sponsors to make more informed decisions. We show that investing in larger venture capital funds are riskier than investing in smaller funds of the same type. Smaller buy-out funds are riskier than larger buy-out funds. Large venture capital funds offer the highest investment risk. The results can be explained as follows. Studies have shown that venture capital funds are less associated with agency conflict. The main reason is that venture capital fund managers take a very active post-investment role compared to buy-out fund managers. An active approach reduces the asymmetric information gap between investors and managers/owners. Further, venture capital funds have stronger monitoring mechanisms than buy-out funds implying that buy-out funds have less control. This is mitigated for large buy-out funds, which are able to diversify risk associated with the earnings stream. As buy-out fund size decreases, there is more uncertainty about fund performance. Increased uncertainty will increase funding costs because investors need to be compensated for taking on the extra risk, which is at least partially due to less diversification. ENDNOTES
1. Our final sample size is 139 funds, which is consistent with the extant literature (e.g. Guo et al., 2011). 2. We refer to each of the three two-way ANOVA models as models 1, 2 and 3, respectively. 3. The initial results suggest that BO is a function of High Risk, which establishes the relationship we are
studying. 4. The interaction term is calculated by taking the product of buy-out (BO) and high-risk. 5. The assumption of equal variance holds using a Levene’s test. The assumption for normality holds
analyzing the box and whisker plots. However, using a Durbin-Watson test for independence suggests that the variables are not independent of each other. The overall model is highly significant (ρ = .001).
6. The assumptions of the model for normality are violated since the test of independence fails. The residual plot (not reported) suggests that over 95% of the residuals fall between 2 and -2. However, the pattern is due to the independent variables being discrete (dummy variables).
7. The regression (Model 2) value for the VC/High Risk category is calculated by taking the average between VC and BO and interpolating the values.
REFERENCES Achleitner, A., R. Braun and B. Hinterramskogler and F. Tappeiner, (2012), Structure and Determinants of Financial Covenants in Leveraged Buyouts, Review of Finance, 16, 647 – 684. Braun, R., N. Engel, P. Hieber and R. Zagst, (2011), The Risk Appetite of Private Equity Sponsors, Journal of Empirical Finance, 18, 815 – 832. Cochrane, J., (2005), The Risk and Return of Venture Capital, Journal of Financial Economics, 75, 3 – 52. Colla, P., F. Ippolito and H. F. Wagner, (2012), Leverage and Pricing of Debt in LBOs, Journal of Corporate Finance, 18, 124 – 137. Cummins, D., (2004), The Determinants of Venture Capital Portfolio Size: Empirical Evidence, Journal of Business, 79, 1083 – 2006. Diller, C. and C. Kaserer, (2009), What Drives Private Equity Returns?, Fund Inflows, Skilled GPs and/or Risk? European Financial Management, 15, 643 – 675.
Journal of Accounting and Finance vol. 13(1) 2013 43
Dimov, D. and G. Murray, (2008), Determinants of the Incidence and Scale of Seed Capital Investments by Venture Capital Firms, Small Business Economics, 30, 127 – 152. Ferrary, M., (2010), Syndication of Venture Capital Investment: The Art of Resource Pooling, Entrepreneurship Theory & Practice, 34, 885 – 907. Franxoni, F., E. Nowak and L. Phalippou, (2011), Private Equity Performance and Liquidity Risk”, working paper. Hall, R. and S. Woodward, (2010), The Burden of the Non-diversifiable Risk on Entrepreneurship, American Economic Review, 100, 1163 – 1194. Gompers, P. and J. Lerner, (1998), Venture Capital Distributions: Short-Run and Long-Run Reactions, The Journal of Finance, 53, 2161 – 2183. Groh, A. P., R. Baule and O. Gottschalg, (2008), Measuring Idiosyncratic Risks in Leveraged Buyout Transactions, Quarterly Journal of Finance and Accounting, 47, 5 – 23. Guo, S., E. S. Hotchkiss and W. Song, (2011), Do Buyouts (Still) Create Value?, The Journal of Finance, 66, 479 – 517. Gupta, A., and H. Sapienza, (1992), Determinants of Venture Capital Firms’ Preferences Regarding the Industry Diversity and GeoFigureic Scope of Their Investments, Journal of Business Venturing, 7, 347 – 362. Hafzalla, N. M., (2009), Managerial Incentives for Discretionary Disclosure: Evidence from Management Leveraged Buyouts, Review of Accounting Studies, 14, 507 – 533. Jensen, M. and W. Meckling, (1976), Theory of the Firm: Managerial Behavior, Agency Costs and Ownership Structure, Journal of Financial Economics, 3, 305 – 360. Kaplan, S. N. and A. Schoar, (2005), Private Equity Performance: Returns, Persistence and Capital Flows, The Journal of Finance, 60, 1791 – 1823. Knill, A., (2009), Should Venture Capitalists Put all Their Eggs in One Basket? Diversification Versus Pure-Play Strategies in Venture Capital, Financial Management, 38, 441 – 486. Koryak, O. and J. Smolarski, (2008), Perception of Risk by Venture Capital and Private Equity Firms: A European Perspective, Journal of Private Equity, 11, 30 – 42. Phalippou, L. and O. Gottschalg, (2008), The Performance of Private Equity Funds, The Review of Financial Studies, 22, 1747 – 1776. Wright, M. and K. Robbie, (1998), Venture Capital and Private Equity: A Review and Synthesis, Journal of Business Finance and Accounting, 25, 521 – 570. Wang, S. and H. Zhou, (2002), Staged Financing in Venture Capital: Moral Hazard and Risks, working paper.
44 Journal of Accounting and Finance vol. 13(1) 2013