Embed Size (px)
Citation preview
Forschungsinstitut zur Zukunft der ArbeitInstitute for the Study of Labor
DI
SC
US
SI
ON
P
AP
ER
S
ER
IE
S
Determining Minimum Wages in China:Do Economic Factors Dominate?
IZA DP No. 9716
February 2016
Christian DregerReinhold KosfeldYanqun Zhang

Determining Minimum Wages in China: Do Economic Factors Dominate?
Christian Dreger DIW Berlin and IZA
Reinhold Kosfeld
University of Kassel
Yanqun Zhang
Chinese Academy of Social Sciences
Discussion Paper No. 9716 February 2016
IZA
P.O. Box 7240 53072 Bonn
Germany
Phone: +49-228-3894-0 Fax: +49-228-3894-180
E-mail: [email protected]
Any opinions expressed here are those of the author(s) and not those of IZA. Research published in this series may include views on policy, but the institute itself takes no institutional policy positions. The IZA research network is committed to the IZA Guiding Principles of Research Integrity. The Institute for the Study of Labor (IZA) in Bonn is a local and virtual international research center and a place of communication between science, politics and business. IZA is an independent nonprofit organization supported by Deutsche Post Foundation. The center is associated with the University of Bonn and offers a stimulating research environment through its international network, workshops and conferences, data service, project support, research visits and doctoral program. IZA engages in (i) original and internationally competitive research in all fields of labor economics, (ii) development of policy concepts, and (iii) dissemination of research results and concepts to the interested public. IZA Discussion Papers often represent preliminary work and are circulated to encourage discussion. Citation of such a paper should account for its provisional character. A revised version may be available directly from the author.
IZA Discussion Paper No. 9716 February 2016
ABSTRACT
Determining Minimum Wages in China: Do Economic Factors Dominate?
Minimum wages may be an important instrument to reduce income inequality in a society and to promote socially inclusive economic growth. While higher minimum wages can support the Chinese transformation towards consumption driven growth, they can worsen the price competitiveness in export markets. As they differ throughout the country, this paper investigates their determinants at the regional level. In addition to a broad set of economic determinants, such as per capita income and consumption, consumer prices, unemployment and industrial structures, spatial effects are taken into account. They might arise for different reasons, including competition of local policymakers. The results show that the impact of economic variables declines, once spatial spillovers are considered. Although the minimum wage regulation pursues the relevance of economic factors in the determination of the appropriate levels, the actual development is largely driven by regional dependencies. As minimum wage standards set by local officials do not fully reflect the regional economic development, further reforms should be on the agenda. JEL Classification: J30, R23, C23 Keywords: Chinese transformation, minimum wages, spatial effects, spatial Durbin model Corresponding author: Christian Dreger DIW Berlin Mohrenstr. 58 10117 Berlin Germany E-mail: [email protected]
2
1 Introduction
The Chinese economic transformation stands at its crossroads. Previous policies contributed to
the emergence of huge overcapacities in many industrial sectors. In contrast to the export‐ and
investment‐led growth strategy of the past, private consumption should play a more dominant
role over the next years. At the same time, income inequality is striking. According to the Na‐
tional Bureau of Statistics, the ratio of per capita income between high (medium) and low in‐
come earners increased from 3.6 (1.9) to 4.9 (2.2) over the past decade. According to the same
source the Gini coefficient is about 0.5, after 0.2 at the onset of economic reforms almost four
decades ago. Income gaps can only partly be attributed to different labour skills. In particular,
the urban‐rural income divide is striking. Net earnings of private households in rural areas
amount to one third of the urban level. Large inequalities can undermine the political stability
of the country and lead to social unrest. Although the Chinese growth record was spectacular
starting from the beginning of the reforms, significant parts of the population benefitted to a
less extent.
Minimum wages may be an instrument to reduce income inequality and foster socially inclu‐
sive economic growth. They can provide a safety net, since they introduce a wage floor and
guarantee a basic standard of living for workers and their families (Lin and Yun, 2014). During
the recent years, the Chinese government implemented various policies to raise income levels
at the lower end, such as the provision of social security for rural areas and the minimum wage
policy2. Since standards of living differ across regions, China does not set one minimum wage
for the whole country. Instead, the task of determining minimum wages is delegated to local
authorities. Each province or municipality set its own minimum wage in accordance with the
individual regional conditions. Higher minimum wages can underpin the transformation to‐
wards consumption‐led growth, as low income households have a high marginal propensity to
consume. At the same time, increasing costs can worsen the attractiveness of regions as po‐
tential destination for investment flows. This may constitute a conflict of interest, as officials
from areas of strong GDP growth have better chances to be promoted. They are able to man‐
age economic challenges to a higher extent and may have better career opportunities in the
communist party. Therefore, local policymakers can have the incentive to keep minimum wag‐
es at relatively low levels in order to improve cost competitiveness. On the other hand, how‐
2 Due to the new rural pension and medical insurance schemes, the disparities in access to basic social services have narrowed, but the quality of the services remains to be inferior compared to entitlements in the urban areas.
3
ever, higher minimum wages can be also seen as an indication of a sound economic perfor‐
mance.
Several papers studied the impacts of minimum wages, most notably on the employment rec‐
ord. Ma, Zhang and Zhu (2012) argued that a rise in minimum wages of 10 percent will lead to
an increase in the average wage of 0.5 percent and a decrease in employment of 0.6 percent in
the export oriented manufacturing and labour intensive sectors. According to Wang and
Gunderson (2011, 2012) minimum wages do not influence neither overall wages nor employ‐
ment in Eastern Chinese regions. Adverse effects can be observed in industries more respon‐
sive to market pressures, in low‐wage sectors such as retail and wholesale trade and in restau‐
rants, as well as for women. Employment effects turn out to be positive for state‐owned en‐
terprises. Ni, Wang and Yao (2011) stressed the impact of the regional dimension for the re‐
sults. While the employment effects from a minimum wage increase appear to be slightly neg‐
ative in Eastern China, they are insignificant or slightly positive in the Central and Western
areas. Fang and Lin (2013) found that a rise in the minimum wage has negative employment
effects in Eastern and Central regions for groups with high labour market risk, such as the
young adults, females and the low skilled. Labour demand elasticities range from ‐0.265 to ‐
0.340. In the less developed areas of Western China, no significant effects are detected. The
results are broadly confirmed by Jia (2014). While male employment is not influenced, female
employment is expected to fall after a minimum wage increase. To better protect disadvan‐
taged workers, future minimum wage reforms should focus on the most vulnerable workers,
such as the less‐educated women.
Mayneris, Poncet and Zhang (2014) investigated whether the recent minimum wage reform
affected the survival and productivity of regional enterprises. In principle, stronger minimum
wage growth allows more productive firms to replace the least productive ones and forces
incumbent firms to raise their competitiveness. The study reported aggregate efficiency gains
attributed to the reform. Huang, Loungani and Wang (2014) found that firms with higher wag‐
es or large profit margins increase employment, while those with low wages or small profit
margins will downsize labour input. The net effect of higher minimum wages on employment
turns out to be positive. Xing and Xu (2015) explored the regional variation of minimum wages.
Despite the decentralization in the implementation of minimum wages, regional differences
declined after the turn of the century. Economic determinants, such as GDP, the economic
structure (share of tertiary industry) and the consumption level are the main drivers of the
dispersion. In addition, there is weak evidence that the variation of minimum wages is influ‐
4
enced by political factors. The latter finding is based on the actual timing of minimum wage
decisions. Regions with stronger GDP, higher fiscal expenditures, and a larger services sector
tend to adjust later than other regions. However, minimum wages are slightly higher than in
the competitive areas.
Despite this literature, the analysis of the determinants of minimum wages is still at an infancy
stage. To bridge the gap, this paper presents evidence on the relative role of the factors driving
the evolution. Besides the potential economic determinants, such as per capita income and
consumption, consumer prices, unemployment and specific industrial patterns, regional spill‐
overs could be relevant, but they have not been examined so far. The exclusion of these de‐
pendencies might constitute an omitted variable bias in the regressions and can lead to misin‐
terpretations of the results. As a consequence, policy conclusions based on the assumption of
regional independence may be invalid. Cross section correlation patterns could arise because
of common infrastructure facilities and migration flows, but can also stem from regional com‐
petition. To stay competitive in terms of costs, local authorities are reluctant to raise minimum
wages above the level in neighbourhood regions, as they fear the loss of cost advantages. Note
that a race to the bottom is not implied for the emergence of regional spillovers. Higher mini‐
mum wages can also signal prosperity and avoid labour shortages. Even skilled workers might
be attracted, since a more generous minimum wage represents an advanced level of the de‐
velopment. In any case, minimum wages in competitive regions are a benchmark when deter‐
mining the own wage level.
According to the spatial Durbin model employed in the analysis, both groups of factors con‐
tribute to explain the development of minimum wages. While they are closely connected to
average wages and consumer prices, other regressors like per capita consumption or the un‐
employment rate are important only if they interact with the regional dimension. The impact
of economic variables declines, once regional spillovers are added to the regression. Although
the minimum wage decree stresses the relevance of economic factors for their proper deter‐
mination, the actual evolution is characterized to a large extent by regional spillovers. Since
minimum wages set by officials do not fully reflect the economic conditions, further reforms
should be on the agenda.
The rest of the paper is structured as follows. Section 2 reviews the major steps of the mini‐
mum wage regulation in China. Section 3 presents the spatial econometric techniques used in
the analysis. After discussing the main trends in the evolution of minimum wages, panel mod‐
5
els are specified at the level of Chinese provinces in Section 4. While a standard fixed effects
approach confirms the presence of economic factors in the process driving minimum wages,
the panel spatial Durbin model reveals that some of the determinants are relevant only be‐
cause of the geographical pattern. Finally, Section 5 concludes with some policy recommenda‐
tions.
2 Minimum wage regulation in China
Due to low wage growth and an acceleration of inflation, several provinces like Guangdong and
Shenzhen introduced minimum wages at a local scale in the late 1980s. Driven by increasing
labour disputes, China implemented its first minimum wage regime in 1994, after ratification
of the International Labour Organization Convention. Local governments are authorized to set
their own minimum wages (Casale and Zhu 2013; Holz 2014). They are determined in line with
regional economic factors, including the average living expenses and wages, social security
contributions, unemployment rates and the level of development. In principle, firms covered
by the reform include the state‐owned and private enterprises, as long as they are engaged in
economic activities. However, the rule was quite porous, as the local authorities could exempt
township and village enterprises from the regulation. Furthermore, the penalties in case of
non‐enforcement were relatively moderate and amounted to 20‐100 percent of the owed
wage. As a consequence, official minimum wages were not very binding.
A stricter reform has been implemented in 2004. The new decree issued by the government
introduced more comprehensive standards. Coverage is extended to town village enterprises
(TVEs), self‐employed businesses, private non‐enterprise units and migrant workers. The pen‐
alties for violators increased to 100‐500 percent of the owed wage. Besides the monthly wage,
hourly minimum wages are introduced for part‐time work. Firms cannot include overtime
premia or canteen and traveling supplements as part of their wages when calculating mini‐
mum wages. Minimum‐wages should be also adjusted more frequently, at least every two
years. In the advance of the adjustment, the local authorities are required to submit a proposal
to the central government. The proposal has to be in advance discussed with local trade un‐
ions and enterprise confederations. The Ministry of Labour provides recommendations that
can lead to revisions of the initial plan. If there are no further requests, the regional authorities
are entitled to adjust the minimum wage. The new regulation led to substantial wage growth,
also stimulated by increasing labour unrest.

6
The aim of the minimum wage regulation is to raise standards of living at the low end of the
income distribution. Local minimum wage for full‐time workers should be about 40 to 60 per‐
cent of the average local wage which in line with international standards. Although minimum
wages increased at double‐digit rates during the last years, the target has not been met so far,
owing to low initial values. According to Han, Wei and Wai‐Kwong Mok (2011) workers in two
thirds of the cities covered by their analysis received minimum wages below the poverty line in
2010. However, this share is only a rough indication, because it is likely upward biased. Aver‐
age annual wages are usually based on labour surveys conducted in urban areas. Migrant
workers and workers in informal sectors, who often earn less than the average wage are not
fully represented in the sample. Thus, the actual average wage tends to be overestimated,
implying that the relative minimum wage, i.e. the ratio between the minimum and the average
wage will be underestimated. Nonetheless, as stressed in the 13th five‐year‐plan of the gov‐
ernment, further increases of minimum wages are on the agenda, despite of the growth slow‐
down of the Chinese economy.
3 Econometric models for regional dependencies
Regional variables can be spatially autocorrelated for several reasons. For example, the spatial
units can be hit by common shocks or share the same infrastructure. In addition, policy deci‐
sions in one area can be affected by corresponding decisions in neighbourhood regions, as it
can be expected in the presence of regional competition. Local spillovers constitute a correla‐
tion pattern over the cross section and can blur the regression results (Anselin, 1988). The
Moran coefficient
(1) ' / 'M z Wz z z
is an overall measure to detect the strength of spatial autocorrelation embedded in a variable
z. The vector z holds the observations of N regions in terms of deviations from their mean. W is
a spatial weight matrix with information on the regional pattern of the study area. Often the
spatial weights are based on the contiguity structure of regions. In case of first order spatial
autocorrelation, the weights are equal to 1, if two regions share a common border and 0 oth‐
erwise3. If the weights are row‐standardized, the Moran coefficient is bounded between ‐1
3 Spatial autocorrelation of higher order can be defined in a similar fashion, by noting the number of areas between the two regions considered. According to the fundamental geographical principle, nearer regions
7
and 1. While positive values indicate regional clustering, negative values point to regional dis‐
persion. The standardized coefficient can be shown to be approximately distributed as stand‐
ard normal (Anselin, 1988).
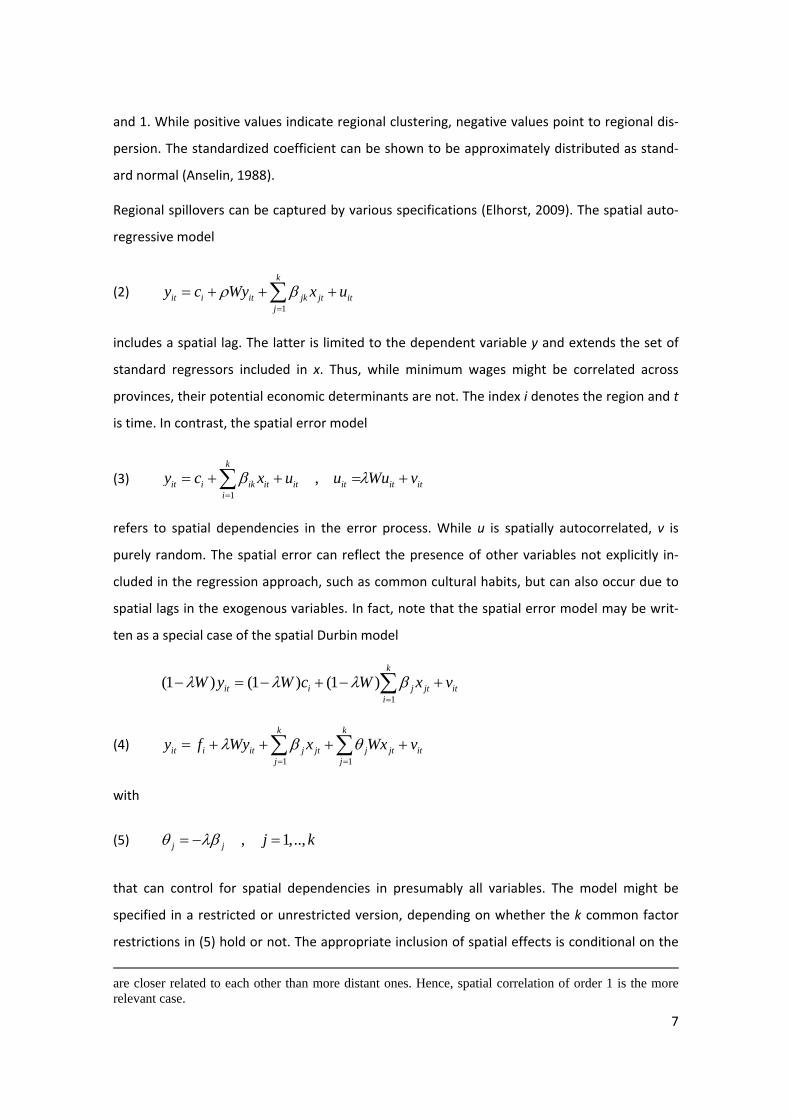
Regional spillovers can be captured by various specifications (Elhorst, 2009). The spatial auto‐
regressive model
(2) 1
k
it i it jk jt itj
y c Wy x u
includes a spatial lag. The latter is limited to the dependent variable y and extends the set of
standard regressors included in x. Thus, while minimum wages might be correlated across
provinces, their potential economic determinants are not. The index i denotes the region and t
is time. In contrast, the spatial error model
(3) 1
,k
it i ik it it it it iti
y c x u u Wu v
refers to spatial dependencies in the error process. While u is spatially autocorrelated, v is
purely random. The spatial error can reflect the presence of other variables not explicitly in‐
cluded in the regression approach, such as common cultural habits, but can also occur due to
spatial lags in the exogenous variables. In fact, note that the spatial error model may be writ‐
ten as a special case of the spatial Durbin model
1
(1 ) (1 ) (1 )k
it i j jt iti
W y W c W x v
(4) 1 1
k k
it i it j jt j jt itj j
y f Wy x Wx v
with
(5) , 1,..,j j j k
that can control for spatial dependencies in presumably all variables. The model might be
specified in a restricted or unrestricted version, depending on whether the k common factor
restrictions in (5) hold or not. The appropriate inclusion of spatial effects is conditional on the
are closer related to each other than more distant ones. Hence, spatial correlation of order 1 is the more relevant case.
8
evaluation of the Moran coefficient. The models are estimated by maximum likelihood tech‐
niques (Lee and Yu, 2010).
In a regional environment, a change of explanatory variables in a particular region can affect
the endogenous variable not only in the same region, but also in geographical surroundings
(LeSage and Pace, 2009). Therefore, direct and indirect effects could be distinguished. Direct
effects refer to the own partial derivatives of the endogenous variable with respect to exoge‐
nous variables in the same region. Feedback loops initiated in other regions are included in the
calculation. The indirect effects are obtained as cross‐section partial derivatives and show the
reaction of the endogeneous variable after a change of exogenous variables in other regions.
Formally, direct and indirect effects are inferred from a Leontief expansion of the spatial mul‐
tiplier matrix (Anselin, 2003). The total impact of a regressor is obtained as the sum of the di‐
rect and indirect components.
4 Explaining regional minimum wages
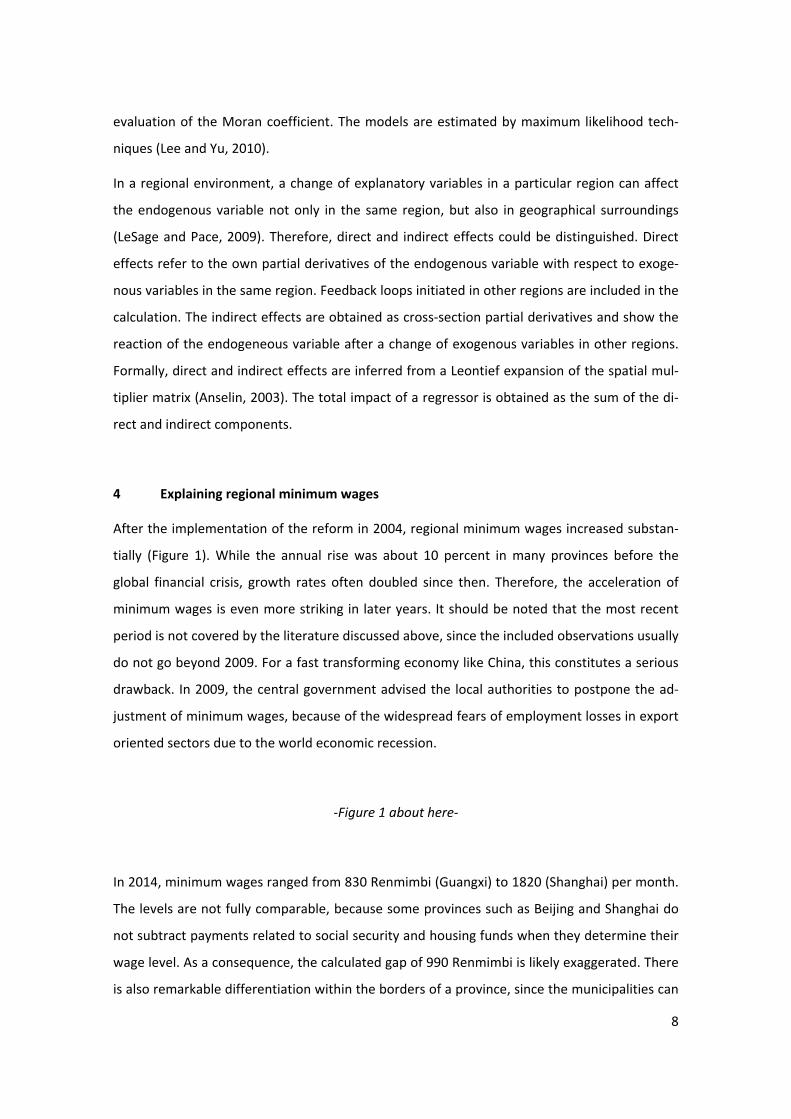
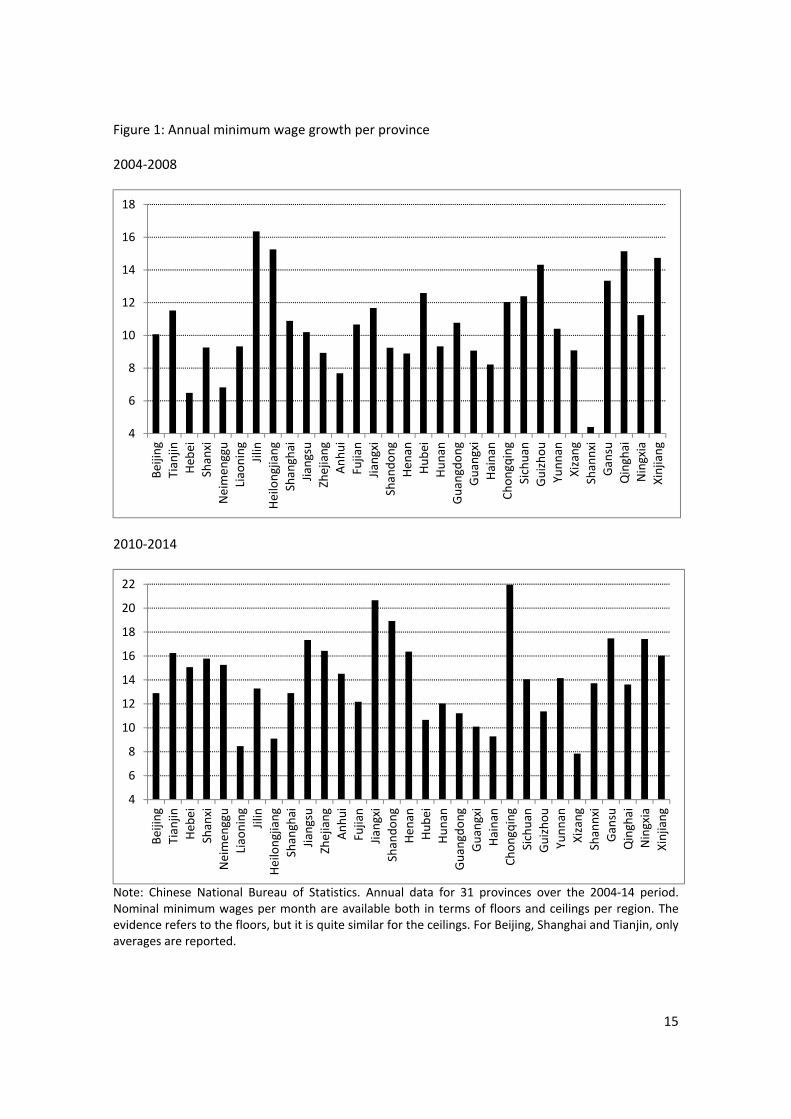
After the implementation of the reform in 2004, regional minimum wages increased substan‐
tially (Figure 1). While the annual rise was about 10 percent in many provinces before the
global financial crisis, growth rates often doubled since then. Therefore, the acceleration of
minimum wages is even more striking in later years. It should be noted that the most recent
period is not covered by the literature discussed above, since the included observations usually
do not go beyond 2009. For a fast transforming economy like China, this constitutes a serious
drawback. In 2009, the central government advised the local authorities to postpone the ad‐
justment of minimum wages, because of the widespread fears of employment losses in export
oriented sectors due to the world economic recession.
‐Figure 1 about here‐
In 2014, minimum wages ranged from 830 Renmimbi (Guangxi) to 1820 (Shanghai) per month.
The levels are not fully comparable, because some provinces such as Beijing and Shanghai do
not subtract payments related to social security and housing funds when they determine their
wage level. As a consequence, the calculated gap of 990 Renmimbi is likely exaggerated. There
is also remarkable differentiation within the borders of a province, since the municipalities can
9
set their own wages. For example, the spread between the ceiling of the minimum wage and
its floor is almost 20 percent of the average minimum wage in Hainan. The variation of mini‐
mum wages within a province is not adressed in this study, as the potential economic determi‐
nants are only reported for provinces. However, it should be noted that an analysis for the
provincial level will likely downweight the role of regional spillovers. Spatial dependencies are
likely weaker the larger the regional entities are.
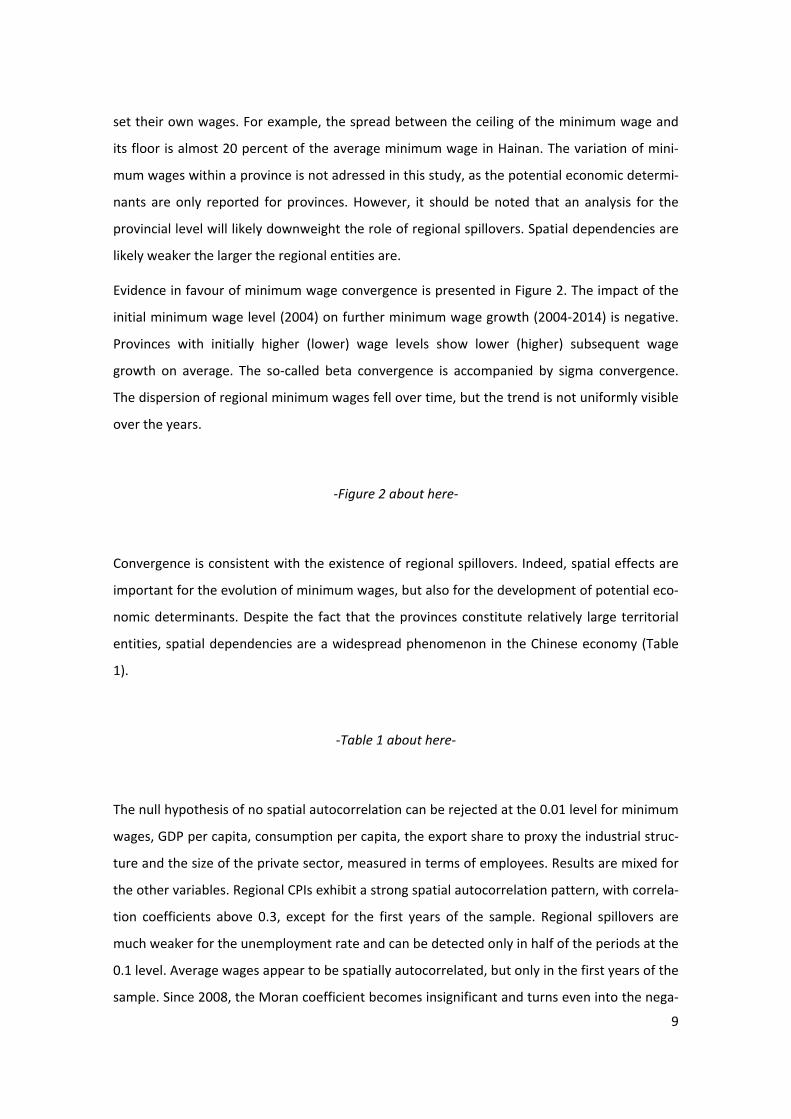
Evidence in favour of minimum wage convergence is presented in Figure 2. The impact of the
initial minimum wage level (2004) on further minimum wage growth (2004‐2014) is negative.
Provinces with initially higher (lower) wage levels show lower (higher) subsequent wage
growth on average. The so‐called beta convergence is accompanied by sigma convergence.
The dispersion of regional minimum wages fell over time, but the trend is not uniformly visible
over the years.
‐Figure 2 about here‐
Convergence is consistent with the existence of regional spillovers. Indeed, spatial effects are
important for the evolution of minimum wages, but also for the development of potential eco‐
nomic determinants. Despite the fact that the provinces constitute relatively large territorial
entities, spatial dependencies are a widespread phenomenon in the Chinese economy (Table
1).
‐Table 1 about here‐
The null hypothesis of no spatial autocorrelation can be rejected at the 0.01 level for minimum
wages, GDP per capita, consumption per capita, the export share to proxy the industrial struc‐
ture and the size of the private sector, measured in terms of employees. Results are mixed for
the other variables. Regional CPIs exhibit a strong spatial autocorrelation pattern, with correla‐
tion coefficients above 0.3, except for the first years of the sample. Regional spillovers are
much weaker for the unemployment rate and can be detected only in half of the periods at the
0.1 level. Average wages appear to be spatially autocorrelated, but only in the first years of the
sample. Since 2008, the Moran coefficient becomes insignificant and turns even into the nega‐
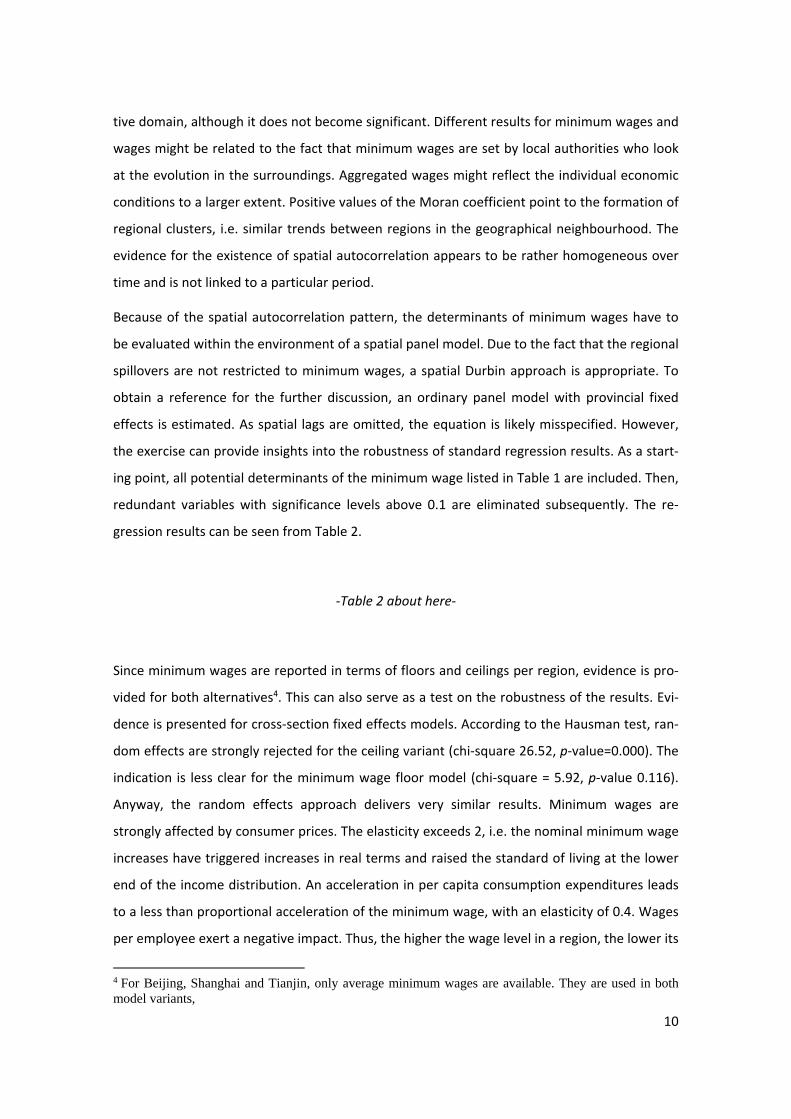
10
tive domain, although it does not become significant. Different results for minimum wages and
wages might be related to the fact that minimum wages are set by local authorities who look
at the evolution in the surroundings. Aggregated wages might reflect the individual economic
conditions to a larger extent. Positive values of the Moran coefficient point to the formation of
regional clusters, i.e. similar trends between regions in the geographical neighbourhood. The
evidence for the existence of spatial autocorrelation appears to be rather homogeneous over
time and is not linked to a particular period.
Because of the spatial autocorrelation pattern, the determinants of minimum wages have to
be evaluated within the environment of a spatial panel model. Due to the fact that the regional
spillovers are not restricted to minimum wages, a spatial Durbin approach is appropriate. To
obtain a reference for the further discussion, an ordinary panel model with provincial fixed
effects is estimated. As spatial lags are omitted, the equation is likely misspecified. However,
the exercise can provide insights into the robustness of standard regression results. As a start‐
ing point, all potential determinants of the minimum wage listed in Table 1 are included. Then,
redundant variables with significance levels above 0.1 are eliminated subsequently. The re‐
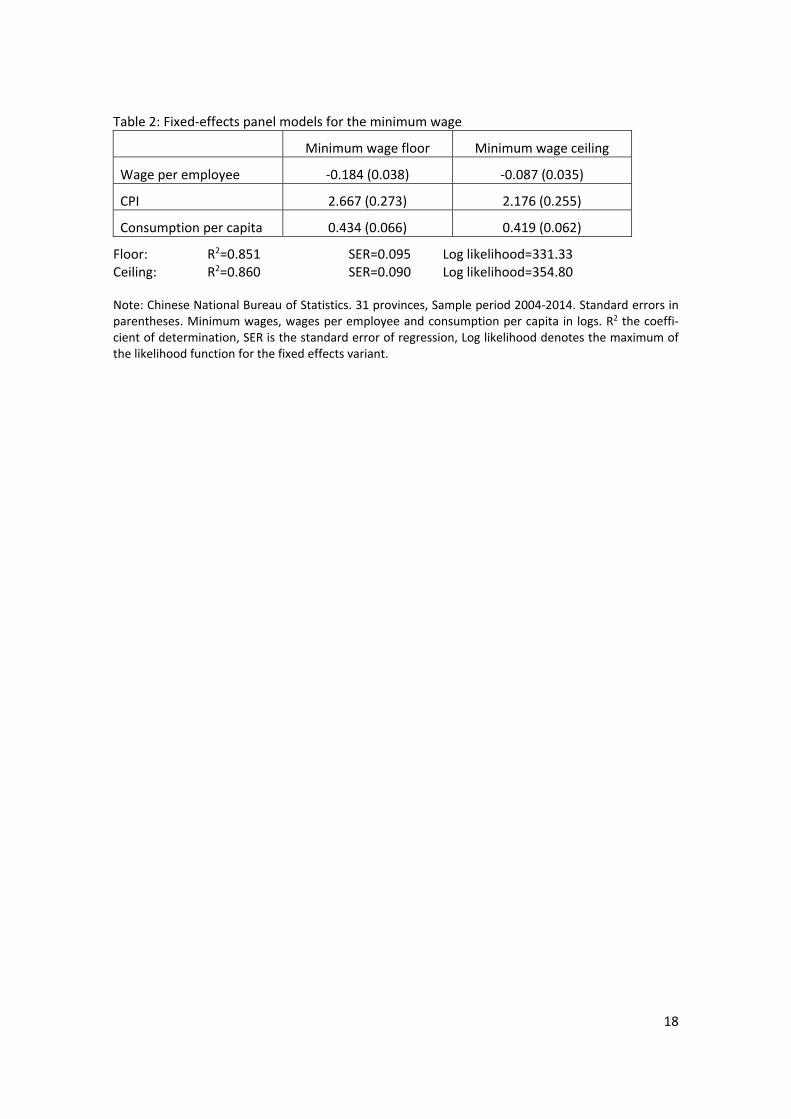
gression results can be seen from Table 2.
‐Table 2 about here‐
Since minimum wages are reported in terms of floors and ceilings per region, evidence is pro‐
vided for both alternatives4. This can also serve as a test on the robustness of the results. Evi‐
dence is presented for cross‐section fixed effects models. According to the Hausman test, ran‐
dom effects are strongly rejected for the ceiling variant (chi‐square 26.52, p‐value=0.000). The
indication is less clear for the minimum wage floor model (chi‐square = 5.92, p‐value 0.116).
Anyway, the random effects approach delivers very similar results. Minimum wages are
strongly affected by consumer prices. The elasticity exceeds 2, i.e. the nominal minimum wage
increases have triggered increases in real terms and raised the standard of living at the lower
end of the income distribution. An acceleration in per capita consumption expenditures leads
to a less than proportional acceleration of the minimum wage, with an elasticity of 0.4. Wages
per employee exert a negative impact. Thus, the higher the wage level in a region, the lower its
4 For Beijing, Shanghai and Tianjin, only average minimum wages are available. They are used in both model variants,
11
minimum wage. While this effect is significant for the floors, it diminishes for the minimum
wage ceilings. The evidence implies that minimum wages are decoupled from the overall wage
evolution to some extent. Similarly, previous studies have been unable to establish a clear‐cut
relationship between these variables, see Wang and Gunderson (2011, 2012). The missing
positive link may be due to the inclusion of other regressors. Higher consumer prices will raise
both minimum and the overall regional wages. An otherwise positive relationship could dimin‐
ish once consumer prices enter the regression.
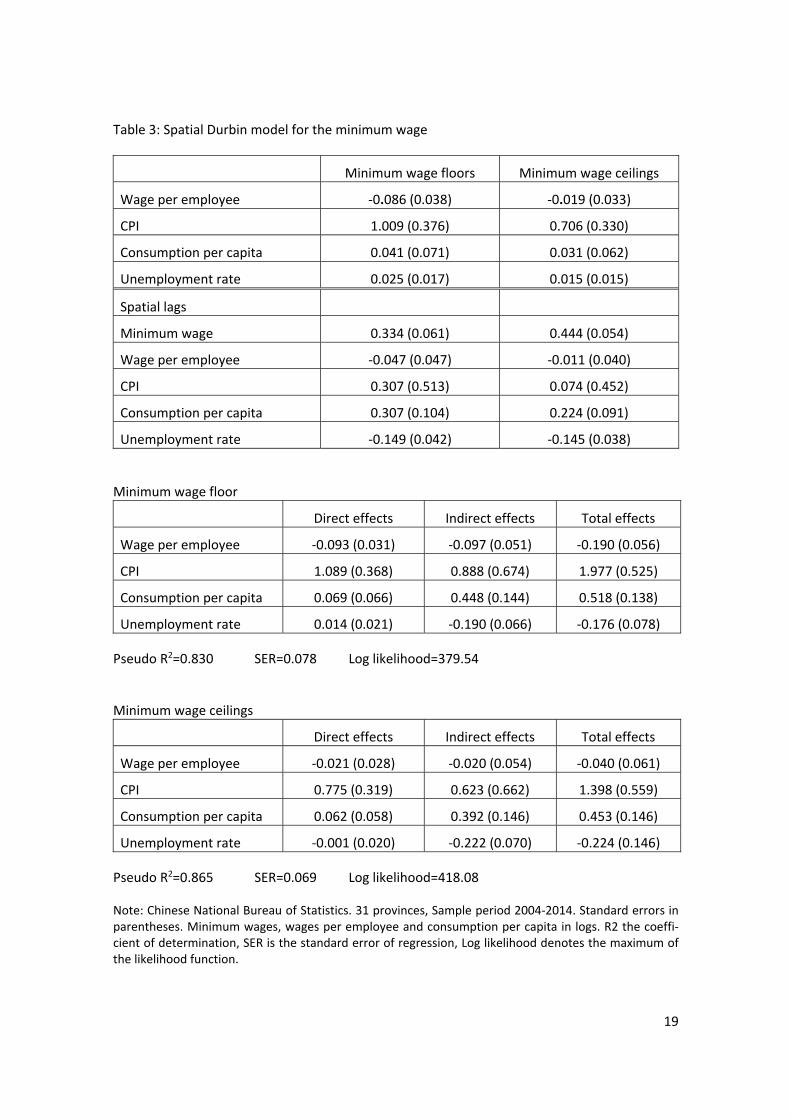
The findings of Table 2 should be taken with care, as they rely on the assumption of independ‐
ent panel members. However, this condition is hardly fulfilled. Due to the findings of Table 1,
the variables are autocorrelated over the cross section. Spatial lags may be important, both for
the minimum wage as well as for the potential economic determinants. Table 3 displays the
maximum likelihood results for the unrestricted spatial Durbin model. Similar to the strategy in
the standard panel setting, an overparameterized model is a starting point. In further rounds
of the estimation, insignificant variables (0.1 level) are eliminated subsequently. As the Haus‐
man test strongly rejects random effects specification (chi‐square= 30.46, p‐value=0.000 for
the minimum wage floor, chi‐square=25.87, p‐value=0.002 in case of minimum wage ceilings)
cross section fixed effects models are reported.
‐Table 3 about here‐
The results reveal the high relevance of the spatial lag of the minimum wage. A coefficient in
the range of 0.3‐0.4 implies that minimum wages in one region are strongly affected by mini‐
mum wages in other regions. In fact, the development in the surroundings will exert a further
upward pressure on the wage level. Obviously, local policymakers aim to provide an incentive
to settle down in their region, in order to avoid shortages in unskilled labor. Further results are
broadly in line with those from the standard panel approach, but offer deeper insights into the
factors driving minimum wages. The unemployment rate enters the preferred specification,
not per se, but only by means of its spatial lag. The higher the unemployment is in geograph‐
ical neighbourhood, the lower the minimum wage level in a region. While the CPI is important
on its own, consumption per capita exerts an impact only because of regional spillovers. The
impact stemming from the overall wage evolution is still negative, at least in case of the floor
model. The effect is based upon own and external ingredients, where the weight of each com‐
12
ponent amounts to roughly 50 percent. Note that the total elasticities exhibited in Table3 are
quite similar to the coefficients obtained in the standard panel model.
5 Conclusions
As they define a lower bound, minimum wages are an important instrument to reduce income
inequality in a society and to promote socially inclusive economic growth. While higher mini‐
mum wages can support the Chinese transformation towards consumption driven growth,
they can worsen the price competitiveness in export markets. As they differ throughout the
country, this paper investigates their determinants at the regional level. In addition to a broad
set of economic indicators, such as per capita income and consumption, CPI, unemployment
and industrial structures, spatial effects are taken into account. They might arise for different
reasons, including competition of local policymakers. The results show that the impact of eco‐
nomic variables declines, once spatial spillovers are considered. Although the minimum wage
regulation pursues the relevance of economic factors in the determination of the appropriate
levels, the actual development is largely driven by regional dependencies. As minimum wage
standards set by local officials do not fully reflect the regional economic development, further
reforms should be on the agenda.
The impact analysis can provide better insights on the strength of the own region's effect and
spatial spillovers. In particular, it becomes obvious that regular wages of employees in neigh‐
bourhood regions do not exert a significant influence on minimum wages. Differences are due
to the fact that the regression coefficient of the spillover variable also capture feedback influ‐
ences passing through neighbours and back to the own region. Furthermore, spillover effects
of consumption and unemployment tend to be stronger than indicated by the regression coef‐
ficients.
13
References
Anselin L (1988): Spatial econometrics: methods and models. Dordrecht, Kluwer Academic
Publishers.
Anselin L (2003): Spatial externalities, spatial multipliers, and spatial econometrics, Interna‐
tional Regional Science Review 26, 153‐166.
Casale G, Zhu C (2013): Labour administration reforms in China, International Labour Office,
Geneva.
Elhorst JP (2009): Spatial panel data models, in Fischer MM, Getis A (eds): Handbook of Ap‐
plied Spatial Analysis, 377‐407.
Fang T, Lin C (2013): Minimum wages and employment in China, IZA Discussion Paper 7813.
Han Z, Wei Z, Wai‐Kwong Mok V (2011): Empirical study on minimum wage level in China. The
ELES approach, Journal of Contemporary China 20, 639‐657.
Holz C (2014): Wage determination in China during the reform period, BOFIT Discussion Paper
13/2014.
Huang Y, Loungani P, Wang G (2014): Minimum wage and firm employment: Evidence from
China, Federal Reserve Bank of Dallas Globalization and Monetary Policy Institute Working
Paper 173.
Jia P (2014): Employment and working hour effects of minimum wage increase: Evidence from
China, China and the World Economy 22, 61‐80.
Lee LF, Yu J (2010): Estimation of spatial autoregressive panel data models with fixed effects,
Journal of Econometrics 154, 165–185.
Lin C, Yun M‐S (2014): Minimum wages and income inequality in urban China, Korea Labor
Institute, Working Paper.
Ma S, Zhang J, Zhu X (2012): The effect of the minimum wage on average wage and employ‐
ment: Evidence from firms in Chinese manufacturing industry, Economic Research Journal 5,
132‐146.
Mayneris F, Poncet S, Zhang T (2014): The cleansing effect the of minimum wage: Minimum
wage rules, firm dynamics and aggregate productivity in China, CEPII Working Paper 2014‐16,
Paris.
14
Ni J, Wang G, Yao X (2011): Impact of minimum wages on employment, The Chinese Economy
44, 18‐38.
LeSage J P, Pace RK (2009): Introduction to spatial econometrics, Taylor & Francis.
Wang J, Gunderson M (2011): Minimum wage impacts in China: Estimates from a prespecified
research design, 2000‐2007, Contemporary Economic Policy 29, 392‐406.
Wang J, Gunderson M (2012): Minimum wage effects on employment and wages: Dif‐in‐Dif
estimates from Eastern China, International Journal of Manpower 33, 860‐876.
Xing C, Xu J (2015): Regional variation of the minimum wages in China, IZA Discussion Paper
8931.
15
Figure 1: Annual minimum wage growth per province
2004‐2008
2010‐2014
Note: Chinese National Bureau of Statistics. Annual data for 31 provinces over the 2004‐14 period. Nominal minimum wages per month are available both in terms of floors and ceilings per region. The evidence refers to the floors, but it is quite similar for the ceilings. For Beijing, Shanghai and Tianjin, only averages are reported.
4
6
8
10
12
14
16
18
Beijing
Tianjin
Heb
ei
Shanxi
Neimen
ggu
Liaoning
Jilin
Heilongjiang
Shanghai
Jiangsu
Zhejiang
Anhui
Fujian
Jiangxi
Shandong
Hen
an
Hubei
Hunan
Guangdong
Guangxi
Hainan
Chongqing
Sichuan
Guizhou
Yunnan
Xizang
Shannxi
Gansu
Qinghai
Ningxia
Xinjiang
4
6
8
10
12
14
16
18
20
22
Beijing
Tianjin
Heb
ei
Shanxi
Neimen
ggu
Liaoning
Jilin
Heilongjiang
Shanghai
Jiangsu
Zhejiang
Anhui
Fujian
Jiangxi
Shandong
Hen
an
Hubei
Hunan
Guangdong
Guangxi
Hainan
Chongqing
Sichuan
Guizhou
Yunnan
Xizang
Shannxi
Gansu
Qinghai
Ningxia
Xinjiang

16
Figure 2: Convergence of minimum wages
Beta convergence
Sigma convergence
Note: See Figure 1. Upper part: Regression of minimim wage growth over the 2004‐14 period on the minimum wage level in 2004 (horizontal axis). Lower part: Coefficient of variation of regional minimum wages.
8
9
10
11
12
13
14
15
16
200 250 300 350 400 450 500 550 600 650 700
0,17
0,19
0,21
0,23
0,25
0,27
0,29
2004 2005 2006 2007 2008 2009 2010 2011 2012 2013 2014

17
Table 1: Moran coefficient for selected variables
Minimum wage Wage per employee
GDP per capita Unemployment rate
2004 0.363 (0.000) 0.335 (0.001) 0.501 (0.000) 0.136 (0.058)
2005 0.382 (0.000) 0.253 (0.008) 0.473 (0.000) 0.112 (0.103)
2006 0.370 (0.000) 0.233 (0.013) 0.467 (0.000) 0.147 (0.056)
2007 0.327 (0.001) 0.135 (0.081) 0.458 (0.000) 0.068 (0.183)
2008 0.336 (0.001) 0.093 (0.144) 0.437 (0.000) 0.018 (0.321)
2009 0.336 (0.001) ‐0.007 (0.413) 0.441 (0.000) 0.046 (0.223)
2010 0.335 (0.001) ‐0.057 (0.421) 0.439 (0.000) 0.062 (0.188)
2011 0.220 (0.015) ‐0.080 (0.348) 0.434 (0.000) 0.107 (0.106)
2012 0.355 (0.000) ‐0.115 (0.247) 0.416 (0.000) ‐0.007 (0.409)
2013 0.325 (0.001) ‐0.108 (0.264) 0.397 (0.000) ‐0.064 (0.396)
2014 0.350 (0.001) ‐0.143 (0.174) 0.374 (0.000) ‐0.061 (0.407)
CPI Consumption per capita
Export to GDP Private sector
2004 0.032 (0.293) 0.372 (0.000) 0.268 (0.004) 0.325 (0.001)
2005 0.020 (0.328) 0.354 (0.000) 0.306 (0.002) 0.375 (0.000)
2006 0.033 (0.288) 0.385 (0.000) 0.316 (0.001) 0.415 (0.000)
2007 0.299 (0.003) 0.376 (0.000) 0.308 (0.001) 0.393 (0.000)
2008 0.290 (0.003) 0.367 (0.000) 0.321 (0.001) 0.388 (0.000)
2009 0.358 (0.000) 0.366 (0.000) 0.351 (0.000) 0.387 (0.000)
2010 0.362 (0.000) 0.367 (0.000) 0.378 (0.000) 0.415 (0.000)
2011 0.374 (0.000) 0.372 (0.000) 0.373 (0.000) 0.447 (0.000)
2012 0.407 (0.000) 0.340 (0.001) 0.306 (0.001) 0.477 (0.000)
2013 0.409 (0.000) 0.344 (0.001) 0.291 (0.002) 0.499 (0.000)
2014 0.421 (0.000) 0.318 (0.001) 0.321 (0.001) 0.538 (0.000)
Note: See Figure 1. Number in parentheses are p‐values. Variables in nominal terms. Size of the private sector is the ratio of workers employed in the private sector to total employees. Minimum wages and wages, GDP, CPI and consumption are in logs.
18
Table 2: Fixed‐effects panel models for the minimum wage
Minimum wage floor Minimum wage ceiling
Wage per employee ‐0.184 (0.038) ‐0.087 (0.035)
CPI 2.667 (0.273) 2.176 (0.255)
Consumption per capita 0.434 (0.066) 0.419 (0.062)
Floor: R2=0.851 SER=0.095 Log likelihood=331.33 Ceiling: R2=0.860 SER=0.090 Log likelihood=354.80
Note: Chinese National Bureau of Statistics. 31 provinces, Sample period 2004‐2014. Standard errors in parentheses. Minimum wages, wages per employee and consumption per capita in logs. R2 the coeffi‐cient of determination, SER is the standard error of regression, Log likelihood denotes the maximum of the likelihood function for the fixed effects variant.
19
Table 3: Spatial Durbin model for the minimum wage
Minimum wage floors Minimum wage ceilings
Wage per employee ‐0.086 (0.038) ‐0.019 (0.033)
CPI 1.009 (0.376) 0.706 (0.330)
Consumption per capita 0.041 (0.071) 0.031 (0.062)
Unemployment rate 0.025 (0.017) 0.015 (0.015)
Spatial lags
Minimum wage 0.334 (0.061) 0.444 (0.054)
Wage per employee ‐0.047 (0.047) ‐0.011 (0.040)
CPI 0.307 (0.513) 0.074 (0.452)
Consumption per capita 0.307 (0.104) 0.224 (0.091)
Unemployment rate ‐0.149 (0.042) ‐0.145 (0.038)
Minimum wage floor
Direct effects Indirect effects Total effects
Wage per employee ‐0.093 (0.031) ‐0.097 (0.051) ‐0.190 (0.056)
CPI 1.089 (0.368) 0.888 (0.674) 1.977 (0.525)
Consumption per capita 0.069 (0.066) 0.448 (0.144) 0.518 (0.138)
Unemployment rate 0.014 (0.021) ‐0.190 (0.066) ‐0.176 (0.078)
Pseudo R2=0.830 SER=0.078 Log likelihood=379.54
Minimum wage ceilings
Direct effects Indirect effects Total effects
Wage per employee ‐0.021 (0.028) ‐0.020 (0.054) ‐0.040 (0.061)
CPI 0.775 (0.319) 0.623 (0.662) 1.398 (0.559)
Consumption per capita 0.062 (0.058) 0.392 (0.146) 0.453 (0.146)
Unemployment rate ‐0.001 (0.020) ‐0.222 (0.070) ‐0.224 (0.146)
Pseudo R2=0.865 SER=0.069 Log likelihood=418.08
Note: Chinese National Bureau of Statistics. 31 provinces, Sample period 2004‐2014. Standard errors in parentheses. Minimum wages, wages per employee and consumption per capita in logs. R2 the coeffi‐cient of determination, SER is the standard error of regression, Log likelihood denotes the maximum of the likelihood function.