Embed Size (px)
Citation preview
at SciVerse ScienceDirect
Journal of Environmental Management 114 (2013) 285e292
Contents lists available
Journal of Environmental Management
journal homepage: www.elsevier .com/locate/ jenvman
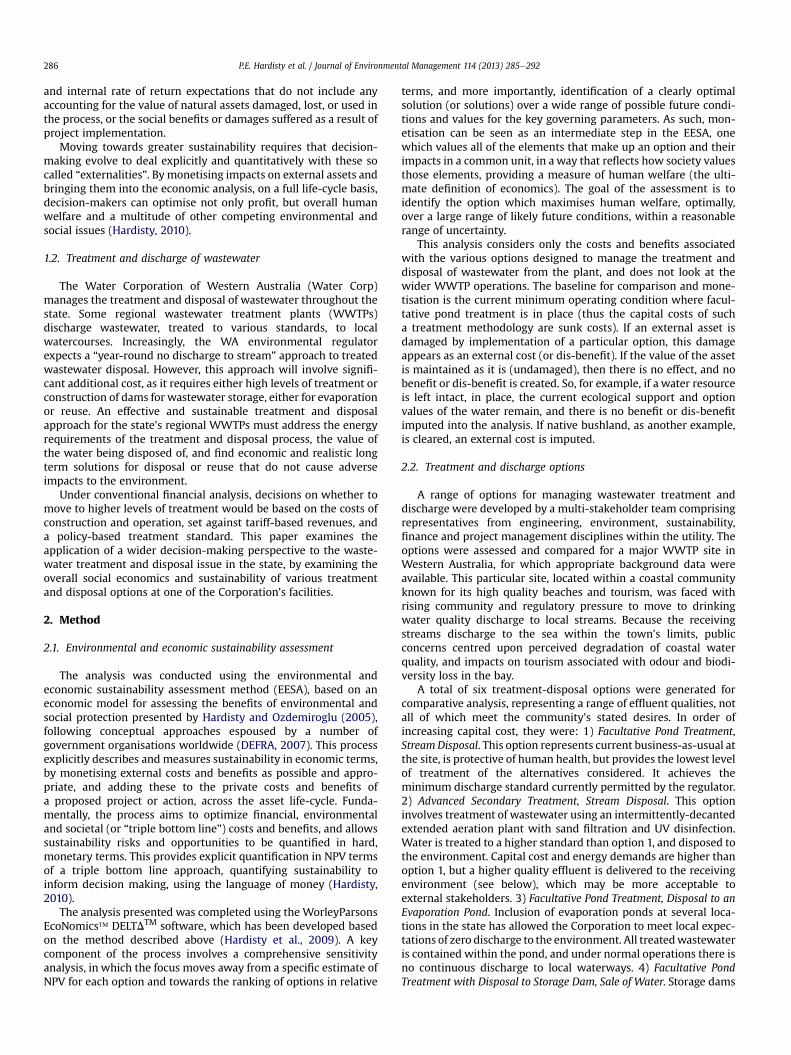
Determining a sustainable and economically optimal wastewater treatment anddischarge strategy
Paul E. Hardisty a,b,*, Mayuran Sivapalan c, Robert Humphries d
aWorleyParsons EcoNomics�, Level 7, QV1 Building, 250 St Georges Terrace, Perth, Western Australia 6000, AustraliabUniversity of Western Australia School of Business, Perth, AustraliacWorleyParsons EcoNomics�, Houston, USAdWater Corporation of Western Australia, Perth, Australia
a r t i c l e i n f o
Article history:Received 30 January 2012Received in revised form5 September 2012Accepted 11 October 2012Available online 24 November 2012
Keywords:Wastewater treatmentSustainabilityEconomics
* Corresponding author. WorleyParsons EcoNomicsSt Georges Terrace, Perth, Western Australia 6000, Au
E-mail address: [email protected]
0301-4797/$ e see front matter � 2012 Elsevier Ltd.http://dx.doi.org/10.1016/j.jenvman.2012.10.019
a b s t r a c t
Options for treatment and discharge of wastewater in regionalWestern Australia (WA) are examined fromthe perspective of overall sustainability and social net benefit. Current practice in the state has typicallyinvolved a basic standard of treatment deemed to be protective of human health, followed by discharge tosurface water bodies. Community and regulatory pressure to move to higher standards of treatment isbased on the presumption that a higher standard of treatment is more protective of the environment andsociety, and thus is more sustainable. This analysis tests that hypothesis forWestern Australian conditions.The merits of various wastewater treatment and discharge strategies are examined by quantifyingfinancial costs (capital and operations), and by monetising the wider environmental and social costs andbenefits of each option over an expanded planning horizon (30 years). Six technical treatment-disposaloptions were assessed at a test site, all of which met the fundamental criterion of protecting humanhealth. From a financial perspective, the current business-as-usual option is preferred e it is the least costsolution. However, valuing externalities such as water, greenhouse gases, ecological impacts andcommunity amenity, the status quo is revealed as sub-optimal. Advanced secondary treatment withstream disposal improves water quality and provides overall net benefit to society. All of the other optionswere net present value (NPV) negative. Sensitivity analysis shows that the favoured option outperforms allof the others under a wide range of financial and externality values and assumptions. Expanding thefindings across the state reveals that moving from the identified socially optimal level of treatment tohigher (tertiary) levels of treatment would result in a net loss to society equivalent to several hundredmillion dollars. In other words, everyone benefits from improving treatment to the optimum point. Butsociety, the environment, and the Corporation are all worse off when treatment levels are pushed beyondwhat is economic and sustainable.
� 2012 Elsevier Ltd. All rights reserved.
1. Introduction
1.1. Background e towards more sustainable decision-making
Despite overwhelming evidence of the need to conduct ouraffairs more sustainably (United States Committee on Environmentand Natural Resources and the US National Science and TechnologyCouncil, 2008; Intergovernmental Panel on Climate Change (IPCC),2007; United Nations, 2002; UNEP, 2007), most decision-making inbusiness and industry continues to rely heavily, and in many cases
�, Level 7, QV1 Building, 250stralia(P.E. Hardisty).
All rights reserved.
exclusively, on traditional financial analysis. Such analysis typicallydoes not ascribe monetary value to assets that are external to theproject (Hardisty, 2010). These “externalities” can include the valueof ecosystems and wild lands damaged by the project, waterresources polluted or wasted, effects of atmospheric pollution oncommunities, agriculture and ecosystems, damage driven byemissions of climate changing greenhouse gases (GHG), andimpacts on community amenity, among others. Worldwide, anincreasingly significant body of work has begun to estimatemonetary values for a wide range of social externalities, andnumerous organisations have begun to call for externalities to beincluded in project analysis (WorldWatch Institute, 2008).However, until very recently, there has been little effort to includeexternalities in decision-making analysis in business and industry.Decisions at all levels are still based largely on net present value
P.E. Hardisty et al. / Journal of Environmental Management 114 (2013) 285e292286
and internal rate of return expectations that do not include anyaccounting for the value of natural assets damaged, lost, or used inthe process, or the social benefits or damages suffered as a result ofproject implementation.
Moving towards greater sustainability requires that decision-making evolve to deal explicitly and quantitatively with these socalled “externalities”. By monetising impacts on external assets andbringing them into the economic analysis, on a full life-cycle basis,decision-makers can optimise not only profit, but overall humanwelfare and a multitude of other competing environmental andsocial issues (Hardisty, 2010).
1.2. Treatment and discharge of wastewater
The Water Corporation of Western Australia (Water Corp)manages the treatment and disposal of wastewater throughout thestate. Some regional wastewater treatment plants (WWTPs)discharge wastewater, treated to various standards, to localwatercourses. Increasingly, the WA environmental regulatorexpects a “year-round no discharge to stream” approach to treatedwastewater disposal. However, this approach will involve signifi-cant additional cost, as it requires either high levels of treatment orconstruction of dams for wastewater storage, either for evaporationor reuse. An effective and sustainable treatment and disposalapproach for the state’s regional WWTPs must address the energyrequirements of the treatment and disposal process, the value ofthe water being disposed of, and find economic and realistic longterm solutions for disposal or reuse that do not cause adverseimpacts to the environment.
Under conventional financial analysis, decisions on whether tomove to higher levels of treatment would be based on the costs ofconstruction and operation, set against tariff-based revenues, anda policy-based treatment standard. This paper examines theapplication of a wider decision-making perspective to the waste-water treatment and disposal issue in the state, by examining theoverall social economics and sustainability of various treatmentand disposal options at one of the Corporation’s facilities.
2. Method
2.1. Environmental and economic sustainability assessment
The analysis was conducted using the environmental andeconomic sustainability assessment method (EESA), based on aneconomic model for assessing the benefits of environmental andsocial protection presented by Hardisty and Ozdemiroglu (2005),following conceptual approaches espoused by a number ofgovernment organisations worldwide (DEFRA, 2007). This processexplicitly describes and measures sustainability in economic terms,by monetising external costs and benefits as possible and appro-priate, and adding these to the private costs and benefits ofa proposed project or action, across the asset life-cycle. Funda-mentally, the process aims to optimize financial, environmentaland societal (or “triple bottom line”) costs and benefits, and allowssustainability risks and opportunities to be quantified in hard,monetary terms. This provides explicit quantification in NPV termsof a triple bottom line approach, quantifying sustainability toinform decision making, using the language of money (Hardisty,2010).
The analysis presented was completed using the WorleyParsonsEcoNomics� DELTDTM software, which has been developed basedon the method described above (Hardisty et al., 2009). A keycomponent of the process involves a comprehensive sensitivityanalysis, in which the focus moves away from a specific estimate ofNPV for each option and towards the ranking of options in relative
terms, and more importantly, identification of a clearly optimalsolution (or solutions) over a wide range of possible future condi-tions and values for the key governing parameters. As such, mon-etisation can be seen as an intermediate step in the EESA, onewhich values all of the elements that make up an option and theirimpacts in a common unit, in a way that reflects how society valuesthose elements, providing a measure of human welfare (the ulti-mate definition of economics). The goal of the assessment is toidentify the option which maximises human welfare, optimally,over a large range of likely future conditions, within a reasonablerange of uncertainty.
This analysis considers only the costs and benefits associatedwith the various options designed to manage the treatment anddisposal of wastewater from the plant, and does not look at thewider WWTP operations. The baseline for comparison and mone-tisation is the current minimum operating condition where facul-tative pond treatment is in place (thus the capital costs of sucha treatment methodology are sunk costs). If an external asset isdamaged by implementation of a particular option, this damageappears as an external cost (or dis-benefit). If the value of the assetis maintained as it is (undamaged), then there is no effect, and nobenefit or dis-benefit is created. So, for example, if a water resourceis left intact, in place, the current ecological support and optionvalues of the water remain, and there is no benefit or dis-benefitimputed into the analysis. If native bushland, as another example,is cleared, an external cost is imputed.
2.2. Treatment and discharge options
A range of options for managing wastewater treatment anddischarge were developed by a multi-stakeholder team comprisingrepresentatives from engineering, environment, sustainability,finance and project management disciplines within the utility. Theoptions were assessed and compared for a major WWTP site inWestern Australia, for which appropriate background data wereavailable. This particular site, located within a coastal communityknown for its high quality beaches and tourism, was faced withrising community and regulatory pressure to move to drinkingwater quality discharge to local streams. Because the receivingstreams discharge to the sea within the town’s limits, publicconcerns centred upon perceived degradation of coastal waterquality, and impacts on tourism associated with odour and biodi-versity loss in the bay.
A total of six treatment-disposal options were generated forcomparative analysis, representing a range of effluent qualities, notall of which meet the community’s stated desires. In order ofincreasing capital cost, they were: 1) Facultative Pond Treatment,StreamDisposal. This option represents current business-as-usual atthe site, is protective of human health, but provides the lowest levelof treatment of the alternatives considered. It achieves theminimum discharge standard currently permitted by the regulator.2) Advanced Secondary Treatment, Stream Disposal. This optioninvolves treatment of wastewater using an intermittently-decantedextended aeration plant with sand filtration and UV disinfection.Water is treated to a higher standard than option 1, and disposed tothe environment. Capital cost and energy demands are higher thanoption 1, but a higher quality effluent is delivered to the receivingenvironment (see below), which may be more acceptable toexternal stakeholders. 3) Facultative Pond Treatment, Disposal to anEvaporation Pond. Inclusion of evaporation ponds at several loca-tions in the state has allowed the Corporation to meet local expec-tations of zero discharge to the environment. All treatedwastewateris contained within the pond, and under normal operations there isno continuous discharge to local waterways. 4) Facultative PondTreatment with Disposal to Storage Dam, Sale of Water. Storage dams
P.E. Hardisty et al. / Journal of Environmental Management 114 (2013) 285e292 287
have also been used in Western Australia as a means of preventingcontinuous discharge to the local environment. Stored water canalso be sold to local users, if demand exists. 5) Tertiary Treatment,Stream Disposal. This option adds RO to the secondary treatmentpackage described above. It meets community expectation bytreating wastewater to drinking water quality. It is not an optionthat has been extensively used inWA in the past, primarily due to itshigh cost and significant energy requirements. However, there isstrong public interest in this higher level of treatment in manycommunities in the state (in most cases not accompanied by anequally enthusiastic willingness to pay). 6) Tertiary Treatment,Disposal to Storage Dam and Sale of Water. This option provides thehighest level of treatment, and the highest level of protection to theenvironment.
3. Analysis
3.1. Financial costs
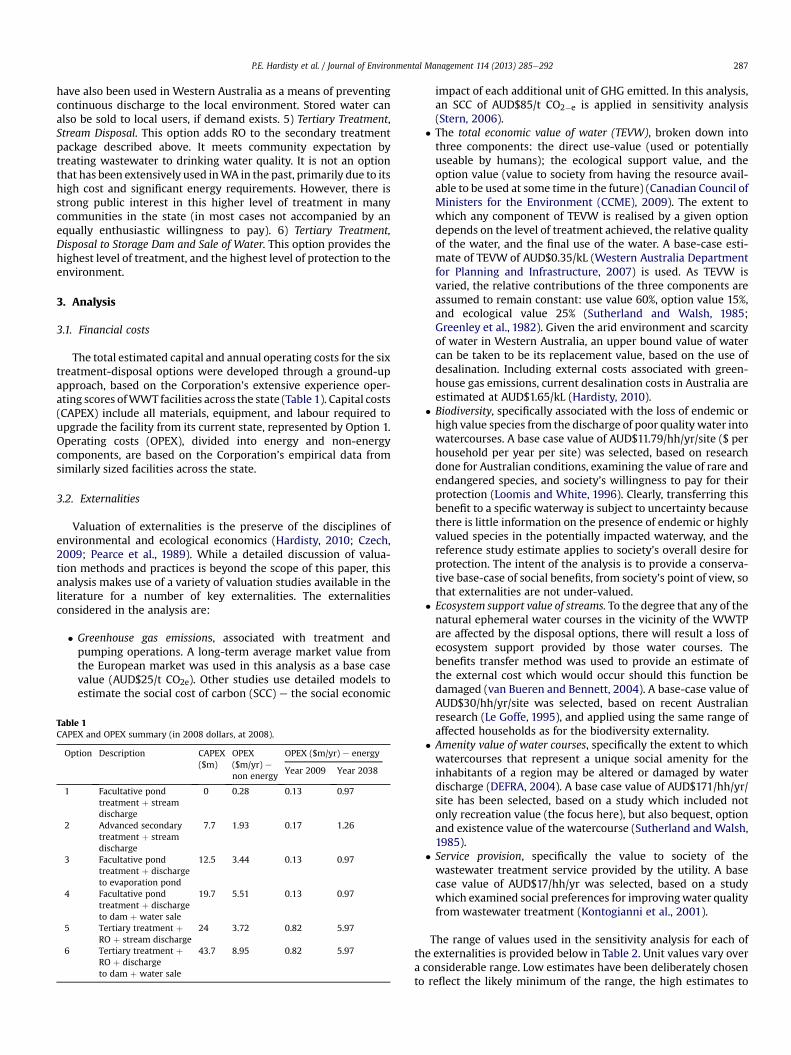
The total estimated capital and annual operating costs for the sixtreatment-disposal options were developed through a ground-upapproach, based on the Corporation’s extensive experience oper-ating scores ofWWT facilities across the state (Table 1). Capital costs(CAPEX) include all materials, equipment, and labour required toupgrade the facility from its current state, represented by Option 1.Operating costs (OPEX), divided into energy and non-energycomponents, are based on the Corporation’s empirical data fromsimilarly sized facilities across the state.
3.2. Externalities
Valuation of externalities is the preserve of the disciplines ofenvironmental and ecological economics (Hardisty, 2010; Czech,2009; Pearce et al., 1989). While a detailed discussion of valua-tion methods and practices is beyond the scope of this paper, thisanalysis makes use of a variety of valuation studies available in theliterature for a number of key externalities. The externalitiesconsidered in the analysis are:
� Greenhouse gas emissions, associated with treatment andpumping operations. A long-term average market value fromthe European market was used in this analysis as a base casevalue (AUD$25/t CO2e). Other studies use detailed models toestimate the social cost of carbon (SCC) e the social economic
Table 1CAPEX and OPEX summary (in 2008 dollars, at 2008).
Option Description CAPEX($m)
OPEX($m/yr) enon energy
OPEX ($m/yr) e energy
Year 2009 Year 2038
1 Facultative pondtreatment þ streamdischarge
0 0.28 0.13 0.97
2 Advanced secondarytreatment þ streamdischarge
7.7 1.93 0.17 1.26
3 Facultative pondtreatment þ dischargeto evaporation pond
12.5 3.44 0.13 0.97
4 Facultative pondtreatment þ dischargeto dam þ water sale
19.7 5.51 0.13 0.97
5 Tertiary treatment þRO þ stream discharge
24 3.72 0.82 5.97
6 Tertiary treatment þRO þ dischargeto dam þ water sale
43.7 8.95 0.82 5.97
impact of each additional unit of GHG emitted. In this analysis,an SCC of AUD$85/t CO2�e is applied in sensitivity analysis(Stern, 2006).
� The total economic value of water (TEVW), broken down intothree components: the direct use-value (used or potentiallyuseable by humans); the ecological support value, and theoption value (value to society from having the resource avail-able to be used at some time in the future) (Canadian Council ofMinisters for the Environment (CCME), 2009). The extent towhich any component of TEVW is realised by a given optiondepends on the level of treatment achieved, the relative qualityof the water, and the final use of the water. A base-case esti-mate of TEVW of AUD$0.35/kL (Western Australia Departmentfor Planning and Infrastructure, 2007) is used. As TEVW isvaried, the relative contributions of the three components areassumed to remain constant: use value 60%, option value 15%,and ecological value 25% (Sutherland and Walsh, 1985;Greenley et al., 1982). Given the arid environment and scarcityof water in Western Australia, an upper bound value of watercan be taken to be its replacement value, based on the use ofdesalination. Including external costs associated with green-house gas emissions, current desalination costs in Australia areestimated at AUD$1.65/kL (Hardisty, 2010).
� Biodiversity, specifically associated with the loss of endemic orhigh value species from the discharge of poor quality water intowatercourses. A base case value of AUD$11.79/hh/yr/site ($ perhousehold per year per site) was selected, based on researchdone for Australian conditions, examining the value of rare andendangered species, and society’s willingness to pay for theirprotection (Loomis and White, 1996). Clearly, transferring thisbenefit to a specific waterway is subject to uncertainty becausethere is little information on the presence of endemic or highlyvalued species in the potentially impacted waterway, and thereference study estimate applies to society’s overall desire forprotection. The intent of the analysis is to provide a conserva-tive base-case of social benefits, from society’s point of view, sothat externalities are not under-valued.
� Ecosystem support value of streams. To the degree that any of thenatural ephemeral water courses in the vicinity of the WWTPare affected by the disposal options, there will result a loss ofecosystem support provided by those water courses. Thebenefits transfer method was used to provide an estimate ofthe external cost which would occur should this function bedamaged (van Bueren and Bennett, 2004). A base-case value ofAUD$30/hh/yr/site was selected, based on recent Australianresearch (Le Goffe, 1995), and applied using the same range ofaffected households as for the biodiversity externality.
� Amenity value of water courses, specifically the extent to whichwatercourses that represent a unique social amenity for theinhabitants of a region may be altered or damaged by waterdischarge (DEFRA, 2004). A base case value of AUD$171/hh/yr/site has been selected, based on a study which included notonly recreation value (the focus here), but also bequest, optionand existence value of the watercourse (Sutherland andWalsh,1985).
� Service provision, specifically the value to society of thewastewater treatment service provided by the utility. A basecase value of AUD$17/hh/yr was selected, based on a studywhich examined social preferences for improvingwater qualityfrom wastewater treatment (Kontogianni et al., 2001).
The range of values used in the sensitivity analysis for each ofthe externalities is provided below in Table 2. Unit values vary overa considerable range. Low estimates have been deliberately chosento reflect the likely minimum of the range, the high estimates to
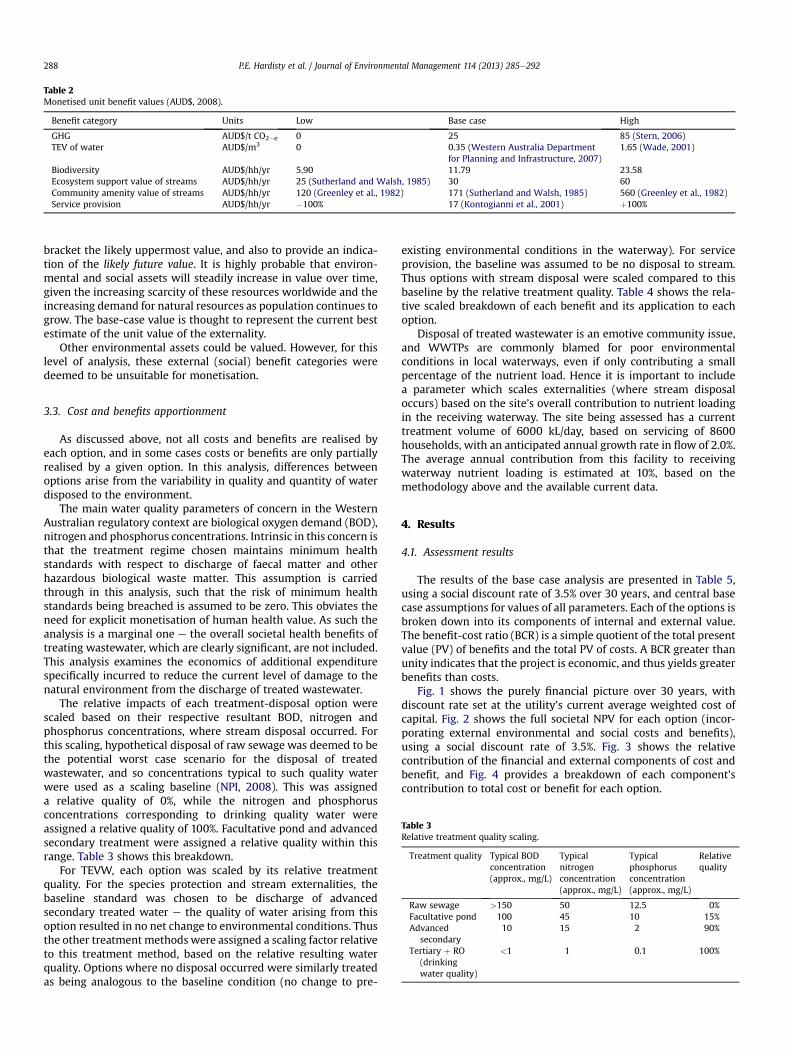
Table 2Monetised unit benefit values (AUD$, 2008).
Benefit category Units Low Base case High
GHG AUD$/t CO2�e 0 25 85 (Stern, 2006)TEV of water AUD$/m3 0 0.35 (Western Australia Department
for Planning and Infrastructure, 2007)1.65 (Wade, 2001)
Biodiversity AUD$/hh/yr 5.90 11.79 23.58Ecosystem support value of streams AUD$/hh/yr 25 (Sutherland and Walsh, 1985) 30 60Community amenity value of streams AUD$/hh/yr 120 (Greenley et al., 1982) 171 (Sutherland and Walsh, 1985) 560 (Greenley et al., 1982)Service provision AUD$/hh/yr �100% 17 (Kontogianni et al., 2001) þ100%
P.E. Hardisty et al. / Journal of Environmental Management 114 (2013) 285e292288
bracket the likely uppermost value, and also to provide an indica-tion of the likely future value. It is highly probable that environ-mental and social assets will steadily increase in value over time,given the increasing scarcity of these resources worldwide and theincreasing demand for natural resources as population continues togrow. The base-case value is thought to represent the current bestestimate of the unit value of the externality.
Other environmental assets could be valued. However, for thislevel of analysis, these external (social) benefit categories weredeemed to be unsuitable for monetisation.
Table 3Relative treatment quality scaling.
Treatment quality Typical BODconcentration(approx., mg/L)
Typicalnitrogenconcentration(approx., mg/L)
Typicalphosphorusconcentration(approx., mg/L)
Relativequality
Raw sewage >150 50 12.5 0%Facultative pond 100 45 10 15%Advanced
secondary10 15 2 90%
Tertiary þ RO(drinkingwater quality)
<1 1 0.1 100%
3.3. Cost and benefits apportionment
As discussed above, not all costs and benefits are realised byeach option, and in some cases costs or benefits are only partiallyrealised by a given option. In this analysis, differences betweenoptions arise from the variability in quality and quantity of waterdisposed to the environment.
The main water quality parameters of concern in the WesternAustralian regulatory context are biological oxygen demand (BOD),nitrogen and phosphorus concentrations. Intrinsic in this concern isthat the treatment regime chosen maintains minimum healthstandards with respect to discharge of faecal matter and otherhazardous biological waste matter. This assumption is carriedthrough in this analysis, such that the risk of minimum healthstandards being breached is assumed to be zero. This obviates theneed for explicit monetisation of human health value. As such theanalysis is a marginal one e the overall societal health benefits oftreating wastewater, which are clearly significant, are not included.This analysis examines the economics of additional expenditurespecifically incurred to reduce the current level of damage to thenatural environment from the discharge of treated wastewater.
The relative impacts of each treatment-disposal option werescaled based on their respective resultant BOD, nitrogen andphosphorus concentrations, where stream disposal occurred. Forthis scaling, hypothetical disposal of raw sewage was deemed to bethe potential worst case scenario for the disposal of treatedwastewater, and so concentrations typical to such quality waterwere used as a scaling baseline (NPI, 2008). This was assigneda relative quality of 0%, while the nitrogen and phosphorusconcentrations corresponding to drinking quality water wereassigned a relative quality of 100%. Facultative pond and advancedsecondary treatment were assigned a relative quality within thisrange. Table 3 shows this breakdown.
For TEVW, each option was scaled by its relative treatmentquality. For the species protection and stream externalities, thebaseline standard was chosen to be discharge of advancedsecondary treated water e the quality of water arising from thisoption resulted in no net change to environmental conditions. Thusthe other treatment methods were assigned a scaling factor relativeto this treatment method, based on the relative resulting waterquality. Options where no disposal occurred were similarly treatedas being analogous to the baseline condition (no change to pre-
existing environmental conditions in the waterway). For serviceprovision, the baseline was assumed to be no disposal to stream.Thus options with stream disposal were scaled compared to thisbaseline by the relative treatment quality. Table 4 shows the rela-tive scaled breakdown of each benefit and its application to eachoption.
Disposal of treated wastewater is an emotive community issue,and WWTPs are commonly blamed for poor environmentalconditions in local waterways, even if only contributing a smallpercentage of the nutrient load. Hence it is important to includea parameter which scales externalities (where stream disposaloccurs) based on the site’s overall contribution to nutrient loadingin the receiving waterway. The site being assessed has a currenttreatment volume of 6000 kL/day, based on servicing of 8600households, with an anticipated annual growth rate in flow of 2.0%.The average annual contribution from this facility to receivingwaterway nutrient loading is estimated at 10%, based on themethodology above and the available current data.
4. Results
4.1. Assessment results
The results of the base case analysis are presented in Table 5,using a social discount rate of 3.5% over 30 years, and central basecase assumptions for values of all parameters. Each of the options isbroken down into its components of internal and external value.The benefit-cost ratio (BCR) is a simple quotient of the total presentvalue (PV) of benefits and the total PV of costs. A BCR greater thanunity indicates that the project is economic, and thus yields greaterbenefits than costs.
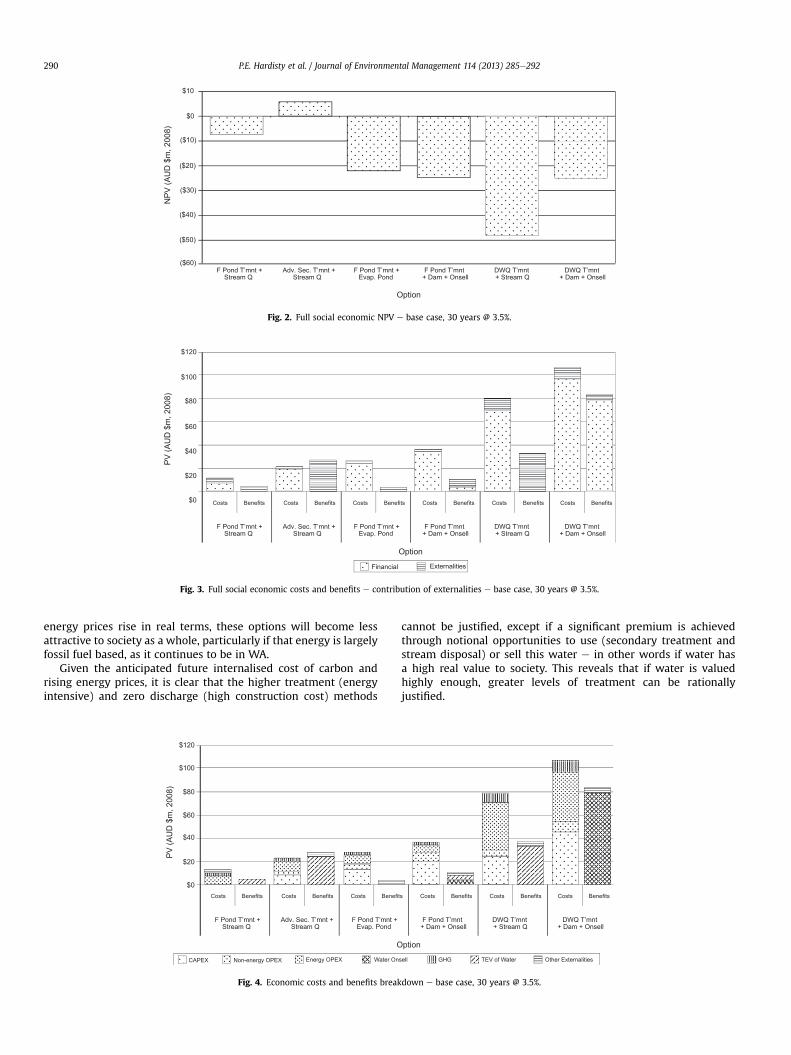
Fig. 1 shows the purely financial picture over 30 years, withdiscount rate set at the utility’s current average weighted cost ofcapital. Fig. 2 shows the full societal NPV for each option (incor-porating external environmental and social costs and benefits),using a social discount rate of 3.5%. Fig. 3 shows the relativecontribution of the financial and external components of cost andbenefit, and Fig. 4 provides a breakdown of each component’scontribution to total cost or benefit for each option.
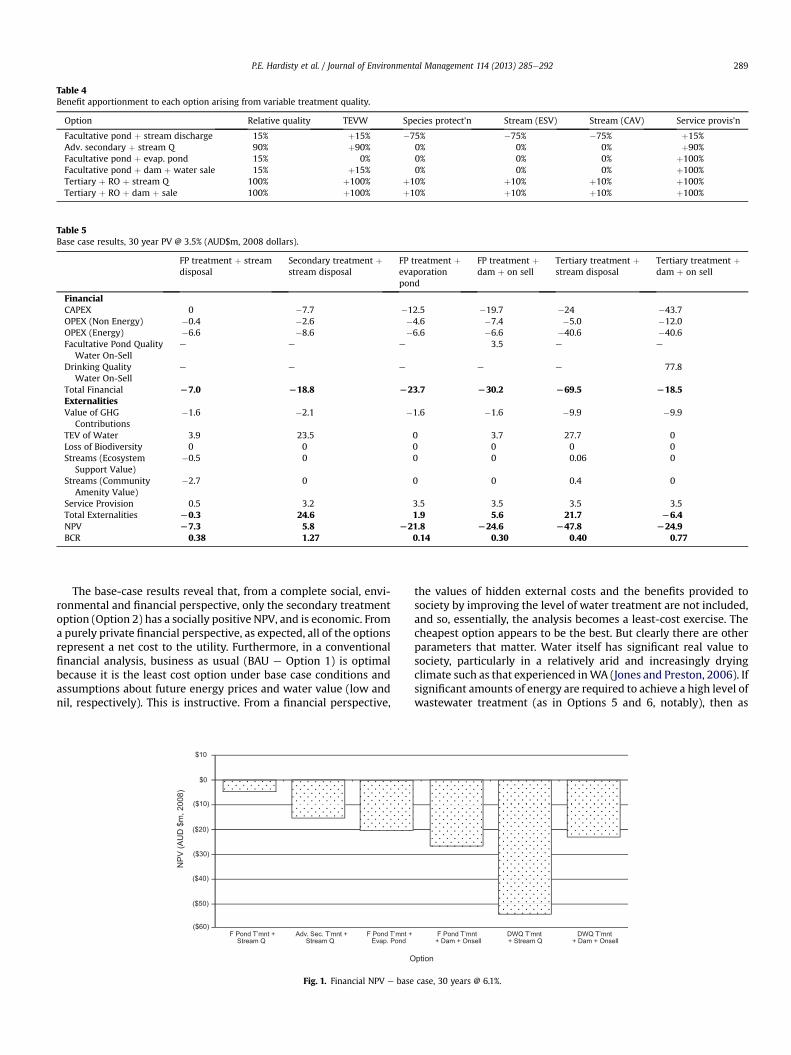
Table 4Benefit apportionment to each option arising from variable treatment quality.
Option Relative quality TEVW Species protect’n Stream (ESV) Stream (CAV) Service provis’n
Facultative pond þ stream discharge 15% þ15% �75% �75% �75% þ15%Adv. secondary þ stream Q 90% þ90% 0% 0% 0% þ90%Facultative pond þ evap. pond 15% 0% 0% 0% 0% þ100%Facultative pond þ dam þ water sale 15% þ15% 0% 0% 0% þ100%Tertiary þ RO þ stream Q 100% þ100% þ10% þ10% þ10% þ100%Tertiary þ RO þ dam þ sale 100% þ100% þ10% þ10% þ10% þ100%
Table 5Base case results, 30 year PV @ 3.5% (AUD$m, 2008 dollars).
FP treatment þ streamdisposal
Secondary treatment þstream disposal
FP treatment þevaporationpond
FP treatment þdam þ on sell
Tertiary treatment þstream disposal
Tertiary treatment þdam þ on sell
FinancialCAPEX 0 �7.7 �12.5 �19.7 �24 �43.7OPEX (Non Energy) �0.4 �2.6 �4.6 �7.4 �5.0 �12.0OPEX (Energy) �6.6 �8.6 �6.6 �6.6 �40.6 �40.6Facultative Pond Quality
Water On-Selle e e 3.5 e e
Drinking QualityWater On-Sell
e e e e e 77.8
Total Financial L7.0 L18.8 L23.7 L30.2 L69.5 L18.5ExternalitiesValue of GHG
Contributions�1.6 �2.1 �1.6 �1.6 �9.9 �9.9
TEV of Water 3.9 23.5 0 3.7 27.7 0Loss of Biodiversity 0 0 0 0 0 0Streams (Ecosystem
Support Value)�0.5 0 0 0 0.06 0
Streams (CommunityAmenity Value)
�2.7 0 0 0 0.4 0
Service Provision 0.5 3.2 3.5 3.5 3.5 3.5Total Externalities L0.3 24.6 1.9 5.6 21.7 L6.4NPV L7.3 5.8 L21.8 L24.6 L47.8 L24.9BCR 0.38 1.27 0.14 0.30 0.40 0.77
P.E. Hardisty et al. / Journal of Environmental Management 114 (2013) 285e292 289
The base-case results reveal that, from a complete social, envi-ronmental and financial perspective, only the secondary treatmentoption (Option 2) has a socially positive NPV, and is economic. Froma purely private financial perspective, as expected, all of the optionsrepresent a net cost to the utility. Furthermore, in a conventionalfinancial analysis, business as usual (BAU e Option 1) is optimalbecause it is the least cost option under base case conditions andassumptions about future energy prices and water value (low andnil, respectively). This is instructive. From a financial perspective,
$10
$0
($30)
($20)
($40)
($50)
($60)
($10)
NPV
(AU
D $
m, 2
008)
F Pond T’mnt +Stream Q
Adv. Sec. T’mnt +Stream Q
F Pond T’mnt +Evap. Pond
O
Fig. 1. Financial NPV e base
the values of hidden external costs and the benefits provided tosociety by improving the level of water treatment are not included,and so, essentially, the analysis becomes a least-cost exercise. Thecheapest option appears to be the best. But clearly there are otherparameters that matter. Water itself has significant real value tosociety, particularly in a relatively arid and increasingly dryingclimate such as that experienced inWA (Jones and Preston, 2006). Ifsignificant amounts of energy are required to achieve a high level ofwastewater treatment (as in Options 5 and 6, notably), then as
F Pond T’mnt + Dam + Onsell
DWQ T’mnt + Stream Q
DWQ T’mnt+ Dam + Onsell
ption
case, 30 years @ 6.1%.
$10
$0
($30)
($20)
($40)
($50)
($60)
($10)
NPV
(AU
D $
m, 2
008)
F Pond T’mnt +Stream Q
Adv. Sec. T’mnt +Stream Q
F Pond T’mnt +Evap. Pond
F Pond T’mnt + Dam + Onsell
DWQ T’mnt + Stream Q
DWQ T’mnt+ Dam + Onsell
Option
Fig. 2. Full social economic NPV e base case, 30 years @ 3.5%.
$120
$0
$40
$60
$20
$100
$80
PV (A
UD
$m
, 200
8)
F Pond T’mnt +Stream Q
Adv. Sec. T’mnt +Stream Q
F Pond T’mnt +Evap. Pond
F Pond T’mnt + Dam + Onsell
DWQ T’mnt + Stream Q
DWQ T’mnt+ Dam + Onsell
Option
Costs Benefits Costs Benefits Costs Benefits Costs Benefits Costs Benefits Costs Benefits
Financial Externalities
Fig. 3. Full social economic costs and benefits e contribution of externalities e base case, 30 years @ 3.5%.
P.E. Hardisty et al. / Journal of Environmental Management 114 (2013) 285e292290
energy prices rise in real terms, these options will become lessattractive to society as a whole, particularly if that energy is largelyfossil fuel based, as it continues to be in WA.
Given the anticipated future internalised cost of carbon andrising energy prices, it is clear that the higher treatment (energyintensive) and zero discharge (high construction cost) methods
$120
$0
$40
$60
$20
$100
$80
PV (A
UD
$m
, 200
8)
F Pond T’mnt +Stream Q
Adv. Sec. T’mnt +Stream Q
F Pond T’mnt +Evap. Pond
O
Costs Benefits Costs Benefits Costs Benefi
CAPEX Non-energy OPEX Energy OPEX Water On
Fig. 4. Economic costs and benefits break
cannot be justified, except if a significant premium is achievedthrough notional opportunities to use (secondary treatment andstream disposal) or sell this water e in other words if water hasa high real value to society. This reveals that if water is valuedhighly enough, greater levels of treatment can be rationallyjustified.
F Pond T’mnt + Dam + Onsell
DWQ T’mnt + Stream Q
DWQ T’mnt+ Dam + Onsell
ption
ts Costs Benefits Costs Benefits Costs Benefits
Other Externalitiessell GHG TEV of Water
down e base case, 30 years @ 3.5%.
P.E. Hardisty et al. / Journal of Environmental Management 114 (2013) 285e292 291
The full social economic analysis only reinforces this view. Boththe current minimum cost option (pond treatment and streamdisposal) currently used by the utility, and the regulator andcommunity favoured options (no stream disposal or drinking waterquality disposal) are NPV negative e society, on the margin, losesmore than it gains with either of these two approaches, for differentreasons. The lowest cost option does not achieve a level of envi-ronmental protection which optimises environmental or watervalue, and the higher cost options (Options 5 and 6) require more inthe way of energy, steel, and concrete and produce too much in theway of secondary damage (greenhouse gas emissions), to justify theimprovements in environmental and water quality. In fact, themore expensive options, from an overall societal point of view,result in a significant reduction in overall human welfare (stronglyNPV negative). However, as is clearly shown in Fig. 2, there is anoptimum that lies somewhere between these two extremes, wheresociety benefits.
In this example, the base-case results suggest that Option 2 issuperior. But does this hold across a wide range of possibleparameter values that may hold today and in the future? It is onlyby examining all of the relevant costs and benefits, across the asset-life-cycle, that the overall relative performance of options can beassessed.
4.2. Sensitivity analysis
The discussion above is based on the base-case values for eachparameter. However, in a rapidly changing world, the costs ofcommodities in the market economy (such as energy, water,concrete, steel), as well as the estimated values of externalities(such as carbon, water, biodiversity), are almost certainly subject tovolatility over the 30 year planning horizon. If an option isfavourable over a wide range of parameter values, compared to theother possible options, then despite the overall uncertainty in theactual monetised NPV results, the option can be identified assuperior to its competitors. This is particularly useful whenconsidering sustainability, which, by definition, is concerned withthe future (which is inherently uncertain).
Pond + Strm ASec + Strm Pond + Evap100
90
80
70
60
50
40
30
20
10
0-150M -100M -50M
Cum
ul. P
rob
(%)
NP
Fig. 5. Absolute NPV cum
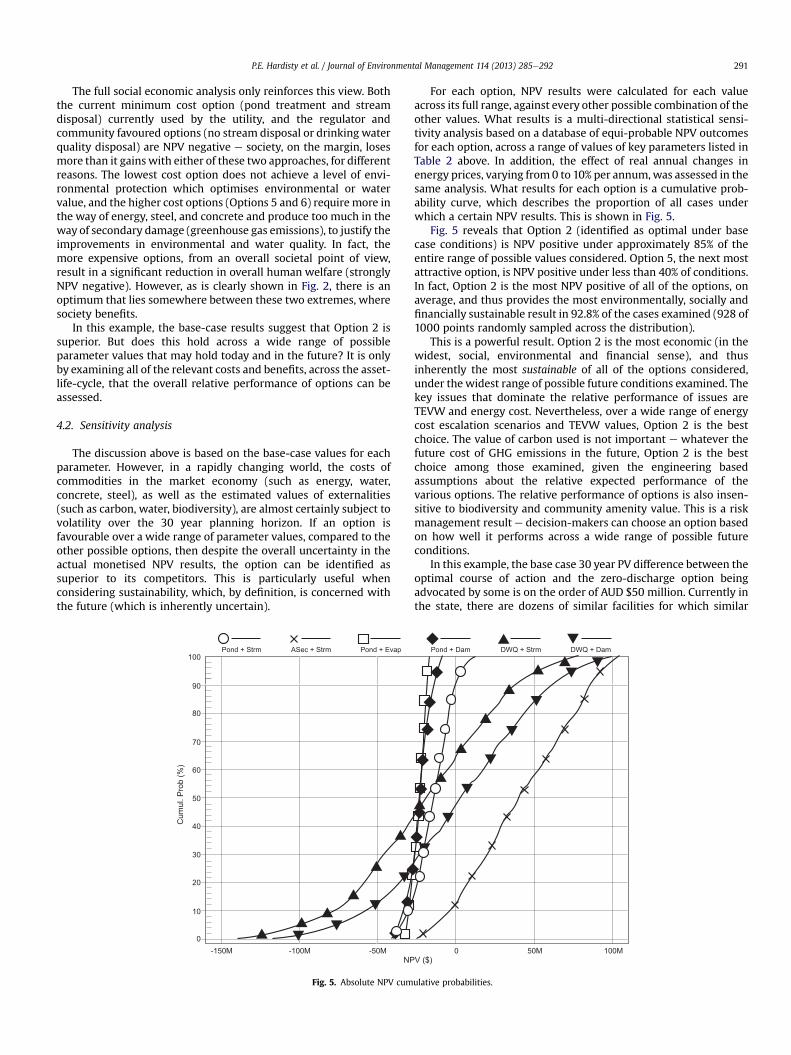
For each option, NPV results were calculated for each valueacross its full range, against every other possible combination of theother values. What results is a multi-directional statistical sensi-tivity analysis based on a database of equi-probable NPV outcomesfor each option, across a range of values of key parameters listed inTable 2 above. In addition, the effect of real annual changes inenergy prices, varying from0 to 10% per annum,was assessed in thesame analysis. What results for each option is a cumulative prob-ability curve, which describes the proportion of all cases underwhich a certain NPV results. This is shown in Fig. 5.
Fig. 5 reveals that Option 2 (identified as optimal under basecase conditions) is NPV positive under approximately 85% of theentire range of possible values considered. Option 5, the next mostattractive option, is NPV positive under less than 40% of conditions.In fact, Option 2 is the most NPV positive of all of the options, onaverage, and thus provides the most environmentally, socially andfinancially sustainable result in 92.8% of the cases examined (928 of1000 points randomly sampled across the distribution).
This is a powerful result. Option 2 is the most economic (in thewidest, social, environmental and financial sense), and thusinherently the most sustainable of all of the options considered,under the widest range of possible future conditions examined. Thekey issues that dominate the relative performance of issues areTEVW and energy cost. Nevertheless, over a wide range of energycost escalation scenarios and TEVW values, Option 2 is the bestchoice. The value of carbon used is not important e whatever thefuture cost of GHG emissions in the future, Option 2 is the bestchoice among those examined, given the engineering basedassumptions about the relative expected performance of thevarious options. The relative performance of options is also insen-sitive to biodiversity and community amenity value. This is a riskmanagement result e decision-makers can choose an option basedon how well it performs across a wide range of possible futureconditions.
In this example, the base case 30 year PV difference between theoptimal course of action and the zero-discharge option beingadvocated by some is on the order of AUD $50 million. Currently inthe state, there are dozens of similar facilities for which similar
Pond + Dam DWQ + Strm DWQ + Dam
0 50M 100MV ($)
ulative probabilities.
P.E. Hardisty et al. / Journal of Environmental Management 114 (2013) 285e292292
upgrades might be contemplated. The effect of a state-wide zero-discharge policy would, by simple aggregation, result in a PV loss ofseveral hundreds of millions of dollars in value to society, comparedto an optimal policy.
5. Conclusions
The EESA (environmental and economic sustainability assess-ment) method was used to examine the overall sustainability ofa range of wastewater treatment and disposal options at WWTP inWestern Australia. The method explicitly monetizes all costs andbenefits over the asset’s lifetime, and then applies sensitivityanalysis to compare a range of possible options. In this case, a widerange of externalities were monetized and incorporated into theanalysis, including greenhouse gas emissions, the total economicvalue of water, biodiversity, and community amenity and servicevalues. NPV positive options are both economic and sustainable.NPV negative options are neither e society gives up more than itgains, and thus will not want to continue supporting a propositionover the long term.
The results revealed that the cheapest, business-as-usualapproach (which is widely used across the state, but which isincreasingly under scrutiny by regulators and communities), wasneither economic nor sustainable. However, the more energyintensive treatment options (including the use of tertiary treatmentand various zero-discharge measures) being advocated by regula-tors and some in the community were also found to be uneconomicand unsustainable. In between, an economic optimum existedwhere all parties benefited. This optimum, the application ofsecondary treatment in this example, can be justified economicallyand socially, and represents a sustainable optimum over a widerange of possible future conditions (including rising energy costs,higher carbon values, and rising value of water).
Sustainability as a notion is widely accepted, but poorly prac-ticed. In engineering and project delivery, this is particularly thecase. Even when decision-makers intuitively know the right andbest course of action, it is often not taken, usually because the“economics” don’t work. Typically, we fall back on what we know,andwhat has worked in the past. This analysis shows that unless allof the issues that matter in decision making e environmental,social and economic e are explicitly included in the analysis, andexamined over a wide range of possible future conditions anduncertainties, sub-optimal choices can result. Business-as-usualanalysis will continue to support business-as-usual decisions.
References
Canadian Council of Ministers for the Environment (CCME), 2009. Water ValuationGuidance: Development of a National Water Valuation Guidance Document.Report by WorleyParsons and Eftec. CCME Water Agenda DevelopmentCommittee, Ottawa.
Czech, B., 2009. Ecological economics; in animal and plant productivity. In:Hudson, R.J. (Ed.), Encyclopaedia of Life Support Systems (EOLSS). UNESCO.Eolss Publishers, Oxford.
DEFRA, 2004. Valuation of the External Costs and Benefits to Health and Environ-ment of Waste Management Options. DEFRA report, London.
DEFRA, 2007. An Introductory Guide to Valuing Ecosystems Services. UK Dept ofEnvironment, Food and Rural Affairs, London.
Greenley, D.A., Walsh, R.G., Young, R.A., 1982. Option value: empirical evidence froma case study of recreation and water quality: reply. Quarterly Journal ofEconomics 100 (1), 294e299.
Hardisty, P.E., Ozdemiroglu, E., 2005. The Economics of Groundwater Remediationand Protection. CRC Press, New York.
Hardisty, P.E., Sivapalan, M., Van Der Linden, S., Donohoo, S., 2009. WorleyParsonsEcoNomics� DELTDTM Toolset for Environmental, Social and Economic Life-cycle Modelling. WorleyParsons, Perth.
Hardisty, P.E., 2010. Environmental and Economic Sustainability. CRC Press, NewYork.
Intergovernmental Panel on Climate Change (IPCC), 2007. Fourth AssessmentReport. The Physical Science Basis. Cambridge University Press.
Jones, R.N., Preston, B.L., 2006. Climate Change Impacts, Risks and the Benefits ofMitigation. CSIRO, Canberra.
Kontogianni, A., Langford, I.H., Papandreou, A., Kourtos, M.S., 2001. Social Prefer-ences for Improving Water Quality: an Economic Analysis of Benefits fromWaste-water Treatment, Working Paper GEC 01e04, Centre for Social andEconomic Research on the Global Environment, School of EnvironmentalSciences, University of East Anglia.
Le Goffe, P., 1995. The benefits of improvements in coastal water quality: a contin-gent approach. Journal of Environmental Management 45 (4), 305e317.
Loomis, J.B., White, D.S., 1996. Economic benefits of rare and endangered species:summary and meta-analysis. Ecological Economics 18, 197e206.
NPI, 2008. Emission Estimation Technique Manual for Sewage and WastewaterTreatment. Commonwealth of Australia, Canberra.
Pearce, D., Markandya, A., Barbier, E., 1989. Blueprint for a Green Economy. Earth-scan, London.
Stern, N., 2006. The Economics of Climate Change e the Stern Review. CambridgeUniversity Press.
Sutherland, R.J., Walsh, R.G., 1985. Effect of distance on the preservation value ofwater quality. Land Economics 61 (3), 281e291.
UNEP, 2007. Global Environmental Outlook 4: Environment for Development (GEO-4). United Nations Environment Programme, Nairobi, Kenya.
United Nations, 2002. World Population Prospects. United Nations, New York.United States Committee on Environment and Natural Resources and the US
National Science and Technology Council, 2008. Scientific Assessment of theEffects of Global Change on the United States.
van Bueren, M., Bennett, J., 2004. Towards the development of a transferable set ofvalue estimates for environmental attributes. The Australian Journal of Agri-cultural and Resource Economics 48 (1), 1e32.
Wade, N.M., 2001. Distillation plant development and cost update. Desalination 136.Western Australia Department for Planning and Infrastructure, 2007. Guidance on
Water Valuation in the State of Western Australia. Perth.WorldWatch Institute, 2008. State of the World Report. D.C, Washington.