Embed Size (px)
Citation preview
1
Determine Volumes from Drawings
There are many methods to determine the volumes required for earthworks. In this course we will
be looking at;
1. Sum of Grid Method
2. Trapezoidal rule and
3. Simpson’s Rule
Sum of Grid Method
As this method implies, firstly you need a site plan that has the land divided into equal grids with the
spot heights at the grid points. This may be done either by your own observations of derived from a
contour drawing as in the previous assessment.
Next you need to determine the physical actual grid size in this case we measured the grid to be 5
meters x 5 metres. The grid width and length do not need to be equal but they need to be the same
in each direction and evenly divide the subject land.
Next you need to determine the formation height. The formation height is the Reduced Level that
your earth works is required to be finished at. Let’s say we want to level the site to a Reduced Level
of 100.500.
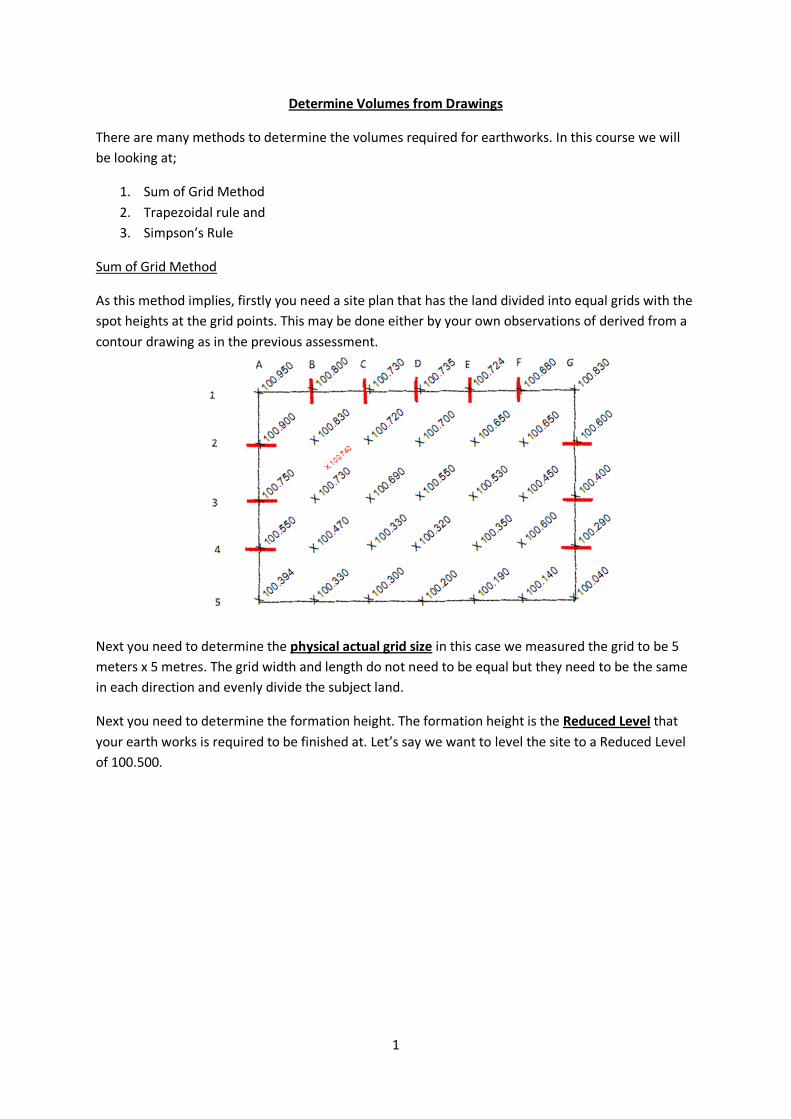
2
Now we prepare a table listing all the spot heights in the following manner.
We look at every grid spot height and list the following details about it.
1. Formation Height
2. Grid Spot Height
3. Number of Grid Squares the spot height appears in
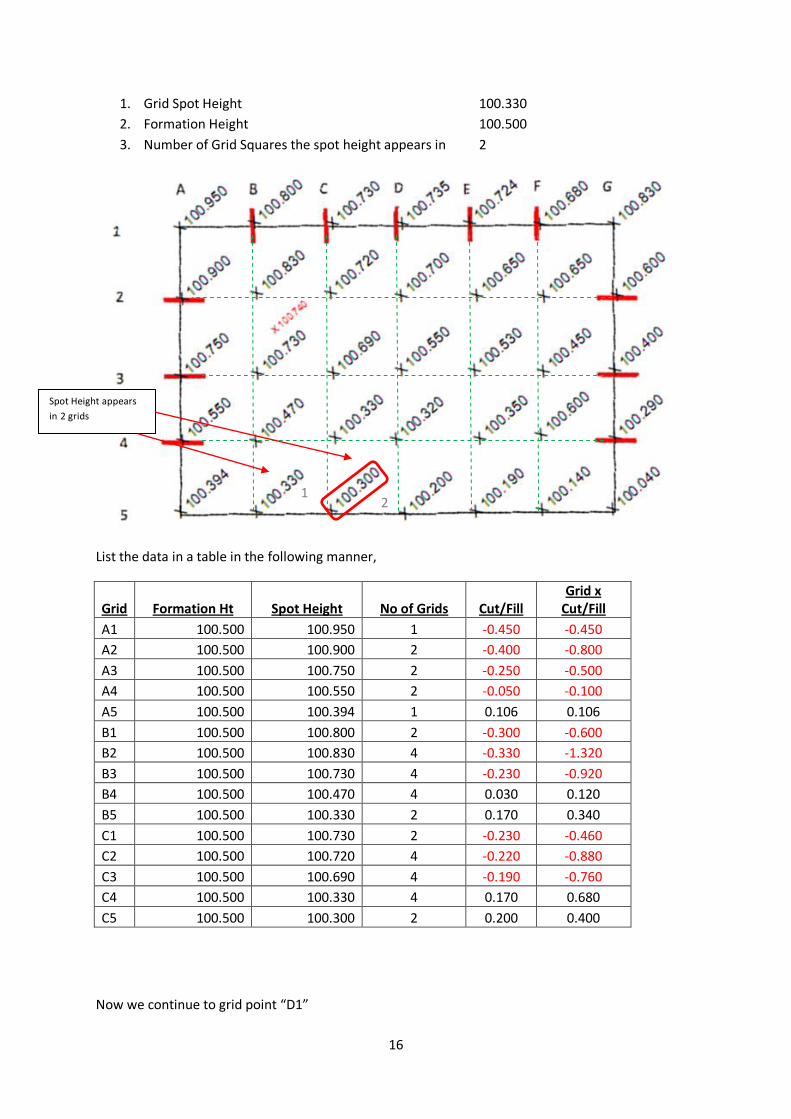
Let’s start with grid point “A1”.
1. Formation Height 100.500
2. Grid Spot Height 100.950
3. Number of Grid Squares the spot height appears in 1
List the data in a table in the following manner,
Grid Formation Ht Spot Height No of Grids Cut/Fill Grid x
Cut/Fill
A1 100.500 100.950 1 -0.450 -0.450
Then subtract the Spot Height from the Formation Height and place it in the cut & fill Column. Then
multiply the amount of “Cut/Fill” by the “Number of Grids” it appears in. Place the result in the last
column “Grid x Cut/Fill”.
Spot Height only
appears in this grid 1
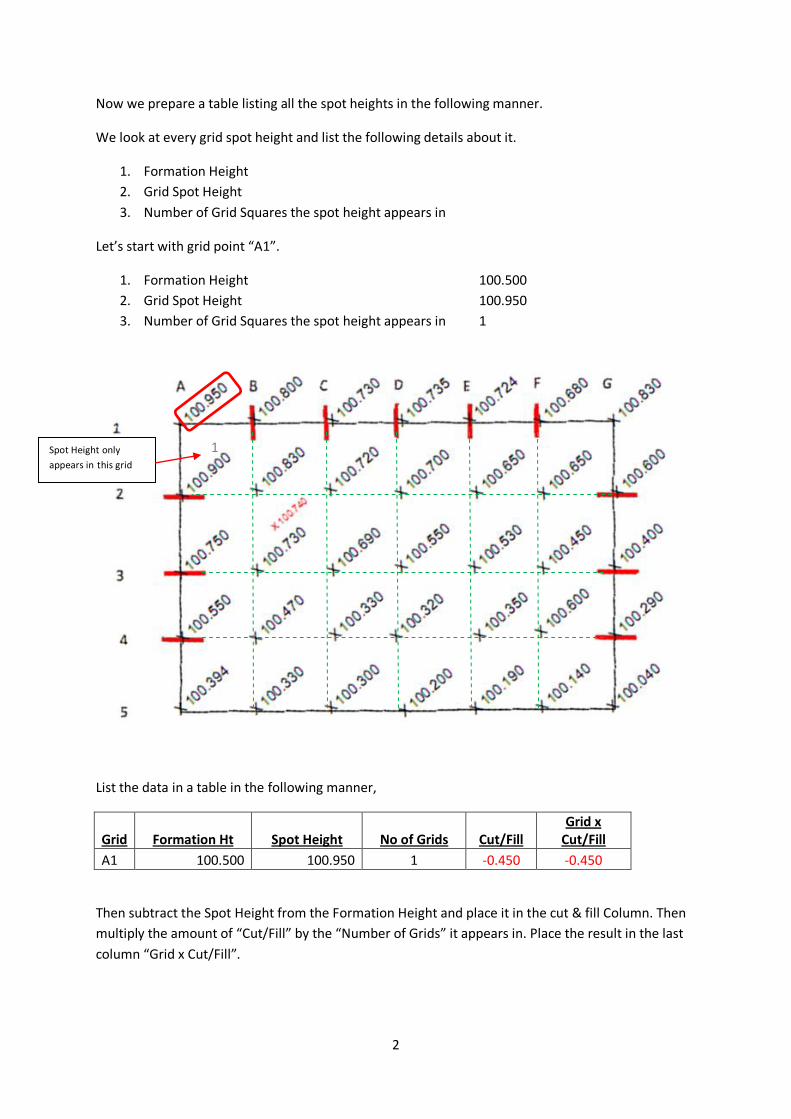
3
Next grid point “A2”.
1. Grid Spot Height 100.900
2. Formation Height 100.500
3. Number of Grid Squares the spot height appears in 2
List the data in a table in the following manner,
Grid Formation Ht Spot Height No of Grids Cut/Fill Grid x
Cut/Fill
A1 100.500 100.950 1 -0.450 -0.450
A2 100.500 100.900 2 -0.400 -0.800
Then subtract the Spot Height from the Formation Height and place it in the cut & fill Column. Then
multiply the amount of “Cut/Fill” by the “Number of Grids” it appears in. Place the result in the last
column “Grid x Cut/Fill”.
Repeat this process for every spot height.
Spot Height appears
in two grids
1
2
4
Next grid point “A3”.
1. Grid Spot Height 100.750
2. Formation Height 100.500
3. Number of Grid Squares the spot height appears in 2
List the data in a table in the following manner,
.
Grid Formation Ht Spot Height No of Grids Cut/Fill Grid x
Cut/Fill
A1 100.500 100.950 1 -0.450 -0.450
A2 100.500 100.900 2 -0.400 -0.800
A3 100.500 100.750 2 -0.250 -0.500
Spot Height appears
in two grids
1
2
5
Next grid point “A4”.
1. Grid Spot Height 100.550
2. Formation Height 100.500
3. Number of Grid Squares the spot height appears in 2
List the data in a table in the following manner,
Grid Formation Ht Spot Height No of Grids Cut/Fill Grid x
Cut/Fill
A1 100.500 100.950 1 -0.450 -0.450
A2 100.500 100.900 2 -0.400 -0.800
A3 100.500 100.750 2 -0.250 -0.500
A4 100.500 100.550 2 -0.050 -0.100
Spot Height appears
in two grids 1
2
6
To complete Grid A record grid point “A5”
Next grid point “A4”.
1. Grid Spot Height 100.394
2. Formation Height 100.500
3. Number of Grid Squares the spot height appears in 1
List the data in a table in the following manner,
Grid Formation Ht Spot Height No of Grids Cut/Fill Grid x
Cut/Fill
A1 100.500 100.950 1 -0.450 -0.450
A2 100.500 100.900 2 -0.400 -0.800
A3 100.500 100.750 2 -0.250 -0.500
A4 100.500 100.550 2 -0.050 -0.100
A5 100.500 100.394 1 0.106 0.106
Spot Height appears
in 1 grid
1
7
Now we continue to grid point “B1”
1. Grid Spot Height 100.800
2. Formation Height 100.500
3. Number of Grid Squares the spot height appears in 2
List the data in a table in the following manner,
Grid Formation Ht Spot Height No of Grids Cut/Fill Grid x
Cut/Fill
A1 100.500 100.950 1 -0.450 -0.450
A2 100.500 100.900 2 -0.400 -0.800
A3 100.500 100.750 2 -0.250 -0.500
A4 100.500 100.550 2 -0.050 -0.100
A5 100.500 100.394 1 0.106 0.106
B1 100.500 100.800 2 -0.300 -0.600
Spot Height appears
in two grids
1 2
8
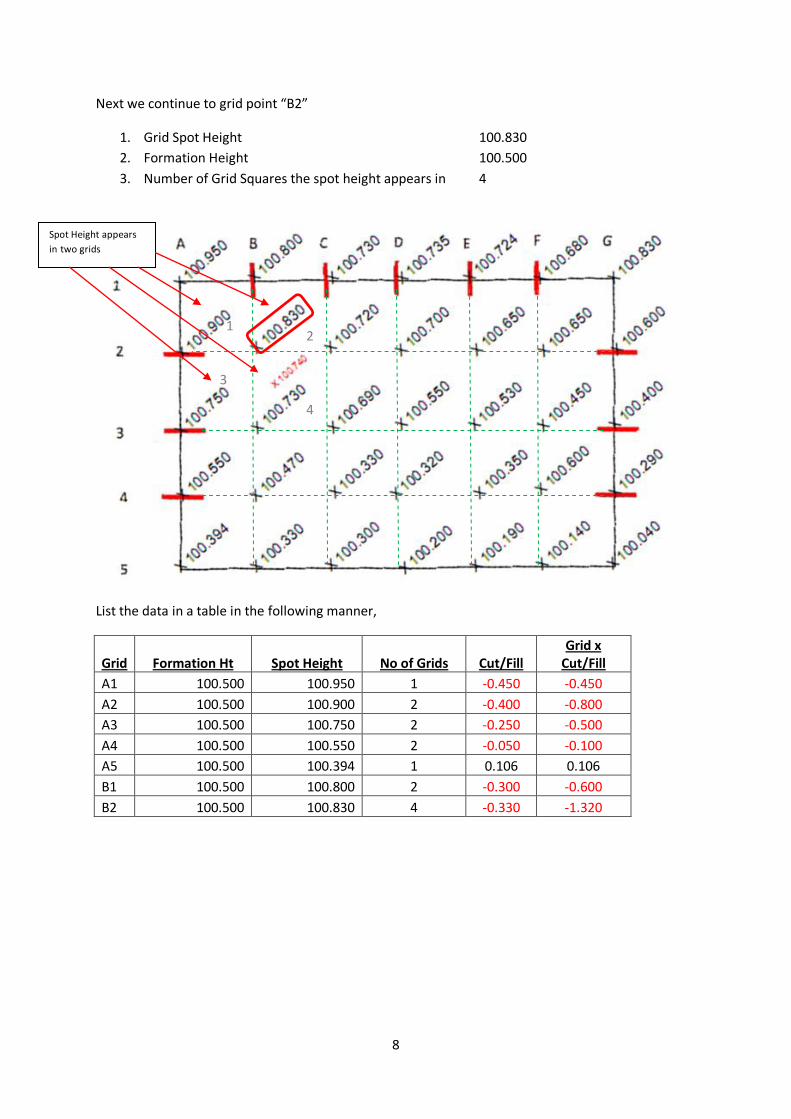
Next we continue to grid point “B2”
1. Grid Spot Height 100.830
2. Formation Height 100.500
3. Number of Grid Squares the spot height appears in 4
List the data in a table in the following manner,
Grid Formation Ht Spot Height No of Grids Cut/Fill Grid x
Cut/Fill
A1 100.500 100.950 1 -0.450 -0.450
A2 100.500 100.900 2 -0.400 -0.800
A3 100.500 100.750 2 -0.250 -0.500
A4 100.500 100.550 2 -0.050 -0.100
A5 100.500 100.394 1 0.106 0.106
B1 100.500 100.800 2 -0.300 -0.600
B2 100.500 100.830 4 -0.330 -1.320
Spot Height appears
in two grids
1 2
3
4
9
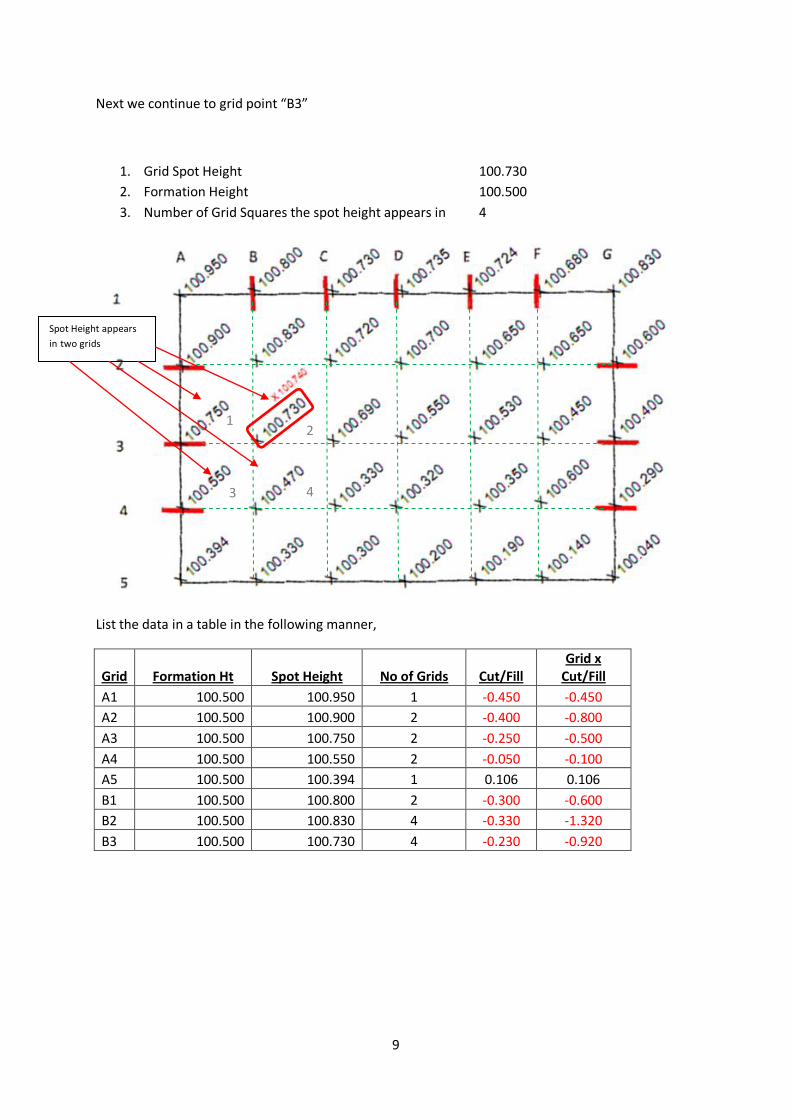
Next we continue to grid point “B3”
1. Grid Spot Height 100.730
2. Formation Height 100.500
3. Number of Grid Squares the spot height appears in 4
List the data in a table in the following manner,
Grid Formation Ht Spot Height No of Grids Cut/Fill Grid x
Cut/Fill
A1 100.500 100.950 1 -0.450 -0.450
A2 100.500 100.900 2 -0.400 -0.800
A3 100.500 100.750 2 -0.250 -0.500
A4 100.500 100.550 2 -0.050 -0.100
A5 100.500 100.394 1 0.106 0.106
B1 100.500 100.800 2 -0.300 -0.600
B2 100.500 100.830 4 -0.330 -1.320
B3 100.500 100.730 4 -0.230 -0.920
Spot Height appears
in two grids
1 2
3 4
10
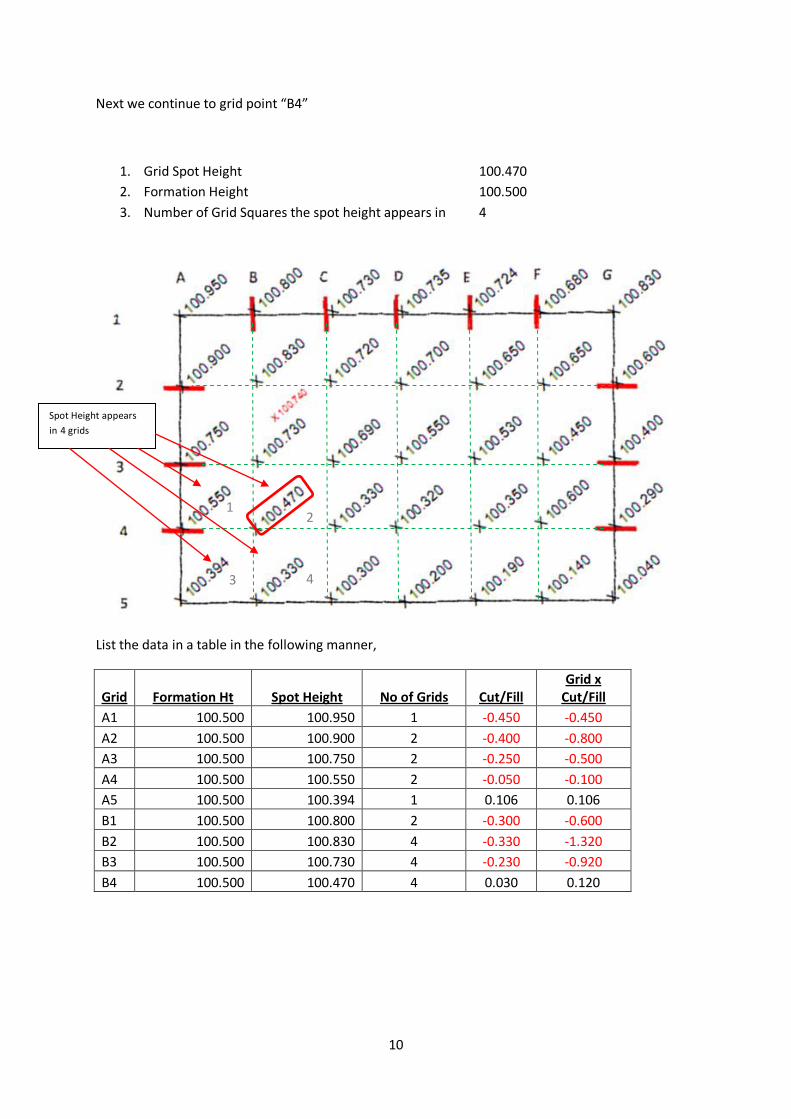
Next we continue to grid point “B4”
1. Grid Spot Height 100.470
2. Formation Height 100.500
3. Number of Grid Squares the spot height appears in 4
List the data in a table in the following manner,
Grid Formation Ht Spot Height No of Grids Cut/Fill Grid x
Cut/Fill
A1 100.500 100.950 1 -0.450 -0.450
A2 100.500 100.900 2 -0.400 -0.800
A3 100.500 100.750 2 -0.250 -0.500
A4 100.500 100.550 2 -0.050 -0.100
A5 100.500 100.394 1 0.106 0.106
B1 100.500 100.800 2 -0.300 -0.600
B2 100.500 100.830 4 -0.330 -1.320
B3 100.500 100.730 4 -0.230 -0.920
B4 100.500 100.470 4 0.030 0.120
Spot Height appears
in 4 grids
1 2
3 4
11
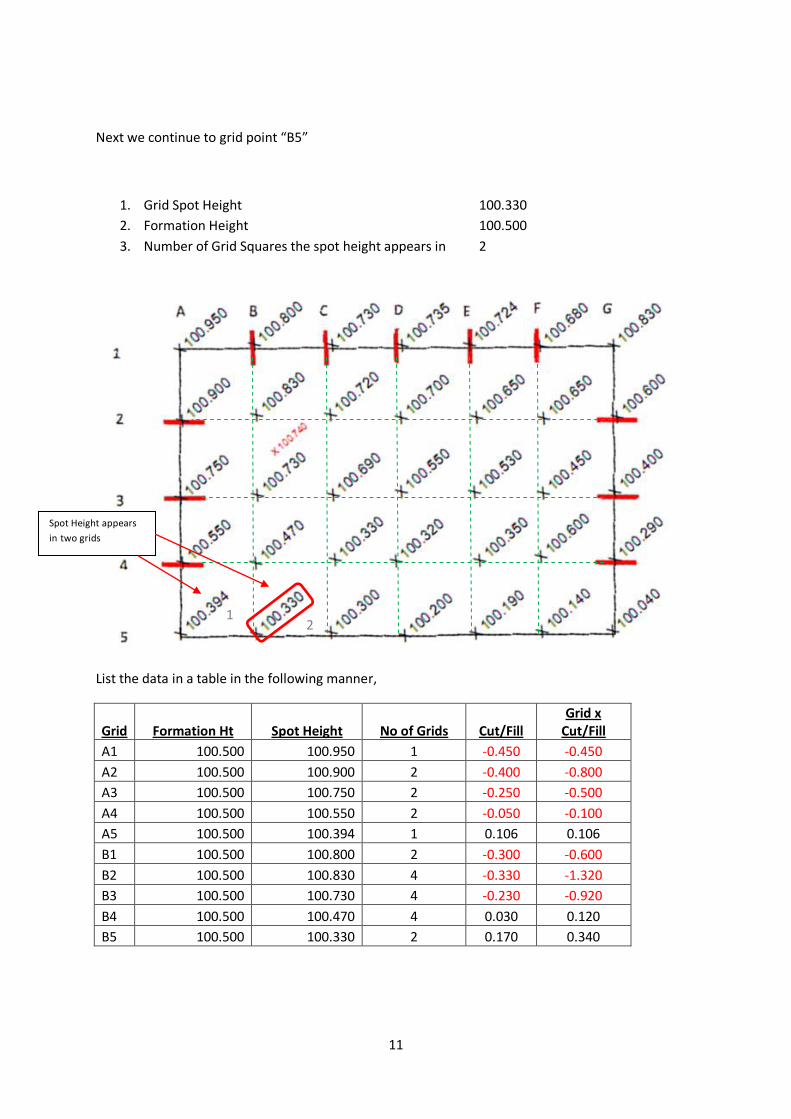
Next we continue to grid point “B5”
1. Grid Spot Height 100.330
2. Formation Height 100.500
3. Number of Grid Squares the spot height appears in 2
List the data in a table in the following manner,
Grid Formation Ht Spot Height No of Grids Cut/Fill Grid x
Cut/Fill
A1 100.500 100.950 1 -0.450 -0.450
A2 100.500 100.900 2 -0.400 -0.800
A3 100.500 100.750 2 -0.250 -0.500
A4 100.500 100.550 2 -0.050 -0.100
A5 100.500 100.394 1 0.106 0.106
B1 100.500 100.800 2 -0.300 -0.600
B2 100.500 100.830 4 -0.330 -1.320
B3 100.500 100.730 4 -0.230 -0.920
B4 100.500 100.470 4 0.030 0.120
B5 100.500 100.330 2 0.170 0.340
Spot Height appears
in two grids
1 2
12
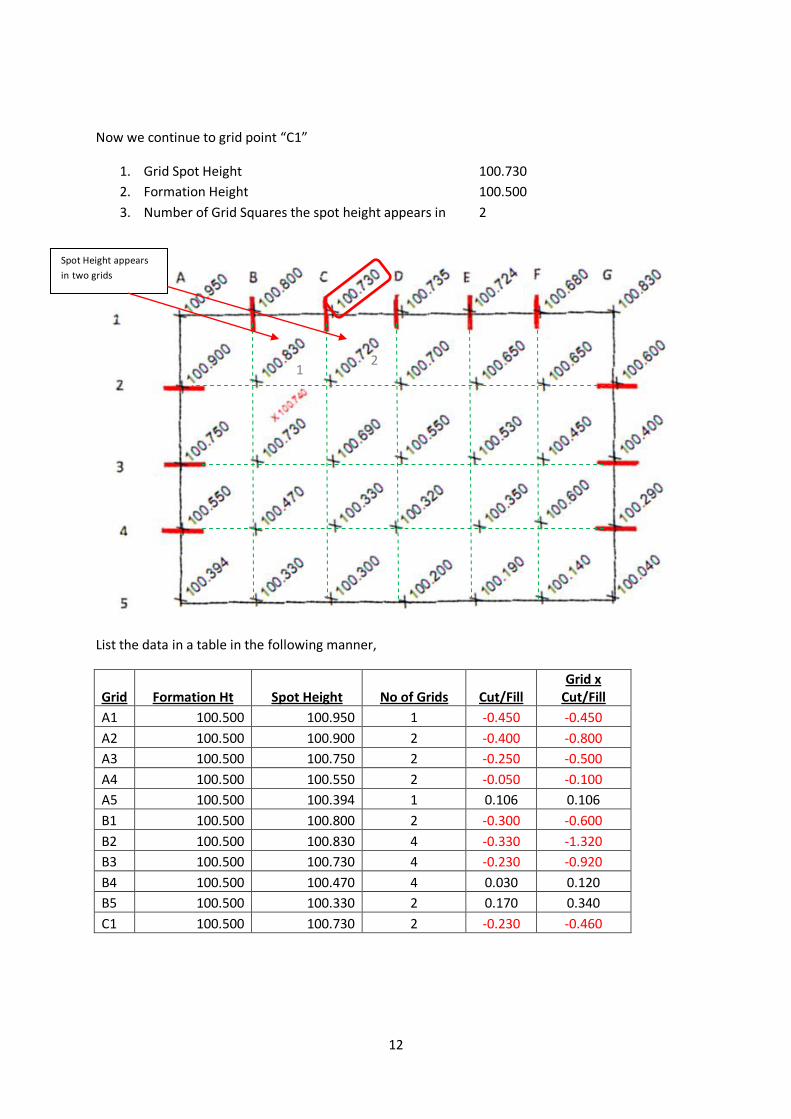
Now we continue to grid point “C1”
1. Grid Spot Height 100.730
2. Formation Height 100.500
3. Number of Grid Squares the spot height appears in 2
List the data in a table in the following manner,
Grid Formation Ht Spot Height No of Grids Cut/Fill Grid x
Cut/Fill
A1 100.500 100.950 1 -0.450 -0.450
A2 100.500 100.900 2 -0.400 -0.800
A3 100.500 100.750 2 -0.250 -0.500
A4 100.500 100.550 2 -0.050 -0.100
A5 100.500 100.394 1 0.106 0.106
B1 100.500 100.800 2 -0.300 -0.600
B2 100.500 100.830 4 -0.330 -1.320
B3 100.500 100.730 4 -0.230 -0.920
B4 100.500 100.470 4 0.030 0.120
B5 100.500 100.330 2 0.170 0.340
C1 100.500 100.730 2 -0.230 -0.460
Spot Height appears
in two grids
1 2
13
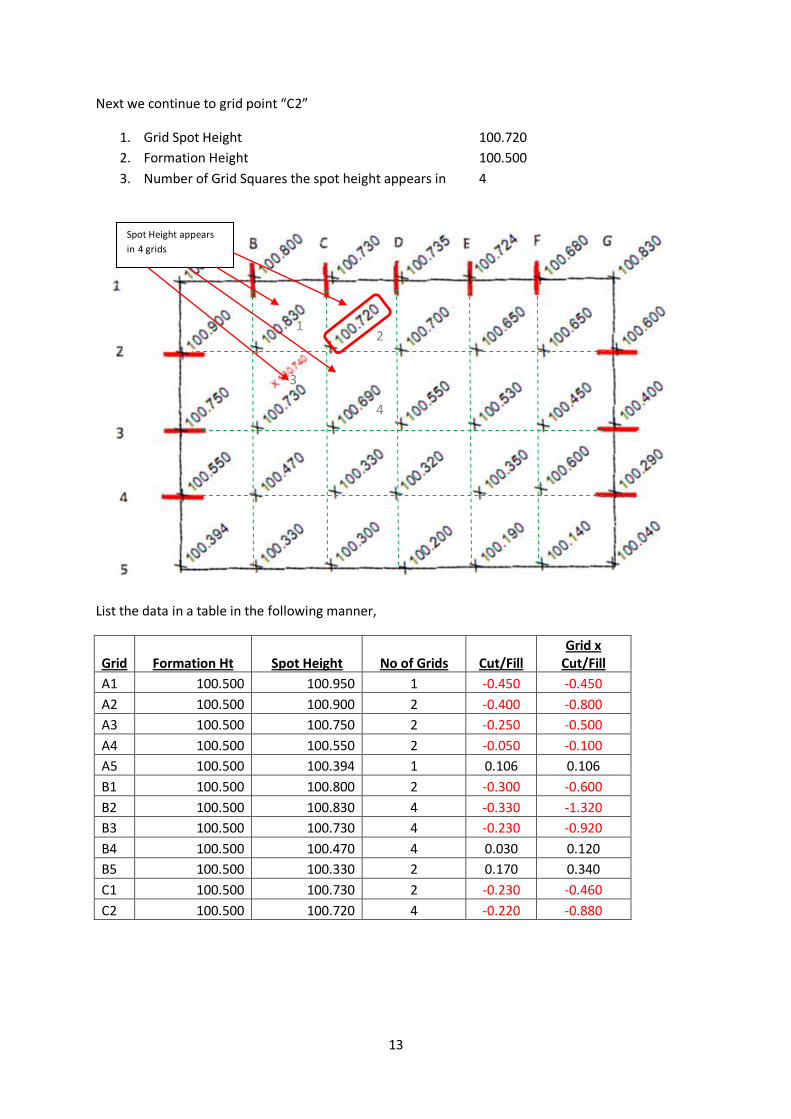
Next we continue to grid point “C2”
1. Grid Spot Height 100.720
2. Formation Height 100.500
3. Number of Grid Squares the spot height appears in 4
List the data in a table in the following manner,
Grid Formation Ht Spot Height No of Grids Cut/Fill Grid x
Cut/Fill
A1 100.500 100.950 1 -0.450 -0.450
A2 100.500 100.900 2 -0.400 -0.800
A3 100.500 100.750 2 -0.250 -0.500
A4 100.500 100.550 2 -0.050 -0.100
A5 100.500 100.394 1 0.106 0.106
B1 100.500 100.800 2 -0.300 -0.600
B2 100.500 100.830 4 -0.330 -1.320
B3 100.500 100.730 4 -0.230 -0.920
B4 100.500 100.470 4 0.030 0.120
B5 100.500 100.330 2 0.170 0.340
C1 100.500 100.730 2 -0.230 -0.460
C2 100.500 100.720 4 -0.220 -0.880
Spot Height appears
in 4 grids
1 2
3
4
14
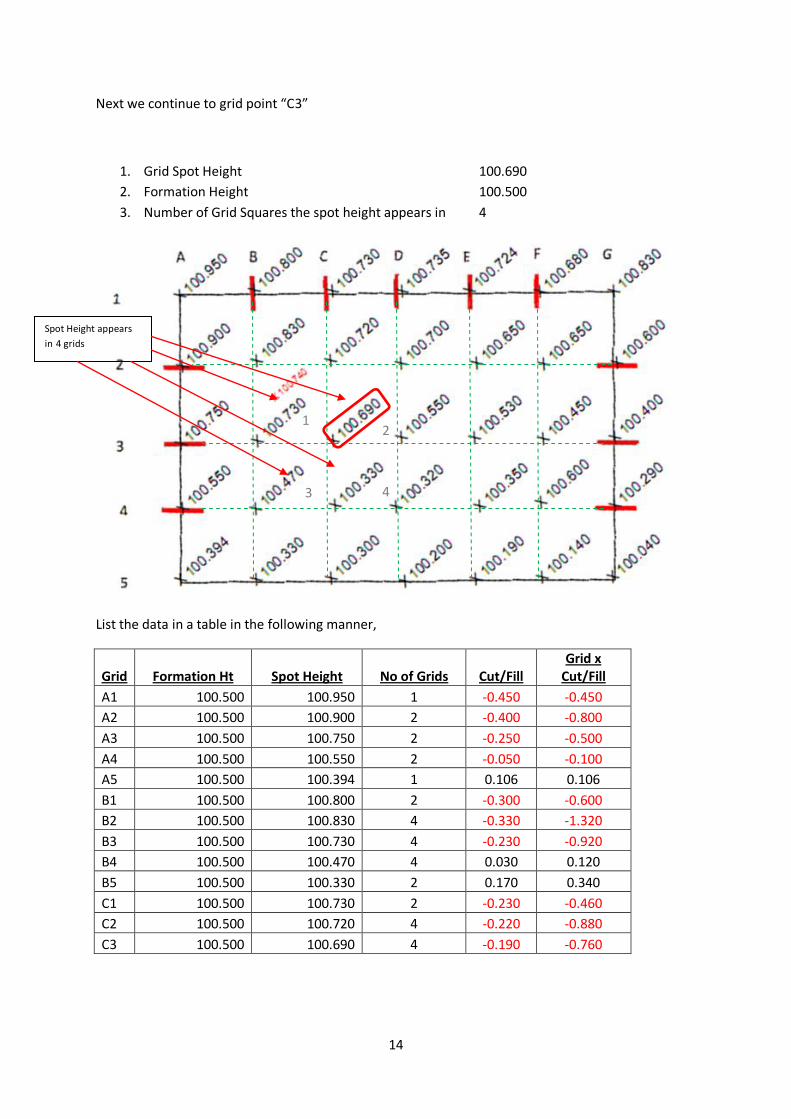
Next we continue to grid point “C3”
1. Grid Spot Height 100.690
2. Formation Height 100.500
3. Number of Grid Squares the spot height appears in 4
List the data in a table in the following manner,
Grid Formation Ht Spot Height No of Grids Cut/Fill Grid x
Cut/Fill
A1 100.500 100.950 1 -0.450 -0.450
A2 100.500 100.900 2 -0.400 -0.800
A3 100.500 100.750 2 -0.250 -0.500
A4 100.500 100.550 2 -0.050 -0.100
A5 100.500 100.394 1 0.106 0.106
B1 100.500 100.800 2 -0.300 -0.600
B2 100.500 100.830 4 -0.330 -1.320
B3 100.500 100.730 4 -0.230 -0.920
B4 100.500 100.470 4 0.030 0.120
B5 100.500 100.330 2 0.170 0.340
C1 100.500 100.730 2 -0.230 -0.460
C2 100.500 100.720 4 -0.220 -0.880
C3 100.500 100.690 4 -0.190 -0.760
Spot Height appears
in 4 grids
1 2
3 4
15
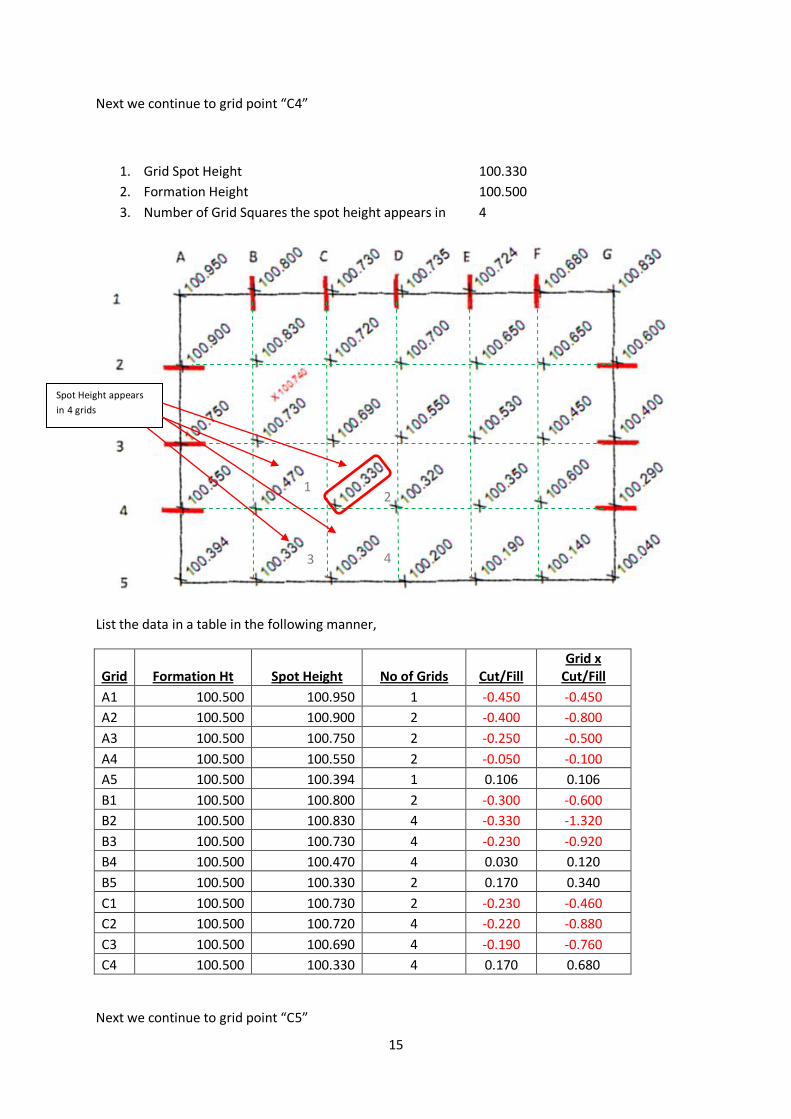
Next we continue to grid point “C4”
1. Grid Spot Height 100.330
2. Formation Height 100.500
3. Number of Grid Squares the spot height appears in 4
List the data in a table in the following manner,
Grid Formation Ht Spot Height No of Grids Cut/Fill Grid x
Cut/Fill
A1 100.500 100.950 1 -0.450 -0.450
A2 100.500 100.900 2 -0.400 -0.800
A3 100.500 100.750 2 -0.250 -0.500
A4 100.500 100.550 2 -0.050 -0.100
A5 100.500 100.394 1 0.106 0.106
B1 100.500 100.800 2 -0.300 -0.600
B2 100.500 100.830 4 -0.330 -1.320
B3 100.500 100.730 4 -0.230 -0.920
B4 100.500 100.470 4 0.030 0.120
B5 100.500 100.330 2 0.170 0.340
C1 100.500 100.730 2 -0.230 -0.460
C2 100.500 100.720 4 -0.220 -0.880
C3 100.500 100.690 4 -0.190 -0.760
C4 100.500 100.330 4 0.170 0.680
Next we continue to grid point “C5”
Spot Height appears
in 4 grids
1 2
3 4
16
1. Grid Spot Height 100.330
2. Formation Height 100.500
3. Number of Grid Squares the spot height appears in 2
List the data in a table in the following manner,
Grid Formation Ht Spot Height No of Grids Cut/Fill Grid x
Cut/Fill
A1 100.500 100.950 1 -0.450 -0.450
A2 100.500 100.900 2 -0.400 -0.800
A3 100.500 100.750 2 -0.250 -0.500
A4 100.500 100.550 2 -0.050 -0.100
A5 100.500 100.394 1 0.106 0.106
B1 100.500 100.800 2 -0.300 -0.600
B2 100.500 100.830 4 -0.330 -1.320
B3 100.500 100.730 4 -0.230 -0.920
B4 100.500 100.470 4 0.030 0.120
B5 100.500 100.330 2 0.170 0.340
C1 100.500 100.730 2 -0.230 -0.460
C2 100.500 100.720 4 -0.220 -0.880
C3 100.500 100.690 4 -0.190 -0.760
C4 100.500 100.330 4 0.170 0.680
C5 100.500 100.300 2 0.200 0.400
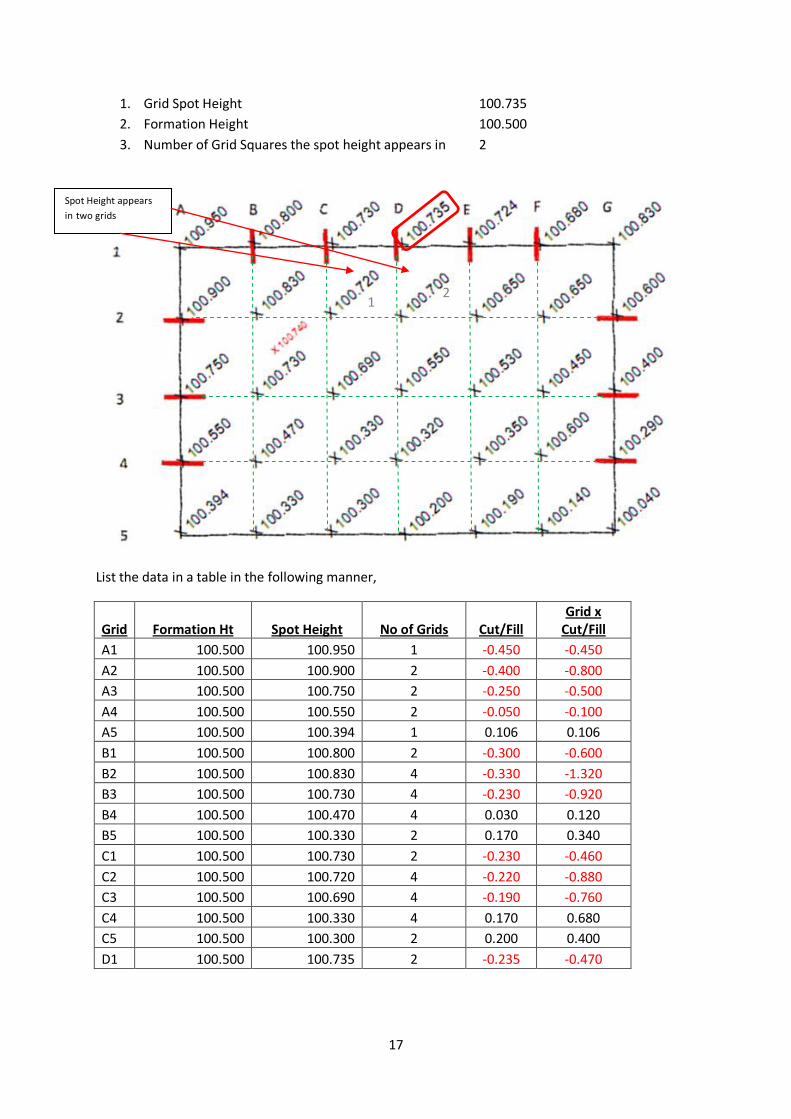
Now we continue to grid point “D1”
Spot Height appears
in 2 grids
1 2
17
1. Grid Spot Height 100.735
2. Formation Height 100.500
3. Number of Grid Squares the spot height appears in 2
List the data in a table in the following manner,
Grid Formation Ht Spot Height No of Grids Cut/Fill Grid x
Cut/Fill
A1 100.500 100.950 1 -0.450 -0.450
A2 100.500 100.900 2 -0.400 -0.800
A3 100.500 100.750 2 -0.250 -0.500
A4 100.500 100.550 2 -0.050 -0.100
A5 100.500 100.394 1 0.106 0.106
B1 100.500 100.800 2 -0.300 -0.600
B2 100.500 100.830 4 -0.330 -1.320
B3 100.500 100.730 4 -0.230 -0.920
B4 100.500 100.470 4 0.030 0.120
B5 100.500 100.330 2 0.170 0.340
C1 100.500 100.730 2 -0.230 -0.460
C2 100.500 100.720 4 -0.220 -0.880
C3 100.500 100.690 4 -0.190 -0.760
C4 100.500 100.330 4 0.170 0.680
C5 100.500 100.300 2 0.200 0.400
D1 100.500 100.735 2 -0.235 -0.470
Spot Height appears
in two grids
1 2
18
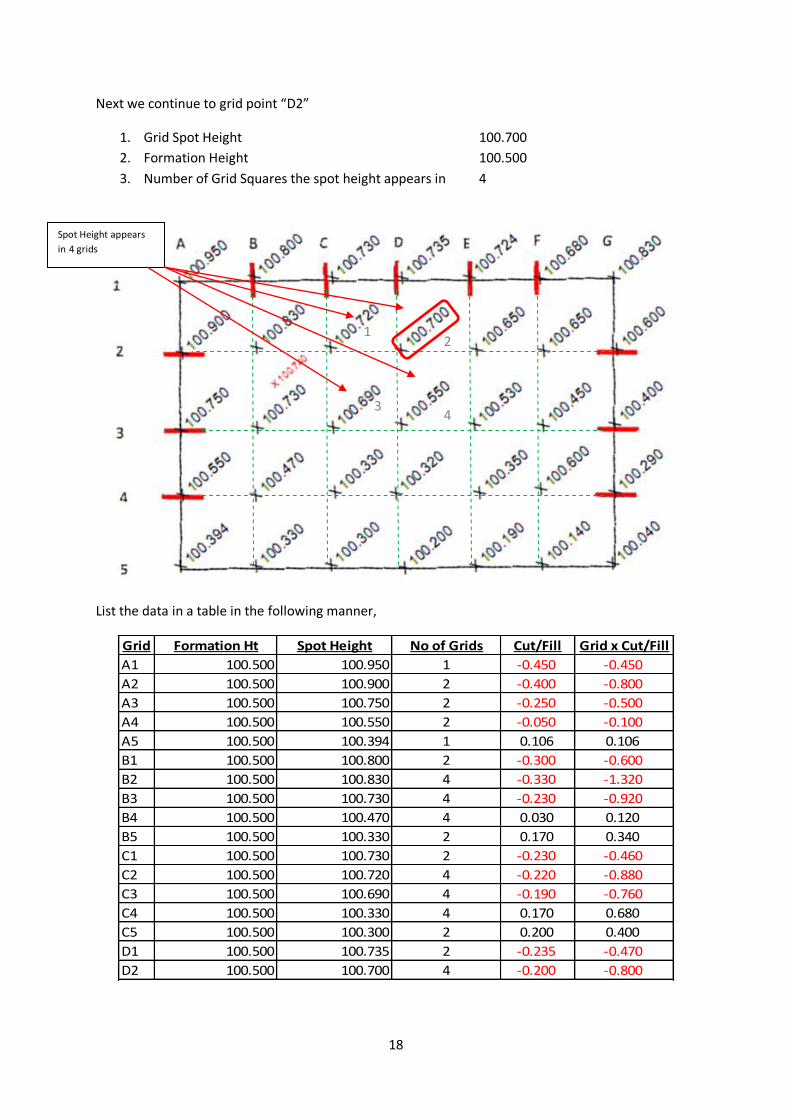
Next we continue to grid point “D2”
1. Grid Spot Height 100.700
2. Formation Height 100.500
3. Number of Grid Squares the spot height appears in 4
List the data in a table in the following manner,
Grid Formation Ht Spot Height No of Grids Cut/Fill Grid x Cut/Fill
A1 100.500 100.950 1 -0.450 -0.450
A2 100.500 100.900 2 -0.400 -0.800
A3 100.500 100.750 2 -0.250 -0.500
A4 100.500 100.550 2 -0.050 -0.100
A5 100.500 100.394 1 0.106 0.106
B1 100.500 100.800 2 -0.300 -0.600
B2 100.500 100.830 4 -0.330 -1.320
B3 100.500 100.730 4 -0.230 -0.920
B4 100.500 100.470 4 0.030 0.120
B5 100.500 100.330 2 0.170 0.340
C1 100.500 100.730 2 -0.230 -0.460
C2 100.500 100.720 4 -0.220 -0.880
C3 100.500 100.690 4 -0.190 -0.760
C4 100.500 100.330 4 0.170 0.680
C5 100.500 100.300 2 0.200 0.400
D1 100.500 100.735 2 -0.235 -0.470
D2 100.500 100.700 4 -0.200 -0.800
Spot Height appears
in 4 grids
1 2
3 4
19
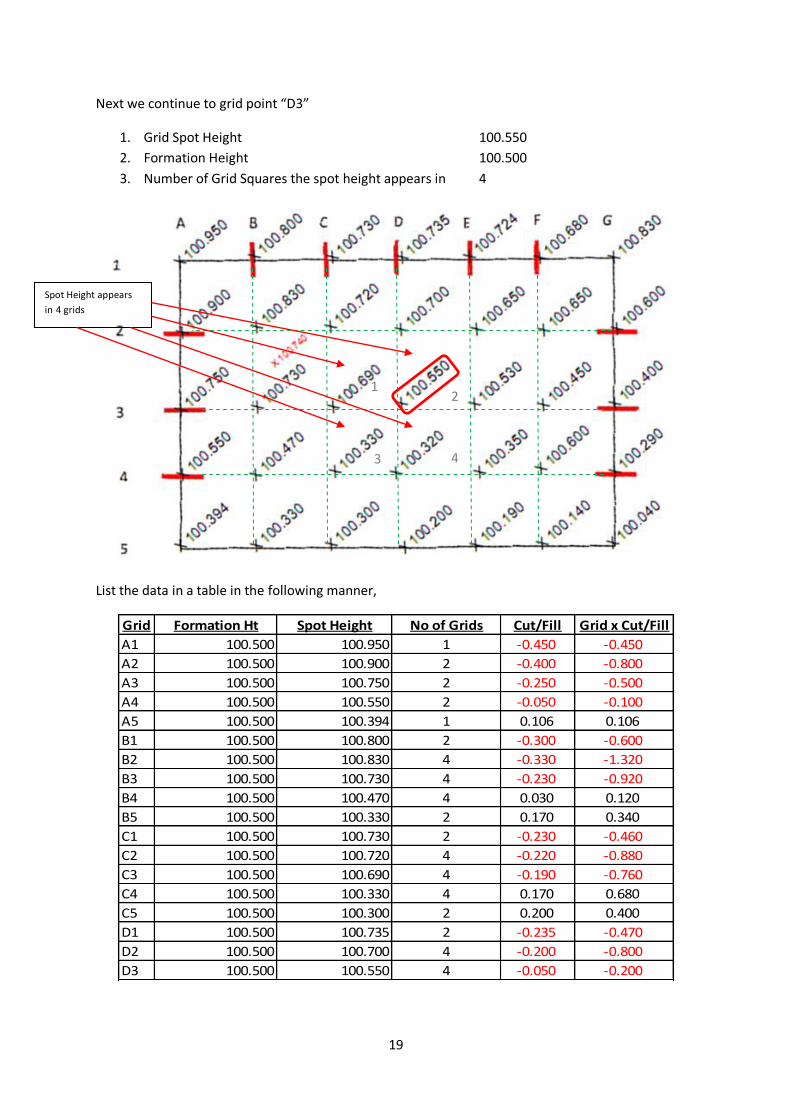
Next we continue to grid point “D3”
1. Grid Spot Height 100.550
2. Formation Height 100.500
3. Number of Grid Squares the spot height appears in 4
List the data in a table in the following manner,
Grid Formation Ht Spot Height No of Grids Cut/Fill Grid x Cut/Fill
A1 100.500 100.950 1 -0.450 -0.450
A2 100.500 100.900 2 -0.400 -0.800
A3 100.500 100.750 2 -0.250 -0.500
A4 100.500 100.550 2 -0.050 -0.100
A5 100.500 100.394 1 0.106 0.106
B1 100.500 100.800 2 -0.300 -0.600
B2 100.500 100.830 4 -0.330 -1.320
B3 100.500 100.730 4 -0.230 -0.920
B4 100.500 100.470 4 0.030 0.120
B5 100.500 100.330 2 0.170 0.340
C1 100.500 100.730 2 -0.230 -0.460
C2 100.500 100.720 4 -0.220 -0.880
C3 100.500 100.690 4 -0.190 -0.760
C4 100.500 100.330 4 0.170 0.680
C5 100.500 100.300 2 0.200 0.400
D1 100.500 100.735 2 -0.235 -0.470
D2 100.500 100.700 4 -0.200 -0.800
D3 100.500 100.550 4 -0.050 -0.200
Spot Height appears
in 4 grids
1 2
3 4
20
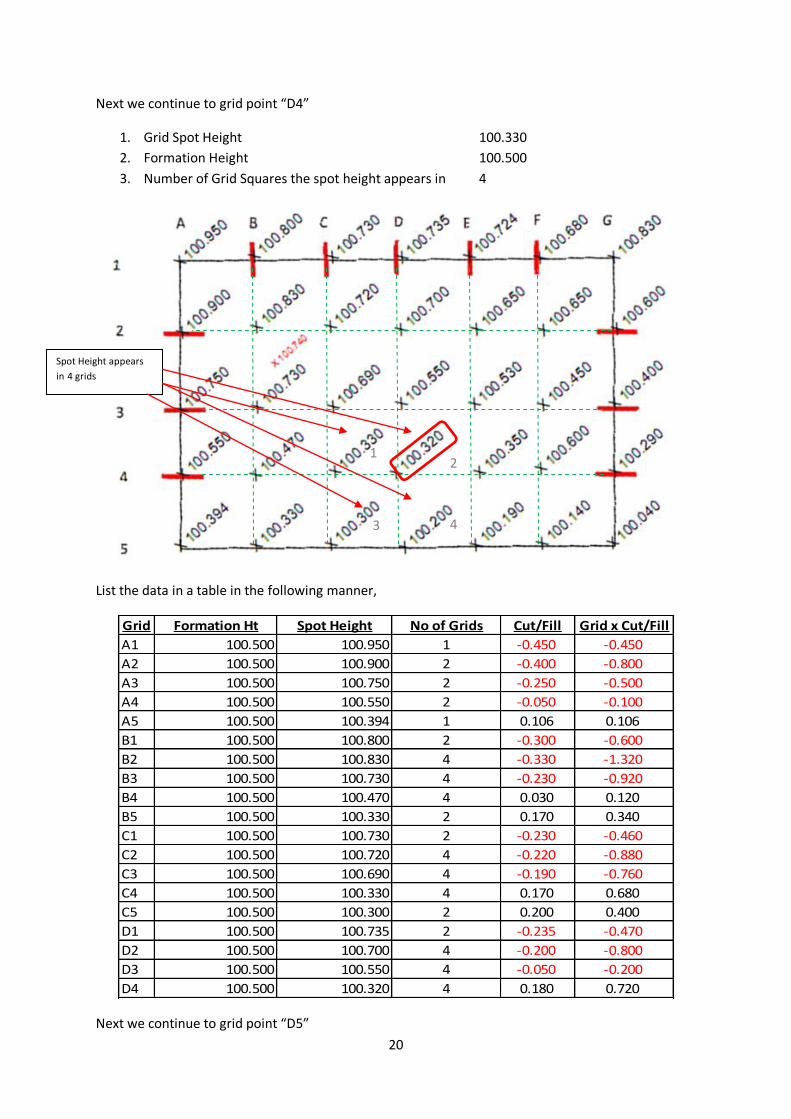
Next we continue to grid point “D4”
1. Grid Spot Height 100.330
2. Formation Height 100.500
3. Number of Grid Squares the spot height appears in 4
List the data in a table in the following manner,
Grid Formation Ht Spot Height No of Grids Cut/Fill Grid x Cut/Fill
A1 100.500 100.950 1 -0.450 -0.450
A2 100.500 100.900 2 -0.400 -0.800
A3 100.500 100.750 2 -0.250 -0.500
A4 100.500 100.550 2 -0.050 -0.100
A5 100.500 100.394 1 0.106 0.106
B1 100.500 100.800 2 -0.300 -0.600
B2 100.500 100.830 4 -0.330 -1.320
B3 100.500 100.730 4 -0.230 -0.920
B4 100.500 100.470 4 0.030 0.120
B5 100.500 100.330 2 0.170 0.340
C1 100.500 100.730 2 -0.230 -0.460
C2 100.500 100.720 4 -0.220 -0.880
C3 100.500 100.690 4 -0.190 -0.760
C4 100.500 100.330 4 0.170 0.680
C5 100.500 100.300 2 0.200 0.400
D1 100.500 100.735 2 -0.235 -0.470
D2 100.500 100.700 4 -0.200 -0.800
D3 100.500 100.550 4 -0.050 -0.200
D4 100.500 100.320 4 0.180 0.720
Next we continue to grid point “D5”
Spot Height appears
in 4 grids
1 2
3 4
21
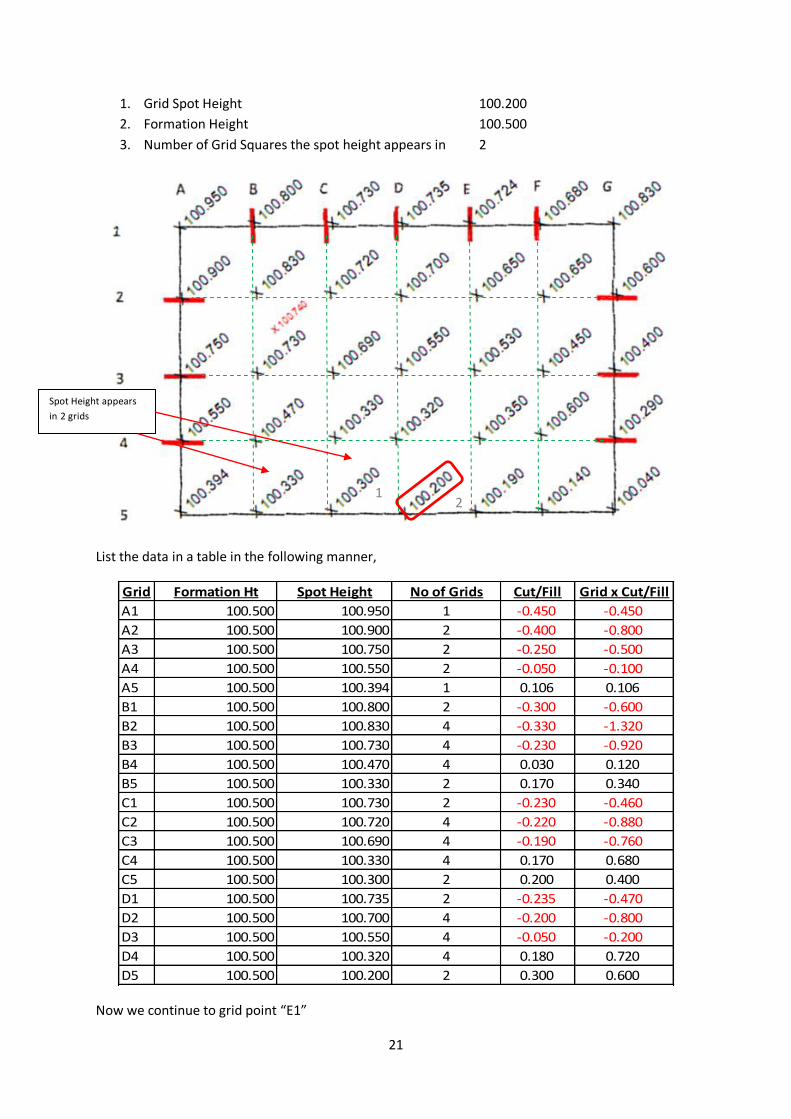
1. Grid Spot Height 100.200
2. Formation Height 100.500
3. Number of Grid Squares the spot height appears in 2
List the data in a table in the following manner,
Grid Formation Ht Spot Height No of Grids Cut/Fill Grid x Cut/Fill
A1 100.500 100.950 1 -0.450 -0.450
A2 100.500 100.900 2 -0.400 -0.800
A3 100.500 100.750 2 -0.250 -0.500
A4 100.500 100.550 2 -0.050 -0.100
A5 100.500 100.394 1 0.106 0.106
B1 100.500 100.800 2 -0.300 -0.600
B2 100.500 100.830 4 -0.330 -1.320
B3 100.500 100.730 4 -0.230 -0.920
B4 100.500 100.470 4 0.030 0.120
B5 100.500 100.330 2 0.170 0.340
C1 100.500 100.730 2 -0.230 -0.460
C2 100.500 100.720 4 -0.220 -0.880
C3 100.500 100.690 4 -0.190 -0.760
C4 100.500 100.330 4 0.170 0.680
C5 100.500 100.300 2 0.200 0.400
D1 100.500 100.735 2 -0.235 -0.470
D2 100.500 100.700 4 -0.200 -0.800
D3 100.500 100.550 4 -0.050 -0.200
D4 100.500 100.320 4 0.180 0.720
D5 100.500 100.200 2 0.300 0.600
Now we continue to grid point “E1”
Spot Height appears
in 2 grids
1 2
22
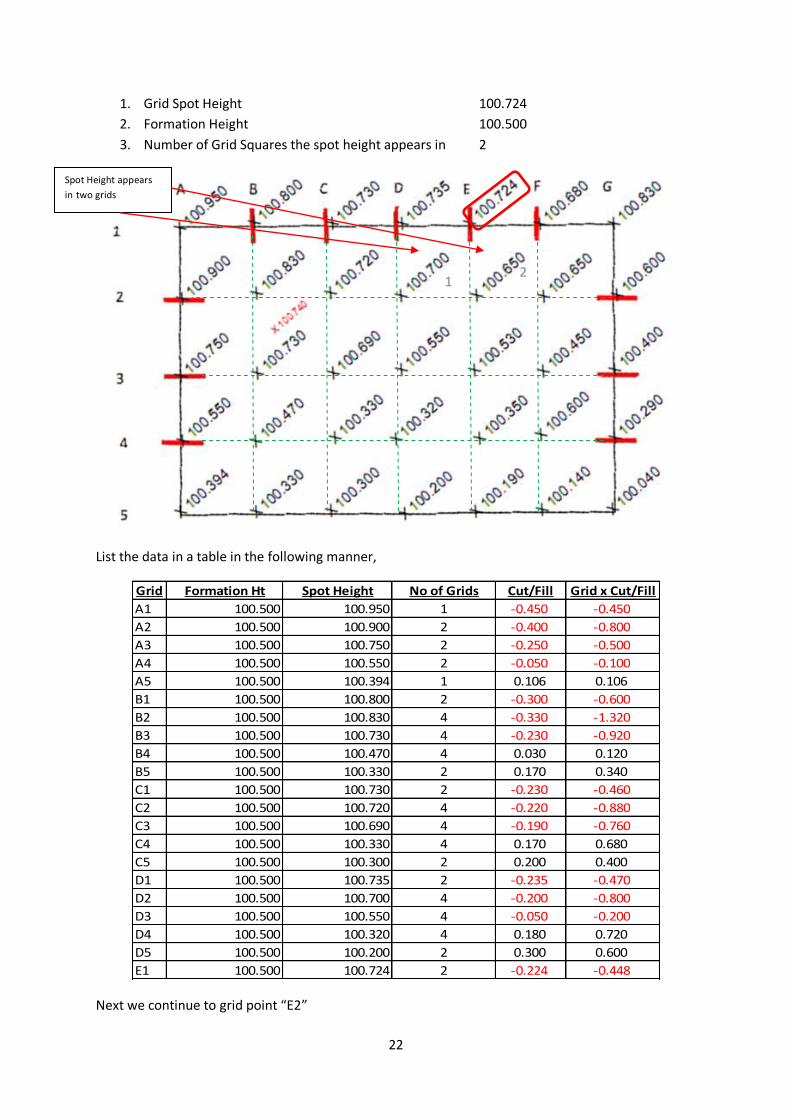
1. Grid Spot Height 100.724
2. Formation Height 100.500
3. Number of Grid Squares the spot height appears in 2
List the data in a table in the following manner,
Grid Formation Ht Spot Height No of Grids Cut/Fill Grid x Cut/Fill
A1 100.500 100.950 1 -0.450 -0.450
A2 100.500 100.900 2 -0.400 -0.800
A3 100.500 100.750 2 -0.250 -0.500
A4 100.500 100.550 2 -0.050 -0.100
A5 100.500 100.394 1 0.106 0.106
B1 100.500 100.800 2 -0.300 -0.600
B2 100.500 100.830 4 -0.330 -1.320
B3 100.500 100.730 4 -0.230 -0.920
B4 100.500 100.470 4 0.030 0.120
B5 100.500 100.330 2 0.170 0.340
C1 100.500 100.730 2 -0.230 -0.460
C2 100.500 100.720 4 -0.220 -0.880
C3 100.500 100.690 4 -0.190 -0.760
C4 100.500 100.330 4 0.170 0.680
C5 100.500 100.300 2 0.200 0.400
D1 100.500 100.735 2 -0.235 -0.470
D2 100.500 100.700 4 -0.200 -0.800
D3 100.500 100.550 4 -0.050 -0.200
D4 100.500 100.320 4 0.180 0.720
D5 100.500 100.200 2 0.300 0.600
E1 100.500 100.724 2 -0.224 -0.448
Next we continue to grid point “E2”
Spot Height appears
in two grids
1 2
23
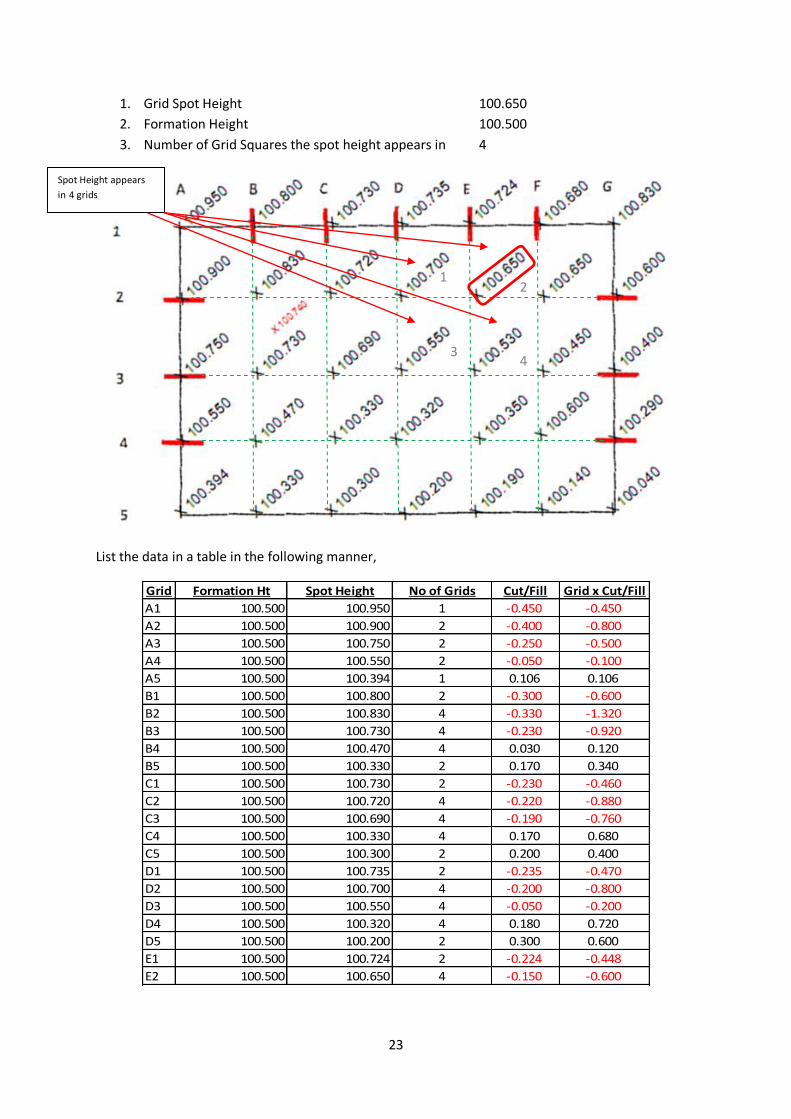
1. Grid Spot Height 100.650
2. Formation Height 100.500
3. Number of Grid Squares the spot height appears in 4
List the data in a table in the following manner,
Grid Formation Ht Spot Height No of Grids Cut/Fill Grid x Cut/Fill
A1 100.500 100.950 1 -0.450 -0.450
A2 100.500 100.900 2 -0.400 -0.800
A3 100.500 100.750 2 -0.250 -0.500
A4 100.500 100.550 2 -0.050 -0.100
A5 100.500 100.394 1 0.106 0.106
B1 100.500 100.800 2 -0.300 -0.600
B2 100.500 100.830 4 -0.330 -1.320
B3 100.500 100.730 4 -0.230 -0.920
B4 100.500 100.470 4 0.030 0.120
B5 100.500 100.330 2 0.170 0.340
C1 100.500 100.730 2 -0.230 -0.460
C2 100.500 100.720 4 -0.220 -0.880
C3 100.500 100.690 4 -0.190 -0.760
C4 100.500 100.330 4 0.170 0.680
C5 100.500 100.300 2 0.200 0.400
D1 100.500 100.735 2 -0.235 -0.470
D2 100.500 100.700 4 -0.200 -0.800
D3 100.500 100.550 4 -0.050 -0.200
D4 100.500 100.320 4 0.180 0.720
D5 100.500 100.200 2 0.300 0.600
E1 100.500 100.724 2 -0.224 -0.448
E2 100.500 100.650 4 -0.150 -0.600
Spot Height appears
in 4 grids
1 2
3 4
24
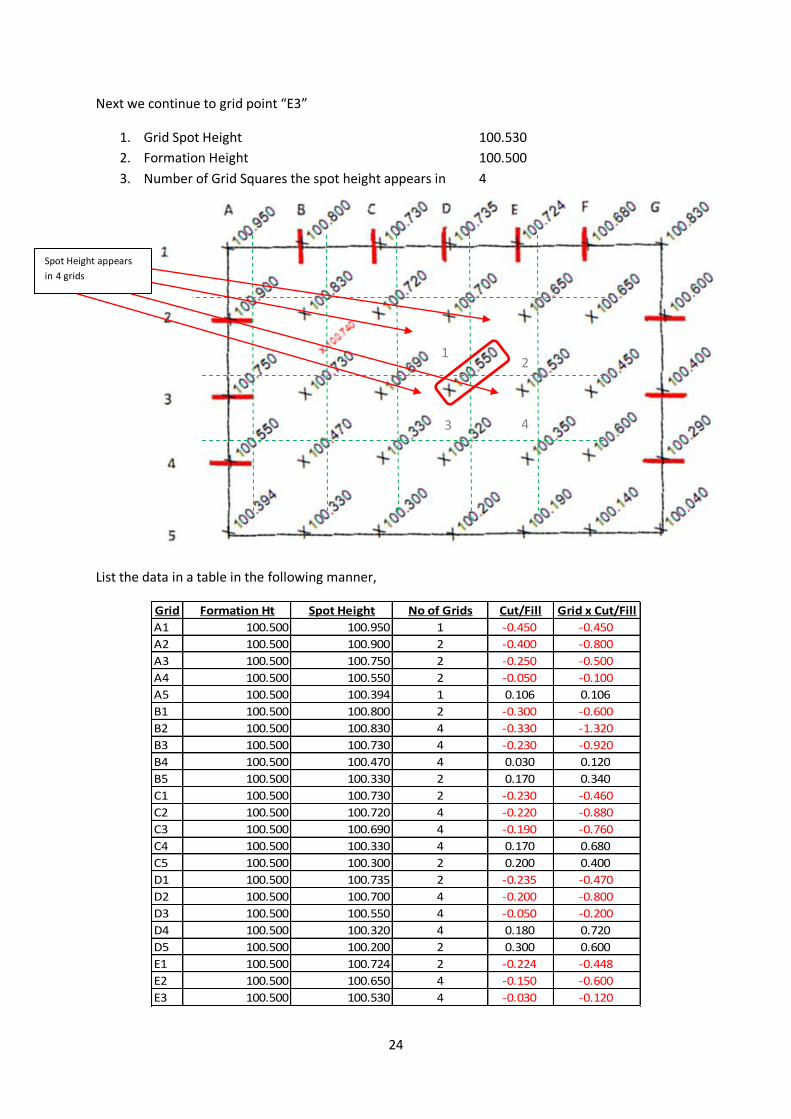
Next we continue to grid point “E3”
1. Grid Spot Height 100.530
2. Formation Height 100.500
3. Number of Grid Squares the spot height appears in 4
List the data in a table in the following manner,
Grid Formation Ht Spot Height No of Grids Cut/Fill Grid x Cut/Fill
A1 100.500 100.950 1 -0.450 -0.450
A2 100.500 100.900 2 -0.400 -0.800
A3 100.500 100.750 2 -0.250 -0.500
A4 100.500 100.550 2 -0.050 -0.100
A5 100.500 100.394 1 0.106 0.106
B1 100.500 100.800 2 -0.300 -0.600
B2 100.500 100.830 4 -0.330 -1.320
B3 100.500 100.730 4 -0.230 -0.920
B4 100.500 100.470 4 0.030 0.120
B5 100.500 100.330 2 0.170 0.340
C1 100.500 100.730 2 -0.230 -0.460
C2 100.500 100.720 4 -0.220 -0.880
C3 100.500 100.690 4 -0.190 -0.760
C4 100.500 100.330 4 0.170 0.680
C5 100.500 100.300 2 0.200 0.400
D1 100.500 100.735 2 -0.235 -0.470
D2 100.500 100.700 4 -0.200 -0.800
D3 100.500 100.550 4 -0.050 -0.200
D4 100.500 100.320 4 0.180 0.720
D5 100.500 100.200 2 0.300 0.600
E1 100.500 100.724 2 -0.224 -0.448
E2 100.500 100.650 4 -0.150 -0.600
E3 100.500 100.530 4 -0.030 -0.120
Spot Height appears
in 4 grids
1 2
3 4
25
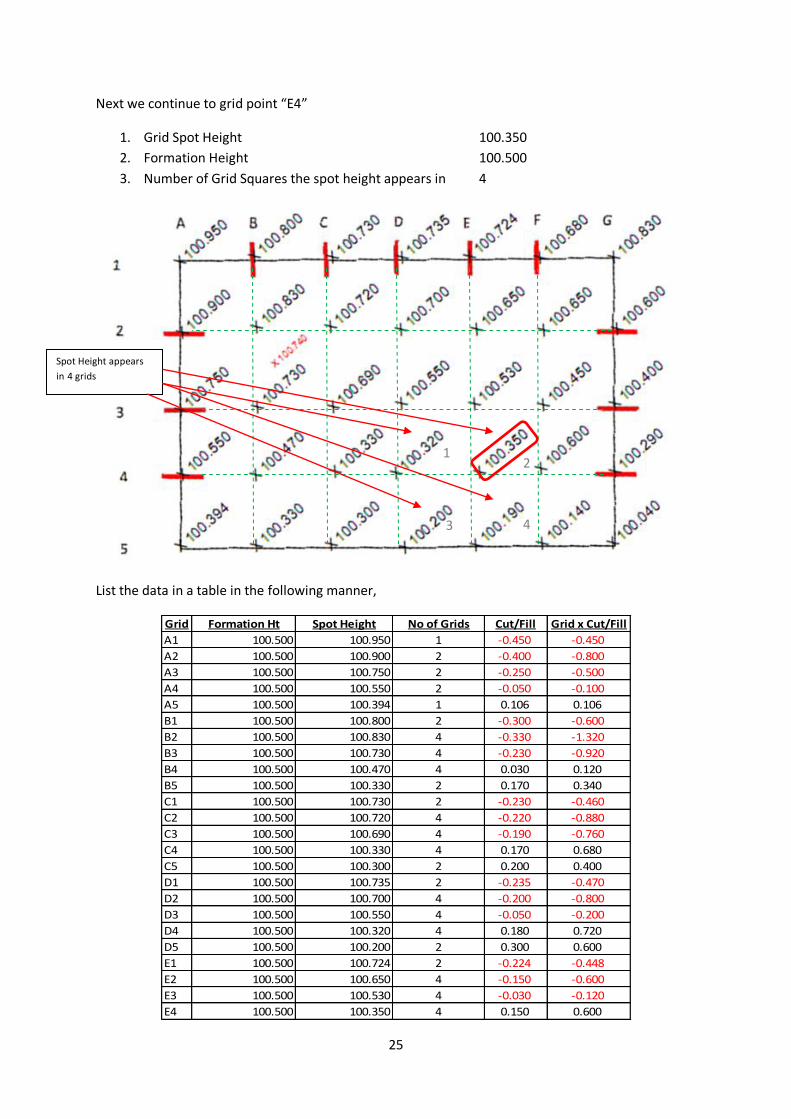
Next we continue to grid point “E4”
1. Grid Spot Height 100.350
2. Formation Height 100.500
3. Number of Grid Squares the spot height appears in 4
List the data in a table in the following manner,
Grid Formation Ht Spot Height No of Grids Cut/Fill Grid x Cut/Fill
A1 100.500 100.950 1 -0.450 -0.450
A2 100.500 100.900 2 -0.400 -0.800
A3 100.500 100.750 2 -0.250 -0.500
A4 100.500 100.550 2 -0.050 -0.100
A5 100.500 100.394 1 0.106 0.106
B1 100.500 100.800 2 -0.300 -0.600
B2 100.500 100.830 4 -0.330 -1.320
B3 100.500 100.730 4 -0.230 -0.920
B4 100.500 100.470 4 0.030 0.120
B5 100.500 100.330 2 0.170 0.340
C1 100.500 100.730 2 -0.230 -0.460
C2 100.500 100.720 4 -0.220 -0.880
C3 100.500 100.690 4 -0.190 -0.760
C4 100.500 100.330 4 0.170 0.680
C5 100.500 100.300 2 0.200 0.400
D1 100.500 100.735 2 -0.235 -0.470
D2 100.500 100.700 4 -0.200 -0.800
D3 100.500 100.550 4 -0.050 -0.200
D4 100.500 100.320 4 0.180 0.720
D5 100.500 100.200 2 0.300 0.600
E1 100.500 100.724 2 -0.224 -0.448
E2 100.500 100.650 4 -0.150 -0.600
E3 100.500 100.530 4 -0.030 -0.120
E4 100.500 100.350 4 0.150 0.600
Spot Height appears
in 4 grids
1 2
3 4
26
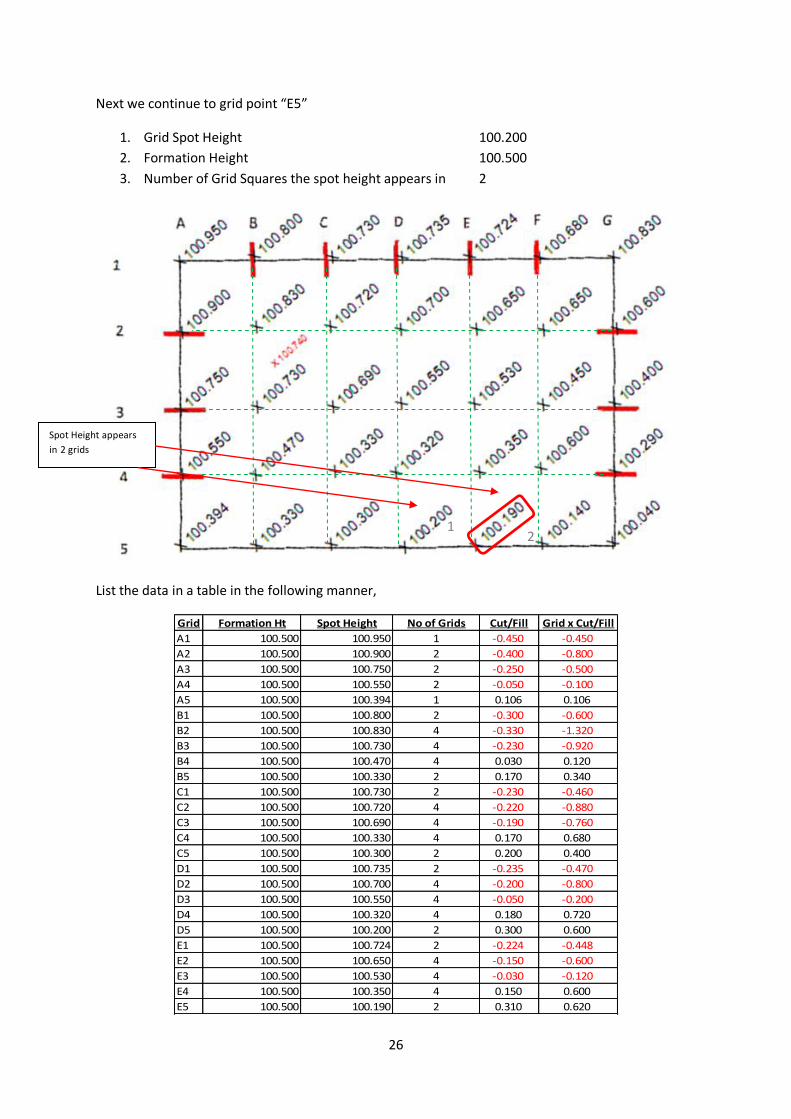
Next we continue to grid point “E5”
1. Grid Spot Height 100.200
2. Formation Height 100.500
3. Number of Grid Squares the spot height appears in 2
List the data in a table in the following manner,
Grid Formation Ht Spot Height No of Grids Cut/Fill Grid x Cut/Fill
A1 100.500 100.950 1 -0.450 -0.450
A2 100.500 100.900 2 -0.400 -0.800
A3 100.500 100.750 2 -0.250 -0.500
A4 100.500 100.550 2 -0.050 -0.100
A5 100.500 100.394 1 0.106 0.106
B1 100.500 100.800 2 -0.300 -0.600
B2 100.500 100.830 4 -0.330 -1.320
B3 100.500 100.730 4 -0.230 -0.920
B4 100.500 100.470 4 0.030 0.120
B5 100.500 100.330 2 0.170 0.340
C1 100.500 100.730 2 -0.230 -0.460
C2 100.500 100.720 4 -0.220 -0.880
C3 100.500 100.690 4 -0.190 -0.760
C4 100.500 100.330 4 0.170 0.680
C5 100.500 100.300 2 0.200 0.400
D1 100.500 100.735 2 -0.235 -0.470
D2 100.500 100.700 4 -0.200 -0.800
D3 100.500 100.550 4 -0.050 -0.200
D4 100.500 100.320 4 0.180 0.720
D5 100.500 100.200 2 0.300 0.600
E1 100.500 100.724 2 -0.224 -0.448
E2 100.500 100.650 4 -0.150 -0.600
E3 100.500 100.530 4 -0.030 -0.120
E4 100.500 100.350 4 0.150 0.600
E5 100.500 100.190 2 0.310 0.620
Spot Height appears
in 2 grids
1 2
27
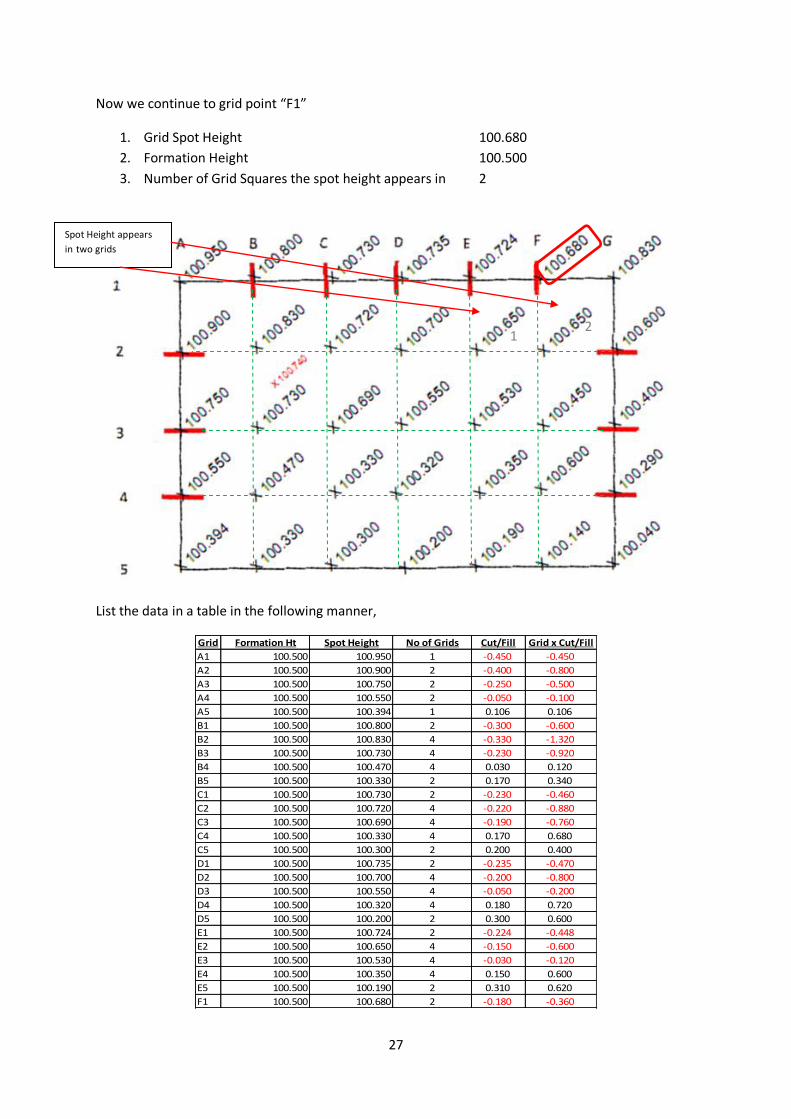
Now we continue to grid point “F1”
1. Grid Spot Height 100.680
2. Formation Height 100.500
3. Number of Grid Squares the spot height appears in 2
List the data in a table in the following manner,
Grid Formation Ht Spot Height No of Grids Cut/Fill Grid x Cut/Fill
A1 100.500 100.950 1 -0.450 -0.450
A2 100.500 100.900 2 -0.400 -0.800
A3 100.500 100.750 2 -0.250 -0.500
A4 100.500 100.550 2 -0.050 -0.100
A5 100.500 100.394 1 0.106 0.106
B1 100.500 100.800 2 -0.300 -0.600
B2 100.500 100.830 4 -0.330 -1.320
B3 100.500 100.730 4 -0.230 -0.920
B4 100.500 100.470 4 0.030 0.120
B5 100.500 100.330 2 0.170 0.340
C1 100.500 100.730 2 -0.230 -0.460
C2 100.500 100.720 4 -0.220 -0.880
C3 100.500 100.690 4 -0.190 -0.760
C4 100.500 100.330 4 0.170 0.680
C5 100.500 100.300 2 0.200 0.400
D1 100.500 100.735 2 -0.235 -0.470
D2 100.500 100.700 4 -0.200 -0.800
D3 100.500 100.550 4 -0.050 -0.200
D4 100.500 100.320 4 0.180 0.720
D5 100.500 100.200 2 0.300 0.600
E1 100.500 100.724 2 -0.224 -0.448
E2 100.500 100.650 4 -0.150 -0.600
E3 100.500 100.530 4 -0.030 -0.120
E4 100.500 100.350 4 0.150 0.600
E5 100.500 100.190 2 0.310 0.620
F1 100.500 100.680 2 -0.180 -0.360
Spot Height appears
in two grids
1 2
28
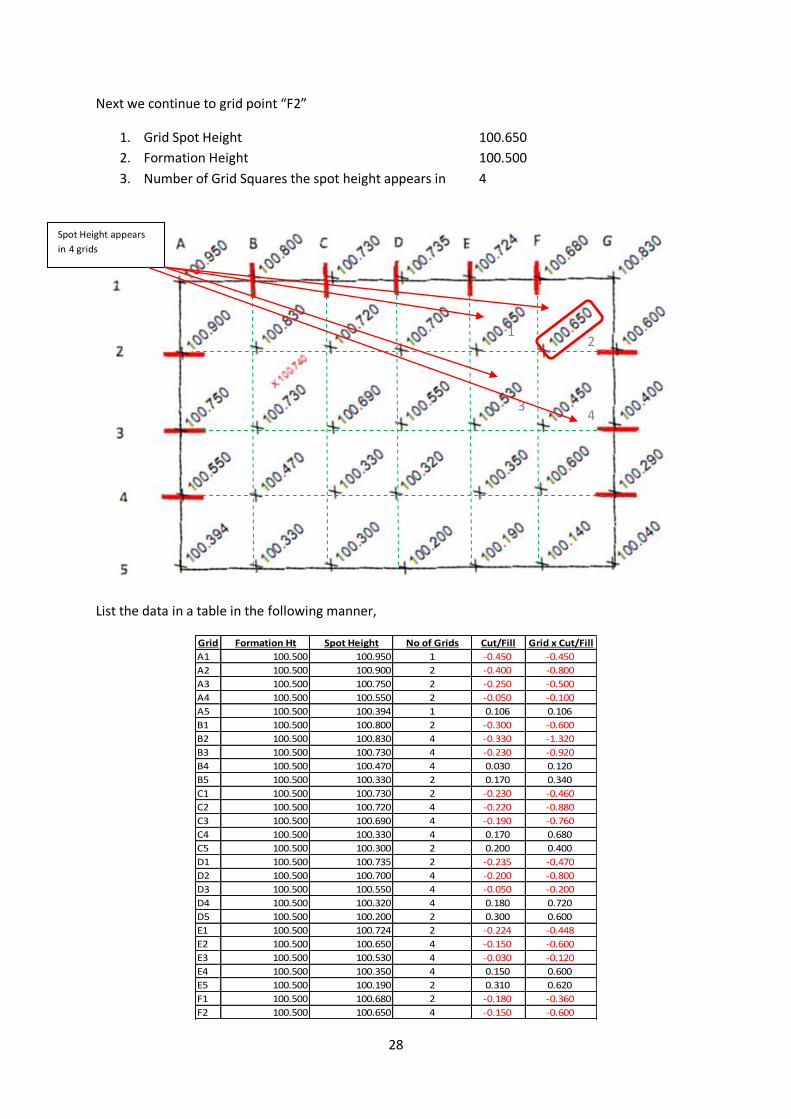
Next we continue to grid point “F2”
1. Grid Spot Height 100.650
2. Formation Height 100.500
3. Number of Grid Squares the spot height appears in 4
List the data in a table in the following manner,
Grid Formation Ht Spot Height No of Grids Cut/Fill Grid x Cut/Fill
A1 100.500 100.950 1 -0.450 -0.450
A2 100.500 100.900 2 -0.400 -0.800
A3 100.500 100.750 2 -0.250 -0.500
A4 100.500 100.550 2 -0.050 -0.100
A5 100.500 100.394 1 0.106 0.106
B1 100.500 100.800 2 -0.300 -0.600
B2 100.500 100.830 4 -0.330 -1.320
B3 100.500 100.730 4 -0.230 -0.920
B4 100.500 100.470 4 0.030 0.120
B5 100.500 100.330 2 0.170 0.340
C1 100.500 100.730 2 -0.230 -0.460
C2 100.500 100.720 4 -0.220 -0.880
C3 100.500 100.690 4 -0.190 -0.760
C4 100.500 100.330 4 0.170 0.680
C5 100.500 100.300 2 0.200 0.400
D1 100.500 100.735 2 -0.235 -0.470
D2 100.500 100.700 4 -0.200 -0.800
D3 100.500 100.550 4 -0.050 -0.200
D4 100.500 100.320 4 0.180 0.720
D5 100.500 100.200 2 0.300 0.600
E1 100.500 100.724 2 -0.224 -0.448
E2 100.500 100.650 4 -0.150 -0.600
E3 100.500 100.530 4 -0.030 -0.120
E4 100.500 100.350 4 0.150 0.600
E5 100.500 100.190 2 0.310 0.620
F1 100.500 100.680 2 -0.180 -0.360
F2 100.500 100.650 4 -0.150 -0.600
Spot Height appears
in 4 grids
1 2
3 4
29
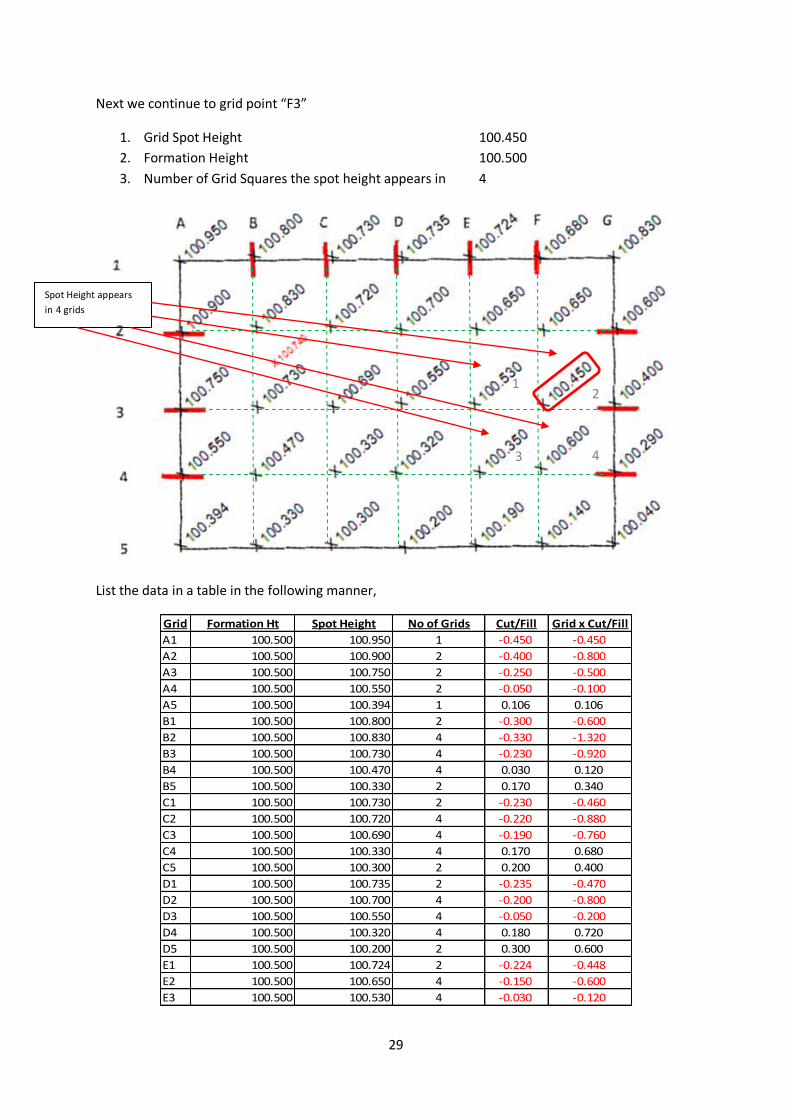
Next we continue to grid point “F3”
1. Grid Spot Height 100.450
2. Formation Height 100.500
3. Number of Grid Squares the spot height appears in 4
List the data in a table in the following manner,
Grid Formation Ht Spot Height No of Grids Cut/Fill Grid x Cut/Fill
A1 100.500 100.950 1 -0.450 -0.450
A2 100.500 100.900 2 -0.400 -0.800
A3 100.500 100.750 2 -0.250 -0.500
A4 100.500 100.550 2 -0.050 -0.100
A5 100.500 100.394 1 0.106 0.106
B1 100.500 100.800 2 -0.300 -0.600
B2 100.500 100.830 4 -0.330 -1.320
B3 100.500 100.730 4 -0.230 -0.920
B4 100.500 100.470 4 0.030 0.120
B5 100.500 100.330 2 0.170 0.340
C1 100.500 100.730 2 -0.230 -0.460
C2 100.500 100.720 4 -0.220 -0.880
C3 100.500 100.690 4 -0.190 -0.760
C4 100.500 100.330 4 0.170 0.680
C5 100.500 100.300 2 0.200 0.400
D1 100.500 100.735 2 -0.235 -0.470
D2 100.500 100.700 4 -0.200 -0.800
D3 100.500 100.550 4 -0.050 -0.200
D4 100.500 100.320 4 0.180 0.720
D5 100.500 100.200 2 0.300 0.600
E1 100.500 100.724 2 -0.224 -0.448
E2 100.500 100.650 4 -0.150 -0.600
E3 100.500 100.530 4 -0.030 -0.120
Spot Height appears
in 4 grids
1 2
3 4
30
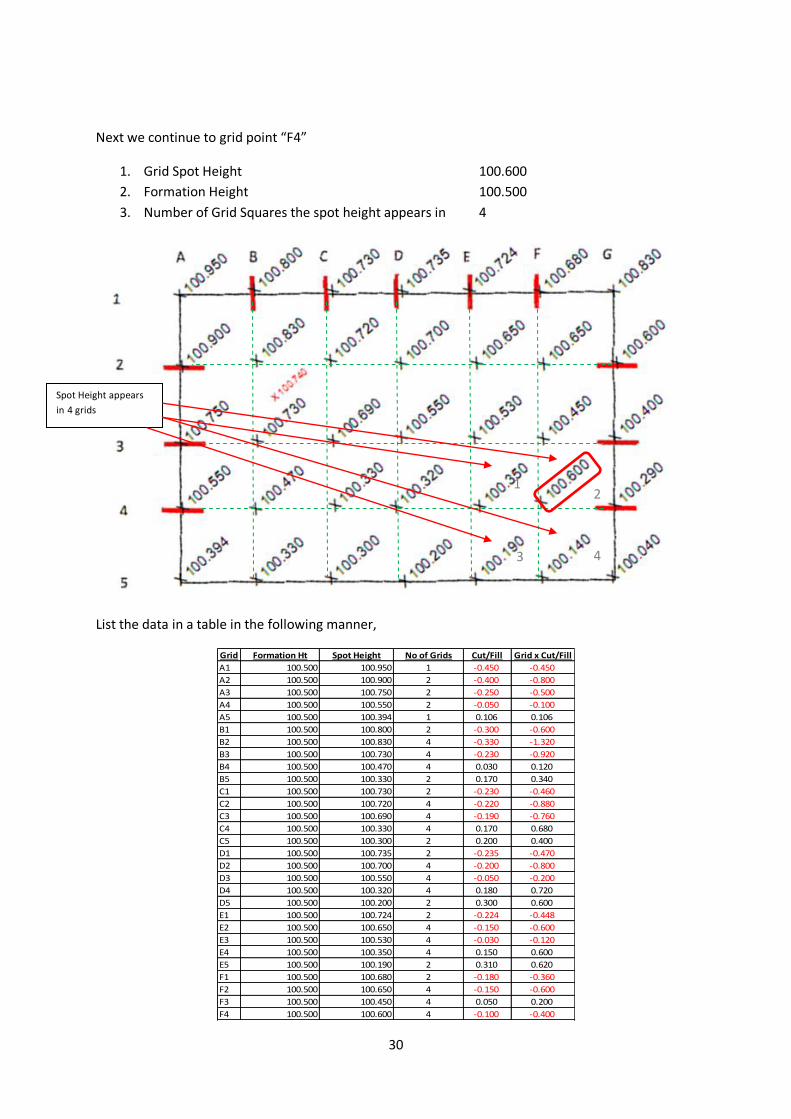
Next we continue to grid point “F4”
1. Grid Spot Height 100.600
2. Formation Height 100.500
3. Number of Grid Squares the spot height appears in 4
List the data in a table in the following manner,
Grid Formation Ht Spot Height No of Grids Cut/Fill Grid x Cut/Fill
A1 100.500 100.950 1 -0.450 -0.450
A2 100.500 100.900 2 -0.400 -0.800
A3 100.500 100.750 2 -0.250 -0.500
A4 100.500 100.550 2 -0.050 -0.100
A5 100.500 100.394 1 0.106 0.106
B1 100.500 100.800 2 -0.300 -0.600
B2 100.500 100.830 4 -0.330 -1.320
B3 100.500 100.730 4 -0.230 -0.920
B4 100.500 100.470 4 0.030 0.120
B5 100.500 100.330 2 0.170 0.340
C1 100.500 100.730 2 -0.230 -0.460
C2 100.500 100.720 4 -0.220 -0.880
C3 100.500 100.690 4 -0.190 -0.760
C4 100.500 100.330 4 0.170 0.680
C5 100.500 100.300 2 0.200 0.400
D1 100.500 100.735 2 -0.235 -0.470
D2 100.500 100.700 4 -0.200 -0.800
D3 100.500 100.550 4 -0.050 -0.200
D4 100.500 100.320 4 0.180 0.720
D5 100.500 100.200 2 0.300 0.600
E1 100.500 100.724 2 -0.224 -0.448
E2 100.500 100.650 4 -0.150 -0.600
E3 100.500 100.530 4 -0.030 -0.120
E4 100.500 100.350 4 0.150 0.600
E5 100.500 100.190 2 0.310 0.620
F1 100.500 100.680 2 -0.180 -0.360
F2 100.500 100.650 4 -0.150 -0.600
F3 100.500 100.450 4 0.050 0.200
F4 100.500 100.600 4 -0.100 -0.400
Spot Height appears
in 4 grids
1 2
3 4
31
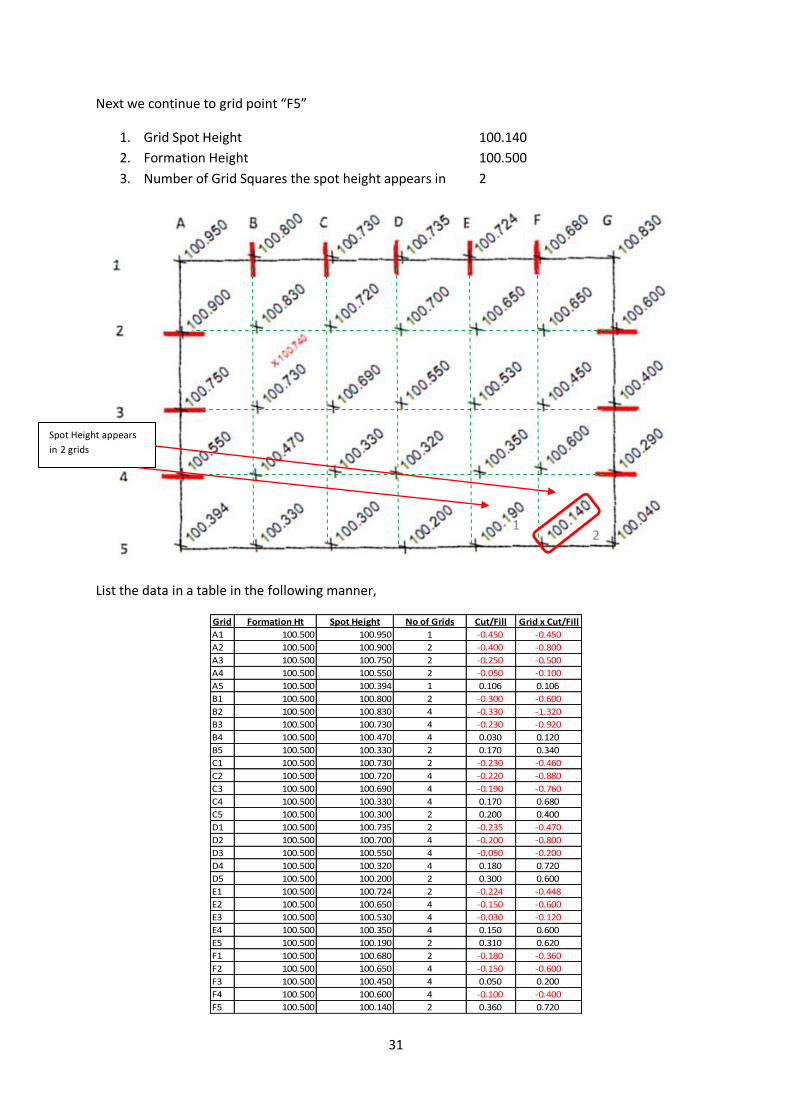
Next we continue to grid point “F5”
1. Grid Spot Height 100.140
2. Formation Height 100.500
3. Number of Grid Squares the spot height appears in 2
List the data in a table in the following manner,
Grid Formation Ht Spot Height No of Grids Cut/Fill Grid x Cut/Fill
A1 100.500 100.950 1 -0.450 -0.450
A2 100.500 100.900 2 -0.400 -0.800
A3 100.500 100.750 2 -0.250 -0.500
A4 100.500 100.550 2 -0.050 -0.100
A5 100.500 100.394 1 0.106 0.106
B1 100.500 100.800 2 -0.300 -0.600
B2 100.500 100.830 4 -0.330 -1.320
B3 100.500 100.730 4 -0.230 -0.920
B4 100.500 100.470 4 0.030 0.120
B5 100.500 100.330 2 0.170 0.340
C1 100.500 100.730 2 -0.230 -0.460
C2 100.500 100.720 4 -0.220 -0.880
C3 100.500 100.690 4 -0.190 -0.760
C4 100.500 100.330 4 0.170 0.680
C5 100.500 100.300 2 0.200 0.400
D1 100.500 100.735 2 -0.235 -0.470
D2 100.500 100.700 4 -0.200 -0.800
D3 100.500 100.550 4 -0.050 -0.200
D4 100.500 100.320 4 0.180 0.720
D5 100.500 100.200 2 0.300 0.600
E1 100.500 100.724 2 -0.224 -0.448
E2 100.500 100.650 4 -0.150 -0.600
E3 100.500 100.530 4 -0.030 -0.120
E4 100.500 100.350 4 0.150 0.600
E5 100.500 100.190 2 0.310 0.620
F1 100.500 100.680 2 -0.180 -0.360
F2 100.500 100.650 4 -0.150 -0.600
F3 100.500 100.450 4 0.050 0.200
F4 100.500 100.600 4 -0.100 -0.400
F5 100.500 100.140 2 0.360 0.720
Spot Height appears
in 2 grids
1 2
32
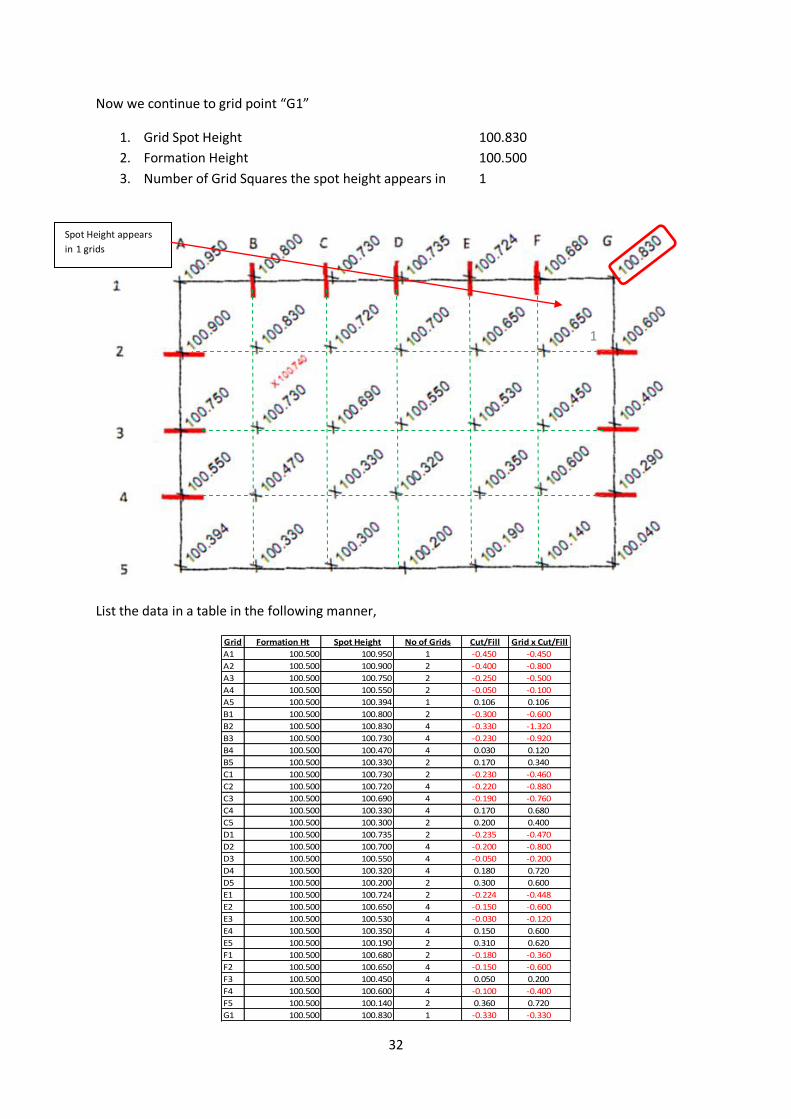
Now we continue to grid point “G1”
1. Grid Spot Height 100.830
2. Formation Height 100.500
3. Number of Grid Squares the spot height appears in 1
List the data in a table in the following manner,
Grid Formation Ht Spot Height No of Grids Cut/Fill Grid x Cut/Fill
A1 100.500 100.950 1 -0.450 -0.450
A2 100.500 100.900 2 -0.400 -0.800
A3 100.500 100.750 2 -0.250 -0.500
A4 100.500 100.550 2 -0.050 -0.100
A5 100.500 100.394 1 0.106 0.106
B1 100.500 100.800 2 -0.300 -0.600
B2 100.500 100.830 4 -0.330 -1.320
B3 100.500 100.730 4 -0.230 -0.920
B4 100.500 100.470 4 0.030 0.120
B5 100.500 100.330 2 0.170 0.340
C1 100.500 100.730 2 -0.230 -0.460
C2 100.500 100.720 4 -0.220 -0.880
C3 100.500 100.690 4 -0.190 -0.760
C4 100.500 100.330 4 0.170 0.680
C5 100.500 100.300 2 0.200 0.400
D1 100.500 100.735 2 -0.235 -0.470
D2 100.500 100.700 4 -0.200 -0.800
D3 100.500 100.550 4 -0.050 -0.200
D4 100.500 100.320 4 0.180 0.720
D5 100.500 100.200 2 0.300 0.600
E1 100.500 100.724 2 -0.224 -0.448
E2 100.500 100.650 4 -0.150 -0.600
E3 100.500 100.530 4 -0.030 -0.120
E4 100.500 100.350 4 0.150 0.600
E5 100.500 100.190 2 0.310 0.620
F1 100.500 100.680 2 -0.180 -0.360
F2 100.500 100.650 4 -0.150 -0.600
F3 100.500 100.450 4 0.050 0.200
F4 100.500 100.600 4 -0.100 -0.400
F5 100.500 100.140 2 0.360 0.720
G1 100.500 100.830 1 -0.330 -0.330
Spot Height appears
in 1 grids
1
33
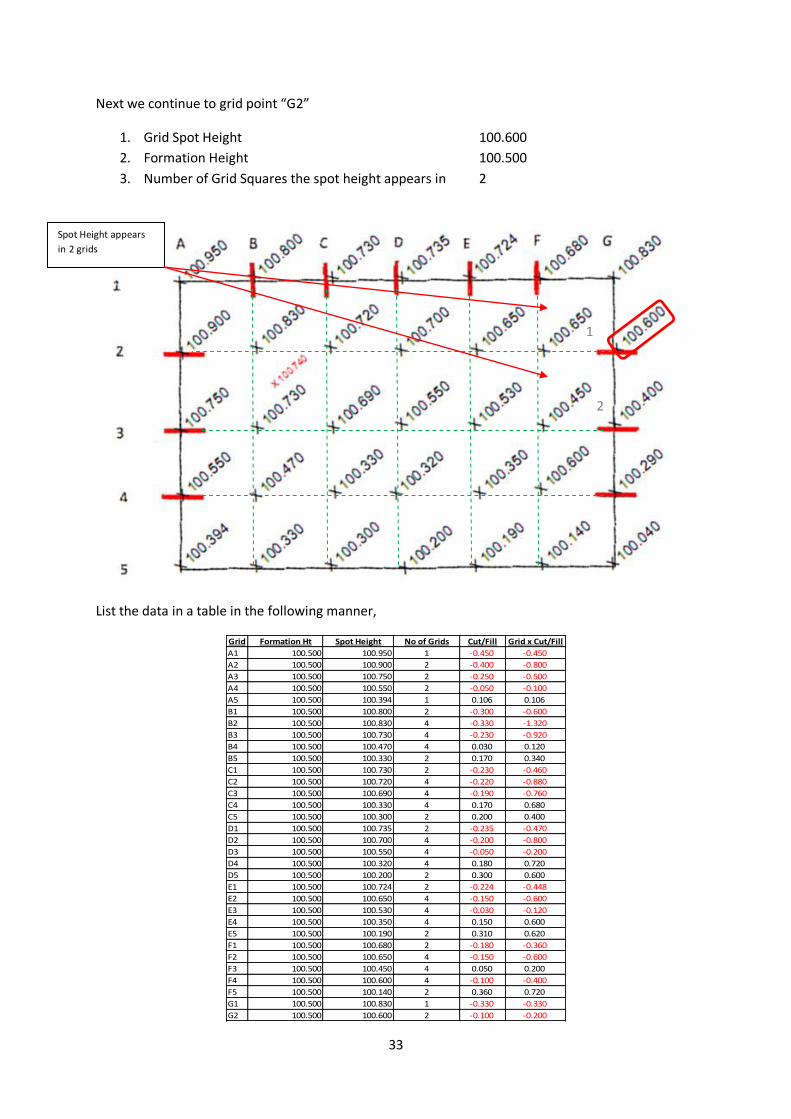
Next we continue to grid point “G2”
1. Grid Spot Height 100.600
2. Formation Height 100.500
3. Number of Grid Squares the spot height appears in 2
List the data in a table in the following manner,
Grid Formation Ht Spot Height No of Grids Cut/Fill Grid x Cut/Fill
A1 100.500 100.950 1 -0.450 -0.450
A2 100.500 100.900 2 -0.400 -0.800
A3 100.500 100.750 2 -0.250 -0.500
A4 100.500 100.550 2 -0.050 -0.100
A5 100.500 100.394 1 0.106 0.106
B1 100.500 100.800 2 -0.300 -0.600
B2 100.500 100.830 4 -0.330 -1.320
B3 100.500 100.730 4 -0.230 -0.920
B4 100.500 100.470 4 0.030 0.120
B5 100.500 100.330 2 0.170 0.340
C1 100.500 100.730 2 -0.230 -0.460
C2 100.500 100.720 4 -0.220 -0.880
C3 100.500 100.690 4 -0.190 -0.760
C4 100.500 100.330 4 0.170 0.680
C5 100.500 100.300 2 0.200 0.400
D1 100.500 100.735 2 -0.235 -0.470
D2 100.500 100.700 4 -0.200 -0.800
D3 100.500 100.550 4 -0.050 -0.200
D4 100.500 100.320 4 0.180 0.720
D5 100.500 100.200 2 0.300 0.600
E1 100.500 100.724 2 -0.224 -0.448
E2 100.500 100.650 4 -0.150 -0.600
E3 100.500 100.530 4 -0.030 -0.120
E4 100.500 100.350 4 0.150 0.600
E5 100.500 100.190 2 0.310 0.620
F1 100.500 100.680 2 -0.180 -0.360
F2 100.500 100.650 4 -0.150 -0.600
F3 100.500 100.450 4 0.050 0.200
F4 100.500 100.600 4 -0.100 -0.400
F5 100.500 100.140 2 0.360 0.720
G1 100.500 100.830 1 -0.330 -0.330
G2 100.500 100.600 2 -0.100 -0.200
Spot Height appears
in 2 grids
1
2
34
Next we continue to grid point “G3”
1. Grid Spot Height 100.400
2. Formation Height 100.500
3. Number of Grid Squares the spot height appears in 2
List the data in a table in the following manner,
Grid Formation Ht Spot Height No of Grids Cut/Fill Grid x Cut/Fill
A1 100.500 100.950 1 -0.450 -0.450
A2 100.500 100.900 2 -0.400 -0.800
A3 100.500 100.750 2 -0.250 -0.500
A4 100.500 100.550 2 -0.050 -0.100
A5 100.500 100.394 1 0.106 0.106
B1 100.500 100.800 2 -0.300 -0.600
B2 100.500 100.830 4 -0.330 -1.320
B3 100.500 100.730 4 -0.230 -0.920
B4 100.500 100.470 4 0.030 0.120
B5 100.500 100.330 2 0.170 0.340
C1 100.500 100.730 2 -0.230 -0.460
C2 100.500 100.720 4 -0.220 -0.880
C3 100.500 100.690 4 -0.190 -0.760
C4 100.500 100.330 4 0.170 0.680
C5 100.500 100.300 2 0.200 0.400
D1 100.500 100.735 2 -0.235 -0.470
D2 100.500 100.700 4 -0.200 -0.800
D3 100.500 100.550 4 -0.050 -0.200
D4 100.500 100.320 4 0.180 0.720
D5 100.500 100.200 2 0.300 0.600
E1 100.500 100.724 2 -0.224 -0.448
E2 100.500 100.650 4 -0.150 -0.600
E3 100.500 100.530 4 -0.030 -0.120
E4 100.500 100.350 4 0.150 0.600
E5 100.500 100.190 2 0.310 0.620
F1 100.500 100.680 2 -0.180 -0.360
F2 100.500 100.650 4 -0.150 -0.600
F3 100.500 100.450 4 0.050 0.200
F4 100.500 100.600 4 -0.100 -0.400
F5 100.500 100.140 2 0.360 0.720
G1 100.500 100.830 1 -0.330 -0.330
G2 100.500 100.600 2 -0.100 -0.200
G3 100.500 100.400 2 0.100 0.200
Spot Height appears
in 2 grids
1
2
35
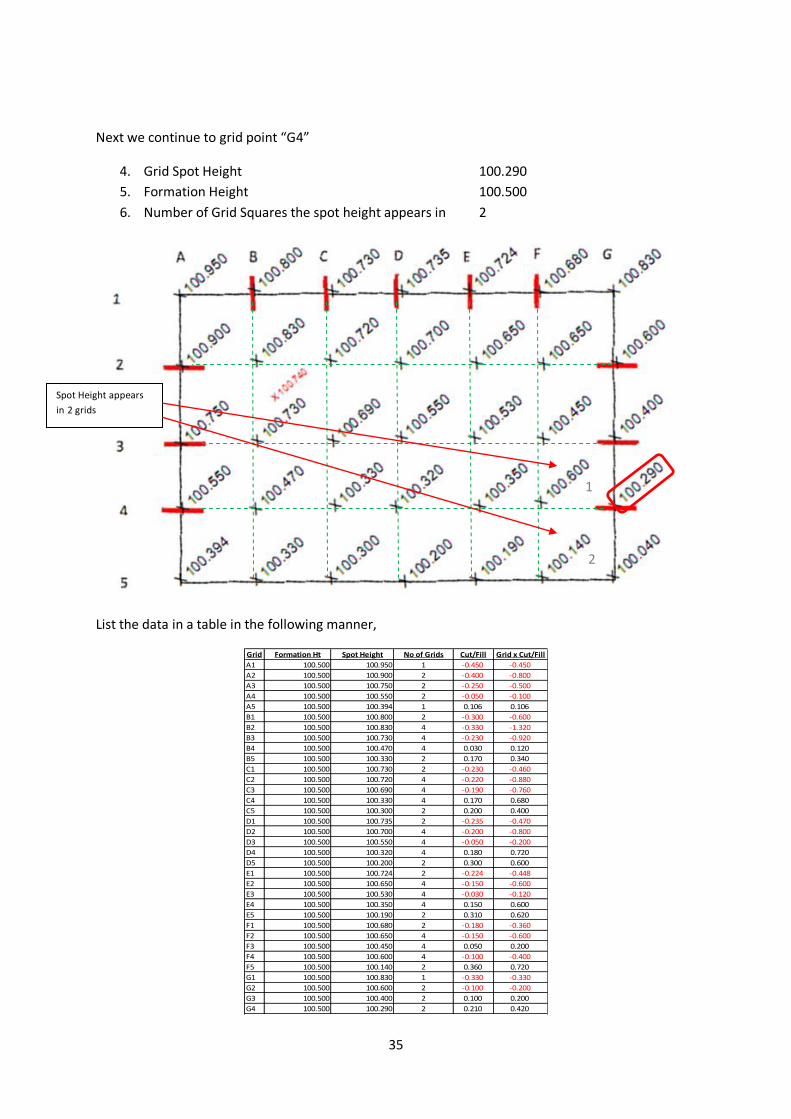
Next we continue to grid point “G4”
4. Grid Spot Height 100.290
5. Formation Height 100.500
6. Number of Grid Squares the spot height appears in 2
List the data in a table in the following manner,
Grid Formation Ht Spot Height No of Grids Cut/Fill Grid x Cut/Fill
A1 100.500 100.950 1 -0.450 -0.450
A2 100.500 100.900 2 -0.400 -0.800
A3 100.500 100.750 2 -0.250 -0.500
A4 100.500 100.550 2 -0.050 -0.100
A5 100.500 100.394 1 0.106 0.106
B1 100.500 100.800 2 -0.300 -0.600
B2 100.500 100.830 4 -0.330 -1.320
B3 100.500 100.730 4 -0.230 -0.920
B4 100.500 100.470 4 0.030 0.120
B5 100.500 100.330 2 0.170 0.340
C1 100.500 100.730 2 -0.230 -0.460
C2 100.500 100.720 4 -0.220 -0.880
C3 100.500 100.690 4 -0.190 -0.760
C4 100.500 100.330 4 0.170 0.680
C5 100.500 100.300 2 0.200 0.400
D1 100.500 100.735 2 -0.235 -0.470
D2 100.500 100.700 4 -0.200 -0.800
D3 100.500 100.550 4 -0.050 -0.200
D4 100.500 100.320 4 0.180 0.720
D5 100.500 100.200 2 0.300 0.600
E1 100.500 100.724 2 -0.224 -0.448
E2 100.500 100.650 4 -0.150 -0.600
E3 100.500 100.530 4 -0.030 -0.120
E4 100.500 100.350 4 0.150 0.600
E5 100.500 100.190 2 0.310 0.620
F1 100.500 100.680 2 -0.180 -0.360
F2 100.500 100.650 4 -0.150 -0.600
F3 100.500 100.450 4 0.050 0.200
F4 100.500 100.600 4 -0.100 -0.400
F5 100.500 100.140 2 0.360 0.720
G1 100.500 100.830 1 -0.330 -0.330
G2 100.500 100.600 2 -0.100 -0.200
G3 100.500 100.400 2 0.100 0.200
G4 100.500 100.290 2 0.210 0.420
Spot Height appears
in 2 grids
1
2
36
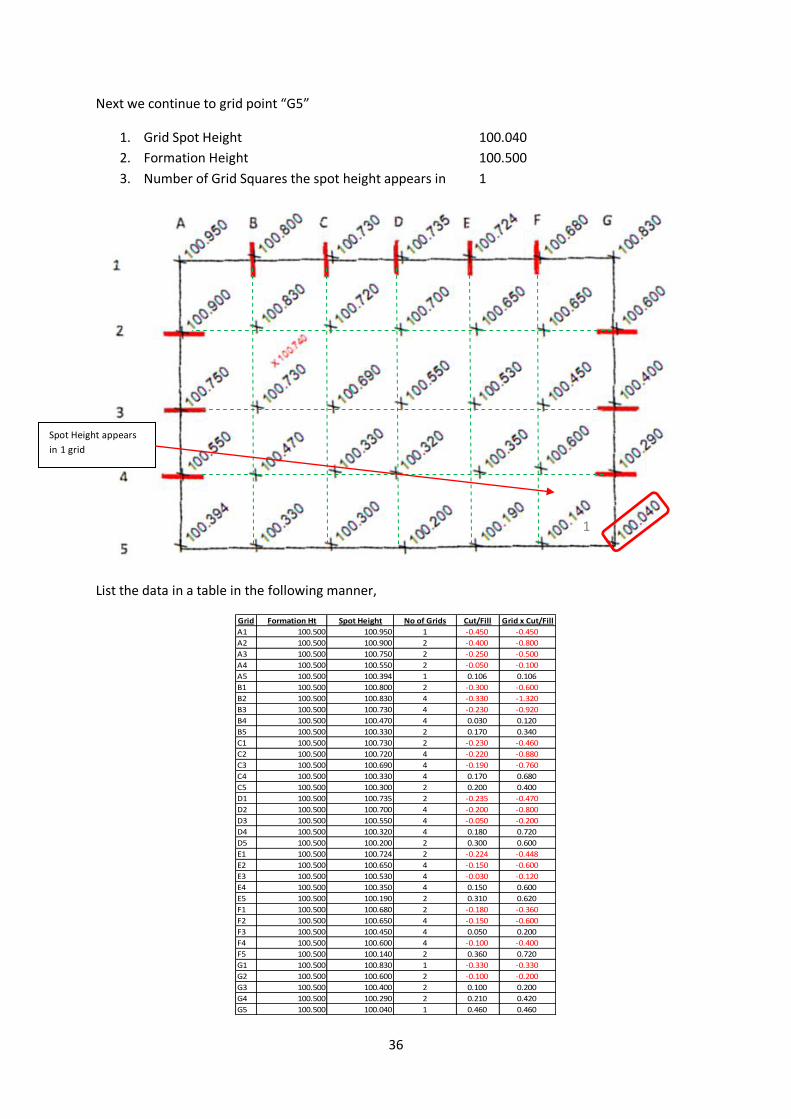
Next we continue to grid point “G5”
1. Grid Spot Height 100.040
2. Formation Height 100.500
3. Number of Grid Squares the spot height appears in 1
List the data in a table in the following manner,
Grid Formation Ht Spot Height No of Grids Cut/Fill Grid x Cut/Fill
A1 100.500 100.950 1 -0.450 -0.450
A2 100.500 100.900 2 -0.400 -0.800
A3 100.500 100.750 2 -0.250 -0.500
A4 100.500 100.550 2 -0.050 -0.100
A5 100.500 100.394 1 0.106 0.106
B1 100.500 100.800 2 -0.300 -0.600
B2 100.500 100.830 4 -0.330 -1.320
B3 100.500 100.730 4 -0.230 -0.920
B4 100.500 100.470 4 0.030 0.120
B5 100.500 100.330 2 0.170 0.340
C1 100.500 100.730 2 -0.230 -0.460
C2 100.500 100.720 4 -0.220 -0.880
C3 100.500 100.690 4 -0.190 -0.760
C4 100.500 100.330 4 0.170 0.680
C5 100.500 100.300 2 0.200 0.400
D1 100.500 100.735 2 -0.235 -0.470
D2 100.500 100.700 4 -0.200 -0.800
D3 100.500 100.550 4 -0.050 -0.200
D4 100.500 100.320 4 0.180 0.720
D5 100.500 100.200 2 0.300 0.600
E1 100.500 100.724 2 -0.224 -0.448
E2 100.500 100.650 4 -0.150 -0.600
E3 100.500 100.530 4 -0.030 -0.120
E4 100.500 100.350 4 0.150 0.600
E5 100.500 100.190 2 0.310 0.620
F1 100.500 100.680 2 -0.180 -0.360
F2 100.500 100.650 4 -0.150 -0.600
F3 100.500 100.450 4 0.050 0.200
F4 100.500 100.600 4 -0.100 -0.400
F5 100.500 100.140 2 0.360 0.720
G1 100.500 100.830 1 -0.330 -0.330
G2 100.500 100.600 2 -0.100 -0.200
G3 100.500 100.400 2 0.100 0.200
G4 100.500 100.290 2 0.210 0.420
G5 100.500 100.040 1 0.460 0.460
Spot Height appears
in 1 grid
1
37
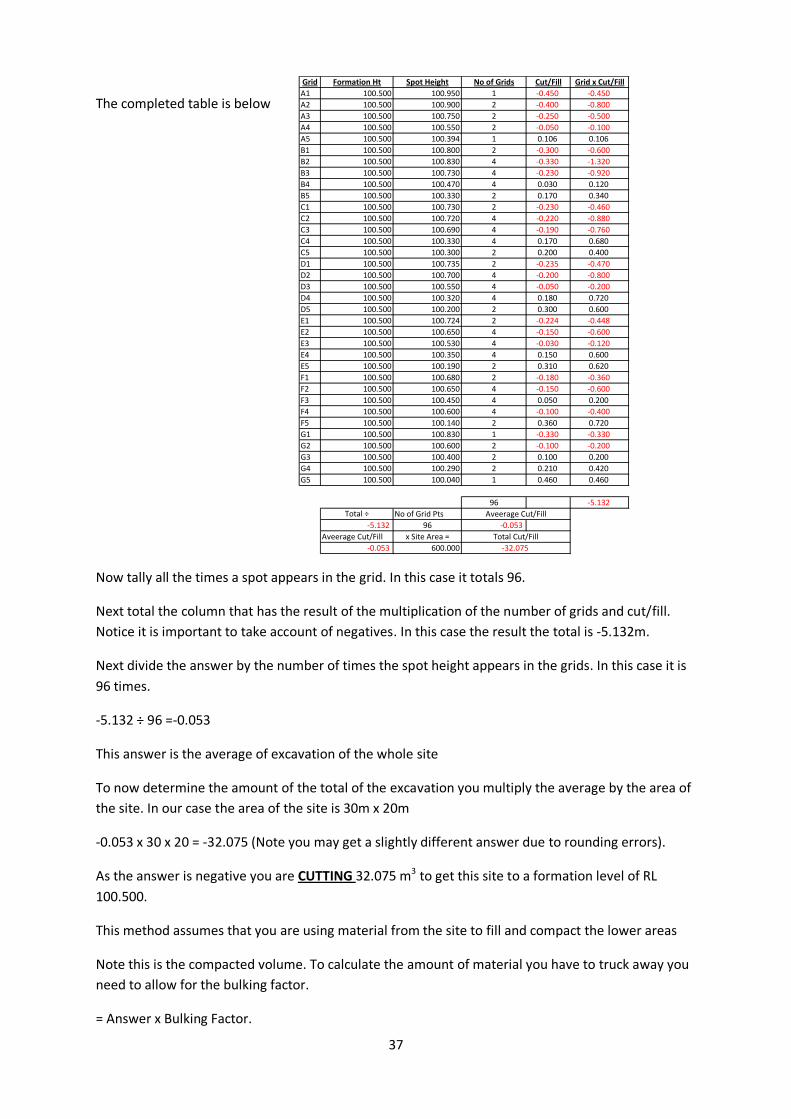
The completed table is below
Now tally all the times a spot appears in the grid. In this case it totals 96.
Next total the column that has the result of the multiplication of the number of grids and cut/fill.
Notice it is important to take account of negatives. In this case the result the total is -5.132m.
Next divide the answer by the number of times the spot height appears in the grids. In this case it is
96 times.
-5.132 ÷ 96 =-0.053
This answer is the average of excavation of the whole site
To now determine the amount of the total of the excavation you multiply the average by the area of
the site. In our case the area of the site is 30m x 20m
-0.053 x 30 x 20 = -32.075 (Note you may get a slightly different answer due to rounding errors).
As the answer is negative you are CUTTING 32.075 m3 to get this site to a formation level of RL
100.500.
This method assumes that you are using material from the site to fill and compact the lower areas
Note this is the compacted volume. To calculate the amount of material you have to truck away you
need to allow for the bulking factor.
= Answer x Bulking Factor.
Grid Formation Ht Spot Height No of Grids Cut/Fill Grid x Cut/Fill
A1 100.500 100.950 1 -0.450 -0.450
A2 100.500 100.900 2 -0.400 -0.800
A3 100.500 100.750 2 -0.250 -0.500
A4 100.500 100.550 2 -0.050 -0.100
A5 100.500 100.394 1 0.106 0.106
B1 100.500 100.800 2 -0.300 -0.600
B2 100.500 100.830 4 -0.330 -1.320
B3 100.500 100.730 4 -0.230 -0.920
B4 100.500 100.470 4 0.030 0.120
B5 100.500 100.330 2 0.170 0.340
C1 100.500 100.730 2 -0.230 -0.460
C2 100.500 100.720 4 -0.220 -0.880
C3 100.500 100.690 4 -0.190 -0.760
C4 100.500 100.330 4 0.170 0.680
C5 100.500 100.300 2 0.200 0.400
D1 100.500 100.735 2 -0.235 -0.470
D2 100.500 100.700 4 -0.200 -0.800
D3 100.500 100.550 4 -0.050 -0.200
D4 100.500 100.320 4 0.180 0.720
D5 100.500 100.200 2 0.300 0.600
E1 100.500 100.724 2 -0.224 -0.448
E2 100.500 100.650 4 -0.150 -0.600
E3 100.500 100.530 4 -0.030 -0.120
E4 100.500 100.350 4 0.150 0.600
E5 100.500 100.190 2 0.310 0.620
F1 100.500 100.680 2 -0.180 -0.360
F2 100.500 100.650 4 -0.150 -0.600
F3 100.500 100.450 4 0.050 0.200
F4 100.500 100.600 4 -0.100 -0.400
F5 100.500 100.140 2 0.360 0.720
G1 100.500 100.830 1 -0.330 -0.330
G2 100.500 100.600 2 -0.100 -0.200
G3 100.500 100.400 2 0.100 0.200
G4 100.500 100.290 2 0.210 0.420
G5 100.500 100.040 1 0.460 0.460
96 -5.132
Total ÷ No of Grid Pts
-5.132 96 -0.053
Aveerage Cut/Fill x Site Area =
-0.053 600.000
Aveerage Cut/Fill
Total Cut/Fill
-32.075
38
If our site was clay to determine how much material you are removing would be calculated as
follows;
-31.8 x 1.4 =- 44.52 m3
If the answer was positive you would need to import fill and to determine the amount using the
shrinkage factor.
Slab Calculation
Some times you do not need to determine the whole area of the site, you may just want to bench
out for a slab.
We solve this in a similar manner.
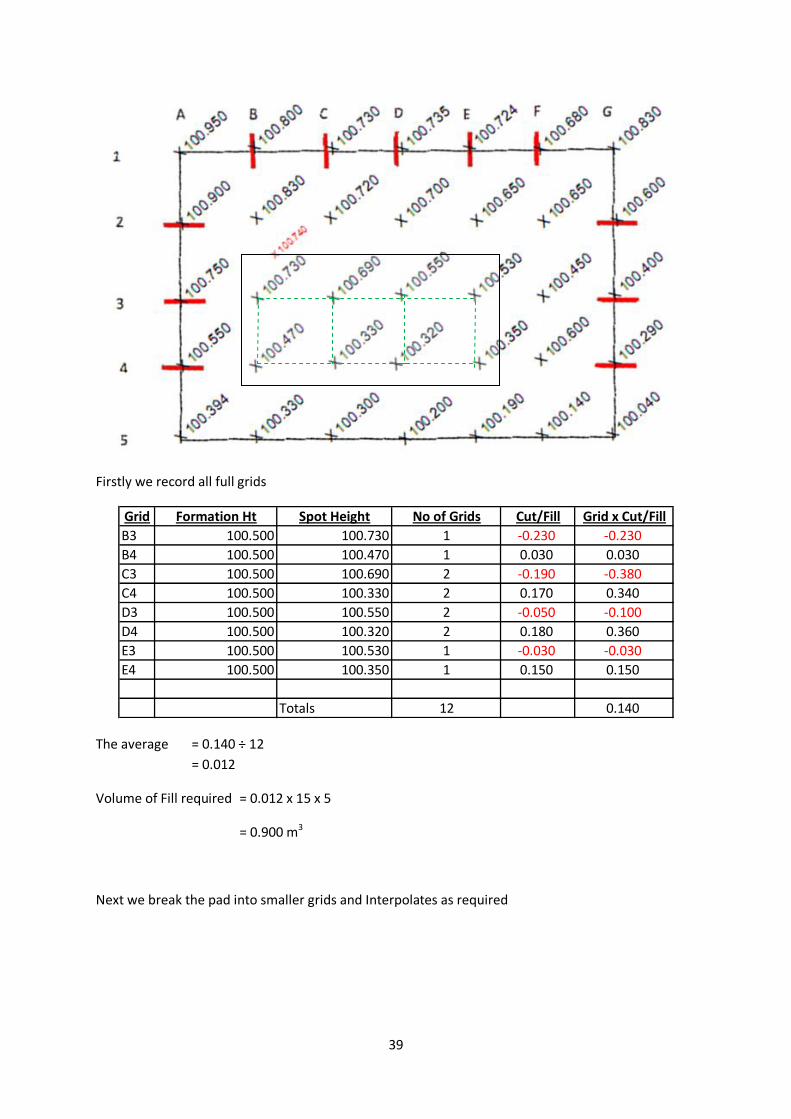
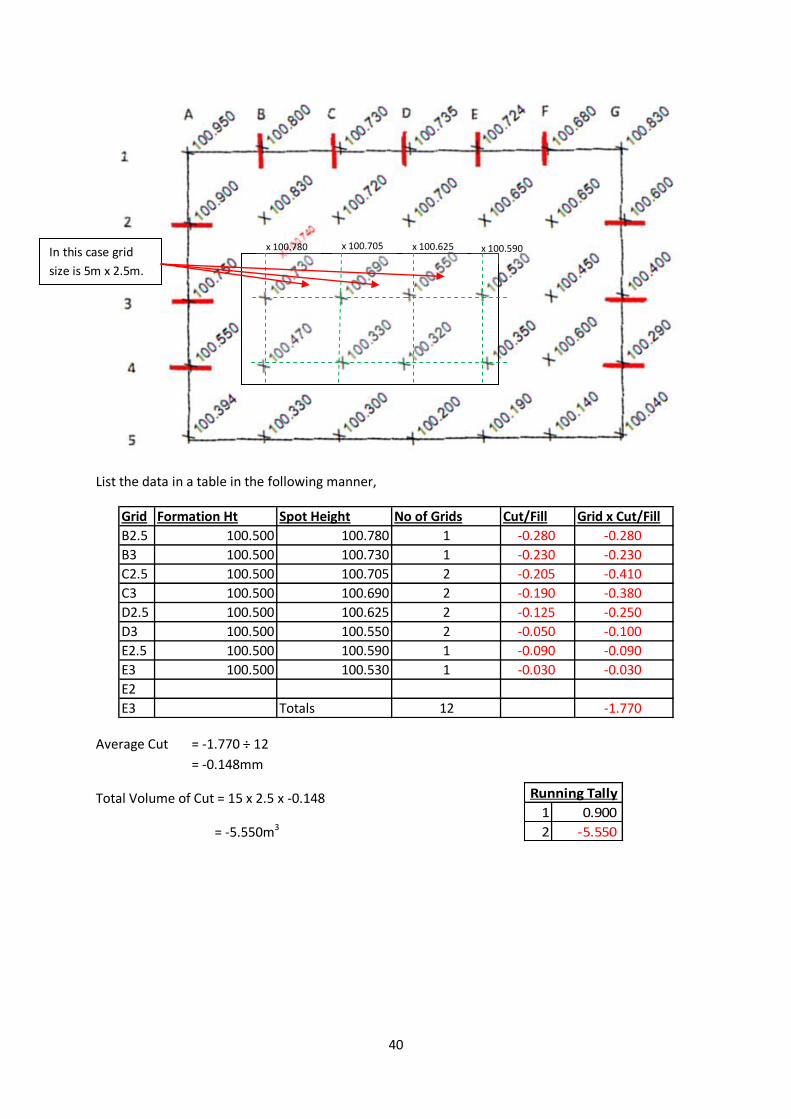
Firstly we record all full grids.
http://www.dur.ac.uk/ - For Educational Purposes only
39
Firstly we record all full grids
Grid Formation Ht Spot Height No of Grids Cut/Fill Grid x Cut/Fill
B3 100.500 100.730 1 -0.230 -0.230
B4 100.500 100.470 1 0.030 0.030
C3 100.500 100.690 2 -0.190 -0.380
C4 100.500 100.330 2 0.170 0.340
D3 100.500 100.550 2 -0.050 -0.100
D4 100.500 100.320 2 0.180 0.360
E3 100.500 100.530 1 -0.030 -0.030
E4 100.500 100.350 1 0.150 0.150
Totals 12 0.140
The average = 0.140 ÷ 12
= 0.012
Volume of Fill required = 0.012 x 15 x 5
= 0.900 m3
Next we break the pad into smaller grids and Interpolates as required
40
1 0.900
2 -5.550
Running Tally
List the data in a table in the following manner,
Grid Formation Ht Spot Height No of Grids Cut/Fill Grid x Cut/Fill
B2.5 100.500 100.780 1 -0.280 -0.280
B3 100.500 100.730 1 -0.230 -0.230
C2.5 100.500 100.705 2 -0.205 -0.410
C3 100.500 100.690 2 -0.190 -0.380
D2.5 100.500 100.625 2 -0.125 -0.250
D3 100.500 100.550 2 -0.050 -0.100
E2.5 100.500 100.590 1 -0.090 -0.090
E3 100.500 100.530 1 -0.030 -0.030
E2
E3 Totals 12 -1.770
Average Cut = -1.770 ÷ 12
= -0.148mm
Total Volume of Cut = 15 x 2.5 x -0.148
= -5.550m3
x 100.705 x 100.780 x 100.625 x 100.590 In this case grid
size is 5m x 2.5m.
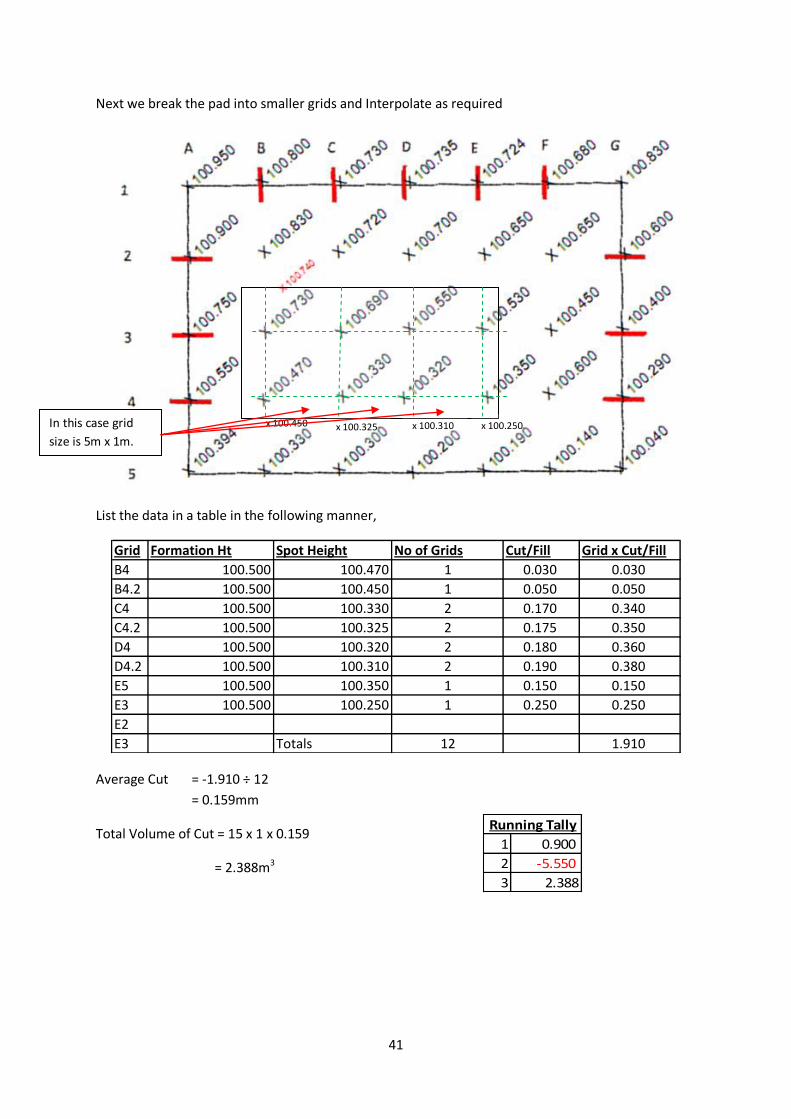
41
1 0.900
2 -5.550
3 2.388
Running Tally
Next we break the pad into smaller grids and Interpolate as required
List the data in a table in the following manner,
Grid Formation Ht Spot Height No of Grids Cut/Fill Grid x Cut/Fill
B4 100.500 100.470 1 0.030 0.030
B4.2 100.500 100.450 1 0.050 0.050
C4 100.500 100.330 2 0.170 0.340
C4.2 100.500 100.325 2 0.175 0.350
D4 100.500 100.320 2 0.180 0.360
D4.2 100.500 100.310 2 0.190 0.380
E5 100.500 100.350 1 0.150 0.150
E3 100.500 100.250 1 0.250 0.250
E2
E3 Totals 12 1.910
Average Cut = -1.910 ÷ 12
= 0.159mm
Total Volume of Cut = 15 x 1 x 0.159
= 2.388m3
x 100.325 x 100.450 x 100.310 x 100.250 In this case grid
size is 5m x 1m.
42
1 0.900
2 -5.550
3 2.388
4 0.033
Running Tally
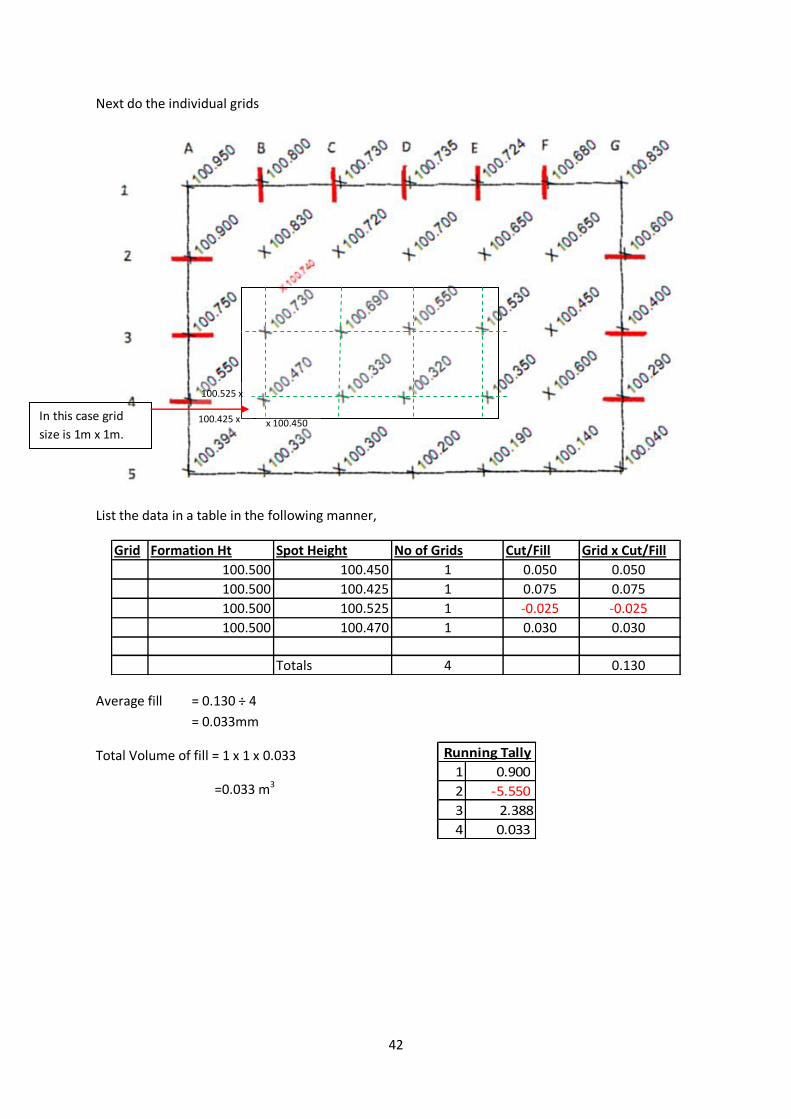
Next do the individual grids
List the data in a table in the following manner,
Grid Formation Ht Spot Height No of Grids Cut/Fill Grid x Cut/Fill
100.500 100.450 1 0.050 0.050
100.500 100.425 1 0.075 0.075
100.500 100.525 1 -0.025 -0.025
100.500 100.470 1 0.030 0.030
Totals 4 0.130
Average fill = 0.130 ÷ 4
= 0.033mm
Total Volume of fill = 1 x 1 x 0.033
=0.033 m3
100.425 x x 100.450
100.525 x
In this case grid
size is 1m x 1m.
43
1 0.900
2 -5.550
3 2.388
4 0.033
5 -0.575
Running Tally
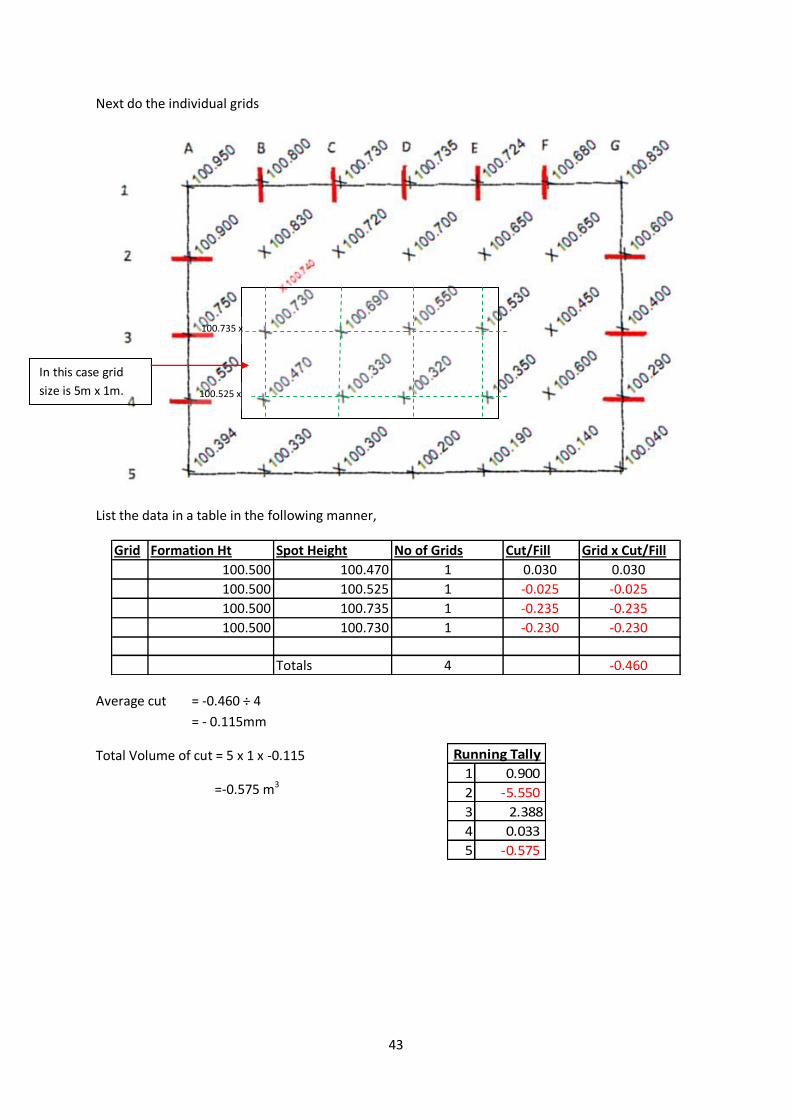
Next do the individual grids
List the data in a table in the following manner,
Grid Formation Ht Spot Height No of Grids Cut/Fill Grid x Cut/Fill
100.500 100.470 1 0.030 0.030
100.500 100.525 1 -0.025 -0.025
100.500 100.735 1 -0.235 -0.235
100.500 100.730 1 -0.230 -0.230
Totals 4 -0.460
Average cut = -0.460 ÷ 4
= - 0.115mm
Total Volume of cut = 5 x 1 x -0.115
=-0.575 m3
100.525 x
100.735 x
In this case grid
size is 5m x 1m.
44
1 0.900
2 -5.550
3 2.388
4 0.033
5 -0.575
6 -0.628
Running Tally
Next do the individual grids
List the data in a table in the following manner,
Grid Formation Ht Spot Height No of Grids Cut/Fill Grid x Cut/Fill
100.500 100.730 1 -0.230 -0.230
100.500 100.740 1 -0.240 -0.240
100.500 100.755 1 -0.255 -0.255
100.500 100.780 1 -0.280 -0.280
Totals 4 -1.005
Average cut = -1.005 ÷ 4
= - 0.251mm
Total Volume of cut = 2.5 x 1 x -0.251
=-0.628 m3
100.755 x
100.735 x
In this case grid
size is 2.5m x 1m.
100.780 x
45
1 0.900
2 -5.550
3 2.388
4 0.033
5 -0.575
6 -0.628
7 -0.096
Running Tally
Next do the individual grids
List the data in a table in the following manner,
Grid Formation Ht Spot Height No of Grids Cut/Fill Grid x Cut/Fill
100.500 100.590 1 -0.090 -0.090
100.500 100.590 1 -0.090 -0.090
100.500 100.510 1 -0.010 -0.010
100.500 100.530 1 -0.030 -0.030
Totals 4 -0.220
Average Cut = -0.220 ÷ 4
= -0.055mm
Total Volume of Cut = 2.5 x 0.7 x -0.055
= -0.096m3
100.590 x x 100.590
x 100.510
In this case grid size
is 2.5m x 0.75m.
46
1 0.900
2 -5.550
3 2.388
4 0.033
5 -0.575
6 -0.628
7 -0.096
8 0.199
Running Tally
Next do the individual grids
List the data in a table in the following manner,
Grid Formation Ht Spot Height No of Grids Cut/Fill Grid x Cut/Fill
100.500 100.530 1 -0.030 -0.030
100.500 100.510 1 -0.010 -0.010
100.500 100.400 1 0.100 0.100
100.500 100.350 1 0.150 0.150
Totals 4 0.210
Average cut = 0.210 ÷ 4
= -0.053mm
Total Volume of cut = 5 x 0.750 x 0.053
=0.199 m3
In this case grid size
is 5m x 0.75m.
x 100.400
x 100.510
47
1 0.900
2 -5.550
3 2.388
4 0.033
5 -0.575
6 -0.628
7 -0.096
8 0.199
9 0.143
Running Tally
Next do the individual grids
List the data in a table in the following manner,
Grid Formation Ht Spot Height No of Grids Cut/Fill Grid x Cut/Fill
100.500 100.350 1 0.150 0.150
100.500 100.400 1 0.100 0.100
100.500 100.240 1 0.260 0.260
100.500 100.250 1 0.250 0.250
Totals 4 0.760
Average cut = 0.760 ÷ 4
= -0.190mm
Total Volume of cut = 1 x 0.750 x 0.190
=0.143 m3
In this case grid size
is 5m x 0.75m.
x 100.400
x 100.510 100.250 x
48
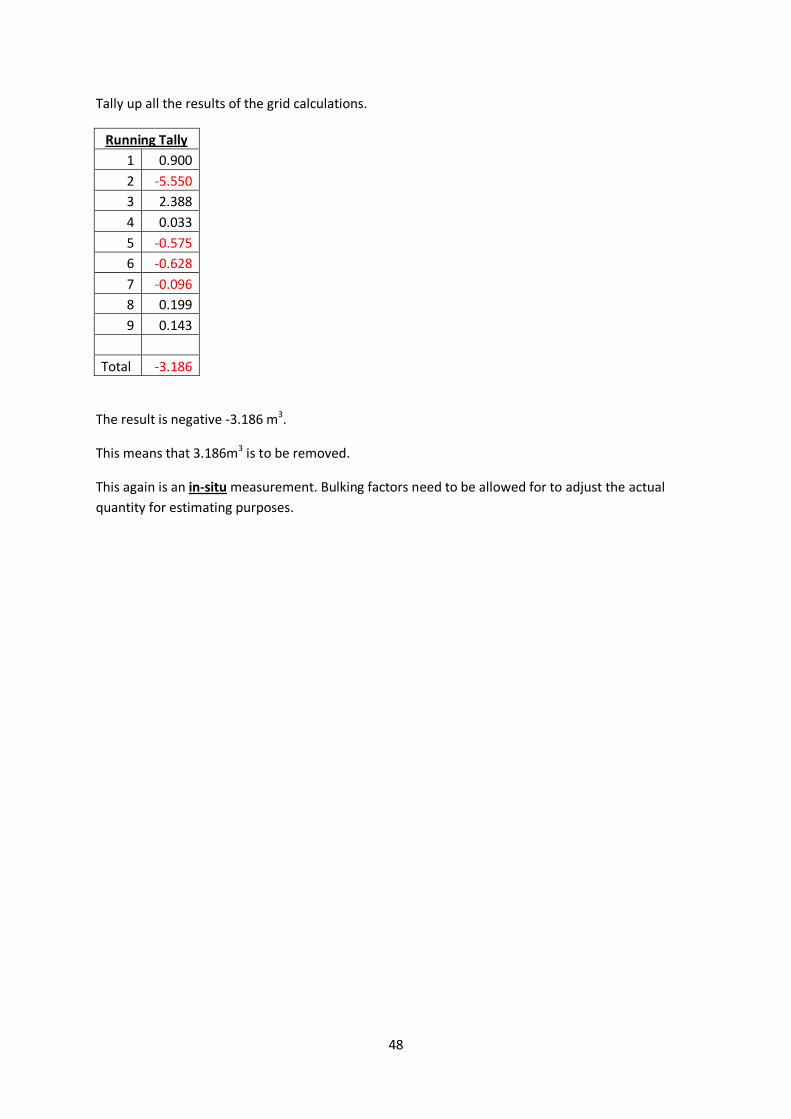
Tally up all the results of the grid calculations.
Running Tally
1 0.900
2 -5.550
3 2.388
4 0.033
5 -0.575
6 -0.628
7 -0.096
8 0.199
9 0.143
Total -3.186
The result is negative -3.186 m3.
This means that 3.186m3 is to be removed.
This again is an in-situ measurement. Bulking factors need to be allowed for to adjust the actual
quantity for estimating purposes.


![David Fischer fonds - UBC Library Home · Catalogue entry (UBC Library catalogue) Fonds Description David Lloyd Fischer fonds. – 1977 – 200[7]. 9 volumes (art books). 106 drawings](https://img.pdfslide.us/doc/110x75/5fac4d6593116211d95e175a/david-fischer-fonds-ubc-library-catalogue-entry-ubc-library-catalogue-fonds.jpg)
![NSW State Archives Access... · Stage machinery: assembly drawings tor Major Hall, Minor Hall and Experimental Theatre [Sydney Opera House] This series consists ot volumes containing](https://img.pdfslide.us/doc/110x75/60583a58bac5014cdf692364/nsw-state-archives-access-stage-machinery-assembly-drawings-tor-major-hall.jpg)