Embed Size (px)
Citation preview
U. S. DEPARTMENT OF COMMERCE NATIONAL BUREAU OF STANDARDS
RESEARCH PAPER RP1268
Part of Jou1'nal of Research of the JXational Bureau of Standards, Volume 24. January 1940
DETERMINATION OF URONIC ACIDS IN CELLULOSIC MATERIALS
By Roy L. Whistler, Albert R. Martin, and Milton Harris 1
ABSTRACT
Methods for the determination of uronic acids, based on the estimation of the amount of carbon dioxide evolved by these acids in a given length of time during treatment with a boiling solution of hydrochloric acid, were found to fail when cellulose or other carbohydrate material was present, since these substances also decomposed with the evolution of some carbon dioxide. An investigation of the rates of evolution showed that pure uronic acids evolved carbon dioxide at a rapid rate and that the evolution was complete in several hours. Carbohydrates, free of uronic acids, evolved carbon dioxide at a much slower rate, which remained approximately constant during the entire treatment with acid. It is shown that this difference in rates can be used as the basis for estimating uronic acids, even when they are mixed with large proportions of cellulosic materials. A detailed description of the apparatus and its manipulation is given.
CONTENTS Page
1. Introduction__ __ _ _ _ _ __ _ _ _ _ _ _ _ _ _ _ _ _ __ _ _ __ _ _ _ _ _ _ __ _ _ __ __ _ _ _ _ __ _ _ _ _ 13 II. Description of apparatus and method______________________________ 14
III. Experimental results and discussion________________________________ 17 IV. References_____ __ _ _ _ __ _ _ _ _ _ _ _ _ _ _ _ _ _ __ _ _____ _ _ _ __ _ _ __ _ __ _ _ _ __ _ _ __ 23
I. INTRODUCTION As part of a Bureau program of research relating to the structure of
cotton fibers, it was necessary to measure the uronic acid content of cotton, both before and after the application of a variety of treatments. Such analyses necessitated the nieasurement of small quantities of uronic acids when mixed with large proportions of other carbohydrate material.
Uronic acids in contact with boiling solutions of hydrochloric acid undergo complete decarboxylation.
CHOH
?HOH I CHOH 0----.C02
6HOH I 6H~
: ----1-----: , ,
i cooiH , , , , , , ! ._---------!
1 Research Associates at the National Bureau of Standards, representing the '.rextiJe Foundation.
13
------------------- ~ - -- ~ --~-
14 Journal oj Research oj the National Bureau oj Standards [Vol.f4
Proceeding from this observation, Lefevre and Tollens [1]2 developed a method for the quantitative determination of uronic acids. The decarboxylation of the uronic acid was accomplished by boiling it in a solution of hydrochloric acid of specific gravity 1.06. A stream of carbon dioxide-free air drawn through the apparatus carried the evolved carbon dioxide from the reaction flask through a reflux condenser into a Peligot tube containing water to remove traces of hydrochloric acid, then through a drying tube, and finally into a weighed potash bulb. This procedure has since undergone numerous modifications [2 to 11]. The subsequent methods differ for the most part in the manner in which the carbon dioxide is collected and determined, and in the length of time necessary to bring the reaction to completion. The length of time recommended as necessary for complete decarboxylation has ranged from 3}f to 10 hours.
Although these methods gave good results when applied to pure uronic acids, considerable difficulty was encountered when they were used on such materials as cotton fibers or other carbohydrate mix-tures. Under the drastic conditions employed in the analysis, it was found that uronic acid-free carbohydrates decomposed with the evolution of carbon dioxide. For example, when pure glucose was treated with a boiling 12-percent solution of hydrochloric acid, carbon dioxide was continuously evolved; the evolution was appreciable even after 30 hours. A study of the rates of evolution of carbon dioxide revealed that in the case of pure uronic acids there occurred an initial rapid evolution of carbon dioxide which ceased after several hours. On the other hand, carbohydrates which did not contain uronic acid groups evolved carbon dioxide at a much slower but approximately constant rate during the entire treatment with acid. A mixture of uronic acids with other carbohydrate material gave an initial rapid evolution of carbon dioxide followed by a slower but steady evolution of the gas.
During the time that the present work was in progress, there appeared three papers [12, 13, 14] from other laboratories, reporting findings relative to the evolution of carbon dioxide from a number of pure sugars and polysaccharides. Norman [13] pointed out that the presence of uronic acid groups could be inferred from the rate of evolution of carbon dioxide (a fact which we had noted independently) and stated that no quantitative significance could be attached to the ,..J
small yields of carbon dioxide from polysaccharides. In the present investigation, a critical study was made of the
factors which influence the rates of evolution of carbon dioxide from uronic acids, glucose, and cellulose fibers during treatment with hydrochloric acid. As a result of these studies, it has been possible to develop a new method for the precise estimation of small quantities of uronic acids in the presence of cellulosic materials.
II. DESCRIPTION OF APPARATUS AND METHOD
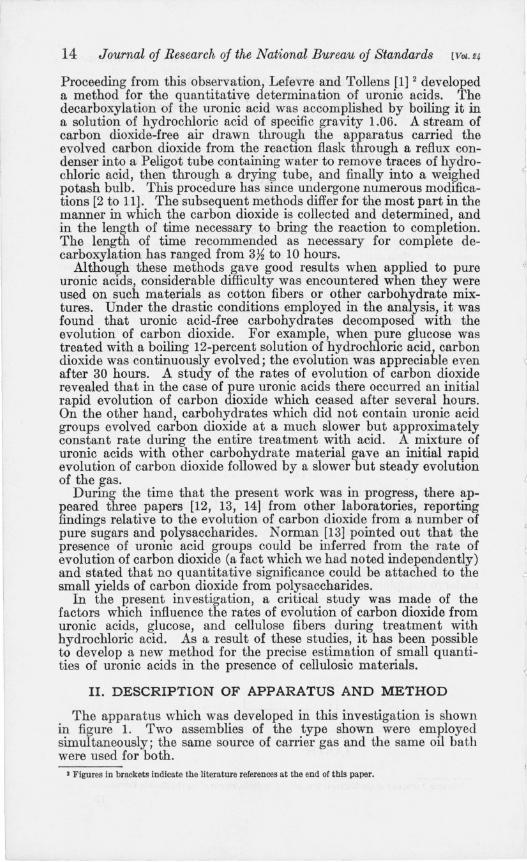
The apparatus which was developed in this investigation is shown in figure 1. Two assemblies of the type shown were employed simultaneously; the same source of carrier gas and the same oil bath were used for both.
, Figures in brackets indicate the literature references at the end of this paper.
Whistler, Martin] Harris Determination oj Uremic Acids 15
Nitrogen, which is used as the carrier gas for the evolved carbon dioxide, enters the apparatus through an empty safety bottle, A. It next passes through an alkaline solution of :pyrogallol, B. The inlet tube in this bottle is drawn out to a small orifice which produces very fine bubbles. From B the gas passes through two absorption towers, 0, filled with soda lime, into a second safety bottle, D, which is provided with a mercury manometer, E, and then enters the reaction flask, F, by way of a side arm whose outlet is 10 to 15 mm above the surface of the liquid in the flask. The size of the flask depends upon the type of material and the size of the sample to be analyzed. In most of the experiments a 500-ml reaction flask was used. From the reaction flask the gas passes through a 40-cm reflux condenser, G, and into a bubbling tower, H, containing approximately 60 ml of concentrated sulfuric acid. The sulfuric acid serves to remove interfering decomposition products which are carried over from the reaction flask. 3 The gas next passes through
AB C
FIGURE I.-Apparatus for determination of the rate oj evolution of carbon dioxide from uronic acids or materials containing uronic acids during treatment with hydl'ochloric acid.
(The apparatus is not drawn to scale. See text for dimensions.)
the U-tube, I, which is filled with anhydrous copper sulfate,4 then :;l through the tube, J, which contains phosphorus pentoxide, and
finally through the carbon dioxide-absorption tube, K, containing ascarite, backed by phosphorus pentoxide. The absorption tubes, K, are connected into the train by means of mercury-cup seals [15]. This type of connection makes possible a rapid exchange of the absorption tubes. Tube K is protected by a soda-lime tube, L, which is followed by a~lcalibrated flowmeter, M, for estimating the rate of flow of nitrogen throu~h the apparatus.
The reaction flask IS immersed in a vessel containing about 16 liters of hydrogenated cottonseed oil. A bath temperature of 1300 C was found to be optimum for maintaining a steady but gentle boiling of the reaction mixture. The bath is brought to the operating t,emperature by means of two electric immersion heaters, one of 500 and one of 1,000 watts. When the desired temperature is reached,
:;> 'An aniline· hydrochloric acid mixture may also be used to remove volatile products, but in our work it was fouud to be less efficient than R,SO,.
• A precaution necessary in systems where chlorine or hydrogen sulfide might be formed. 198881-4()-""2
1
---- --------- --------------- ~-- -- -- ----~I
16 Journal oj Research~oj the~National Bureau oj Standards [VOl. 14
the 500-watt heater alone is sufficient to maintain thermal constancy within ± 0.20 C. The time required to raise the temperature of the bath to 1300 C is approximately 50 minutes.
The sample to be analyzed is placed in the reaction flask, F. The optimum size of the sample depends upon its uronic acid content. When working with a material such as cotton, which contains a relatively small proportion of uronic acids, it is advisable to use samples of approximately 10 g, although good results may be obtained with smaller samples. A sample of this size is readily covered by 300 ml of the hydrochloric acid solution. Varying the ratio of acid solution to sample within reasonable limits does not affect the results. Thorough wetting of the sample by the acid solution is accomplished by evacuating the air in the flask with a filter pump.
The flask is placed in position in the oil bath so that the oil level is 3 to 4 mm lower than the liquid level inside of the flask. This precaution is taken to prevent the baking of small bits of sample which may be splashed against the sides of the flask. Nitrogen, at the rate of about 10 liters per hour, is passed through the apparatus until the ascarite tube, K, shows no further gain in weight. This operation requires about 30 minutes, during which time the temperature of the oil bath is slowly raised to 500 C. When the apparatus is free of carbon dioxide, both heating units are turned on and the temperature brought to 1300 C. This procedure is always carefully followed in order to assure the same preliminary heating for all samples. The point of zero time is taken as the time at which the bath reaches 1300 C. At that time the ascarite tube, K, is removed for weighing and a second weighed ascarite tube inserted in its place. At the end of 1 hour the second tube is removed for weighing and replaced by the first. This process is repeated at intervals of 1 hour for the duration of the analysis. When analyses are made on pure uronic acids or materials rich in uronic acids, a small amount of carbon dioxide is evolved by the time the temperature of the bath reaches 1300 C. In these cases, this amount is measured and added to that evolved during the first hour.
Previous investigators have suggested that the tube entering the reaction flask, F, extend into the reaction mixture in order to prevent bumping. However, it was found that there is no tendency to bump when a 12-percent solution of acid and an oil-bath temperature of 1300 C are used. On the other hand, it is found advantageous to have this tube terminate above the surface of the liquid. With this arrangement there is no tendency toward different amounts of agitation resulting from slight variations in the rate of flow of the carrier gas. Furthermore, there is less tendency for the gas stream to carry interfering products from the reaction mixture into the sulfuric acid tower, H. That no secondary reaction occurs from the action of sulfuric acid on the volatile substances, which interferes with the determination, was demonstrated by SUbstituting a U-tube cooled in a mixture of solid carbon dioxide and trichloroethylene for the sulfuric acid tower, H. Identical results were obtained under both conditions.
The length of time required to sweep the carbon dioxide from the reaction flask into the absorption tubes was determined by the use of a known quantity of pure sodium carbonate. The sample was weighed in a glass tube, and the ends were sealed with paraffin. The tube was placed in an acid solution in the reaction flask and the train
I
I
1

Mllt/er, Martin] HarTlI Determination oj Uronic Acids 17
swept out with nitrogen. The temperature of the bath was then raised until the paraffin plugs loosened and allowed the acid to come in contact with the sample of carbonate. Since the reaction is extremely rapid, it was easy to determine the moment at which the carbon dioxide was released into the system. This procedure was repeated several times, a different rate of nitrogen flow being used in each case. It was found that with a gas flow of 10 liters per hour, all the carbon dioxide was absorbed by the ascarite in less than 30 minutes.
III. EXPERIMENTAL RESULTS AND DISCUSSION
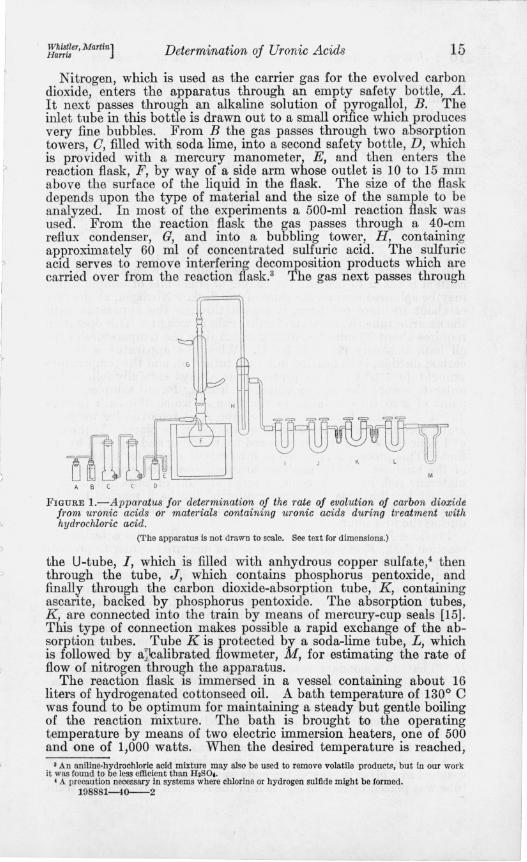
The rate of evolution of carbon dioxide from pure galacturonic acid monohydrate in 11-, 12-, and l3-percent solutions 5 of hydrochloric
250,--------------------------------------------.
:2' <t
200
~ 150 -0:: w a.
2 3
• 13 % Hel () 12 % o I I % "
4 5 6 7 8 T IME IN HO URS
FIGURE 2.-Rate of evolution of carbon dioxide from galacturonic acid monohydrate.
acid is shown in figure 2. The curves show that an initial, rapid evolution of carbon dioxide occurs and that the evolution ceases after about 4 hours. A total of 208 mg of carbon dioxide per gram of galacturonic acid monohydrate was obtained (the theoretical yield is 207.5 mg) . Increasing the concentration of acid increases the rate of evolution but does not affect the total amount of gas evolved.
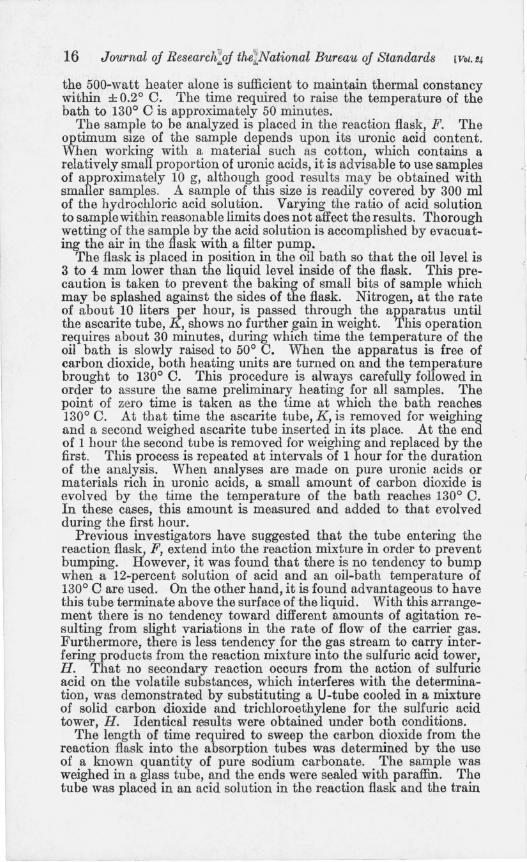
Similar treatment of pure glucose in solutions of hydrochloric acid gives very different results, as shown in figure 3. The amounts of carbon dioxide evolved are small 6 compared with the amOlmts obtained from galacturonic acid under similar conditions. The rate of evolution increases with increasing acid concentration; but unlike the case of the galacturonic acid, the evolution of gas continues, except in the
• Tbese solutions containod no. 120. and lao g o( bydrogen ~bloride per liter of solution. • Because of tbe small amount of CO. evolved, lO·g samples of glucose were used (or eacb analysis.
\ I

18 Journal oj Research oj the National Bureau oj Standards [Vol. !4
most concentrated acid solutions, at an approximately constant rate for the duration of the analysis.
The amount of carbon dIOxide obtained from pure glucose is very 7
6 • 14 % Hel () 12 % () II 0,(,
~ 5 <1 0 10% 0::
" 4 0:: W D-
0 3 '-' 0 ::< 2
~=-~ __ ~L-__ ~ ____ L-__ ~ __ ~ ____ ~ ____ L-__ ~ __ ~
3 4 5 6 7 8 9 10
TIME IN HOURS
FIGURE 3.-Rate of evolution of carbon dioxide from glucose.
small compared with that obtained from pure galacturonic acid; but it is obvious that in naturally occurring cellulosic materials, such as
5 •
4
~ <1 0::
'" 0::
3 w "-
0 '-' <9 ~ 2
• 13 % Hel () 12 % 0 II 0,(,
OL----L--~----_L--~ ____ ~ __ ~ ____ ~ __ ~ __ ~
o 23 456789
TIME IN HOURS
FIGURE 4.-Rate of evolution of carbon dioxide from dewaxed cotton.
cotton, which contain only small amounts of uronic acids, the amount of carbon dioxide evolved by that portion of the material which does not contain uronic acid groups may be an appreciable part of the total.
I <;
I
i C.

Whistler, Martin] Harris Determination of Uronic Acids 19
This is shown by the curves for dewaxed cotton 7 in figure 4. An examination of these curves indicates that they are probably composites of curves of the types found in figures 2 and 3. The rapid evolution of carbon dioxide during the first 3 hours, as indicated by the steep slopes of the curves, is characteristic of uronic acids. After the 3-hour period the evolution of gas does not cease but continues at a slower but constant rate characteristic of carbohydrates which do not contain uronic acid groups. As in the previous experiments, the rate of evolution of gas increases with increasing acid concentrations.
On the basis of the results shown in figures 2, 3, and 4, a 12-percent solution (3.290 N) of hydrochloric acid was chosen as a satisfactory concentration for the decarboxylation of uronic acids in the presence
(j)
;;0 <t
70
60
:'550 .J .J ;;;; z 40-
'" o u
.J <t 1-o
30
1- 20 -
10
• 0.1000 G. GALACTURON1C ACID ~ tO,OO G. GLUCOSE
o 10 00 G GLUCOSE
() 0 1000 G GALACTURONIC ACID
c
B
A
2 3 4 5 6 7 8 9
TIME IN HOURS
::. FIGURE 5.- Rate of evolution of carbon dioxide from glucose, galacturonic acid, and a mixture of both.
of other carbohydrate material.s In lower concentrations of acid the decarboxylation of the uronic acids proceeds too slowly for convenience, whereas in acids of higher concentration the decomposition of the carbohydrate itself is too rapid and erratic. Since the rate of evolution of carbon dioxide is appreciably affected by variations in acid strength, it is essential that the same concentration (within 0.02 percent) of acid be used in all comparative studies.
That the results obtained with dewaxed cotton probably represent the behavior of a mixture of uronic acids and other carbohvdrate materials was further indicated by studying the evolution of carbon dioxide from glucose, galacturonic acid, and a known mixture of the two. The results are shown in figure 5. Curve 0, which represents
7 Dewaxed cotton refers to cotton whIch has undergone 24·hour extractions each with alcohol and with dlethyJ ether.
8 This concentration was used in olJ subsequent experiments.

20 Journal oj Research oj the National Bureau oj Standards [Vol.'4
the total amount of carbon dioxide evolved from a mixture of 10.00 g of glucose and 0.100 g of galacturonic acid monohydrate, is similar in shape to the curves in figure 4. The total amount of carbon dioxide evolved by the mixture at any time, as shown by curve 0, is equal to the sum of the amounts evolved by each of the components in the same time, as shown by curves A and B. The good agreement of the data is seen in table 1. "-
Oonversely, it follows that the amount of carbon dioxide evolved from uronic acid groups in this or similar mixtures can be readily estimated from the differences between the ordinates of the parallel portions of the curves Band O. The average of these differences, taken from the data in table 1, is 20.5 mg of carbon dioxide (theory, 20.75mg).
TABLE I.-Evolution of carbon dioxide from galacturonic acid, glucose, and a mixture of both
1 2 3 4 - - ------
Time 0.100 g of galacturo· 10.00 g of H2 H2 nlc acid (monohy. glucose calculated found
drate)
Hours mg mg my my 1 14. 3 4.5 18.8 20.0 2 18.7 10.8 29.5 28.7 3 20.0 16.4 36.4 35.2 4 20.6 21.8 42. 4 41.5 5 20.8 26. 4 47.2 46. 0 6 20.8 31.3 52.1 lit. 7 7 20.8 3li.4 66.2 56.3 8 20.8 39.1 li9.9 60.3
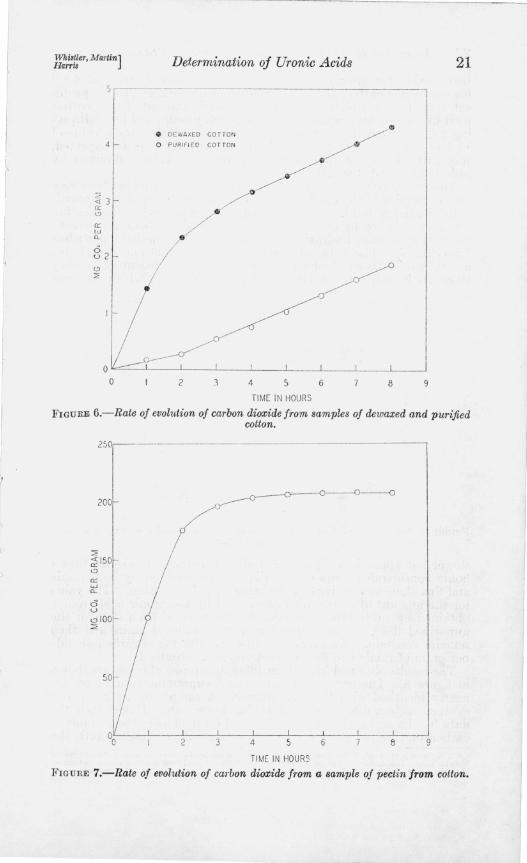
The curves shown in figure 6 were obtained from samples of dewaxed cotton and from cotton which had been purified by boiling for 7~ hours in a I-percent solution of sodium hydroxide according to the methods recommended for the preparation of standard cotton cellulose [16, 17, 18]. With the exceptIOn of the induction period during the first 2 hours, the curve for purified cotton is similar in shape to that for glucose. It shows no initial, rapid rise, characteristic of the uronic acids, and indicates that cotton purified in this manner is free from a measurable amount of uronic acids. The amount of carbon dioxide evolved from the uronic groups in the dewaxed cotton is obtained by taking the average distance between the parallel portions of the curves, which gives a value of 2.4 mg of carbon dioxide per gram of cotton.
It has ~enerally beeu assumed that the uronic acids in native cotton are contamed in the pectic g substance of the fiber. Further evidence for this assumption is shown in figure 7. The carbon dioxide-rate curve of the pectin 10 is very similar in shape to that obtained for galacturonic acid (fig. 2), and reaches a maXImum at 208 mg of car-
I Pectic substance has been defined by the ACS committee on nomenclature of pectin [19J as 8 complex carbohydrate derivative whieh is characterized by the presence of galacturonic acid units.
" The pectin used In these experiments was obtained from the cotton by the well·known method of extraction with ammonium oxala~. A description of the preparation and properties of tbis pectin Is being \;; prepared for publication. I
1 I
? I
I
Whi.tler. MaTtin ] Harris
~ 3 0::
'" a:: w "-
82 '" ;;;:
Determination oj Uronic Acids
-------------------------1
~ DEY/AXED COTTO N
o PURIFIED COTTON
O ~~-L----~--~ ____ _L ____ L__~~ __ L_ __ ~
o 2 3 4 5 6 7 8
TIME IN HOURS
21
FIGURE 6.-Rate of evolt!tion of carbon dioxide from samples of dewaxed and purified cotton.
2S0'~----
200
TIME IN HOURS
FIGUHE 7.-Rate of evolution of carbon dioxide from a sample of pectin from cotton.

r
22 Journal oj Research oj the National Bureau oj Standards [Vol. 34
bon dioxide per gram of ~ectin. From this value a factor of 4.8 !1
for converting carbon dioxIde, formed from uronic acids, to the pectin extracted from cotton is obtained. The pectin content of the cotton used in the present work may then be roughly estimated by multiplying 2.4 mg (from the curves in fig. 6) by 4.8, which gives a value of 11.5 mg of pectin per gram, or 1.15 percent. As is to be expected, this value is higher t.han previously reported values obtained by isolation methods [20, 21].
The uronic acid contents of a number of other cellulosic fibers were also determined. Table 2 shows the results obtained from decorticated ramie, retted flax, and purified samples of both. Purification was accomplished by treatment of the fibers with a boiling I-percent solution of sodium hydroxide for 4 hours by the methods described for cellulose. The data for the decorticated ramie and retted flax are similar t.o those obtained for dewaxed cotton, inasmuch as they show an initial, rapid evolution of carbon dioxide, which becomes
7r-------------------------------------------, A GLUCOSE
6 0 VISCOSE RAYON
::;; 5 <J: 0: <.!) 4 0:: W "-
0'" 3 o lO ::;; 2
o CUPRAMMON!UM RAYON
() ACETATE RAYON
• PURIFIED CELLULOSE
TIME IN HOURS
o o
FIGURE 8.-Rate of et'olution of carbon dioxide from samples of rayon, glucose, and purified cotton
slower but approximately constant after 4 hours. During the first 4 hours considerably more carbon dioxide was evolved by both ramie and flax than was evolved in the same period by cotton. The value for the amount of carbon dioxide evolved by the uronic acid groups, obtained by subtracting the value for the purified from that for the unpurified fiber, reaches a maximum after about 4 hours and then remains constant. An average of 10.4 and 10.2 mg of carbon dioxide per gram of ramie and flax, respectively, was obtained.
The results obtained from three different samples of rayon are shown in figure 8. The curves for viscose and cuprammonium rayon are nearly identical with that for glucose. A sample of acetate rayon evolved carbon dioxide at a somewhat lower rate. However, if the data for the acetate rayon are calculated on the basis of milligrams of carbon dioxide per gram of cellulose instead of cellulose acetate, the
II This factor is valid only if it is assumed that the pectin has not been appreciahly altered durIng removal from the fiber. Justification for the use of such a factol will depend on obtaining similar results on samples of pectin removed from cotton by several different methods. Work along this line is in progres3.
1 I

Whistler, Martin] Harris Determination oj Uronic Acids 23
results are very similar to those for the viscose or cuprammonium rayon. The curves for these 'samples indicate that they are free of uronic acids.
TABLE 2.-Amount of carbon dioxide evolved from the ul'onic acid groups of ramie and flax fibers
Ramie Flax Dura-tion of treat- Decort!- Uronic Uronic ment Purified acid-carbon Retted Purified acid-carbon cated dioxide dioxide
Hours mu/u mg/(I m% m(l/O m(l/O m(l/O I 5.4 0.3 5. I 5.4 0.3 5. I 2 8.5 .5 8.0 8.7 .7 8.0 3 10. I .6 9. 5 10.2 1.0 9.1 4 10.9 .7 10.2 11. 2 1.4 9.8 5 II. 4 1.0 10.3 II. 7 1.6 10. I
6 II. 0 1.4 10.5 12.2 1.9 10.3 7 12.0 1.7 10.3 12. 5 2.3 10. 2 8 12.4 2.0 10.4 12.8 2.6 10.2 9 12.7 2. 3 10.4 13. I 3.0 10. I
A carbon dioxide-rate curve for purified cotton cellulose is included for comparison. It is of interest to note that the slope of this curve is quite different from that of glucose or the regenerated fibers.
IV. REFERENCES
[1] K. V. Lefevre and B. Tollens, Bel'. deut. chem. Ges. 40, 4513 (1907). [2] A. W. van del' Haar, Anleitung zum Nachweis, zur Trennung und Bestim
mung del' Monosaccharide und Aldehydesauren, p. 71 (Gebriider Borntraeger, Berlin, 1920).
[3] D. R. Nanji, F. T. Paton, and A. R. Ling, J. Soc. Chem. Ind. U, 253T (1925). [4] W. H. Dore, J. Am. Chem. Soc. <l8, 232 (1926). [5] R. B. McKinnis, J. Am. Chem. Soc. 50, 1911 (1928) [6] F. Ehrlich and F. Schubert, Ber. deut. chem. Ges. 62, 1974 (1929). [7] A. D. Dickson, H. Otterson, and K. P. Link, J. Am. Chem. Soc. 52, 775
(1930). [8] C. M. Conrad, J. Am. Chem. Soc. 53, 1999 (1931). [9] G. Klein, Handbuch del' Pflanzenanalyse 3, 121 (Julius Springer, Vienna,
1932). [10] H. W. Buston, Analyst, 57, 207 (1932). [11] B. Burkhart, L. Baur, and K. P. Link, J. BioI. Chem. 10<l, 171 (1934). [12] W. G. Campbell, E. L. Hirst, and G. T. Young, Nature !<l2, 912 (1938). [13] A. G. Norman, Nature !<l3, 284 (1939). [14] H. Colin and S. Lemayne, Bu.I. soc. chim. bioI. 20, 343 (1939). [15] W. F. Hillebrand and G. E. F. Lundell, Applied Inorganic Analysis, p. 623
(John Wiley & Sons, New York, N. Y., 1929). [16] Report of the Committee of the Division of Cellulose Chemistry of the
American Chemical Society, Ind. Eng. Chem. 15, 748 (1923). [17] A. B. Corey and H. L. Grey, Ind. Eng. Chem. 16,853,1130 (1924). [18] R. K. Worner and R. T. Mease, J. Research NBS 21, 609 (1938) RP1146. [19] American Chemical Society Committee on Nomenclature of Pectin of the
Agricultural Food Division. Definitions. J. Am. Chem. Soc. (Proc.) <l9, 37 (1927).
[20] S. A. Harris and H. J. Thompson, Contributions from Boyce Thompson Institute 9, 1 (1937).
[21] J. T. Marsh and F. C. Wood, An Introduction to the Chemistry of Cellulose, p. 12 (Chapman and Hall, London, 1938).
WASHINGTON, October 25, 1939.