Embed Size (px)
Citation preview

Jiawen Zhu
DETERMINATION OF TITANIUM DIOXIDE IN LIMESTONE BY
DIANTIPYRINE METHANE PHOTOMETRIC METHOD
Thesis
CENTRIA UNIVERSITY OF APPLIED SCIENCES
Environmental Chemistry amp Technology
June 2020
ABSTRACT
Centria University
of Applied Sciences
Date
June 2020
Author
Jiawen Zhu
Degree programme
Environmental Chemistry and Technology
Name of thesis
DETERMINATION OF TITANIUM DIOXIDE IN LIMESTONE BY DIANTIPYRINE ME-
THANE PHOTOMETRIC METHOD
Instructor
Pages
32
Supervisor
Yue Dong
Iron ore contains useless gangue (useless rock or tailings containing useful metals or minerals) in iron-
making the main component of gangue is silica dioxide In the process of ironmaking iron is changed
into liquid state at high temperature Because the melting point of silica is very high this particle im-
purity is mixed in molten iron In order to remove this impurity limestone is chosen as the agent of
fusion The reason for choosing limestone as flux is that limestone will decompose into calcium oxide
and carbon dioxide at high temperature Calcium oxide reacts with silica at high temperature to form
calcium silicate with lower melting point than that of molten iron Because the density of liquid calcium
silicate is smaller than that of molten iron and molten iron and liquid calcium silicate are insoluble
Liquid calcium silicate floats on the molten iron
Because micro alloyed steel and pure steel (steel with few non-metallic inclusions and gases or steel
with few harmful elements such as oxygen sulfur phosphorus hydrogen and nitrogen) have higher
requirements for non-metallic inclusion control (in the process of steelmaking a small amount of slag
refractories and reaction products are formed by entering the molten steel) of steel Titanium is one of
the important alloy elements In addition to its strong deoxidizing ability it can also denature non-
metallic inclusions in steel thus improving the mechanical properties of steel Therefore adding proper
amount of titanium into steel has an important influence on the quality of steel what kind of inclusions
are formed and the shape of inclusions Therefore the accurate determination of titanium dioxide in
limestone is of great significance to the control of inclusions in steel
The spectrophotometer is a common device This method does not have high requirements on the la-
boratory The diantipyryl methane (DAPM) photometric method is a color reagent with less interference
and has strong adaptability In this experiment the DAPM photometric method will be used to measure
titanium dioxide in limestone
Key words
Ascorbic acid Diantipyryl methane Limestone Silicon dioxide Spectrophotometer
CONCEPT DEFINITIONS
List of abbreviations
Al2O3 Aluminum oxide
CaCO3 Calcium carbonate
CaO Calcium oxide
DAPM Diantipyryl methane
EDTA Ethylene Diamine Tetraacetic Acid
Fe2O3 Iron oxide
Fe2+ Ferrous iron
HClO4 Perchloric acid
HNO3 Nitric acid
H2O2 Hydrogen peroxide
H2SO4 Sulfuric acid
H3PO4 Phosphoric acid
HF Hydrofluoric acid
ICP-AES Inductively Coupled Plasma-Atomic Emission Spectroscopy
MgO Magnesium oxide
SiO2 Silicon dioxide
TiO2 Titanium dioxide
TiO2+ Titanium oxide ion
Ti3+ Titanium ion
UV-vis Ultraviolet visible
XRF X-ray fluorescence
ABSTRACT
CONCEPT DEFINITIONS
CONTENTS
1 INTRODUCTION 1
2 DETERMINATION OF TITANIUM DIOXIDE IN INDUSTRIAL RAW MATERIALS 3
21 Spectrophotometer 3
22 Diantipyryl methane spectrophotometry 6
23 Inductively coupled plasma atomic emission spectrometry 7
24 Titration analysis 9
25 X-ray fluorescence spectrometry 10
26 Hydrogen peroxide photometry and ferrotitanium spectrophotometry 13
3 EXPERIMENT 14
31 Reagents and reagents preparation 14
32 Experimental procedure 15
33 Procedure of sample decomposition 15
34 Procedure of color rendering 16
35 Procedure of the absorbance measuring 19
36 Interference test of calcium and magnesium ions 20
4 RESULTS AND DISCUSSIONS 22
41 Measurement results of titanium dioxide content 23
42 Accuracy of results discussion 24
5 CONCLUSION 26
REFERENCES 27
APPENDICES
FIGURES
FIGURE 1 The structure of ultraviolet spectrophotometerhelliphelliphelliphelliphelliphelliphelliphelliphelliphelliphelliphelliphelliphelliphelliphelliphellip5
FIGURE 2 The molecular structure of Diantipyrylmethane6
FIGURE 3 Absorbance values at different wavelengths7
FIGURE 4 Wavelength dispersive spectrometer and energy dispersive spectrometer helliphelliphelliphelliphelliphelliphelliphelliphelliphelliphellip12
FIGURE 5 The experimental procedure of measuring titanium dioxide content in limestone by dianti-
pyryl methane photometry 15
TABLES
TABLE 1 Effect of acidity in hydrochloric acid medium on color reaction18
TABLE 2 The absorbance values of different ascorbic acid dosages18
TABLE 3 The dosage of DAPM experiment19
TABLE 4 Optimal wavelength test datahelliphelliphelliphelliphelliphelliphelliphelliphelliphelliphelliphelliphelliphelliphelliphelliphelliphelliphelliphelliphelliphelliphelliphelliphelliphelliphellip20
TABLE 5 The interference experiment results of calcium and magnesium21
TABLE 6 Experimental measurement data24
TABLE 7 Average value of samples24
1
1 INTRODUCTION
Calcium carbonate (CaCO3) is the main component of limestone which is the main raw material for
glass production In addition to the main component CaCO3 in limestone limestone also contains a small
amount of silicon dioxide (SiO2) aluminum oxide (Al2O3) iron oxide (Fe2O3) magnesium oxide (MgO)
and titanium dioxide (TiO2) Lime and limestone are widely used as building materials and important
raw materials for many industries CaCO3 can be directly processed into stone stock and burnt into
quicklime Lime has quicklime and hydrated lime The main component of quicklime is calcium oxide
(CaO) which is generally lumpy pure white light gray or light yellow when containing impurities In
the chemical industry limestone is mainly used to fabricate alkali calcium carbide CaCO3 potassium
carbonate nitrogen fertilizer phosphate fertilizer and other raw materials Limestone is used as agent of
fusion in ironmaking to remove gangue (Qingling 2009 179-180) Quicklime is used as slagging mate-
rial in steelmaking to remove harmful impurities such as sulfur and phosphorus Titanium is one of the
important alloy elements In addition to its strong deoxidizing ability it can also denature non-metallic
inclusions in steel thus improving the mechanical properties of steel Therefore adding proper amount
of titanium into steel has an important influence on the quality of steel and the formation of nonmetallic
inclusions The determination of TiO2 content in limestone is of great significance to the improvement
of steel quality and the control of non-metallic inclusions in steelmaking and ironmaking (Junhua 2016
37)
There are many methods of measuring TiO2 and there are several determination methods titration anal-
ysis (ammonium ferric sulfate volumetric method hydrogen peroxide (H2O2) coordination-bismuth salt
solution titration method) spectrophotometry H2O2 photometric method ferro-titanium reagent photom-
etry) large-scale instrumental analysis (inductively coupled plasma-atomic emission spectrometry (ICP-
AES) and X-ray fluorescence (XRF) spectrometry) For the determination of TiO2 content in the sample
by titration analysis This method has poor sensitivity and selectivity In chemical analysis the sensitiv-
ity is expressed by the molar absorption coefficient ε It refers to the absorption capacity of matter to
light of a certain wavelength The value of ε reflects the degree of light absorption of the absorption
medium For the medium with selective absorption in the visible light area it indicates the sensitivity of
a certain color reaction For the same measured element the greater the value of ε the more sensitive
the color reaction is For the same color reaction the value of ε is related to the measured concentration
The higher the molar absorption coefficient the higher the sensitivity Selectivity refers to the ability to
avoid interference of other coexisting components in the sample when a certain analytical method is
used to determine a certain component Other elements such as vanadium tin molybdenum tungsten
2
copper and arsenic can interfere experimental determination Together with titanium oxide ion (TiO2+)
these elements are completely or partially reduced to a low valence state and oxidized leading to high
experimental results Although the titration analysis method does not have high requirements for instru-
ments and equipment the accuracy of the measurement results is poor and the scope of use is narrow
In H2O2 photometry the experimental operation is simple and fast but the stability of hydrogen is poor
For the determination of TiO2 samples by ICP-AES the ICP-AES was used to determine the content of
TiO2 in the experiment The method is fast accurate highly sensitive and has good reproducibility and
stability But the instrument is expensive and this method is difficult to widely promote and apply (Juan
2019 46)
Using diantipyryl methane (DAPM) photometry method for determining TiO2 is easy to operate and it
has high sensitivity good reproducibility and stability This thesis introduces the method of determining
the content of TiO2 in limestone sample A (mass fraction of TiO2 content is 0041 ) sample B (mass
fraction of TiO2 content is 0074 ) and sample C (mass fraction of TiO2 content is 0130 ) by using
DAPM photometry In the end influence of different factors for the determination of TiO2 such as
dosage of ascorbic acid dosage of DAPM spectrophotometry chromogenic reagent influence of acid
concentration and elimination method will be discussed
3
2 DETERMINATION OF TITANIUM DIOXIDE IN INDUSTRIAL RAW MATERIALS
For the determination of TiO2 in alloys ores or other industrial raw materials there are several detection
methods in the world such as titration detection method XRF detection method ICP-AES detection
method and DAPM spectrophotometry In the experimental for the determination of TiO2 by ammonium
ferrate volumetric method the experiment needs to be carried out in hydrochloric acid (HCl) or sulfuric
acid medium (H2SO4) TiO2+ is reduced to titanium ion (Ti3+) by metal aluminum sheet Potassium thi-
ocyanate is used as indicator and titrated with standard solution of ammonium ferrate sulfate Vanadium
tin molybdenum tungsten copper arsenic and other elements will interfere with the experimental re-
sults These elements will be fully or partially reduced to a low valence state together with TiO2+ and
then oxidized by high iron to produce high results (Juan 2019 45)
In the determination of TiO2 by H2O2 coordination-bismuth salt solution back titration method Firstly
adding appropriate amount of H2O2 to the solution which containing TiO2+ will form a yellow complex
And then adding excessive Ethylene Diamine Tetraacetic Acid (EDTA) to make it a more stable ternary
complex The remaining EDTA was titrated with bismuth salt solution to xylenol orange as indicator
This method is often used for samples of high titanium content Although titrimetric analysis has low
requirements for instruments and equipment its accuracy is poor and its application range is narrow In
the experiment of TiO2 sample determination by ICP-AES the inductively coupled plasma-atomic emis-
sion spectrometer was used to determine the content of TiO2 This method is fast accurate highly sen-
sitive and has good stability but the large instruments used are expensive This method is difficult to
widely promote and apply The advantages of DAPM photometry are as follows it avoids tedious ex-
perimental steps it can be used as a very practical analysis method in scientific research detection and
it can be widely used in the determination of TiO2 in steel alloys and mineral raw materials Compared
with other detection methods the DAPM spectrophotometry is more simple the detection speed is faster
and the repeatability of the experimental is good (Juan 2019 45)
21 Spectrophotometer
A spectrophotometer is a scientific instrument that breaks light with complex composition into spectral
lines The measurement range generally includes the visible light region with a wavelength range of 380-
780 nm and the ultraviolet light region with a wavelength range of 200-380 nm Different light sources
have their own unique emission spectrum so different luminous bodies can be used as the light source
4
of the instrument The emission spectrum of tungsten lamp is formed in this way After refracting the
spectrum light of 380-780 nm wavelength emitted by tungsten lamp light source through a prism a
continuous color spectrum composed of red orange yellow green blue indigo and violet can be ob-
tained The color spectrum can be used as the light source of the visible light spectrophotometer
(Xiaohua 2012 6)
Ultraviolet spectrophotometer is based on the absorption spectrum of substances to study the composi-
tion structure and interaction of substances The ultraviolet spectrophotometer can arbitrarily choose
different wavelengths of light in the ultraviolet visible region The absorption spectrum of a substance
is that the molecules and atoms in the substance absorb the light energy of certain specific wavelengths
in the incident light The molecular vibrational energy level transition and the electronic energy level
transition occur accordingly All kinds of substances have their own different molecules atoms and
different molecular space structures Their absorption of light energy is different Therefore each sub-
stance has its own unique and fixed absorption spectrum curve The absorbance at certain characteristic
wavelengths on the spectrum can be used to distinguish or determine the content of the substance Ul-
traviolet spectrophotometry is based on Lambert-Beer law According to Lambert-Beer law A = εbc
(A is the absorbance ε is the molar absorption coefficient b is the thickness of the liquid cell and c is
the concentration of the solution) This law can be used to analyze the solution quantitatively (Mohamed
amp Hassan 2015 4)
There are many types of ultraviolet visible (UV-vis) spectrophotometers but their basic structures are
similar The UV-vis spectrophotometers are composed of five parts light source monochromator ab-
sorption cell detector and signal display system The structure of the ultraviolet spectrophotometer is
shown in FIGURE 1 The light source is a device to provide the incident light that meets the requirements
The common light source in the visible light area of the UV-vis spectrophotometer is tungsten lamp and
the common light source in the UV-vis light area is hydrogen lamp or deuterium lamp Tungsten lamp
is the most commonly used visible light source It can emit a continuous spectrum of 325-2500 nm and
the most suitable wavelength range is 320-1000 nm Therefore it can also be used as near-infrared light
source Deuterium lamp is the most commonly used ultraviolet light source It emits light with a wave-
length range of 190-400 nm and the wavelength range is generally 190-360 nm The second part of the
UV-vis spectrophotometer is monochromator which decomposes the continuous spectrum of the light
source into monochromatic light and can accurately and conveniently select the optical device of a cer-
tain wavelength needed It is the heart of the photometer Monochromator is mainly composed of slit
dispersion element and lens system The dispersion element is the main part of monochromator The
5
most commonly used dispersion elements are prism grating or a combination of the two The dispersive
element is shown in the FIGURE 1 It is a combination of prism and grating (Xiaojing 2015 19-20)
The absorption tank is a vessel used to hold the liquid to be measured and determine the thickness of the
transparent liquid layer of the solution to be measured also known as a cuvette Generally speaking the
absorption tank is a cuboid which also has a circle or other shapes The absorption tank in FIGURE 1
is a cuboid The bottom and both sides of the absorption tank are ground glass and the other two sides
are optical light transmitting surfaces According to the material of the light transmitting surface the
absorption tank can be divided into two types glass absorption tank and quartz absorption tank The
glass absorption cell is used for the determination of visible light area and the quartz absorption cell is
used for the determination of ultraviolet light area The specification of absorption tank is marked by
optical path The commonly used specifications of absorption cell are 05 cm 10 cm 20 cm 30 cm
50 cm The detector is a device that converts an optical signal into an electrical signal When measuring
the absorbance it is not to directly measure the light intensity through the absorption cell but to convert
the light intensity into a current for measurement This photoelectric converter is called a detector Signal
display is a device to amplify and display the output signal of detector The new spectrophotometer is
displayed by digital voltmeter and the absorbance curve is drawn directly by recorder The new spec-
trophotometer is equipped with computer data processor (Xiaojing 2015 19-20)
FIGURE 1 The structure of ultraviolet spectrophotometer (adapted from Xiaojing 2015 19)
6
22 Diantipyryl methane spectrophotometry
DAPM is white flake crystals It is insoluble in water ether and alkali But it is soluble in acid ethanol
and chloroform DAPM is soluble in acids and forms complex organic cations with acids The solution
of DAPM is colorless and it reacts with Ti3+ to form yellow complexes DAPM can be used as a sensitive
color reagent for the determination of Ti3+ iridium iron molybdenum neodymium uranium iridium
platinum rhenium It can also be used as an extractant for various ions The molecular formula of DAPM
is C23H24N4O2H2O The molecular structure of DAPM is shown in FIGURE 2
FIGURE 2 The molecular structure of DAPM (adapted from Liu Zhou amp Song 2011 31)
The UV-vis absorption spectrum of molecules is a common spectral analysis method based on the ab-
sorption spectrum generated by the intramolecular electronic transition When a material is irradiated by
light the material molecules will collide with the light As a result the energy of photons is transferred
to the molecules In this way the stable ground state molecules will jump to the unstable high energy
state This is the absorption of the light The qualitative analysis of UV-Vis absorption spectrum is based
on the fact that the shape of absorption curve of light to the same absorption material is different the
maximum absorption wavelength is the same but the corresponding absorption rate is different There
are three properties of UV-vis absorption spectrum the first is that the same concentration of the test
solution has different absorbance for different wavelengths of light The second point is that the higher
the concentration of the same test solution the higher the absorbance Finally the smaller the concen-
tration of the same substance the same wavelength (maximum absorption wavelength λ max) corre-
sponding to the maximum absorption peak and the same curve shape The absorbance tested results of
yellow complex formed by titanium and DAPM by DAPM spectrophotometry are shown in FIGURE 3
The shape of the absorption curve can be seen from FIGURE 3 The abscissa in the chart is the wave-
length the unit of wavelength is nm The ordinate is the absorbance and the unit of absorbance is
L(g middot cm) The absorbance reaches the maximum value at the wavelength of 390 nm In the vicinity of
7
the maximum wavelength the closer to the maximum range of the spectrophotometer the greater the
sample absorbance and the smaller the error brought by the photometer itself (Junhua 2020 38)
FIGURE 3Absorbance values at different wavelengths (adapted from Junhua 2020 38)
After consulting the literatures on the determination of TiO2 by DAPM Spectrophotometry It can be
founded that the measurement method is essentially similar The specific method is as follows Firstly
the sample needs to be decomposed the sample is placed in a platinum crucible and mixed flux (lime-
stone samples with accurate TiO2 content) is added to mix with the sample Heat the crucible at high
temperature (950-1000 ) take it out and cool it then add acid to dissolve the sample After that transfer
the solution to a volumetric flask to constant volume and blend well After transferring the solution add
ascorbic acid HCl DAPM solution put it into the spectrophotometer to measure the absorbance Finally
record the data and calculate the result (Junhua 2016 39)
23 Inductively coupled plasma atomic emission spectrometry
ICP-AES has the advantages of high accuracy and precision low detection limit fast determination
wide linear range and simultaneous determination of multiple elements It has been widely used in de-
termination of dozens of elements in environmental samples and samples of rocks minerals metals
Plasma is ionized gas with an ionization degree exceeding 01 This gas contains not only neutral
atoms and molecules but also a large number of ions and electrons (Haiyan 2010 62)
8
ICP-AES is based on the spectrum emitted by atoms to determine the chemical composition of a sub-
stance Different substances are composed of atoms of different elements and the atoms all contain a
densely structured nucleus The nucleus is surrounded by moving electrons Each electron is at a certain
energy level and has a certain energy Atoms are in a stable state under normal circumstances This state
is called the ground state When the atoms are transformed into gaseous atoms under the action of exter-
nal energy the outer electrons of the gaseous atoms are excited to a high energy state When transitioning
from a higher energy level to a lower energy level the atoms will release excess energy and emit char-
acteristic lines ICP-AES disperse the generated radiation through the instrument and record it on the
photosensitive plate in the order of wavelength which can show regular spectral lines The perform
quantitative analysis based on the obtained spectrum ICP-AES is a new type of light source that is
developing rapidly and is highly valued in the analysis of emission spectrum (Haiyan 2010 62)
ICP-AES consists of sample introduction system ICP light source dispersion system and detection sys-
tem And equipped with computer control and data processing system cooling system gas control sys-
tem ICP light source consists of high frequency power supply and ICP torch tube The ICP torch tube
consists of three concentric quartz tubes and a high-frequency induction ring (generally 2-4 rings of
hollow copper tubes) surrounded by the upper part of the tube There are three intake tubes A 10-20
Lmin argon gas is passed between the quartz outer tube and the intermediate tube Its function is to form
plasma as working gas and cool the quartz torch tube which is called plasma gas or cooling gas The
intermediate tube and the central tube are filled with 05-15 Lmin argon to become auxiliary gas which
is used to assist the formation of plasma After the plasma torch is formed it can be turned off The
carrier gas in the central tube is used to introduce the sample aerosol (Xu Wang amp Xu 2020 67)
The formation of ICP torch is called ignition The ignition is divided into three steps the first step is to
introduce plasma and auxiliary gas into the outer tube and the middle tube At present the central tube
is not connected with gas and an argon atmosphere is established in the torch tube The second step is
to connect the high-frequency power supply to the induction coil The general frequency is 7-50 mhz
and the power supply is 1-15 kw At present there is high-frequency current and high-frequency elec-
tromagnetic field generated by the coil The third step is to ionize the working gas flowing in the middle
by means of high frequency spark and then the ions and electrons produced will interact with the fluc-
tuating magnetic field produced by the induction coil This interaction causes the ions and electrons in
the coil to flow along the closed loop in the figure Their resistance to this movement causes ohmic
9
heating Because of the high temperature generated by the strong current the gas is heated to form a
torch like plasma (Xu et al 2020 67)
Aerosol injection system is a commonly used method at present The sample introduction system con-
sists of two main parts sample lifting part and atomization part The sample lifting part is generally a
peristaltic pump and a self-lifting atomizer can also be used It is required that the speed of the peristaltic
pump is stable and the elasticity of the pump pipe is good so that the sample solution can be pumped in
at a constant speed and the waste liquid can be discharged smoothly The atomizing part includes atom-
izer and atomizing chamber After the sample enters the atomizer by means of pump or self-lifting small
droplets are formed under the action of carrier gas and enter the atomization chamber The large droplets
are eliminated when they touch the wall of the atomization chamber Only small droplets can enter the
plasma source (Xu et al 2020 68) For the optical system the monochromator of ICP-AES usually
adopts the combination of grating or prism and grating And for the detection system the detection
system of ICP-AES is a photoelectric converter which uses photoelectric effect to convert the radiation
energy of different wavelengths into electrical signals (Xu et al 2020 68)
As a conventional chemical analysis technology ICP-AES has a wide range of applications in biological
samples materials geology environmental protection metallurgy and other fields In the field of met-
allurgical analysis such as steel raw materials and ferroalloys it is required to measure dozens to hun-
dreds of samples at a time And each sample must simultaneously analyze dozens of elements such as
Mn Cu Al Cr Si P Ni Ti V Nb W Ca Mg It can show the absolute advantages of ICP in terms of
work efficiency In the analysis of standard materials especially the low-value fixed-value analysis of
rare earth elements the accuracy of ICP data and the simplicity of operation are fully utilized (Haiyan
2010 62) The disadvantage of the ICP-AES method is that the equipment and operating costs are rela-
tively high The sample generally needs to be converted into a solution in advance and the determination
of some elements is not obvious such as sodium (Na) and potassium (K) (Juan 2019 46)
24 Titration analysis
There are generally two types of titration analysis to determine the content of TiO2 in the sample Am-
monium ferric sulfate volumetric method and H2O2 coordination titration The specific steps of ammo-
nium ferrate sulfate volumetric method are as follows firstly reduction of TiO2+ to Ti3+ with metal
10
aluminum tablets in HCl or H2SO4 medium And then using potassium thiocyanate as an indicator Fi-
nally titration with standard solution to ammonium ferrate sulfate The method has poor sensitivity and
selectivity But there are interference elements such as vanadium tin molybdenum tungsten copper
and arsenic that affect the experimental results These elements and TiO2 are completely or partially
reduced to a low valence state and these elements are oxidized by ferric ions (Fe3+) Leading to errors
in the experimental results (Juan 2019 46)
The specific steps of H2O2 coordination titration are as follows firstly the yellow complex will be form
by adding an appropriate amount of H2O2 to a solution which containing TiO2+Then add excess EDTA
to the solution (EDTA is a good complexing agent in chemistry It has six coordination atoms The
complex formed is called chelate EDTA is often used in coordination titration to determine the content
of metal ions In biological application it is used to exclude most transition metal elements For example
it is used to exclude the interference of iron ion nickel ion and manganese ion in the experiment) Make
it form a more stable ternary complex The remaining EDTA was titrated with xylenol orange as indica-
tor For the back titration with bismuth salt solution method when the reaction is slow or the reactant is
solid add a certain amount of titration solution Normally the reaction cannot be completed immediately
At this time a certain amount of excess titrating solution can be added first to accelerate the reaction
After the reaction is completed titrating the remaining titrant with another standard solution This
method is mostly used for samples with high titanium content Although the titration analysis method
does not have high requirements for instruments and equipment but the accuracy of the measurement
results is poor and the scope of use is narrow (Juan 2019 46)
25 X-ray fluorescence spectrometry
People usually irradiate X-rays on substances to produce secondary X-rays called XRF The X-rays used
for irradiation are called primary X-rays XRF is still X-ray XRF spectrometer is mainly composed of
excitation dispersion detection recording and data unit The role of the excitation unit is to generate
primary X-rays It consists of high-voltage generator and X-ray tube The role of the dispersion unit is
to separate X-rays of the desired wavelength It consists of sample chamber slit goniometer analysis
crystal and other parts The role of the detector is to convert X-ray photon energy into electrical energy
The recording unit is composed of an amplifier a pulse amplitude analyzer and a display part X-ray
tube generates incident X-rays to excite the tested sample Each element in the excited sample emits
11
secondary X-rays and the secondary X-rays emitted by different elements have specific energy charac-
teristics or wavelength characteristics The detection system measures the energy and quantity of these
emitted secondary X-rays The instrument software converts the information collected by the detection
system into the types and contents of various elements in the sample By using the principle of X-ray
fluorescence every element after beryllium in the periodic table can be measured theoretically In prac-
tical applications the effective element measurement range is element 9 (F) to element 92 (U) in the
periodic table (Chu Li amp Jiang 2014 40)
The characteristic X-ray energy and wavelength emitted by different elements are different Therefore
no matter what kind of element can be detected by measuring the energy or wavelength of X-ray At the
same time the characteristic X-ray intensity of an element emitted after the sample is excited It is related
to the content of this element in the sample so the quantitative analysis of the element can be performed
by measuring its intensity There are two basic types of XRF spectrometers wavelength dispersive spec-
trometer and energy dispersive spectrometer The structure of the instrument is shown in FIGURE 4
12
FIGURE 4 Wavelength dispersive spectrometer and energy dispersive spectrometer (adapted from Bo
Xiao amp Tao 2015 1308)
With the development of instrument technology and theoretical methods the application range of XRF
analysis is very widely In the analysis of the composition of substances in the metallurgy geology
chemical industry machinery petroleum building materials and other industrial sectors agriculture and
medicine and health as well as physics chemistry biology geoscience environment astronomy and
archaeology and other research departments have been widely applications (Chu et al 2014 37)
13
26 Hydrogen peroxide photometry and ferrotitanium spectrophotometry
H2O2 is a colorless odorless liquid with bitter taste and easy to decompose into water and oxygen It is
a strong oxidant H2O2 is often used for sterilization in the workplace starch whitening in the industry
or as a strong oxidant for food or food packaging and liquid fuel propellant In this method phosphoric
acid (H3PO4) and H2SO4 were used to dissolve the sample In the medium of 5 H2SO4 by volume
TiO2+ and H2O2 formed a yellow complex ion in the acidic condition The stable equilibrium constant
of the complex is k = 10 times 104 and the maximum absorption wavelength is λmax = 405 nm H2O2
spectrophotometry is simple and rapid but its sensitivity and selectivity are poor Sodium catechol-35
sulfonate forms a yellow complex with titanium at pH = 47-49 Ferrotitanium reagent has high sensi-
tivity and can be used for the continuous determination of trace titanium and iron (Xinyan 2006 66)
14
3 EXPERIMENT
There are three main experimental steps sample decomposition color rendering and absorbance exper-
iment which are studied and developed extensively in this project The detail procedures of both topics
will be fully displayed Besides some important choices of chemical reagents during the experiment
will be explained by five variable value optimization experiments optimal selection of the spectropho-
tometerrsquos wavelength the optimal dosage of acidity the optimal dosage of DAPM the optimal dosage
of ascorbic acid and the interference factors analysis experimental
31 Reagents and reagents preparation
The reagents used in the experiment are as follows mixed flux grind from anhydrous sodium sulfate
and boric acid potassium pyrosulfate HCl with a density of 119 gmL H2SO4 with a density of 184
gmL HCl (1+1) ((1+1) is the solution which mix 1 ratio of HCl with 1 ratio of water in volume The
molar concentration of HCl (1+1) is 6 molL) H2SO4 (5+95) ((5+95) is the solution which mix 5 ratio
of H2SO4 with 95 ratio of water in volume The molar concentration of H2SO4 (5+95) is 09 molL)
ascorbic acid solution (20 gL) DAPM solution (50 gL) TiO2 stock solution (100 μgmL) and TiO2
standard solution (10 μgmL)
The preparation steps for ascorbic acid solution (20 gL) are as follows weigh 20g of ascorbic acid add
200-300 mL of water to dissolve the sample and stir evenly After the ascorbic acid is completely dis-
solved transfer the solution to a 1 L volumetric flask and make up to volume The preparation steps of
the TiO2 stock solution (100 μgmL) are as follows weigh 01 g of TiO2 and place it in a platinum
crucible and then add 5-7 g of potassium pyrosulfate Put them into a high-temperature furnace raise
the temperature to 600 deg C to melt Use 60 mL H2SO4 to dissolve the melt After it cooling to room
temperature transfer it to a 1000 mL volumetric flask diluted with H2SO4 to the mark and mixed fully
The preparation of the TiO2 standard solution (10 μgmL) are as follows add 50mL of TiO2 stock solu-
tion to a 500 mL volumetric flask And then add H2SO4 to constant volume and mix it well
Three instruments are used in this experiment platinum crucible (The volume needs to be greater than
30 mL) high temperature furnace (The crucible heating temperature is suitable for 100-1100 ) and
UV-vis spectrophotometer (1000 nm ge wavelength ge 180 nm) Before using the spectrophotometer
15
connect the spectrophotometer to the power supply turn on the instrument switch lift the lid of the
sample chamber and preheat the sample chamber for 10 minutes
32 Experimental procedure
Before the experiment the preparation of reagents and the commissioning of equipment need to be com-
pleted The preparatory work includes preparation of ascorbic acid solution (20 gL) preparation of
DAPM solution (50 gL) preparation of TiO2 stock solution (100 μgmL) and preparation of TiO2 stand-
ard solution (10 μgmL) After the reagent preparation is completed proceed to the second step as shown
in FIGURE 5 Dissolve the sample after weighing it Thirdly render the color of the sample solution
The fourth step is measure the absorbance of the developed solution by spectrophotometer And finally
record and process the experimental data
FIGURE 5 The experimental procedure of measuring titanium dioxide content in limestone by dianti-
pyryl methane photometry
33 Procedure of sample decomposition
In this experiment the samples selected three limestones with known accurate TiO2 content The TiO2
content (mass fraction) of sample A is 0041 the TiO2 content (mass fraction) of sample B is 0074
and the TiO2 content (mass fraction) of sample C is 013 The purpose of these accurate data is to
make a precision comparison with the data measured in this experiment and verify the accuracy of the
experimental method A total of three sets of experiments were conducted and each set was measured 6
times
The sample decomposition steps are as follows take 02 g limestone (crumb limestone) sample into a
platinum crucible add 5 g mixed flux (anhydrous sodium carbonate and boric acid) Secondly place the
platinum crucible in a high-temperature furnace and gradually increase the temperature to 950-1000
Weighing of
samplesamp
reagents
preparation
Sample
decomposition
Color
rendering
Absorbance
experiment
Experimental
data recording
16
After the sample is melted take it out and cool it to room temperature Thirdly put the crucible in the
250 mL beaker together with the sample and add HCl into the beaker Finally heat the beaker at around
75 to make the solution transparently After cooling to room temperature dilute the solution to 100
mL with water (Wang Yan amp Zhu 2013 49) During the experiment HCl is used to dissolve the sample
The choice of acid type needs to be determined through the phenomenon of sample dissolution in dif-
ferent acid systems Through experiments of dissolving samples in various acid systems the results can
be obtained the most suitable acid for dissolving limestone
For the optimal selection of the dosage and the type of acid to dissolve the sample the experimental
procedure is as follows select 025 g of limestone sample B with a TiO2 content of 0074 and place
it in 6 polytetrafluoroethylene beakers Add HCl (1+1) nitric acid (HNO3) (1+1) perchloric acid (HClO4)
(1+1) hydrofluoric acid (HF) (1+1) and H2SO4 (5+95) to dissolve the sample with different acid systems
composed of these acids Put 20 mL HCl into the first beaker By observing the solution in the beaker
the solution is cloudy with residue For the second beaker add HCl of the same volume as the first
beaker and 5 mL HNO3 The phenomenon of the solution is cloudy with residue For the third beaker
add HCl and HNO3 of the same volume as the second beaker and 10 mL HClO4 into the beaker By
observing the phenomenon of the reaction the solution is cloudy with residue For the fourth beaker put
20 mL HCl 10 mL HClO4 5 mL HF into the beaker The limestone sample is completely dissolved
And then put add HCl HNO3 and HClO4 of the same volume as the third beaker and 5 mL HF into the
fifth beaker the limestone sample is completely dissolved For the last beaker choose 20 mL HCl 10
mL HClO4 5 mL HF and 5 mL H2SO4 to dissolve the sample The solution is turbid
34 Procedure of color rendering
Whether the color rendering reaction can meet the requirements of the photometric method in addition
to mainly related to the nature of the chromogenic reagent it is also very important to control the con-
ditions of the color reaction The color rendering conditions mainly included the dosage of the chromo-
genic reagent and the acidity of the solution In order to make the color reaction as complete as possible
it is necessary to add an appropriate dosage of the chromogenic reagent If an excessive dosage of chro-
mogenic reagent is added it will cause side reactions which are not conducive to the measurement In
the experiment the appropriate dosage of the chromogenic reagent is obtained through related experi-
ments Most chromogenic reagents are organic weak acids The acidity of the solution affects the disso-
17
ciation of the chromogenic reagent and the completeness of the color rendering reaction Many chromo-
genic reagents are acid-base indicators The acidity of the solution will change the initial color of the
chromogenic reagent The acidity of the solution also has an effect on the composition and stability of
the colored complex
Three solutions need to be added in the color rendering experiment Firstly HCl needs to be added to
control the acidity of the solution Secondly ascorbic acid solution needs to be added to reduce Fe3+ to
ferrous iron (Fe2+) in the solution Because of the main interference element of this experiment is iron
So it is necessary to eliminate this interference by adding ascorbic acid solution Finally add DAPM for
color rendering reaction So before rendering colors the optimal dosage of these three solutions needs
to be found
The acidity of the solution affects the dissociation of the chromogenic reagent and the completeness of
the color rendering reaction Therefore maintaining the acidity of the solution is a prerequisite for start-
ing the color rendering experiment Determine the experiment steps of optimum dosage of HCl are as
follows take 10 mL of the test solution in 50 mL volumetric flask And then add 5 mL of ascorbic acid
solution and mix it well Place it for about 5 minutes Add 2 mL 4 mL 6 mL 8 mL 10 mL 12 mL 16
mL 20 mL HCl to 8 flasks respectively then add 7 mL of DAPM solution into each flask Dilute the
solution to the mark with water and mix it well Leave it for about half an hour at room temperature
Then put the chromogenic reagent into the spectrophotometer to measure the absorbance (detection
wavelength is 385 nm) It can be realized from TABLE 1 that the acidity in HCl medium has minimal
effect on the color rendering reaction During the analysis add 6 mL of 6 molL HCl to control the
normal concentration of about 113 N Normality (N) is defined as the number of equivalents per liter of
solution where definition of an equivalent depends on the reaction taking place in the solution For an
acid-base reaction the equivalent is the mass of acid or base that can furnish or accept exactly 1 mole of
proton (H+ ions) And this is based on the HCl concentration It can be seen from the absorbance value
in the last row of TABLE 1 that the acidity has little effect on the color rendering reaction in HCl medium
In the analysis process add 6 mL 6 molL HCl solution to control the normal concentration at 113 N
18
TABLE 1 Effect of acidity in HCl medium on color reaction
Flask1 Flask 2 Flask 3 Flask 4 Flask 5 Flask 6 Flask 7 Flask 8
HCl
(1+1) mL
2 4 6 8 10 12 16 20
Normal
concentration
(N)
065 089 113 137 161 185 233 290
Absorbance
L(gmiddotcm)
0185 0185 0185 0185 0185 0185 0185 0180
After determining the acidity of the solution the second problem to be determined is the optimal dosage
of ascorbic acid reagent Take several copies of 10 mL sample B solution with 0074 TiO2 content
add different amounts of ascorbic acid solution Then add 6 mL of HCl and 7 mL of DAPM for color
development and measure the absorbance by spectrophotometer (detection wavelength is 385 nm) The
absorbance values of different ascorbic acid dosages are shown in TABLE 2 The effect of adding
different volume of ascorbic acid on absorbance is shown in TABLE 2 The experimental results show
that when the dosage of ascorbic acid is between 3 mL and 15 mL the absorbance remains stable In
order to facilitate the operation and ensure complete reduction reaction we chose the dosage of ascorbic
acid to be 5 mL
TABLE 2 The absorbance values of different ascorbic acid dosages
Flask 1 Flask2 Flask3 Flask4 Flask5 Flask6
Ascorbic
acid (mL)
1 3 5 6 10 15
Absorbance
L(gmiddotcm)
0509 0514 0515 0515 0515 0515
After determining the dosage of the HCl and the ascorbic acid the third question is the optimal dosage
of DAPM Firstly take several copies of 5 mL sample B solution which content about 0074 of TiO2
and put the each solution into a 50 mL volumetric flask Secondly add 6 mL of HCl 5 mL of ascorbic
acid and different amounts of DAPM for color rendering reaction Finally measure the absorbance value
19
at 385 nm wavelength the experimental results are shown in the TABLE 3 From the experimental data
it can be seen that the absorbance of the DAPM chromogenic reagent is basically constant when it is
above 5 mL So the optimum dosage of the DAPM chromogenic reagent is 7 mL
TABLE 3 The dosage of DAPM experiment
Flask1 Flask2 Flask3 Flask4 Flask5 Flask6 Flask7 Flask8 Flask9
The dosage of
DAPM (mL)
2 3 4 5 6 7 8 9 10
Absorbance
L(gmiddotcm)
0226 0259 0282 0299 0231 0232 0232 0234 0233
Through the above three experiments (determine the optimal dosage of HCl ascorbic acid and DAPM)
the exact dosage of the three reagents in the color rendering experiment was determined The order and
steps of adding the three reagents are as follows firstly take 10 mL of TiO2 standard solution and put it
in a 50 mL volumetric flask Secondly add 5 mL of ascorbic acid solution mix it well Place the solution
for 5 minutes in the room temperature Then add 6 ml hydrochloric acid to mix the reagent evenly
Finally add 7 mL of DAPM into the solution Dilute the solution to the mark with water and mix it well
Leave it for 30 minutes in the room temperature and prepare to measure the absorbance
35 Procedure of the absorbance measuring
After the color rendering reaction is completed the test solution needs to be placed in a cuvette for
absorbance testing By changing the test wavelength the optimal wavelength is determined according
to the absorbance corresponding to each wavelength The absorbance at different wavelengths after color
development is shown in TABLE 4 It can be seen from the data that the wavelength has a maximum
value at 380-390 nm To ensure the best sensitivity the test wavelength is selected at 385 nm Under the
test of the maximum absorption wavelength the response of the instrument is more sensitive and the
measurement data is more accurate
20
TABLE 4 Optimal wavelength test data
Flask1 Flask2 Flask3 Flask1 Flask4 Flask5 Flask6 Flask7
Wavelength (nm) 360 370 380 385 390 400 410 420
Absorbance
L(gmiddotcm)
0499 0533 0547 0554 0543 0533 0502 0461
After determining the optimal wavelength use the spectrophotometer to analyze the content of TiO2 in
the sample firstly prepare the spectrophotometer and open the sample chamber cover Turn on the
power and the indicator lights up let the instrument warm up for 20 minutes Set the selector switch to
the T knob to display the number as 000 Secondly turn the wavelength knob to the 385 nm wave-
length and align the scale line Transfer the color rendering solution into a 3 cm cuvette and place it on
the colorimetric shelves And then close the sample chamber cover and adjust the light transmittance
100 T knob to make the number display as 1000 T Turn the selector switch to the A zero adjust-
ment knob the digital display should be 000 Then pull out the lever to put the solution to be measured
into the optical path and the digital display value is the absorbance A of the sample According to the
absorbance data it can be easily get the mass of TiO2 in the test solution After the measurement is
completed open the sample chamber cover and turn off the power switch
36 Interference test of calcium and magnesium ions
The main components of limestone are CaO and magnesium oxide (MgO) In order to determine whether
CaO or MgO has an effect on the determination of TiO2 Firstly prepare two standard solutions CaO
standard solution and MgO standard solution The content of CaO in the CaO standard solution is 10
mgL And the content of MgO in the MgO standard solution is 10 mgL Extract several parts from the
two prepared solutions and add a certain amount of TiO2 standard solution 4 mL (The amount of TiO2
added is 40 ug) to each part According to the method of 34 for color rendering the interference
experiment results of calcium ion and magnesium ion are as shown in TABLE 5 It can be seen from the
absorbance value in TABLE 5 that CaO and MgO have no effect on the determination of TiO2 There
was no difference in absorbance before and after adding CaO and MgO
21
TABLE 5 The interference experiment results of calcium ion and magnesium ion
Flask 1 Flask 2 Flask 3 Flask 4
The amount of TiO2 added 40 ug 40 ug 40 ug 40 ug
The amount of CaO added
(no MgO)
10 mg 20 mg 30 mg 40 mg
Absorbance L(gmiddotcm) 0551 0548 0550 0551
Flask 5 Flask 6 Flask 7 Flask 8
The amount of TiO2 added 40 ug 40 ug 40 ug 40 ug
The amount of MgO added
(no CaO )
10 mg 15 mg 20 mg 25 mg
Absorbance L(gmiddotcm) 0551 0550 0548 0551
22
4 RESULTS AND DISCUSSIONS
Through the acid system selection experiment the optimal selection of the spectrophotometerrsquos wave-
length experiment the optimal dosage of acidity selection experiment the optimal dosage of DAPM
selection experiment the optimal dosage of ascorbic acid selection experiment and the interference fac-
tors analysis experimental the accurate dosage of reagents was determined by these experiments Ac-
cording to the reaction phenomena or absorbance results of each experiment the corresponding experi-
mental results were obtained
In the acid system selection experiment the following conclusions can be drawn from the observation
of six experimental phenomena In the system of HF and HClO4 the sample is completely dissolved (the
precipitation is precipitated by adding H2SO4 the solution is turbid) but HClO4 and HF have a effect on
the determination of titanium and the fluoride ion is easy to complex with titanium And this
combination is likely to lead to the results on the low performance The presence of HClO4 can combine
with DAPM to produce white flocculent precipitate which led to the failure of the experiment In order
to eliminate the influence of insoluble residue to the analysis and ensure the sample is completely
dissolved The experiment uses the usual method which is anhydrous sodium carbonate and boric acid
system solvent mixed together for melting This method is simple and fast and the melting is complete
The acid system is relatively simple without introducing HClO4 acid HF acid and other kinds of acid
HCl is used to dissolve the sample and the sample dissolves quickly
In the optimal dosage of acidity selection experiment By observing the results of absorbance under
different acidity The best color acidity can be obtained add 6 mL of 6 molL HCl to control the color
acidity of solution In the optimal dosage of DAPM selection experiment through the absorbance test
results of solutions with different DAPM dosage It can be concluded from the data that the best dosage
of DAPM solution is 7 mL In the the optimal selection of the spectrophotometerrsquos wavelength
experiment according to the test results of absorbance of solution at different wavelengths it can be
concluded that the optimal wavelength is 385 nm In the optimal dosage of ascorbic acid selection
experiment through the absorbance test results of several solutions added with different volume of
ascorbic acid it can be concluded that the optimal dosage of ascorbic acid is 5 mL In the interference
factors analysis experimental it can be seen from the absorbance value in experiment results that CaO
and MgO have no effect on the determination of TiO2 By determining the accurate dosage of various
reagents a set of measurement steps with accurate actual dosage is formulated
23
41 Measurement results of titanium dioxide content
The content of TiO2 in three limestone samples was determined six times in parallel The analysis result
is rounded according to the rules of bankerrsquos rounding In order to avoid the phenomenon of big error
caused by rounding rules The specific method of data processing in this rule is as follows when the
mantissa is less than or equal to 4 the mantissa will be directly rounded off When the mantissa is greater
than or equal to 6 round off the mantissa and carry forward one digit When the mantissa is equal to 5
but the numbers after the mantissa are all 0 the previous digit of the mantissa should be used as a refer-
ence If the previous number is an odd number move one digit forward If the previous number is even
the mantissa is discarded If the mantissa is 5 but there is a number that is not 0 after the mantissa
whether the number before the mantissa is odd or even the number must move forward one bit
This experiment is carried out under the specified repeatability conditions the same experimental re-
searcher carries out the experiment uses the same instrument to carry out the experimental measurement
carries out the experiment under the same experimental conditions carries out the same calibration in a
short time TiO2 content is calculated according to the mass fraction WTiO2 calculation formula (1)
2
6
1
1
10100
TiO
mw
m V V
minus=
(1)
V1 The volume of the solution obtained separately from the sample solution The unit is milliliter (mL)
V Total volume of sample solution The unit is milliliter (mL)
m1 The quality of the titanium dioxide obtained separately from the sample solution The unit is mi-
crogram (μg)
m The quality of the sample The unit is gram (g)
The measurement results of the experiment are shown in the TABLE 6 The experimental data compared
with the TiO2 content in three limestone samples are shown in TABLE 7 For sample A the TiO2 content
obtained from the first and third experiments is basically consistent with the known accurate TiO2
content of sample A In addition to the second experimental data the accuracy of other experimental
data is good Compare with the other five groups of data the results of the second experiment have
relatively large errors For sample B the content of TiO2 obtained in the third experiment is almost the
same as the given value The TiO2 content measured in the fifth experiment is quite different from the
given value compared with the other five groups of data For sample C the TiO2 content obtained from
six experiments is almost the same as the given TiO2 content
24
TABLE 6 Experimental measurement data
Experiment
1
Experiment
2
Experiment
3
Experiment
4
Experiment
5
Experiment
6
Sample A
()
00412 00423 00409 00414 00416 00415
Sample B
()
00730 00750 00740 00765 00780 00735
Sample C
()
01250 01280 01290 01310 01240 01260
42 Accuracy of results discussion
From the average value of the data it can be seen that the accuracy of using the DAPM photometry to
determine the TiO2 content in limestone TABLE 7 is the average value of TiO2 content measured in six
experiments for each sample from TABLE 6 The second column is the certified value of the three
samples The mass fraction of TiO2 content in sample A is 0041 The mass fraction of TiO2 content
in sample B is 0074 The mass fraction of TiO2 content in sample C is 013 And the third column
is the average values which are obtained through experimental measurement and calculation As can be
seen from TABLE 7 The average value of TiO2 content in several groups of limestone samples meas-
ured by this experiment have high accuracy
TABLE 7 Average mass fraction of TiO2 content in limestone
Certified value Average value
Sample A () 0041 00414
Sample B () 0074 00750
Sample C () 0130 01272
HCl was used to dissolve the sample If HClO4 is used in the experiment it will form white flocculent
precipitate with DAPM which will affect the absorbance test If HF is used in the experiment fluorine
ions will complexate with titanium to form titanium fluoride complex which will affect the accuracy of
25
the experimental results If only HNO3 is used for decomposition except for incomplete decomposition
of the sample HNO3 also destroys DAPM thus affecting the continuation of the experiment According
to the dissolution treatment experiment and acidification experiment the HCl system is relatively simple
without the introduction of HClO4 HF and other types of acids And the sample dissolves quickly by
HCl leaching
In the experiment of determine the optimal dosage of DAPM solution it can be concluded that the
optimal dosage of DAPM is 7mL When the amount of DAPM is more than 6 mL the absorbance tends
to be stable If the flux of DAPM does not reach 6 mL the color reaction will be incomplete which will
affect the whole experiment For the selection of the amount of ascorbic acid ascorbic acid is used to
reduce Fe3+ in the solution to Fe2+ In order to eliminate the interference 5 mL ascorbic acid was selected
to reduce Fe3+ in the sample If the amount of ascorbic acid is less than 5 mL the remaining unreduced
Fe3+ will affect the accuracy of the whole experiment
In this experiment temperature and time have influence on the measurement results In 15-80 the
absorbance value is not affected by temperature However if the iron content in the sample is high and
the temperature is higher than 60 the solution is easy to be turbid and unable to compare colors
Therefore this experiment uses 15-30 room temperature to render color The color solution is very
stable and can be maintained for several months When the room temperature is higher than 20 it
tends to be stable after 20 minutes of color development When the room temperature is lower than 20
it needs 40-60 minutes to be stable In this color rendering experiment the accuracy of temperature
control is particularly important
When selecting the optimal wavelength of the test absorbance the wavelength corresponding to the
maximum absorbance is selected according to the absorption curve of the test solution In this experiment
when the wavelength is 385 nm the absorbance changes with the concentration in the largest range so
the determination is the most sensitive The absorption curve is an important basis for choosing the
wavelength of incident light in quantitative analysis In the wavelength selection experiment if the
wavelength corresponding to the maximum absorbance is not selected the accuracy of the experiment
will be insufficient
26
5 CONCLUSION
In this experiment the DAPM photometric method was used to determine the content of TiO2 The
sample is melted by sodium carbonate-boric acid mixed flux and leached with dilute HCl The experi-
ment used ascorbic acid as a masking agent to reduce Fe3+ to Fe2+ in the solution to eliminate interference
In this experiment DAPM solution was added to render the solution color In order to ensure the accu-
racy of the experimental results the amount of various reagents was optimized The following five as-
pects were quantitatively analyzed in the experiment optimal selection of the spectrophotometerrsquos
wavelength the optimal dosage of acidity the optimal dosage of DAPM the optimal dosage of ascorbic
acid and the interference factors analysis The exact dosage of each reagent was determined The TiO2
content measured in the experiment was compared with limestone with known accurate TiO2 content
The accuracy of the measurement can be seen in this experiment This experimental method has a perfect
effect on the use of spectrophotometers and promotes the determination of mineral raw materials con-
taining low TiO2 content by spectrophotometer
For the measurement results of the experiment there is a certain error between the TiO2 content meas-
ured in this experiment and the TiO2 content given in the limestone sample Through the interference
element analysis experiment it is determined that the two main components of limestone (MgO and
CaO) are not the cause of this error For several values with slightly poor accuracy there may be some
problems in the operation of the experiment The most likely reason for the poor accuracy of the data is
that after the sample dissolves the color reaction does not wait until the solution cools to room temper-
ature Another possibility is that the limestone sample is not well preserved resulting in a certain error
between the actual TiO2 value and the given value In the future experiments the above two error aspects
are further studied to ensure that the measurement method is accurate and the measurement results are
more accurate
Compared to ammonium ferric sulfate volumetric method and H2O2 coordination titration method
DAPM photometric method has high accuracy and eliminates the interference of vanadium molyb-
denum tungsten copper arsenic and other elements to the experiment Compared to ICP-AES method
DAPM photometric method is simple in operation and suitable for popularization and application The
results of the project provided a technical method for accurately and quickly determining the content of
TiO2 in limestone
27
REFERENCES
Bo H Xiaomei W amp Tao Y 2015 The development and application of X-Ray fluorescence
spectrometer Nuclear Electronics amp Detection Technology 1307-1311
Chen C 2005 Determinition of TiO2 in mine with diantipyrylmethane spectrophotometry Tian jing
Metallurgy 43(4) 9-10
Chen Z 2009 Research and Fabrication of Opto-mechanical Systems of New UV Spectrophotometer
Chu N Li W amp Jiang X 2014 Determination of major and minor compoments in limestone by
wavelength dispersive X-ray fluorescence spectrometry with fusion sample preparation Metallurgical
analysis 34(10) 37-41
Chu Y 1983 Development of X-ray fluorescence spectrometer DOI 10 13595 j cnki issn1000 -
0720 1983 0062
Deng J 2016 Determination of Titanium Dioxide in Titanium Slag by Diantipyrylmethane
Spectrophotometry Physico-ChemistryampChemical-Chemistry 52(1) 37-40
Deng J 2020 Determination of Titanium in Titanium Ferroalloy by Spectrophotometry with
Diantipyrylmethane Angang technology 2(1) 36-39
Du M 2017 Simultaneous determination of Fe Al Ca Mg K Na Ti in limestone by inductively
coupled plasma atomic emission spectrometry with microwave digestion Metallurgical Analysis
26(4) 30
Jin L Meng H amp Yinglin D 2008 Determining titanium dioxide in ores by ICP-AES Jilin
geology 27(1) 83-85
Khavar A amp Asadollahzadeh H 2020 Preconcentration and determination of nickel (Ⅱ)and
copper(Ⅱ) ions Elsevier Inc DOI101016jjfca2020103457
Li C 2006 Determination of SiO2 Cao MgO Al2O3 Fe2O3 and P2O5 in limestone and dolomite by
XRF melting method Shandong Metallurgy 28(6) 10-14
Li H 2005 Diantipyric methane spectrophotometric determination of titanium in magnesium
chloride Journal of environmental management college of China 15(3) 113-114
Liu X Zhong Y amp Song H 2011 Synthesis of Diantipyrylmethane aromatic ring derivatives and
its application in photometric analysis Jiangxi Nonferrous Metals 15 30-35
Mohamed E amp Hassan A 2015 Characterization of visiblelight activated TiO2 catalysts and their
photocatalytic performance study Huazhong Agricultural University 4-16
Pan X 2015 Development Trend of Ultraviolet Spectrophotometer Science and Technology amp
Innovation(14) 19-21
Peng X 2012 Study on spectrum analytical system of visible spectrometer Tianjin University 3-12
28
Shao H 2001 Determination of chloride ion in copper electrolyte by potentiometric titration
metallurgical analysis 21(4) 64-65
Song X 2006 Determination of titanium dioxide in vanadic titanomagnetite by hydrogen peroxide
Spectrophotometry Metallurgical Analysis 26(3)
Sunil R amp Kalpana C 2011 Synthesis of diarypyrimidinones (DAPMs) using large porezeolites
Journal of molecular catalysis 210-215
Wang R Yan W amp Zhu X 2013 Methods for chemical analysis of limestone quicklime and
hydrated lime for building materials Cement(4) 49-50
Wang H 2010 Discussion on the principle and maintenance of ICP- AES Electronic product
reliability and environmental testing 28(4) 60-63
Xu C Wang Q Xu W Dai M amp Qi 2020 Trouble shooting of inductively coupled plasma
atomic emission spectrometer Metallurgical analysis 40 66-71
Xu C Wang Q amp Xu W 2020 Fault analysis and treatment of inductively coupled plasma atomic
emission spectrometer Metallurgical analysis 40(2) 66-71
Yang Z 2008 Simultaneous quantification measurement of SiFeTiCaMgZr in corundum by
inductively coupled plasma-atomic emission spectrometry with secondary-melting method Rock
and mineral analysis 31(2)
Zhang J 2019 Discussion on the determination of TiO2 by Diantipyrylmethane Spectrophotometry
Chemical enterprise management(1) 45-46
Zhi P 1999 Development and application of biochemical instruments Telecommunication
Engineering 6(2)
Zhang Q 2009 Determination of Al2O3 CaO Fe2O3 MgO MnO SiO2TiO2 in Limestone and
Dolomite by ICP-AES Analysis and testing technology and instruments 15(3) 179-181
ABSTRACT
Centria University
of Applied Sciences
Date
June 2020
Author
Jiawen Zhu
Degree programme
Environmental Chemistry and Technology
Name of thesis
DETERMINATION OF TITANIUM DIOXIDE IN LIMESTONE BY DIANTIPYRINE ME-
THANE PHOTOMETRIC METHOD
Instructor
Pages
32
Supervisor
Yue Dong
Iron ore contains useless gangue (useless rock or tailings containing useful metals or minerals) in iron-
making the main component of gangue is silica dioxide In the process of ironmaking iron is changed
into liquid state at high temperature Because the melting point of silica is very high this particle im-
purity is mixed in molten iron In order to remove this impurity limestone is chosen as the agent of
fusion The reason for choosing limestone as flux is that limestone will decompose into calcium oxide
and carbon dioxide at high temperature Calcium oxide reacts with silica at high temperature to form
calcium silicate with lower melting point than that of molten iron Because the density of liquid calcium
silicate is smaller than that of molten iron and molten iron and liquid calcium silicate are insoluble
Liquid calcium silicate floats on the molten iron
Because micro alloyed steel and pure steel (steel with few non-metallic inclusions and gases or steel
with few harmful elements such as oxygen sulfur phosphorus hydrogen and nitrogen) have higher
requirements for non-metallic inclusion control (in the process of steelmaking a small amount of slag
refractories and reaction products are formed by entering the molten steel) of steel Titanium is one of
the important alloy elements In addition to its strong deoxidizing ability it can also denature non-
metallic inclusions in steel thus improving the mechanical properties of steel Therefore adding proper
amount of titanium into steel has an important influence on the quality of steel what kind of inclusions
are formed and the shape of inclusions Therefore the accurate determination of titanium dioxide in
limestone is of great significance to the control of inclusions in steel
The spectrophotometer is a common device This method does not have high requirements on the la-
boratory The diantipyryl methane (DAPM) photometric method is a color reagent with less interference
and has strong adaptability In this experiment the DAPM photometric method will be used to measure
titanium dioxide in limestone
Key words
Ascorbic acid Diantipyryl methane Limestone Silicon dioxide Spectrophotometer
CONCEPT DEFINITIONS
List of abbreviations
Al2O3 Aluminum oxide
CaCO3 Calcium carbonate
CaO Calcium oxide
DAPM Diantipyryl methane
EDTA Ethylene Diamine Tetraacetic Acid
Fe2O3 Iron oxide
Fe2+ Ferrous iron
HClO4 Perchloric acid
HNO3 Nitric acid
H2O2 Hydrogen peroxide
H2SO4 Sulfuric acid
H3PO4 Phosphoric acid
HF Hydrofluoric acid
ICP-AES Inductively Coupled Plasma-Atomic Emission Spectroscopy
MgO Magnesium oxide
SiO2 Silicon dioxide
TiO2 Titanium dioxide
TiO2+ Titanium oxide ion
Ti3+ Titanium ion
UV-vis Ultraviolet visible
XRF X-ray fluorescence
ABSTRACT
CONCEPT DEFINITIONS
CONTENTS
1 INTRODUCTION 1
2 DETERMINATION OF TITANIUM DIOXIDE IN INDUSTRIAL RAW MATERIALS 3
21 Spectrophotometer 3
22 Diantipyryl methane spectrophotometry 6
23 Inductively coupled plasma atomic emission spectrometry 7
24 Titration analysis 9
25 X-ray fluorescence spectrometry 10
26 Hydrogen peroxide photometry and ferrotitanium spectrophotometry 13
3 EXPERIMENT 14
31 Reagents and reagents preparation 14
32 Experimental procedure 15
33 Procedure of sample decomposition 15
34 Procedure of color rendering 16
35 Procedure of the absorbance measuring 19
36 Interference test of calcium and magnesium ions 20
4 RESULTS AND DISCUSSIONS 22
41 Measurement results of titanium dioxide content 23
42 Accuracy of results discussion 24
5 CONCLUSION 26
REFERENCES 27
APPENDICES
FIGURES
FIGURE 1 The structure of ultraviolet spectrophotometerhelliphelliphelliphelliphelliphelliphelliphelliphelliphelliphelliphelliphelliphelliphelliphelliphellip5
FIGURE 2 The molecular structure of Diantipyrylmethane6
FIGURE 3 Absorbance values at different wavelengths7
FIGURE 4 Wavelength dispersive spectrometer and energy dispersive spectrometer helliphelliphelliphelliphelliphelliphelliphelliphelliphelliphellip12
FIGURE 5 The experimental procedure of measuring titanium dioxide content in limestone by dianti-
pyryl methane photometry 15
TABLES
TABLE 1 Effect of acidity in hydrochloric acid medium on color reaction18
TABLE 2 The absorbance values of different ascorbic acid dosages18
TABLE 3 The dosage of DAPM experiment19
TABLE 4 Optimal wavelength test datahelliphelliphelliphelliphelliphelliphelliphelliphelliphelliphelliphelliphelliphelliphelliphelliphelliphelliphelliphelliphelliphelliphelliphelliphelliphelliphellip20
TABLE 5 The interference experiment results of calcium and magnesium21
TABLE 6 Experimental measurement data24
TABLE 7 Average value of samples24
1
1 INTRODUCTION
Calcium carbonate (CaCO3) is the main component of limestone which is the main raw material for
glass production In addition to the main component CaCO3 in limestone limestone also contains a small
amount of silicon dioxide (SiO2) aluminum oxide (Al2O3) iron oxide (Fe2O3) magnesium oxide (MgO)
and titanium dioxide (TiO2) Lime and limestone are widely used as building materials and important
raw materials for many industries CaCO3 can be directly processed into stone stock and burnt into
quicklime Lime has quicklime and hydrated lime The main component of quicklime is calcium oxide
(CaO) which is generally lumpy pure white light gray or light yellow when containing impurities In
the chemical industry limestone is mainly used to fabricate alkali calcium carbide CaCO3 potassium
carbonate nitrogen fertilizer phosphate fertilizer and other raw materials Limestone is used as agent of
fusion in ironmaking to remove gangue (Qingling 2009 179-180) Quicklime is used as slagging mate-
rial in steelmaking to remove harmful impurities such as sulfur and phosphorus Titanium is one of the
important alloy elements In addition to its strong deoxidizing ability it can also denature non-metallic
inclusions in steel thus improving the mechanical properties of steel Therefore adding proper amount
of titanium into steel has an important influence on the quality of steel and the formation of nonmetallic
inclusions The determination of TiO2 content in limestone is of great significance to the improvement
of steel quality and the control of non-metallic inclusions in steelmaking and ironmaking (Junhua 2016
37)
There are many methods of measuring TiO2 and there are several determination methods titration anal-
ysis (ammonium ferric sulfate volumetric method hydrogen peroxide (H2O2) coordination-bismuth salt
solution titration method) spectrophotometry H2O2 photometric method ferro-titanium reagent photom-
etry) large-scale instrumental analysis (inductively coupled plasma-atomic emission spectrometry (ICP-
AES) and X-ray fluorescence (XRF) spectrometry) For the determination of TiO2 content in the sample
by titration analysis This method has poor sensitivity and selectivity In chemical analysis the sensitiv-
ity is expressed by the molar absorption coefficient ε It refers to the absorption capacity of matter to
light of a certain wavelength The value of ε reflects the degree of light absorption of the absorption
medium For the medium with selective absorption in the visible light area it indicates the sensitivity of
a certain color reaction For the same measured element the greater the value of ε the more sensitive
the color reaction is For the same color reaction the value of ε is related to the measured concentration
The higher the molar absorption coefficient the higher the sensitivity Selectivity refers to the ability to
avoid interference of other coexisting components in the sample when a certain analytical method is
used to determine a certain component Other elements such as vanadium tin molybdenum tungsten
2
copper and arsenic can interfere experimental determination Together with titanium oxide ion (TiO2+)
these elements are completely or partially reduced to a low valence state and oxidized leading to high
experimental results Although the titration analysis method does not have high requirements for instru-
ments and equipment the accuracy of the measurement results is poor and the scope of use is narrow
In H2O2 photometry the experimental operation is simple and fast but the stability of hydrogen is poor
For the determination of TiO2 samples by ICP-AES the ICP-AES was used to determine the content of
TiO2 in the experiment The method is fast accurate highly sensitive and has good reproducibility and
stability But the instrument is expensive and this method is difficult to widely promote and apply (Juan
2019 46)
Using diantipyryl methane (DAPM) photometry method for determining TiO2 is easy to operate and it
has high sensitivity good reproducibility and stability This thesis introduces the method of determining
the content of TiO2 in limestone sample A (mass fraction of TiO2 content is 0041 ) sample B (mass
fraction of TiO2 content is 0074 ) and sample C (mass fraction of TiO2 content is 0130 ) by using
DAPM photometry In the end influence of different factors for the determination of TiO2 such as
dosage of ascorbic acid dosage of DAPM spectrophotometry chromogenic reagent influence of acid
concentration and elimination method will be discussed
3
2 DETERMINATION OF TITANIUM DIOXIDE IN INDUSTRIAL RAW MATERIALS
For the determination of TiO2 in alloys ores or other industrial raw materials there are several detection
methods in the world such as titration detection method XRF detection method ICP-AES detection
method and DAPM spectrophotometry In the experimental for the determination of TiO2 by ammonium
ferrate volumetric method the experiment needs to be carried out in hydrochloric acid (HCl) or sulfuric
acid medium (H2SO4) TiO2+ is reduced to titanium ion (Ti3+) by metal aluminum sheet Potassium thi-
ocyanate is used as indicator and titrated with standard solution of ammonium ferrate sulfate Vanadium
tin molybdenum tungsten copper arsenic and other elements will interfere with the experimental re-
sults These elements will be fully or partially reduced to a low valence state together with TiO2+ and
then oxidized by high iron to produce high results (Juan 2019 45)
In the determination of TiO2 by H2O2 coordination-bismuth salt solution back titration method Firstly
adding appropriate amount of H2O2 to the solution which containing TiO2+ will form a yellow complex
And then adding excessive Ethylene Diamine Tetraacetic Acid (EDTA) to make it a more stable ternary
complex The remaining EDTA was titrated with bismuth salt solution to xylenol orange as indicator
This method is often used for samples of high titanium content Although titrimetric analysis has low
requirements for instruments and equipment its accuracy is poor and its application range is narrow In
the experiment of TiO2 sample determination by ICP-AES the inductively coupled plasma-atomic emis-
sion spectrometer was used to determine the content of TiO2 This method is fast accurate highly sen-
sitive and has good stability but the large instruments used are expensive This method is difficult to
widely promote and apply The advantages of DAPM photometry are as follows it avoids tedious ex-
perimental steps it can be used as a very practical analysis method in scientific research detection and
it can be widely used in the determination of TiO2 in steel alloys and mineral raw materials Compared
with other detection methods the DAPM spectrophotometry is more simple the detection speed is faster
and the repeatability of the experimental is good (Juan 2019 45)
21 Spectrophotometer
A spectrophotometer is a scientific instrument that breaks light with complex composition into spectral
lines The measurement range generally includes the visible light region with a wavelength range of 380-
780 nm and the ultraviolet light region with a wavelength range of 200-380 nm Different light sources
have their own unique emission spectrum so different luminous bodies can be used as the light source
4
of the instrument The emission spectrum of tungsten lamp is formed in this way After refracting the
spectrum light of 380-780 nm wavelength emitted by tungsten lamp light source through a prism a
continuous color spectrum composed of red orange yellow green blue indigo and violet can be ob-
tained The color spectrum can be used as the light source of the visible light spectrophotometer
(Xiaohua 2012 6)
Ultraviolet spectrophotometer is based on the absorption spectrum of substances to study the composi-
tion structure and interaction of substances The ultraviolet spectrophotometer can arbitrarily choose
different wavelengths of light in the ultraviolet visible region The absorption spectrum of a substance
is that the molecules and atoms in the substance absorb the light energy of certain specific wavelengths
in the incident light The molecular vibrational energy level transition and the electronic energy level
transition occur accordingly All kinds of substances have their own different molecules atoms and
different molecular space structures Their absorption of light energy is different Therefore each sub-
stance has its own unique and fixed absorption spectrum curve The absorbance at certain characteristic
wavelengths on the spectrum can be used to distinguish or determine the content of the substance Ul-
traviolet spectrophotometry is based on Lambert-Beer law According to Lambert-Beer law A = εbc
(A is the absorbance ε is the molar absorption coefficient b is the thickness of the liquid cell and c is
the concentration of the solution) This law can be used to analyze the solution quantitatively (Mohamed
amp Hassan 2015 4)
There are many types of ultraviolet visible (UV-vis) spectrophotometers but their basic structures are
similar The UV-vis spectrophotometers are composed of five parts light source monochromator ab-
sorption cell detector and signal display system The structure of the ultraviolet spectrophotometer is
shown in FIGURE 1 The light source is a device to provide the incident light that meets the requirements
The common light source in the visible light area of the UV-vis spectrophotometer is tungsten lamp and
the common light source in the UV-vis light area is hydrogen lamp or deuterium lamp Tungsten lamp
is the most commonly used visible light source It can emit a continuous spectrum of 325-2500 nm and
the most suitable wavelength range is 320-1000 nm Therefore it can also be used as near-infrared light
source Deuterium lamp is the most commonly used ultraviolet light source It emits light with a wave-
length range of 190-400 nm and the wavelength range is generally 190-360 nm The second part of the
UV-vis spectrophotometer is monochromator which decomposes the continuous spectrum of the light
source into monochromatic light and can accurately and conveniently select the optical device of a cer-
tain wavelength needed It is the heart of the photometer Monochromator is mainly composed of slit
dispersion element and lens system The dispersion element is the main part of monochromator The
5
most commonly used dispersion elements are prism grating or a combination of the two The dispersive
element is shown in the FIGURE 1 It is a combination of prism and grating (Xiaojing 2015 19-20)
The absorption tank is a vessel used to hold the liquid to be measured and determine the thickness of the
transparent liquid layer of the solution to be measured also known as a cuvette Generally speaking the
absorption tank is a cuboid which also has a circle or other shapes The absorption tank in FIGURE 1
is a cuboid The bottom and both sides of the absorption tank are ground glass and the other two sides
are optical light transmitting surfaces According to the material of the light transmitting surface the
absorption tank can be divided into two types glass absorption tank and quartz absorption tank The
glass absorption cell is used for the determination of visible light area and the quartz absorption cell is
used for the determination of ultraviolet light area The specification of absorption tank is marked by
optical path The commonly used specifications of absorption cell are 05 cm 10 cm 20 cm 30 cm
50 cm The detector is a device that converts an optical signal into an electrical signal When measuring
the absorbance it is not to directly measure the light intensity through the absorption cell but to convert
the light intensity into a current for measurement This photoelectric converter is called a detector Signal
display is a device to amplify and display the output signal of detector The new spectrophotometer is
displayed by digital voltmeter and the absorbance curve is drawn directly by recorder The new spec-
trophotometer is equipped with computer data processor (Xiaojing 2015 19-20)
FIGURE 1 The structure of ultraviolet spectrophotometer (adapted from Xiaojing 2015 19)
6
22 Diantipyryl methane spectrophotometry
DAPM is white flake crystals It is insoluble in water ether and alkali But it is soluble in acid ethanol
and chloroform DAPM is soluble in acids and forms complex organic cations with acids The solution
of DAPM is colorless and it reacts with Ti3+ to form yellow complexes DAPM can be used as a sensitive
color reagent for the determination of Ti3+ iridium iron molybdenum neodymium uranium iridium
platinum rhenium It can also be used as an extractant for various ions The molecular formula of DAPM
is C23H24N4O2H2O The molecular structure of DAPM is shown in FIGURE 2
FIGURE 2 The molecular structure of DAPM (adapted from Liu Zhou amp Song 2011 31)
The UV-vis absorption spectrum of molecules is a common spectral analysis method based on the ab-
sorption spectrum generated by the intramolecular electronic transition When a material is irradiated by
light the material molecules will collide with the light As a result the energy of photons is transferred
to the molecules In this way the stable ground state molecules will jump to the unstable high energy
state This is the absorption of the light The qualitative analysis of UV-Vis absorption spectrum is based
on the fact that the shape of absorption curve of light to the same absorption material is different the
maximum absorption wavelength is the same but the corresponding absorption rate is different There
are three properties of UV-vis absorption spectrum the first is that the same concentration of the test
solution has different absorbance for different wavelengths of light The second point is that the higher
the concentration of the same test solution the higher the absorbance Finally the smaller the concen-
tration of the same substance the same wavelength (maximum absorption wavelength λ max) corre-
sponding to the maximum absorption peak and the same curve shape The absorbance tested results of
yellow complex formed by titanium and DAPM by DAPM spectrophotometry are shown in FIGURE 3
The shape of the absorption curve can be seen from FIGURE 3 The abscissa in the chart is the wave-
length the unit of wavelength is nm The ordinate is the absorbance and the unit of absorbance is
L(g middot cm) The absorbance reaches the maximum value at the wavelength of 390 nm In the vicinity of
7
the maximum wavelength the closer to the maximum range of the spectrophotometer the greater the
sample absorbance and the smaller the error brought by the photometer itself (Junhua 2020 38)
FIGURE 3Absorbance values at different wavelengths (adapted from Junhua 2020 38)
After consulting the literatures on the determination of TiO2 by DAPM Spectrophotometry It can be
founded that the measurement method is essentially similar The specific method is as follows Firstly
the sample needs to be decomposed the sample is placed in a platinum crucible and mixed flux (lime-
stone samples with accurate TiO2 content) is added to mix with the sample Heat the crucible at high
temperature (950-1000 ) take it out and cool it then add acid to dissolve the sample After that transfer
the solution to a volumetric flask to constant volume and blend well After transferring the solution add
ascorbic acid HCl DAPM solution put it into the spectrophotometer to measure the absorbance Finally
record the data and calculate the result (Junhua 2016 39)
23 Inductively coupled plasma atomic emission spectrometry
ICP-AES has the advantages of high accuracy and precision low detection limit fast determination
wide linear range and simultaneous determination of multiple elements It has been widely used in de-
termination of dozens of elements in environmental samples and samples of rocks minerals metals
Plasma is ionized gas with an ionization degree exceeding 01 This gas contains not only neutral
atoms and molecules but also a large number of ions and electrons (Haiyan 2010 62)
8
ICP-AES is based on the spectrum emitted by atoms to determine the chemical composition of a sub-
stance Different substances are composed of atoms of different elements and the atoms all contain a
densely structured nucleus The nucleus is surrounded by moving electrons Each electron is at a certain
energy level and has a certain energy Atoms are in a stable state under normal circumstances This state
is called the ground state When the atoms are transformed into gaseous atoms under the action of exter-
nal energy the outer electrons of the gaseous atoms are excited to a high energy state When transitioning
from a higher energy level to a lower energy level the atoms will release excess energy and emit char-
acteristic lines ICP-AES disperse the generated radiation through the instrument and record it on the
photosensitive plate in the order of wavelength which can show regular spectral lines The perform
quantitative analysis based on the obtained spectrum ICP-AES is a new type of light source that is
developing rapidly and is highly valued in the analysis of emission spectrum (Haiyan 2010 62)
ICP-AES consists of sample introduction system ICP light source dispersion system and detection sys-
tem And equipped with computer control and data processing system cooling system gas control sys-
tem ICP light source consists of high frequency power supply and ICP torch tube The ICP torch tube
consists of three concentric quartz tubes and a high-frequency induction ring (generally 2-4 rings of
hollow copper tubes) surrounded by the upper part of the tube There are three intake tubes A 10-20
Lmin argon gas is passed between the quartz outer tube and the intermediate tube Its function is to form
plasma as working gas and cool the quartz torch tube which is called plasma gas or cooling gas The
intermediate tube and the central tube are filled with 05-15 Lmin argon to become auxiliary gas which
is used to assist the formation of plasma After the plasma torch is formed it can be turned off The
carrier gas in the central tube is used to introduce the sample aerosol (Xu Wang amp Xu 2020 67)
The formation of ICP torch is called ignition The ignition is divided into three steps the first step is to
introduce plasma and auxiliary gas into the outer tube and the middle tube At present the central tube
is not connected with gas and an argon atmosphere is established in the torch tube The second step is
to connect the high-frequency power supply to the induction coil The general frequency is 7-50 mhz
and the power supply is 1-15 kw At present there is high-frequency current and high-frequency elec-
tromagnetic field generated by the coil The third step is to ionize the working gas flowing in the middle
by means of high frequency spark and then the ions and electrons produced will interact with the fluc-
tuating magnetic field produced by the induction coil This interaction causes the ions and electrons in
the coil to flow along the closed loop in the figure Their resistance to this movement causes ohmic
9
heating Because of the high temperature generated by the strong current the gas is heated to form a
torch like plasma (Xu et al 2020 67)
Aerosol injection system is a commonly used method at present The sample introduction system con-
sists of two main parts sample lifting part and atomization part The sample lifting part is generally a
peristaltic pump and a self-lifting atomizer can also be used It is required that the speed of the peristaltic
pump is stable and the elasticity of the pump pipe is good so that the sample solution can be pumped in
at a constant speed and the waste liquid can be discharged smoothly The atomizing part includes atom-
izer and atomizing chamber After the sample enters the atomizer by means of pump or self-lifting small
droplets are formed under the action of carrier gas and enter the atomization chamber The large droplets
are eliminated when they touch the wall of the atomization chamber Only small droplets can enter the
plasma source (Xu et al 2020 68) For the optical system the monochromator of ICP-AES usually
adopts the combination of grating or prism and grating And for the detection system the detection
system of ICP-AES is a photoelectric converter which uses photoelectric effect to convert the radiation
energy of different wavelengths into electrical signals (Xu et al 2020 68)
As a conventional chemical analysis technology ICP-AES has a wide range of applications in biological
samples materials geology environmental protection metallurgy and other fields In the field of met-
allurgical analysis such as steel raw materials and ferroalloys it is required to measure dozens to hun-
dreds of samples at a time And each sample must simultaneously analyze dozens of elements such as
Mn Cu Al Cr Si P Ni Ti V Nb W Ca Mg It can show the absolute advantages of ICP in terms of
work efficiency In the analysis of standard materials especially the low-value fixed-value analysis of
rare earth elements the accuracy of ICP data and the simplicity of operation are fully utilized (Haiyan
2010 62) The disadvantage of the ICP-AES method is that the equipment and operating costs are rela-
tively high The sample generally needs to be converted into a solution in advance and the determination
of some elements is not obvious such as sodium (Na) and potassium (K) (Juan 2019 46)
24 Titration analysis
There are generally two types of titration analysis to determine the content of TiO2 in the sample Am-
monium ferric sulfate volumetric method and H2O2 coordination titration The specific steps of ammo-
nium ferrate sulfate volumetric method are as follows firstly reduction of TiO2+ to Ti3+ with metal
10
aluminum tablets in HCl or H2SO4 medium And then using potassium thiocyanate as an indicator Fi-
nally titration with standard solution to ammonium ferrate sulfate The method has poor sensitivity and
selectivity But there are interference elements such as vanadium tin molybdenum tungsten copper
and arsenic that affect the experimental results These elements and TiO2 are completely or partially
reduced to a low valence state and these elements are oxidized by ferric ions (Fe3+) Leading to errors
in the experimental results (Juan 2019 46)
The specific steps of H2O2 coordination titration are as follows firstly the yellow complex will be form
by adding an appropriate amount of H2O2 to a solution which containing TiO2+Then add excess EDTA
to the solution (EDTA is a good complexing agent in chemistry It has six coordination atoms The
complex formed is called chelate EDTA is often used in coordination titration to determine the content
of metal ions In biological application it is used to exclude most transition metal elements For example
it is used to exclude the interference of iron ion nickel ion and manganese ion in the experiment) Make
it form a more stable ternary complex The remaining EDTA was titrated with xylenol orange as indica-
tor For the back titration with bismuth salt solution method when the reaction is slow or the reactant is
solid add a certain amount of titration solution Normally the reaction cannot be completed immediately
At this time a certain amount of excess titrating solution can be added first to accelerate the reaction
After the reaction is completed titrating the remaining titrant with another standard solution This
method is mostly used for samples with high titanium content Although the titration analysis method
does not have high requirements for instruments and equipment but the accuracy of the measurement
results is poor and the scope of use is narrow (Juan 2019 46)
25 X-ray fluorescence spectrometry
People usually irradiate X-rays on substances to produce secondary X-rays called XRF The X-rays used
for irradiation are called primary X-rays XRF is still X-ray XRF spectrometer is mainly composed of
excitation dispersion detection recording and data unit The role of the excitation unit is to generate
primary X-rays It consists of high-voltage generator and X-ray tube The role of the dispersion unit is
to separate X-rays of the desired wavelength It consists of sample chamber slit goniometer analysis
crystal and other parts The role of the detector is to convert X-ray photon energy into electrical energy
The recording unit is composed of an amplifier a pulse amplitude analyzer and a display part X-ray
tube generates incident X-rays to excite the tested sample Each element in the excited sample emits
11
secondary X-rays and the secondary X-rays emitted by different elements have specific energy charac-
teristics or wavelength characteristics The detection system measures the energy and quantity of these
emitted secondary X-rays The instrument software converts the information collected by the detection
system into the types and contents of various elements in the sample By using the principle of X-ray
fluorescence every element after beryllium in the periodic table can be measured theoretically In prac-
tical applications the effective element measurement range is element 9 (F) to element 92 (U) in the
periodic table (Chu Li amp Jiang 2014 40)
The characteristic X-ray energy and wavelength emitted by different elements are different Therefore
no matter what kind of element can be detected by measuring the energy or wavelength of X-ray At the
same time the characteristic X-ray intensity of an element emitted after the sample is excited It is related
to the content of this element in the sample so the quantitative analysis of the element can be performed
by measuring its intensity There are two basic types of XRF spectrometers wavelength dispersive spec-
trometer and energy dispersive spectrometer The structure of the instrument is shown in FIGURE 4
12
FIGURE 4 Wavelength dispersive spectrometer and energy dispersive spectrometer (adapted from Bo
Xiao amp Tao 2015 1308)
With the development of instrument technology and theoretical methods the application range of XRF
analysis is very widely In the analysis of the composition of substances in the metallurgy geology
chemical industry machinery petroleum building materials and other industrial sectors agriculture and
medicine and health as well as physics chemistry biology geoscience environment astronomy and
archaeology and other research departments have been widely applications (Chu et al 2014 37)
13
26 Hydrogen peroxide photometry and ferrotitanium spectrophotometry
H2O2 is a colorless odorless liquid with bitter taste and easy to decompose into water and oxygen It is
a strong oxidant H2O2 is often used for sterilization in the workplace starch whitening in the industry
or as a strong oxidant for food or food packaging and liquid fuel propellant In this method phosphoric
acid (H3PO4) and H2SO4 were used to dissolve the sample In the medium of 5 H2SO4 by volume
TiO2+ and H2O2 formed a yellow complex ion in the acidic condition The stable equilibrium constant
of the complex is k = 10 times 104 and the maximum absorption wavelength is λmax = 405 nm H2O2
spectrophotometry is simple and rapid but its sensitivity and selectivity are poor Sodium catechol-35
sulfonate forms a yellow complex with titanium at pH = 47-49 Ferrotitanium reagent has high sensi-
tivity and can be used for the continuous determination of trace titanium and iron (Xinyan 2006 66)
14
3 EXPERIMENT
There are three main experimental steps sample decomposition color rendering and absorbance exper-
iment which are studied and developed extensively in this project The detail procedures of both topics
will be fully displayed Besides some important choices of chemical reagents during the experiment
will be explained by five variable value optimization experiments optimal selection of the spectropho-
tometerrsquos wavelength the optimal dosage of acidity the optimal dosage of DAPM the optimal dosage
of ascorbic acid and the interference factors analysis experimental
31 Reagents and reagents preparation
The reagents used in the experiment are as follows mixed flux grind from anhydrous sodium sulfate
and boric acid potassium pyrosulfate HCl with a density of 119 gmL H2SO4 with a density of 184
gmL HCl (1+1) ((1+1) is the solution which mix 1 ratio of HCl with 1 ratio of water in volume The
molar concentration of HCl (1+1) is 6 molL) H2SO4 (5+95) ((5+95) is the solution which mix 5 ratio
of H2SO4 with 95 ratio of water in volume The molar concentration of H2SO4 (5+95) is 09 molL)
ascorbic acid solution (20 gL) DAPM solution (50 gL) TiO2 stock solution (100 μgmL) and TiO2
standard solution (10 μgmL)
The preparation steps for ascorbic acid solution (20 gL) are as follows weigh 20g of ascorbic acid add
200-300 mL of water to dissolve the sample and stir evenly After the ascorbic acid is completely dis-
solved transfer the solution to a 1 L volumetric flask and make up to volume The preparation steps of
the TiO2 stock solution (100 μgmL) are as follows weigh 01 g of TiO2 and place it in a platinum
crucible and then add 5-7 g of potassium pyrosulfate Put them into a high-temperature furnace raise
the temperature to 600 deg C to melt Use 60 mL H2SO4 to dissolve the melt After it cooling to room
temperature transfer it to a 1000 mL volumetric flask diluted with H2SO4 to the mark and mixed fully
The preparation of the TiO2 standard solution (10 μgmL) are as follows add 50mL of TiO2 stock solu-
tion to a 500 mL volumetric flask And then add H2SO4 to constant volume and mix it well
Three instruments are used in this experiment platinum crucible (The volume needs to be greater than
30 mL) high temperature furnace (The crucible heating temperature is suitable for 100-1100 ) and
UV-vis spectrophotometer (1000 nm ge wavelength ge 180 nm) Before using the spectrophotometer
15
connect the spectrophotometer to the power supply turn on the instrument switch lift the lid of the
sample chamber and preheat the sample chamber for 10 minutes
32 Experimental procedure
Before the experiment the preparation of reagents and the commissioning of equipment need to be com-
pleted The preparatory work includes preparation of ascorbic acid solution (20 gL) preparation of
DAPM solution (50 gL) preparation of TiO2 stock solution (100 μgmL) and preparation of TiO2 stand-
ard solution (10 μgmL) After the reagent preparation is completed proceed to the second step as shown
in FIGURE 5 Dissolve the sample after weighing it Thirdly render the color of the sample solution
The fourth step is measure the absorbance of the developed solution by spectrophotometer And finally
record and process the experimental data
FIGURE 5 The experimental procedure of measuring titanium dioxide content in limestone by dianti-
pyryl methane photometry
33 Procedure of sample decomposition
In this experiment the samples selected three limestones with known accurate TiO2 content The TiO2
content (mass fraction) of sample A is 0041 the TiO2 content (mass fraction) of sample B is 0074
and the TiO2 content (mass fraction) of sample C is 013 The purpose of these accurate data is to
make a precision comparison with the data measured in this experiment and verify the accuracy of the
experimental method A total of three sets of experiments were conducted and each set was measured 6
times
The sample decomposition steps are as follows take 02 g limestone (crumb limestone) sample into a
platinum crucible add 5 g mixed flux (anhydrous sodium carbonate and boric acid) Secondly place the
platinum crucible in a high-temperature furnace and gradually increase the temperature to 950-1000
Weighing of
samplesamp
reagents
preparation
Sample
decomposition
Color
rendering
Absorbance
experiment
Experimental
data recording
16
After the sample is melted take it out and cool it to room temperature Thirdly put the crucible in the
250 mL beaker together with the sample and add HCl into the beaker Finally heat the beaker at around
75 to make the solution transparently After cooling to room temperature dilute the solution to 100
mL with water (Wang Yan amp Zhu 2013 49) During the experiment HCl is used to dissolve the sample
The choice of acid type needs to be determined through the phenomenon of sample dissolution in dif-
ferent acid systems Through experiments of dissolving samples in various acid systems the results can
be obtained the most suitable acid for dissolving limestone
For the optimal selection of the dosage and the type of acid to dissolve the sample the experimental
procedure is as follows select 025 g of limestone sample B with a TiO2 content of 0074 and place
it in 6 polytetrafluoroethylene beakers Add HCl (1+1) nitric acid (HNO3) (1+1) perchloric acid (HClO4)
(1+1) hydrofluoric acid (HF) (1+1) and H2SO4 (5+95) to dissolve the sample with different acid systems
composed of these acids Put 20 mL HCl into the first beaker By observing the solution in the beaker
the solution is cloudy with residue For the second beaker add HCl of the same volume as the first
beaker and 5 mL HNO3 The phenomenon of the solution is cloudy with residue For the third beaker
add HCl and HNO3 of the same volume as the second beaker and 10 mL HClO4 into the beaker By
observing the phenomenon of the reaction the solution is cloudy with residue For the fourth beaker put
20 mL HCl 10 mL HClO4 5 mL HF into the beaker The limestone sample is completely dissolved
And then put add HCl HNO3 and HClO4 of the same volume as the third beaker and 5 mL HF into the
fifth beaker the limestone sample is completely dissolved For the last beaker choose 20 mL HCl 10
mL HClO4 5 mL HF and 5 mL H2SO4 to dissolve the sample The solution is turbid
34 Procedure of color rendering
Whether the color rendering reaction can meet the requirements of the photometric method in addition
to mainly related to the nature of the chromogenic reagent it is also very important to control the con-
ditions of the color reaction The color rendering conditions mainly included the dosage of the chromo-
genic reagent and the acidity of the solution In order to make the color reaction as complete as possible
it is necessary to add an appropriate dosage of the chromogenic reagent If an excessive dosage of chro-
mogenic reagent is added it will cause side reactions which are not conducive to the measurement In
the experiment the appropriate dosage of the chromogenic reagent is obtained through related experi-
ments Most chromogenic reagents are organic weak acids The acidity of the solution affects the disso-
17
ciation of the chromogenic reagent and the completeness of the color rendering reaction Many chromo-
genic reagents are acid-base indicators The acidity of the solution will change the initial color of the
chromogenic reagent The acidity of the solution also has an effect on the composition and stability of
the colored complex
Three solutions need to be added in the color rendering experiment Firstly HCl needs to be added to
control the acidity of the solution Secondly ascorbic acid solution needs to be added to reduce Fe3+ to
ferrous iron (Fe2+) in the solution Because of the main interference element of this experiment is iron
So it is necessary to eliminate this interference by adding ascorbic acid solution Finally add DAPM for
color rendering reaction So before rendering colors the optimal dosage of these three solutions needs
to be found
The acidity of the solution affects the dissociation of the chromogenic reagent and the completeness of
the color rendering reaction Therefore maintaining the acidity of the solution is a prerequisite for start-
ing the color rendering experiment Determine the experiment steps of optimum dosage of HCl are as
follows take 10 mL of the test solution in 50 mL volumetric flask And then add 5 mL of ascorbic acid
solution and mix it well Place it for about 5 minutes Add 2 mL 4 mL 6 mL 8 mL 10 mL 12 mL 16
mL 20 mL HCl to 8 flasks respectively then add 7 mL of DAPM solution into each flask Dilute the
solution to the mark with water and mix it well Leave it for about half an hour at room temperature
Then put the chromogenic reagent into the spectrophotometer to measure the absorbance (detection
wavelength is 385 nm) It can be realized from TABLE 1 that the acidity in HCl medium has minimal
effect on the color rendering reaction During the analysis add 6 mL of 6 molL HCl to control the
normal concentration of about 113 N Normality (N) is defined as the number of equivalents per liter of
solution where definition of an equivalent depends on the reaction taking place in the solution For an
acid-base reaction the equivalent is the mass of acid or base that can furnish or accept exactly 1 mole of
proton (H+ ions) And this is based on the HCl concentration It can be seen from the absorbance value
in the last row of TABLE 1 that the acidity has little effect on the color rendering reaction in HCl medium
In the analysis process add 6 mL 6 molL HCl solution to control the normal concentration at 113 N
18
TABLE 1 Effect of acidity in HCl medium on color reaction
Flask1 Flask 2 Flask 3 Flask 4 Flask 5 Flask 6 Flask 7 Flask 8
HCl
(1+1) mL
2 4 6 8 10 12 16 20
Normal
concentration
(N)
065 089 113 137 161 185 233 290
Absorbance
L(gmiddotcm)
0185 0185 0185 0185 0185 0185 0185 0180
After determining the acidity of the solution the second problem to be determined is the optimal dosage
of ascorbic acid reagent Take several copies of 10 mL sample B solution with 0074 TiO2 content
add different amounts of ascorbic acid solution Then add 6 mL of HCl and 7 mL of DAPM for color
development and measure the absorbance by spectrophotometer (detection wavelength is 385 nm) The
absorbance values of different ascorbic acid dosages are shown in TABLE 2 The effect of adding
different volume of ascorbic acid on absorbance is shown in TABLE 2 The experimental results show
that when the dosage of ascorbic acid is between 3 mL and 15 mL the absorbance remains stable In
order to facilitate the operation and ensure complete reduction reaction we chose the dosage of ascorbic
acid to be 5 mL
TABLE 2 The absorbance values of different ascorbic acid dosages
Flask 1 Flask2 Flask3 Flask4 Flask5 Flask6
Ascorbic
acid (mL)
1 3 5 6 10 15
Absorbance
L(gmiddotcm)
0509 0514 0515 0515 0515 0515
After determining the dosage of the HCl and the ascorbic acid the third question is the optimal dosage
of DAPM Firstly take several copies of 5 mL sample B solution which content about 0074 of TiO2
and put the each solution into a 50 mL volumetric flask Secondly add 6 mL of HCl 5 mL of ascorbic
acid and different amounts of DAPM for color rendering reaction Finally measure the absorbance value
19
at 385 nm wavelength the experimental results are shown in the TABLE 3 From the experimental data
it can be seen that the absorbance of the DAPM chromogenic reagent is basically constant when it is
above 5 mL So the optimum dosage of the DAPM chromogenic reagent is 7 mL
TABLE 3 The dosage of DAPM experiment
Flask1 Flask2 Flask3 Flask4 Flask5 Flask6 Flask7 Flask8 Flask9
The dosage of
DAPM (mL)
2 3 4 5 6 7 8 9 10
Absorbance
L(gmiddotcm)
0226 0259 0282 0299 0231 0232 0232 0234 0233
Through the above three experiments (determine the optimal dosage of HCl ascorbic acid and DAPM)
the exact dosage of the three reagents in the color rendering experiment was determined The order and
steps of adding the three reagents are as follows firstly take 10 mL of TiO2 standard solution and put it
in a 50 mL volumetric flask Secondly add 5 mL of ascorbic acid solution mix it well Place the solution
for 5 minutes in the room temperature Then add 6 ml hydrochloric acid to mix the reagent evenly
Finally add 7 mL of DAPM into the solution Dilute the solution to the mark with water and mix it well
Leave it for 30 minutes in the room temperature and prepare to measure the absorbance
35 Procedure of the absorbance measuring
After the color rendering reaction is completed the test solution needs to be placed in a cuvette for
absorbance testing By changing the test wavelength the optimal wavelength is determined according
to the absorbance corresponding to each wavelength The absorbance at different wavelengths after color
development is shown in TABLE 4 It can be seen from the data that the wavelength has a maximum
value at 380-390 nm To ensure the best sensitivity the test wavelength is selected at 385 nm Under the
test of the maximum absorption wavelength the response of the instrument is more sensitive and the
measurement data is more accurate
20
TABLE 4 Optimal wavelength test data
Flask1 Flask2 Flask3 Flask1 Flask4 Flask5 Flask6 Flask7
Wavelength (nm) 360 370 380 385 390 400 410 420
Absorbance
L(gmiddotcm)
0499 0533 0547 0554 0543 0533 0502 0461
After determining the optimal wavelength use the spectrophotometer to analyze the content of TiO2 in
the sample firstly prepare the spectrophotometer and open the sample chamber cover Turn on the
power and the indicator lights up let the instrument warm up for 20 minutes Set the selector switch to
the T knob to display the number as 000 Secondly turn the wavelength knob to the 385 nm wave-
length and align the scale line Transfer the color rendering solution into a 3 cm cuvette and place it on
the colorimetric shelves And then close the sample chamber cover and adjust the light transmittance
100 T knob to make the number display as 1000 T Turn the selector switch to the A zero adjust-
ment knob the digital display should be 000 Then pull out the lever to put the solution to be measured
into the optical path and the digital display value is the absorbance A of the sample According to the
absorbance data it can be easily get the mass of TiO2 in the test solution After the measurement is
completed open the sample chamber cover and turn off the power switch
36 Interference test of calcium and magnesium ions
The main components of limestone are CaO and magnesium oxide (MgO) In order to determine whether
CaO or MgO has an effect on the determination of TiO2 Firstly prepare two standard solutions CaO
standard solution and MgO standard solution The content of CaO in the CaO standard solution is 10
mgL And the content of MgO in the MgO standard solution is 10 mgL Extract several parts from the
two prepared solutions and add a certain amount of TiO2 standard solution 4 mL (The amount of TiO2
added is 40 ug) to each part According to the method of 34 for color rendering the interference
experiment results of calcium ion and magnesium ion are as shown in TABLE 5 It can be seen from the
absorbance value in TABLE 5 that CaO and MgO have no effect on the determination of TiO2 There
was no difference in absorbance before and after adding CaO and MgO
21
TABLE 5 The interference experiment results of calcium ion and magnesium ion
Flask 1 Flask 2 Flask 3 Flask 4
The amount of TiO2 added 40 ug 40 ug 40 ug 40 ug
The amount of CaO added
(no MgO)
10 mg 20 mg 30 mg 40 mg
Absorbance L(gmiddotcm) 0551 0548 0550 0551
Flask 5 Flask 6 Flask 7 Flask 8
The amount of TiO2 added 40 ug 40 ug 40 ug 40 ug
The amount of MgO added
(no CaO )
10 mg 15 mg 20 mg 25 mg
Absorbance L(gmiddotcm) 0551 0550 0548 0551
22
4 RESULTS AND DISCUSSIONS
Through the acid system selection experiment the optimal selection of the spectrophotometerrsquos wave-
length experiment the optimal dosage of acidity selection experiment the optimal dosage of DAPM
selection experiment the optimal dosage of ascorbic acid selection experiment and the interference fac-
tors analysis experimental the accurate dosage of reagents was determined by these experiments Ac-
cording to the reaction phenomena or absorbance results of each experiment the corresponding experi-
mental results were obtained
In the acid system selection experiment the following conclusions can be drawn from the observation
of six experimental phenomena In the system of HF and HClO4 the sample is completely dissolved (the
precipitation is precipitated by adding H2SO4 the solution is turbid) but HClO4 and HF have a effect on
the determination of titanium and the fluoride ion is easy to complex with titanium And this
combination is likely to lead to the results on the low performance The presence of HClO4 can combine
with DAPM to produce white flocculent precipitate which led to the failure of the experiment In order
to eliminate the influence of insoluble residue to the analysis and ensure the sample is completely
dissolved The experiment uses the usual method which is anhydrous sodium carbonate and boric acid
system solvent mixed together for melting This method is simple and fast and the melting is complete
The acid system is relatively simple without introducing HClO4 acid HF acid and other kinds of acid
HCl is used to dissolve the sample and the sample dissolves quickly
In the optimal dosage of acidity selection experiment By observing the results of absorbance under
different acidity The best color acidity can be obtained add 6 mL of 6 molL HCl to control the color
acidity of solution In the optimal dosage of DAPM selection experiment through the absorbance test
results of solutions with different DAPM dosage It can be concluded from the data that the best dosage
of DAPM solution is 7 mL In the the optimal selection of the spectrophotometerrsquos wavelength
experiment according to the test results of absorbance of solution at different wavelengths it can be
concluded that the optimal wavelength is 385 nm In the optimal dosage of ascorbic acid selection
experiment through the absorbance test results of several solutions added with different volume of
ascorbic acid it can be concluded that the optimal dosage of ascorbic acid is 5 mL In the interference
factors analysis experimental it can be seen from the absorbance value in experiment results that CaO
and MgO have no effect on the determination of TiO2 By determining the accurate dosage of various
reagents a set of measurement steps with accurate actual dosage is formulated
23
41 Measurement results of titanium dioxide content
The content of TiO2 in three limestone samples was determined six times in parallel The analysis result
is rounded according to the rules of bankerrsquos rounding In order to avoid the phenomenon of big error
caused by rounding rules The specific method of data processing in this rule is as follows when the
mantissa is less than or equal to 4 the mantissa will be directly rounded off When the mantissa is greater
than or equal to 6 round off the mantissa and carry forward one digit When the mantissa is equal to 5
but the numbers after the mantissa are all 0 the previous digit of the mantissa should be used as a refer-
ence If the previous number is an odd number move one digit forward If the previous number is even
the mantissa is discarded If the mantissa is 5 but there is a number that is not 0 after the mantissa
whether the number before the mantissa is odd or even the number must move forward one bit
This experiment is carried out under the specified repeatability conditions the same experimental re-
searcher carries out the experiment uses the same instrument to carry out the experimental measurement
carries out the experiment under the same experimental conditions carries out the same calibration in a
short time TiO2 content is calculated according to the mass fraction WTiO2 calculation formula (1)
2
6
1
1
10100
TiO
mw
m V V
minus=
(1)
V1 The volume of the solution obtained separately from the sample solution The unit is milliliter (mL)
V Total volume of sample solution The unit is milliliter (mL)
m1 The quality of the titanium dioxide obtained separately from the sample solution The unit is mi-
crogram (μg)
m The quality of the sample The unit is gram (g)
The measurement results of the experiment are shown in the TABLE 6 The experimental data compared
with the TiO2 content in three limestone samples are shown in TABLE 7 For sample A the TiO2 content
obtained from the first and third experiments is basically consistent with the known accurate TiO2
content of sample A In addition to the second experimental data the accuracy of other experimental
data is good Compare with the other five groups of data the results of the second experiment have
relatively large errors For sample B the content of TiO2 obtained in the third experiment is almost the
same as the given value The TiO2 content measured in the fifth experiment is quite different from the
given value compared with the other five groups of data For sample C the TiO2 content obtained from
six experiments is almost the same as the given TiO2 content
24
TABLE 6 Experimental measurement data
Experiment
1
Experiment
2
Experiment
3
Experiment
4
Experiment
5
Experiment
6
Sample A
()
00412 00423 00409 00414 00416 00415
Sample B
()
00730 00750 00740 00765 00780 00735
Sample C
()
01250 01280 01290 01310 01240 01260
42 Accuracy of results discussion
From the average value of the data it can be seen that the accuracy of using the DAPM photometry to
determine the TiO2 content in limestone TABLE 7 is the average value of TiO2 content measured in six
experiments for each sample from TABLE 6 The second column is the certified value of the three
samples The mass fraction of TiO2 content in sample A is 0041 The mass fraction of TiO2 content
in sample B is 0074 The mass fraction of TiO2 content in sample C is 013 And the third column
is the average values which are obtained through experimental measurement and calculation As can be
seen from TABLE 7 The average value of TiO2 content in several groups of limestone samples meas-
ured by this experiment have high accuracy
TABLE 7 Average mass fraction of TiO2 content in limestone
Certified value Average value
Sample A () 0041 00414
Sample B () 0074 00750
Sample C () 0130 01272
HCl was used to dissolve the sample If HClO4 is used in the experiment it will form white flocculent
precipitate with DAPM which will affect the absorbance test If HF is used in the experiment fluorine
ions will complexate with titanium to form titanium fluoride complex which will affect the accuracy of
25
the experimental results If only HNO3 is used for decomposition except for incomplete decomposition
of the sample HNO3 also destroys DAPM thus affecting the continuation of the experiment According
to the dissolution treatment experiment and acidification experiment the HCl system is relatively simple
without the introduction of HClO4 HF and other types of acids And the sample dissolves quickly by
HCl leaching
In the experiment of determine the optimal dosage of DAPM solution it can be concluded that the
optimal dosage of DAPM is 7mL When the amount of DAPM is more than 6 mL the absorbance tends
to be stable If the flux of DAPM does not reach 6 mL the color reaction will be incomplete which will
affect the whole experiment For the selection of the amount of ascorbic acid ascorbic acid is used to
reduce Fe3+ in the solution to Fe2+ In order to eliminate the interference 5 mL ascorbic acid was selected
to reduce Fe3+ in the sample If the amount of ascorbic acid is less than 5 mL the remaining unreduced
Fe3+ will affect the accuracy of the whole experiment
In this experiment temperature and time have influence on the measurement results In 15-80 the
absorbance value is not affected by temperature However if the iron content in the sample is high and
the temperature is higher than 60 the solution is easy to be turbid and unable to compare colors
Therefore this experiment uses 15-30 room temperature to render color The color solution is very
stable and can be maintained for several months When the room temperature is higher than 20 it
tends to be stable after 20 minutes of color development When the room temperature is lower than 20
it needs 40-60 minutes to be stable In this color rendering experiment the accuracy of temperature
control is particularly important
When selecting the optimal wavelength of the test absorbance the wavelength corresponding to the
maximum absorbance is selected according to the absorption curve of the test solution In this experiment
when the wavelength is 385 nm the absorbance changes with the concentration in the largest range so
the determination is the most sensitive The absorption curve is an important basis for choosing the
wavelength of incident light in quantitative analysis In the wavelength selection experiment if the
wavelength corresponding to the maximum absorbance is not selected the accuracy of the experiment
will be insufficient
26
5 CONCLUSION
In this experiment the DAPM photometric method was used to determine the content of TiO2 The
sample is melted by sodium carbonate-boric acid mixed flux and leached with dilute HCl The experi-
ment used ascorbic acid as a masking agent to reduce Fe3+ to Fe2+ in the solution to eliminate interference
In this experiment DAPM solution was added to render the solution color In order to ensure the accu-
racy of the experimental results the amount of various reagents was optimized The following five as-
pects were quantitatively analyzed in the experiment optimal selection of the spectrophotometerrsquos
wavelength the optimal dosage of acidity the optimal dosage of DAPM the optimal dosage of ascorbic
acid and the interference factors analysis The exact dosage of each reagent was determined The TiO2
content measured in the experiment was compared with limestone with known accurate TiO2 content
The accuracy of the measurement can be seen in this experiment This experimental method has a perfect
effect on the use of spectrophotometers and promotes the determination of mineral raw materials con-
taining low TiO2 content by spectrophotometer
For the measurement results of the experiment there is a certain error between the TiO2 content meas-
ured in this experiment and the TiO2 content given in the limestone sample Through the interference
element analysis experiment it is determined that the two main components of limestone (MgO and
CaO) are not the cause of this error For several values with slightly poor accuracy there may be some
problems in the operation of the experiment The most likely reason for the poor accuracy of the data is
that after the sample dissolves the color reaction does not wait until the solution cools to room temper-
ature Another possibility is that the limestone sample is not well preserved resulting in a certain error
between the actual TiO2 value and the given value In the future experiments the above two error aspects
are further studied to ensure that the measurement method is accurate and the measurement results are
more accurate
Compared to ammonium ferric sulfate volumetric method and H2O2 coordination titration method
DAPM photometric method has high accuracy and eliminates the interference of vanadium molyb-
denum tungsten copper arsenic and other elements to the experiment Compared to ICP-AES method
DAPM photometric method is simple in operation and suitable for popularization and application The
results of the project provided a technical method for accurately and quickly determining the content of
TiO2 in limestone
27
REFERENCES
Bo H Xiaomei W amp Tao Y 2015 The development and application of X-Ray fluorescence
spectrometer Nuclear Electronics amp Detection Technology 1307-1311
Chen C 2005 Determinition of TiO2 in mine with diantipyrylmethane spectrophotometry Tian jing
Metallurgy 43(4) 9-10
Chen Z 2009 Research and Fabrication of Opto-mechanical Systems of New UV Spectrophotometer
Chu N Li W amp Jiang X 2014 Determination of major and minor compoments in limestone by
wavelength dispersive X-ray fluorescence spectrometry with fusion sample preparation Metallurgical
analysis 34(10) 37-41
Chu Y 1983 Development of X-ray fluorescence spectrometer DOI 10 13595 j cnki issn1000 -
0720 1983 0062
Deng J 2016 Determination of Titanium Dioxide in Titanium Slag by Diantipyrylmethane
Spectrophotometry Physico-ChemistryampChemical-Chemistry 52(1) 37-40
Deng J 2020 Determination of Titanium in Titanium Ferroalloy by Spectrophotometry with
Diantipyrylmethane Angang technology 2(1) 36-39
Du M 2017 Simultaneous determination of Fe Al Ca Mg K Na Ti in limestone by inductively
coupled plasma atomic emission spectrometry with microwave digestion Metallurgical Analysis
26(4) 30
Jin L Meng H amp Yinglin D 2008 Determining titanium dioxide in ores by ICP-AES Jilin
geology 27(1) 83-85
Khavar A amp Asadollahzadeh H 2020 Preconcentration and determination of nickel (Ⅱ)and
copper(Ⅱ) ions Elsevier Inc DOI101016jjfca2020103457
Li C 2006 Determination of SiO2 Cao MgO Al2O3 Fe2O3 and P2O5 in limestone and dolomite by
XRF melting method Shandong Metallurgy 28(6) 10-14
Li H 2005 Diantipyric methane spectrophotometric determination of titanium in magnesium
chloride Journal of environmental management college of China 15(3) 113-114
Liu X Zhong Y amp Song H 2011 Synthesis of Diantipyrylmethane aromatic ring derivatives and
its application in photometric analysis Jiangxi Nonferrous Metals 15 30-35
Mohamed E amp Hassan A 2015 Characterization of visiblelight activated TiO2 catalysts and their
photocatalytic performance study Huazhong Agricultural University 4-16
Pan X 2015 Development Trend of Ultraviolet Spectrophotometer Science and Technology amp
Innovation(14) 19-21
Peng X 2012 Study on spectrum analytical system of visible spectrometer Tianjin University 3-12
28
Shao H 2001 Determination of chloride ion in copper electrolyte by potentiometric titration
metallurgical analysis 21(4) 64-65
Song X 2006 Determination of titanium dioxide in vanadic titanomagnetite by hydrogen peroxide
Spectrophotometry Metallurgical Analysis 26(3)
Sunil R amp Kalpana C 2011 Synthesis of diarypyrimidinones (DAPMs) using large porezeolites
Journal of molecular catalysis 210-215
Wang R Yan W amp Zhu X 2013 Methods for chemical analysis of limestone quicklime and
hydrated lime for building materials Cement(4) 49-50
Wang H 2010 Discussion on the principle and maintenance of ICP- AES Electronic product
reliability and environmental testing 28(4) 60-63
Xu C Wang Q Xu W Dai M amp Qi 2020 Trouble shooting of inductively coupled plasma
atomic emission spectrometer Metallurgical analysis 40 66-71
Xu C Wang Q amp Xu W 2020 Fault analysis and treatment of inductively coupled plasma atomic
emission spectrometer Metallurgical analysis 40(2) 66-71
Yang Z 2008 Simultaneous quantification measurement of SiFeTiCaMgZr in corundum by
inductively coupled plasma-atomic emission spectrometry with secondary-melting method Rock
and mineral analysis 31(2)
Zhang J 2019 Discussion on the determination of TiO2 by Diantipyrylmethane Spectrophotometry
Chemical enterprise management(1) 45-46
Zhi P 1999 Development and application of biochemical instruments Telecommunication
Engineering 6(2)
Zhang Q 2009 Determination of Al2O3 CaO Fe2O3 MgO MnO SiO2TiO2 in Limestone and
Dolomite by ICP-AES Analysis and testing technology and instruments 15(3) 179-181
CONCEPT DEFINITIONS
List of abbreviations
Al2O3 Aluminum oxide
CaCO3 Calcium carbonate
CaO Calcium oxide
DAPM Diantipyryl methane
EDTA Ethylene Diamine Tetraacetic Acid
Fe2O3 Iron oxide
Fe2+ Ferrous iron
HClO4 Perchloric acid
HNO3 Nitric acid
H2O2 Hydrogen peroxide
H2SO4 Sulfuric acid
H3PO4 Phosphoric acid
HF Hydrofluoric acid
ICP-AES Inductively Coupled Plasma-Atomic Emission Spectroscopy
MgO Magnesium oxide
SiO2 Silicon dioxide
TiO2 Titanium dioxide
TiO2+ Titanium oxide ion
Ti3+ Titanium ion
UV-vis Ultraviolet visible
XRF X-ray fluorescence
ABSTRACT
CONCEPT DEFINITIONS
CONTENTS
1 INTRODUCTION 1
2 DETERMINATION OF TITANIUM DIOXIDE IN INDUSTRIAL RAW MATERIALS 3
21 Spectrophotometer 3
22 Diantipyryl methane spectrophotometry 6
23 Inductively coupled plasma atomic emission spectrometry 7
24 Titration analysis 9
25 X-ray fluorescence spectrometry 10
26 Hydrogen peroxide photometry and ferrotitanium spectrophotometry 13
3 EXPERIMENT 14
31 Reagents and reagents preparation 14
32 Experimental procedure 15
33 Procedure of sample decomposition 15
34 Procedure of color rendering 16
35 Procedure of the absorbance measuring 19
36 Interference test of calcium and magnesium ions 20
4 RESULTS AND DISCUSSIONS 22
41 Measurement results of titanium dioxide content 23
42 Accuracy of results discussion 24
5 CONCLUSION 26
REFERENCES 27
APPENDICES
FIGURES
FIGURE 1 The structure of ultraviolet spectrophotometerhelliphelliphelliphelliphelliphelliphelliphelliphelliphelliphelliphelliphelliphelliphelliphelliphellip5
FIGURE 2 The molecular structure of Diantipyrylmethane6
FIGURE 3 Absorbance values at different wavelengths7
FIGURE 4 Wavelength dispersive spectrometer and energy dispersive spectrometer helliphelliphelliphelliphelliphelliphelliphelliphelliphelliphellip12
FIGURE 5 The experimental procedure of measuring titanium dioxide content in limestone by dianti-
pyryl methane photometry 15
TABLES
TABLE 1 Effect of acidity in hydrochloric acid medium on color reaction18
TABLE 2 The absorbance values of different ascorbic acid dosages18
TABLE 3 The dosage of DAPM experiment19
TABLE 4 Optimal wavelength test datahelliphelliphelliphelliphelliphelliphelliphelliphelliphelliphelliphelliphelliphelliphelliphelliphelliphelliphelliphelliphelliphelliphelliphelliphelliphelliphellip20
TABLE 5 The interference experiment results of calcium and magnesium21
TABLE 6 Experimental measurement data24
TABLE 7 Average value of samples24
1
1 INTRODUCTION
Calcium carbonate (CaCO3) is the main component of limestone which is the main raw material for
glass production In addition to the main component CaCO3 in limestone limestone also contains a small
amount of silicon dioxide (SiO2) aluminum oxide (Al2O3) iron oxide (Fe2O3) magnesium oxide (MgO)
and titanium dioxide (TiO2) Lime and limestone are widely used as building materials and important
raw materials for many industries CaCO3 can be directly processed into stone stock and burnt into
quicklime Lime has quicklime and hydrated lime The main component of quicklime is calcium oxide
(CaO) which is generally lumpy pure white light gray or light yellow when containing impurities In
the chemical industry limestone is mainly used to fabricate alkali calcium carbide CaCO3 potassium
carbonate nitrogen fertilizer phosphate fertilizer and other raw materials Limestone is used as agent of
fusion in ironmaking to remove gangue (Qingling 2009 179-180) Quicklime is used as slagging mate-
rial in steelmaking to remove harmful impurities such as sulfur and phosphorus Titanium is one of the
important alloy elements In addition to its strong deoxidizing ability it can also denature non-metallic
inclusions in steel thus improving the mechanical properties of steel Therefore adding proper amount
of titanium into steel has an important influence on the quality of steel and the formation of nonmetallic
inclusions The determination of TiO2 content in limestone is of great significance to the improvement
of steel quality and the control of non-metallic inclusions in steelmaking and ironmaking (Junhua 2016
37)
There are many methods of measuring TiO2 and there are several determination methods titration anal-
ysis (ammonium ferric sulfate volumetric method hydrogen peroxide (H2O2) coordination-bismuth salt
solution titration method) spectrophotometry H2O2 photometric method ferro-titanium reagent photom-
etry) large-scale instrumental analysis (inductively coupled plasma-atomic emission spectrometry (ICP-
AES) and X-ray fluorescence (XRF) spectrometry) For the determination of TiO2 content in the sample
by titration analysis This method has poor sensitivity and selectivity In chemical analysis the sensitiv-
ity is expressed by the molar absorption coefficient ε It refers to the absorption capacity of matter to
light of a certain wavelength The value of ε reflects the degree of light absorption of the absorption
medium For the medium with selective absorption in the visible light area it indicates the sensitivity of
a certain color reaction For the same measured element the greater the value of ε the more sensitive
the color reaction is For the same color reaction the value of ε is related to the measured concentration
The higher the molar absorption coefficient the higher the sensitivity Selectivity refers to the ability to
avoid interference of other coexisting components in the sample when a certain analytical method is
used to determine a certain component Other elements such as vanadium tin molybdenum tungsten
2
copper and arsenic can interfere experimental determination Together with titanium oxide ion (TiO2+)
these elements are completely or partially reduced to a low valence state and oxidized leading to high
experimental results Although the titration analysis method does not have high requirements for instru-
ments and equipment the accuracy of the measurement results is poor and the scope of use is narrow
In H2O2 photometry the experimental operation is simple and fast but the stability of hydrogen is poor
For the determination of TiO2 samples by ICP-AES the ICP-AES was used to determine the content of
TiO2 in the experiment The method is fast accurate highly sensitive and has good reproducibility and
stability But the instrument is expensive and this method is difficult to widely promote and apply (Juan
2019 46)
Using diantipyryl methane (DAPM) photometry method for determining TiO2 is easy to operate and it
has high sensitivity good reproducibility and stability This thesis introduces the method of determining
the content of TiO2 in limestone sample A (mass fraction of TiO2 content is 0041 ) sample B (mass
fraction of TiO2 content is 0074 ) and sample C (mass fraction of TiO2 content is 0130 ) by using
DAPM photometry In the end influence of different factors for the determination of TiO2 such as
dosage of ascorbic acid dosage of DAPM spectrophotometry chromogenic reagent influence of acid
concentration and elimination method will be discussed
3
2 DETERMINATION OF TITANIUM DIOXIDE IN INDUSTRIAL RAW MATERIALS
For the determination of TiO2 in alloys ores or other industrial raw materials there are several detection
methods in the world such as titration detection method XRF detection method ICP-AES detection
method and DAPM spectrophotometry In the experimental for the determination of TiO2 by ammonium
ferrate volumetric method the experiment needs to be carried out in hydrochloric acid (HCl) or sulfuric
acid medium (H2SO4) TiO2+ is reduced to titanium ion (Ti3+) by metal aluminum sheet Potassium thi-
ocyanate is used as indicator and titrated with standard solution of ammonium ferrate sulfate Vanadium
tin molybdenum tungsten copper arsenic and other elements will interfere with the experimental re-
sults These elements will be fully or partially reduced to a low valence state together with TiO2+ and
then oxidized by high iron to produce high results (Juan 2019 45)
In the determination of TiO2 by H2O2 coordination-bismuth salt solution back titration method Firstly
adding appropriate amount of H2O2 to the solution which containing TiO2+ will form a yellow complex
And then adding excessive Ethylene Diamine Tetraacetic Acid (EDTA) to make it a more stable ternary
complex The remaining EDTA was titrated with bismuth salt solution to xylenol orange as indicator
This method is often used for samples of high titanium content Although titrimetric analysis has low
requirements for instruments and equipment its accuracy is poor and its application range is narrow In
the experiment of TiO2 sample determination by ICP-AES the inductively coupled plasma-atomic emis-
sion spectrometer was used to determine the content of TiO2 This method is fast accurate highly sen-
sitive and has good stability but the large instruments used are expensive This method is difficult to
widely promote and apply The advantages of DAPM photometry are as follows it avoids tedious ex-
perimental steps it can be used as a very practical analysis method in scientific research detection and
it can be widely used in the determination of TiO2 in steel alloys and mineral raw materials Compared
with other detection methods the DAPM spectrophotometry is more simple the detection speed is faster
and the repeatability of the experimental is good (Juan 2019 45)
21 Spectrophotometer
A spectrophotometer is a scientific instrument that breaks light with complex composition into spectral
lines The measurement range generally includes the visible light region with a wavelength range of 380-
780 nm and the ultraviolet light region with a wavelength range of 200-380 nm Different light sources
have their own unique emission spectrum so different luminous bodies can be used as the light source
4
of the instrument The emission spectrum of tungsten lamp is formed in this way After refracting the
spectrum light of 380-780 nm wavelength emitted by tungsten lamp light source through a prism a
continuous color spectrum composed of red orange yellow green blue indigo and violet can be ob-
tained The color spectrum can be used as the light source of the visible light spectrophotometer
(Xiaohua 2012 6)
Ultraviolet spectrophotometer is based on the absorption spectrum of substances to study the composi-
tion structure and interaction of substances The ultraviolet spectrophotometer can arbitrarily choose
different wavelengths of light in the ultraviolet visible region The absorption spectrum of a substance
is that the molecules and atoms in the substance absorb the light energy of certain specific wavelengths
in the incident light The molecular vibrational energy level transition and the electronic energy level
transition occur accordingly All kinds of substances have their own different molecules atoms and
different molecular space structures Their absorption of light energy is different Therefore each sub-
stance has its own unique and fixed absorption spectrum curve The absorbance at certain characteristic
wavelengths on the spectrum can be used to distinguish or determine the content of the substance Ul-
traviolet spectrophotometry is based on Lambert-Beer law According to Lambert-Beer law A = εbc
(A is the absorbance ε is the molar absorption coefficient b is the thickness of the liquid cell and c is
the concentration of the solution) This law can be used to analyze the solution quantitatively (Mohamed
amp Hassan 2015 4)
There are many types of ultraviolet visible (UV-vis) spectrophotometers but their basic structures are
similar The UV-vis spectrophotometers are composed of five parts light source monochromator ab-
sorption cell detector and signal display system The structure of the ultraviolet spectrophotometer is
shown in FIGURE 1 The light source is a device to provide the incident light that meets the requirements
The common light source in the visible light area of the UV-vis spectrophotometer is tungsten lamp and
the common light source in the UV-vis light area is hydrogen lamp or deuterium lamp Tungsten lamp
is the most commonly used visible light source It can emit a continuous spectrum of 325-2500 nm and
the most suitable wavelength range is 320-1000 nm Therefore it can also be used as near-infrared light
source Deuterium lamp is the most commonly used ultraviolet light source It emits light with a wave-
length range of 190-400 nm and the wavelength range is generally 190-360 nm The second part of the
UV-vis spectrophotometer is monochromator which decomposes the continuous spectrum of the light
source into monochromatic light and can accurately and conveniently select the optical device of a cer-
tain wavelength needed It is the heart of the photometer Monochromator is mainly composed of slit
dispersion element and lens system The dispersion element is the main part of monochromator The
5
most commonly used dispersion elements are prism grating or a combination of the two The dispersive
element is shown in the FIGURE 1 It is a combination of prism and grating (Xiaojing 2015 19-20)
The absorption tank is a vessel used to hold the liquid to be measured and determine the thickness of the
transparent liquid layer of the solution to be measured also known as a cuvette Generally speaking the
absorption tank is a cuboid which also has a circle or other shapes The absorption tank in FIGURE 1
is a cuboid The bottom and both sides of the absorption tank are ground glass and the other two sides
are optical light transmitting surfaces According to the material of the light transmitting surface the
absorption tank can be divided into two types glass absorption tank and quartz absorption tank The
glass absorption cell is used for the determination of visible light area and the quartz absorption cell is
used for the determination of ultraviolet light area The specification of absorption tank is marked by
optical path The commonly used specifications of absorption cell are 05 cm 10 cm 20 cm 30 cm
50 cm The detector is a device that converts an optical signal into an electrical signal When measuring
the absorbance it is not to directly measure the light intensity through the absorption cell but to convert
the light intensity into a current for measurement This photoelectric converter is called a detector Signal
display is a device to amplify and display the output signal of detector The new spectrophotometer is
displayed by digital voltmeter and the absorbance curve is drawn directly by recorder The new spec-
trophotometer is equipped with computer data processor (Xiaojing 2015 19-20)
FIGURE 1 The structure of ultraviolet spectrophotometer (adapted from Xiaojing 2015 19)
6
22 Diantipyryl methane spectrophotometry
DAPM is white flake crystals It is insoluble in water ether and alkali But it is soluble in acid ethanol
and chloroform DAPM is soluble in acids and forms complex organic cations with acids The solution
of DAPM is colorless and it reacts with Ti3+ to form yellow complexes DAPM can be used as a sensitive
color reagent for the determination of Ti3+ iridium iron molybdenum neodymium uranium iridium
platinum rhenium It can also be used as an extractant for various ions The molecular formula of DAPM
is C23H24N4O2H2O The molecular structure of DAPM is shown in FIGURE 2
FIGURE 2 The molecular structure of DAPM (adapted from Liu Zhou amp Song 2011 31)
The UV-vis absorption spectrum of molecules is a common spectral analysis method based on the ab-
sorption spectrum generated by the intramolecular electronic transition When a material is irradiated by
light the material molecules will collide with the light As a result the energy of photons is transferred
to the molecules In this way the stable ground state molecules will jump to the unstable high energy
state This is the absorption of the light The qualitative analysis of UV-Vis absorption spectrum is based
on the fact that the shape of absorption curve of light to the same absorption material is different the
maximum absorption wavelength is the same but the corresponding absorption rate is different There
are three properties of UV-vis absorption spectrum the first is that the same concentration of the test
solution has different absorbance for different wavelengths of light The second point is that the higher
the concentration of the same test solution the higher the absorbance Finally the smaller the concen-
tration of the same substance the same wavelength (maximum absorption wavelength λ max) corre-
sponding to the maximum absorption peak and the same curve shape The absorbance tested results of
yellow complex formed by titanium and DAPM by DAPM spectrophotometry are shown in FIGURE 3
The shape of the absorption curve can be seen from FIGURE 3 The abscissa in the chart is the wave-
length the unit of wavelength is nm The ordinate is the absorbance and the unit of absorbance is
L(g middot cm) The absorbance reaches the maximum value at the wavelength of 390 nm In the vicinity of
7
the maximum wavelength the closer to the maximum range of the spectrophotometer the greater the
sample absorbance and the smaller the error brought by the photometer itself (Junhua 2020 38)
FIGURE 3Absorbance values at different wavelengths (adapted from Junhua 2020 38)
After consulting the literatures on the determination of TiO2 by DAPM Spectrophotometry It can be
founded that the measurement method is essentially similar The specific method is as follows Firstly
the sample needs to be decomposed the sample is placed in a platinum crucible and mixed flux (lime-
stone samples with accurate TiO2 content) is added to mix with the sample Heat the crucible at high
temperature (950-1000 ) take it out and cool it then add acid to dissolve the sample After that transfer
the solution to a volumetric flask to constant volume and blend well After transferring the solution add
ascorbic acid HCl DAPM solution put it into the spectrophotometer to measure the absorbance Finally
record the data and calculate the result (Junhua 2016 39)
23 Inductively coupled plasma atomic emission spectrometry
ICP-AES has the advantages of high accuracy and precision low detection limit fast determination
wide linear range and simultaneous determination of multiple elements It has been widely used in de-
termination of dozens of elements in environmental samples and samples of rocks minerals metals
Plasma is ionized gas with an ionization degree exceeding 01 This gas contains not only neutral
atoms and molecules but also a large number of ions and electrons (Haiyan 2010 62)
8
ICP-AES is based on the spectrum emitted by atoms to determine the chemical composition of a sub-
stance Different substances are composed of atoms of different elements and the atoms all contain a
densely structured nucleus The nucleus is surrounded by moving electrons Each electron is at a certain
energy level and has a certain energy Atoms are in a stable state under normal circumstances This state
is called the ground state When the atoms are transformed into gaseous atoms under the action of exter-
nal energy the outer electrons of the gaseous atoms are excited to a high energy state When transitioning
from a higher energy level to a lower energy level the atoms will release excess energy and emit char-
acteristic lines ICP-AES disperse the generated radiation through the instrument and record it on the
photosensitive plate in the order of wavelength which can show regular spectral lines The perform
quantitative analysis based on the obtained spectrum ICP-AES is a new type of light source that is
developing rapidly and is highly valued in the analysis of emission spectrum (Haiyan 2010 62)
ICP-AES consists of sample introduction system ICP light source dispersion system and detection sys-
tem And equipped with computer control and data processing system cooling system gas control sys-
tem ICP light source consists of high frequency power supply and ICP torch tube The ICP torch tube
consists of three concentric quartz tubes and a high-frequency induction ring (generally 2-4 rings of
hollow copper tubes) surrounded by the upper part of the tube There are three intake tubes A 10-20
Lmin argon gas is passed between the quartz outer tube and the intermediate tube Its function is to form
plasma as working gas and cool the quartz torch tube which is called plasma gas or cooling gas The
intermediate tube and the central tube are filled with 05-15 Lmin argon to become auxiliary gas which
is used to assist the formation of plasma After the plasma torch is formed it can be turned off The
carrier gas in the central tube is used to introduce the sample aerosol (Xu Wang amp Xu 2020 67)
The formation of ICP torch is called ignition The ignition is divided into three steps the first step is to
introduce plasma and auxiliary gas into the outer tube and the middle tube At present the central tube
is not connected with gas and an argon atmosphere is established in the torch tube The second step is
to connect the high-frequency power supply to the induction coil The general frequency is 7-50 mhz
and the power supply is 1-15 kw At present there is high-frequency current and high-frequency elec-
tromagnetic field generated by the coil The third step is to ionize the working gas flowing in the middle
by means of high frequency spark and then the ions and electrons produced will interact with the fluc-
tuating magnetic field produced by the induction coil This interaction causes the ions and electrons in
the coil to flow along the closed loop in the figure Their resistance to this movement causes ohmic
9
heating Because of the high temperature generated by the strong current the gas is heated to form a
torch like plasma (Xu et al 2020 67)
Aerosol injection system is a commonly used method at present The sample introduction system con-
sists of two main parts sample lifting part and atomization part The sample lifting part is generally a
peristaltic pump and a self-lifting atomizer can also be used It is required that the speed of the peristaltic
pump is stable and the elasticity of the pump pipe is good so that the sample solution can be pumped in
at a constant speed and the waste liquid can be discharged smoothly The atomizing part includes atom-
izer and atomizing chamber After the sample enters the atomizer by means of pump or self-lifting small
droplets are formed under the action of carrier gas and enter the atomization chamber The large droplets
are eliminated when they touch the wall of the atomization chamber Only small droplets can enter the
plasma source (Xu et al 2020 68) For the optical system the monochromator of ICP-AES usually
adopts the combination of grating or prism and grating And for the detection system the detection
system of ICP-AES is a photoelectric converter which uses photoelectric effect to convert the radiation
energy of different wavelengths into electrical signals (Xu et al 2020 68)
As a conventional chemical analysis technology ICP-AES has a wide range of applications in biological
samples materials geology environmental protection metallurgy and other fields In the field of met-
allurgical analysis such as steel raw materials and ferroalloys it is required to measure dozens to hun-
dreds of samples at a time And each sample must simultaneously analyze dozens of elements such as
Mn Cu Al Cr Si P Ni Ti V Nb W Ca Mg It can show the absolute advantages of ICP in terms of
work efficiency In the analysis of standard materials especially the low-value fixed-value analysis of
rare earth elements the accuracy of ICP data and the simplicity of operation are fully utilized (Haiyan
2010 62) The disadvantage of the ICP-AES method is that the equipment and operating costs are rela-
tively high The sample generally needs to be converted into a solution in advance and the determination
of some elements is not obvious such as sodium (Na) and potassium (K) (Juan 2019 46)
24 Titration analysis
There are generally two types of titration analysis to determine the content of TiO2 in the sample Am-
monium ferric sulfate volumetric method and H2O2 coordination titration The specific steps of ammo-
nium ferrate sulfate volumetric method are as follows firstly reduction of TiO2+ to Ti3+ with metal
10
aluminum tablets in HCl or H2SO4 medium And then using potassium thiocyanate as an indicator Fi-
nally titration with standard solution to ammonium ferrate sulfate The method has poor sensitivity and
selectivity But there are interference elements such as vanadium tin molybdenum tungsten copper
and arsenic that affect the experimental results These elements and TiO2 are completely or partially
reduced to a low valence state and these elements are oxidized by ferric ions (Fe3+) Leading to errors
in the experimental results (Juan 2019 46)
The specific steps of H2O2 coordination titration are as follows firstly the yellow complex will be form
by adding an appropriate amount of H2O2 to a solution which containing TiO2+Then add excess EDTA
to the solution (EDTA is a good complexing agent in chemistry It has six coordination atoms The
complex formed is called chelate EDTA is often used in coordination titration to determine the content
of metal ions In biological application it is used to exclude most transition metal elements For example
it is used to exclude the interference of iron ion nickel ion and manganese ion in the experiment) Make
it form a more stable ternary complex The remaining EDTA was titrated with xylenol orange as indica-
tor For the back titration with bismuth salt solution method when the reaction is slow or the reactant is
solid add a certain amount of titration solution Normally the reaction cannot be completed immediately
At this time a certain amount of excess titrating solution can be added first to accelerate the reaction
After the reaction is completed titrating the remaining titrant with another standard solution This
method is mostly used for samples with high titanium content Although the titration analysis method
does not have high requirements for instruments and equipment but the accuracy of the measurement
results is poor and the scope of use is narrow (Juan 2019 46)
25 X-ray fluorescence spectrometry
People usually irradiate X-rays on substances to produce secondary X-rays called XRF The X-rays used
for irradiation are called primary X-rays XRF is still X-ray XRF spectrometer is mainly composed of
excitation dispersion detection recording and data unit The role of the excitation unit is to generate
primary X-rays It consists of high-voltage generator and X-ray tube The role of the dispersion unit is
to separate X-rays of the desired wavelength It consists of sample chamber slit goniometer analysis
crystal and other parts The role of the detector is to convert X-ray photon energy into electrical energy
The recording unit is composed of an amplifier a pulse amplitude analyzer and a display part X-ray
tube generates incident X-rays to excite the tested sample Each element in the excited sample emits
11
secondary X-rays and the secondary X-rays emitted by different elements have specific energy charac-
teristics or wavelength characteristics The detection system measures the energy and quantity of these
emitted secondary X-rays The instrument software converts the information collected by the detection
system into the types and contents of various elements in the sample By using the principle of X-ray
fluorescence every element after beryllium in the periodic table can be measured theoretically In prac-
tical applications the effective element measurement range is element 9 (F) to element 92 (U) in the
periodic table (Chu Li amp Jiang 2014 40)
The characteristic X-ray energy and wavelength emitted by different elements are different Therefore
no matter what kind of element can be detected by measuring the energy or wavelength of X-ray At the
same time the characteristic X-ray intensity of an element emitted after the sample is excited It is related
to the content of this element in the sample so the quantitative analysis of the element can be performed
by measuring its intensity There are two basic types of XRF spectrometers wavelength dispersive spec-
trometer and energy dispersive spectrometer The structure of the instrument is shown in FIGURE 4
12
FIGURE 4 Wavelength dispersive spectrometer and energy dispersive spectrometer (adapted from Bo
Xiao amp Tao 2015 1308)
With the development of instrument technology and theoretical methods the application range of XRF
analysis is very widely In the analysis of the composition of substances in the metallurgy geology
chemical industry machinery petroleum building materials and other industrial sectors agriculture and
medicine and health as well as physics chemistry biology geoscience environment astronomy and
archaeology and other research departments have been widely applications (Chu et al 2014 37)
13
26 Hydrogen peroxide photometry and ferrotitanium spectrophotometry
H2O2 is a colorless odorless liquid with bitter taste and easy to decompose into water and oxygen It is
a strong oxidant H2O2 is often used for sterilization in the workplace starch whitening in the industry
or as a strong oxidant for food or food packaging and liquid fuel propellant In this method phosphoric
acid (H3PO4) and H2SO4 were used to dissolve the sample In the medium of 5 H2SO4 by volume
TiO2+ and H2O2 formed a yellow complex ion in the acidic condition The stable equilibrium constant
of the complex is k = 10 times 104 and the maximum absorption wavelength is λmax = 405 nm H2O2
spectrophotometry is simple and rapid but its sensitivity and selectivity are poor Sodium catechol-35
sulfonate forms a yellow complex with titanium at pH = 47-49 Ferrotitanium reagent has high sensi-
tivity and can be used for the continuous determination of trace titanium and iron (Xinyan 2006 66)
14
3 EXPERIMENT
There are three main experimental steps sample decomposition color rendering and absorbance exper-
iment which are studied and developed extensively in this project The detail procedures of both topics
will be fully displayed Besides some important choices of chemical reagents during the experiment
will be explained by five variable value optimization experiments optimal selection of the spectropho-
tometerrsquos wavelength the optimal dosage of acidity the optimal dosage of DAPM the optimal dosage
of ascorbic acid and the interference factors analysis experimental
31 Reagents and reagents preparation
The reagents used in the experiment are as follows mixed flux grind from anhydrous sodium sulfate
and boric acid potassium pyrosulfate HCl with a density of 119 gmL H2SO4 with a density of 184
gmL HCl (1+1) ((1+1) is the solution which mix 1 ratio of HCl with 1 ratio of water in volume The
molar concentration of HCl (1+1) is 6 molL) H2SO4 (5+95) ((5+95) is the solution which mix 5 ratio
of H2SO4 with 95 ratio of water in volume The molar concentration of H2SO4 (5+95) is 09 molL)
ascorbic acid solution (20 gL) DAPM solution (50 gL) TiO2 stock solution (100 μgmL) and TiO2
standard solution (10 μgmL)
The preparation steps for ascorbic acid solution (20 gL) are as follows weigh 20g of ascorbic acid add
200-300 mL of water to dissolve the sample and stir evenly After the ascorbic acid is completely dis-
solved transfer the solution to a 1 L volumetric flask and make up to volume The preparation steps of
the TiO2 stock solution (100 μgmL) are as follows weigh 01 g of TiO2 and place it in a platinum
crucible and then add 5-7 g of potassium pyrosulfate Put them into a high-temperature furnace raise
the temperature to 600 deg C to melt Use 60 mL H2SO4 to dissolve the melt After it cooling to room
temperature transfer it to a 1000 mL volumetric flask diluted with H2SO4 to the mark and mixed fully
The preparation of the TiO2 standard solution (10 μgmL) are as follows add 50mL of TiO2 stock solu-
tion to a 500 mL volumetric flask And then add H2SO4 to constant volume and mix it well
Three instruments are used in this experiment platinum crucible (The volume needs to be greater than
30 mL) high temperature furnace (The crucible heating temperature is suitable for 100-1100 ) and
UV-vis spectrophotometer (1000 nm ge wavelength ge 180 nm) Before using the spectrophotometer
15
connect the spectrophotometer to the power supply turn on the instrument switch lift the lid of the
sample chamber and preheat the sample chamber for 10 minutes
32 Experimental procedure
Before the experiment the preparation of reagents and the commissioning of equipment need to be com-
pleted The preparatory work includes preparation of ascorbic acid solution (20 gL) preparation of
DAPM solution (50 gL) preparation of TiO2 stock solution (100 μgmL) and preparation of TiO2 stand-
ard solution (10 μgmL) After the reagent preparation is completed proceed to the second step as shown
in FIGURE 5 Dissolve the sample after weighing it Thirdly render the color of the sample solution
The fourth step is measure the absorbance of the developed solution by spectrophotometer And finally
record and process the experimental data
FIGURE 5 The experimental procedure of measuring titanium dioxide content in limestone by dianti-
pyryl methane photometry
33 Procedure of sample decomposition
In this experiment the samples selected three limestones with known accurate TiO2 content The TiO2
content (mass fraction) of sample A is 0041 the TiO2 content (mass fraction) of sample B is 0074
and the TiO2 content (mass fraction) of sample C is 013 The purpose of these accurate data is to
make a precision comparison with the data measured in this experiment and verify the accuracy of the
experimental method A total of three sets of experiments were conducted and each set was measured 6
times
The sample decomposition steps are as follows take 02 g limestone (crumb limestone) sample into a
platinum crucible add 5 g mixed flux (anhydrous sodium carbonate and boric acid) Secondly place the
platinum crucible in a high-temperature furnace and gradually increase the temperature to 950-1000
Weighing of
samplesamp
reagents
preparation
Sample
decomposition
Color
rendering
Absorbance
experiment
Experimental
data recording
16
After the sample is melted take it out and cool it to room temperature Thirdly put the crucible in the
250 mL beaker together with the sample and add HCl into the beaker Finally heat the beaker at around
75 to make the solution transparently After cooling to room temperature dilute the solution to 100
mL with water (Wang Yan amp Zhu 2013 49) During the experiment HCl is used to dissolve the sample
The choice of acid type needs to be determined through the phenomenon of sample dissolution in dif-
ferent acid systems Through experiments of dissolving samples in various acid systems the results can
be obtained the most suitable acid for dissolving limestone
For the optimal selection of the dosage and the type of acid to dissolve the sample the experimental
procedure is as follows select 025 g of limestone sample B with a TiO2 content of 0074 and place
it in 6 polytetrafluoroethylene beakers Add HCl (1+1) nitric acid (HNO3) (1+1) perchloric acid (HClO4)
(1+1) hydrofluoric acid (HF) (1+1) and H2SO4 (5+95) to dissolve the sample with different acid systems
composed of these acids Put 20 mL HCl into the first beaker By observing the solution in the beaker
the solution is cloudy with residue For the second beaker add HCl of the same volume as the first
beaker and 5 mL HNO3 The phenomenon of the solution is cloudy with residue For the third beaker
add HCl and HNO3 of the same volume as the second beaker and 10 mL HClO4 into the beaker By
observing the phenomenon of the reaction the solution is cloudy with residue For the fourth beaker put
20 mL HCl 10 mL HClO4 5 mL HF into the beaker The limestone sample is completely dissolved
And then put add HCl HNO3 and HClO4 of the same volume as the third beaker and 5 mL HF into the
fifth beaker the limestone sample is completely dissolved For the last beaker choose 20 mL HCl 10
mL HClO4 5 mL HF and 5 mL H2SO4 to dissolve the sample The solution is turbid
34 Procedure of color rendering
Whether the color rendering reaction can meet the requirements of the photometric method in addition
to mainly related to the nature of the chromogenic reagent it is also very important to control the con-
ditions of the color reaction The color rendering conditions mainly included the dosage of the chromo-
genic reagent and the acidity of the solution In order to make the color reaction as complete as possible
it is necessary to add an appropriate dosage of the chromogenic reagent If an excessive dosage of chro-
mogenic reagent is added it will cause side reactions which are not conducive to the measurement In
the experiment the appropriate dosage of the chromogenic reagent is obtained through related experi-
ments Most chromogenic reagents are organic weak acids The acidity of the solution affects the disso-
17
ciation of the chromogenic reagent and the completeness of the color rendering reaction Many chromo-
genic reagents are acid-base indicators The acidity of the solution will change the initial color of the
chromogenic reagent The acidity of the solution also has an effect on the composition and stability of
the colored complex
Three solutions need to be added in the color rendering experiment Firstly HCl needs to be added to
control the acidity of the solution Secondly ascorbic acid solution needs to be added to reduce Fe3+ to
ferrous iron (Fe2+) in the solution Because of the main interference element of this experiment is iron
So it is necessary to eliminate this interference by adding ascorbic acid solution Finally add DAPM for
color rendering reaction So before rendering colors the optimal dosage of these three solutions needs
to be found
The acidity of the solution affects the dissociation of the chromogenic reagent and the completeness of
the color rendering reaction Therefore maintaining the acidity of the solution is a prerequisite for start-
ing the color rendering experiment Determine the experiment steps of optimum dosage of HCl are as
follows take 10 mL of the test solution in 50 mL volumetric flask And then add 5 mL of ascorbic acid
solution and mix it well Place it for about 5 minutes Add 2 mL 4 mL 6 mL 8 mL 10 mL 12 mL 16
mL 20 mL HCl to 8 flasks respectively then add 7 mL of DAPM solution into each flask Dilute the
solution to the mark with water and mix it well Leave it for about half an hour at room temperature
Then put the chromogenic reagent into the spectrophotometer to measure the absorbance (detection
wavelength is 385 nm) It can be realized from TABLE 1 that the acidity in HCl medium has minimal
effect on the color rendering reaction During the analysis add 6 mL of 6 molL HCl to control the
normal concentration of about 113 N Normality (N) is defined as the number of equivalents per liter of
solution where definition of an equivalent depends on the reaction taking place in the solution For an
acid-base reaction the equivalent is the mass of acid or base that can furnish or accept exactly 1 mole of
proton (H+ ions) And this is based on the HCl concentration It can be seen from the absorbance value
in the last row of TABLE 1 that the acidity has little effect on the color rendering reaction in HCl medium
In the analysis process add 6 mL 6 molL HCl solution to control the normal concentration at 113 N
18
TABLE 1 Effect of acidity in HCl medium on color reaction
Flask1 Flask 2 Flask 3 Flask 4 Flask 5 Flask 6 Flask 7 Flask 8
HCl
(1+1) mL
2 4 6 8 10 12 16 20
Normal
concentration
(N)
065 089 113 137 161 185 233 290
Absorbance
L(gmiddotcm)
0185 0185 0185 0185 0185 0185 0185 0180
After determining the acidity of the solution the second problem to be determined is the optimal dosage
of ascorbic acid reagent Take several copies of 10 mL sample B solution with 0074 TiO2 content
add different amounts of ascorbic acid solution Then add 6 mL of HCl and 7 mL of DAPM for color
development and measure the absorbance by spectrophotometer (detection wavelength is 385 nm) The
absorbance values of different ascorbic acid dosages are shown in TABLE 2 The effect of adding
different volume of ascorbic acid on absorbance is shown in TABLE 2 The experimental results show
that when the dosage of ascorbic acid is between 3 mL and 15 mL the absorbance remains stable In
order to facilitate the operation and ensure complete reduction reaction we chose the dosage of ascorbic
acid to be 5 mL
TABLE 2 The absorbance values of different ascorbic acid dosages
Flask 1 Flask2 Flask3 Flask4 Flask5 Flask6
Ascorbic
acid (mL)
1 3 5 6 10 15
Absorbance
L(gmiddotcm)
0509 0514 0515 0515 0515 0515
After determining the dosage of the HCl and the ascorbic acid the third question is the optimal dosage
of DAPM Firstly take several copies of 5 mL sample B solution which content about 0074 of TiO2
and put the each solution into a 50 mL volumetric flask Secondly add 6 mL of HCl 5 mL of ascorbic
acid and different amounts of DAPM for color rendering reaction Finally measure the absorbance value
19
at 385 nm wavelength the experimental results are shown in the TABLE 3 From the experimental data
it can be seen that the absorbance of the DAPM chromogenic reagent is basically constant when it is
above 5 mL So the optimum dosage of the DAPM chromogenic reagent is 7 mL
TABLE 3 The dosage of DAPM experiment
Flask1 Flask2 Flask3 Flask4 Flask5 Flask6 Flask7 Flask8 Flask9
The dosage of
DAPM (mL)
2 3 4 5 6 7 8 9 10
Absorbance
L(gmiddotcm)
0226 0259 0282 0299 0231 0232 0232 0234 0233
Through the above three experiments (determine the optimal dosage of HCl ascorbic acid and DAPM)
the exact dosage of the three reagents in the color rendering experiment was determined The order and
steps of adding the three reagents are as follows firstly take 10 mL of TiO2 standard solution and put it
in a 50 mL volumetric flask Secondly add 5 mL of ascorbic acid solution mix it well Place the solution
for 5 minutes in the room temperature Then add 6 ml hydrochloric acid to mix the reagent evenly
Finally add 7 mL of DAPM into the solution Dilute the solution to the mark with water and mix it well
Leave it for 30 minutes in the room temperature and prepare to measure the absorbance
35 Procedure of the absorbance measuring
After the color rendering reaction is completed the test solution needs to be placed in a cuvette for
absorbance testing By changing the test wavelength the optimal wavelength is determined according
to the absorbance corresponding to each wavelength The absorbance at different wavelengths after color
development is shown in TABLE 4 It can be seen from the data that the wavelength has a maximum
value at 380-390 nm To ensure the best sensitivity the test wavelength is selected at 385 nm Under the
test of the maximum absorption wavelength the response of the instrument is more sensitive and the
measurement data is more accurate
20
TABLE 4 Optimal wavelength test data
Flask1 Flask2 Flask3 Flask1 Flask4 Flask5 Flask6 Flask7
Wavelength (nm) 360 370 380 385 390 400 410 420
Absorbance
L(gmiddotcm)
0499 0533 0547 0554 0543 0533 0502 0461
After determining the optimal wavelength use the spectrophotometer to analyze the content of TiO2 in
the sample firstly prepare the spectrophotometer and open the sample chamber cover Turn on the
power and the indicator lights up let the instrument warm up for 20 minutes Set the selector switch to
the T knob to display the number as 000 Secondly turn the wavelength knob to the 385 nm wave-
length and align the scale line Transfer the color rendering solution into a 3 cm cuvette and place it on
the colorimetric shelves And then close the sample chamber cover and adjust the light transmittance
100 T knob to make the number display as 1000 T Turn the selector switch to the A zero adjust-
ment knob the digital display should be 000 Then pull out the lever to put the solution to be measured
into the optical path and the digital display value is the absorbance A of the sample According to the
absorbance data it can be easily get the mass of TiO2 in the test solution After the measurement is
completed open the sample chamber cover and turn off the power switch
36 Interference test of calcium and magnesium ions
The main components of limestone are CaO and magnesium oxide (MgO) In order to determine whether
CaO or MgO has an effect on the determination of TiO2 Firstly prepare two standard solutions CaO
standard solution and MgO standard solution The content of CaO in the CaO standard solution is 10
mgL And the content of MgO in the MgO standard solution is 10 mgL Extract several parts from the
two prepared solutions and add a certain amount of TiO2 standard solution 4 mL (The amount of TiO2
added is 40 ug) to each part According to the method of 34 for color rendering the interference
experiment results of calcium ion and magnesium ion are as shown in TABLE 5 It can be seen from the
absorbance value in TABLE 5 that CaO and MgO have no effect on the determination of TiO2 There
was no difference in absorbance before and after adding CaO and MgO
21
TABLE 5 The interference experiment results of calcium ion and magnesium ion
Flask 1 Flask 2 Flask 3 Flask 4
The amount of TiO2 added 40 ug 40 ug 40 ug 40 ug
The amount of CaO added
(no MgO)
10 mg 20 mg 30 mg 40 mg
Absorbance L(gmiddotcm) 0551 0548 0550 0551
Flask 5 Flask 6 Flask 7 Flask 8
The amount of TiO2 added 40 ug 40 ug 40 ug 40 ug
The amount of MgO added
(no CaO )
10 mg 15 mg 20 mg 25 mg
Absorbance L(gmiddotcm) 0551 0550 0548 0551
22
4 RESULTS AND DISCUSSIONS
Through the acid system selection experiment the optimal selection of the spectrophotometerrsquos wave-
length experiment the optimal dosage of acidity selection experiment the optimal dosage of DAPM
selection experiment the optimal dosage of ascorbic acid selection experiment and the interference fac-
tors analysis experimental the accurate dosage of reagents was determined by these experiments Ac-
cording to the reaction phenomena or absorbance results of each experiment the corresponding experi-
mental results were obtained
In the acid system selection experiment the following conclusions can be drawn from the observation
of six experimental phenomena In the system of HF and HClO4 the sample is completely dissolved (the
precipitation is precipitated by adding H2SO4 the solution is turbid) but HClO4 and HF have a effect on
the determination of titanium and the fluoride ion is easy to complex with titanium And this
combination is likely to lead to the results on the low performance The presence of HClO4 can combine
with DAPM to produce white flocculent precipitate which led to the failure of the experiment In order
to eliminate the influence of insoluble residue to the analysis and ensure the sample is completely
dissolved The experiment uses the usual method which is anhydrous sodium carbonate and boric acid
system solvent mixed together for melting This method is simple and fast and the melting is complete
The acid system is relatively simple without introducing HClO4 acid HF acid and other kinds of acid
HCl is used to dissolve the sample and the sample dissolves quickly
In the optimal dosage of acidity selection experiment By observing the results of absorbance under
different acidity The best color acidity can be obtained add 6 mL of 6 molL HCl to control the color
acidity of solution In the optimal dosage of DAPM selection experiment through the absorbance test
results of solutions with different DAPM dosage It can be concluded from the data that the best dosage
of DAPM solution is 7 mL In the the optimal selection of the spectrophotometerrsquos wavelength
experiment according to the test results of absorbance of solution at different wavelengths it can be
concluded that the optimal wavelength is 385 nm In the optimal dosage of ascorbic acid selection
experiment through the absorbance test results of several solutions added with different volume of
ascorbic acid it can be concluded that the optimal dosage of ascorbic acid is 5 mL In the interference
factors analysis experimental it can be seen from the absorbance value in experiment results that CaO
and MgO have no effect on the determination of TiO2 By determining the accurate dosage of various
reagents a set of measurement steps with accurate actual dosage is formulated
23
41 Measurement results of titanium dioxide content
The content of TiO2 in three limestone samples was determined six times in parallel The analysis result
is rounded according to the rules of bankerrsquos rounding In order to avoid the phenomenon of big error
caused by rounding rules The specific method of data processing in this rule is as follows when the
mantissa is less than or equal to 4 the mantissa will be directly rounded off When the mantissa is greater
than or equal to 6 round off the mantissa and carry forward one digit When the mantissa is equal to 5
but the numbers after the mantissa are all 0 the previous digit of the mantissa should be used as a refer-
ence If the previous number is an odd number move one digit forward If the previous number is even
the mantissa is discarded If the mantissa is 5 but there is a number that is not 0 after the mantissa
whether the number before the mantissa is odd or even the number must move forward one bit
This experiment is carried out under the specified repeatability conditions the same experimental re-
searcher carries out the experiment uses the same instrument to carry out the experimental measurement
carries out the experiment under the same experimental conditions carries out the same calibration in a
short time TiO2 content is calculated according to the mass fraction WTiO2 calculation formula (1)
2
6
1
1
10100
TiO
mw
m V V
minus=
(1)
V1 The volume of the solution obtained separately from the sample solution The unit is milliliter (mL)
V Total volume of sample solution The unit is milliliter (mL)
m1 The quality of the titanium dioxide obtained separately from the sample solution The unit is mi-
crogram (μg)
m The quality of the sample The unit is gram (g)
The measurement results of the experiment are shown in the TABLE 6 The experimental data compared
with the TiO2 content in three limestone samples are shown in TABLE 7 For sample A the TiO2 content
obtained from the first and third experiments is basically consistent with the known accurate TiO2
content of sample A In addition to the second experimental data the accuracy of other experimental
data is good Compare with the other five groups of data the results of the second experiment have
relatively large errors For sample B the content of TiO2 obtained in the third experiment is almost the
same as the given value The TiO2 content measured in the fifth experiment is quite different from the
given value compared with the other five groups of data For sample C the TiO2 content obtained from
six experiments is almost the same as the given TiO2 content
24
TABLE 6 Experimental measurement data
Experiment
1
Experiment
2
Experiment
3
Experiment
4
Experiment
5
Experiment
6
Sample A
()
00412 00423 00409 00414 00416 00415
Sample B
()
00730 00750 00740 00765 00780 00735
Sample C
()
01250 01280 01290 01310 01240 01260
42 Accuracy of results discussion
From the average value of the data it can be seen that the accuracy of using the DAPM photometry to
determine the TiO2 content in limestone TABLE 7 is the average value of TiO2 content measured in six
experiments for each sample from TABLE 6 The second column is the certified value of the three
samples The mass fraction of TiO2 content in sample A is 0041 The mass fraction of TiO2 content
in sample B is 0074 The mass fraction of TiO2 content in sample C is 013 And the third column
is the average values which are obtained through experimental measurement and calculation As can be
seen from TABLE 7 The average value of TiO2 content in several groups of limestone samples meas-
ured by this experiment have high accuracy
TABLE 7 Average mass fraction of TiO2 content in limestone
Certified value Average value
Sample A () 0041 00414
Sample B () 0074 00750
Sample C () 0130 01272
HCl was used to dissolve the sample If HClO4 is used in the experiment it will form white flocculent
precipitate with DAPM which will affect the absorbance test If HF is used in the experiment fluorine
ions will complexate with titanium to form titanium fluoride complex which will affect the accuracy of
25
the experimental results If only HNO3 is used for decomposition except for incomplete decomposition
of the sample HNO3 also destroys DAPM thus affecting the continuation of the experiment According
to the dissolution treatment experiment and acidification experiment the HCl system is relatively simple
without the introduction of HClO4 HF and other types of acids And the sample dissolves quickly by
HCl leaching
In the experiment of determine the optimal dosage of DAPM solution it can be concluded that the
optimal dosage of DAPM is 7mL When the amount of DAPM is more than 6 mL the absorbance tends
to be stable If the flux of DAPM does not reach 6 mL the color reaction will be incomplete which will
affect the whole experiment For the selection of the amount of ascorbic acid ascorbic acid is used to
reduce Fe3+ in the solution to Fe2+ In order to eliminate the interference 5 mL ascorbic acid was selected
to reduce Fe3+ in the sample If the amount of ascorbic acid is less than 5 mL the remaining unreduced
Fe3+ will affect the accuracy of the whole experiment
In this experiment temperature and time have influence on the measurement results In 15-80 the
absorbance value is not affected by temperature However if the iron content in the sample is high and
the temperature is higher than 60 the solution is easy to be turbid and unable to compare colors
Therefore this experiment uses 15-30 room temperature to render color The color solution is very
stable and can be maintained for several months When the room temperature is higher than 20 it
tends to be stable after 20 minutes of color development When the room temperature is lower than 20
it needs 40-60 minutes to be stable In this color rendering experiment the accuracy of temperature
control is particularly important
When selecting the optimal wavelength of the test absorbance the wavelength corresponding to the
maximum absorbance is selected according to the absorption curve of the test solution In this experiment
when the wavelength is 385 nm the absorbance changes with the concentration in the largest range so
the determination is the most sensitive The absorption curve is an important basis for choosing the
wavelength of incident light in quantitative analysis In the wavelength selection experiment if the
wavelength corresponding to the maximum absorbance is not selected the accuracy of the experiment
will be insufficient
26
5 CONCLUSION
In this experiment the DAPM photometric method was used to determine the content of TiO2 The
sample is melted by sodium carbonate-boric acid mixed flux and leached with dilute HCl The experi-
ment used ascorbic acid as a masking agent to reduce Fe3+ to Fe2+ in the solution to eliminate interference
In this experiment DAPM solution was added to render the solution color In order to ensure the accu-
racy of the experimental results the amount of various reagents was optimized The following five as-
pects were quantitatively analyzed in the experiment optimal selection of the spectrophotometerrsquos
wavelength the optimal dosage of acidity the optimal dosage of DAPM the optimal dosage of ascorbic
acid and the interference factors analysis The exact dosage of each reagent was determined The TiO2
content measured in the experiment was compared with limestone with known accurate TiO2 content
The accuracy of the measurement can be seen in this experiment This experimental method has a perfect
effect on the use of spectrophotometers and promotes the determination of mineral raw materials con-
taining low TiO2 content by spectrophotometer
For the measurement results of the experiment there is a certain error between the TiO2 content meas-
ured in this experiment and the TiO2 content given in the limestone sample Through the interference
element analysis experiment it is determined that the two main components of limestone (MgO and
CaO) are not the cause of this error For several values with slightly poor accuracy there may be some
problems in the operation of the experiment The most likely reason for the poor accuracy of the data is
that after the sample dissolves the color reaction does not wait until the solution cools to room temper-
ature Another possibility is that the limestone sample is not well preserved resulting in a certain error
between the actual TiO2 value and the given value In the future experiments the above two error aspects
are further studied to ensure that the measurement method is accurate and the measurement results are
more accurate
Compared to ammonium ferric sulfate volumetric method and H2O2 coordination titration method
DAPM photometric method has high accuracy and eliminates the interference of vanadium molyb-
denum tungsten copper arsenic and other elements to the experiment Compared to ICP-AES method
DAPM photometric method is simple in operation and suitable for popularization and application The
results of the project provided a technical method for accurately and quickly determining the content of
TiO2 in limestone
27
REFERENCES
Bo H Xiaomei W amp Tao Y 2015 The development and application of X-Ray fluorescence
spectrometer Nuclear Electronics amp Detection Technology 1307-1311
Chen C 2005 Determinition of TiO2 in mine with diantipyrylmethane spectrophotometry Tian jing
Metallurgy 43(4) 9-10
Chen Z 2009 Research and Fabrication of Opto-mechanical Systems of New UV Spectrophotometer
Chu N Li W amp Jiang X 2014 Determination of major and minor compoments in limestone by
wavelength dispersive X-ray fluorescence spectrometry with fusion sample preparation Metallurgical
analysis 34(10) 37-41
Chu Y 1983 Development of X-ray fluorescence spectrometer DOI 10 13595 j cnki issn1000 -
0720 1983 0062
Deng J 2016 Determination of Titanium Dioxide in Titanium Slag by Diantipyrylmethane
Spectrophotometry Physico-ChemistryampChemical-Chemistry 52(1) 37-40
Deng J 2020 Determination of Titanium in Titanium Ferroalloy by Spectrophotometry with
Diantipyrylmethane Angang technology 2(1) 36-39
Du M 2017 Simultaneous determination of Fe Al Ca Mg K Na Ti in limestone by inductively
coupled plasma atomic emission spectrometry with microwave digestion Metallurgical Analysis
26(4) 30
Jin L Meng H amp Yinglin D 2008 Determining titanium dioxide in ores by ICP-AES Jilin
geology 27(1) 83-85
Khavar A amp Asadollahzadeh H 2020 Preconcentration and determination of nickel (Ⅱ)and
copper(Ⅱ) ions Elsevier Inc DOI101016jjfca2020103457
Li C 2006 Determination of SiO2 Cao MgO Al2O3 Fe2O3 and P2O5 in limestone and dolomite by
XRF melting method Shandong Metallurgy 28(6) 10-14
Li H 2005 Diantipyric methane spectrophotometric determination of titanium in magnesium
chloride Journal of environmental management college of China 15(3) 113-114
Liu X Zhong Y amp Song H 2011 Synthesis of Diantipyrylmethane aromatic ring derivatives and
its application in photometric analysis Jiangxi Nonferrous Metals 15 30-35
Mohamed E amp Hassan A 2015 Characterization of visiblelight activated TiO2 catalysts and their
photocatalytic performance study Huazhong Agricultural University 4-16
Pan X 2015 Development Trend of Ultraviolet Spectrophotometer Science and Technology amp
Innovation(14) 19-21
Peng X 2012 Study on spectrum analytical system of visible spectrometer Tianjin University 3-12
28
Shao H 2001 Determination of chloride ion in copper electrolyte by potentiometric titration
metallurgical analysis 21(4) 64-65
Song X 2006 Determination of titanium dioxide in vanadic titanomagnetite by hydrogen peroxide
Spectrophotometry Metallurgical Analysis 26(3)
Sunil R amp Kalpana C 2011 Synthesis of diarypyrimidinones (DAPMs) using large porezeolites
Journal of molecular catalysis 210-215
Wang R Yan W amp Zhu X 2013 Methods for chemical analysis of limestone quicklime and
hydrated lime for building materials Cement(4) 49-50
Wang H 2010 Discussion on the principle and maintenance of ICP- AES Electronic product
reliability and environmental testing 28(4) 60-63
Xu C Wang Q Xu W Dai M amp Qi 2020 Trouble shooting of inductively coupled plasma
atomic emission spectrometer Metallurgical analysis 40 66-71
Xu C Wang Q amp Xu W 2020 Fault analysis and treatment of inductively coupled plasma atomic
emission spectrometer Metallurgical analysis 40(2) 66-71
Yang Z 2008 Simultaneous quantification measurement of SiFeTiCaMgZr in corundum by
inductively coupled plasma-atomic emission spectrometry with secondary-melting method Rock
and mineral analysis 31(2)
Zhang J 2019 Discussion on the determination of TiO2 by Diantipyrylmethane Spectrophotometry
Chemical enterprise management(1) 45-46
Zhi P 1999 Development and application of biochemical instruments Telecommunication
Engineering 6(2)
Zhang Q 2009 Determination of Al2O3 CaO Fe2O3 MgO MnO SiO2TiO2 in Limestone and
Dolomite by ICP-AES Analysis and testing technology and instruments 15(3) 179-181

1
1 INTRODUCTION
Calcium carbonate (CaCO3) is the main component of limestone which is the main raw material for
glass production In addition to the main component CaCO3 in limestone limestone also contains a small
amount of silicon dioxide (SiO2) aluminum oxide (Al2O3) iron oxide (Fe2O3) magnesium oxide (MgO)
and titanium dioxide (TiO2) Lime and limestone are widely used as building materials and important
raw materials for many industries CaCO3 can be directly processed into stone stock and burnt into
quicklime Lime has quicklime and hydrated lime The main component of quicklime is calcium oxide
(CaO) which is generally lumpy pure white light gray or light yellow when containing impurities In
the chemical industry limestone is mainly used to fabricate alkali calcium carbide CaCO3 potassium
carbonate nitrogen fertilizer phosphate fertilizer and other raw materials Limestone is used as agent of
fusion in ironmaking to remove gangue (Qingling 2009 179-180) Quicklime is used as slagging mate-
rial in steelmaking to remove harmful impurities such as sulfur and phosphorus Titanium is one of the
important alloy elements In addition to its strong deoxidizing ability it can also denature non-metallic
inclusions in steel thus improving the mechanical properties of steel Therefore adding proper amount
of titanium into steel has an important influence on the quality of steel and the formation of nonmetallic
inclusions The determination of TiO2 content in limestone is of great significance to the improvement
of steel quality and the control of non-metallic inclusions in steelmaking and ironmaking (Junhua 2016
37)
There are many methods of measuring TiO2 and there are several determination methods titration anal-
ysis (ammonium ferric sulfate volumetric method hydrogen peroxide (H2O2) coordination-bismuth salt
solution titration method) spectrophotometry H2O2 photometric method ferro-titanium reagent photom-
etry) large-scale instrumental analysis (inductively coupled plasma-atomic emission spectrometry (ICP-
AES) and X-ray fluorescence (XRF) spectrometry) For the determination of TiO2 content in the sample
by titration analysis This method has poor sensitivity and selectivity In chemical analysis the sensitiv-
ity is expressed by the molar absorption coefficient ε It refers to the absorption capacity of matter to
light of a certain wavelength The value of ε reflects the degree of light absorption of the absorption
medium For the medium with selective absorption in the visible light area it indicates the sensitivity of
a certain color reaction For the same measured element the greater the value of ε the more sensitive
the color reaction is For the same color reaction the value of ε is related to the measured concentration
The higher the molar absorption coefficient the higher the sensitivity Selectivity refers to the ability to
avoid interference of other coexisting components in the sample when a certain analytical method is
used to determine a certain component Other elements such as vanadium tin molybdenum tungsten
2
copper and arsenic can interfere experimental determination Together with titanium oxide ion (TiO2+)
these elements are completely or partially reduced to a low valence state and oxidized leading to high
experimental results Although the titration analysis method does not have high requirements for instru-
ments and equipment the accuracy of the measurement results is poor and the scope of use is narrow
In H2O2 photometry the experimental operation is simple and fast but the stability of hydrogen is poor
For the determination of TiO2 samples by ICP-AES the ICP-AES was used to determine the content of
TiO2 in the experiment The method is fast accurate highly sensitive and has good reproducibility and
stability But the instrument is expensive and this method is difficult to widely promote and apply (Juan
2019 46)
Using diantipyryl methane (DAPM) photometry method for determining TiO2 is easy to operate and it
has high sensitivity good reproducibility and stability This thesis introduces the method of determining
the content of TiO2 in limestone sample A (mass fraction of TiO2 content is 0041 ) sample B (mass
fraction of TiO2 content is 0074 ) and sample C (mass fraction of TiO2 content is 0130 ) by using
DAPM photometry In the end influence of different factors for the determination of TiO2 such as
dosage of ascorbic acid dosage of DAPM spectrophotometry chromogenic reagent influence of acid
concentration and elimination method will be discussed
3
2 DETERMINATION OF TITANIUM DIOXIDE IN INDUSTRIAL RAW MATERIALS
For the determination of TiO2 in alloys ores or other industrial raw materials there are several detection
methods in the world such as titration detection method XRF detection method ICP-AES detection
method and DAPM spectrophotometry In the experimental for the determination of TiO2 by ammonium
ferrate volumetric method the experiment needs to be carried out in hydrochloric acid (HCl) or sulfuric
acid medium (H2SO4) TiO2+ is reduced to titanium ion (Ti3+) by metal aluminum sheet Potassium thi-
ocyanate is used as indicator and titrated with standard solution of ammonium ferrate sulfate Vanadium
tin molybdenum tungsten copper arsenic and other elements will interfere with the experimental re-
sults These elements will be fully or partially reduced to a low valence state together with TiO2+ and
then oxidized by high iron to produce high results (Juan 2019 45)
In the determination of TiO2 by H2O2 coordination-bismuth salt solution back titration method Firstly
adding appropriate amount of H2O2 to the solution which containing TiO2+ will form a yellow complex
And then adding excessive Ethylene Diamine Tetraacetic Acid (EDTA) to make it a more stable ternary
complex The remaining EDTA was titrated with bismuth salt solution to xylenol orange as indicator
This method is often used for samples of high titanium content Although titrimetric analysis has low
requirements for instruments and equipment its accuracy is poor and its application range is narrow In
the experiment of TiO2 sample determination by ICP-AES the inductively coupled plasma-atomic emis-
sion spectrometer was used to determine the content of TiO2 This method is fast accurate highly sen-
sitive and has good stability but the large instruments used are expensive This method is difficult to
widely promote and apply The advantages of DAPM photometry are as follows it avoids tedious ex-
perimental steps it can be used as a very practical analysis method in scientific research detection and
it can be widely used in the determination of TiO2 in steel alloys and mineral raw materials Compared
with other detection methods the DAPM spectrophotometry is more simple the detection speed is faster
and the repeatability of the experimental is good (Juan 2019 45)
21 Spectrophotometer
A spectrophotometer is a scientific instrument that breaks light with complex composition into spectral
lines The measurement range generally includes the visible light region with a wavelength range of 380-
780 nm and the ultraviolet light region with a wavelength range of 200-380 nm Different light sources
have their own unique emission spectrum so different luminous bodies can be used as the light source
4
of the instrument The emission spectrum of tungsten lamp is formed in this way After refracting the
spectrum light of 380-780 nm wavelength emitted by tungsten lamp light source through a prism a
continuous color spectrum composed of red orange yellow green blue indigo and violet can be ob-
tained The color spectrum can be used as the light source of the visible light spectrophotometer
(Xiaohua 2012 6)
Ultraviolet spectrophotometer is based on the absorption spectrum of substances to study the composi-
tion structure and interaction of substances The ultraviolet spectrophotometer can arbitrarily choose
different wavelengths of light in the ultraviolet visible region The absorption spectrum of a substance
is that the molecules and atoms in the substance absorb the light energy of certain specific wavelengths
in the incident light The molecular vibrational energy level transition and the electronic energy level
transition occur accordingly All kinds of substances have their own different molecules atoms and
different molecular space structures Their absorption of light energy is different Therefore each sub-
stance has its own unique and fixed absorption spectrum curve The absorbance at certain characteristic
wavelengths on the spectrum can be used to distinguish or determine the content of the substance Ul-
traviolet spectrophotometry is based on Lambert-Beer law According to Lambert-Beer law A = εbc
(A is the absorbance ε is the molar absorption coefficient b is the thickness of the liquid cell and c is
the concentration of the solution) This law can be used to analyze the solution quantitatively (Mohamed
amp Hassan 2015 4)
There are many types of ultraviolet visible (UV-vis) spectrophotometers but their basic structures are
similar The UV-vis spectrophotometers are composed of five parts light source monochromator ab-
sorption cell detector and signal display system The structure of the ultraviolet spectrophotometer is
shown in FIGURE 1 The light source is a device to provide the incident light that meets the requirements
The common light source in the visible light area of the UV-vis spectrophotometer is tungsten lamp and
the common light source in the UV-vis light area is hydrogen lamp or deuterium lamp Tungsten lamp
is the most commonly used visible light source It can emit a continuous spectrum of 325-2500 nm and
the most suitable wavelength range is 320-1000 nm Therefore it can also be used as near-infrared light
source Deuterium lamp is the most commonly used ultraviolet light source It emits light with a wave-
length range of 190-400 nm and the wavelength range is generally 190-360 nm The second part of the
UV-vis spectrophotometer is monochromator which decomposes the continuous spectrum of the light
source into monochromatic light and can accurately and conveniently select the optical device of a cer-
tain wavelength needed It is the heart of the photometer Monochromator is mainly composed of slit
dispersion element and lens system The dispersion element is the main part of monochromator The
5
most commonly used dispersion elements are prism grating or a combination of the two The dispersive
element is shown in the FIGURE 1 It is a combination of prism and grating (Xiaojing 2015 19-20)
The absorption tank is a vessel used to hold the liquid to be measured and determine the thickness of the
transparent liquid layer of the solution to be measured also known as a cuvette Generally speaking the
absorption tank is a cuboid which also has a circle or other shapes The absorption tank in FIGURE 1
is a cuboid The bottom and both sides of the absorption tank are ground glass and the other two sides
are optical light transmitting surfaces According to the material of the light transmitting surface the
absorption tank can be divided into two types glass absorption tank and quartz absorption tank The
glass absorption cell is used for the determination of visible light area and the quartz absorption cell is
used for the determination of ultraviolet light area The specification of absorption tank is marked by
optical path The commonly used specifications of absorption cell are 05 cm 10 cm 20 cm 30 cm
50 cm The detector is a device that converts an optical signal into an electrical signal When measuring
the absorbance it is not to directly measure the light intensity through the absorption cell but to convert
the light intensity into a current for measurement This photoelectric converter is called a detector Signal
display is a device to amplify and display the output signal of detector The new spectrophotometer is
displayed by digital voltmeter and the absorbance curve is drawn directly by recorder The new spec-
trophotometer is equipped with computer data processor (Xiaojing 2015 19-20)
FIGURE 1 The structure of ultraviolet spectrophotometer (adapted from Xiaojing 2015 19)
6
22 Diantipyryl methane spectrophotometry
DAPM is white flake crystals It is insoluble in water ether and alkali But it is soluble in acid ethanol
and chloroform DAPM is soluble in acids and forms complex organic cations with acids The solution
of DAPM is colorless and it reacts with Ti3+ to form yellow complexes DAPM can be used as a sensitive
color reagent for the determination of Ti3+ iridium iron molybdenum neodymium uranium iridium
platinum rhenium It can also be used as an extractant for various ions The molecular formula of DAPM
is C23H24N4O2H2O The molecular structure of DAPM is shown in FIGURE 2
FIGURE 2 The molecular structure of DAPM (adapted from Liu Zhou amp Song 2011 31)
The UV-vis absorption spectrum of molecules is a common spectral analysis method based on the ab-
sorption spectrum generated by the intramolecular electronic transition When a material is irradiated by
light the material molecules will collide with the light As a result the energy of photons is transferred
to the molecules In this way the stable ground state molecules will jump to the unstable high energy
state This is the absorption of the light The qualitative analysis of UV-Vis absorption spectrum is based
on the fact that the shape of absorption curve of light to the same absorption material is different the
maximum absorption wavelength is the same but the corresponding absorption rate is different There
are three properties of UV-vis absorption spectrum the first is that the same concentration of the test
solution has different absorbance for different wavelengths of light The second point is that the higher
the concentration of the same test solution the higher the absorbance Finally the smaller the concen-
tration of the same substance the same wavelength (maximum absorption wavelength λ max) corre-
sponding to the maximum absorption peak and the same curve shape The absorbance tested results of
yellow complex formed by titanium and DAPM by DAPM spectrophotometry are shown in FIGURE 3
The shape of the absorption curve can be seen from FIGURE 3 The abscissa in the chart is the wave-
length the unit of wavelength is nm The ordinate is the absorbance and the unit of absorbance is
L(g middot cm) The absorbance reaches the maximum value at the wavelength of 390 nm In the vicinity of
7
the maximum wavelength the closer to the maximum range of the spectrophotometer the greater the
sample absorbance and the smaller the error brought by the photometer itself (Junhua 2020 38)
FIGURE 3Absorbance values at different wavelengths (adapted from Junhua 2020 38)
After consulting the literatures on the determination of TiO2 by DAPM Spectrophotometry It can be
founded that the measurement method is essentially similar The specific method is as follows Firstly
the sample needs to be decomposed the sample is placed in a platinum crucible and mixed flux (lime-
stone samples with accurate TiO2 content) is added to mix with the sample Heat the crucible at high
temperature (950-1000 ) take it out and cool it then add acid to dissolve the sample After that transfer
the solution to a volumetric flask to constant volume and blend well After transferring the solution add
ascorbic acid HCl DAPM solution put it into the spectrophotometer to measure the absorbance Finally
record the data and calculate the result (Junhua 2016 39)
23 Inductively coupled plasma atomic emission spectrometry
ICP-AES has the advantages of high accuracy and precision low detection limit fast determination
wide linear range and simultaneous determination of multiple elements It has been widely used in de-
termination of dozens of elements in environmental samples and samples of rocks minerals metals
Plasma is ionized gas with an ionization degree exceeding 01 This gas contains not only neutral
atoms and molecules but also a large number of ions and electrons (Haiyan 2010 62)
8
ICP-AES is based on the spectrum emitted by atoms to determine the chemical composition of a sub-
stance Different substances are composed of atoms of different elements and the atoms all contain a
densely structured nucleus The nucleus is surrounded by moving electrons Each electron is at a certain
energy level and has a certain energy Atoms are in a stable state under normal circumstances This state
is called the ground state When the atoms are transformed into gaseous atoms under the action of exter-
nal energy the outer electrons of the gaseous atoms are excited to a high energy state When transitioning
from a higher energy level to a lower energy level the atoms will release excess energy and emit char-
acteristic lines ICP-AES disperse the generated radiation through the instrument and record it on the
photosensitive plate in the order of wavelength which can show regular spectral lines The perform
quantitative analysis based on the obtained spectrum ICP-AES is a new type of light source that is
developing rapidly and is highly valued in the analysis of emission spectrum (Haiyan 2010 62)
ICP-AES consists of sample introduction system ICP light source dispersion system and detection sys-
tem And equipped with computer control and data processing system cooling system gas control sys-
tem ICP light source consists of high frequency power supply and ICP torch tube The ICP torch tube
consists of three concentric quartz tubes and a high-frequency induction ring (generally 2-4 rings of
hollow copper tubes) surrounded by the upper part of the tube There are three intake tubes A 10-20
Lmin argon gas is passed between the quartz outer tube and the intermediate tube Its function is to form
plasma as working gas and cool the quartz torch tube which is called plasma gas or cooling gas The
intermediate tube and the central tube are filled with 05-15 Lmin argon to become auxiliary gas which
is used to assist the formation of plasma After the plasma torch is formed it can be turned off The
carrier gas in the central tube is used to introduce the sample aerosol (Xu Wang amp Xu 2020 67)
The formation of ICP torch is called ignition The ignition is divided into three steps the first step is to
introduce plasma and auxiliary gas into the outer tube and the middle tube At present the central tube
is not connected with gas and an argon atmosphere is established in the torch tube The second step is
to connect the high-frequency power supply to the induction coil The general frequency is 7-50 mhz
and the power supply is 1-15 kw At present there is high-frequency current and high-frequency elec-
tromagnetic field generated by the coil The third step is to ionize the working gas flowing in the middle
by means of high frequency spark and then the ions and electrons produced will interact with the fluc-
tuating magnetic field produced by the induction coil This interaction causes the ions and electrons in
the coil to flow along the closed loop in the figure Their resistance to this movement causes ohmic
9
heating Because of the high temperature generated by the strong current the gas is heated to form a
torch like plasma (Xu et al 2020 67)
Aerosol injection system is a commonly used method at present The sample introduction system con-
sists of two main parts sample lifting part and atomization part The sample lifting part is generally a
peristaltic pump and a self-lifting atomizer can also be used It is required that the speed of the peristaltic
pump is stable and the elasticity of the pump pipe is good so that the sample solution can be pumped in
at a constant speed and the waste liquid can be discharged smoothly The atomizing part includes atom-
izer and atomizing chamber After the sample enters the atomizer by means of pump or self-lifting small
droplets are formed under the action of carrier gas and enter the atomization chamber The large droplets
are eliminated when they touch the wall of the atomization chamber Only small droplets can enter the
plasma source (Xu et al 2020 68) For the optical system the monochromator of ICP-AES usually
adopts the combination of grating or prism and grating And for the detection system the detection
system of ICP-AES is a photoelectric converter which uses photoelectric effect to convert the radiation
energy of different wavelengths into electrical signals (Xu et al 2020 68)
As a conventional chemical analysis technology ICP-AES has a wide range of applications in biological
samples materials geology environmental protection metallurgy and other fields In the field of met-
allurgical analysis such as steel raw materials and ferroalloys it is required to measure dozens to hun-
dreds of samples at a time And each sample must simultaneously analyze dozens of elements such as
Mn Cu Al Cr Si P Ni Ti V Nb W Ca Mg It can show the absolute advantages of ICP in terms of
work efficiency In the analysis of standard materials especially the low-value fixed-value analysis of
rare earth elements the accuracy of ICP data and the simplicity of operation are fully utilized (Haiyan
2010 62) The disadvantage of the ICP-AES method is that the equipment and operating costs are rela-
tively high The sample generally needs to be converted into a solution in advance and the determination
of some elements is not obvious such as sodium (Na) and potassium (K) (Juan 2019 46)
24 Titration analysis
There are generally two types of titration analysis to determine the content of TiO2 in the sample Am-
monium ferric sulfate volumetric method and H2O2 coordination titration The specific steps of ammo-
nium ferrate sulfate volumetric method are as follows firstly reduction of TiO2+ to Ti3+ with metal
10
aluminum tablets in HCl or H2SO4 medium And then using potassium thiocyanate as an indicator Fi-
nally titration with standard solution to ammonium ferrate sulfate The method has poor sensitivity and
selectivity But there are interference elements such as vanadium tin molybdenum tungsten copper
and arsenic that affect the experimental results These elements and TiO2 are completely or partially
reduced to a low valence state and these elements are oxidized by ferric ions (Fe3+) Leading to errors
in the experimental results (Juan 2019 46)
The specific steps of H2O2 coordination titration are as follows firstly the yellow complex will be form
by adding an appropriate amount of H2O2 to a solution which containing TiO2+Then add excess EDTA
to the solution (EDTA is a good complexing agent in chemistry It has six coordination atoms The
complex formed is called chelate EDTA is often used in coordination titration to determine the content
of metal ions In biological application it is used to exclude most transition metal elements For example
it is used to exclude the interference of iron ion nickel ion and manganese ion in the experiment) Make
it form a more stable ternary complex The remaining EDTA was titrated with xylenol orange as indica-
tor For the back titration with bismuth salt solution method when the reaction is slow or the reactant is
solid add a certain amount of titration solution Normally the reaction cannot be completed immediately
At this time a certain amount of excess titrating solution can be added first to accelerate the reaction
After the reaction is completed titrating the remaining titrant with another standard solution This
method is mostly used for samples with high titanium content Although the titration analysis method
does not have high requirements for instruments and equipment but the accuracy of the measurement
results is poor and the scope of use is narrow (Juan 2019 46)
25 X-ray fluorescence spectrometry
People usually irradiate X-rays on substances to produce secondary X-rays called XRF The X-rays used
for irradiation are called primary X-rays XRF is still X-ray XRF spectrometer is mainly composed of
excitation dispersion detection recording and data unit The role of the excitation unit is to generate
primary X-rays It consists of high-voltage generator and X-ray tube The role of the dispersion unit is
to separate X-rays of the desired wavelength It consists of sample chamber slit goniometer analysis
crystal and other parts The role of the detector is to convert X-ray photon energy into electrical energy
The recording unit is composed of an amplifier a pulse amplitude analyzer and a display part X-ray
tube generates incident X-rays to excite the tested sample Each element in the excited sample emits
11
secondary X-rays and the secondary X-rays emitted by different elements have specific energy charac-
teristics or wavelength characteristics The detection system measures the energy and quantity of these
emitted secondary X-rays The instrument software converts the information collected by the detection
system into the types and contents of various elements in the sample By using the principle of X-ray
fluorescence every element after beryllium in the periodic table can be measured theoretically In prac-
tical applications the effective element measurement range is element 9 (F) to element 92 (U) in the
periodic table (Chu Li amp Jiang 2014 40)
The characteristic X-ray energy and wavelength emitted by different elements are different Therefore
no matter what kind of element can be detected by measuring the energy or wavelength of X-ray At the
same time the characteristic X-ray intensity of an element emitted after the sample is excited It is related
to the content of this element in the sample so the quantitative analysis of the element can be performed
by measuring its intensity There are two basic types of XRF spectrometers wavelength dispersive spec-
trometer and energy dispersive spectrometer The structure of the instrument is shown in FIGURE 4
12
FIGURE 4 Wavelength dispersive spectrometer and energy dispersive spectrometer (adapted from Bo
Xiao amp Tao 2015 1308)
With the development of instrument technology and theoretical methods the application range of XRF
analysis is very widely In the analysis of the composition of substances in the metallurgy geology
chemical industry machinery petroleum building materials and other industrial sectors agriculture and
medicine and health as well as physics chemistry biology geoscience environment astronomy and
archaeology and other research departments have been widely applications (Chu et al 2014 37)
13
26 Hydrogen peroxide photometry and ferrotitanium spectrophotometry
H2O2 is a colorless odorless liquid with bitter taste and easy to decompose into water and oxygen It is
a strong oxidant H2O2 is often used for sterilization in the workplace starch whitening in the industry
or as a strong oxidant for food or food packaging and liquid fuel propellant In this method phosphoric
acid (H3PO4) and H2SO4 were used to dissolve the sample In the medium of 5 H2SO4 by volume
TiO2+ and H2O2 formed a yellow complex ion in the acidic condition The stable equilibrium constant
of the complex is k = 10 times 104 and the maximum absorption wavelength is λmax = 405 nm H2O2
spectrophotometry is simple and rapid but its sensitivity and selectivity are poor Sodium catechol-35
sulfonate forms a yellow complex with titanium at pH = 47-49 Ferrotitanium reagent has high sensi-
tivity and can be used for the continuous determination of trace titanium and iron (Xinyan 2006 66)
14
3 EXPERIMENT
There are three main experimental steps sample decomposition color rendering and absorbance exper-
iment which are studied and developed extensively in this project The detail procedures of both topics
will be fully displayed Besides some important choices of chemical reagents during the experiment
will be explained by five variable value optimization experiments optimal selection of the spectropho-
tometerrsquos wavelength the optimal dosage of acidity the optimal dosage of DAPM the optimal dosage
of ascorbic acid and the interference factors analysis experimental
31 Reagents and reagents preparation
The reagents used in the experiment are as follows mixed flux grind from anhydrous sodium sulfate
and boric acid potassium pyrosulfate HCl with a density of 119 gmL H2SO4 with a density of 184
gmL HCl (1+1) ((1+1) is the solution which mix 1 ratio of HCl with 1 ratio of water in volume The
molar concentration of HCl (1+1) is 6 molL) H2SO4 (5+95) ((5+95) is the solution which mix 5 ratio
of H2SO4 with 95 ratio of water in volume The molar concentration of H2SO4 (5+95) is 09 molL)
ascorbic acid solution (20 gL) DAPM solution (50 gL) TiO2 stock solution (100 μgmL) and TiO2
standard solution (10 μgmL)
The preparation steps for ascorbic acid solution (20 gL) are as follows weigh 20g of ascorbic acid add
200-300 mL of water to dissolve the sample and stir evenly After the ascorbic acid is completely dis-
solved transfer the solution to a 1 L volumetric flask and make up to volume The preparation steps of
the TiO2 stock solution (100 μgmL) are as follows weigh 01 g of TiO2 and place it in a platinum
crucible and then add 5-7 g of potassium pyrosulfate Put them into a high-temperature furnace raise
the temperature to 600 deg C to melt Use 60 mL H2SO4 to dissolve the melt After it cooling to room
temperature transfer it to a 1000 mL volumetric flask diluted with H2SO4 to the mark and mixed fully
The preparation of the TiO2 standard solution (10 μgmL) are as follows add 50mL of TiO2 stock solu-
tion to a 500 mL volumetric flask And then add H2SO4 to constant volume and mix it well
Three instruments are used in this experiment platinum crucible (The volume needs to be greater than
30 mL) high temperature furnace (The crucible heating temperature is suitable for 100-1100 ) and
UV-vis spectrophotometer (1000 nm ge wavelength ge 180 nm) Before using the spectrophotometer
15
connect the spectrophotometer to the power supply turn on the instrument switch lift the lid of the
sample chamber and preheat the sample chamber for 10 minutes
32 Experimental procedure
Before the experiment the preparation of reagents and the commissioning of equipment need to be com-
pleted The preparatory work includes preparation of ascorbic acid solution (20 gL) preparation of
DAPM solution (50 gL) preparation of TiO2 stock solution (100 μgmL) and preparation of TiO2 stand-
ard solution (10 μgmL) After the reagent preparation is completed proceed to the second step as shown
in FIGURE 5 Dissolve the sample after weighing it Thirdly render the color of the sample solution
The fourth step is measure the absorbance of the developed solution by spectrophotometer And finally
record and process the experimental data
FIGURE 5 The experimental procedure of measuring titanium dioxide content in limestone by dianti-
pyryl methane photometry
33 Procedure of sample decomposition
In this experiment the samples selected three limestones with known accurate TiO2 content The TiO2
content (mass fraction) of sample A is 0041 the TiO2 content (mass fraction) of sample B is 0074
and the TiO2 content (mass fraction) of sample C is 013 The purpose of these accurate data is to
make a precision comparison with the data measured in this experiment and verify the accuracy of the
experimental method A total of three sets of experiments were conducted and each set was measured 6
times
The sample decomposition steps are as follows take 02 g limestone (crumb limestone) sample into a
platinum crucible add 5 g mixed flux (anhydrous sodium carbonate and boric acid) Secondly place the
platinum crucible in a high-temperature furnace and gradually increase the temperature to 950-1000
Weighing of
samplesamp
reagents
preparation
Sample
decomposition
Color
rendering
Absorbance
experiment
Experimental
data recording
16
After the sample is melted take it out and cool it to room temperature Thirdly put the crucible in the
250 mL beaker together with the sample and add HCl into the beaker Finally heat the beaker at around
75 to make the solution transparently After cooling to room temperature dilute the solution to 100
mL with water (Wang Yan amp Zhu 2013 49) During the experiment HCl is used to dissolve the sample
The choice of acid type needs to be determined through the phenomenon of sample dissolution in dif-
ferent acid systems Through experiments of dissolving samples in various acid systems the results can
be obtained the most suitable acid for dissolving limestone
For the optimal selection of the dosage and the type of acid to dissolve the sample the experimental
procedure is as follows select 025 g of limestone sample B with a TiO2 content of 0074 and place
it in 6 polytetrafluoroethylene beakers Add HCl (1+1) nitric acid (HNO3) (1+1) perchloric acid (HClO4)
(1+1) hydrofluoric acid (HF) (1+1) and H2SO4 (5+95) to dissolve the sample with different acid systems
composed of these acids Put 20 mL HCl into the first beaker By observing the solution in the beaker
the solution is cloudy with residue For the second beaker add HCl of the same volume as the first
beaker and 5 mL HNO3 The phenomenon of the solution is cloudy with residue For the third beaker
add HCl and HNO3 of the same volume as the second beaker and 10 mL HClO4 into the beaker By
observing the phenomenon of the reaction the solution is cloudy with residue For the fourth beaker put
20 mL HCl 10 mL HClO4 5 mL HF into the beaker The limestone sample is completely dissolved
And then put add HCl HNO3 and HClO4 of the same volume as the third beaker and 5 mL HF into the
fifth beaker the limestone sample is completely dissolved For the last beaker choose 20 mL HCl 10
mL HClO4 5 mL HF and 5 mL H2SO4 to dissolve the sample The solution is turbid
34 Procedure of color rendering
Whether the color rendering reaction can meet the requirements of the photometric method in addition
to mainly related to the nature of the chromogenic reagent it is also very important to control the con-
ditions of the color reaction The color rendering conditions mainly included the dosage of the chromo-
genic reagent and the acidity of the solution In order to make the color reaction as complete as possible
it is necessary to add an appropriate dosage of the chromogenic reagent If an excessive dosage of chro-
mogenic reagent is added it will cause side reactions which are not conducive to the measurement In
the experiment the appropriate dosage of the chromogenic reagent is obtained through related experi-
ments Most chromogenic reagents are organic weak acids The acidity of the solution affects the disso-
17
ciation of the chromogenic reagent and the completeness of the color rendering reaction Many chromo-
genic reagents are acid-base indicators The acidity of the solution will change the initial color of the
chromogenic reagent The acidity of the solution also has an effect on the composition and stability of
the colored complex
Three solutions need to be added in the color rendering experiment Firstly HCl needs to be added to
control the acidity of the solution Secondly ascorbic acid solution needs to be added to reduce Fe3+ to
ferrous iron (Fe2+) in the solution Because of the main interference element of this experiment is iron
So it is necessary to eliminate this interference by adding ascorbic acid solution Finally add DAPM for
color rendering reaction So before rendering colors the optimal dosage of these three solutions needs
to be found
The acidity of the solution affects the dissociation of the chromogenic reagent and the completeness of
the color rendering reaction Therefore maintaining the acidity of the solution is a prerequisite for start-
ing the color rendering experiment Determine the experiment steps of optimum dosage of HCl are as
follows take 10 mL of the test solution in 50 mL volumetric flask And then add 5 mL of ascorbic acid
solution and mix it well Place it for about 5 minutes Add 2 mL 4 mL 6 mL 8 mL 10 mL 12 mL 16
mL 20 mL HCl to 8 flasks respectively then add 7 mL of DAPM solution into each flask Dilute the
solution to the mark with water and mix it well Leave it for about half an hour at room temperature
Then put the chromogenic reagent into the spectrophotometer to measure the absorbance (detection
wavelength is 385 nm) It can be realized from TABLE 1 that the acidity in HCl medium has minimal
effect on the color rendering reaction During the analysis add 6 mL of 6 molL HCl to control the
normal concentration of about 113 N Normality (N) is defined as the number of equivalents per liter of
solution where definition of an equivalent depends on the reaction taking place in the solution For an
acid-base reaction the equivalent is the mass of acid or base that can furnish or accept exactly 1 mole of
proton (H+ ions) And this is based on the HCl concentration It can be seen from the absorbance value
in the last row of TABLE 1 that the acidity has little effect on the color rendering reaction in HCl medium
In the analysis process add 6 mL 6 molL HCl solution to control the normal concentration at 113 N
18
TABLE 1 Effect of acidity in HCl medium on color reaction
Flask1 Flask 2 Flask 3 Flask 4 Flask 5 Flask 6 Flask 7 Flask 8
HCl
(1+1) mL
2 4 6 8 10 12 16 20
Normal
concentration
(N)
065 089 113 137 161 185 233 290
Absorbance
L(gmiddotcm)
0185 0185 0185 0185 0185 0185 0185 0180
After determining the acidity of the solution the second problem to be determined is the optimal dosage
of ascorbic acid reagent Take several copies of 10 mL sample B solution with 0074 TiO2 content
add different amounts of ascorbic acid solution Then add 6 mL of HCl and 7 mL of DAPM for color
development and measure the absorbance by spectrophotometer (detection wavelength is 385 nm) The
absorbance values of different ascorbic acid dosages are shown in TABLE 2 The effect of adding
different volume of ascorbic acid on absorbance is shown in TABLE 2 The experimental results show
that when the dosage of ascorbic acid is between 3 mL and 15 mL the absorbance remains stable In
order to facilitate the operation and ensure complete reduction reaction we chose the dosage of ascorbic
acid to be 5 mL
TABLE 2 The absorbance values of different ascorbic acid dosages
Flask 1 Flask2 Flask3 Flask4 Flask5 Flask6
Ascorbic
acid (mL)
1 3 5 6 10 15
Absorbance
L(gmiddotcm)
0509 0514 0515 0515 0515 0515
After determining the dosage of the HCl and the ascorbic acid the third question is the optimal dosage
of DAPM Firstly take several copies of 5 mL sample B solution which content about 0074 of TiO2
and put the each solution into a 50 mL volumetric flask Secondly add 6 mL of HCl 5 mL of ascorbic
acid and different amounts of DAPM for color rendering reaction Finally measure the absorbance value
19
at 385 nm wavelength the experimental results are shown in the TABLE 3 From the experimental data
it can be seen that the absorbance of the DAPM chromogenic reagent is basically constant when it is
above 5 mL So the optimum dosage of the DAPM chromogenic reagent is 7 mL
TABLE 3 The dosage of DAPM experiment
Flask1 Flask2 Flask3 Flask4 Flask5 Flask6 Flask7 Flask8 Flask9
The dosage of
DAPM (mL)
2 3 4 5 6 7 8 9 10
Absorbance
L(gmiddotcm)
0226 0259 0282 0299 0231 0232 0232 0234 0233
Through the above three experiments (determine the optimal dosage of HCl ascorbic acid and DAPM)
the exact dosage of the three reagents in the color rendering experiment was determined The order and
steps of adding the three reagents are as follows firstly take 10 mL of TiO2 standard solution and put it
in a 50 mL volumetric flask Secondly add 5 mL of ascorbic acid solution mix it well Place the solution
for 5 minutes in the room temperature Then add 6 ml hydrochloric acid to mix the reagent evenly
Finally add 7 mL of DAPM into the solution Dilute the solution to the mark with water and mix it well
Leave it for 30 minutes in the room temperature and prepare to measure the absorbance
35 Procedure of the absorbance measuring
After the color rendering reaction is completed the test solution needs to be placed in a cuvette for
absorbance testing By changing the test wavelength the optimal wavelength is determined according
to the absorbance corresponding to each wavelength The absorbance at different wavelengths after color
development is shown in TABLE 4 It can be seen from the data that the wavelength has a maximum
value at 380-390 nm To ensure the best sensitivity the test wavelength is selected at 385 nm Under the
test of the maximum absorption wavelength the response of the instrument is more sensitive and the
measurement data is more accurate
20
TABLE 4 Optimal wavelength test data
Flask1 Flask2 Flask3 Flask1 Flask4 Flask5 Flask6 Flask7
Wavelength (nm) 360 370 380 385 390 400 410 420
Absorbance
L(gmiddotcm)
0499 0533 0547 0554 0543 0533 0502 0461
After determining the optimal wavelength use the spectrophotometer to analyze the content of TiO2 in
the sample firstly prepare the spectrophotometer and open the sample chamber cover Turn on the
power and the indicator lights up let the instrument warm up for 20 minutes Set the selector switch to
the T knob to display the number as 000 Secondly turn the wavelength knob to the 385 nm wave-
length and align the scale line Transfer the color rendering solution into a 3 cm cuvette and place it on
the colorimetric shelves And then close the sample chamber cover and adjust the light transmittance
100 T knob to make the number display as 1000 T Turn the selector switch to the A zero adjust-
ment knob the digital display should be 000 Then pull out the lever to put the solution to be measured
into the optical path and the digital display value is the absorbance A of the sample According to the
absorbance data it can be easily get the mass of TiO2 in the test solution After the measurement is
completed open the sample chamber cover and turn off the power switch
36 Interference test of calcium and magnesium ions
The main components of limestone are CaO and magnesium oxide (MgO) In order to determine whether
CaO or MgO has an effect on the determination of TiO2 Firstly prepare two standard solutions CaO
standard solution and MgO standard solution The content of CaO in the CaO standard solution is 10
mgL And the content of MgO in the MgO standard solution is 10 mgL Extract several parts from the
two prepared solutions and add a certain amount of TiO2 standard solution 4 mL (The amount of TiO2
added is 40 ug) to each part According to the method of 34 for color rendering the interference
experiment results of calcium ion and magnesium ion are as shown in TABLE 5 It can be seen from the
absorbance value in TABLE 5 that CaO and MgO have no effect on the determination of TiO2 There
was no difference in absorbance before and after adding CaO and MgO
21
TABLE 5 The interference experiment results of calcium ion and magnesium ion
Flask 1 Flask 2 Flask 3 Flask 4
The amount of TiO2 added 40 ug 40 ug 40 ug 40 ug
The amount of CaO added
(no MgO)
10 mg 20 mg 30 mg 40 mg
Absorbance L(gmiddotcm) 0551 0548 0550 0551
Flask 5 Flask 6 Flask 7 Flask 8
The amount of TiO2 added 40 ug 40 ug 40 ug 40 ug
The amount of MgO added
(no CaO )
10 mg 15 mg 20 mg 25 mg
Absorbance L(gmiddotcm) 0551 0550 0548 0551
22
4 RESULTS AND DISCUSSIONS
Through the acid system selection experiment the optimal selection of the spectrophotometerrsquos wave-
length experiment the optimal dosage of acidity selection experiment the optimal dosage of DAPM
selection experiment the optimal dosage of ascorbic acid selection experiment and the interference fac-
tors analysis experimental the accurate dosage of reagents was determined by these experiments Ac-
cording to the reaction phenomena or absorbance results of each experiment the corresponding experi-
mental results were obtained
In the acid system selection experiment the following conclusions can be drawn from the observation
of six experimental phenomena In the system of HF and HClO4 the sample is completely dissolved (the
precipitation is precipitated by adding H2SO4 the solution is turbid) but HClO4 and HF have a effect on
the determination of titanium and the fluoride ion is easy to complex with titanium And this
combination is likely to lead to the results on the low performance The presence of HClO4 can combine
with DAPM to produce white flocculent precipitate which led to the failure of the experiment In order
to eliminate the influence of insoluble residue to the analysis and ensure the sample is completely
dissolved The experiment uses the usual method which is anhydrous sodium carbonate and boric acid
system solvent mixed together for melting This method is simple and fast and the melting is complete
The acid system is relatively simple without introducing HClO4 acid HF acid and other kinds of acid
HCl is used to dissolve the sample and the sample dissolves quickly
In the optimal dosage of acidity selection experiment By observing the results of absorbance under
different acidity The best color acidity can be obtained add 6 mL of 6 molL HCl to control the color
acidity of solution In the optimal dosage of DAPM selection experiment through the absorbance test
results of solutions with different DAPM dosage It can be concluded from the data that the best dosage
of DAPM solution is 7 mL In the the optimal selection of the spectrophotometerrsquos wavelength
experiment according to the test results of absorbance of solution at different wavelengths it can be
concluded that the optimal wavelength is 385 nm In the optimal dosage of ascorbic acid selection
experiment through the absorbance test results of several solutions added with different volume of
ascorbic acid it can be concluded that the optimal dosage of ascorbic acid is 5 mL In the interference
factors analysis experimental it can be seen from the absorbance value in experiment results that CaO
and MgO have no effect on the determination of TiO2 By determining the accurate dosage of various
reagents a set of measurement steps with accurate actual dosage is formulated
23
41 Measurement results of titanium dioxide content
The content of TiO2 in three limestone samples was determined six times in parallel The analysis result
is rounded according to the rules of bankerrsquos rounding In order to avoid the phenomenon of big error
caused by rounding rules The specific method of data processing in this rule is as follows when the
mantissa is less than or equal to 4 the mantissa will be directly rounded off When the mantissa is greater
than or equal to 6 round off the mantissa and carry forward one digit When the mantissa is equal to 5
but the numbers after the mantissa are all 0 the previous digit of the mantissa should be used as a refer-
ence If the previous number is an odd number move one digit forward If the previous number is even
the mantissa is discarded If the mantissa is 5 but there is a number that is not 0 after the mantissa
whether the number before the mantissa is odd or even the number must move forward one bit
This experiment is carried out under the specified repeatability conditions the same experimental re-
searcher carries out the experiment uses the same instrument to carry out the experimental measurement
carries out the experiment under the same experimental conditions carries out the same calibration in a
short time TiO2 content is calculated according to the mass fraction WTiO2 calculation formula (1)
2
6
1
1
10100
TiO
mw
m V V
minus=
(1)
V1 The volume of the solution obtained separately from the sample solution The unit is milliliter (mL)
V Total volume of sample solution The unit is milliliter (mL)
m1 The quality of the titanium dioxide obtained separately from the sample solution The unit is mi-
crogram (μg)
m The quality of the sample The unit is gram (g)
The measurement results of the experiment are shown in the TABLE 6 The experimental data compared
with the TiO2 content in three limestone samples are shown in TABLE 7 For sample A the TiO2 content
obtained from the first and third experiments is basically consistent with the known accurate TiO2
content of sample A In addition to the second experimental data the accuracy of other experimental
data is good Compare with the other five groups of data the results of the second experiment have
relatively large errors For sample B the content of TiO2 obtained in the third experiment is almost the
same as the given value The TiO2 content measured in the fifth experiment is quite different from the
given value compared with the other five groups of data For sample C the TiO2 content obtained from
six experiments is almost the same as the given TiO2 content
24
TABLE 6 Experimental measurement data
Experiment
1
Experiment
2
Experiment
3
Experiment
4
Experiment
5
Experiment
6
Sample A
()
00412 00423 00409 00414 00416 00415
Sample B
()
00730 00750 00740 00765 00780 00735
Sample C
()
01250 01280 01290 01310 01240 01260
42 Accuracy of results discussion
From the average value of the data it can be seen that the accuracy of using the DAPM photometry to
determine the TiO2 content in limestone TABLE 7 is the average value of TiO2 content measured in six
experiments for each sample from TABLE 6 The second column is the certified value of the three
samples The mass fraction of TiO2 content in sample A is 0041 The mass fraction of TiO2 content
in sample B is 0074 The mass fraction of TiO2 content in sample C is 013 And the third column
is the average values which are obtained through experimental measurement and calculation As can be
seen from TABLE 7 The average value of TiO2 content in several groups of limestone samples meas-
ured by this experiment have high accuracy
TABLE 7 Average mass fraction of TiO2 content in limestone
Certified value Average value
Sample A () 0041 00414
Sample B () 0074 00750
Sample C () 0130 01272
HCl was used to dissolve the sample If HClO4 is used in the experiment it will form white flocculent
precipitate with DAPM which will affect the absorbance test If HF is used in the experiment fluorine
ions will complexate with titanium to form titanium fluoride complex which will affect the accuracy of
25
the experimental results If only HNO3 is used for decomposition except for incomplete decomposition
of the sample HNO3 also destroys DAPM thus affecting the continuation of the experiment According
to the dissolution treatment experiment and acidification experiment the HCl system is relatively simple
without the introduction of HClO4 HF and other types of acids And the sample dissolves quickly by
HCl leaching
In the experiment of determine the optimal dosage of DAPM solution it can be concluded that the
optimal dosage of DAPM is 7mL When the amount of DAPM is more than 6 mL the absorbance tends
to be stable If the flux of DAPM does not reach 6 mL the color reaction will be incomplete which will
affect the whole experiment For the selection of the amount of ascorbic acid ascorbic acid is used to
reduce Fe3+ in the solution to Fe2+ In order to eliminate the interference 5 mL ascorbic acid was selected
to reduce Fe3+ in the sample If the amount of ascorbic acid is less than 5 mL the remaining unreduced
Fe3+ will affect the accuracy of the whole experiment
In this experiment temperature and time have influence on the measurement results In 15-80 the
absorbance value is not affected by temperature However if the iron content in the sample is high and
the temperature is higher than 60 the solution is easy to be turbid and unable to compare colors
Therefore this experiment uses 15-30 room temperature to render color The color solution is very
stable and can be maintained for several months When the room temperature is higher than 20 it
tends to be stable after 20 minutes of color development When the room temperature is lower than 20
it needs 40-60 minutes to be stable In this color rendering experiment the accuracy of temperature
control is particularly important
When selecting the optimal wavelength of the test absorbance the wavelength corresponding to the
maximum absorbance is selected according to the absorption curve of the test solution In this experiment
when the wavelength is 385 nm the absorbance changes with the concentration in the largest range so
the determination is the most sensitive The absorption curve is an important basis for choosing the
wavelength of incident light in quantitative analysis In the wavelength selection experiment if the
wavelength corresponding to the maximum absorbance is not selected the accuracy of the experiment
will be insufficient
26
5 CONCLUSION
In this experiment the DAPM photometric method was used to determine the content of TiO2 The
sample is melted by sodium carbonate-boric acid mixed flux and leached with dilute HCl The experi-
ment used ascorbic acid as a masking agent to reduce Fe3+ to Fe2+ in the solution to eliminate interference
In this experiment DAPM solution was added to render the solution color In order to ensure the accu-
racy of the experimental results the amount of various reagents was optimized The following five as-
pects were quantitatively analyzed in the experiment optimal selection of the spectrophotometerrsquos
wavelength the optimal dosage of acidity the optimal dosage of DAPM the optimal dosage of ascorbic
acid and the interference factors analysis The exact dosage of each reagent was determined The TiO2
content measured in the experiment was compared with limestone with known accurate TiO2 content
The accuracy of the measurement can be seen in this experiment This experimental method has a perfect
effect on the use of spectrophotometers and promotes the determination of mineral raw materials con-
taining low TiO2 content by spectrophotometer
For the measurement results of the experiment there is a certain error between the TiO2 content meas-
ured in this experiment and the TiO2 content given in the limestone sample Through the interference
element analysis experiment it is determined that the two main components of limestone (MgO and
CaO) are not the cause of this error For several values with slightly poor accuracy there may be some
problems in the operation of the experiment The most likely reason for the poor accuracy of the data is
that after the sample dissolves the color reaction does not wait until the solution cools to room temper-
ature Another possibility is that the limestone sample is not well preserved resulting in a certain error
between the actual TiO2 value and the given value In the future experiments the above two error aspects
are further studied to ensure that the measurement method is accurate and the measurement results are
more accurate
Compared to ammonium ferric sulfate volumetric method and H2O2 coordination titration method
DAPM photometric method has high accuracy and eliminates the interference of vanadium molyb-
denum tungsten copper arsenic and other elements to the experiment Compared to ICP-AES method
DAPM photometric method is simple in operation and suitable for popularization and application The
results of the project provided a technical method for accurately and quickly determining the content of
TiO2 in limestone
27
REFERENCES
Bo H Xiaomei W amp Tao Y 2015 The development and application of X-Ray fluorescence
spectrometer Nuclear Electronics amp Detection Technology 1307-1311
Chen C 2005 Determinition of TiO2 in mine with diantipyrylmethane spectrophotometry Tian jing
Metallurgy 43(4) 9-10
Chen Z 2009 Research and Fabrication of Opto-mechanical Systems of New UV Spectrophotometer
Chu N Li W amp Jiang X 2014 Determination of major and minor compoments in limestone by
wavelength dispersive X-ray fluorescence spectrometry with fusion sample preparation Metallurgical
analysis 34(10) 37-41
Chu Y 1983 Development of X-ray fluorescence spectrometer DOI 10 13595 j cnki issn1000 -
0720 1983 0062
Deng J 2016 Determination of Titanium Dioxide in Titanium Slag by Diantipyrylmethane
Spectrophotometry Physico-ChemistryampChemical-Chemistry 52(1) 37-40
Deng J 2020 Determination of Titanium in Titanium Ferroalloy by Spectrophotometry with
Diantipyrylmethane Angang technology 2(1) 36-39
Du M 2017 Simultaneous determination of Fe Al Ca Mg K Na Ti in limestone by inductively
coupled plasma atomic emission spectrometry with microwave digestion Metallurgical Analysis
26(4) 30
Jin L Meng H amp Yinglin D 2008 Determining titanium dioxide in ores by ICP-AES Jilin
geology 27(1) 83-85
Khavar A amp Asadollahzadeh H 2020 Preconcentration and determination of nickel (Ⅱ)and
copper(Ⅱ) ions Elsevier Inc DOI101016jjfca2020103457
Li C 2006 Determination of SiO2 Cao MgO Al2O3 Fe2O3 and P2O5 in limestone and dolomite by
XRF melting method Shandong Metallurgy 28(6) 10-14
Li H 2005 Diantipyric methane spectrophotometric determination of titanium in magnesium
chloride Journal of environmental management college of China 15(3) 113-114
Liu X Zhong Y amp Song H 2011 Synthesis of Diantipyrylmethane aromatic ring derivatives and
its application in photometric analysis Jiangxi Nonferrous Metals 15 30-35
Mohamed E amp Hassan A 2015 Characterization of visiblelight activated TiO2 catalysts and their
photocatalytic performance study Huazhong Agricultural University 4-16
Pan X 2015 Development Trend of Ultraviolet Spectrophotometer Science and Technology amp
Innovation(14) 19-21
Peng X 2012 Study on spectrum analytical system of visible spectrometer Tianjin University 3-12
28
Shao H 2001 Determination of chloride ion in copper electrolyte by potentiometric titration
metallurgical analysis 21(4) 64-65
Song X 2006 Determination of titanium dioxide in vanadic titanomagnetite by hydrogen peroxide
Spectrophotometry Metallurgical Analysis 26(3)
Sunil R amp Kalpana C 2011 Synthesis of diarypyrimidinones (DAPMs) using large porezeolites
Journal of molecular catalysis 210-215
Wang R Yan W amp Zhu X 2013 Methods for chemical analysis of limestone quicklime and
hydrated lime for building materials Cement(4) 49-50
Wang H 2010 Discussion on the principle and maintenance of ICP- AES Electronic product
reliability and environmental testing 28(4) 60-63
Xu C Wang Q Xu W Dai M amp Qi 2020 Trouble shooting of inductively coupled plasma
atomic emission spectrometer Metallurgical analysis 40 66-71
Xu C Wang Q amp Xu W 2020 Fault analysis and treatment of inductively coupled plasma atomic
emission spectrometer Metallurgical analysis 40(2) 66-71
Yang Z 2008 Simultaneous quantification measurement of SiFeTiCaMgZr in corundum by
inductively coupled plasma-atomic emission spectrometry with secondary-melting method Rock
and mineral analysis 31(2)
Zhang J 2019 Discussion on the determination of TiO2 by Diantipyrylmethane Spectrophotometry
Chemical enterprise management(1) 45-46
Zhi P 1999 Development and application of biochemical instruments Telecommunication
Engineering 6(2)
Zhang Q 2009 Determination of Al2O3 CaO Fe2O3 MgO MnO SiO2TiO2 in Limestone and
Dolomite by ICP-AES Analysis and testing technology and instruments 15(3) 179-181

2
copper and arsenic can interfere experimental determination Together with titanium oxide ion (TiO2+)
these elements are completely or partially reduced to a low valence state and oxidized leading to high
experimental results Although the titration analysis method does not have high requirements for instru-
ments and equipment the accuracy of the measurement results is poor and the scope of use is narrow
In H2O2 photometry the experimental operation is simple and fast but the stability of hydrogen is poor
For the determination of TiO2 samples by ICP-AES the ICP-AES was used to determine the content of
TiO2 in the experiment The method is fast accurate highly sensitive and has good reproducibility and
stability But the instrument is expensive and this method is difficult to widely promote and apply (Juan
2019 46)
Using diantipyryl methane (DAPM) photometry method for determining TiO2 is easy to operate and it
has high sensitivity good reproducibility and stability This thesis introduces the method of determining
the content of TiO2 in limestone sample A (mass fraction of TiO2 content is 0041 ) sample B (mass
fraction of TiO2 content is 0074 ) and sample C (mass fraction of TiO2 content is 0130 ) by using
DAPM photometry In the end influence of different factors for the determination of TiO2 such as
dosage of ascorbic acid dosage of DAPM spectrophotometry chromogenic reagent influence of acid
concentration and elimination method will be discussed
3
2 DETERMINATION OF TITANIUM DIOXIDE IN INDUSTRIAL RAW MATERIALS
For the determination of TiO2 in alloys ores or other industrial raw materials there are several detection
methods in the world such as titration detection method XRF detection method ICP-AES detection
method and DAPM spectrophotometry In the experimental for the determination of TiO2 by ammonium
ferrate volumetric method the experiment needs to be carried out in hydrochloric acid (HCl) or sulfuric
acid medium (H2SO4) TiO2+ is reduced to titanium ion (Ti3+) by metal aluminum sheet Potassium thi-
ocyanate is used as indicator and titrated with standard solution of ammonium ferrate sulfate Vanadium
tin molybdenum tungsten copper arsenic and other elements will interfere with the experimental re-
sults These elements will be fully or partially reduced to a low valence state together with TiO2+ and
then oxidized by high iron to produce high results (Juan 2019 45)
In the determination of TiO2 by H2O2 coordination-bismuth salt solution back titration method Firstly
adding appropriate amount of H2O2 to the solution which containing TiO2+ will form a yellow complex
And then adding excessive Ethylene Diamine Tetraacetic Acid (EDTA) to make it a more stable ternary
complex The remaining EDTA was titrated with bismuth salt solution to xylenol orange as indicator
This method is often used for samples of high titanium content Although titrimetric analysis has low
requirements for instruments and equipment its accuracy is poor and its application range is narrow In
the experiment of TiO2 sample determination by ICP-AES the inductively coupled plasma-atomic emis-
sion spectrometer was used to determine the content of TiO2 This method is fast accurate highly sen-
sitive and has good stability but the large instruments used are expensive This method is difficult to
widely promote and apply The advantages of DAPM photometry are as follows it avoids tedious ex-
perimental steps it can be used as a very practical analysis method in scientific research detection and
it can be widely used in the determination of TiO2 in steel alloys and mineral raw materials Compared
with other detection methods the DAPM spectrophotometry is more simple the detection speed is faster
and the repeatability of the experimental is good (Juan 2019 45)
21 Spectrophotometer
A spectrophotometer is a scientific instrument that breaks light with complex composition into spectral
lines The measurement range generally includes the visible light region with a wavelength range of 380-
780 nm and the ultraviolet light region with a wavelength range of 200-380 nm Different light sources
have their own unique emission spectrum so different luminous bodies can be used as the light source
4
of the instrument The emission spectrum of tungsten lamp is formed in this way After refracting the
spectrum light of 380-780 nm wavelength emitted by tungsten lamp light source through a prism a
continuous color spectrum composed of red orange yellow green blue indigo and violet can be ob-
tained The color spectrum can be used as the light source of the visible light spectrophotometer
(Xiaohua 2012 6)
Ultraviolet spectrophotometer is based on the absorption spectrum of substances to study the composi-
tion structure and interaction of substances The ultraviolet spectrophotometer can arbitrarily choose
different wavelengths of light in the ultraviolet visible region The absorption spectrum of a substance
is that the molecules and atoms in the substance absorb the light energy of certain specific wavelengths
in the incident light The molecular vibrational energy level transition and the electronic energy level
transition occur accordingly All kinds of substances have their own different molecules atoms and
different molecular space structures Their absorption of light energy is different Therefore each sub-
stance has its own unique and fixed absorption spectrum curve The absorbance at certain characteristic
wavelengths on the spectrum can be used to distinguish or determine the content of the substance Ul-
traviolet spectrophotometry is based on Lambert-Beer law According to Lambert-Beer law A = εbc
(A is the absorbance ε is the molar absorption coefficient b is the thickness of the liquid cell and c is
the concentration of the solution) This law can be used to analyze the solution quantitatively (Mohamed
amp Hassan 2015 4)
There are many types of ultraviolet visible (UV-vis) spectrophotometers but their basic structures are
similar The UV-vis spectrophotometers are composed of five parts light source monochromator ab-
sorption cell detector and signal display system The structure of the ultraviolet spectrophotometer is
shown in FIGURE 1 The light source is a device to provide the incident light that meets the requirements
The common light source in the visible light area of the UV-vis spectrophotometer is tungsten lamp and
the common light source in the UV-vis light area is hydrogen lamp or deuterium lamp Tungsten lamp
is the most commonly used visible light source It can emit a continuous spectrum of 325-2500 nm and
the most suitable wavelength range is 320-1000 nm Therefore it can also be used as near-infrared light
source Deuterium lamp is the most commonly used ultraviolet light source It emits light with a wave-
length range of 190-400 nm and the wavelength range is generally 190-360 nm The second part of the
UV-vis spectrophotometer is monochromator which decomposes the continuous spectrum of the light
source into monochromatic light and can accurately and conveniently select the optical device of a cer-
tain wavelength needed It is the heart of the photometer Monochromator is mainly composed of slit
dispersion element and lens system The dispersion element is the main part of monochromator The
5
most commonly used dispersion elements are prism grating or a combination of the two The dispersive
element is shown in the FIGURE 1 It is a combination of prism and grating (Xiaojing 2015 19-20)
The absorption tank is a vessel used to hold the liquid to be measured and determine the thickness of the
transparent liquid layer of the solution to be measured also known as a cuvette Generally speaking the
absorption tank is a cuboid which also has a circle or other shapes The absorption tank in FIGURE 1
is a cuboid The bottom and both sides of the absorption tank are ground glass and the other two sides
are optical light transmitting surfaces According to the material of the light transmitting surface the
absorption tank can be divided into two types glass absorption tank and quartz absorption tank The
glass absorption cell is used for the determination of visible light area and the quartz absorption cell is
used for the determination of ultraviolet light area The specification of absorption tank is marked by
optical path The commonly used specifications of absorption cell are 05 cm 10 cm 20 cm 30 cm
50 cm The detector is a device that converts an optical signal into an electrical signal When measuring
the absorbance it is not to directly measure the light intensity through the absorption cell but to convert
the light intensity into a current for measurement This photoelectric converter is called a detector Signal
display is a device to amplify and display the output signal of detector The new spectrophotometer is
displayed by digital voltmeter and the absorbance curve is drawn directly by recorder The new spec-
trophotometer is equipped with computer data processor (Xiaojing 2015 19-20)
FIGURE 1 The structure of ultraviolet spectrophotometer (adapted from Xiaojing 2015 19)
6
22 Diantipyryl methane spectrophotometry
DAPM is white flake crystals It is insoluble in water ether and alkali But it is soluble in acid ethanol
and chloroform DAPM is soluble in acids and forms complex organic cations with acids The solution
of DAPM is colorless and it reacts with Ti3+ to form yellow complexes DAPM can be used as a sensitive
color reagent for the determination of Ti3+ iridium iron molybdenum neodymium uranium iridium
platinum rhenium It can also be used as an extractant for various ions The molecular formula of DAPM
is C23H24N4O2H2O The molecular structure of DAPM is shown in FIGURE 2
FIGURE 2 The molecular structure of DAPM (adapted from Liu Zhou amp Song 2011 31)
The UV-vis absorption spectrum of molecules is a common spectral analysis method based on the ab-
sorption spectrum generated by the intramolecular electronic transition When a material is irradiated by
light the material molecules will collide with the light As a result the energy of photons is transferred
to the molecules In this way the stable ground state molecules will jump to the unstable high energy
state This is the absorption of the light The qualitative analysis of UV-Vis absorption spectrum is based
on the fact that the shape of absorption curve of light to the same absorption material is different the
maximum absorption wavelength is the same but the corresponding absorption rate is different There
are three properties of UV-vis absorption spectrum the first is that the same concentration of the test
solution has different absorbance for different wavelengths of light The second point is that the higher
the concentration of the same test solution the higher the absorbance Finally the smaller the concen-
tration of the same substance the same wavelength (maximum absorption wavelength λ max) corre-
sponding to the maximum absorption peak and the same curve shape The absorbance tested results of
yellow complex formed by titanium and DAPM by DAPM spectrophotometry are shown in FIGURE 3
The shape of the absorption curve can be seen from FIGURE 3 The abscissa in the chart is the wave-
length the unit of wavelength is nm The ordinate is the absorbance and the unit of absorbance is
L(g middot cm) The absorbance reaches the maximum value at the wavelength of 390 nm In the vicinity of
7
the maximum wavelength the closer to the maximum range of the spectrophotometer the greater the
sample absorbance and the smaller the error brought by the photometer itself (Junhua 2020 38)
FIGURE 3Absorbance values at different wavelengths (adapted from Junhua 2020 38)
After consulting the literatures on the determination of TiO2 by DAPM Spectrophotometry It can be
founded that the measurement method is essentially similar The specific method is as follows Firstly
the sample needs to be decomposed the sample is placed in a platinum crucible and mixed flux (lime-
stone samples with accurate TiO2 content) is added to mix with the sample Heat the crucible at high
temperature (950-1000 ) take it out and cool it then add acid to dissolve the sample After that transfer
the solution to a volumetric flask to constant volume and blend well After transferring the solution add
ascorbic acid HCl DAPM solution put it into the spectrophotometer to measure the absorbance Finally
record the data and calculate the result (Junhua 2016 39)
23 Inductively coupled plasma atomic emission spectrometry
ICP-AES has the advantages of high accuracy and precision low detection limit fast determination
wide linear range and simultaneous determination of multiple elements It has been widely used in de-
termination of dozens of elements in environmental samples and samples of rocks minerals metals
Plasma is ionized gas with an ionization degree exceeding 01 This gas contains not only neutral
atoms and molecules but also a large number of ions and electrons (Haiyan 2010 62)
8
ICP-AES is based on the spectrum emitted by atoms to determine the chemical composition of a sub-
stance Different substances are composed of atoms of different elements and the atoms all contain a
densely structured nucleus The nucleus is surrounded by moving electrons Each electron is at a certain
energy level and has a certain energy Atoms are in a stable state under normal circumstances This state
is called the ground state When the atoms are transformed into gaseous atoms under the action of exter-
nal energy the outer electrons of the gaseous atoms are excited to a high energy state When transitioning
from a higher energy level to a lower energy level the atoms will release excess energy and emit char-
acteristic lines ICP-AES disperse the generated radiation through the instrument and record it on the
photosensitive plate in the order of wavelength which can show regular spectral lines The perform
quantitative analysis based on the obtained spectrum ICP-AES is a new type of light source that is
developing rapidly and is highly valued in the analysis of emission spectrum (Haiyan 2010 62)
ICP-AES consists of sample introduction system ICP light source dispersion system and detection sys-
tem And equipped with computer control and data processing system cooling system gas control sys-
tem ICP light source consists of high frequency power supply and ICP torch tube The ICP torch tube
consists of three concentric quartz tubes and a high-frequency induction ring (generally 2-4 rings of
hollow copper tubes) surrounded by the upper part of the tube There are three intake tubes A 10-20
Lmin argon gas is passed between the quartz outer tube and the intermediate tube Its function is to form
plasma as working gas and cool the quartz torch tube which is called plasma gas or cooling gas The
intermediate tube and the central tube are filled with 05-15 Lmin argon to become auxiliary gas which
is used to assist the formation of plasma After the plasma torch is formed it can be turned off The
carrier gas in the central tube is used to introduce the sample aerosol (Xu Wang amp Xu 2020 67)
The formation of ICP torch is called ignition The ignition is divided into three steps the first step is to
introduce plasma and auxiliary gas into the outer tube and the middle tube At present the central tube
is not connected with gas and an argon atmosphere is established in the torch tube The second step is
to connect the high-frequency power supply to the induction coil The general frequency is 7-50 mhz
and the power supply is 1-15 kw At present there is high-frequency current and high-frequency elec-
tromagnetic field generated by the coil The third step is to ionize the working gas flowing in the middle
by means of high frequency spark and then the ions and electrons produced will interact with the fluc-
tuating magnetic field produced by the induction coil This interaction causes the ions and electrons in
the coil to flow along the closed loop in the figure Their resistance to this movement causes ohmic
9
heating Because of the high temperature generated by the strong current the gas is heated to form a
torch like plasma (Xu et al 2020 67)
Aerosol injection system is a commonly used method at present The sample introduction system con-
sists of two main parts sample lifting part and atomization part The sample lifting part is generally a
peristaltic pump and a self-lifting atomizer can also be used It is required that the speed of the peristaltic
pump is stable and the elasticity of the pump pipe is good so that the sample solution can be pumped in
at a constant speed and the waste liquid can be discharged smoothly The atomizing part includes atom-
izer and atomizing chamber After the sample enters the atomizer by means of pump or self-lifting small
droplets are formed under the action of carrier gas and enter the atomization chamber The large droplets
are eliminated when they touch the wall of the atomization chamber Only small droplets can enter the
plasma source (Xu et al 2020 68) For the optical system the monochromator of ICP-AES usually
adopts the combination of grating or prism and grating And for the detection system the detection
system of ICP-AES is a photoelectric converter which uses photoelectric effect to convert the radiation
energy of different wavelengths into electrical signals (Xu et al 2020 68)
As a conventional chemical analysis technology ICP-AES has a wide range of applications in biological
samples materials geology environmental protection metallurgy and other fields In the field of met-
allurgical analysis such as steel raw materials and ferroalloys it is required to measure dozens to hun-
dreds of samples at a time And each sample must simultaneously analyze dozens of elements such as
Mn Cu Al Cr Si P Ni Ti V Nb W Ca Mg It can show the absolute advantages of ICP in terms of
work efficiency In the analysis of standard materials especially the low-value fixed-value analysis of
rare earth elements the accuracy of ICP data and the simplicity of operation are fully utilized (Haiyan
2010 62) The disadvantage of the ICP-AES method is that the equipment and operating costs are rela-
tively high The sample generally needs to be converted into a solution in advance and the determination
of some elements is not obvious such as sodium (Na) and potassium (K) (Juan 2019 46)
24 Titration analysis
There are generally two types of titration analysis to determine the content of TiO2 in the sample Am-
monium ferric sulfate volumetric method and H2O2 coordination titration The specific steps of ammo-
nium ferrate sulfate volumetric method are as follows firstly reduction of TiO2+ to Ti3+ with metal
10
aluminum tablets in HCl or H2SO4 medium And then using potassium thiocyanate as an indicator Fi-
nally titration with standard solution to ammonium ferrate sulfate The method has poor sensitivity and
selectivity But there are interference elements such as vanadium tin molybdenum tungsten copper
and arsenic that affect the experimental results These elements and TiO2 are completely or partially
reduced to a low valence state and these elements are oxidized by ferric ions (Fe3+) Leading to errors
in the experimental results (Juan 2019 46)
The specific steps of H2O2 coordination titration are as follows firstly the yellow complex will be form
by adding an appropriate amount of H2O2 to a solution which containing TiO2+Then add excess EDTA
to the solution (EDTA is a good complexing agent in chemistry It has six coordination atoms The
complex formed is called chelate EDTA is often used in coordination titration to determine the content
of metal ions In biological application it is used to exclude most transition metal elements For example
it is used to exclude the interference of iron ion nickel ion and manganese ion in the experiment) Make
it form a more stable ternary complex The remaining EDTA was titrated with xylenol orange as indica-
tor For the back titration with bismuth salt solution method when the reaction is slow or the reactant is
solid add a certain amount of titration solution Normally the reaction cannot be completed immediately
At this time a certain amount of excess titrating solution can be added first to accelerate the reaction
After the reaction is completed titrating the remaining titrant with another standard solution This
method is mostly used for samples with high titanium content Although the titration analysis method
does not have high requirements for instruments and equipment but the accuracy of the measurement
results is poor and the scope of use is narrow (Juan 2019 46)
25 X-ray fluorescence spectrometry
People usually irradiate X-rays on substances to produce secondary X-rays called XRF The X-rays used
for irradiation are called primary X-rays XRF is still X-ray XRF spectrometer is mainly composed of
excitation dispersion detection recording and data unit The role of the excitation unit is to generate
primary X-rays It consists of high-voltage generator and X-ray tube The role of the dispersion unit is
to separate X-rays of the desired wavelength It consists of sample chamber slit goniometer analysis
crystal and other parts The role of the detector is to convert X-ray photon energy into electrical energy
The recording unit is composed of an amplifier a pulse amplitude analyzer and a display part X-ray
tube generates incident X-rays to excite the tested sample Each element in the excited sample emits
11
secondary X-rays and the secondary X-rays emitted by different elements have specific energy charac-
teristics or wavelength characteristics The detection system measures the energy and quantity of these
emitted secondary X-rays The instrument software converts the information collected by the detection
system into the types and contents of various elements in the sample By using the principle of X-ray
fluorescence every element after beryllium in the periodic table can be measured theoretically In prac-
tical applications the effective element measurement range is element 9 (F) to element 92 (U) in the
periodic table (Chu Li amp Jiang 2014 40)
The characteristic X-ray energy and wavelength emitted by different elements are different Therefore
no matter what kind of element can be detected by measuring the energy or wavelength of X-ray At the
same time the characteristic X-ray intensity of an element emitted after the sample is excited It is related
to the content of this element in the sample so the quantitative analysis of the element can be performed
by measuring its intensity There are two basic types of XRF spectrometers wavelength dispersive spec-
trometer and energy dispersive spectrometer The structure of the instrument is shown in FIGURE 4
12
FIGURE 4 Wavelength dispersive spectrometer and energy dispersive spectrometer (adapted from Bo
Xiao amp Tao 2015 1308)
With the development of instrument technology and theoretical methods the application range of XRF
analysis is very widely In the analysis of the composition of substances in the metallurgy geology
chemical industry machinery petroleum building materials and other industrial sectors agriculture and
medicine and health as well as physics chemistry biology geoscience environment astronomy and
archaeology and other research departments have been widely applications (Chu et al 2014 37)
13
26 Hydrogen peroxide photometry and ferrotitanium spectrophotometry
H2O2 is a colorless odorless liquid with bitter taste and easy to decompose into water and oxygen It is
a strong oxidant H2O2 is often used for sterilization in the workplace starch whitening in the industry
or as a strong oxidant for food or food packaging and liquid fuel propellant In this method phosphoric
acid (H3PO4) and H2SO4 were used to dissolve the sample In the medium of 5 H2SO4 by volume
TiO2+ and H2O2 formed a yellow complex ion in the acidic condition The stable equilibrium constant
of the complex is k = 10 times 104 and the maximum absorption wavelength is λmax = 405 nm H2O2
spectrophotometry is simple and rapid but its sensitivity and selectivity are poor Sodium catechol-35
sulfonate forms a yellow complex with titanium at pH = 47-49 Ferrotitanium reagent has high sensi-
tivity and can be used for the continuous determination of trace titanium and iron (Xinyan 2006 66)
14
3 EXPERIMENT
There are three main experimental steps sample decomposition color rendering and absorbance exper-
iment which are studied and developed extensively in this project The detail procedures of both topics
will be fully displayed Besides some important choices of chemical reagents during the experiment
will be explained by five variable value optimization experiments optimal selection of the spectropho-
tometerrsquos wavelength the optimal dosage of acidity the optimal dosage of DAPM the optimal dosage
of ascorbic acid and the interference factors analysis experimental
31 Reagents and reagents preparation
The reagents used in the experiment are as follows mixed flux grind from anhydrous sodium sulfate
and boric acid potassium pyrosulfate HCl with a density of 119 gmL H2SO4 with a density of 184
gmL HCl (1+1) ((1+1) is the solution which mix 1 ratio of HCl with 1 ratio of water in volume The
molar concentration of HCl (1+1) is 6 molL) H2SO4 (5+95) ((5+95) is the solution which mix 5 ratio
of H2SO4 with 95 ratio of water in volume The molar concentration of H2SO4 (5+95) is 09 molL)
ascorbic acid solution (20 gL) DAPM solution (50 gL) TiO2 stock solution (100 μgmL) and TiO2
standard solution (10 μgmL)
The preparation steps for ascorbic acid solution (20 gL) are as follows weigh 20g of ascorbic acid add
200-300 mL of water to dissolve the sample and stir evenly After the ascorbic acid is completely dis-
solved transfer the solution to a 1 L volumetric flask and make up to volume The preparation steps of
the TiO2 stock solution (100 μgmL) are as follows weigh 01 g of TiO2 and place it in a platinum
crucible and then add 5-7 g of potassium pyrosulfate Put them into a high-temperature furnace raise
the temperature to 600 deg C to melt Use 60 mL H2SO4 to dissolve the melt After it cooling to room
temperature transfer it to a 1000 mL volumetric flask diluted with H2SO4 to the mark and mixed fully
The preparation of the TiO2 standard solution (10 μgmL) are as follows add 50mL of TiO2 stock solu-
tion to a 500 mL volumetric flask And then add H2SO4 to constant volume and mix it well
Three instruments are used in this experiment platinum crucible (The volume needs to be greater than
30 mL) high temperature furnace (The crucible heating temperature is suitable for 100-1100 ) and
UV-vis spectrophotometer (1000 nm ge wavelength ge 180 nm) Before using the spectrophotometer
15
connect the spectrophotometer to the power supply turn on the instrument switch lift the lid of the
sample chamber and preheat the sample chamber for 10 minutes
32 Experimental procedure
Before the experiment the preparation of reagents and the commissioning of equipment need to be com-
pleted The preparatory work includes preparation of ascorbic acid solution (20 gL) preparation of
DAPM solution (50 gL) preparation of TiO2 stock solution (100 μgmL) and preparation of TiO2 stand-
ard solution (10 μgmL) After the reagent preparation is completed proceed to the second step as shown
in FIGURE 5 Dissolve the sample after weighing it Thirdly render the color of the sample solution
The fourth step is measure the absorbance of the developed solution by spectrophotometer And finally
record and process the experimental data
FIGURE 5 The experimental procedure of measuring titanium dioxide content in limestone by dianti-
pyryl methane photometry
33 Procedure of sample decomposition
In this experiment the samples selected three limestones with known accurate TiO2 content The TiO2
content (mass fraction) of sample A is 0041 the TiO2 content (mass fraction) of sample B is 0074
and the TiO2 content (mass fraction) of sample C is 013 The purpose of these accurate data is to
make a precision comparison with the data measured in this experiment and verify the accuracy of the
experimental method A total of three sets of experiments were conducted and each set was measured 6
times
The sample decomposition steps are as follows take 02 g limestone (crumb limestone) sample into a
platinum crucible add 5 g mixed flux (anhydrous sodium carbonate and boric acid) Secondly place the
platinum crucible in a high-temperature furnace and gradually increase the temperature to 950-1000
Weighing of
samplesamp
reagents
preparation
Sample
decomposition
Color
rendering
Absorbance
experiment
Experimental
data recording
16
After the sample is melted take it out and cool it to room temperature Thirdly put the crucible in the
250 mL beaker together with the sample and add HCl into the beaker Finally heat the beaker at around
75 to make the solution transparently After cooling to room temperature dilute the solution to 100
mL with water (Wang Yan amp Zhu 2013 49) During the experiment HCl is used to dissolve the sample
The choice of acid type needs to be determined through the phenomenon of sample dissolution in dif-
ferent acid systems Through experiments of dissolving samples in various acid systems the results can
be obtained the most suitable acid for dissolving limestone
For the optimal selection of the dosage and the type of acid to dissolve the sample the experimental
procedure is as follows select 025 g of limestone sample B with a TiO2 content of 0074 and place
it in 6 polytetrafluoroethylene beakers Add HCl (1+1) nitric acid (HNO3) (1+1) perchloric acid (HClO4)
(1+1) hydrofluoric acid (HF) (1+1) and H2SO4 (5+95) to dissolve the sample with different acid systems
composed of these acids Put 20 mL HCl into the first beaker By observing the solution in the beaker
the solution is cloudy with residue For the second beaker add HCl of the same volume as the first
beaker and 5 mL HNO3 The phenomenon of the solution is cloudy with residue For the third beaker
add HCl and HNO3 of the same volume as the second beaker and 10 mL HClO4 into the beaker By
observing the phenomenon of the reaction the solution is cloudy with residue For the fourth beaker put
20 mL HCl 10 mL HClO4 5 mL HF into the beaker The limestone sample is completely dissolved
And then put add HCl HNO3 and HClO4 of the same volume as the third beaker and 5 mL HF into the
fifth beaker the limestone sample is completely dissolved For the last beaker choose 20 mL HCl 10
mL HClO4 5 mL HF and 5 mL H2SO4 to dissolve the sample The solution is turbid
34 Procedure of color rendering
Whether the color rendering reaction can meet the requirements of the photometric method in addition
to mainly related to the nature of the chromogenic reagent it is also very important to control the con-
ditions of the color reaction The color rendering conditions mainly included the dosage of the chromo-
genic reagent and the acidity of the solution In order to make the color reaction as complete as possible
it is necessary to add an appropriate dosage of the chromogenic reagent If an excessive dosage of chro-
mogenic reagent is added it will cause side reactions which are not conducive to the measurement In
the experiment the appropriate dosage of the chromogenic reagent is obtained through related experi-
ments Most chromogenic reagents are organic weak acids The acidity of the solution affects the disso-
17
ciation of the chromogenic reagent and the completeness of the color rendering reaction Many chromo-
genic reagents are acid-base indicators The acidity of the solution will change the initial color of the
chromogenic reagent The acidity of the solution also has an effect on the composition and stability of
the colored complex
Three solutions need to be added in the color rendering experiment Firstly HCl needs to be added to
control the acidity of the solution Secondly ascorbic acid solution needs to be added to reduce Fe3+ to
ferrous iron (Fe2+) in the solution Because of the main interference element of this experiment is iron
So it is necessary to eliminate this interference by adding ascorbic acid solution Finally add DAPM for
color rendering reaction So before rendering colors the optimal dosage of these three solutions needs
to be found
The acidity of the solution affects the dissociation of the chromogenic reagent and the completeness of
the color rendering reaction Therefore maintaining the acidity of the solution is a prerequisite for start-
ing the color rendering experiment Determine the experiment steps of optimum dosage of HCl are as
follows take 10 mL of the test solution in 50 mL volumetric flask And then add 5 mL of ascorbic acid
solution and mix it well Place it for about 5 minutes Add 2 mL 4 mL 6 mL 8 mL 10 mL 12 mL 16
mL 20 mL HCl to 8 flasks respectively then add 7 mL of DAPM solution into each flask Dilute the
solution to the mark with water and mix it well Leave it for about half an hour at room temperature
Then put the chromogenic reagent into the spectrophotometer to measure the absorbance (detection
wavelength is 385 nm) It can be realized from TABLE 1 that the acidity in HCl medium has minimal
effect on the color rendering reaction During the analysis add 6 mL of 6 molL HCl to control the
normal concentration of about 113 N Normality (N) is defined as the number of equivalents per liter of
solution where definition of an equivalent depends on the reaction taking place in the solution For an
acid-base reaction the equivalent is the mass of acid or base that can furnish or accept exactly 1 mole of
proton (H+ ions) And this is based on the HCl concentration It can be seen from the absorbance value
in the last row of TABLE 1 that the acidity has little effect on the color rendering reaction in HCl medium
In the analysis process add 6 mL 6 molL HCl solution to control the normal concentration at 113 N
18
TABLE 1 Effect of acidity in HCl medium on color reaction
Flask1 Flask 2 Flask 3 Flask 4 Flask 5 Flask 6 Flask 7 Flask 8
HCl
(1+1) mL
2 4 6 8 10 12 16 20
Normal
concentration
(N)
065 089 113 137 161 185 233 290
Absorbance
L(gmiddotcm)
0185 0185 0185 0185 0185 0185 0185 0180
After determining the acidity of the solution the second problem to be determined is the optimal dosage
of ascorbic acid reagent Take several copies of 10 mL sample B solution with 0074 TiO2 content
add different amounts of ascorbic acid solution Then add 6 mL of HCl and 7 mL of DAPM for color
development and measure the absorbance by spectrophotometer (detection wavelength is 385 nm) The
absorbance values of different ascorbic acid dosages are shown in TABLE 2 The effect of adding
different volume of ascorbic acid on absorbance is shown in TABLE 2 The experimental results show
that when the dosage of ascorbic acid is between 3 mL and 15 mL the absorbance remains stable In
order to facilitate the operation and ensure complete reduction reaction we chose the dosage of ascorbic
acid to be 5 mL
TABLE 2 The absorbance values of different ascorbic acid dosages
Flask 1 Flask2 Flask3 Flask4 Flask5 Flask6
Ascorbic
acid (mL)
1 3 5 6 10 15
Absorbance
L(gmiddotcm)
0509 0514 0515 0515 0515 0515
After determining the dosage of the HCl and the ascorbic acid the third question is the optimal dosage
of DAPM Firstly take several copies of 5 mL sample B solution which content about 0074 of TiO2
and put the each solution into a 50 mL volumetric flask Secondly add 6 mL of HCl 5 mL of ascorbic
acid and different amounts of DAPM for color rendering reaction Finally measure the absorbance value
19
at 385 nm wavelength the experimental results are shown in the TABLE 3 From the experimental data
it can be seen that the absorbance of the DAPM chromogenic reagent is basically constant when it is
above 5 mL So the optimum dosage of the DAPM chromogenic reagent is 7 mL
TABLE 3 The dosage of DAPM experiment
Flask1 Flask2 Flask3 Flask4 Flask5 Flask6 Flask7 Flask8 Flask9
The dosage of
DAPM (mL)
2 3 4 5 6 7 8 9 10
Absorbance
L(gmiddotcm)
0226 0259 0282 0299 0231 0232 0232 0234 0233
Through the above three experiments (determine the optimal dosage of HCl ascorbic acid and DAPM)
the exact dosage of the three reagents in the color rendering experiment was determined The order and
steps of adding the three reagents are as follows firstly take 10 mL of TiO2 standard solution and put it
in a 50 mL volumetric flask Secondly add 5 mL of ascorbic acid solution mix it well Place the solution
for 5 minutes in the room temperature Then add 6 ml hydrochloric acid to mix the reagent evenly
Finally add 7 mL of DAPM into the solution Dilute the solution to the mark with water and mix it well
Leave it for 30 minutes in the room temperature and prepare to measure the absorbance
35 Procedure of the absorbance measuring
After the color rendering reaction is completed the test solution needs to be placed in a cuvette for
absorbance testing By changing the test wavelength the optimal wavelength is determined according
to the absorbance corresponding to each wavelength The absorbance at different wavelengths after color
development is shown in TABLE 4 It can be seen from the data that the wavelength has a maximum
value at 380-390 nm To ensure the best sensitivity the test wavelength is selected at 385 nm Under the
test of the maximum absorption wavelength the response of the instrument is more sensitive and the
measurement data is more accurate
20
TABLE 4 Optimal wavelength test data
Flask1 Flask2 Flask3 Flask1 Flask4 Flask5 Flask6 Flask7
Wavelength (nm) 360 370 380 385 390 400 410 420
Absorbance
L(gmiddotcm)
0499 0533 0547 0554 0543 0533 0502 0461
After determining the optimal wavelength use the spectrophotometer to analyze the content of TiO2 in
the sample firstly prepare the spectrophotometer and open the sample chamber cover Turn on the
power and the indicator lights up let the instrument warm up for 20 minutes Set the selector switch to
the T knob to display the number as 000 Secondly turn the wavelength knob to the 385 nm wave-
length and align the scale line Transfer the color rendering solution into a 3 cm cuvette and place it on
the colorimetric shelves And then close the sample chamber cover and adjust the light transmittance
100 T knob to make the number display as 1000 T Turn the selector switch to the A zero adjust-
ment knob the digital display should be 000 Then pull out the lever to put the solution to be measured
into the optical path and the digital display value is the absorbance A of the sample According to the
absorbance data it can be easily get the mass of TiO2 in the test solution After the measurement is
completed open the sample chamber cover and turn off the power switch
36 Interference test of calcium and magnesium ions
The main components of limestone are CaO and magnesium oxide (MgO) In order to determine whether
CaO or MgO has an effect on the determination of TiO2 Firstly prepare two standard solutions CaO
standard solution and MgO standard solution The content of CaO in the CaO standard solution is 10
mgL And the content of MgO in the MgO standard solution is 10 mgL Extract several parts from the
two prepared solutions and add a certain amount of TiO2 standard solution 4 mL (The amount of TiO2
added is 40 ug) to each part According to the method of 34 for color rendering the interference
experiment results of calcium ion and magnesium ion are as shown in TABLE 5 It can be seen from the
absorbance value in TABLE 5 that CaO and MgO have no effect on the determination of TiO2 There
was no difference in absorbance before and after adding CaO and MgO
21
TABLE 5 The interference experiment results of calcium ion and magnesium ion
Flask 1 Flask 2 Flask 3 Flask 4
The amount of TiO2 added 40 ug 40 ug 40 ug 40 ug
The amount of CaO added
(no MgO)
10 mg 20 mg 30 mg 40 mg
Absorbance L(gmiddotcm) 0551 0548 0550 0551
Flask 5 Flask 6 Flask 7 Flask 8
The amount of TiO2 added 40 ug 40 ug 40 ug 40 ug
The amount of MgO added
(no CaO )
10 mg 15 mg 20 mg 25 mg
Absorbance L(gmiddotcm) 0551 0550 0548 0551
22
4 RESULTS AND DISCUSSIONS
Through the acid system selection experiment the optimal selection of the spectrophotometerrsquos wave-
length experiment the optimal dosage of acidity selection experiment the optimal dosage of DAPM
selection experiment the optimal dosage of ascorbic acid selection experiment and the interference fac-
tors analysis experimental the accurate dosage of reagents was determined by these experiments Ac-
cording to the reaction phenomena or absorbance results of each experiment the corresponding experi-
mental results were obtained
In the acid system selection experiment the following conclusions can be drawn from the observation
of six experimental phenomena In the system of HF and HClO4 the sample is completely dissolved (the
precipitation is precipitated by adding H2SO4 the solution is turbid) but HClO4 and HF have a effect on
the determination of titanium and the fluoride ion is easy to complex with titanium And this
combination is likely to lead to the results on the low performance The presence of HClO4 can combine
with DAPM to produce white flocculent precipitate which led to the failure of the experiment In order
to eliminate the influence of insoluble residue to the analysis and ensure the sample is completely
dissolved The experiment uses the usual method which is anhydrous sodium carbonate and boric acid
system solvent mixed together for melting This method is simple and fast and the melting is complete
The acid system is relatively simple without introducing HClO4 acid HF acid and other kinds of acid
HCl is used to dissolve the sample and the sample dissolves quickly
In the optimal dosage of acidity selection experiment By observing the results of absorbance under
different acidity The best color acidity can be obtained add 6 mL of 6 molL HCl to control the color
acidity of solution In the optimal dosage of DAPM selection experiment through the absorbance test
results of solutions with different DAPM dosage It can be concluded from the data that the best dosage
of DAPM solution is 7 mL In the the optimal selection of the spectrophotometerrsquos wavelength
experiment according to the test results of absorbance of solution at different wavelengths it can be
concluded that the optimal wavelength is 385 nm In the optimal dosage of ascorbic acid selection
experiment through the absorbance test results of several solutions added with different volume of
ascorbic acid it can be concluded that the optimal dosage of ascorbic acid is 5 mL In the interference
factors analysis experimental it can be seen from the absorbance value in experiment results that CaO
and MgO have no effect on the determination of TiO2 By determining the accurate dosage of various
reagents a set of measurement steps with accurate actual dosage is formulated
23
41 Measurement results of titanium dioxide content
The content of TiO2 in three limestone samples was determined six times in parallel The analysis result
is rounded according to the rules of bankerrsquos rounding In order to avoid the phenomenon of big error
caused by rounding rules The specific method of data processing in this rule is as follows when the
mantissa is less than or equal to 4 the mantissa will be directly rounded off When the mantissa is greater
than or equal to 6 round off the mantissa and carry forward one digit When the mantissa is equal to 5
but the numbers after the mantissa are all 0 the previous digit of the mantissa should be used as a refer-
ence If the previous number is an odd number move one digit forward If the previous number is even
the mantissa is discarded If the mantissa is 5 but there is a number that is not 0 after the mantissa
whether the number before the mantissa is odd or even the number must move forward one bit
This experiment is carried out under the specified repeatability conditions the same experimental re-
searcher carries out the experiment uses the same instrument to carry out the experimental measurement
carries out the experiment under the same experimental conditions carries out the same calibration in a
short time TiO2 content is calculated according to the mass fraction WTiO2 calculation formula (1)
2
6
1
1
10100
TiO
mw
m V V
minus=
(1)
V1 The volume of the solution obtained separately from the sample solution The unit is milliliter (mL)
V Total volume of sample solution The unit is milliliter (mL)
m1 The quality of the titanium dioxide obtained separately from the sample solution The unit is mi-
crogram (μg)
m The quality of the sample The unit is gram (g)
The measurement results of the experiment are shown in the TABLE 6 The experimental data compared
with the TiO2 content in three limestone samples are shown in TABLE 7 For sample A the TiO2 content
obtained from the first and third experiments is basically consistent with the known accurate TiO2
content of sample A In addition to the second experimental data the accuracy of other experimental
data is good Compare with the other five groups of data the results of the second experiment have
relatively large errors For sample B the content of TiO2 obtained in the third experiment is almost the
same as the given value The TiO2 content measured in the fifth experiment is quite different from the
given value compared with the other five groups of data For sample C the TiO2 content obtained from
six experiments is almost the same as the given TiO2 content
24
TABLE 6 Experimental measurement data
Experiment
1
Experiment
2
Experiment
3
Experiment
4
Experiment
5
Experiment
6
Sample A
()
00412 00423 00409 00414 00416 00415
Sample B
()
00730 00750 00740 00765 00780 00735
Sample C
()
01250 01280 01290 01310 01240 01260
42 Accuracy of results discussion
From the average value of the data it can be seen that the accuracy of using the DAPM photometry to
determine the TiO2 content in limestone TABLE 7 is the average value of TiO2 content measured in six
experiments for each sample from TABLE 6 The second column is the certified value of the three
samples The mass fraction of TiO2 content in sample A is 0041 The mass fraction of TiO2 content
in sample B is 0074 The mass fraction of TiO2 content in sample C is 013 And the third column
is the average values which are obtained through experimental measurement and calculation As can be
seen from TABLE 7 The average value of TiO2 content in several groups of limestone samples meas-
ured by this experiment have high accuracy
TABLE 7 Average mass fraction of TiO2 content in limestone
Certified value Average value
Sample A () 0041 00414
Sample B () 0074 00750
Sample C () 0130 01272
HCl was used to dissolve the sample If HClO4 is used in the experiment it will form white flocculent
precipitate with DAPM which will affect the absorbance test If HF is used in the experiment fluorine
ions will complexate with titanium to form titanium fluoride complex which will affect the accuracy of
25
the experimental results If only HNO3 is used for decomposition except for incomplete decomposition
of the sample HNO3 also destroys DAPM thus affecting the continuation of the experiment According
to the dissolution treatment experiment and acidification experiment the HCl system is relatively simple
without the introduction of HClO4 HF and other types of acids And the sample dissolves quickly by
HCl leaching
In the experiment of determine the optimal dosage of DAPM solution it can be concluded that the
optimal dosage of DAPM is 7mL When the amount of DAPM is more than 6 mL the absorbance tends
to be stable If the flux of DAPM does not reach 6 mL the color reaction will be incomplete which will
affect the whole experiment For the selection of the amount of ascorbic acid ascorbic acid is used to
reduce Fe3+ in the solution to Fe2+ In order to eliminate the interference 5 mL ascorbic acid was selected
to reduce Fe3+ in the sample If the amount of ascorbic acid is less than 5 mL the remaining unreduced
Fe3+ will affect the accuracy of the whole experiment
In this experiment temperature and time have influence on the measurement results In 15-80 the
absorbance value is not affected by temperature However if the iron content in the sample is high and
the temperature is higher than 60 the solution is easy to be turbid and unable to compare colors
Therefore this experiment uses 15-30 room temperature to render color The color solution is very
stable and can be maintained for several months When the room temperature is higher than 20 it
tends to be stable after 20 minutes of color development When the room temperature is lower than 20
it needs 40-60 minutes to be stable In this color rendering experiment the accuracy of temperature
control is particularly important
When selecting the optimal wavelength of the test absorbance the wavelength corresponding to the
maximum absorbance is selected according to the absorption curve of the test solution In this experiment
when the wavelength is 385 nm the absorbance changes with the concentration in the largest range so
the determination is the most sensitive The absorption curve is an important basis for choosing the
wavelength of incident light in quantitative analysis In the wavelength selection experiment if the
wavelength corresponding to the maximum absorbance is not selected the accuracy of the experiment
will be insufficient
26
5 CONCLUSION
In this experiment the DAPM photometric method was used to determine the content of TiO2 The
sample is melted by sodium carbonate-boric acid mixed flux and leached with dilute HCl The experi-
ment used ascorbic acid as a masking agent to reduce Fe3+ to Fe2+ in the solution to eliminate interference
In this experiment DAPM solution was added to render the solution color In order to ensure the accu-
racy of the experimental results the amount of various reagents was optimized The following five as-
pects were quantitatively analyzed in the experiment optimal selection of the spectrophotometerrsquos
wavelength the optimal dosage of acidity the optimal dosage of DAPM the optimal dosage of ascorbic
acid and the interference factors analysis The exact dosage of each reagent was determined The TiO2
content measured in the experiment was compared with limestone with known accurate TiO2 content
The accuracy of the measurement can be seen in this experiment This experimental method has a perfect
effect on the use of spectrophotometers and promotes the determination of mineral raw materials con-
taining low TiO2 content by spectrophotometer
For the measurement results of the experiment there is a certain error between the TiO2 content meas-
ured in this experiment and the TiO2 content given in the limestone sample Through the interference
element analysis experiment it is determined that the two main components of limestone (MgO and
CaO) are not the cause of this error For several values with slightly poor accuracy there may be some
problems in the operation of the experiment The most likely reason for the poor accuracy of the data is
that after the sample dissolves the color reaction does not wait until the solution cools to room temper-
ature Another possibility is that the limestone sample is not well preserved resulting in a certain error
between the actual TiO2 value and the given value In the future experiments the above two error aspects
are further studied to ensure that the measurement method is accurate and the measurement results are
more accurate
Compared to ammonium ferric sulfate volumetric method and H2O2 coordination titration method
DAPM photometric method has high accuracy and eliminates the interference of vanadium molyb-
denum tungsten copper arsenic and other elements to the experiment Compared to ICP-AES method
DAPM photometric method is simple in operation and suitable for popularization and application The
results of the project provided a technical method for accurately and quickly determining the content of
TiO2 in limestone
27
REFERENCES
Bo H Xiaomei W amp Tao Y 2015 The development and application of X-Ray fluorescence
spectrometer Nuclear Electronics amp Detection Technology 1307-1311
Chen C 2005 Determinition of TiO2 in mine with diantipyrylmethane spectrophotometry Tian jing
Metallurgy 43(4) 9-10
Chen Z 2009 Research and Fabrication of Opto-mechanical Systems of New UV Spectrophotometer
Chu N Li W amp Jiang X 2014 Determination of major and minor compoments in limestone by
wavelength dispersive X-ray fluorescence spectrometry with fusion sample preparation Metallurgical
analysis 34(10) 37-41
Chu Y 1983 Development of X-ray fluorescence spectrometer DOI 10 13595 j cnki issn1000 -
0720 1983 0062
Deng J 2016 Determination of Titanium Dioxide in Titanium Slag by Diantipyrylmethane
Spectrophotometry Physico-ChemistryampChemical-Chemistry 52(1) 37-40
Deng J 2020 Determination of Titanium in Titanium Ferroalloy by Spectrophotometry with
Diantipyrylmethane Angang technology 2(1) 36-39
Du M 2017 Simultaneous determination of Fe Al Ca Mg K Na Ti in limestone by inductively
coupled plasma atomic emission spectrometry with microwave digestion Metallurgical Analysis
26(4) 30
Jin L Meng H amp Yinglin D 2008 Determining titanium dioxide in ores by ICP-AES Jilin
geology 27(1) 83-85
Khavar A amp Asadollahzadeh H 2020 Preconcentration and determination of nickel (Ⅱ)and
copper(Ⅱ) ions Elsevier Inc DOI101016jjfca2020103457
Li C 2006 Determination of SiO2 Cao MgO Al2O3 Fe2O3 and P2O5 in limestone and dolomite by
XRF melting method Shandong Metallurgy 28(6) 10-14
Li H 2005 Diantipyric methane spectrophotometric determination of titanium in magnesium
chloride Journal of environmental management college of China 15(3) 113-114
Liu X Zhong Y amp Song H 2011 Synthesis of Diantipyrylmethane aromatic ring derivatives and
its application in photometric analysis Jiangxi Nonferrous Metals 15 30-35
Mohamed E amp Hassan A 2015 Characterization of visiblelight activated TiO2 catalysts and their
photocatalytic performance study Huazhong Agricultural University 4-16
Pan X 2015 Development Trend of Ultraviolet Spectrophotometer Science and Technology amp
Innovation(14) 19-21
Peng X 2012 Study on spectrum analytical system of visible spectrometer Tianjin University 3-12
28
Shao H 2001 Determination of chloride ion in copper electrolyte by potentiometric titration
metallurgical analysis 21(4) 64-65
Song X 2006 Determination of titanium dioxide in vanadic titanomagnetite by hydrogen peroxide
Spectrophotometry Metallurgical Analysis 26(3)
Sunil R amp Kalpana C 2011 Synthesis of diarypyrimidinones (DAPMs) using large porezeolites
Journal of molecular catalysis 210-215
Wang R Yan W amp Zhu X 2013 Methods for chemical analysis of limestone quicklime and
hydrated lime for building materials Cement(4) 49-50
Wang H 2010 Discussion on the principle and maintenance of ICP- AES Electronic product
reliability and environmental testing 28(4) 60-63
Xu C Wang Q Xu W Dai M amp Qi 2020 Trouble shooting of inductively coupled plasma
atomic emission spectrometer Metallurgical analysis 40 66-71
Xu C Wang Q amp Xu W 2020 Fault analysis and treatment of inductively coupled plasma atomic
emission spectrometer Metallurgical analysis 40(2) 66-71
Yang Z 2008 Simultaneous quantification measurement of SiFeTiCaMgZr in corundum by
inductively coupled plasma-atomic emission spectrometry with secondary-melting method Rock
and mineral analysis 31(2)
Zhang J 2019 Discussion on the determination of TiO2 by Diantipyrylmethane Spectrophotometry
Chemical enterprise management(1) 45-46
Zhi P 1999 Development and application of biochemical instruments Telecommunication
Engineering 6(2)
Zhang Q 2009 Determination of Al2O3 CaO Fe2O3 MgO MnO SiO2TiO2 in Limestone and
Dolomite by ICP-AES Analysis and testing technology and instruments 15(3) 179-181
3
2 DETERMINATION OF TITANIUM DIOXIDE IN INDUSTRIAL RAW MATERIALS
For the determination of TiO2 in alloys ores or other industrial raw materials there are several detection
methods in the world such as titration detection method XRF detection method ICP-AES detection
method and DAPM spectrophotometry In the experimental for the determination of TiO2 by ammonium
ferrate volumetric method the experiment needs to be carried out in hydrochloric acid (HCl) or sulfuric
acid medium (H2SO4) TiO2+ is reduced to titanium ion (Ti3+) by metal aluminum sheet Potassium thi-
ocyanate is used as indicator and titrated with standard solution of ammonium ferrate sulfate Vanadium
tin molybdenum tungsten copper arsenic and other elements will interfere with the experimental re-
sults These elements will be fully or partially reduced to a low valence state together with TiO2+ and
then oxidized by high iron to produce high results (Juan 2019 45)
In the determination of TiO2 by H2O2 coordination-bismuth salt solution back titration method Firstly
adding appropriate amount of H2O2 to the solution which containing TiO2+ will form a yellow complex
And then adding excessive Ethylene Diamine Tetraacetic Acid (EDTA) to make it a more stable ternary
complex The remaining EDTA was titrated with bismuth salt solution to xylenol orange as indicator
This method is often used for samples of high titanium content Although titrimetric analysis has low
requirements for instruments and equipment its accuracy is poor and its application range is narrow In
the experiment of TiO2 sample determination by ICP-AES the inductively coupled plasma-atomic emis-
sion spectrometer was used to determine the content of TiO2 This method is fast accurate highly sen-
sitive and has good stability but the large instruments used are expensive This method is difficult to
widely promote and apply The advantages of DAPM photometry are as follows it avoids tedious ex-
perimental steps it can be used as a very practical analysis method in scientific research detection and
it can be widely used in the determination of TiO2 in steel alloys and mineral raw materials Compared
with other detection methods the DAPM spectrophotometry is more simple the detection speed is faster
and the repeatability of the experimental is good (Juan 2019 45)
21 Spectrophotometer
A spectrophotometer is a scientific instrument that breaks light with complex composition into spectral
lines The measurement range generally includes the visible light region with a wavelength range of 380-
780 nm and the ultraviolet light region with a wavelength range of 200-380 nm Different light sources
have their own unique emission spectrum so different luminous bodies can be used as the light source
4
of the instrument The emission spectrum of tungsten lamp is formed in this way After refracting the
spectrum light of 380-780 nm wavelength emitted by tungsten lamp light source through a prism a
continuous color spectrum composed of red orange yellow green blue indigo and violet can be ob-
tained The color spectrum can be used as the light source of the visible light spectrophotometer
(Xiaohua 2012 6)
Ultraviolet spectrophotometer is based on the absorption spectrum of substances to study the composi-
tion structure and interaction of substances The ultraviolet spectrophotometer can arbitrarily choose
different wavelengths of light in the ultraviolet visible region The absorption spectrum of a substance
is that the molecules and atoms in the substance absorb the light energy of certain specific wavelengths
in the incident light The molecular vibrational energy level transition and the electronic energy level
transition occur accordingly All kinds of substances have their own different molecules atoms and
different molecular space structures Their absorption of light energy is different Therefore each sub-
stance has its own unique and fixed absorption spectrum curve The absorbance at certain characteristic
wavelengths on the spectrum can be used to distinguish or determine the content of the substance Ul-
traviolet spectrophotometry is based on Lambert-Beer law According to Lambert-Beer law A = εbc
(A is the absorbance ε is the molar absorption coefficient b is the thickness of the liquid cell and c is
the concentration of the solution) This law can be used to analyze the solution quantitatively (Mohamed
amp Hassan 2015 4)
There are many types of ultraviolet visible (UV-vis) spectrophotometers but their basic structures are
similar The UV-vis spectrophotometers are composed of five parts light source monochromator ab-
sorption cell detector and signal display system The structure of the ultraviolet spectrophotometer is
shown in FIGURE 1 The light source is a device to provide the incident light that meets the requirements
The common light source in the visible light area of the UV-vis spectrophotometer is tungsten lamp and
the common light source in the UV-vis light area is hydrogen lamp or deuterium lamp Tungsten lamp
is the most commonly used visible light source It can emit a continuous spectrum of 325-2500 nm and
the most suitable wavelength range is 320-1000 nm Therefore it can also be used as near-infrared light
source Deuterium lamp is the most commonly used ultraviolet light source It emits light with a wave-
length range of 190-400 nm and the wavelength range is generally 190-360 nm The second part of the
UV-vis spectrophotometer is monochromator which decomposes the continuous spectrum of the light
source into monochromatic light and can accurately and conveniently select the optical device of a cer-
tain wavelength needed It is the heart of the photometer Monochromator is mainly composed of slit
dispersion element and lens system The dispersion element is the main part of monochromator The
5
most commonly used dispersion elements are prism grating or a combination of the two The dispersive
element is shown in the FIGURE 1 It is a combination of prism and grating (Xiaojing 2015 19-20)
The absorption tank is a vessel used to hold the liquid to be measured and determine the thickness of the
transparent liquid layer of the solution to be measured also known as a cuvette Generally speaking the
absorption tank is a cuboid which also has a circle or other shapes The absorption tank in FIGURE 1
is a cuboid The bottom and both sides of the absorption tank are ground glass and the other two sides
are optical light transmitting surfaces According to the material of the light transmitting surface the
absorption tank can be divided into two types glass absorption tank and quartz absorption tank The
glass absorption cell is used for the determination of visible light area and the quartz absorption cell is
used for the determination of ultraviolet light area The specification of absorption tank is marked by
optical path The commonly used specifications of absorption cell are 05 cm 10 cm 20 cm 30 cm
50 cm The detector is a device that converts an optical signal into an electrical signal When measuring
the absorbance it is not to directly measure the light intensity through the absorption cell but to convert
the light intensity into a current for measurement This photoelectric converter is called a detector Signal
display is a device to amplify and display the output signal of detector The new spectrophotometer is
displayed by digital voltmeter and the absorbance curve is drawn directly by recorder The new spec-
trophotometer is equipped with computer data processor (Xiaojing 2015 19-20)
FIGURE 1 The structure of ultraviolet spectrophotometer (adapted from Xiaojing 2015 19)
6
22 Diantipyryl methane spectrophotometry
DAPM is white flake crystals It is insoluble in water ether and alkali But it is soluble in acid ethanol
and chloroform DAPM is soluble in acids and forms complex organic cations with acids The solution
of DAPM is colorless and it reacts with Ti3+ to form yellow complexes DAPM can be used as a sensitive
color reagent for the determination of Ti3+ iridium iron molybdenum neodymium uranium iridium
platinum rhenium It can also be used as an extractant for various ions The molecular formula of DAPM
is C23H24N4O2H2O The molecular structure of DAPM is shown in FIGURE 2
FIGURE 2 The molecular structure of DAPM (adapted from Liu Zhou amp Song 2011 31)
The UV-vis absorption spectrum of molecules is a common spectral analysis method based on the ab-
sorption spectrum generated by the intramolecular electronic transition When a material is irradiated by
light the material molecules will collide with the light As a result the energy of photons is transferred
to the molecules In this way the stable ground state molecules will jump to the unstable high energy
state This is the absorption of the light The qualitative analysis of UV-Vis absorption spectrum is based
on the fact that the shape of absorption curve of light to the same absorption material is different the
maximum absorption wavelength is the same but the corresponding absorption rate is different There
are three properties of UV-vis absorption spectrum the first is that the same concentration of the test
solution has different absorbance for different wavelengths of light The second point is that the higher
the concentration of the same test solution the higher the absorbance Finally the smaller the concen-
tration of the same substance the same wavelength (maximum absorption wavelength λ max) corre-
sponding to the maximum absorption peak and the same curve shape The absorbance tested results of
yellow complex formed by titanium and DAPM by DAPM spectrophotometry are shown in FIGURE 3
The shape of the absorption curve can be seen from FIGURE 3 The abscissa in the chart is the wave-
length the unit of wavelength is nm The ordinate is the absorbance and the unit of absorbance is
L(g middot cm) The absorbance reaches the maximum value at the wavelength of 390 nm In the vicinity of
7
the maximum wavelength the closer to the maximum range of the spectrophotometer the greater the
sample absorbance and the smaller the error brought by the photometer itself (Junhua 2020 38)
FIGURE 3Absorbance values at different wavelengths (adapted from Junhua 2020 38)
After consulting the literatures on the determination of TiO2 by DAPM Spectrophotometry It can be
founded that the measurement method is essentially similar The specific method is as follows Firstly
the sample needs to be decomposed the sample is placed in a platinum crucible and mixed flux (lime-
stone samples with accurate TiO2 content) is added to mix with the sample Heat the crucible at high
temperature (950-1000 ) take it out and cool it then add acid to dissolve the sample After that transfer
the solution to a volumetric flask to constant volume and blend well After transferring the solution add
ascorbic acid HCl DAPM solution put it into the spectrophotometer to measure the absorbance Finally
record the data and calculate the result (Junhua 2016 39)
23 Inductively coupled plasma atomic emission spectrometry
ICP-AES has the advantages of high accuracy and precision low detection limit fast determination
wide linear range and simultaneous determination of multiple elements It has been widely used in de-
termination of dozens of elements in environmental samples and samples of rocks minerals metals
Plasma is ionized gas with an ionization degree exceeding 01 This gas contains not only neutral
atoms and molecules but also a large number of ions and electrons (Haiyan 2010 62)
8
ICP-AES is based on the spectrum emitted by atoms to determine the chemical composition of a sub-
stance Different substances are composed of atoms of different elements and the atoms all contain a
densely structured nucleus The nucleus is surrounded by moving electrons Each electron is at a certain
energy level and has a certain energy Atoms are in a stable state under normal circumstances This state
is called the ground state When the atoms are transformed into gaseous atoms under the action of exter-
nal energy the outer electrons of the gaseous atoms are excited to a high energy state When transitioning
from a higher energy level to a lower energy level the atoms will release excess energy and emit char-
acteristic lines ICP-AES disperse the generated radiation through the instrument and record it on the
photosensitive plate in the order of wavelength which can show regular spectral lines The perform
quantitative analysis based on the obtained spectrum ICP-AES is a new type of light source that is
developing rapidly and is highly valued in the analysis of emission spectrum (Haiyan 2010 62)
ICP-AES consists of sample introduction system ICP light source dispersion system and detection sys-
tem And equipped with computer control and data processing system cooling system gas control sys-
tem ICP light source consists of high frequency power supply and ICP torch tube The ICP torch tube
consists of three concentric quartz tubes and a high-frequency induction ring (generally 2-4 rings of
hollow copper tubes) surrounded by the upper part of the tube There are three intake tubes A 10-20
Lmin argon gas is passed between the quartz outer tube and the intermediate tube Its function is to form
plasma as working gas and cool the quartz torch tube which is called plasma gas or cooling gas The
intermediate tube and the central tube are filled with 05-15 Lmin argon to become auxiliary gas which
is used to assist the formation of plasma After the plasma torch is formed it can be turned off The
carrier gas in the central tube is used to introduce the sample aerosol (Xu Wang amp Xu 2020 67)
The formation of ICP torch is called ignition The ignition is divided into three steps the first step is to
introduce plasma and auxiliary gas into the outer tube and the middle tube At present the central tube
is not connected with gas and an argon atmosphere is established in the torch tube The second step is
to connect the high-frequency power supply to the induction coil The general frequency is 7-50 mhz
and the power supply is 1-15 kw At present there is high-frequency current and high-frequency elec-
tromagnetic field generated by the coil The third step is to ionize the working gas flowing in the middle
by means of high frequency spark and then the ions and electrons produced will interact with the fluc-
tuating magnetic field produced by the induction coil This interaction causes the ions and electrons in
the coil to flow along the closed loop in the figure Their resistance to this movement causes ohmic
9
heating Because of the high temperature generated by the strong current the gas is heated to form a
torch like plasma (Xu et al 2020 67)
Aerosol injection system is a commonly used method at present The sample introduction system con-
sists of two main parts sample lifting part and atomization part The sample lifting part is generally a
peristaltic pump and a self-lifting atomizer can also be used It is required that the speed of the peristaltic
pump is stable and the elasticity of the pump pipe is good so that the sample solution can be pumped in
at a constant speed and the waste liquid can be discharged smoothly The atomizing part includes atom-
izer and atomizing chamber After the sample enters the atomizer by means of pump or self-lifting small
droplets are formed under the action of carrier gas and enter the atomization chamber The large droplets
are eliminated when they touch the wall of the atomization chamber Only small droplets can enter the
plasma source (Xu et al 2020 68) For the optical system the monochromator of ICP-AES usually
adopts the combination of grating or prism and grating And for the detection system the detection
system of ICP-AES is a photoelectric converter which uses photoelectric effect to convert the radiation
energy of different wavelengths into electrical signals (Xu et al 2020 68)
As a conventional chemical analysis technology ICP-AES has a wide range of applications in biological
samples materials geology environmental protection metallurgy and other fields In the field of met-
allurgical analysis such as steel raw materials and ferroalloys it is required to measure dozens to hun-
dreds of samples at a time And each sample must simultaneously analyze dozens of elements such as
Mn Cu Al Cr Si P Ni Ti V Nb W Ca Mg It can show the absolute advantages of ICP in terms of
work efficiency In the analysis of standard materials especially the low-value fixed-value analysis of
rare earth elements the accuracy of ICP data and the simplicity of operation are fully utilized (Haiyan
2010 62) The disadvantage of the ICP-AES method is that the equipment and operating costs are rela-
tively high The sample generally needs to be converted into a solution in advance and the determination
of some elements is not obvious such as sodium (Na) and potassium (K) (Juan 2019 46)
24 Titration analysis
There are generally two types of titration analysis to determine the content of TiO2 in the sample Am-
monium ferric sulfate volumetric method and H2O2 coordination titration The specific steps of ammo-
nium ferrate sulfate volumetric method are as follows firstly reduction of TiO2+ to Ti3+ with metal
10
aluminum tablets in HCl or H2SO4 medium And then using potassium thiocyanate as an indicator Fi-
nally titration with standard solution to ammonium ferrate sulfate The method has poor sensitivity and
selectivity But there are interference elements such as vanadium tin molybdenum tungsten copper
and arsenic that affect the experimental results These elements and TiO2 are completely or partially
reduced to a low valence state and these elements are oxidized by ferric ions (Fe3+) Leading to errors
in the experimental results (Juan 2019 46)
The specific steps of H2O2 coordination titration are as follows firstly the yellow complex will be form
by adding an appropriate amount of H2O2 to a solution which containing TiO2+Then add excess EDTA
to the solution (EDTA is a good complexing agent in chemistry It has six coordination atoms The
complex formed is called chelate EDTA is often used in coordination titration to determine the content
of metal ions In biological application it is used to exclude most transition metal elements For example
it is used to exclude the interference of iron ion nickel ion and manganese ion in the experiment) Make
it form a more stable ternary complex The remaining EDTA was titrated with xylenol orange as indica-
tor For the back titration with bismuth salt solution method when the reaction is slow or the reactant is
solid add a certain amount of titration solution Normally the reaction cannot be completed immediately
At this time a certain amount of excess titrating solution can be added first to accelerate the reaction
After the reaction is completed titrating the remaining titrant with another standard solution This
method is mostly used for samples with high titanium content Although the titration analysis method
does not have high requirements for instruments and equipment but the accuracy of the measurement
results is poor and the scope of use is narrow (Juan 2019 46)
25 X-ray fluorescence spectrometry
People usually irradiate X-rays on substances to produce secondary X-rays called XRF The X-rays used
for irradiation are called primary X-rays XRF is still X-ray XRF spectrometer is mainly composed of
excitation dispersion detection recording and data unit The role of the excitation unit is to generate
primary X-rays It consists of high-voltage generator and X-ray tube The role of the dispersion unit is
to separate X-rays of the desired wavelength It consists of sample chamber slit goniometer analysis
crystal and other parts The role of the detector is to convert X-ray photon energy into electrical energy
The recording unit is composed of an amplifier a pulse amplitude analyzer and a display part X-ray
tube generates incident X-rays to excite the tested sample Each element in the excited sample emits
11
secondary X-rays and the secondary X-rays emitted by different elements have specific energy charac-
teristics or wavelength characteristics The detection system measures the energy and quantity of these
emitted secondary X-rays The instrument software converts the information collected by the detection
system into the types and contents of various elements in the sample By using the principle of X-ray
fluorescence every element after beryllium in the periodic table can be measured theoretically In prac-
tical applications the effective element measurement range is element 9 (F) to element 92 (U) in the
periodic table (Chu Li amp Jiang 2014 40)
The characteristic X-ray energy and wavelength emitted by different elements are different Therefore
no matter what kind of element can be detected by measuring the energy or wavelength of X-ray At the
same time the characteristic X-ray intensity of an element emitted after the sample is excited It is related
to the content of this element in the sample so the quantitative analysis of the element can be performed
by measuring its intensity There are two basic types of XRF spectrometers wavelength dispersive spec-
trometer and energy dispersive spectrometer The structure of the instrument is shown in FIGURE 4
12
FIGURE 4 Wavelength dispersive spectrometer and energy dispersive spectrometer (adapted from Bo
Xiao amp Tao 2015 1308)
With the development of instrument technology and theoretical methods the application range of XRF
analysis is very widely In the analysis of the composition of substances in the metallurgy geology
chemical industry machinery petroleum building materials and other industrial sectors agriculture and
medicine and health as well as physics chemistry biology geoscience environment astronomy and
archaeology and other research departments have been widely applications (Chu et al 2014 37)
13
26 Hydrogen peroxide photometry and ferrotitanium spectrophotometry
H2O2 is a colorless odorless liquid with bitter taste and easy to decompose into water and oxygen It is
a strong oxidant H2O2 is often used for sterilization in the workplace starch whitening in the industry
or as a strong oxidant for food or food packaging and liquid fuel propellant In this method phosphoric
acid (H3PO4) and H2SO4 were used to dissolve the sample In the medium of 5 H2SO4 by volume
TiO2+ and H2O2 formed a yellow complex ion in the acidic condition The stable equilibrium constant
of the complex is k = 10 times 104 and the maximum absorption wavelength is λmax = 405 nm H2O2
spectrophotometry is simple and rapid but its sensitivity and selectivity are poor Sodium catechol-35
sulfonate forms a yellow complex with titanium at pH = 47-49 Ferrotitanium reagent has high sensi-
tivity and can be used for the continuous determination of trace titanium and iron (Xinyan 2006 66)
14
3 EXPERIMENT
There are three main experimental steps sample decomposition color rendering and absorbance exper-
iment which are studied and developed extensively in this project The detail procedures of both topics
will be fully displayed Besides some important choices of chemical reagents during the experiment
will be explained by five variable value optimization experiments optimal selection of the spectropho-
tometerrsquos wavelength the optimal dosage of acidity the optimal dosage of DAPM the optimal dosage
of ascorbic acid and the interference factors analysis experimental
31 Reagents and reagents preparation
The reagents used in the experiment are as follows mixed flux grind from anhydrous sodium sulfate
and boric acid potassium pyrosulfate HCl with a density of 119 gmL H2SO4 with a density of 184
gmL HCl (1+1) ((1+1) is the solution which mix 1 ratio of HCl with 1 ratio of water in volume The
molar concentration of HCl (1+1) is 6 molL) H2SO4 (5+95) ((5+95) is the solution which mix 5 ratio
of H2SO4 with 95 ratio of water in volume The molar concentration of H2SO4 (5+95) is 09 molL)
ascorbic acid solution (20 gL) DAPM solution (50 gL) TiO2 stock solution (100 μgmL) and TiO2
standard solution (10 μgmL)
The preparation steps for ascorbic acid solution (20 gL) are as follows weigh 20g of ascorbic acid add
200-300 mL of water to dissolve the sample and stir evenly After the ascorbic acid is completely dis-
solved transfer the solution to a 1 L volumetric flask and make up to volume The preparation steps of
the TiO2 stock solution (100 μgmL) are as follows weigh 01 g of TiO2 and place it in a platinum
crucible and then add 5-7 g of potassium pyrosulfate Put them into a high-temperature furnace raise
the temperature to 600 deg C to melt Use 60 mL H2SO4 to dissolve the melt After it cooling to room
temperature transfer it to a 1000 mL volumetric flask diluted with H2SO4 to the mark and mixed fully
The preparation of the TiO2 standard solution (10 μgmL) are as follows add 50mL of TiO2 stock solu-
tion to a 500 mL volumetric flask And then add H2SO4 to constant volume and mix it well
Three instruments are used in this experiment platinum crucible (The volume needs to be greater than
30 mL) high temperature furnace (The crucible heating temperature is suitable for 100-1100 ) and
UV-vis spectrophotometer (1000 nm ge wavelength ge 180 nm) Before using the spectrophotometer
15
connect the spectrophotometer to the power supply turn on the instrument switch lift the lid of the
sample chamber and preheat the sample chamber for 10 minutes
32 Experimental procedure
Before the experiment the preparation of reagents and the commissioning of equipment need to be com-
pleted The preparatory work includes preparation of ascorbic acid solution (20 gL) preparation of
DAPM solution (50 gL) preparation of TiO2 stock solution (100 μgmL) and preparation of TiO2 stand-
ard solution (10 μgmL) After the reagent preparation is completed proceed to the second step as shown
in FIGURE 5 Dissolve the sample after weighing it Thirdly render the color of the sample solution
The fourth step is measure the absorbance of the developed solution by spectrophotometer And finally
record and process the experimental data
FIGURE 5 The experimental procedure of measuring titanium dioxide content in limestone by dianti-
pyryl methane photometry
33 Procedure of sample decomposition
In this experiment the samples selected three limestones with known accurate TiO2 content The TiO2
content (mass fraction) of sample A is 0041 the TiO2 content (mass fraction) of sample B is 0074
and the TiO2 content (mass fraction) of sample C is 013 The purpose of these accurate data is to
make a precision comparison with the data measured in this experiment and verify the accuracy of the
experimental method A total of three sets of experiments were conducted and each set was measured 6
times
The sample decomposition steps are as follows take 02 g limestone (crumb limestone) sample into a
platinum crucible add 5 g mixed flux (anhydrous sodium carbonate and boric acid) Secondly place the
platinum crucible in a high-temperature furnace and gradually increase the temperature to 950-1000
Weighing of
samplesamp
reagents
preparation
Sample
decomposition
Color
rendering
Absorbance
experiment
Experimental
data recording
16
After the sample is melted take it out and cool it to room temperature Thirdly put the crucible in the
250 mL beaker together with the sample and add HCl into the beaker Finally heat the beaker at around
75 to make the solution transparently After cooling to room temperature dilute the solution to 100
mL with water (Wang Yan amp Zhu 2013 49) During the experiment HCl is used to dissolve the sample
The choice of acid type needs to be determined through the phenomenon of sample dissolution in dif-
ferent acid systems Through experiments of dissolving samples in various acid systems the results can
be obtained the most suitable acid for dissolving limestone
For the optimal selection of the dosage and the type of acid to dissolve the sample the experimental
procedure is as follows select 025 g of limestone sample B with a TiO2 content of 0074 and place
it in 6 polytetrafluoroethylene beakers Add HCl (1+1) nitric acid (HNO3) (1+1) perchloric acid (HClO4)
(1+1) hydrofluoric acid (HF) (1+1) and H2SO4 (5+95) to dissolve the sample with different acid systems
composed of these acids Put 20 mL HCl into the first beaker By observing the solution in the beaker
the solution is cloudy with residue For the second beaker add HCl of the same volume as the first
beaker and 5 mL HNO3 The phenomenon of the solution is cloudy with residue For the third beaker
add HCl and HNO3 of the same volume as the second beaker and 10 mL HClO4 into the beaker By
observing the phenomenon of the reaction the solution is cloudy with residue For the fourth beaker put
20 mL HCl 10 mL HClO4 5 mL HF into the beaker The limestone sample is completely dissolved
And then put add HCl HNO3 and HClO4 of the same volume as the third beaker and 5 mL HF into the
fifth beaker the limestone sample is completely dissolved For the last beaker choose 20 mL HCl 10
mL HClO4 5 mL HF and 5 mL H2SO4 to dissolve the sample The solution is turbid
34 Procedure of color rendering
Whether the color rendering reaction can meet the requirements of the photometric method in addition
to mainly related to the nature of the chromogenic reagent it is also very important to control the con-
ditions of the color reaction The color rendering conditions mainly included the dosage of the chromo-
genic reagent and the acidity of the solution In order to make the color reaction as complete as possible
it is necessary to add an appropriate dosage of the chromogenic reagent If an excessive dosage of chro-
mogenic reagent is added it will cause side reactions which are not conducive to the measurement In
the experiment the appropriate dosage of the chromogenic reagent is obtained through related experi-
ments Most chromogenic reagents are organic weak acids The acidity of the solution affects the disso-
17
ciation of the chromogenic reagent and the completeness of the color rendering reaction Many chromo-
genic reagents are acid-base indicators The acidity of the solution will change the initial color of the
chromogenic reagent The acidity of the solution also has an effect on the composition and stability of
the colored complex
Three solutions need to be added in the color rendering experiment Firstly HCl needs to be added to
control the acidity of the solution Secondly ascorbic acid solution needs to be added to reduce Fe3+ to
ferrous iron (Fe2+) in the solution Because of the main interference element of this experiment is iron
So it is necessary to eliminate this interference by adding ascorbic acid solution Finally add DAPM for
color rendering reaction So before rendering colors the optimal dosage of these three solutions needs
to be found
The acidity of the solution affects the dissociation of the chromogenic reagent and the completeness of
the color rendering reaction Therefore maintaining the acidity of the solution is a prerequisite for start-
ing the color rendering experiment Determine the experiment steps of optimum dosage of HCl are as
follows take 10 mL of the test solution in 50 mL volumetric flask And then add 5 mL of ascorbic acid
solution and mix it well Place it for about 5 minutes Add 2 mL 4 mL 6 mL 8 mL 10 mL 12 mL 16
mL 20 mL HCl to 8 flasks respectively then add 7 mL of DAPM solution into each flask Dilute the
solution to the mark with water and mix it well Leave it for about half an hour at room temperature
Then put the chromogenic reagent into the spectrophotometer to measure the absorbance (detection
wavelength is 385 nm) It can be realized from TABLE 1 that the acidity in HCl medium has minimal
effect on the color rendering reaction During the analysis add 6 mL of 6 molL HCl to control the
normal concentration of about 113 N Normality (N) is defined as the number of equivalents per liter of
solution where definition of an equivalent depends on the reaction taking place in the solution For an
acid-base reaction the equivalent is the mass of acid or base that can furnish or accept exactly 1 mole of
proton (H+ ions) And this is based on the HCl concentration It can be seen from the absorbance value
in the last row of TABLE 1 that the acidity has little effect on the color rendering reaction in HCl medium
In the analysis process add 6 mL 6 molL HCl solution to control the normal concentration at 113 N
18
TABLE 1 Effect of acidity in HCl medium on color reaction
Flask1 Flask 2 Flask 3 Flask 4 Flask 5 Flask 6 Flask 7 Flask 8
HCl
(1+1) mL
2 4 6 8 10 12 16 20
Normal
concentration
(N)
065 089 113 137 161 185 233 290
Absorbance
L(gmiddotcm)
0185 0185 0185 0185 0185 0185 0185 0180
After determining the acidity of the solution the second problem to be determined is the optimal dosage
of ascorbic acid reagent Take several copies of 10 mL sample B solution with 0074 TiO2 content
add different amounts of ascorbic acid solution Then add 6 mL of HCl and 7 mL of DAPM for color
development and measure the absorbance by spectrophotometer (detection wavelength is 385 nm) The
absorbance values of different ascorbic acid dosages are shown in TABLE 2 The effect of adding
different volume of ascorbic acid on absorbance is shown in TABLE 2 The experimental results show
that when the dosage of ascorbic acid is between 3 mL and 15 mL the absorbance remains stable In
order to facilitate the operation and ensure complete reduction reaction we chose the dosage of ascorbic
acid to be 5 mL
TABLE 2 The absorbance values of different ascorbic acid dosages
Flask 1 Flask2 Flask3 Flask4 Flask5 Flask6
Ascorbic
acid (mL)
1 3 5 6 10 15
Absorbance
L(gmiddotcm)
0509 0514 0515 0515 0515 0515
After determining the dosage of the HCl and the ascorbic acid the third question is the optimal dosage
of DAPM Firstly take several copies of 5 mL sample B solution which content about 0074 of TiO2
and put the each solution into a 50 mL volumetric flask Secondly add 6 mL of HCl 5 mL of ascorbic
acid and different amounts of DAPM for color rendering reaction Finally measure the absorbance value
19
at 385 nm wavelength the experimental results are shown in the TABLE 3 From the experimental data
it can be seen that the absorbance of the DAPM chromogenic reagent is basically constant when it is
above 5 mL So the optimum dosage of the DAPM chromogenic reagent is 7 mL
TABLE 3 The dosage of DAPM experiment
Flask1 Flask2 Flask3 Flask4 Flask5 Flask6 Flask7 Flask8 Flask9
The dosage of
DAPM (mL)
2 3 4 5 6 7 8 9 10
Absorbance
L(gmiddotcm)
0226 0259 0282 0299 0231 0232 0232 0234 0233
Through the above three experiments (determine the optimal dosage of HCl ascorbic acid and DAPM)
the exact dosage of the three reagents in the color rendering experiment was determined The order and
steps of adding the three reagents are as follows firstly take 10 mL of TiO2 standard solution and put it
in a 50 mL volumetric flask Secondly add 5 mL of ascorbic acid solution mix it well Place the solution
for 5 minutes in the room temperature Then add 6 ml hydrochloric acid to mix the reagent evenly
Finally add 7 mL of DAPM into the solution Dilute the solution to the mark with water and mix it well
Leave it for 30 minutes in the room temperature and prepare to measure the absorbance
35 Procedure of the absorbance measuring
After the color rendering reaction is completed the test solution needs to be placed in a cuvette for
absorbance testing By changing the test wavelength the optimal wavelength is determined according
to the absorbance corresponding to each wavelength The absorbance at different wavelengths after color
development is shown in TABLE 4 It can be seen from the data that the wavelength has a maximum
value at 380-390 nm To ensure the best sensitivity the test wavelength is selected at 385 nm Under the
test of the maximum absorption wavelength the response of the instrument is more sensitive and the
measurement data is more accurate
20
TABLE 4 Optimal wavelength test data
Flask1 Flask2 Flask3 Flask1 Flask4 Flask5 Flask6 Flask7
Wavelength (nm) 360 370 380 385 390 400 410 420
Absorbance
L(gmiddotcm)
0499 0533 0547 0554 0543 0533 0502 0461
After determining the optimal wavelength use the spectrophotometer to analyze the content of TiO2 in
the sample firstly prepare the spectrophotometer and open the sample chamber cover Turn on the
power and the indicator lights up let the instrument warm up for 20 minutes Set the selector switch to
the T knob to display the number as 000 Secondly turn the wavelength knob to the 385 nm wave-
length and align the scale line Transfer the color rendering solution into a 3 cm cuvette and place it on
the colorimetric shelves And then close the sample chamber cover and adjust the light transmittance
100 T knob to make the number display as 1000 T Turn the selector switch to the A zero adjust-
ment knob the digital display should be 000 Then pull out the lever to put the solution to be measured
into the optical path and the digital display value is the absorbance A of the sample According to the
absorbance data it can be easily get the mass of TiO2 in the test solution After the measurement is
completed open the sample chamber cover and turn off the power switch
36 Interference test of calcium and magnesium ions
The main components of limestone are CaO and magnesium oxide (MgO) In order to determine whether
CaO or MgO has an effect on the determination of TiO2 Firstly prepare two standard solutions CaO
standard solution and MgO standard solution The content of CaO in the CaO standard solution is 10
mgL And the content of MgO in the MgO standard solution is 10 mgL Extract several parts from the
two prepared solutions and add a certain amount of TiO2 standard solution 4 mL (The amount of TiO2
added is 40 ug) to each part According to the method of 34 for color rendering the interference
experiment results of calcium ion and magnesium ion are as shown in TABLE 5 It can be seen from the
absorbance value in TABLE 5 that CaO and MgO have no effect on the determination of TiO2 There
was no difference in absorbance before and after adding CaO and MgO
21
TABLE 5 The interference experiment results of calcium ion and magnesium ion
Flask 1 Flask 2 Flask 3 Flask 4
The amount of TiO2 added 40 ug 40 ug 40 ug 40 ug
The amount of CaO added
(no MgO)
10 mg 20 mg 30 mg 40 mg
Absorbance L(gmiddotcm) 0551 0548 0550 0551
Flask 5 Flask 6 Flask 7 Flask 8
The amount of TiO2 added 40 ug 40 ug 40 ug 40 ug
The amount of MgO added
(no CaO )
10 mg 15 mg 20 mg 25 mg
Absorbance L(gmiddotcm) 0551 0550 0548 0551
22
4 RESULTS AND DISCUSSIONS
Through the acid system selection experiment the optimal selection of the spectrophotometerrsquos wave-
length experiment the optimal dosage of acidity selection experiment the optimal dosage of DAPM
selection experiment the optimal dosage of ascorbic acid selection experiment and the interference fac-
tors analysis experimental the accurate dosage of reagents was determined by these experiments Ac-
cording to the reaction phenomena or absorbance results of each experiment the corresponding experi-
mental results were obtained
In the acid system selection experiment the following conclusions can be drawn from the observation
of six experimental phenomena In the system of HF and HClO4 the sample is completely dissolved (the
precipitation is precipitated by adding H2SO4 the solution is turbid) but HClO4 and HF have a effect on
the determination of titanium and the fluoride ion is easy to complex with titanium And this
combination is likely to lead to the results on the low performance The presence of HClO4 can combine
with DAPM to produce white flocculent precipitate which led to the failure of the experiment In order
to eliminate the influence of insoluble residue to the analysis and ensure the sample is completely
dissolved The experiment uses the usual method which is anhydrous sodium carbonate and boric acid
system solvent mixed together for melting This method is simple and fast and the melting is complete
The acid system is relatively simple without introducing HClO4 acid HF acid and other kinds of acid
HCl is used to dissolve the sample and the sample dissolves quickly
In the optimal dosage of acidity selection experiment By observing the results of absorbance under
different acidity The best color acidity can be obtained add 6 mL of 6 molL HCl to control the color
acidity of solution In the optimal dosage of DAPM selection experiment through the absorbance test
results of solutions with different DAPM dosage It can be concluded from the data that the best dosage
of DAPM solution is 7 mL In the the optimal selection of the spectrophotometerrsquos wavelength
experiment according to the test results of absorbance of solution at different wavelengths it can be
concluded that the optimal wavelength is 385 nm In the optimal dosage of ascorbic acid selection
experiment through the absorbance test results of several solutions added with different volume of
ascorbic acid it can be concluded that the optimal dosage of ascorbic acid is 5 mL In the interference
factors analysis experimental it can be seen from the absorbance value in experiment results that CaO
and MgO have no effect on the determination of TiO2 By determining the accurate dosage of various
reagents a set of measurement steps with accurate actual dosage is formulated
23
41 Measurement results of titanium dioxide content
The content of TiO2 in three limestone samples was determined six times in parallel The analysis result
is rounded according to the rules of bankerrsquos rounding In order to avoid the phenomenon of big error
caused by rounding rules The specific method of data processing in this rule is as follows when the
mantissa is less than or equal to 4 the mantissa will be directly rounded off When the mantissa is greater
than or equal to 6 round off the mantissa and carry forward one digit When the mantissa is equal to 5
but the numbers after the mantissa are all 0 the previous digit of the mantissa should be used as a refer-
ence If the previous number is an odd number move one digit forward If the previous number is even
the mantissa is discarded If the mantissa is 5 but there is a number that is not 0 after the mantissa
whether the number before the mantissa is odd or even the number must move forward one bit
This experiment is carried out under the specified repeatability conditions the same experimental re-
searcher carries out the experiment uses the same instrument to carry out the experimental measurement
carries out the experiment under the same experimental conditions carries out the same calibration in a
short time TiO2 content is calculated according to the mass fraction WTiO2 calculation formula (1)
2
6
1
1
10100
TiO
mw
m V V
minus=
(1)
V1 The volume of the solution obtained separately from the sample solution The unit is milliliter (mL)
V Total volume of sample solution The unit is milliliter (mL)
m1 The quality of the titanium dioxide obtained separately from the sample solution The unit is mi-
crogram (μg)
m The quality of the sample The unit is gram (g)
The measurement results of the experiment are shown in the TABLE 6 The experimental data compared
with the TiO2 content in three limestone samples are shown in TABLE 7 For sample A the TiO2 content
obtained from the first and third experiments is basically consistent with the known accurate TiO2
content of sample A In addition to the second experimental data the accuracy of other experimental
data is good Compare with the other five groups of data the results of the second experiment have
relatively large errors For sample B the content of TiO2 obtained in the third experiment is almost the
same as the given value The TiO2 content measured in the fifth experiment is quite different from the
given value compared with the other five groups of data For sample C the TiO2 content obtained from
six experiments is almost the same as the given TiO2 content
24
TABLE 6 Experimental measurement data
Experiment
1
Experiment
2
Experiment
3
Experiment
4
Experiment
5
Experiment
6
Sample A
()
00412 00423 00409 00414 00416 00415
Sample B
()
00730 00750 00740 00765 00780 00735
Sample C
()
01250 01280 01290 01310 01240 01260
42 Accuracy of results discussion
From the average value of the data it can be seen that the accuracy of using the DAPM photometry to
determine the TiO2 content in limestone TABLE 7 is the average value of TiO2 content measured in six
experiments for each sample from TABLE 6 The second column is the certified value of the three
samples The mass fraction of TiO2 content in sample A is 0041 The mass fraction of TiO2 content
in sample B is 0074 The mass fraction of TiO2 content in sample C is 013 And the third column
is the average values which are obtained through experimental measurement and calculation As can be
seen from TABLE 7 The average value of TiO2 content in several groups of limestone samples meas-
ured by this experiment have high accuracy
TABLE 7 Average mass fraction of TiO2 content in limestone
Certified value Average value
Sample A () 0041 00414
Sample B () 0074 00750
Sample C () 0130 01272
HCl was used to dissolve the sample If HClO4 is used in the experiment it will form white flocculent
precipitate with DAPM which will affect the absorbance test If HF is used in the experiment fluorine
ions will complexate with titanium to form titanium fluoride complex which will affect the accuracy of
25
the experimental results If only HNO3 is used for decomposition except for incomplete decomposition
of the sample HNO3 also destroys DAPM thus affecting the continuation of the experiment According
to the dissolution treatment experiment and acidification experiment the HCl system is relatively simple
without the introduction of HClO4 HF and other types of acids And the sample dissolves quickly by
HCl leaching
In the experiment of determine the optimal dosage of DAPM solution it can be concluded that the
optimal dosage of DAPM is 7mL When the amount of DAPM is more than 6 mL the absorbance tends
to be stable If the flux of DAPM does not reach 6 mL the color reaction will be incomplete which will
affect the whole experiment For the selection of the amount of ascorbic acid ascorbic acid is used to
reduce Fe3+ in the solution to Fe2+ In order to eliminate the interference 5 mL ascorbic acid was selected
to reduce Fe3+ in the sample If the amount of ascorbic acid is less than 5 mL the remaining unreduced
Fe3+ will affect the accuracy of the whole experiment
In this experiment temperature and time have influence on the measurement results In 15-80 the
absorbance value is not affected by temperature However if the iron content in the sample is high and
the temperature is higher than 60 the solution is easy to be turbid and unable to compare colors
Therefore this experiment uses 15-30 room temperature to render color The color solution is very
stable and can be maintained for several months When the room temperature is higher than 20 it
tends to be stable after 20 minutes of color development When the room temperature is lower than 20
it needs 40-60 minutes to be stable In this color rendering experiment the accuracy of temperature
control is particularly important
When selecting the optimal wavelength of the test absorbance the wavelength corresponding to the
maximum absorbance is selected according to the absorption curve of the test solution In this experiment
when the wavelength is 385 nm the absorbance changes with the concentration in the largest range so
the determination is the most sensitive The absorption curve is an important basis for choosing the
wavelength of incident light in quantitative analysis In the wavelength selection experiment if the
wavelength corresponding to the maximum absorbance is not selected the accuracy of the experiment
will be insufficient
26
5 CONCLUSION
In this experiment the DAPM photometric method was used to determine the content of TiO2 The
sample is melted by sodium carbonate-boric acid mixed flux and leached with dilute HCl The experi-
ment used ascorbic acid as a masking agent to reduce Fe3+ to Fe2+ in the solution to eliminate interference
In this experiment DAPM solution was added to render the solution color In order to ensure the accu-
racy of the experimental results the amount of various reagents was optimized The following five as-
pects were quantitatively analyzed in the experiment optimal selection of the spectrophotometerrsquos
wavelength the optimal dosage of acidity the optimal dosage of DAPM the optimal dosage of ascorbic
acid and the interference factors analysis The exact dosage of each reagent was determined The TiO2
content measured in the experiment was compared with limestone with known accurate TiO2 content
The accuracy of the measurement can be seen in this experiment This experimental method has a perfect
effect on the use of spectrophotometers and promotes the determination of mineral raw materials con-
taining low TiO2 content by spectrophotometer
For the measurement results of the experiment there is a certain error between the TiO2 content meas-
ured in this experiment and the TiO2 content given in the limestone sample Through the interference
element analysis experiment it is determined that the two main components of limestone (MgO and
CaO) are not the cause of this error For several values with slightly poor accuracy there may be some
problems in the operation of the experiment The most likely reason for the poor accuracy of the data is
that after the sample dissolves the color reaction does not wait until the solution cools to room temper-
ature Another possibility is that the limestone sample is not well preserved resulting in a certain error
between the actual TiO2 value and the given value In the future experiments the above two error aspects
are further studied to ensure that the measurement method is accurate and the measurement results are
more accurate
Compared to ammonium ferric sulfate volumetric method and H2O2 coordination titration method
DAPM photometric method has high accuracy and eliminates the interference of vanadium molyb-
denum tungsten copper arsenic and other elements to the experiment Compared to ICP-AES method
DAPM photometric method is simple in operation and suitable for popularization and application The
results of the project provided a technical method for accurately and quickly determining the content of
TiO2 in limestone
27
REFERENCES
Bo H Xiaomei W amp Tao Y 2015 The development and application of X-Ray fluorescence
spectrometer Nuclear Electronics amp Detection Technology 1307-1311
Chen C 2005 Determinition of TiO2 in mine with diantipyrylmethane spectrophotometry Tian jing
Metallurgy 43(4) 9-10
Chen Z 2009 Research and Fabrication of Opto-mechanical Systems of New UV Spectrophotometer
Chu N Li W amp Jiang X 2014 Determination of major and minor compoments in limestone by
wavelength dispersive X-ray fluorescence spectrometry with fusion sample preparation Metallurgical
analysis 34(10) 37-41
Chu Y 1983 Development of X-ray fluorescence spectrometer DOI 10 13595 j cnki issn1000 -
0720 1983 0062
Deng J 2016 Determination of Titanium Dioxide in Titanium Slag by Diantipyrylmethane
Spectrophotometry Physico-ChemistryampChemical-Chemistry 52(1) 37-40
Deng J 2020 Determination of Titanium in Titanium Ferroalloy by Spectrophotometry with
Diantipyrylmethane Angang technology 2(1) 36-39
Du M 2017 Simultaneous determination of Fe Al Ca Mg K Na Ti in limestone by inductively
coupled plasma atomic emission spectrometry with microwave digestion Metallurgical Analysis
26(4) 30
Jin L Meng H amp Yinglin D 2008 Determining titanium dioxide in ores by ICP-AES Jilin
geology 27(1) 83-85
Khavar A amp Asadollahzadeh H 2020 Preconcentration and determination of nickel (Ⅱ)and
copper(Ⅱ) ions Elsevier Inc DOI101016jjfca2020103457
Li C 2006 Determination of SiO2 Cao MgO Al2O3 Fe2O3 and P2O5 in limestone and dolomite by
XRF melting method Shandong Metallurgy 28(6) 10-14
Li H 2005 Diantipyric methane spectrophotometric determination of titanium in magnesium
chloride Journal of environmental management college of China 15(3) 113-114
Liu X Zhong Y amp Song H 2011 Synthesis of Diantipyrylmethane aromatic ring derivatives and
its application in photometric analysis Jiangxi Nonferrous Metals 15 30-35
Mohamed E amp Hassan A 2015 Characterization of visiblelight activated TiO2 catalysts and their
photocatalytic performance study Huazhong Agricultural University 4-16
Pan X 2015 Development Trend of Ultraviolet Spectrophotometer Science and Technology amp
Innovation(14) 19-21
Peng X 2012 Study on spectrum analytical system of visible spectrometer Tianjin University 3-12
28
Shao H 2001 Determination of chloride ion in copper electrolyte by potentiometric titration
metallurgical analysis 21(4) 64-65
Song X 2006 Determination of titanium dioxide in vanadic titanomagnetite by hydrogen peroxide
Spectrophotometry Metallurgical Analysis 26(3)
Sunil R amp Kalpana C 2011 Synthesis of diarypyrimidinones (DAPMs) using large porezeolites
Journal of molecular catalysis 210-215
Wang R Yan W amp Zhu X 2013 Methods for chemical analysis of limestone quicklime and
hydrated lime for building materials Cement(4) 49-50
Wang H 2010 Discussion on the principle and maintenance of ICP- AES Electronic product
reliability and environmental testing 28(4) 60-63
Xu C Wang Q Xu W Dai M amp Qi 2020 Trouble shooting of inductively coupled plasma
atomic emission spectrometer Metallurgical analysis 40 66-71
Xu C Wang Q amp Xu W 2020 Fault analysis and treatment of inductively coupled plasma atomic
emission spectrometer Metallurgical analysis 40(2) 66-71
Yang Z 2008 Simultaneous quantification measurement of SiFeTiCaMgZr in corundum by
inductively coupled plasma-atomic emission spectrometry with secondary-melting method Rock
and mineral analysis 31(2)
Zhang J 2019 Discussion on the determination of TiO2 by Diantipyrylmethane Spectrophotometry
Chemical enterprise management(1) 45-46
Zhi P 1999 Development and application of biochemical instruments Telecommunication
Engineering 6(2)
Zhang Q 2009 Determination of Al2O3 CaO Fe2O3 MgO MnO SiO2TiO2 in Limestone and
Dolomite by ICP-AES Analysis and testing technology and instruments 15(3) 179-181

4
of the instrument The emission spectrum of tungsten lamp is formed in this way After refracting the
spectrum light of 380-780 nm wavelength emitted by tungsten lamp light source through a prism a
continuous color spectrum composed of red orange yellow green blue indigo and violet can be ob-
tained The color spectrum can be used as the light source of the visible light spectrophotometer
(Xiaohua 2012 6)
Ultraviolet spectrophotometer is based on the absorption spectrum of substances to study the composi-
tion structure and interaction of substances The ultraviolet spectrophotometer can arbitrarily choose
different wavelengths of light in the ultraviolet visible region The absorption spectrum of a substance
is that the molecules and atoms in the substance absorb the light energy of certain specific wavelengths
in the incident light The molecular vibrational energy level transition and the electronic energy level
transition occur accordingly All kinds of substances have their own different molecules atoms and
different molecular space structures Their absorption of light energy is different Therefore each sub-
stance has its own unique and fixed absorption spectrum curve The absorbance at certain characteristic
wavelengths on the spectrum can be used to distinguish or determine the content of the substance Ul-
traviolet spectrophotometry is based on Lambert-Beer law According to Lambert-Beer law A = εbc
(A is the absorbance ε is the molar absorption coefficient b is the thickness of the liquid cell and c is
the concentration of the solution) This law can be used to analyze the solution quantitatively (Mohamed
amp Hassan 2015 4)
There are many types of ultraviolet visible (UV-vis) spectrophotometers but their basic structures are
similar The UV-vis spectrophotometers are composed of five parts light source monochromator ab-
sorption cell detector and signal display system The structure of the ultraviolet spectrophotometer is
shown in FIGURE 1 The light source is a device to provide the incident light that meets the requirements
The common light source in the visible light area of the UV-vis spectrophotometer is tungsten lamp and
the common light source in the UV-vis light area is hydrogen lamp or deuterium lamp Tungsten lamp
is the most commonly used visible light source It can emit a continuous spectrum of 325-2500 nm and
the most suitable wavelength range is 320-1000 nm Therefore it can also be used as near-infrared light
source Deuterium lamp is the most commonly used ultraviolet light source It emits light with a wave-
length range of 190-400 nm and the wavelength range is generally 190-360 nm The second part of the
UV-vis spectrophotometer is monochromator which decomposes the continuous spectrum of the light
source into monochromatic light and can accurately and conveniently select the optical device of a cer-
tain wavelength needed It is the heart of the photometer Monochromator is mainly composed of slit
dispersion element and lens system The dispersion element is the main part of monochromator The
5
most commonly used dispersion elements are prism grating or a combination of the two The dispersive
element is shown in the FIGURE 1 It is a combination of prism and grating (Xiaojing 2015 19-20)
The absorption tank is a vessel used to hold the liquid to be measured and determine the thickness of the
transparent liquid layer of the solution to be measured also known as a cuvette Generally speaking the
absorption tank is a cuboid which also has a circle or other shapes The absorption tank in FIGURE 1
is a cuboid The bottom and both sides of the absorption tank are ground glass and the other two sides
are optical light transmitting surfaces According to the material of the light transmitting surface the
absorption tank can be divided into two types glass absorption tank and quartz absorption tank The
glass absorption cell is used for the determination of visible light area and the quartz absorption cell is
used for the determination of ultraviolet light area The specification of absorption tank is marked by
optical path The commonly used specifications of absorption cell are 05 cm 10 cm 20 cm 30 cm
50 cm The detector is a device that converts an optical signal into an electrical signal When measuring
the absorbance it is not to directly measure the light intensity through the absorption cell but to convert
the light intensity into a current for measurement This photoelectric converter is called a detector Signal
display is a device to amplify and display the output signal of detector The new spectrophotometer is
displayed by digital voltmeter and the absorbance curve is drawn directly by recorder The new spec-
trophotometer is equipped with computer data processor (Xiaojing 2015 19-20)
FIGURE 1 The structure of ultraviolet spectrophotometer (adapted from Xiaojing 2015 19)
6
22 Diantipyryl methane spectrophotometry
DAPM is white flake crystals It is insoluble in water ether and alkali But it is soluble in acid ethanol
and chloroform DAPM is soluble in acids and forms complex organic cations with acids The solution
of DAPM is colorless and it reacts with Ti3+ to form yellow complexes DAPM can be used as a sensitive
color reagent for the determination of Ti3+ iridium iron molybdenum neodymium uranium iridium
platinum rhenium It can also be used as an extractant for various ions The molecular formula of DAPM
is C23H24N4O2H2O The molecular structure of DAPM is shown in FIGURE 2
FIGURE 2 The molecular structure of DAPM (adapted from Liu Zhou amp Song 2011 31)
The UV-vis absorption spectrum of molecules is a common spectral analysis method based on the ab-
sorption spectrum generated by the intramolecular electronic transition When a material is irradiated by
light the material molecules will collide with the light As a result the energy of photons is transferred
to the molecules In this way the stable ground state molecules will jump to the unstable high energy
state This is the absorption of the light The qualitative analysis of UV-Vis absorption spectrum is based
on the fact that the shape of absorption curve of light to the same absorption material is different the
maximum absorption wavelength is the same but the corresponding absorption rate is different There
are three properties of UV-vis absorption spectrum the first is that the same concentration of the test
solution has different absorbance for different wavelengths of light The second point is that the higher
the concentration of the same test solution the higher the absorbance Finally the smaller the concen-
tration of the same substance the same wavelength (maximum absorption wavelength λ max) corre-
sponding to the maximum absorption peak and the same curve shape The absorbance tested results of
yellow complex formed by titanium and DAPM by DAPM spectrophotometry are shown in FIGURE 3
The shape of the absorption curve can be seen from FIGURE 3 The abscissa in the chart is the wave-
length the unit of wavelength is nm The ordinate is the absorbance and the unit of absorbance is
L(g middot cm) The absorbance reaches the maximum value at the wavelength of 390 nm In the vicinity of
7
the maximum wavelength the closer to the maximum range of the spectrophotometer the greater the
sample absorbance and the smaller the error brought by the photometer itself (Junhua 2020 38)
FIGURE 3Absorbance values at different wavelengths (adapted from Junhua 2020 38)
After consulting the literatures on the determination of TiO2 by DAPM Spectrophotometry It can be
founded that the measurement method is essentially similar The specific method is as follows Firstly
the sample needs to be decomposed the sample is placed in a platinum crucible and mixed flux (lime-
stone samples with accurate TiO2 content) is added to mix with the sample Heat the crucible at high
temperature (950-1000 ) take it out and cool it then add acid to dissolve the sample After that transfer
the solution to a volumetric flask to constant volume and blend well After transferring the solution add
ascorbic acid HCl DAPM solution put it into the spectrophotometer to measure the absorbance Finally
record the data and calculate the result (Junhua 2016 39)
23 Inductively coupled plasma atomic emission spectrometry
ICP-AES has the advantages of high accuracy and precision low detection limit fast determination
wide linear range and simultaneous determination of multiple elements It has been widely used in de-
termination of dozens of elements in environmental samples and samples of rocks minerals metals
Plasma is ionized gas with an ionization degree exceeding 01 This gas contains not only neutral
atoms and molecules but also a large number of ions and electrons (Haiyan 2010 62)
8
ICP-AES is based on the spectrum emitted by atoms to determine the chemical composition of a sub-
stance Different substances are composed of atoms of different elements and the atoms all contain a
densely structured nucleus The nucleus is surrounded by moving electrons Each electron is at a certain
energy level and has a certain energy Atoms are in a stable state under normal circumstances This state
is called the ground state When the atoms are transformed into gaseous atoms under the action of exter-
nal energy the outer electrons of the gaseous atoms are excited to a high energy state When transitioning
from a higher energy level to a lower energy level the atoms will release excess energy and emit char-
acteristic lines ICP-AES disperse the generated radiation through the instrument and record it on the
photosensitive plate in the order of wavelength which can show regular spectral lines The perform
quantitative analysis based on the obtained spectrum ICP-AES is a new type of light source that is
developing rapidly and is highly valued in the analysis of emission spectrum (Haiyan 2010 62)
ICP-AES consists of sample introduction system ICP light source dispersion system and detection sys-
tem And equipped with computer control and data processing system cooling system gas control sys-
tem ICP light source consists of high frequency power supply and ICP torch tube The ICP torch tube
consists of three concentric quartz tubes and a high-frequency induction ring (generally 2-4 rings of
hollow copper tubes) surrounded by the upper part of the tube There are three intake tubes A 10-20
Lmin argon gas is passed between the quartz outer tube and the intermediate tube Its function is to form
plasma as working gas and cool the quartz torch tube which is called plasma gas or cooling gas The
intermediate tube and the central tube are filled with 05-15 Lmin argon to become auxiliary gas which
is used to assist the formation of plasma After the plasma torch is formed it can be turned off The
carrier gas in the central tube is used to introduce the sample aerosol (Xu Wang amp Xu 2020 67)
The formation of ICP torch is called ignition The ignition is divided into three steps the first step is to
introduce plasma and auxiliary gas into the outer tube and the middle tube At present the central tube
is not connected with gas and an argon atmosphere is established in the torch tube The second step is
to connect the high-frequency power supply to the induction coil The general frequency is 7-50 mhz
and the power supply is 1-15 kw At present there is high-frequency current and high-frequency elec-
tromagnetic field generated by the coil The third step is to ionize the working gas flowing in the middle
by means of high frequency spark and then the ions and electrons produced will interact with the fluc-
tuating magnetic field produced by the induction coil This interaction causes the ions and electrons in
the coil to flow along the closed loop in the figure Their resistance to this movement causes ohmic
9
heating Because of the high temperature generated by the strong current the gas is heated to form a
torch like plasma (Xu et al 2020 67)
Aerosol injection system is a commonly used method at present The sample introduction system con-
sists of two main parts sample lifting part and atomization part The sample lifting part is generally a
peristaltic pump and a self-lifting atomizer can also be used It is required that the speed of the peristaltic
pump is stable and the elasticity of the pump pipe is good so that the sample solution can be pumped in
at a constant speed and the waste liquid can be discharged smoothly The atomizing part includes atom-
izer and atomizing chamber After the sample enters the atomizer by means of pump or self-lifting small
droplets are formed under the action of carrier gas and enter the atomization chamber The large droplets
are eliminated when they touch the wall of the atomization chamber Only small droplets can enter the
plasma source (Xu et al 2020 68) For the optical system the monochromator of ICP-AES usually
adopts the combination of grating or prism and grating And for the detection system the detection
system of ICP-AES is a photoelectric converter which uses photoelectric effect to convert the radiation
energy of different wavelengths into electrical signals (Xu et al 2020 68)
As a conventional chemical analysis technology ICP-AES has a wide range of applications in biological
samples materials geology environmental protection metallurgy and other fields In the field of met-
allurgical analysis such as steel raw materials and ferroalloys it is required to measure dozens to hun-
dreds of samples at a time And each sample must simultaneously analyze dozens of elements such as
Mn Cu Al Cr Si P Ni Ti V Nb W Ca Mg It can show the absolute advantages of ICP in terms of
work efficiency In the analysis of standard materials especially the low-value fixed-value analysis of
rare earth elements the accuracy of ICP data and the simplicity of operation are fully utilized (Haiyan
2010 62) The disadvantage of the ICP-AES method is that the equipment and operating costs are rela-
tively high The sample generally needs to be converted into a solution in advance and the determination
of some elements is not obvious such as sodium (Na) and potassium (K) (Juan 2019 46)
24 Titration analysis
There are generally two types of titration analysis to determine the content of TiO2 in the sample Am-
monium ferric sulfate volumetric method and H2O2 coordination titration The specific steps of ammo-
nium ferrate sulfate volumetric method are as follows firstly reduction of TiO2+ to Ti3+ with metal
10
aluminum tablets in HCl or H2SO4 medium And then using potassium thiocyanate as an indicator Fi-
nally titration with standard solution to ammonium ferrate sulfate The method has poor sensitivity and
selectivity But there are interference elements such as vanadium tin molybdenum tungsten copper
and arsenic that affect the experimental results These elements and TiO2 are completely or partially
reduced to a low valence state and these elements are oxidized by ferric ions (Fe3+) Leading to errors
in the experimental results (Juan 2019 46)
The specific steps of H2O2 coordination titration are as follows firstly the yellow complex will be form
by adding an appropriate amount of H2O2 to a solution which containing TiO2+Then add excess EDTA
to the solution (EDTA is a good complexing agent in chemistry It has six coordination atoms The
complex formed is called chelate EDTA is often used in coordination titration to determine the content
of metal ions In biological application it is used to exclude most transition metal elements For example
it is used to exclude the interference of iron ion nickel ion and manganese ion in the experiment) Make
it form a more stable ternary complex The remaining EDTA was titrated with xylenol orange as indica-
tor For the back titration with bismuth salt solution method when the reaction is slow or the reactant is
solid add a certain amount of titration solution Normally the reaction cannot be completed immediately
At this time a certain amount of excess titrating solution can be added first to accelerate the reaction
After the reaction is completed titrating the remaining titrant with another standard solution This
method is mostly used for samples with high titanium content Although the titration analysis method
does not have high requirements for instruments and equipment but the accuracy of the measurement
results is poor and the scope of use is narrow (Juan 2019 46)
25 X-ray fluorescence spectrometry
People usually irradiate X-rays on substances to produce secondary X-rays called XRF The X-rays used
for irradiation are called primary X-rays XRF is still X-ray XRF spectrometer is mainly composed of
excitation dispersion detection recording and data unit The role of the excitation unit is to generate
primary X-rays It consists of high-voltage generator and X-ray tube The role of the dispersion unit is
to separate X-rays of the desired wavelength It consists of sample chamber slit goniometer analysis
crystal and other parts The role of the detector is to convert X-ray photon energy into electrical energy
The recording unit is composed of an amplifier a pulse amplitude analyzer and a display part X-ray
tube generates incident X-rays to excite the tested sample Each element in the excited sample emits
11
secondary X-rays and the secondary X-rays emitted by different elements have specific energy charac-
teristics or wavelength characteristics The detection system measures the energy and quantity of these
emitted secondary X-rays The instrument software converts the information collected by the detection
system into the types and contents of various elements in the sample By using the principle of X-ray
fluorescence every element after beryllium in the periodic table can be measured theoretically In prac-
tical applications the effective element measurement range is element 9 (F) to element 92 (U) in the
periodic table (Chu Li amp Jiang 2014 40)
The characteristic X-ray energy and wavelength emitted by different elements are different Therefore
no matter what kind of element can be detected by measuring the energy or wavelength of X-ray At the
same time the characteristic X-ray intensity of an element emitted after the sample is excited It is related
to the content of this element in the sample so the quantitative analysis of the element can be performed
by measuring its intensity There are two basic types of XRF spectrometers wavelength dispersive spec-
trometer and energy dispersive spectrometer The structure of the instrument is shown in FIGURE 4
12
FIGURE 4 Wavelength dispersive spectrometer and energy dispersive spectrometer (adapted from Bo
Xiao amp Tao 2015 1308)
With the development of instrument technology and theoretical methods the application range of XRF
analysis is very widely In the analysis of the composition of substances in the metallurgy geology
chemical industry machinery petroleum building materials and other industrial sectors agriculture and
medicine and health as well as physics chemistry biology geoscience environment astronomy and
archaeology and other research departments have been widely applications (Chu et al 2014 37)
13
26 Hydrogen peroxide photometry and ferrotitanium spectrophotometry
H2O2 is a colorless odorless liquid with bitter taste and easy to decompose into water and oxygen It is
a strong oxidant H2O2 is often used for sterilization in the workplace starch whitening in the industry
or as a strong oxidant for food or food packaging and liquid fuel propellant In this method phosphoric
acid (H3PO4) and H2SO4 were used to dissolve the sample In the medium of 5 H2SO4 by volume
TiO2+ and H2O2 formed a yellow complex ion in the acidic condition The stable equilibrium constant
of the complex is k = 10 times 104 and the maximum absorption wavelength is λmax = 405 nm H2O2
spectrophotometry is simple and rapid but its sensitivity and selectivity are poor Sodium catechol-35
sulfonate forms a yellow complex with titanium at pH = 47-49 Ferrotitanium reagent has high sensi-
tivity and can be used for the continuous determination of trace titanium and iron (Xinyan 2006 66)
14
3 EXPERIMENT
There are three main experimental steps sample decomposition color rendering and absorbance exper-
iment which are studied and developed extensively in this project The detail procedures of both topics
will be fully displayed Besides some important choices of chemical reagents during the experiment
will be explained by five variable value optimization experiments optimal selection of the spectropho-
tometerrsquos wavelength the optimal dosage of acidity the optimal dosage of DAPM the optimal dosage
of ascorbic acid and the interference factors analysis experimental
31 Reagents and reagents preparation
The reagents used in the experiment are as follows mixed flux grind from anhydrous sodium sulfate
and boric acid potassium pyrosulfate HCl with a density of 119 gmL H2SO4 with a density of 184
gmL HCl (1+1) ((1+1) is the solution which mix 1 ratio of HCl with 1 ratio of water in volume The
molar concentration of HCl (1+1) is 6 molL) H2SO4 (5+95) ((5+95) is the solution which mix 5 ratio
of H2SO4 with 95 ratio of water in volume The molar concentration of H2SO4 (5+95) is 09 molL)
ascorbic acid solution (20 gL) DAPM solution (50 gL) TiO2 stock solution (100 μgmL) and TiO2
standard solution (10 μgmL)
The preparation steps for ascorbic acid solution (20 gL) are as follows weigh 20g of ascorbic acid add
200-300 mL of water to dissolve the sample and stir evenly After the ascorbic acid is completely dis-
solved transfer the solution to a 1 L volumetric flask and make up to volume The preparation steps of
the TiO2 stock solution (100 μgmL) are as follows weigh 01 g of TiO2 and place it in a platinum
crucible and then add 5-7 g of potassium pyrosulfate Put them into a high-temperature furnace raise
the temperature to 600 deg C to melt Use 60 mL H2SO4 to dissolve the melt After it cooling to room
temperature transfer it to a 1000 mL volumetric flask diluted with H2SO4 to the mark and mixed fully
The preparation of the TiO2 standard solution (10 μgmL) are as follows add 50mL of TiO2 stock solu-
tion to a 500 mL volumetric flask And then add H2SO4 to constant volume and mix it well
Three instruments are used in this experiment platinum crucible (The volume needs to be greater than
30 mL) high temperature furnace (The crucible heating temperature is suitable for 100-1100 ) and
UV-vis spectrophotometer (1000 nm ge wavelength ge 180 nm) Before using the spectrophotometer
15
connect the spectrophotometer to the power supply turn on the instrument switch lift the lid of the
sample chamber and preheat the sample chamber for 10 minutes
32 Experimental procedure
Before the experiment the preparation of reagents and the commissioning of equipment need to be com-
pleted The preparatory work includes preparation of ascorbic acid solution (20 gL) preparation of
DAPM solution (50 gL) preparation of TiO2 stock solution (100 μgmL) and preparation of TiO2 stand-
ard solution (10 μgmL) After the reagent preparation is completed proceed to the second step as shown
in FIGURE 5 Dissolve the sample after weighing it Thirdly render the color of the sample solution
The fourth step is measure the absorbance of the developed solution by spectrophotometer And finally
record and process the experimental data
FIGURE 5 The experimental procedure of measuring titanium dioxide content in limestone by dianti-
pyryl methane photometry
33 Procedure of sample decomposition
In this experiment the samples selected three limestones with known accurate TiO2 content The TiO2
content (mass fraction) of sample A is 0041 the TiO2 content (mass fraction) of sample B is 0074
and the TiO2 content (mass fraction) of sample C is 013 The purpose of these accurate data is to
make a precision comparison with the data measured in this experiment and verify the accuracy of the
experimental method A total of three sets of experiments were conducted and each set was measured 6
times
The sample decomposition steps are as follows take 02 g limestone (crumb limestone) sample into a
platinum crucible add 5 g mixed flux (anhydrous sodium carbonate and boric acid) Secondly place the
platinum crucible in a high-temperature furnace and gradually increase the temperature to 950-1000
Weighing of
samplesamp
reagents
preparation
Sample
decomposition
Color
rendering
Absorbance
experiment
Experimental
data recording
16
After the sample is melted take it out and cool it to room temperature Thirdly put the crucible in the
250 mL beaker together with the sample and add HCl into the beaker Finally heat the beaker at around
75 to make the solution transparently After cooling to room temperature dilute the solution to 100
mL with water (Wang Yan amp Zhu 2013 49) During the experiment HCl is used to dissolve the sample
The choice of acid type needs to be determined through the phenomenon of sample dissolution in dif-
ferent acid systems Through experiments of dissolving samples in various acid systems the results can
be obtained the most suitable acid for dissolving limestone
For the optimal selection of the dosage and the type of acid to dissolve the sample the experimental
procedure is as follows select 025 g of limestone sample B with a TiO2 content of 0074 and place
it in 6 polytetrafluoroethylene beakers Add HCl (1+1) nitric acid (HNO3) (1+1) perchloric acid (HClO4)
(1+1) hydrofluoric acid (HF) (1+1) and H2SO4 (5+95) to dissolve the sample with different acid systems
composed of these acids Put 20 mL HCl into the first beaker By observing the solution in the beaker
the solution is cloudy with residue For the second beaker add HCl of the same volume as the first
beaker and 5 mL HNO3 The phenomenon of the solution is cloudy with residue For the third beaker
add HCl and HNO3 of the same volume as the second beaker and 10 mL HClO4 into the beaker By
observing the phenomenon of the reaction the solution is cloudy with residue For the fourth beaker put
20 mL HCl 10 mL HClO4 5 mL HF into the beaker The limestone sample is completely dissolved
And then put add HCl HNO3 and HClO4 of the same volume as the third beaker and 5 mL HF into the
fifth beaker the limestone sample is completely dissolved For the last beaker choose 20 mL HCl 10
mL HClO4 5 mL HF and 5 mL H2SO4 to dissolve the sample The solution is turbid
34 Procedure of color rendering
Whether the color rendering reaction can meet the requirements of the photometric method in addition
to mainly related to the nature of the chromogenic reagent it is also very important to control the con-
ditions of the color reaction The color rendering conditions mainly included the dosage of the chromo-
genic reagent and the acidity of the solution In order to make the color reaction as complete as possible
it is necessary to add an appropriate dosage of the chromogenic reagent If an excessive dosage of chro-
mogenic reagent is added it will cause side reactions which are not conducive to the measurement In
the experiment the appropriate dosage of the chromogenic reagent is obtained through related experi-
ments Most chromogenic reagents are organic weak acids The acidity of the solution affects the disso-
17
ciation of the chromogenic reagent and the completeness of the color rendering reaction Many chromo-
genic reagents are acid-base indicators The acidity of the solution will change the initial color of the
chromogenic reagent The acidity of the solution also has an effect on the composition and stability of
the colored complex
Three solutions need to be added in the color rendering experiment Firstly HCl needs to be added to
control the acidity of the solution Secondly ascorbic acid solution needs to be added to reduce Fe3+ to
ferrous iron (Fe2+) in the solution Because of the main interference element of this experiment is iron
So it is necessary to eliminate this interference by adding ascorbic acid solution Finally add DAPM for
color rendering reaction So before rendering colors the optimal dosage of these three solutions needs
to be found
The acidity of the solution affects the dissociation of the chromogenic reagent and the completeness of
the color rendering reaction Therefore maintaining the acidity of the solution is a prerequisite for start-
ing the color rendering experiment Determine the experiment steps of optimum dosage of HCl are as
follows take 10 mL of the test solution in 50 mL volumetric flask And then add 5 mL of ascorbic acid
solution and mix it well Place it for about 5 minutes Add 2 mL 4 mL 6 mL 8 mL 10 mL 12 mL 16
mL 20 mL HCl to 8 flasks respectively then add 7 mL of DAPM solution into each flask Dilute the
solution to the mark with water and mix it well Leave it for about half an hour at room temperature
Then put the chromogenic reagent into the spectrophotometer to measure the absorbance (detection
wavelength is 385 nm) It can be realized from TABLE 1 that the acidity in HCl medium has minimal
effect on the color rendering reaction During the analysis add 6 mL of 6 molL HCl to control the
normal concentration of about 113 N Normality (N) is defined as the number of equivalents per liter of
solution where definition of an equivalent depends on the reaction taking place in the solution For an
acid-base reaction the equivalent is the mass of acid or base that can furnish or accept exactly 1 mole of
proton (H+ ions) And this is based on the HCl concentration It can be seen from the absorbance value
in the last row of TABLE 1 that the acidity has little effect on the color rendering reaction in HCl medium
In the analysis process add 6 mL 6 molL HCl solution to control the normal concentration at 113 N
18
TABLE 1 Effect of acidity in HCl medium on color reaction
Flask1 Flask 2 Flask 3 Flask 4 Flask 5 Flask 6 Flask 7 Flask 8
HCl
(1+1) mL
2 4 6 8 10 12 16 20
Normal
concentration
(N)
065 089 113 137 161 185 233 290
Absorbance
L(gmiddotcm)
0185 0185 0185 0185 0185 0185 0185 0180
After determining the acidity of the solution the second problem to be determined is the optimal dosage
of ascorbic acid reagent Take several copies of 10 mL sample B solution with 0074 TiO2 content
add different amounts of ascorbic acid solution Then add 6 mL of HCl and 7 mL of DAPM for color
development and measure the absorbance by spectrophotometer (detection wavelength is 385 nm) The
absorbance values of different ascorbic acid dosages are shown in TABLE 2 The effect of adding
different volume of ascorbic acid on absorbance is shown in TABLE 2 The experimental results show
that when the dosage of ascorbic acid is between 3 mL and 15 mL the absorbance remains stable In
order to facilitate the operation and ensure complete reduction reaction we chose the dosage of ascorbic
acid to be 5 mL
TABLE 2 The absorbance values of different ascorbic acid dosages
Flask 1 Flask2 Flask3 Flask4 Flask5 Flask6
Ascorbic
acid (mL)
1 3 5 6 10 15
Absorbance
L(gmiddotcm)
0509 0514 0515 0515 0515 0515
After determining the dosage of the HCl and the ascorbic acid the third question is the optimal dosage
of DAPM Firstly take several copies of 5 mL sample B solution which content about 0074 of TiO2
and put the each solution into a 50 mL volumetric flask Secondly add 6 mL of HCl 5 mL of ascorbic
acid and different amounts of DAPM for color rendering reaction Finally measure the absorbance value
19
at 385 nm wavelength the experimental results are shown in the TABLE 3 From the experimental data
it can be seen that the absorbance of the DAPM chromogenic reagent is basically constant when it is
above 5 mL So the optimum dosage of the DAPM chromogenic reagent is 7 mL
TABLE 3 The dosage of DAPM experiment
Flask1 Flask2 Flask3 Flask4 Flask5 Flask6 Flask7 Flask8 Flask9
The dosage of
DAPM (mL)
2 3 4 5 6 7 8 9 10
Absorbance
L(gmiddotcm)
0226 0259 0282 0299 0231 0232 0232 0234 0233
Through the above three experiments (determine the optimal dosage of HCl ascorbic acid and DAPM)
the exact dosage of the three reagents in the color rendering experiment was determined The order and
steps of adding the three reagents are as follows firstly take 10 mL of TiO2 standard solution and put it
in a 50 mL volumetric flask Secondly add 5 mL of ascorbic acid solution mix it well Place the solution
for 5 minutes in the room temperature Then add 6 ml hydrochloric acid to mix the reagent evenly
Finally add 7 mL of DAPM into the solution Dilute the solution to the mark with water and mix it well
Leave it for 30 minutes in the room temperature and prepare to measure the absorbance
35 Procedure of the absorbance measuring
After the color rendering reaction is completed the test solution needs to be placed in a cuvette for
absorbance testing By changing the test wavelength the optimal wavelength is determined according
to the absorbance corresponding to each wavelength The absorbance at different wavelengths after color
development is shown in TABLE 4 It can be seen from the data that the wavelength has a maximum
value at 380-390 nm To ensure the best sensitivity the test wavelength is selected at 385 nm Under the
test of the maximum absorption wavelength the response of the instrument is more sensitive and the
measurement data is more accurate
20
TABLE 4 Optimal wavelength test data
Flask1 Flask2 Flask3 Flask1 Flask4 Flask5 Flask6 Flask7
Wavelength (nm) 360 370 380 385 390 400 410 420
Absorbance
L(gmiddotcm)
0499 0533 0547 0554 0543 0533 0502 0461
After determining the optimal wavelength use the spectrophotometer to analyze the content of TiO2 in
the sample firstly prepare the spectrophotometer and open the sample chamber cover Turn on the
power and the indicator lights up let the instrument warm up for 20 minutes Set the selector switch to
the T knob to display the number as 000 Secondly turn the wavelength knob to the 385 nm wave-
length and align the scale line Transfer the color rendering solution into a 3 cm cuvette and place it on
the colorimetric shelves And then close the sample chamber cover and adjust the light transmittance
100 T knob to make the number display as 1000 T Turn the selector switch to the A zero adjust-
ment knob the digital display should be 000 Then pull out the lever to put the solution to be measured
into the optical path and the digital display value is the absorbance A of the sample According to the
absorbance data it can be easily get the mass of TiO2 in the test solution After the measurement is
completed open the sample chamber cover and turn off the power switch
36 Interference test of calcium and magnesium ions
The main components of limestone are CaO and magnesium oxide (MgO) In order to determine whether
CaO or MgO has an effect on the determination of TiO2 Firstly prepare two standard solutions CaO
standard solution and MgO standard solution The content of CaO in the CaO standard solution is 10
mgL And the content of MgO in the MgO standard solution is 10 mgL Extract several parts from the
two prepared solutions and add a certain amount of TiO2 standard solution 4 mL (The amount of TiO2
added is 40 ug) to each part According to the method of 34 for color rendering the interference
experiment results of calcium ion and magnesium ion are as shown in TABLE 5 It can be seen from the
absorbance value in TABLE 5 that CaO and MgO have no effect on the determination of TiO2 There
was no difference in absorbance before and after adding CaO and MgO
21
TABLE 5 The interference experiment results of calcium ion and magnesium ion
Flask 1 Flask 2 Flask 3 Flask 4
The amount of TiO2 added 40 ug 40 ug 40 ug 40 ug
The amount of CaO added
(no MgO)
10 mg 20 mg 30 mg 40 mg
Absorbance L(gmiddotcm) 0551 0548 0550 0551
Flask 5 Flask 6 Flask 7 Flask 8
The amount of TiO2 added 40 ug 40 ug 40 ug 40 ug
The amount of MgO added
(no CaO )
10 mg 15 mg 20 mg 25 mg
Absorbance L(gmiddotcm) 0551 0550 0548 0551
22
4 RESULTS AND DISCUSSIONS
Through the acid system selection experiment the optimal selection of the spectrophotometerrsquos wave-
length experiment the optimal dosage of acidity selection experiment the optimal dosage of DAPM
selection experiment the optimal dosage of ascorbic acid selection experiment and the interference fac-
tors analysis experimental the accurate dosage of reagents was determined by these experiments Ac-
cording to the reaction phenomena or absorbance results of each experiment the corresponding experi-
mental results were obtained
In the acid system selection experiment the following conclusions can be drawn from the observation
of six experimental phenomena In the system of HF and HClO4 the sample is completely dissolved (the
precipitation is precipitated by adding H2SO4 the solution is turbid) but HClO4 and HF have a effect on
the determination of titanium and the fluoride ion is easy to complex with titanium And this
combination is likely to lead to the results on the low performance The presence of HClO4 can combine
with DAPM to produce white flocculent precipitate which led to the failure of the experiment In order
to eliminate the influence of insoluble residue to the analysis and ensure the sample is completely
dissolved The experiment uses the usual method which is anhydrous sodium carbonate and boric acid
system solvent mixed together for melting This method is simple and fast and the melting is complete
The acid system is relatively simple without introducing HClO4 acid HF acid and other kinds of acid
HCl is used to dissolve the sample and the sample dissolves quickly
In the optimal dosage of acidity selection experiment By observing the results of absorbance under
different acidity The best color acidity can be obtained add 6 mL of 6 molL HCl to control the color
acidity of solution In the optimal dosage of DAPM selection experiment through the absorbance test
results of solutions with different DAPM dosage It can be concluded from the data that the best dosage
of DAPM solution is 7 mL In the the optimal selection of the spectrophotometerrsquos wavelength
experiment according to the test results of absorbance of solution at different wavelengths it can be
concluded that the optimal wavelength is 385 nm In the optimal dosage of ascorbic acid selection
experiment through the absorbance test results of several solutions added with different volume of
ascorbic acid it can be concluded that the optimal dosage of ascorbic acid is 5 mL In the interference
factors analysis experimental it can be seen from the absorbance value in experiment results that CaO
and MgO have no effect on the determination of TiO2 By determining the accurate dosage of various
reagents a set of measurement steps with accurate actual dosage is formulated
23
41 Measurement results of titanium dioxide content
The content of TiO2 in three limestone samples was determined six times in parallel The analysis result
is rounded according to the rules of bankerrsquos rounding In order to avoid the phenomenon of big error
caused by rounding rules The specific method of data processing in this rule is as follows when the
mantissa is less than or equal to 4 the mantissa will be directly rounded off When the mantissa is greater
than or equal to 6 round off the mantissa and carry forward one digit When the mantissa is equal to 5
but the numbers after the mantissa are all 0 the previous digit of the mantissa should be used as a refer-
ence If the previous number is an odd number move one digit forward If the previous number is even
the mantissa is discarded If the mantissa is 5 but there is a number that is not 0 after the mantissa
whether the number before the mantissa is odd or even the number must move forward one bit
This experiment is carried out under the specified repeatability conditions the same experimental re-
searcher carries out the experiment uses the same instrument to carry out the experimental measurement
carries out the experiment under the same experimental conditions carries out the same calibration in a
short time TiO2 content is calculated according to the mass fraction WTiO2 calculation formula (1)
2
6
1
1
10100
TiO
mw
m V V
minus=
(1)
V1 The volume of the solution obtained separately from the sample solution The unit is milliliter (mL)
V Total volume of sample solution The unit is milliliter (mL)
m1 The quality of the titanium dioxide obtained separately from the sample solution The unit is mi-
crogram (μg)
m The quality of the sample The unit is gram (g)
The measurement results of the experiment are shown in the TABLE 6 The experimental data compared
with the TiO2 content in three limestone samples are shown in TABLE 7 For sample A the TiO2 content
obtained from the first and third experiments is basically consistent with the known accurate TiO2
content of sample A In addition to the second experimental data the accuracy of other experimental
data is good Compare with the other five groups of data the results of the second experiment have
relatively large errors For sample B the content of TiO2 obtained in the third experiment is almost the
same as the given value The TiO2 content measured in the fifth experiment is quite different from the
given value compared with the other five groups of data For sample C the TiO2 content obtained from
six experiments is almost the same as the given TiO2 content
24
TABLE 6 Experimental measurement data
Experiment
1
Experiment
2
Experiment
3
Experiment
4
Experiment
5
Experiment
6
Sample A
()
00412 00423 00409 00414 00416 00415
Sample B
()
00730 00750 00740 00765 00780 00735
Sample C
()
01250 01280 01290 01310 01240 01260
42 Accuracy of results discussion
From the average value of the data it can be seen that the accuracy of using the DAPM photometry to
determine the TiO2 content in limestone TABLE 7 is the average value of TiO2 content measured in six
experiments for each sample from TABLE 6 The second column is the certified value of the three
samples The mass fraction of TiO2 content in sample A is 0041 The mass fraction of TiO2 content
in sample B is 0074 The mass fraction of TiO2 content in sample C is 013 And the third column
is the average values which are obtained through experimental measurement and calculation As can be
seen from TABLE 7 The average value of TiO2 content in several groups of limestone samples meas-
ured by this experiment have high accuracy
TABLE 7 Average mass fraction of TiO2 content in limestone
Certified value Average value
Sample A () 0041 00414
Sample B () 0074 00750
Sample C () 0130 01272
HCl was used to dissolve the sample If HClO4 is used in the experiment it will form white flocculent
precipitate with DAPM which will affect the absorbance test If HF is used in the experiment fluorine
ions will complexate with titanium to form titanium fluoride complex which will affect the accuracy of
25
the experimental results If only HNO3 is used for decomposition except for incomplete decomposition
of the sample HNO3 also destroys DAPM thus affecting the continuation of the experiment According
to the dissolution treatment experiment and acidification experiment the HCl system is relatively simple
without the introduction of HClO4 HF and other types of acids And the sample dissolves quickly by
HCl leaching
In the experiment of determine the optimal dosage of DAPM solution it can be concluded that the
optimal dosage of DAPM is 7mL When the amount of DAPM is more than 6 mL the absorbance tends
to be stable If the flux of DAPM does not reach 6 mL the color reaction will be incomplete which will
affect the whole experiment For the selection of the amount of ascorbic acid ascorbic acid is used to
reduce Fe3+ in the solution to Fe2+ In order to eliminate the interference 5 mL ascorbic acid was selected
to reduce Fe3+ in the sample If the amount of ascorbic acid is less than 5 mL the remaining unreduced
Fe3+ will affect the accuracy of the whole experiment
In this experiment temperature and time have influence on the measurement results In 15-80 the
absorbance value is not affected by temperature However if the iron content in the sample is high and
the temperature is higher than 60 the solution is easy to be turbid and unable to compare colors
Therefore this experiment uses 15-30 room temperature to render color The color solution is very
stable and can be maintained for several months When the room temperature is higher than 20 it
tends to be stable after 20 minutes of color development When the room temperature is lower than 20
it needs 40-60 minutes to be stable In this color rendering experiment the accuracy of temperature
control is particularly important
When selecting the optimal wavelength of the test absorbance the wavelength corresponding to the
maximum absorbance is selected according to the absorption curve of the test solution In this experiment
when the wavelength is 385 nm the absorbance changes with the concentration in the largest range so
the determination is the most sensitive The absorption curve is an important basis for choosing the
wavelength of incident light in quantitative analysis In the wavelength selection experiment if the
wavelength corresponding to the maximum absorbance is not selected the accuracy of the experiment
will be insufficient
26
5 CONCLUSION
In this experiment the DAPM photometric method was used to determine the content of TiO2 The
sample is melted by sodium carbonate-boric acid mixed flux and leached with dilute HCl The experi-
ment used ascorbic acid as a masking agent to reduce Fe3+ to Fe2+ in the solution to eliminate interference
In this experiment DAPM solution was added to render the solution color In order to ensure the accu-
racy of the experimental results the amount of various reagents was optimized The following five as-
pects were quantitatively analyzed in the experiment optimal selection of the spectrophotometerrsquos
wavelength the optimal dosage of acidity the optimal dosage of DAPM the optimal dosage of ascorbic
acid and the interference factors analysis The exact dosage of each reagent was determined The TiO2
content measured in the experiment was compared with limestone with known accurate TiO2 content
The accuracy of the measurement can be seen in this experiment This experimental method has a perfect
effect on the use of spectrophotometers and promotes the determination of mineral raw materials con-
taining low TiO2 content by spectrophotometer
For the measurement results of the experiment there is a certain error between the TiO2 content meas-
ured in this experiment and the TiO2 content given in the limestone sample Through the interference
element analysis experiment it is determined that the two main components of limestone (MgO and
CaO) are not the cause of this error For several values with slightly poor accuracy there may be some
problems in the operation of the experiment The most likely reason for the poor accuracy of the data is
that after the sample dissolves the color reaction does not wait until the solution cools to room temper-
ature Another possibility is that the limestone sample is not well preserved resulting in a certain error
between the actual TiO2 value and the given value In the future experiments the above two error aspects
are further studied to ensure that the measurement method is accurate and the measurement results are
more accurate
Compared to ammonium ferric sulfate volumetric method and H2O2 coordination titration method
DAPM photometric method has high accuracy and eliminates the interference of vanadium molyb-
denum tungsten copper arsenic and other elements to the experiment Compared to ICP-AES method
DAPM photometric method is simple in operation and suitable for popularization and application The
results of the project provided a technical method for accurately and quickly determining the content of
TiO2 in limestone
27
REFERENCES
Bo H Xiaomei W amp Tao Y 2015 The development and application of X-Ray fluorescence
spectrometer Nuclear Electronics amp Detection Technology 1307-1311
Chen C 2005 Determinition of TiO2 in mine with diantipyrylmethane spectrophotometry Tian jing
Metallurgy 43(4) 9-10
Chen Z 2009 Research and Fabrication of Opto-mechanical Systems of New UV Spectrophotometer
Chu N Li W amp Jiang X 2014 Determination of major and minor compoments in limestone by
wavelength dispersive X-ray fluorescence spectrometry with fusion sample preparation Metallurgical
analysis 34(10) 37-41
Chu Y 1983 Development of X-ray fluorescence spectrometer DOI 10 13595 j cnki issn1000 -
0720 1983 0062
Deng J 2016 Determination of Titanium Dioxide in Titanium Slag by Diantipyrylmethane
Spectrophotometry Physico-ChemistryampChemical-Chemistry 52(1) 37-40
Deng J 2020 Determination of Titanium in Titanium Ferroalloy by Spectrophotometry with
Diantipyrylmethane Angang technology 2(1) 36-39
Du M 2017 Simultaneous determination of Fe Al Ca Mg K Na Ti in limestone by inductively
coupled plasma atomic emission spectrometry with microwave digestion Metallurgical Analysis
26(4) 30
Jin L Meng H amp Yinglin D 2008 Determining titanium dioxide in ores by ICP-AES Jilin
geology 27(1) 83-85
Khavar A amp Asadollahzadeh H 2020 Preconcentration and determination of nickel (Ⅱ)and
copper(Ⅱ) ions Elsevier Inc DOI101016jjfca2020103457
Li C 2006 Determination of SiO2 Cao MgO Al2O3 Fe2O3 and P2O5 in limestone and dolomite by
XRF melting method Shandong Metallurgy 28(6) 10-14
Li H 2005 Diantipyric methane spectrophotometric determination of titanium in magnesium
chloride Journal of environmental management college of China 15(3) 113-114
Liu X Zhong Y amp Song H 2011 Synthesis of Diantipyrylmethane aromatic ring derivatives and
its application in photometric analysis Jiangxi Nonferrous Metals 15 30-35
Mohamed E amp Hassan A 2015 Characterization of visiblelight activated TiO2 catalysts and their
photocatalytic performance study Huazhong Agricultural University 4-16
Pan X 2015 Development Trend of Ultraviolet Spectrophotometer Science and Technology amp
Innovation(14) 19-21
Peng X 2012 Study on spectrum analytical system of visible spectrometer Tianjin University 3-12
28
Shao H 2001 Determination of chloride ion in copper electrolyte by potentiometric titration
metallurgical analysis 21(4) 64-65
Song X 2006 Determination of titanium dioxide in vanadic titanomagnetite by hydrogen peroxide
Spectrophotometry Metallurgical Analysis 26(3)
Sunil R amp Kalpana C 2011 Synthesis of diarypyrimidinones (DAPMs) using large porezeolites
Journal of molecular catalysis 210-215
Wang R Yan W amp Zhu X 2013 Methods for chemical analysis of limestone quicklime and
hydrated lime for building materials Cement(4) 49-50
Wang H 2010 Discussion on the principle and maintenance of ICP- AES Electronic product
reliability and environmental testing 28(4) 60-63
Xu C Wang Q Xu W Dai M amp Qi 2020 Trouble shooting of inductively coupled plasma
atomic emission spectrometer Metallurgical analysis 40 66-71
Xu C Wang Q amp Xu W 2020 Fault analysis and treatment of inductively coupled plasma atomic
emission spectrometer Metallurgical analysis 40(2) 66-71
Yang Z 2008 Simultaneous quantification measurement of SiFeTiCaMgZr in corundum by
inductively coupled plasma-atomic emission spectrometry with secondary-melting method Rock
and mineral analysis 31(2)
Zhang J 2019 Discussion on the determination of TiO2 by Diantipyrylmethane Spectrophotometry
Chemical enterprise management(1) 45-46
Zhi P 1999 Development and application of biochemical instruments Telecommunication
Engineering 6(2)
Zhang Q 2009 Determination of Al2O3 CaO Fe2O3 MgO MnO SiO2TiO2 in Limestone and
Dolomite by ICP-AES Analysis and testing technology and instruments 15(3) 179-181

5
most commonly used dispersion elements are prism grating or a combination of the two The dispersive
element is shown in the FIGURE 1 It is a combination of prism and grating (Xiaojing 2015 19-20)
The absorption tank is a vessel used to hold the liquid to be measured and determine the thickness of the
transparent liquid layer of the solution to be measured also known as a cuvette Generally speaking the
absorption tank is a cuboid which also has a circle or other shapes The absorption tank in FIGURE 1
is a cuboid The bottom and both sides of the absorption tank are ground glass and the other two sides
are optical light transmitting surfaces According to the material of the light transmitting surface the
absorption tank can be divided into two types glass absorption tank and quartz absorption tank The
glass absorption cell is used for the determination of visible light area and the quartz absorption cell is
used for the determination of ultraviolet light area The specification of absorption tank is marked by
optical path The commonly used specifications of absorption cell are 05 cm 10 cm 20 cm 30 cm
50 cm The detector is a device that converts an optical signal into an electrical signal When measuring
the absorbance it is not to directly measure the light intensity through the absorption cell but to convert
the light intensity into a current for measurement This photoelectric converter is called a detector Signal
display is a device to amplify and display the output signal of detector The new spectrophotometer is
displayed by digital voltmeter and the absorbance curve is drawn directly by recorder The new spec-
trophotometer is equipped with computer data processor (Xiaojing 2015 19-20)
FIGURE 1 The structure of ultraviolet spectrophotometer (adapted from Xiaojing 2015 19)
6
22 Diantipyryl methane spectrophotometry
DAPM is white flake crystals It is insoluble in water ether and alkali But it is soluble in acid ethanol
and chloroform DAPM is soluble in acids and forms complex organic cations with acids The solution
of DAPM is colorless and it reacts with Ti3+ to form yellow complexes DAPM can be used as a sensitive
color reagent for the determination of Ti3+ iridium iron molybdenum neodymium uranium iridium
platinum rhenium It can also be used as an extractant for various ions The molecular formula of DAPM
is C23H24N4O2H2O The molecular structure of DAPM is shown in FIGURE 2
FIGURE 2 The molecular structure of DAPM (adapted from Liu Zhou amp Song 2011 31)
The UV-vis absorption spectrum of molecules is a common spectral analysis method based on the ab-
sorption spectrum generated by the intramolecular electronic transition When a material is irradiated by
light the material molecules will collide with the light As a result the energy of photons is transferred
to the molecules In this way the stable ground state molecules will jump to the unstable high energy
state This is the absorption of the light The qualitative analysis of UV-Vis absorption spectrum is based
on the fact that the shape of absorption curve of light to the same absorption material is different the
maximum absorption wavelength is the same but the corresponding absorption rate is different There
are three properties of UV-vis absorption spectrum the first is that the same concentration of the test
solution has different absorbance for different wavelengths of light The second point is that the higher
the concentration of the same test solution the higher the absorbance Finally the smaller the concen-
tration of the same substance the same wavelength (maximum absorption wavelength λ max) corre-
sponding to the maximum absorption peak and the same curve shape The absorbance tested results of
yellow complex formed by titanium and DAPM by DAPM spectrophotometry are shown in FIGURE 3
The shape of the absorption curve can be seen from FIGURE 3 The abscissa in the chart is the wave-
length the unit of wavelength is nm The ordinate is the absorbance and the unit of absorbance is
L(g middot cm) The absorbance reaches the maximum value at the wavelength of 390 nm In the vicinity of
7
the maximum wavelength the closer to the maximum range of the spectrophotometer the greater the
sample absorbance and the smaller the error brought by the photometer itself (Junhua 2020 38)
FIGURE 3Absorbance values at different wavelengths (adapted from Junhua 2020 38)
After consulting the literatures on the determination of TiO2 by DAPM Spectrophotometry It can be
founded that the measurement method is essentially similar The specific method is as follows Firstly
the sample needs to be decomposed the sample is placed in a platinum crucible and mixed flux (lime-
stone samples with accurate TiO2 content) is added to mix with the sample Heat the crucible at high
temperature (950-1000 ) take it out and cool it then add acid to dissolve the sample After that transfer
the solution to a volumetric flask to constant volume and blend well After transferring the solution add
ascorbic acid HCl DAPM solution put it into the spectrophotometer to measure the absorbance Finally
record the data and calculate the result (Junhua 2016 39)
23 Inductively coupled plasma atomic emission spectrometry
ICP-AES has the advantages of high accuracy and precision low detection limit fast determination
wide linear range and simultaneous determination of multiple elements It has been widely used in de-
termination of dozens of elements in environmental samples and samples of rocks minerals metals
Plasma is ionized gas with an ionization degree exceeding 01 This gas contains not only neutral
atoms and molecules but also a large number of ions and electrons (Haiyan 2010 62)
8
ICP-AES is based on the spectrum emitted by atoms to determine the chemical composition of a sub-
stance Different substances are composed of atoms of different elements and the atoms all contain a
densely structured nucleus The nucleus is surrounded by moving electrons Each electron is at a certain
energy level and has a certain energy Atoms are in a stable state under normal circumstances This state
is called the ground state When the atoms are transformed into gaseous atoms under the action of exter-
nal energy the outer electrons of the gaseous atoms are excited to a high energy state When transitioning
from a higher energy level to a lower energy level the atoms will release excess energy and emit char-
acteristic lines ICP-AES disperse the generated radiation through the instrument and record it on the
photosensitive plate in the order of wavelength which can show regular spectral lines The perform
quantitative analysis based on the obtained spectrum ICP-AES is a new type of light source that is
developing rapidly and is highly valued in the analysis of emission spectrum (Haiyan 2010 62)
ICP-AES consists of sample introduction system ICP light source dispersion system and detection sys-
tem And equipped with computer control and data processing system cooling system gas control sys-
tem ICP light source consists of high frequency power supply and ICP torch tube The ICP torch tube
consists of three concentric quartz tubes and a high-frequency induction ring (generally 2-4 rings of
hollow copper tubes) surrounded by the upper part of the tube There are three intake tubes A 10-20
Lmin argon gas is passed between the quartz outer tube and the intermediate tube Its function is to form
plasma as working gas and cool the quartz torch tube which is called plasma gas or cooling gas The
intermediate tube and the central tube are filled with 05-15 Lmin argon to become auxiliary gas which
is used to assist the formation of plasma After the plasma torch is formed it can be turned off The
carrier gas in the central tube is used to introduce the sample aerosol (Xu Wang amp Xu 2020 67)
The formation of ICP torch is called ignition The ignition is divided into three steps the first step is to
introduce plasma and auxiliary gas into the outer tube and the middle tube At present the central tube
is not connected with gas and an argon atmosphere is established in the torch tube The second step is
to connect the high-frequency power supply to the induction coil The general frequency is 7-50 mhz
and the power supply is 1-15 kw At present there is high-frequency current and high-frequency elec-
tromagnetic field generated by the coil The third step is to ionize the working gas flowing in the middle
by means of high frequency spark and then the ions and electrons produced will interact with the fluc-
tuating magnetic field produced by the induction coil This interaction causes the ions and electrons in
the coil to flow along the closed loop in the figure Their resistance to this movement causes ohmic
9
heating Because of the high temperature generated by the strong current the gas is heated to form a
torch like plasma (Xu et al 2020 67)
Aerosol injection system is a commonly used method at present The sample introduction system con-
sists of two main parts sample lifting part and atomization part The sample lifting part is generally a
peristaltic pump and a self-lifting atomizer can also be used It is required that the speed of the peristaltic
pump is stable and the elasticity of the pump pipe is good so that the sample solution can be pumped in
at a constant speed and the waste liquid can be discharged smoothly The atomizing part includes atom-
izer and atomizing chamber After the sample enters the atomizer by means of pump or self-lifting small
droplets are formed under the action of carrier gas and enter the atomization chamber The large droplets
are eliminated when they touch the wall of the atomization chamber Only small droplets can enter the
plasma source (Xu et al 2020 68) For the optical system the monochromator of ICP-AES usually
adopts the combination of grating or prism and grating And for the detection system the detection
system of ICP-AES is a photoelectric converter which uses photoelectric effect to convert the radiation
energy of different wavelengths into electrical signals (Xu et al 2020 68)
As a conventional chemical analysis technology ICP-AES has a wide range of applications in biological
samples materials geology environmental protection metallurgy and other fields In the field of met-
allurgical analysis such as steel raw materials and ferroalloys it is required to measure dozens to hun-
dreds of samples at a time And each sample must simultaneously analyze dozens of elements such as
Mn Cu Al Cr Si P Ni Ti V Nb W Ca Mg It can show the absolute advantages of ICP in terms of
work efficiency In the analysis of standard materials especially the low-value fixed-value analysis of
rare earth elements the accuracy of ICP data and the simplicity of operation are fully utilized (Haiyan
2010 62) The disadvantage of the ICP-AES method is that the equipment and operating costs are rela-
tively high The sample generally needs to be converted into a solution in advance and the determination
of some elements is not obvious such as sodium (Na) and potassium (K) (Juan 2019 46)
24 Titration analysis
There are generally two types of titration analysis to determine the content of TiO2 in the sample Am-
monium ferric sulfate volumetric method and H2O2 coordination titration The specific steps of ammo-
nium ferrate sulfate volumetric method are as follows firstly reduction of TiO2+ to Ti3+ with metal
10
aluminum tablets in HCl or H2SO4 medium And then using potassium thiocyanate as an indicator Fi-
nally titration with standard solution to ammonium ferrate sulfate The method has poor sensitivity and
selectivity But there are interference elements such as vanadium tin molybdenum tungsten copper
and arsenic that affect the experimental results These elements and TiO2 are completely or partially
reduced to a low valence state and these elements are oxidized by ferric ions (Fe3+) Leading to errors
in the experimental results (Juan 2019 46)
The specific steps of H2O2 coordination titration are as follows firstly the yellow complex will be form
by adding an appropriate amount of H2O2 to a solution which containing TiO2+Then add excess EDTA
to the solution (EDTA is a good complexing agent in chemistry It has six coordination atoms The
complex formed is called chelate EDTA is often used in coordination titration to determine the content
of metal ions In biological application it is used to exclude most transition metal elements For example
it is used to exclude the interference of iron ion nickel ion and manganese ion in the experiment) Make
it form a more stable ternary complex The remaining EDTA was titrated with xylenol orange as indica-
tor For the back titration with bismuth salt solution method when the reaction is slow or the reactant is
solid add a certain amount of titration solution Normally the reaction cannot be completed immediately
At this time a certain amount of excess titrating solution can be added first to accelerate the reaction
After the reaction is completed titrating the remaining titrant with another standard solution This
method is mostly used for samples with high titanium content Although the titration analysis method
does not have high requirements for instruments and equipment but the accuracy of the measurement
results is poor and the scope of use is narrow (Juan 2019 46)
25 X-ray fluorescence spectrometry
People usually irradiate X-rays on substances to produce secondary X-rays called XRF The X-rays used
for irradiation are called primary X-rays XRF is still X-ray XRF spectrometer is mainly composed of
excitation dispersion detection recording and data unit The role of the excitation unit is to generate
primary X-rays It consists of high-voltage generator and X-ray tube The role of the dispersion unit is
to separate X-rays of the desired wavelength It consists of sample chamber slit goniometer analysis
crystal and other parts The role of the detector is to convert X-ray photon energy into electrical energy
The recording unit is composed of an amplifier a pulse amplitude analyzer and a display part X-ray
tube generates incident X-rays to excite the tested sample Each element in the excited sample emits
11
secondary X-rays and the secondary X-rays emitted by different elements have specific energy charac-
teristics or wavelength characteristics The detection system measures the energy and quantity of these
emitted secondary X-rays The instrument software converts the information collected by the detection
system into the types and contents of various elements in the sample By using the principle of X-ray
fluorescence every element after beryllium in the periodic table can be measured theoretically In prac-
tical applications the effective element measurement range is element 9 (F) to element 92 (U) in the
periodic table (Chu Li amp Jiang 2014 40)
The characteristic X-ray energy and wavelength emitted by different elements are different Therefore
no matter what kind of element can be detected by measuring the energy or wavelength of X-ray At the
same time the characteristic X-ray intensity of an element emitted after the sample is excited It is related
to the content of this element in the sample so the quantitative analysis of the element can be performed
by measuring its intensity There are two basic types of XRF spectrometers wavelength dispersive spec-
trometer and energy dispersive spectrometer The structure of the instrument is shown in FIGURE 4
12
FIGURE 4 Wavelength dispersive spectrometer and energy dispersive spectrometer (adapted from Bo
Xiao amp Tao 2015 1308)
With the development of instrument technology and theoretical methods the application range of XRF
analysis is very widely In the analysis of the composition of substances in the metallurgy geology
chemical industry machinery petroleum building materials and other industrial sectors agriculture and
medicine and health as well as physics chemistry biology geoscience environment astronomy and
archaeology and other research departments have been widely applications (Chu et al 2014 37)
13
26 Hydrogen peroxide photometry and ferrotitanium spectrophotometry
H2O2 is a colorless odorless liquid with bitter taste and easy to decompose into water and oxygen It is
a strong oxidant H2O2 is often used for sterilization in the workplace starch whitening in the industry
or as a strong oxidant for food or food packaging and liquid fuel propellant In this method phosphoric
acid (H3PO4) and H2SO4 were used to dissolve the sample In the medium of 5 H2SO4 by volume
TiO2+ and H2O2 formed a yellow complex ion in the acidic condition The stable equilibrium constant
of the complex is k = 10 times 104 and the maximum absorption wavelength is λmax = 405 nm H2O2
spectrophotometry is simple and rapid but its sensitivity and selectivity are poor Sodium catechol-35
sulfonate forms a yellow complex with titanium at pH = 47-49 Ferrotitanium reagent has high sensi-
tivity and can be used for the continuous determination of trace titanium and iron (Xinyan 2006 66)
14
3 EXPERIMENT
There are three main experimental steps sample decomposition color rendering and absorbance exper-
iment which are studied and developed extensively in this project The detail procedures of both topics
will be fully displayed Besides some important choices of chemical reagents during the experiment
will be explained by five variable value optimization experiments optimal selection of the spectropho-
tometerrsquos wavelength the optimal dosage of acidity the optimal dosage of DAPM the optimal dosage
of ascorbic acid and the interference factors analysis experimental
31 Reagents and reagents preparation
The reagents used in the experiment are as follows mixed flux grind from anhydrous sodium sulfate
and boric acid potassium pyrosulfate HCl with a density of 119 gmL H2SO4 with a density of 184
gmL HCl (1+1) ((1+1) is the solution which mix 1 ratio of HCl with 1 ratio of water in volume The
molar concentration of HCl (1+1) is 6 molL) H2SO4 (5+95) ((5+95) is the solution which mix 5 ratio
of H2SO4 with 95 ratio of water in volume The molar concentration of H2SO4 (5+95) is 09 molL)
ascorbic acid solution (20 gL) DAPM solution (50 gL) TiO2 stock solution (100 μgmL) and TiO2
standard solution (10 μgmL)
The preparation steps for ascorbic acid solution (20 gL) are as follows weigh 20g of ascorbic acid add
200-300 mL of water to dissolve the sample and stir evenly After the ascorbic acid is completely dis-
solved transfer the solution to a 1 L volumetric flask and make up to volume The preparation steps of
the TiO2 stock solution (100 μgmL) are as follows weigh 01 g of TiO2 and place it in a platinum
crucible and then add 5-7 g of potassium pyrosulfate Put them into a high-temperature furnace raise
the temperature to 600 deg C to melt Use 60 mL H2SO4 to dissolve the melt After it cooling to room
temperature transfer it to a 1000 mL volumetric flask diluted with H2SO4 to the mark and mixed fully
The preparation of the TiO2 standard solution (10 μgmL) are as follows add 50mL of TiO2 stock solu-
tion to a 500 mL volumetric flask And then add H2SO4 to constant volume and mix it well
Three instruments are used in this experiment platinum crucible (The volume needs to be greater than
30 mL) high temperature furnace (The crucible heating temperature is suitable for 100-1100 ) and
UV-vis spectrophotometer (1000 nm ge wavelength ge 180 nm) Before using the spectrophotometer
15
connect the spectrophotometer to the power supply turn on the instrument switch lift the lid of the
sample chamber and preheat the sample chamber for 10 minutes
32 Experimental procedure
Before the experiment the preparation of reagents and the commissioning of equipment need to be com-
pleted The preparatory work includes preparation of ascorbic acid solution (20 gL) preparation of
DAPM solution (50 gL) preparation of TiO2 stock solution (100 μgmL) and preparation of TiO2 stand-
ard solution (10 μgmL) After the reagent preparation is completed proceed to the second step as shown
in FIGURE 5 Dissolve the sample after weighing it Thirdly render the color of the sample solution
The fourth step is measure the absorbance of the developed solution by spectrophotometer And finally
record and process the experimental data
FIGURE 5 The experimental procedure of measuring titanium dioxide content in limestone by dianti-
pyryl methane photometry
33 Procedure of sample decomposition
In this experiment the samples selected three limestones with known accurate TiO2 content The TiO2
content (mass fraction) of sample A is 0041 the TiO2 content (mass fraction) of sample B is 0074
and the TiO2 content (mass fraction) of sample C is 013 The purpose of these accurate data is to
make a precision comparison with the data measured in this experiment and verify the accuracy of the
experimental method A total of three sets of experiments were conducted and each set was measured 6
times
The sample decomposition steps are as follows take 02 g limestone (crumb limestone) sample into a
platinum crucible add 5 g mixed flux (anhydrous sodium carbonate and boric acid) Secondly place the
platinum crucible in a high-temperature furnace and gradually increase the temperature to 950-1000
Weighing of
samplesamp
reagents
preparation
Sample
decomposition
Color
rendering
Absorbance
experiment
Experimental
data recording
16
After the sample is melted take it out and cool it to room temperature Thirdly put the crucible in the
250 mL beaker together with the sample and add HCl into the beaker Finally heat the beaker at around
75 to make the solution transparently After cooling to room temperature dilute the solution to 100
mL with water (Wang Yan amp Zhu 2013 49) During the experiment HCl is used to dissolve the sample
The choice of acid type needs to be determined through the phenomenon of sample dissolution in dif-
ferent acid systems Through experiments of dissolving samples in various acid systems the results can
be obtained the most suitable acid for dissolving limestone
For the optimal selection of the dosage and the type of acid to dissolve the sample the experimental
procedure is as follows select 025 g of limestone sample B with a TiO2 content of 0074 and place
it in 6 polytetrafluoroethylene beakers Add HCl (1+1) nitric acid (HNO3) (1+1) perchloric acid (HClO4)
(1+1) hydrofluoric acid (HF) (1+1) and H2SO4 (5+95) to dissolve the sample with different acid systems
composed of these acids Put 20 mL HCl into the first beaker By observing the solution in the beaker
the solution is cloudy with residue For the second beaker add HCl of the same volume as the first
beaker and 5 mL HNO3 The phenomenon of the solution is cloudy with residue For the third beaker
add HCl and HNO3 of the same volume as the second beaker and 10 mL HClO4 into the beaker By
observing the phenomenon of the reaction the solution is cloudy with residue For the fourth beaker put
20 mL HCl 10 mL HClO4 5 mL HF into the beaker The limestone sample is completely dissolved
And then put add HCl HNO3 and HClO4 of the same volume as the third beaker and 5 mL HF into the
fifth beaker the limestone sample is completely dissolved For the last beaker choose 20 mL HCl 10
mL HClO4 5 mL HF and 5 mL H2SO4 to dissolve the sample The solution is turbid
34 Procedure of color rendering
Whether the color rendering reaction can meet the requirements of the photometric method in addition
to mainly related to the nature of the chromogenic reagent it is also very important to control the con-
ditions of the color reaction The color rendering conditions mainly included the dosage of the chromo-
genic reagent and the acidity of the solution In order to make the color reaction as complete as possible
it is necessary to add an appropriate dosage of the chromogenic reagent If an excessive dosage of chro-
mogenic reagent is added it will cause side reactions which are not conducive to the measurement In
the experiment the appropriate dosage of the chromogenic reagent is obtained through related experi-
ments Most chromogenic reagents are organic weak acids The acidity of the solution affects the disso-
17
ciation of the chromogenic reagent and the completeness of the color rendering reaction Many chromo-
genic reagents are acid-base indicators The acidity of the solution will change the initial color of the
chromogenic reagent The acidity of the solution also has an effect on the composition and stability of
the colored complex
Three solutions need to be added in the color rendering experiment Firstly HCl needs to be added to
control the acidity of the solution Secondly ascorbic acid solution needs to be added to reduce Fe3+ to
ferrous iron (Fe2+) in the solution Because of the main interference element of this experiment is iron
So it is necessary to eliminate this interference by adding ascorbic acid solution Finally add DAPM for
color rendering reaction So before rendering colors the optimal dosage of these three solutions needs
to be found
The acidity of the solution affects the dissociation of the chromogenic reagent and the completeness of
the color rendering reaction Therefore maintaining the acidity of the solution is a prerequisite for start-
ing the color rendering experiment Determine the experiment steps of optimum dosage of HCl are as
follows take 10 mL of the test solution in 50 mL volumetric flask And then add 5 mL of ascorbic acid
solution and mix it well Place it for about 5 minutes Add 2 mL 4 mL 6 mL 8 mL 10 mL 12 mL 16
mL 20 mL HCl to 8 flasks respectively then add 7 mL of DAPM solution into each flask Dilute the
solution to the mark with water and mix it well Leave it for about half an hour at room temperature
Then put the chromogenic reagent into the spectrophotometer to measure the absorbance (detection
wavelength is 385 nm) It can be realized from TABLE 1 that the acidity in HCl medium has minimal
effect on the color rendering reaction During the analysis add 6 mL of 6 molL HCl to control the
normal concentration of about 113 N Normality (N) is defined as the number of equivalents per liter of
solution where definition of an equivalent depends on the reaction taking place in the solution For an
acid-base reaction the equivalent is the mass of acid or base that can furnish or accept exactly 1 mole of
proton (H+ ions) And this is based on the HCl concentration It can be seen from the absorbance value
in the last row of TABLE 1 that the acidity has little effect on the color rendering reaction in HCl medium
In the analysis process add 6 mL 6 molL HCl solution to control the normal concentration at 113 N
18
TABLE 1 Effect of acidity in HCl medium on color reaction
Flask1 Flask 2 Flask 3 Flask 4 Flask 5 Flask 6 Flask 7 Flask 8
HCl
(1+1) mL
2 4 6 8 10 12 16 20
Normal
concentration
(N)
065 089 113 137 161 185 233 290
Absorbance
L(gmiddotcm)
0185 0185 0185 0185 0185 0185 0185 0180
After determining the acidity of the solution the second problem to be determined is the optimal dosage
of ascorbic acid reagent Take several copies of 10 mL sample B solution with 0074 TiO2 content
add different amounts of ascorbic acid solution Then add 6 mL of HCl and 7 mL of DAPM for color
development and measure the absorbance by spectrophotometer (detection wavelength is 385 nm) The
absorbance values of different ascorbic acid dosages are shown in TABLE 2 The effect of adding
different volume of ascorbic acid on absorbance is shown in TABLE 2 The experimental results show
that when the dosage of ascorbic acid is between 3 mL and 15 mL the absorbance remains stable In
order to facilitate the operation and ensure complete reduction reaction we chose the dosage of ascorbic
acid to be 5 mL
TABLE 2 The absorbance values of different ascorbic acid dosages
Flask 1 Flask2 Flask3 Flask4 Flask5 Flask6
Ascorbic
acid (mL)
1 3 5 6 10 15
Absorbance
L(gmiddotcm)
0509 0514 0515 0515 0515 0515
After determining the dosage of the HCl and the ascorbic acid the third question is the optimal dosage
of DAPM Firstly take several copies of 5 mL sample B solution which content about 0074 of TiO2
and put the each solution into a 50 mL volumetric flask Secondly add 6 mL of HCl 5 mL of ascorbic
acid and different amounts of DAPM for color rendering reaction Finally measure the absorbance value
19
at 385 nm wavelength the experimental results are shown in the TABLE 3 From the experimental data
it can be seen that the absorbance of the DAPM chromogenic reagent is basically constant when it is
above 5 mL So the optimum dosage of the DAPM chromogenic reagent is 7 mL
TABLE 3 The dosage of DAPM experiment
Flask1 Flask2 Flask3 Flask4 Flask5 Flask6 Flask7 Flask8 Flask9
The dosage of
DAPM (mL)
2 3 4 5 6 7 8 9 10
Absorbance
L(gmiddotcm)
0226 0259 0282 0299 0231 0232 0232 0234 0233
Through the above three experiments (determine the optimal dosage of HCl ascorbic acid and DAPM)
the exact dosage of the three reagents in the color rendering experiment was determined The order and
steps of adding the three reagents are as follows firstly take 10 mL of TiO2 standard solution and put it
in a 50 mL volumetric flask Secondly add 5 mL of ascorbic acid solution mix it well Place the solution
for 5 minutes in the room temperature Then add 6 ml hydrochloric acid to mix the reagent evenly
Finally add 7 mL of DAPM into the solution Dilute the solution to the mark with water and mix it well
Leave it for 30 minutes in the room temperature and prepare to measure the absorbance
35 Procedure of the absorbance measuring
After the color rendering reaction is completed the test solution needs to be placed in a cuvette for
absorbance testing By changing the test wavelength the optimal wavelength is determined according
to the absorbance corresponding to each wavelength The absorbance at different wavelengths after color
development is shown in TABLE 4 It can be seen from the data that the wavelength has a maximum
value at 380-390 nm To ensure the best sensitivity the test wavelength is selected at 385 nm Under the
test of the maximum absorption wavelength the response of the instrument is more sensitive and the
measurement data is more accurate
20
TABLE 4 Optimal wavelength test data
Flask1 Flask2 Flask3 Flask1 Flask4 Flask5 Flask6 Flask7
Wavelength (nm) 360 370 380 385 390 400 410 420
Absorbance
L(gmiddotcm)
0499 0533 0547 0554 0543 0533 0502 0461
After determining the optimal wavelength use the spectrophotometer to analyze the content of TiO2 in
the sample firstly prepare the spectrophotometer and open the sample chamber cover Turn on the
power and the indicator lights up let the instrument warm up for 20 minutes Set the selector switch to
the T knob to display the number as 000 Secondly turn the wavelength knob to the 385 nm wave-
length and align the scale line Transfer the color rendering solution into a 3 cm cuvette and place it on
the colorimetric shelves And then close the sample chamber cover and adjust the light transmittance
100 T knob to make the number display as 1000 T Turn the selector switch to the A zero adjust-
ment knob the digital display should be 000 Then pull out the lever to put the solution to be measured
into the optical path and the digital display value is the absorbance A of the sample According to the
absorbance data it can be easily get the mass of TiO2 in the test solution After the measurement is
completed open the sample chamber cover and turn off the power switch
36 Interference test of calcium and magnesium ions
The main components of limestone are CaO and magnesium oxide (MgO) In order to determine whether
CaO or MgO has an effect on the determination of TiO2 Firstly prepare two standard solutions CaO
standard solution and MgO standard solution The content of CaO in the CaO standard solution is 10
mgL And the content of MgO in the MgO standard solution is 10 mgL Extract several parts from the
two prepared solutions and add a certain amount of TiO2 standard solution 4 mL (The amount of TiO2
added is 40 ug) to each part According to the method of 34 for color rendering the interference
experiment results of calcium ion and magnesium ion are as shown in TABLE 5 It can be seen from the
absorbance value in TABLE 5 that CaO and MgO have no effect on the determination of TiO2 There
was no difference in absorbance before and after adding CaO and MgO
21
TABLE 5 The interference experiment results of calcium ion and magnesium ion
Flask 1 Flask 2 Flask 3 Flask 4
The amount of TiO2 added 40 ug 40 ug 40 ug 40 ug
The amount of CaO added
(no MgO)
10 mg 20 mg 30 mg 40 mg
Absorbance L(gmiddotcm) 0551 0548 0550 0551
Flask 5 Flask 6 Flask 7 Flask 8
The amount of TiO2 added 40 ug 40 ug 40 ug 40 ug
The amount of MgO added
(no CaO )
10 mg 15 mg 20 mg 25 mg
Absorbance L(gmiddotcm) 0551 0550 0548 0551
22
4 RESULTS AND DISCUSSIONS
Through the acid system selection experiment the optimal selection of the spectrophotometerrsquos wave-
length experiment the optimal dosage of acidity selection experiment the optimal dosage of DAPM
selection experiment the optimal dosage of ascorbic acid selection experiment and the interference fac-
tors analysis experimental the accurate dosage of reagents was determined by these experiments Ac-
cording to the reaction phenomena or absorbance results of each experiment the corresponding experi-
mental results were obtained
In the acid system selection experiment the following conclusions can be drawn from the observation
of six experimental phenomena In the system of HF and HClO4 the sample is completely dissolved (the
precipitation is precipitated by adding H2SO4 the solution is turbid) but HClO4 and HF have a effect on
the determination of titanium and the fluoride ion is easy to complex with titanium And this
combination is likely to lead to the results on the low performance The presence of HClO4 can combine
with DAPM to produce white flocculent precipitate which led to the failure of the experiment In order
to eliminate the influence of insoluble residue to the analysis and ensure the sample is completely
dissolved The experiment uses the usual method which is anhydrous sodium carbonate and boric acid
system solvent mixed together for melting This method is simple and fast and the melting is complete
The acid system is relatively simple without introducing HClO4 acid HF acid and other kinds of acid
HCl is used to dissolve the sample and the sample dissolves quickly
In the optimal dosage of acidity selection experiment By observing the results of absorbance under
different acidity The best color acidity can be obtained add 6 mL of 6 molL HCl to control the color
acidity of solution In the optimal dosage of DAPM selection experiment through the absorbance test
results of solutions with different DAPM dosage It can be concluded from the data that the best dosage
of DAPM solution is 7 mL In the the optimal selection of the spectrophotometerrsquos wavelength
experiment according to the test results of absorbance of solution at different wavelengths it can be
concluded that the optimal wavelength is 385 nm In the optimal dosage of ascorbic acid selection
experiment through the absorbance test results of several solutions added with different volume of
ascorbic acid it can be concluded that the optimal dosage of ascorbic acid is 5 mL In the interference
factors analysis experimental it can be seen from the absorbance value in experiment results that CaO
and MgO have no effect on the determination of TiO2 By determining the accurate dosage of various
reagents a set of measurement steps with accurate actual dosage is formulated
23
41 Measurement results of titanium dioxide content
The content of TiO2 in three limestone samples was determined six times in parallel The analysis result
is rounded according to the rules of bankerrsquos rounding In order to avoid the phenomenon of big error
caused by rounding rules The specific method of data processing in this rule is as follows when the
mantissa is less than or equal to 4 the mantissa will be directly rounded off When the mantissa is greater
than or equal to 6 round off the mantissa and carry forward one digit When the mantissa is equal to 5
but the numbers after the mantissa are all 0 the previous digit of the mantissa should be used as a refer-
ence If the previous number is an odd number move one digit forward If the previous number is even
the mantissa is discarded If the mantissa is 5 but there is a number that is not 0 after the mantissa
whether the number before the mantissa is odd or even the number must move forward one bit
This experiment is carried out under the specified repeatability conditions the same experimental re-
searcher carries out the experiment uses the same instrument to carry out the experimental measurement
carries out the experiment under the same experimental conditions carries out the same calibration in a
short time TiO2 content is calculated according to the mass fraction WTiO2 calculation formula (1)
2
6
1
1
10100
TiO
mw
m V V
minus=
(1)
V1 The volume of the solution obtained separately from the sample solution The unit is milliliter (mL)
V Total volume of sample solution The unit is milliliter (mL)
m1 The quality of the titanium dioxide obtained separately from the sample solution The unit is mi-
crogram (μg)
m The quality of the sample The unit is gram (g)
The measurement results of the experiment are shown in the TABLE 6 The experimental data compared
with the TiO2 content in three limestone samples are shown in TABLE 7 For sample A the TiO2 content
obtained from the first and third experiments is basically consistent with the known accurate TiO2
content of sample A In addition to the second experimental data the accuracy of other experimental
data is good Compare with the other five groups of data the results of the second experiment have
relatively large errors For sample B the content of TiO2 obtained in the third experiment is almost the
same as the given value The TiO2 content measured in the fifth experiment is quite different from the
given value compared with the other five groups of data For sample C the TiO2 content obtained from
six experiments is almost the same as the given TiO2 content
24
TABLE 6 Experimental measurement data
Experiment
1
Experiment
2
Experiment
3
Experiment
4
Experiment
5
Experiment
6
Sample A
()
00412 00423 00409 00414 00416 00415
Sample B
()
00730 00750 00740 00765 00780 00735
Sample C
()
01250 01280 01290 01310 01240 01260
42 Accuracy of results discussion
From the average value of the data it can be seen that the accuracy of using the DAPM photometry to
determine the TiO2 content in limestone TABLE 7 is the average value of TiO2 content measured in six
experiments for each sample from TABLE 6 The second column is the certified value of the three
samples The mass fraction of TiO2 content in sample A is 0041 The mass fraction of TiO2 content
in sample B is 0074 The mass fraction of TiO2 content in sample C is 013 And the third column
is the average values which are obtained through experimental measurement and calculation As can be
seen from TABLE 7 The average value of TiO2 content in several groups of limestone samples meas-
ured by this experiment have high accuracy
TABLE 7 Average mass fraction of TiO2 content in limestone
Certified value Average value
Sample A () 0041 00414
Sample B () 0074 00750
Sample C () 0130 01272
HCl was used to dissolve the sample If HClO4 is used in the experiment it will form white flocculent
precipitate with DAPM which will affect the absorbance test If HF is used in the experiment fluorine
ions will complexate with titanium to form titanium fluoride complex which will affect the accuracy of
25
the experimental results If only HNO3 is used for decomposition except for incomplete decomposition
of the sample HNO3 also destroys DAPM thus affecting the continuation of the experiment According
to the dissolution treatment experiment and acidification experiment the HCl system is relatively simple
without the introduction of HClO4 HF and other types of acids And the sample dissolves quickly by
HCl leaching
In the experiment of determine the optimal dosage of DAPM solution it can be concluded that the
optimal dosage of DAPM is 7mL When the amount of DAPM is more than 6 mL the absorbance tends
to be stable If the flux of DAPM does not reach 6 mL the color reaction will be incomplete which will
affect the whole experiment For the selection of the amount of ascorbic acid ascorbic acid is used to
reduce Fe3+ in the solution to Fe2+ In order to eliminate the interference 5 mL ascorbic acid was selected
to reduce Fe3+ in the sample If the amount of ascorbic acid is less than 5 mL the remaining unreduced
Fe3+ will affect the accuracy of the whole experiment
In this experiment temperature and time have influence on the measurement results In 15-80 the
absorbance value is not affected by temperature However if the iron content in the sample is high and
the temperature is higher than 60 the solution is easy to be turbid and unable to compare colors
Therefore this experiment uses 15-30 room temperature to render color The color solution is very
stable and can be maintained for several months When the room temperature is higher than 20 it
tends to be stable after 20 minutes of color development When the room temperature is lower than 20
it needs 40-60 minutes to be stable In this color rendering experiment the accuracy of temperature
control is particularly important
When selecting the optimal wavelength of the test absorbance the wavelength corresponding to the
maximum absorbance is selected according to the absorption curve of the test solution In this experiment
when the wavelength is 385 nm the absorbance changes with the concentration in the largest range so
the determination is the most sensitive The absorption curve is an important basis for choosing the
wavelength of incident light in quantitative analysis In the wavelength selection experiment if the
wavelength corresponding to the maximum absorbance is not selected the accuracy of the experiment
will be insufficient
26
5 CONCLUSION
In this experiment the DAPM photometric method was used to determine the content of TiO2 The
sample is melted by sodium carbonate-boric acid mixed flux and leached with dilute HCl The experi-
ment used ascorbic acid as a masking agent to reduce Fe3+ to Fe2+ in the solution to eliminate interference
In this experiment DAPM solution was added to render the solution color In order to ensure the accu-
racy of the experimental results the amount of various reagents was optimized The following five as-
pects were quantitatively analyzed in the experiment optimal selection of the spectrophotometerrsquos
wavelength the optimal dosage of acidity the optimal dosage of DAPM the optimal dosage of ascorbic
acid and the interference factors analysis The exact dosage of each reagent was determined The TiO2
content measured in the experiment was compared with limestone with known accurate TiO2 content
The accuracy of the measurement can be seen in this experiment This experimental method has a perfect
effect on the use of spectrophotometers and promotes the determination of mineral raw materials con-
taining low TiO2 content by spectrophotometer
For the measurement results of the experiment there is a certain error between the TiO2 content meas-
ured in this experiment and the TiO2 content given in the limestone sample Through the interference
element analysis experiment it is determined that the two main components of limestone (MgO and
CaO) are not the cause of this error For several values with slightly poor accuracy there may be some
problems in the operation of the experiment The most likely reason for the poor accuracy of the data is
that after the sample dissolves the color reaction does not wait until the solution cools to room temper-
ature Another possibility is that the limestone sample is not well preserved resulting in a certain error
between the actual TiO2 value and the given value In the future experiments the above two error aspects
are further studied to ensure that the measurement method is accurate and the measurement results are
more accurate
Compared to ammonium ferric sulfate volumetric method and H2O2 coordination titration method
DAPM photometric method has high accuracy and eliminates the interference of vanadium molyb-
denum tungsten copper arsenic and other elements to the experiment Compared to ICP-AES method
DAPM photometric method is simple in operation and suitable for popularization and application The
results of the project provided a technical method for accurately and quickly determining the content of
TiO2 in limestone
27
REFERENCES
Bo H Xiaomei W amp Tao Y 2015 The development and application of X-Ray fluorescence
spectrometer Nuclear Electronics amp Detection Technology 1307-1311
Chen C 2005 Determinition of TiO2 in mine with diantipyrylmethane spectrophotometry Tian jing
Metallurgy 43(4) 9-10
Chen Z 2009 Research and Fabrication of Opto-mechanical Systems of New UV Spectrophotometer
Chu N Li W amp Jiang X 2014 Determination of major and minor compoments in limestone by
wavelength dispersive X-ray fluorescence spectrometry with fusion sample preparation Metallurgical
analysis 34(10) 37-41
Chu Y 1983 Development of X-ray fluorescence spectrometer DOI 10 13595 j cnki issn1000 -
0720 1983 0062
Deng J 2016 Determination of Titanium Dioxide in Titanium Slag by Diantipyrylmethane
Spectrophotometry Physico-ChemistryampChemical-Chemistry 52(1) 37-40
Deng J 2020 Determination of Titanium in Titanium Ferroalloy by Spectrophotometry with
Diantipyrylmethane Angang technology 2(1) 36-39
Du M 2017 Simultaneous determination of Fe Al Ca Mg K Na Ti in limestone by inductively
coupled plasma atomic emission spectrometry with microwave digestion Metallurgical Analysis
26(4) 30
Jin L Meng H amp Yinglin D 2008 Determining titanium dioxide in ores by ICP-AES Jilin
geology 27(1) 83-85
Khavar A amp Asadollahzadeh H 2020 Preconcentration and determination of nickel (Ⅱ)and
copper(Ⅱ) ions Elsevier Inc DOI101016jjfca2020103457
Li C 2006 Determination of SiO2 Cao MgO Al2O3 Fe2O3 and P2O5 in limestone and dolomite by
XRF melting method Shandong Metallurgy 28(6) 10-14
Li H 2005 Diantipyric methane spectrophotometric determination of titanium in magnesium
chloride Journal of environmental management college of China 15(3) 113-114
Liu X Zhong Y amp Song H 2011 Synthesis of Diantipyrylmethane aromatic ring derivatives and
its application in photometric analysis Jiangxi Nonferrous Metals 15 30-35
Mohamed E amp Hassan A 2015 Characterization of visiblelight activated TiO2 catalysts and their
photocatalytic performance study Huazhong Agricultural University 4-16
Pan X 2015 Development Trend of Ultraviolet Spectrophotometer Science and Technology amp
Innovation(14) 19-21
Peng X 2012 Study on spectrum analytical system of visible spectrometer Tianjin University 3-12
28
Shao H 2001 Determination of chloride ion in copper electrolyte by potentiometric titration
metallurgical analysis 21(4) 64-65
Song X 2006 Determination of titanium dioxide in vanadic titanomagnetite by hydrogen peroxide
Spectrophotometry Metallurgical Analysis 26(3)
Sunil R amp Kalpana C 2011 Synthesis of diarypyrimidinones (DAPMs) using large porezeolites
Journal of molecular catalysis 210-215
Wang R Yan W amp Zhu X 2013 Methods for chemical analysis of limestone quicklime and
hydrated lime for building materials Cement(4) 49-50
Wang H 2010 Discussion on the principle and maintenance of ICP- AES Electronic product
reliability and environmental testing 28(4) 60-63
Xu C Wang Q Xu W Dai M amp Qi 2020 Trouble shooting of inductively coupled plasma
atomic emission spectrometer Metallurgical analysis 40 66-71
Xu C Wang Q amp Xu W 2020 Fault analysis and treatment of inductively coupled plasma atomic
emission spectrometer Metallurgical analysis 40(2) 66-71
Yang Z 2008 Simultaneous quantification measurement of SiFeTiCaMgZr in corundum by
inductively coupled plasma-atomic emission spectrometry with secondary-melting method Rock
and mineral analysis 31(2)
Zhang J 2019 Discussion on the determination of TiO2 by Diantipyrylmethane Spectrophotometry
Chemical enterprise management(1) 45-46
Zhi P 1999 Development and application of biochemical instruments Telecommunication
Engineering 6(2)
Zhang Q 2009 Determination of Al2O3 CaO Fe2O3 MgO MnO SiO2TiO2 in Limestone and
Dolomite by ICP-AES Analysis and testing technology and instruments 15(3) 179-181

6
22 Diantipyryl methane spectrophotometry
DAPM is white flake crystals It is insoluble in water ether and alkali But it is soluble in acid ethanol
and chloroform DAPM is soluble in acids and forms complex organic cations with acids The solution
of DAPM is colorless and it reacts with Ti3+ to form yellow complexes DAPM can be used as a sensitive
color reagent for the determination of Ti3+ iridium iron molybdenum neodymium uranium iridium
platinum rhenium It can also be used as an extractant for various ions The molecular formula of DAPM
is C23H24N4O2H2O The molecular structure of DAPM is shown in FIGURE 2
FIGURE 2 The molecular structure of DAPM (adapted from Liu Zhou amp Song 2011 31)
The UV-vis absorption spectrum of molecules is a common spectral analysis method based on the ab-
sorption spectrum generated by the intramolecular electronic transition When a material is irradiated by
light the material molecules will collide with the light As a result the energy of photons is transferred
to the molecules In this way the stable ground state molecules will jump to the unstable high energy
state This is the absorption of the light The qualitative analysis of UV-Vis absorption spectrum is based
on the fact that the shape of absorption curve of light to the same absorption material is different the
maximum absorption wavelength is the same but the corresponding absorption rate is different There
are three properties of UV-vis absorption spectrum the first is that the same concentration of the test
solution has different absorbance for different wavelengths of light The second point is that the higher
the concentration of the same test solution the higher the absorbance Finally the smaller the concen-
tration of the same substance the same wavelength (maximum absorption wavelength λ max) corre-
sponding to the maximum absorption peak and the same curve shape The absorbance tested results of
yellow complex formed by titanium and DAPM by DAPM spectrophotometry are shown in FIGURE 3
The shape of the absorption curve can be seen from FIGURE 3 The abscissa in the chart is the wave-
length the unit of wavelength is nm The ordinate is the absorbance and the unit of absorbance is
L(g middot cm) The absorbance reaches the maximum value at the wavelength of 390 nm In the vicinity of
7
the maximum wavelength the closer to the maximum range of the spectrophotometer the greater the
sample absorbance and the smaller the error brought by the photometer itself (Junhua 2020 38)
FIGURE 3Absorbance values at different wavelengths (adapted from Junhua 2020 38)
After consulting the literatures on the determination of TiO2 by DAPM Spectrophotometry It can be
founded that the measurement method is essentially similar The specific method is as follows Firstly
the sample needs to be decomposed the sample is placed in a platinum crucible and mixed flux (lime-
stone samples with accurate TiO2 content) is added to mix with the sample Heat the crucible at high
temperature (950-1000 ) take it out and cool it then add acid to dissolve the sample After that transfer
the solution to a volumetric flask to constant volume and blend well After transferring the solution add
ascorbic acid HCl DAPM solution put it into the spectrophotometer to measure the absorbance Finally
record the data and calculate the result (Junhua 2016 39)
23 Inductively coupled plasma atomic emission spectrometry
ICP-AES has the advantages of high accuracy and precision low detection limit fast determination
wide linear range and simultaneous determination of multiple elements It has been widely used in de-
termination of dozens of elements in environmental samples and samples of rocks minerals metals
Plasma is ionized gas with an ionization degree exceeding 01 This gas contains not only neutral
atoms and molecules but also a large number of ions and electrons (Haiyan 2010 62)
8
ICP-AES is based on the spectrum emitted by atoms to determine the chemical composition of a sub-
stance Different substances are composed of atoms of different elements and the atoms all contain a
densely structured nucleus The nucleus is surrounded by moving electrons Each electron is at a certain
energy level and has a certain energy Atoms are in a stable state under normal circumstances This state
is called the ground state When the atoms are transformed into gaseous atoms under the action of exter-
nal energy the outer electrons of the gaseous atoms are excited to a high energy state When transitioning
from a higher energy level to a lower energy level the atoms will release excess energy and emit char-
acteristic lines ICP-AES disperse the generated radiation through the instrument and record it on the
photosensitive plate in the order of wavelength which can show regular spectral lines The perform
quantitative analysis based on the obtained spectrum ICP-AES is a new type of light source that is
developing rapidly and is highly valued in the analysis of emission spectrum (Haiyan 2010 62)
ICP-AES consists of sample introduction system ICP light source dispersion system and detection sys-
tem And equipped with computer control and data processing system cooling system gas control sys-
tem ICP light source consists of high frequency power supply and ICP torch tube The ICP torch tube
consists of three concentric quartz tubes and a high-frequency induction ring (generally 2-4 rings of
hollow copper tubes) surrounded by the upper part of the tube There are three intake tubes A 10-20
Lmin argon gas is passed between the quartz outer tube and the intermediate tube Its function is to form
plasma as working gas and cool the quartz torch tube which is called plasma gas or cooling gas The
intermediate tube and the central tube are filled with 05-15 Lmin argon to become auxiliary gas which
is used to assist the formation of plasma After the plasma torch is formed it can be turned off The
carrier gas in the central tube is used to introduce the sample aerosol (Xu Wang amp Xu 2020 67)
The formation of ICP torch is called ignition The ignition is divided into three steps the first step is to
introduce plasma and auxiliary gas into the outer tube and the middle tube At present the central tube
is not connected with gas and an argon atmosphere is established in the torch tube The second step is
to connect the high-frequency power supply to the induction coil The general frequency is 7-50 mhz
and the power supply is 1-15 kw At present there is high-frequency current and high-frequency elec-
tromagnetic field generated by the coil The third step is to ionize the working gas flowing in the middle
by means of high frequency spark and then the ions and electrons produced will interact with the fluc-
tuating magnetic field produced by the induction coil This interaction causes the ions and electrons in
the coil to flow along the closed loop in the figure Their resistance to this movement causes ohmic
9
heating Because of the high temperature generated by the strong current the gas is heated to form a
torch like plasma (Xu et al 2020 67)
Aerosol injection system is a commonly used method at present The sample introduction system con-
sists of two main parts sample lifting part and atomization part The sample lifting part is generally a
peristaltic pump and a self-lifting atomizer can also be used It is required that the speed of the peristaltic
pump is stable and the elasticity of the pump pipe is good so that the sample solution can be pumped in
at a constant speed and the waste liquid can be discharged smoothly The atomizing part includes atom-
izer and atomizing chamber After the sample enters the atomizer by means of pump or self-lifting small
droplets are formed under the action of carrier gas and enter the atomization chamber The large droplets
are eliminated when they touch the wall of the atomization chamber Only small droplets can enter the
plasma source (Xu et al 2020 68) For the optical system the monochromator of ICP-AES usually
adopts the combination of grating or prism and grating And for the detection system the detection
system of ICP-AES is a photoelectric converter which uses photoelectric effect to convert the radiation
energy of different wavelengths into electrical signals (Xu et al 2020 68)
As a conventional chemical analysis technology ICP-AES has a wide range of applications in biological
samples materials geology environmental protection metallurgy and other fields In the field of met-
allurgical analysis such as steel raw materials and ferroalloys it is required to measure dozens to hun-
dreds of samples at a time And each sample must simultaneously analyze dozens of elements such as
Mn Cu Al Cr Si P Ni Ti V Nb W Ca Mg It can show the absolute advantages of ICP in terms of
work efficiency In the analysis of standard materials especially the low-value fixed-value analysis of
rare earth elements the accuracy of ICP data and the simplicity of operation are fully utilized (Haiyan
2010 62) The disadvantage of the ICP-AES method is that the equipment and operating costs are rela-
tively high The sample generally needs to be converted into a solution in advance and the determination
of some elements is not obvious such as sodium (Na) and potassium (K) (Juan 2019 46)
24 Titration analysis
There are generally two types of titration analysis to determine the content of TiO2 in the sample Am-
monium ferric sulfate volumetric method and H2O2 coordination titration The specific steps of ammo-
nium ferrate sulfate volumetric method are as follows firstly reduction of TiO2+ to Ti3+ with metal
10
aluminum tablets in HCl or H2SO4 medium And then using potassium thiocyanate as an indicator Fi-
nally titration with standard solution to ammonium ferrate sulfate The method has poor sensitivity and
selectivity But there are interference elements such as vanadium tin molybdenum tungsten copper
and arsenic that affect the experimental results These elements and TiO2 are completely or partially
reduced to a low valence state and these elements are oxidized by ferric ions (Fe3+) Leading to errors
in the experimental results (Juan 2019 46)
The specific steps of H2O2 coordination titration are as follows firstly the yellow complex will be form
by adding an appropriate amount of H2O2 to a solution which containing TiO2+Then add excess EDTA
to the solution (EDTA is a good complexing agent in chemistry It has six coordination atoms The
complex formed is called chelate EDTA is often used in coordination titration to determine the content
of metal ions In biological application it is used to exclude most transition metal elements For example
it is used to exclude the interference of iron ion nickel ion and manganese ion in the experiment) Make
it form a more stable ternary complex The remaining EDTA was titrated with xylenol orange as indica-
tor For the back titration with bismuth salt solution method when the reaction is slow or the reactant is
solid add a certain amount of titration solution Normally the reaction cannot be completed immediately
At this time a certain amount of excess titrating solution can be added first to accelerate the reaction
After the reaction is completed titrating the remaining titrant with another standard solution This
method is mostly used for samples with high titanium content Although the titration analysis method
does not have high requirements for instruments and equipment but the accuracy of the measurement
results is poor and the scope of use is narrow (Juan 2019 46)
25 X-ray fluorescence spectrometry
People usually irradiate X-rays on substances to produce secondary X-rays called XRF The X-rays used
for irradiation are called primary X-rays XRF is still X-ray XRF spectrometer is mainly composed of
excitation dispersion detection recording and data unit The role of the excitation unit is to generate
primary X-rays It consists of high-voltage generator and X-ray tube The role of the dispersion unit is
to separate X-rays of the desired wavelength It consists of sample chamber slit goniometer analysis
crystal and other parts The role of the detector is to convert X-ray photon energy into electrical energy
The recording unit is composed of an amplifier a pulse amplitude analyzer and a display part X-ray
tube generates incident X-rays to excite the tested sample Each element in the excited sample emits
11
secondary X-rays and the secondary X-rays emitted by different elements have specific energy charac-
teristics or wavelength characteristics The detection system measures the energy and quantity of these
emitted secondary X-rays The instrument software converts the information collected by the detection
system into the types and contents of various elements in the sample By using the principle of X-ray
fluorescence every element after beryllium in the periodic table can be measured theoretically In prac-
tical applications the effective element measurement range is element 9 (F) to element 92 (U) in the
periodic table (Chu Li amp Jiang 2014 40)
The characteristic X-ray energy and wavelength emitted by different elements are different Therefore
no matter what kind of element can be detected by measuring the energy or wavelength of X-ray At the
same time the characteristic X-ray intensity of an element emitted after the sample is excited It is related
to the content of this element in the sample so the quantitative analysis of the element can be performed
by measuring its intensity There are two basic types of XRF spectrometers wavelength dispersive spec-
trometer and energy dispersive spectrometer The structure of the instrument is shown in FIGURE 4
12
FIGURE 4 Wavelength dispersive spectrometer and energy dispersive spectrometer (adapted from Bo
Xiao amp Tao 2015 1308)
With the development of instrument technology and theoretical methods the application range of XRF
analysis is very widely In the analysis of the composition of substances in the metallurgy geology
chemical industry machinery petroleum building materials and other industrial sectors agriculture and
medicine and health as well as physics chemistry biology geoscience environment astronomy and
archaeology and other research departments have been widely applications (Chu et al 2014 37)
13
26 Hydrogen peroxide photometry and ferrotitanium spectrophotometry
H2O2 is a colorless odorless liquid with bitter taste and easy to decompose into water and oxygen It is
a strong oxidant H2O2 is often used for sterilization in the workplace starch whitening in the industry
or as a strong oxidant for food or food packaging and liquid fuel propellant In this method phosphoric
acid (H3PO4) and H2SO4 were used to dissolve the sample In the medium of 5 H2SO4 by volume
TiO2+ and H2O2 formed a yellow complex ion in the acidic condition The stable equilibrium constant
of the complex is k = 10 times 104 and the maximum absorption wavelength is λmax = 405 nm H2O2
spectrophotometry is simple and rapid but its sensitivity and selectivity are poor Sodium catechol-35
sulfonate forms a yellow complex with titanium at pH = 47-49 Ferrotitanium reagent has high sensi-
tivity and can be used for the continuous determination of trace titanium and iron (Xinyan 2006 66)
14
3 EXPERIMENT
There are three main experimental steps sample decomposition color rendering and absorbance exper-
iment which are studied and developed extensively in this project The detail procedures of both topics
will be fully displayed Besides some important choices of chemical reagents during the experiment
will be explained by five variable value optimization experiments optimal selection of the spectropho-
tometerrsquos wavelength the optimal dosage of acidity the optimal dosage of DAPM the optimal dosage
of ascorbic acid and the interference factors analysis experimental
31 Reagents and reagents preparation
The reagents used in the experiment are as follows mixed flux grind from anhydrous sodium sulfate
and boric acid potassium pyrosulfate HCl with a density of 119 gmL H2SO4 with a density of 184
gmL HCl (1+1) ((1+1) is the solution which mix 1 ratio of HCl with 1 ratio of water in volume The
molar concentration of HCl (1+1) is 6 molL) H2SO4 (5+95) ((5+95) is the solution which mix 5 ratio
of H2SO4 with 95 ratio of water in volume The molar concentration of H2SO4 (5+95) is 09 molL)
ascorbic acid solution (20 gL) DAPM solution (50 gL) TiO2 stock solution (100 μgmL) and TiO2
standard solution (10 μgmL)
The preparation steps for ascorbic acid solution (20 gL) are as follows weigh 20g of ascorbic acid add
200-300 mL of water to dissolve the sample and stir evenly After the ascorbic acid is completely dis-
solved transfer the solution to a 1 L volumetric flask and make up to volume The preparation steps of
the TiO2 stock solution (100 μgmL) are as follows weigh 01 g of TiO2 and place it in a platinum
crucible and then add 5-7 g of potassium pyrosulfate Put them into a high-temperature furnace raise
the temperature to 600 deg C to melt Use 60 mL H2SO4 to dissolve the melt After it cooling to room
temperature transfer it to a 1000 mL volumetric flask diluted with H2SO4 to the mark and mixed fully
The preparation of the TiO2 standard solution (10 μgmL) are as follows add 50mL of TiO2 stock solu-
tion to a 500 mL volumetric flask And then add H2SO4 to constant volume and mix it well
Three instruments are used in this experiment platinum crucible (The volume needs to be greater than
30 mL) high temperature furnace (The crucible heating temperature is suitable for 100-1100 ) and
UV-vis spectrophotometer (1000 nm ge wavelength ge 180 nm) Before using the spectrophotometer
15
connect the spectrophotometer to the power supply turn on the instrument switch lift the lid of the
sample chamber and preheat the sample chamber for 10 minutes
32 Experimental procedure
Before the experiment the preparation of reagents and the commissioning of equipment need to be com-
pleted The preparatory work includes preparation of ascorbic acid solution (20 gL) preparation of
DAPM solution (50 gL) preparation of TiO2 stock solution (100 μgmL) and preparation of TiO2 stand-
ard solution (10 μgmL) After the reagent preparation is completed proceed to the second step as shown
in FIGURE 5 Dissolve the sample after weighing it Thirdly render the color of the sample solution
The fourth step is measure the absorbance of the developed solution by spectrophotometer And finally
record and process the experimental data
FIGURE 5 The experimental procedure of measuring titanium dioxide content in limestone by dianti-
pyryl methane photometry
33 Procedure of sample decomposition
In this experiment the samples selected three limestones with known accurate TiO2 content The TiO2
content (mass fraction) of sample A is 0041 the TiO2 content (mass fraction) of sample B is 0074
and the TiO2 content (mass fraction) of sample C is 013 The purpose of these accurate data is to
make a precision comparison with the data measured in this experiment and verify the accuracy of the
experimental method A total of three sets of experiments were conducted and each set was measured 6
times
The sample decomposition steps are as follows take 02 g limestone (crumb limestone) sample into a
platinum crucible add 5 g mixed flux (anhydrous sodium carbonate and boric acid) Secondly place the
platinum crucible in a high-temperature furnace and gradually increase the temperature to 950-1000
Weighing of
samplesamp
reagents
preparation
Sample
decomposition
Color
rendering
Absorbance
experiment
Experimental
data recording
16
After the sample is melted take it out and cool it to room temperature Thirdly put the crucible in the
250 mL beaker together with the sample and add HCl into the beaker Finally heat the beaker at around
75 to make the solution transparently After cooling to room temperature dilute the solution to 100
mL with water (Wang Yan amp Zhu 2013 49) During the experiment HCl is used to dissolve the sample
The choice of acid type needs to be determined through the phenomenon of sample dissolution in dif-
ferent acid systems Through experiments of dissolving samples in various acid systems the results can
be obtained the most suitable acid for dissolving limestone
For the optimal selection of the dosage and the type of acid to dissolve the sample the experimental
procedure is as follows select 025 g of limestone sample B with a TiO2 content of 0074 and place
it in 6 polytetrafluoroethylene beakers Add HCl (1+1) nitric acid (HNO3) (1+1) perchloric acid (HClO4)
(1+1) hydrofluoric acid (HF) (1+1) and H2SO4 (5+95) to dissolve the sample with different acid systems
composed of these acids Put 20 mL HCl into the first beaker By observing the solution in the beaker
the solution is cloudy with residue For the second beaker add HCl of the same volume as the first
beaker and 5 mL HNO3 The phenomenon of the solution is cloudy with residue For the third beaker
add HCl and HNO3 of the same volume as the second beaker and 10 mL HClO4 into the beaker By
observing the phenomenon of the reaction the solution is cloudy with residue For the fourth beaker put
20 mL HCl 10 mL HClO4 5 mL HF into the beaker The limestone sample is completely dissolved
And then put add HCl HNO3 and HClO4 of the same volume as the third beaker and 5 mL HF into the
fifth beaker the limestone sample is completely dissolved For the last beaker choose 20 mL HCl 10
mL HClO4 5 mL HF and 5 mL H2SO4 to dissolve the sample The solution is turbid
34 Procedure of color rendering
Whether the color rendering reaction can meet the requirements of the photometric method in addition
to mainly related to the nature of the chromogenic reagent it is also very important to control the con-
ditions of the color reaction The color rendering conditions mainly included the dosage of the chromo-
genic reagent and the acidity of the solution In order to make the color reaction as complete as possible
it is necessary to add an appropriate dosage of the chromogenic reagent If an excessive dosage of chro-
mogenic reagent is added it will cause side reactions which are not conducive to the measurement In
the experiment the appropriate dosage of the chromogenic reagent is obtained through related experi-
ments Most chromogenic reagents are organic weak acids The acidity of the solution affects the disso-
17
ciation of the chromogenic reagent and the completeness of the color rendering reaction Many chromo-
genic reagents are acid-base indicators The acidity of the solution will change the initial color of the
chromogenic reagent The acidity of the solution also has an effect on the composition and stability of
the colored complex
Three solutions need to be added in the color rendering experiment Firstly HCl needs to be added to
control the acidity of the solution Secondly ascorbic acid solution needs to be added to reduce Fe3+ to
ferrous iron (Fe2+) in the solution Because of the main interference element of this experiment is iron
So it is necessary to eliminate this interference by adding ascorbic acid solution Finally add DAPM for
color rendering reaction So before rendering colors the optimal dosage of these three solutions needs
to be found
The acidity of the solution affects the dissociation of the chromogenic reagent and the completeness of
the color rendering reaction Therefore maintaining the acidity of the solution is a prerequisite for start-
ing the color rendering experiment Determine the experiment steps of optimum dosage of HCl are as
follows take 10 mL of the test solution in 50 mL volumetric flask And then add 5 mL of ascorbic acid
solution and mix it well Place it for about 5 minutes Add 2 mL 4 mL 6 mL 8 mL 10 mL 12 mL 16
mL 20 mL HCl to 8 flasks respectively then add 7 mL of DAPM solution into each flask Dilute the
solution to the mark with water and mix it well Leave it for about half an hour at room temperature
Then put the chromogenic reagent into the spectrophotometer to measure the absorbance (detection
wavelength is 385 nm) It can be realized from TABLE 1 that the acidity in HCl medium has minimal
effect on the color rendering reaction During the analysis add 6 mL of 6 molL HCl to control the
normal concentration of about 113 N Normality (N) is defined as the number of equivalents per liter of
solution where definition of an equivalent depends on the reaction taking place in the solution For an
acid-base reaction the equivalent is the mass of acid or base that can furnish or accept exactly 1 mole of
proton (H+ ions) And this is based on the HCl concentration It can be seen from the absorbance value
in the last row of TABLE 1 that the acidity has little effect on the color rendering reaction in HCl medium
In the analysis process add 6 mL 6 molL HCl solution to control the normal concentration at 113 N
18
TABLE 1 Effect of acidity in HCl medium on color reaction
Flask1 Flask 2 Flask 3 Flask 4 Flask 5 Flask 6 Flask 7 Flask 8
HCl
(1+1) mL
2 4 6 8 10 12 16 20
Normal
concentration
(N)
065 089 113 137 161 185 233 290
Absorbance
L(gmiddotcm)
0185 0185 0185 0185 0185 0185 0185 0180
After determining the acidity of the solution the second problem to be determined is the optimal dosage
of ascorbic acid reagent Take several copies of 10 mL sample B solution with 0074 TiO2 content
add different amounts of ascorbic acid solution Then add 6 mL of HCl and 7 mL of DAPM for color
development and measure the absorbance by spectrophotometer (detection wavelength is 385 nm) The
absorbance values of different ascorbic acid dosages are shown in TABLE 2 The effect of adding
different volume of ascorbic acid on absorbance is shown in TABLE 2 The experimental results show
that when the dosage of ascorbic acid is between 3 mL and 15 mL the absorbance remains stable In
order to facilitate the operation and ensure complete reduction reaction we chose the dosage of ascorbic
acid to be 5 mL
TABLE 2 The absorbance values of different ascorbic acid dosages
Flask 1 Flask2 Flask3 Flask4 Flask5 Flask6
Ascorbic
acid (mL)
1 3 5 6 10 15
Absorbance
L(gmiddotcm)
0509 0514 0515 0515 0515 0515
After determining the dosage of the HCl and the ascorbic acid the third question is the optimal dosage
of DAPM Firstly take several copies of 5 mL sample B solution which content about 0074 of TiO2
and put the each solution into a 50 mL volumetric flask Secondly add 6 mL of HCl 5 mL of ascorbic
acid and different amounts of DAPM for color rendering reaction Finally measure the absorbance value
19
at 385 nm wavelength the experimental results are shown in the TABLE 3 From the experimental data
it can be seen that the absorbance of the DAPM chromogenic reagent is basically constant when it is
above 5 mL So the optimum dosage of the DAPM chromogenic reagent is 7 mL
TABLE 3 The dosage of DAPM experiment
Flask1 Flask2 Flask3 Flask4 Flask5 Flask6 Flask7 Flask8 Flask9
The dosage of
DAPM (mL)
2 3 4 5 6 7 8 9 10
Absorbance
L(gmiddotcm)
0226 0259 0282 0299 0231 0232 0232 0234 0233
Through the above three experiments (determine the optimal dosage of HCl ascorbic acid and DAPM)
the exact dosage of the three reagents in the color rendering experiment was determined The order and
steps of adding the three reagents are as follows firstly take 10 mL of TiO2 standard solution and put it
in a 50 mL volumetric flask Secondly add 5 mL of ascorbic acid solution mix it well Place the solution
for 5 minutes in the room temperature Then add 6 ml hydrochloric acid to mix the reagent evenly
Finally add 7 mL of DAPM into the solution Dilute the solution to the mark with water and mix it well
Leave it for 30 minutes in the room temperature and prepare to measure the absorbance
35 Procedure of the absorbance measuring
After the color rendering reaction is completed the test solution needs to be placed in a cuvette for
absorbance testing By changing the test wavelength the optimal wavelength is determined according
to the absorbance corresponding to each wavelength The absorbance at different wavelengths after color
development is shown in TABLE 4 It can be seen from the data that the wavelength has a maximum
value at 380-390 nm To ensure the best sensitivity the test wavelength is selected at 385 nm Under the
test of the maximum absorption wavelength the response of the instrument is more sensitive and the
measurement data is more accurate
20
TABLE 4 Optimal wavelength test data
Flask1 Flask2 Flask3 Flask1 Flask4 Flask5 Flask6 Flask7
Wavelength (nm) 360 370 380 385 390 400 410 420
Absorbance
L(gmiddotcm)
0499 0533 0547 0554 0543 0533 0502 0461
After determining the optimal wavelength use the spectrophotometer to analyze the content of TiO2 in
the sample firstly prepare the spectrophotometer and open the sample chamber cover Turn on the
power and the indicator lights up let the instrument warm up for 20 minutes Set the selector switch to
the T knob to display the number as 000 Secondly turn the wavelength knob to the 385 nm wave-
length and align the scale line Transfer the color rendering solution into a 3 cm cuvette and place it on
the colorimetric shelves And then close the sample chamber cover and adjust the light transmittance
100 T knob to make the number display as 1000 T Turn the selector switch to the A zero adjust-
ment knob the digital display should be 000 Then pull out the lever to put the solution to be measured
into the optical path and the digital display value is the absorbance A of the sample According to the
absorbance data it can be easily get the mass of TiO2 in the test solution After the measurement is
completed open the sample chamber cover and turn off the power switch
36 Interference test of calcium and magnesium ions
The main components of limestone are CaO and magnesium oxide (MgO) In order to determine whether
CaO or MgO has an effect on the determination of TiO2 Firstly prepare two standard solutions CaO
standard solution and MgO standard solution The content of CaO in the CaO standard solution is 10
mgL And the content of MgO in the MgO standard solution is 10 mgL Extract several parts from the
two prepared solutions and add a certain amount of TiO2 standard solution 4 mL (The amount of TiO2
added is 40 ug) to each part According to the method of 34 for color rendering the interference
experiment results of calcium ion and magnesium ion are as shown in TABLE 5 It can be seen from the
absorbance value in TABLE 5 that CaO and MgO have no effect on the determination of TiO2 There
was no difference in absorbance before and after adding CaO and MgO
21
TABLE 5 The interference experiment results of calcium ion and magnesium ion
Flask 1 Flask 2 Flask 3 Flask 4
The amount of TiO2 added 40 ug 40 ug 40 ug 40 ug
The amount of CaO added
(no MgO)
10 mg 20 mg 30 mg 40 mg
Absorbance L(gmiddotcm) 0551 0548 0550 0551
Flask 5 Flask 6 Flask 7 Flask 8
The amount of TiO2 added 40 ug 40 ug 40 ug 40 ug
The amount of MgO added
(no CaO )
10 mg 15 mg 20 mg 25 mg
Absorbance L(gmiddotcm) 0551 0550 0548 0551
22
4 RESULTS AND DISCUSSIONS
Through the acid system selection experiment the optimal selection of the spectrophotometerrsquos wave-
length experiment the optimal dosage of acidity selection experiment the optimal dosage of DAPM
selection experiment the optimal dosage of ascorbic acid selection experiment and the interference fac-
tors analysis experimental the accurate dosage of reagents was determined by these experiments Ac-
cording to the reaction phenomena or absorbance results of each experiment the corresponding experi-
mental results were obtained
In the acid system selection experiment the following conclusions can be drawn from the observation
of six experimental phenomena In the system of HF and HClO4 the sample is completely dissolved (the
precipitation is precipitated by adding H2SO4 the solution is turbid) but HClO4 and HF have a effect on
the determination of titanium and the fluoride ion is easy to complex with titanium And this
combination is likely to lead to the results on the low performance The presence of HClO4 can combine
with DAPM to produce white flocculent precipitate which led to the failure of the experiment In order
to eliminate the influence of insoluble residue to the analysis and ensure the sample is completely
dissolved The experiment uses the usual method which is anhydrous sodium carbonate and boric acid
system solvent mixed together for melting This method is simple and fast and the melting is complete
The acid system is relatively simple without introducing HClO4 acid HF acid and other kinds of acid
HCl is used to dissolve the sample and the sample dissolves quickly
In the optimal dosage of acidity selection experiment By observing the results of absorbance under
different acidity The best color acidity can be obtained add 6 mL of 6 molL HCl to control the color
acidity of solution In the optimal dosage of DAPM selection experiment through the absorbance test
results of solutions with different DAPM dosage It can be concluded from the data that the best dosage
of DAPM solution is 7 mL In the the optimal selection of the spectrophotometerrsquos wavelength
experiment according to the test results of absorbance of solution at different wavelengths it can be
concluded that the optimal wavelength is 385 nm In the optimal dosage of ascorbic acid selection
experiment through the absorbance test results of several solutions added with different volume of
ascorbic acid it can be concluded that the optimal dosage of ascorbic acid is 5 mL In the interference
factors analysis experimental it can be seen from the absorbance value in experiment results that CaO
and MgO have no effect on the determination of TiO2 By determining the accurate dosage of various
reagents a set of measurement steps with accurate actual dosage is formulated
23
41 Measurement results of titanium dioxide content
The content of TiO2 in three limestone samples was determined six times in parallel The analysis result
is rounded according to the rules of bankerrsquos rounding In order to avoid the phenomenon of big error
caused by rounding rules The specific method of data processing in this rule is as follows when the
mantissa is less than or equal to 4 the mantissa will be directly rounded off When the mantissa is greater
than or equal to 6 round off the mantissa and carry forward one digit When the mantissa is equal to 5
but the numbers after the mantissa are all 0 the previous digit of the mantissa should be used as a refer-
ence If the previous number is an odd number move one digit forward If the previous number is even
the mantissa is discarded If the mantissa is 5 but there is a number that is not 0 after the mantissa
whether the number before the mantissa is odd or even the number must move forward one bit
This experiment is carried out under the specified repeatability conditions the same experimental re-
searcher carries out the experiment uses the same instrument to carry out the experimental measurement
carries out the experiment under the same experimental conditions carries out the same calibration in a
short time TiO2 content is calculated according to the mass fraction WTiO2 calculation formula (1)
2
6
1
1
10100
TiO
mw
m V V
minus=
(1)
V1 The volume of the solution obtained separately from the sample solution The unit is milliliter (mL)
V Total volume of sample solution The unit is milliliter (mL)
m1 The quality of the titanium dioxide obtained separately from the sample solution The unit is mi-
crogram (μg)
m The quality of the sample The unit is gram (g)
The measurement results of the experiment are shown in the TABLE 6 The experimental data compared
with the TiO2 content in three limestone samples are shown in TABLE 7 For sample A the TiO2 content
obtained from the first and third experiments is basically consistent with the known accurate TiO2
content of sample A In addition to the second experimental data the accuracy of other experimental
data is good Compare with the other five groups of data the results of the second experiment have
relatively large errors For sample B the content of TiO2 obtained in the third experiment is almost the
same as the given value The TiO2 content measured in the fifth experiment is quite different from the
given value compared with the other five groups of data For sample C the TiO2 content obtained from
six experiments is almost the same as the given TiO2 content
24
TABLE 6 Experimental measurement data
Experiment
1
Experiment
2
Experiment
3
Experiment
4
Experiment
5
Experiment
6
Sample A
()
00412 00423 00409 00414 00416 00415
Sample B
()
00730 00750 00740 00765 00780 00735
Sample C
()
01250 01280 01290 01310 01240 01260
42 Accuracy of results discussion
From the average value of the data it can be seen that the accuracy of using the DAPM photometry to
determine the TiO2 content in limestone TABLE 7 is the average value of TiO2 content measured in six
experiments for each sample from TABLE 6 The second column is the certified value of the three
samples The mass fraction of TiO2 content in sample A is 0041 The mass fraction of TiO2 content
in sample B is 0074 The mass fraction of TiO2 content in sample C is 013 And the third column
is the average values which are obtained through experimental measurement and calculation As can be
seen from TABLE 7 The average value of TiO2 content in several groups of limestone samples meas-
ured by this experiment have high accuracy
TABLE 7 Average mass fraction of TiO2 content in limestone
Certified value Average value
Sample A () 0041 00414
Sample B () 0074 00750
Sample C () 0130 01272
HCl was used to dissolve the sample If HClO4 is used in the experiment it will form white flocculent
precipitate with DAPM which will affect the absorbance test If HF is used in the experiment fluorine
ions will complexate with titanium to form titanium fluoride complex which will affect the accuracy of
25
the experimental results If only HNO3 is used for decomposition except for incomplete decomposition
of the sample HNO3 also destroys DAPM thus affecting the continuation of the experiment According
to the dissolution treatment experiment and acidification experiment the HCl system is relatively simple
without the introduction of HClO4 HF and other types of acids And the sample dissolves quickly by
HCl leaching
In the experiment of determine the optimal dosage of DAPM solution it can be concluded that the
optimal dosage of DAPM is 7mL When the amount of DAPM is more than 6 mL the absorbance tends
to be stable If the flux of DAPM does not reach 6 mL the color reaction will be incomplete which will
affect the whole experiment For the selection of the amount of ascorbic acid ascorbic acid is used to
reduce Fe3+ in the solution to Fe2+ In order to eliminate the interference 5 mL ascorbic acid was selected
to reduce Fe3+ in the sample If the amount of ascorbic acid is less than 5 mL the remaining unreduced
Fe3+ will affect the accuracy of the whole experiment
In this experiment temperature and time have influence on the measurement results In 15-80 the
absorbance value is not affected by temperature However if the iron content in the sample is high and
the temperature is higher than 60 the solution is easy to be turbid and unable to compare colors
Therefore this experiment uses 15-30 room temperature to render color The color solution is very
stable and can be maintained for several months When the room temperature is higher than 20 it
tends to be stable after 20 minutes of color development When the room temperature is lower than 20
it needs 40-60 minutes to be stable In this color rendering experiment the accuracy of temperature
control is particularly important
When selecting the optimal wavelength of the test absorbance the wavelength corresponding to the
maximum absorbance is selected according to the absorption curve of the test solution In this experiment
when the wavelength is 385 nm the absorbance changes with the concentration in the largest range so
the determination is the most sensitive The absorption curve is an important basis for choosing the
wavelength of incident light in quantitative analysis In the wavelength selection experiment if the
wavelength corresponding to the maximum absorbance is not selected the accuracy of the experiment
will be insufficient
26
5 CONCLUSION
In this experiment the DAPM photometric method was used to determine the content of TiO2 The
sample is melted by sodium carbonate-boric acid mixed flux and leached with dilute HCl The experi-
ment used ascorbic acid as a masking agent to reduce Fe3+ to Fe2+ in the solution to eliminate interference
In this experiment DAPM solution was added to render the solution color In order to ensure the accu-
racy of the experimental results the amount of various reagents was optimized The following five as-
pects were quantitatively analyzed in the experiment optimal selection of the spectrophotometerrsquos
wavelength the optimal dosage of acidity the optimal dosage of DAPM the optimal dosage of ascorbic
acid and the interference factors analysis The exact dosage of each reagent was determined The TiO2
content measured in the experiment was compared with limestone with known accurate TiO2 content
The accuracy of the measurement can be seen in this experiment This experimental method has a perfect
effect on the use of spectrophotometers and promotes the determination of mineral raw materials con-
taining low TiO2 content by spectrophotometer
For the measurement results of the experiment there is a certain error between the TiO2 content meas-
ured in this experiment and the TiO2 content given in the limestone sample Through the interference
element analysis experiment it is determined that the two main components of limestone (MgO and
CaO) are not the cause of this error For several values with slightly poor accuracy there may be some
problems in the operation of the experiment The most likely reason for the poor accuracy of the data is
that after the sample dissolves the color reaction does not wait until the solution cools to room temper-
ature Another possibility is that the limestone sample is not well preserved resulting in a certain error
between the actual TiO2 value and the given value In the future experiments the above two error aspects
are further studied to ensure that the measurement method is accurate and the measurement results are
more accurate
Compared to ammonium ferric sulfate volumetric method and H2O2 coordination titration method
DAPM photometric method has high accuracy and eliminates the interference of vanadium molyb-
denum tungsten copper arsenic and other elements to the experiment Compared to ICP-AES method
DAPM photometric method is simple in operation and suitable for popularization and application The
results of the project provided a technical method for accurately and quickly determining the content of
TiO2 in limestone
27
REFERENCES
Bo H Xiaomei W amp Tao Y 2015 The development and application of X-Ray fluorescence
spectrometer Nuclear Electronics amp Detection Technology 1307-1311
Chen C 2005 Determinition of TiO2 in mine with diantipyrylmethane spectrophotometry Tian jing
Metallurgy 43(4) 9-10
Chen Z 2009 Research and Fabrication of Opto-mechanical Systems of New UV Spectrophotometer
Chu N Li W amp Jiang X 2014 Determination of major and minor compoments in limestone by
wavelength dispersive X-ray fluorescence spectrometry with fusion sample preparation Metallurgical
analysis 34(10) 37-41
Chu Y 1983 Development of X-ray fluorescence spectrometer DOI 10 13595 j cnki issn1000 -
0720 1983 0062
Deng J 2016 Determination of Titanium Dioxide in Titanium Slag by Diantipyrylmethane
Spectrophotometry Physico-ChemistryampChemical-Chemistry 52(1) 37-40
Deng J 2020 Determination of Titanium in Titanium Ferroalloy by Spectrophotometry with
Diantipyrylmethane Angang technology 2(1) 36-39
Du M 2017 Simultaneous determination of Fe Al Ca Mg K Na Ti in limestone by inductively
coupled plasma atomic emission spectrometry with microwave digestion Metallurgical Analysis
26(4) 30
Jin L Meng H amp Yinglin D 2008 Determining titanium dioxide in ores by ICP-AES Jilin
geology 27(1) 83-85
Khavar A amp Asadollahzadeh H 2020 Preconcentration and determination of nickel (Ⅱ)and
copper(Ⅱ) ions Elsevier Inc DOI101016jjfca2020103457
Li C 2006 Determination of SiO2 Cao MgO Al2O3 Fe2O3 and P2O5 in limestone and dolomite by
XRF melting method Shandong Metallurgy 28(6) 10-14
Li H 2005 Diantipyric methane spectrophotometric determination of titanium in magnesium
chloride Journal of environmental management college of China 15(3) 113-114
Liu X Zhong Y amp Song H 2011 Synthesis of Diantipyrylmethane aromatic ring derivatives and
its application in photometric analysis Jiangxi Nonferrous Metals 15 30-35
Mohamed E amp Hassan A 2015 Characterization of visiblelight activated TiO2 catalysts and their
photocatalytic performance study Huazhong Agricultural University 4-16
Pan X 2015 Development Trend of Ultraviolet Spectrophotometer Science and Technology amp
Innovation(14) 19-21
Peng X 2012 Study on spectrum analytical system of visible spectrometer Tianjin University 3-12
28
Shao H 2001 Determination of chloride ion in copper electrolyte by potentiometric titration
metallurgical analysis 21(4) 64-65
Song X 2006 Determination of titanium dioxide in vanadic titanomagnetite by hydrogen peroxide
Spectrophotometry Metallurgical Analysis 26(3)
Sunil R amp Kalpana C 2011 Synthesis of diarypyrimidinones (DAPMs) using large porezeolites
Journal of molecular catalysis 210-215
Wang R Yan W amp Zhu X 2013 Methods for chemical analysis of limestone quicklime and
hydrated lime for building materials Cement(4) 49-50
Wang H 2010 Discussion on the principle and maintenance of ICP- AES Electronic product
reliability and environmental testing 28(4) 60-63
Xu C Wang Q Xu W Dai M amp Qi 2020 Trouble shooting of inductively coupled plasma
atomic emission spectrometer Metallurgical analysis 40 66-71
Xu C Wang Q amp Xu W 2020 Fault analysis and treatment of inductively coupled plasma atomic
emission spectrometer Metallurgical analysis 40(2) 66-71
Yang Z 2008 Simultaneous quantification measurement of SiFeTiCaMgZr in corundum by
inductively coupled plasma-atomic emission spectrometry with secondary-melting method Rock
and mineral analysis 31(2)
Zhang J 2019 Discussion on the determination of TiO2 by Diantipyrylmethane Spectrophotometry
Chemical enterprise management(1) 45-46
Zhi P 1999 Development and application of biochemical instruments Telecommunication
Engineering 6(2)
Zhang Q 2009 Determination of Al2O3 CaO Fe2O3 MgO MnO SiO2TiO2 in Limestone and
Dolomite by ICP-AES Analysis and testing technology and instruments 15(3) 179-181
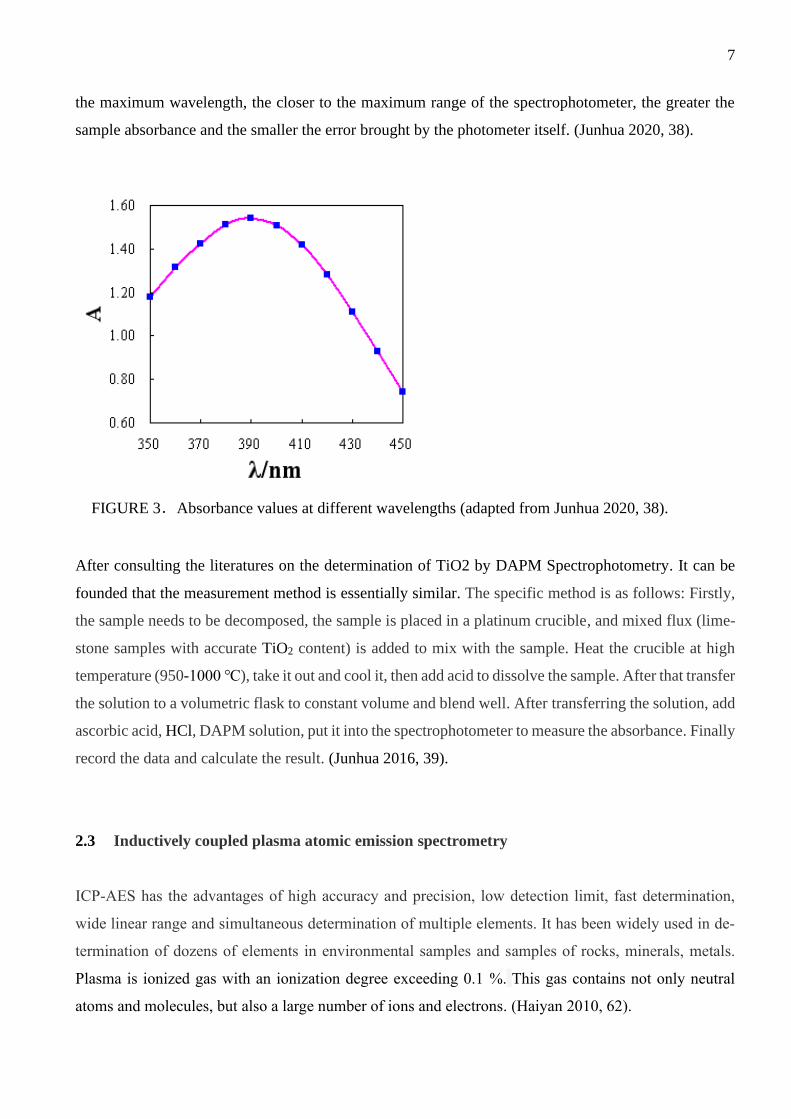
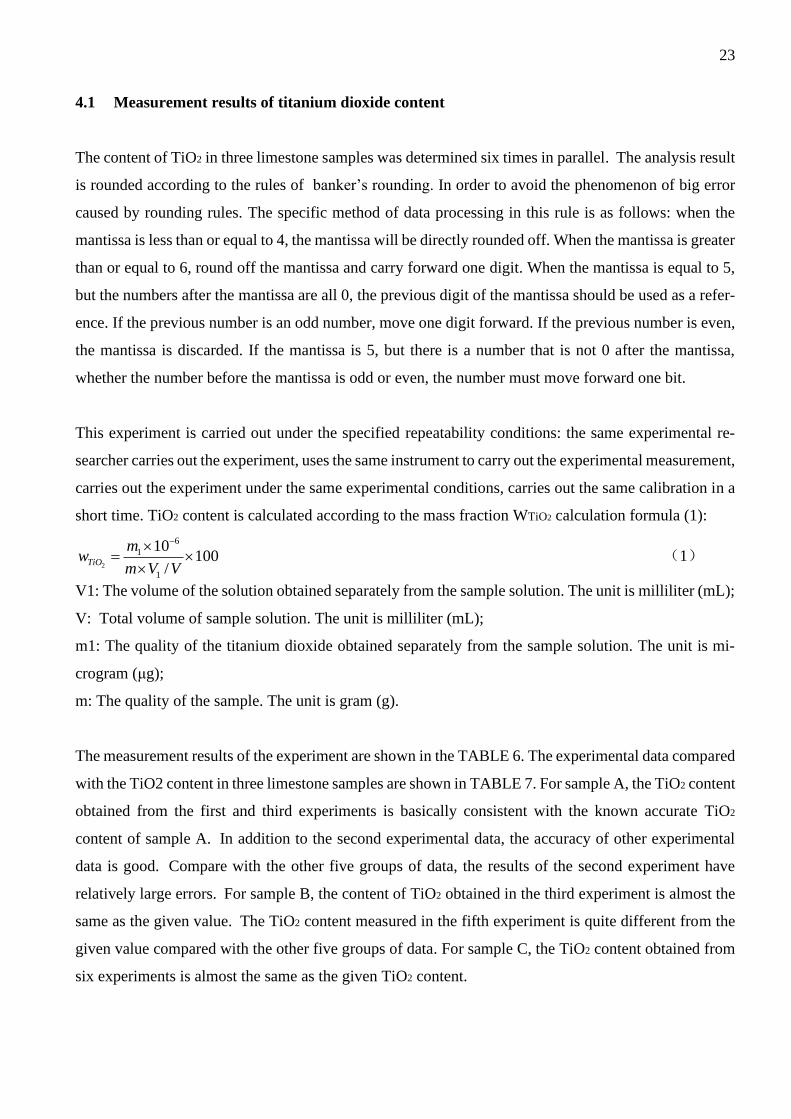
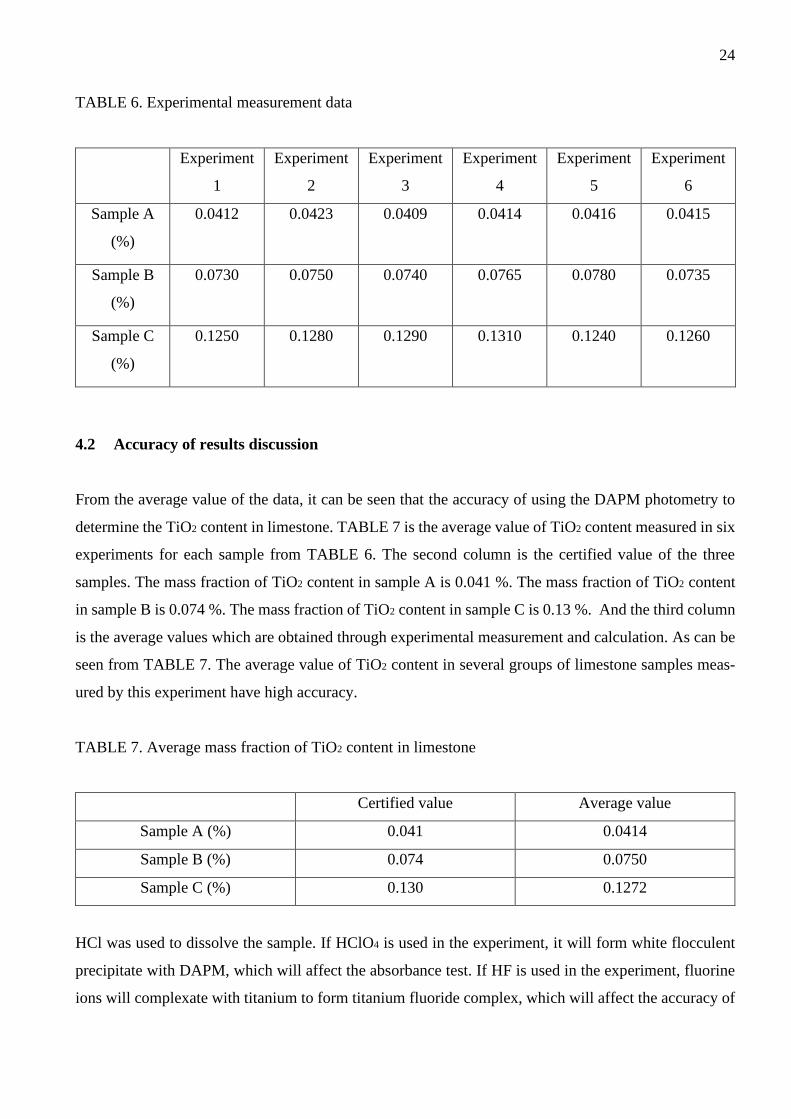


![Titanium dioxide and modified titanium dioxide by silver ...cdmf.org.br/wp-content/uploads/2019/02/Titanium-dioxide...zinc oxide [6,7], titanium dioxide [8,9], hydroxyapatite and chlorhexidine,](https://img.pdfslide.us/doc/110x75/60ff91e8d40a2e46c9475976/titanium-dioxide-and-modified-titanium-dioxide-by-silver-cdmforgbrwp-contentuploads201902titanium-dioxide.jpg)