Embed Size (px)
Citation preview

DETERMINATION OF THE ELECTROCALORIC PROPERTIES OF THE FERROELECTRIC
(1-x)BaTiO3-xBi(Li1/3Ti2/3)O3 (0≤x≤0.2) SYSTEM
A Thesis Submitted to The Graduate School of Engineering and Science of
İzmir Institute of Technology in Partial Fulfillment of the Requirements for the Degree of
MASTER OF SCIENCE
in Materials Science and Engineering
by Tuğçe DEMİRTAY
December 2018 İZMİR

We approve the thesis of Tuğçe DEMİRTAY
Examining Committee Members:
________________________________ Dr. Umut ADEM Department of Materials Science and Engineering, İzmir Institute of Technology
________________________________ Assoc. Prof. Dr. Çekdar Vakıf AHMETOĞLU Department of Materials Science and Engineering, İzmir Institute of Technology
________________________________ Assoc. Prof. Dr. Ümit AKINCI Department of Physics, Dokuz Eylül University
27 December 2018
________________________________ Dr. Umut ADEM Supervisor, Department of Materials Science and Engineering, İzmir Institute of Technology ________________________________ Prof. Dr. Mustafa Muammer DEMİR Head of the Department of Materials Science and Engineering
________________________________ Prof. Dr. Muhsin ÇİFTÇİOĞLU Co-Supervisor, Department of Chemical Engineering, İzmir Institute of Technology
___________________________ Prof. Dr. Aysun SOFUOĞLU Dean of the Graduate School of Engineering and Sciences

ACKNOWLEDGEMENTS
I would like to thank my thesis advisor Dr. Umut Adem for sharing his knowledge
and experiences with me. He supported and guidanced me at every stage of the study and
whenever I had a problem about my research he made me believe that I could solve the
problems myself. Furthermore, I would like to thank to my co-advisor Prof. Dr. Muhsin
Çiftçioğlu for his valuable information and support.
I would like to thank Turkish Scientific and Technological Research Council
(TÜBİTAK) via the project with the number 315M241 and IZTECH for supporting me
during this project.
An important part of this study is carried out at the ICREA Institute at Barcelona
and I am very thankful to Dr. Aziz Genç for TEM measurements. I would like to thank
Prof. Dr. Ender Suvacı for the strain measurements and his participation and comments
for this study.
I would like to express my gratitude to the Işın Özçelik for XRD experiments. I
would like to thank specialist of Material Research Center of IKCU for SEM analysis.
My deepest gratitude goes foremost to my dear parents Figen Dönertaş and Atilla
Demirtay and my brother Orkun Demirtay and his precious wife Oya Demirtay who
always feel behind me and think of my happiness and future in my all life. They made me
keep going all the time and they believed I could and this study would not have been
possible without them.
I would like to thank my dear friend Keriman Şanlı for providing motivation and
valuable friendship during my study. I cannot forget to mention my lovely dog Tina who
motivate and made me happy.
Last but not least, I would like to thank my dear friend Gürol İleri for his valuable
support and understanding. Furthermore, I would also thank to Burak Bostancıoğlu, Ali
Çakal and Birnur Kaya for their valuable friendship.
iv
ABSTRACT
DETERMINATION OF THE ELECTROCALORIC PROPERTIES OF THE FERROELECTRIC (1-x)BaTiO3-xBi(Li1/3Ti2/3)O3 (0≤x≤0.2)
SYSTEM
The aim of this study is to develop electrocaloric (EC) materials for alternative
eco-friendly cooling technologies.
Considering the dielectric and piezoelectric properties of the (1-x)BaTiO3-
xBi(Li1/3Ti2/3)O3 (0≤x≤0.2), this system was selected to study electrocaloric properties
due to the presence of morphotropic phase boundary (MBP). The crystal structure of the
samples that were synthesized by convential solid state reaction technique were
determined by the X-Ray Diffraction experiments. The electrical properties of the
ceramics were characterized by temperature-dependent dielectric measurements and the
phase transition temperatures of the samples were identified. Temperature-dependent
electrical polarization curves were measured for all compositions and electrocaloric
temperature change values were calculated with the help of Maxwell equations. Using
the dielectric measurements, a phase diagram was obtained. Strain-electric field
measurements were done to complement dielectric and polarization measurements.
A new antiferroelectric phase was discovered at high temperatures in the samples.
As Bi(Li1/3Ti2/3)O3 content is increased, phase transition from the ferroelectric to
antiferroelectric phase decreases. Since in the antiferroelectric phase the net polarization
is very small, a large polarization change therefore large electrocaloric temperature
change is obtained. Highest electrocaloric temperature change (ΔT=0.66 K under 22
kV/cm) is obtained for x=0.03 sample.

v
ÖZET
FERROELEKTRİK (1-x)BaTiO3-xBi(Li1/3Ti2/3)O3 (0≤x≤0.2) SİSTEMİNİN ELEKTROKALORİK ÖZELLİKLERİNİN
BELİRLENMESİ
Bu çalışmanın amacı, alternatif çevre dostu soğutma teknolojileri için
elektrokalorik (EC) malzemeler geliştirmektir.
(1-x)BaTiO3-xBi(Li1/3Ti2/3)O3 (0≤x≤0.2) sisteminde, dielektrik ve piezoelektrik
ölçümlere göre morfotropik faz sınırı bulunduğundan bu sistem elektrokalorik özellikleri
çalışılmak için seçilmiştir. Geleneksel katı hal reaksiyon tekniği ile sentezlenen
numunelerin kristal yapısı, X-Işını Kırınımı deneyleriyle belirlenmiştir. Seramiklerin
elektriksel özellikleri sıcaklığa bağlı dielektrik ölçümleri ile karakterize edilmiştir ve
örneklerin faz geçiş sıcaklıkları belirlenmiştir. Sıcaklığa bağlı elektriksel kutuplanma
eğrileri ölçülmüş ve Maxwell denklemlerinin yardımıyla elektrokalorik sıcaklık değişimi
değerleri hesaplanmıştır. Dielektrik ölçümler kullanılarak bir faz diyagramı elde
edilmiştir. Dielektrik ve polarizasyon ölçümlerini tamamlamak amacıyla gerinim-elektrik
alan ölçümleri yapılmıştır.
Örneklerde yüksek sıcaklıklarda yeni bir antiferroelektrik faz keşfedilmiştir.
Artan Bi(Li1/3Ti2/3)O3 oranıyla ferroelektrik fazdan antiferroelektrik faza geçiş sıcaklığı
düşmektedir. Antiferroelektrik fazdaki net polarizasyonun çok küçük olması nedeniyle
ferroelektrik antiferroelektrik geçiş sıcaklığında yüksek bir polarizasyon değişimi
dolayısıyla yüksek elektrokalorik sıcaklık değişimi elde edilmiştir. En yüksek
elektrokalorik sıcaklık değişimi (22 kv/cm altında ΔT=0.66 K) x=0.03 örneğinde elde
edilmiştir.

vi
TABLE OF CONTENTS
LIST OF FIGURES ix
LIST OF TABLES xiii
CHAPTER 1. INTRODUCTION 1
Ferroelectricity 1
1.1.1. Ferroelectric Materials 1
1.1.2. Antiferroelectric Materials 8
Electrocaloric Effect (ECE) 9
1.2.1. History of ECE 9
1.2.2. Phenomenological and Thermodynamic Description of ECE 10
1.2.3. Measurement Methods for ECE 11
1.2.3.1 Direct Method 12
1.2.3.2 Indirect Method 13
1.2.4. Application Areas 14
Electrocaloric Materials 15
1.3.1. Lead-containing perovskites 16
1.3.2. Lead-free perovskites 17
Mechanisms to Enhance the Electrocaloric Effect 20
1.4.1. First Order Phase Transition, Diffuse Transition, Relaxor Ferroelectricity 20
1.4.2. Morphotropic Phase Boundary (MPB) 22
1.4.3. Ferroelectric-Antiferroelectric (FE-AFE) Phase Transitions 23
Motivation of the Thesis 25

vii
CHAPTER 2. EXPERIMENTAL METHODS 29
Material Preparation 29
2.1.1. Synthesis Route-I 29
2.1.2. Synthesis Route-II 31
Characterization of the Materials 31
2.2.1. Particle Size Analysis 31
2.2.2. Archimedes' Method 33
2.2.3. X-Ray Diffraction 35
2.2.4. Scanning Electron Microscopy 35
2.2.5. Transmission Electron Microscopy 36
Electrical Characterization 37
2.3.1.Dielectric Permittivity Measurements 37
2.3.2. Hysteresis Loop and Current-Voltage Measurements 38
2.3.3. Strain Measurements 40
CHAPTER 3. RESULTS AND DISCUSSION 41
Synthesis Route-I 41
3.1.1. XRD Measurement 41
3.1.2. Particle Size Analysis 42
3.1.3. Density Measurements 43
3.1.4. Hysteresis Loop Measurements 44
3.1.5. Electrocaloric Effect Calculations 45
3.1.6. Dielectric Measurements 50
3.1.7. Microstructural Analysis 51
Synthesis Route-II 53
3.2.1. XRD Measurements 53

viii
3.2.2. Microstructural Analysis 55
3.2.3. Density Measurements and Particle Size Analysis 59
3.2.4. Dielectric Measurements 60
3.2.5. Hysteresis Loop Measurements 64
3.2.6. Strain-Electric Field Measurements 69
3.2.7. Temperature Dependent X-Ray Diffraction 71
3.2.8. Electrocaloric Effect Calculations 72
CHAPTER 4. CONCLUSIONS 78
Synthesis Route-I 78
Synthesis Route-II 78
REFERENCES 80
ix
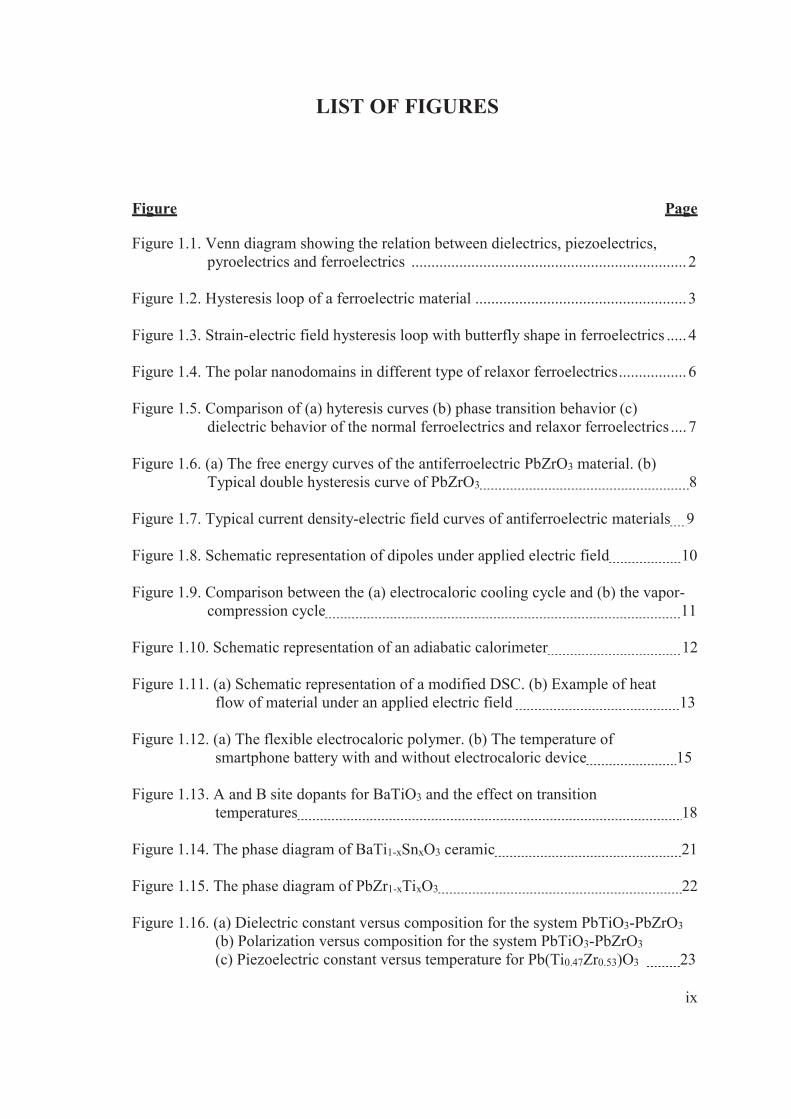
LIST OF FIGURES
Figure Page Figure 1.1. Venn diagram showing the relation between dielectrics, piezoelectrics,
pyroelectrics and ferroelectrics ..................................................................... 2 Figure 1.2. Hysteresis loop of a ferroelectric material ..................................................... 3 Figure 1.3. Strain-electric field hysteresis loop with butterfly shape in ferroelectrics ..... 4 Figure 1.4. The polar nanodomains in different type of relaxor ferroelectrics ................. 6 Figure 1.5. Comparison of (a) hyteresis curves (b) phase transition behavior (c)
dielectric behavior of the normal ferroelectrics and relaxor ferroelectrics .... 7 Figure 1.6. (a) The free energy curves of the antiferroelectric PbZrO3 material. (b)
Typical double hysteresis curve of PbZrO3 8 Figure 1.7. Typical current density-electric field curves of antiferroelectric materials 9 Figure 1.8. Schematic representation of dipoles under applied electric field 10 Figure 1.9. Comparison between the (a) electrocaloric cooling cycle and (b) the vapor-
compression cycle 11 Figure 1.10. Schematic representation of an adiabatic calorimeter 12 Figure 1.11. (a) Schematic representation of a modified DSC. (b) Example of heat
flow of material under an applied electric field 13 Figure 1.12. (a) The flexible electrocaloric polymer. (b) The temperature of
smartphone battery with and without electrocaloric device 15 Figure 1.13. A and B site dopants for BaTiO3 and the effect on transition
temperatures 18 Figure 1.14. The phase diagram of BaTi1-xSnxO3 ceramic 21 Figure 1.15. The phase diagram of PbZr1-xTixO3 22 Figure 1.16. (a) Dielectric constant versus composition for the system PbTiO3-PbZrO3
(b) Polarization versus composition for the system PbTiO3-PbZrO3 (c) Piezoelectric constant versus temperature for Pb(Ti0.47Zr0.53)O3 23

x
Figure 1.17. Phase diagram of (1-x)(Na1/2Bi1/2)O3-xBaTiO3 24 Figure 1.18. (a) XRD patterns of (1−x)BaTiO3−xBi(Li1/3Ti2/3)O3 between (a) 20-60°
and (b) 44-46.5°. (c) Piezoelectric (d33) coefficient of all (1−x)BaTiO3− xBi(Li1/3Ti2/3)O3 ceramics 26
Figure 1.19. Dielectric behavior of (1−x)BaTiO3−xBi(Li1/3Ti2/3)O3 ceramics as a
function of temperature measured at 1 kHz, 10 kHz, 100 kHz and 1 MHz 27
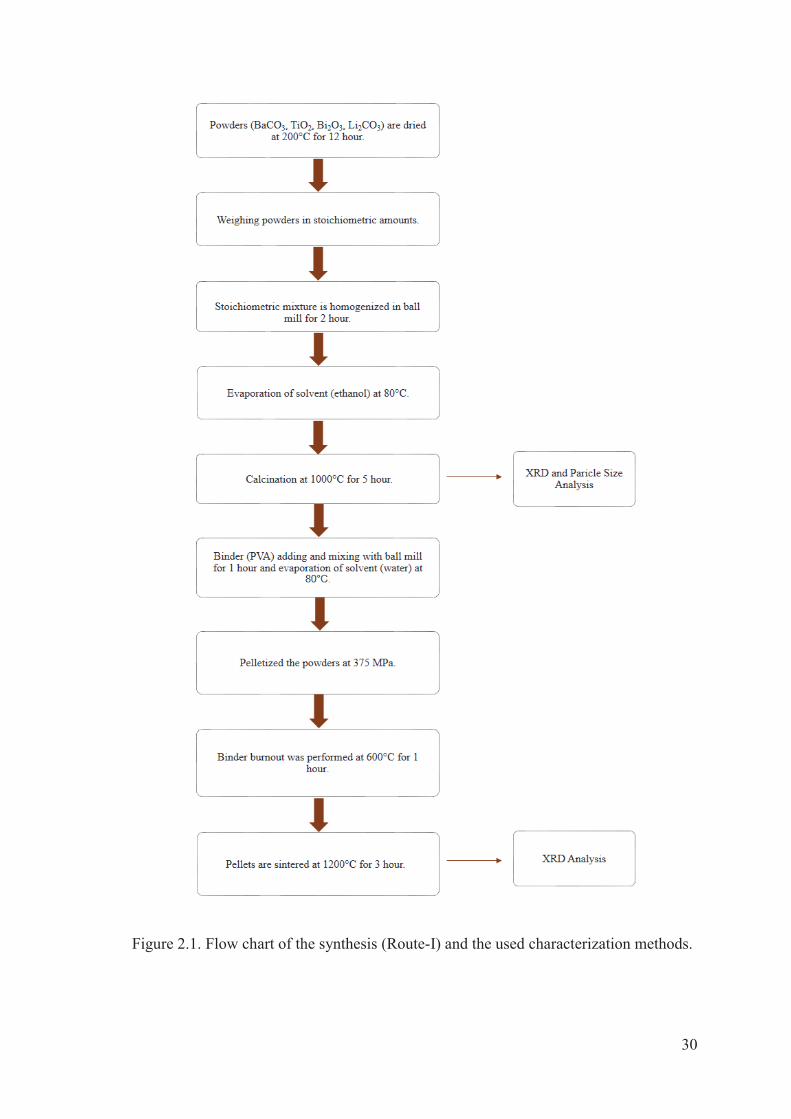
Figure 2.1. Flow chart of the synthesis (Route-I) and the used characterization
methods 30 Figure 2.2. Flow chart of the synthesis (Route-II) and the used characterization
methods 32 Figure 2.3. A schematic representation of the dynamic light scattering experiment ...... 33 Figure 2.4. A schematic representation of the Archimedes’ principle .......................... 34 Figure 2.5. Definition of impedance .............................................................................. 38 Figure 2.6. (a) The excitation signals (b) The hysteresis loops corresponding to the
signals 39 Figure 3.1. XRD patterns of all (1−x)BaTiO3−xBi(Li1/3Ti2/3)O3 calcined samples in
the range of 2Ɵ (a) from 20° to 80° and (b) 40° to 50 41 Figure 3.2. XRD patterns of all (1−x)BaTiO3−xBi(Li1/3Ti2/3)O3 sintered samples in
the range of 2Ɵ (a) from 20° to 80° and (b) 40° to 50 42 Figure 3.3. Part cle s ze d str but on of (1−x)BaTiO3−xBi(Li1/3Ti2/3)O3 ceramics 43
Figure 3.4. (a)-(d) Polarization hysteresis loops of all (1−x)BaTiO3−xBi(Li1/3Ti2/3)O3 ceramics measured at different temperatures ............................................... 44
Figure 3.5. (a)-(d) Polarization versus temperature graphs of all (1-x)BaTiO3-xBi(Li1/3Ti2/3)O3 ceramics measured under different electric fields for (a)x=0.03, (b)x=0.05, (c)x=0.07, (d)x=0.10 ................................................ 47
Figure 3.6. (a)-(d) Polarization versus temperature graphs fitted with a 6th order polynomial of all (1−x)BaTiO3−xBi(Li1/3Ti2/3)O3 ceramics measured at 22 kV/cm for (a) x=0.03, (b) x=0.05, (c) x=0.07, (d) x=0.10 ..................... 48
Figure 3.7. Temperature dependence of ΔT of all (1−x)BaTiO3−xBi(Li1/3Ti2/3)O3 ceramics calculated at different electric field values for both fitting (left) and numerical (right) differentiation method for (a) x=0.03, (b) x=0.05, (c) x=0.07, (d) x=0.10 ................................................................................. 49

xi
Figure 3.8. Temperature dependence of ΔT of all (1-x)BaTiO3-xBi(Li1/3Ti2/3)O3 ceramics measured at 22 kV/cm for (a) fitting method and (b) numerical differentiation ............................................................................................. 50
Figure 3.9. Temperature dependence of dielectric constant εr and dielectric loss of all
(1−x)BaTiO3−xBi(Li1/3Ti2/3)O3 ceramics at different frequencies ............. 51
Figure 3.10. (a)-(c) Selection of low magnification TEM micrographs and (d) and (e) selected area electron diffraction patterns of (1−x)BaTiO3− xBi(Li1/3Ti2/3)O3 for x=0.07 ....................................................................... 52
Figure 3.11. XRD patterns of all (1−x)BaTiO3−xBi(Li1/3Ti2/3)O3 calcined samples between (a) 20° to 80° and (b) 40° to 50° .................................................. 54
Figure 3.12. XRD patterns of all (1−x)BaTiO3−xBi(Li1/3Ti2/3)O3 sintered samples between (a) 20° to 80° and (b) 40° to 50° ................................................... 54
Figure 3.13. (a)-(d) and (f) Selection of low magnification TEM micrographs and (e) and (g) selected area diffraction patterns of (1−x)BaTiO3−xBi(Li1/3Ti2/3)O3 for x=0.05 .................................................................................................... 56
Figure 3.14. (a)-(f) SEM micrographs of all (1−x)BaTiO3−xBi(Li1/3Ti2/3)O3 ceramics for (a) x=0.03, (b) x=0.04, (c) x=0.05, (d) x=0.06, (e) x=0.07, (d) x=0.08 .................................................................................................. 57
Figure 3.15. (a)-(f) SEM micrographs of all (1−x)BaTiO3−xBi(Li1/3Ti2/3)O3 ceramics
with the presence of secondary phases for (a)x=0.03, (b)x=0.04, (c)x=0.05, (d)x=0.06, (e)x=0.07, (f)x=0.08 .................................................................. 58
Figure 3.16. SEM image of (1−x)BaTiO3− xBi(Li1/3Ti2/3)O3 (x=0.06) .......................... 59 Figure 3.17. Particle size distribution of selected compositions before sintering
process ......................................................................................................... 60 Figure 3.18. (a)-(f) Temperature dependence of dielectric constant Ɛr of all
(1−x)BaTiO3− xBi(Li1/3Ti2/3)O3 ceramics at different frequencies. Under each graph in (a)-(f) 1/Ɛr versus temperature graphs are shown ..... 63
Figure 3.19. Temperature dependence of (a) dielectric constant and (b) tanδ of all (1−x)BaTiO3− xBi(Li1/3Ti2/3)O3 ceramics at 1 kHz .................................. 63
Figure 3.20. Polarization versus electric field plots of (1−x)BaTiO3− xBi(Li1/3Ti2/3)O3 ceramics measured at 1 Hz for 0.03≤x≤0.06 and 10 Hz for x=0.07 and 0.08 at 30 kV/cm at 35°C ........................................................................... 64
Figure 3.21. (a)-(f) Polarization hysteresis loops of all (1−x)BaTiO3−xBi(Li1/3Ti2/3)O3 ceramics measured at different temperatures .............................................. 67
Figure 3.22. Current-electric field (J-E) curves of all (1−x)BaTiO3−xBi(Li1/3Ti2/3)O3 ceramics measured at different tempeatures at 10 Hz................................ 68
Figure 3.23. Electronegativity difference vs tolerance factor plot of all (1−x)BaTiO3−

xii
xBi(Li1/3Ti2/3)O3 ceramics .......................................................................... 69
Figure 3.24. (a) Electrical polarization versus electric field (b) current density versus electric field and (c) Bipolar S(E) curves of (1−x)BaTiO3−xBi(Li1/3Ti2/3)O3 (x=0.03 and x=0.07) measured at room temperature ................................ 70
Figure 3.25. The change in unit cell parameters as a function of temperature for x=0.05 sample ........................................................................................... 72
Figure 3.26. (a)-(f) Polarization-electric field graphs of all (1-x)BaTiO3- xBi(Li1/3Ti2/3)O3 ceramics measured at given frequencies for (a) x=0.03, (b) x=0.04, (c) x=0.05, (d) x=0.06, (e) x=0.07 and (f) x=0.08 . ................ 73
Figure 3.27. Temperature dependence of ΔT and ΔS of all (1−x)BaTiO3− xBi(Li1/3Ti2/3)O3 ceramics at 22 kV/cm .................................................... 74
Figure 3.28. Phase diagram of the (1−x)BaTiO3− xBi(Li1/3Ti2/3)O3 ceramics ............... 76
xiii
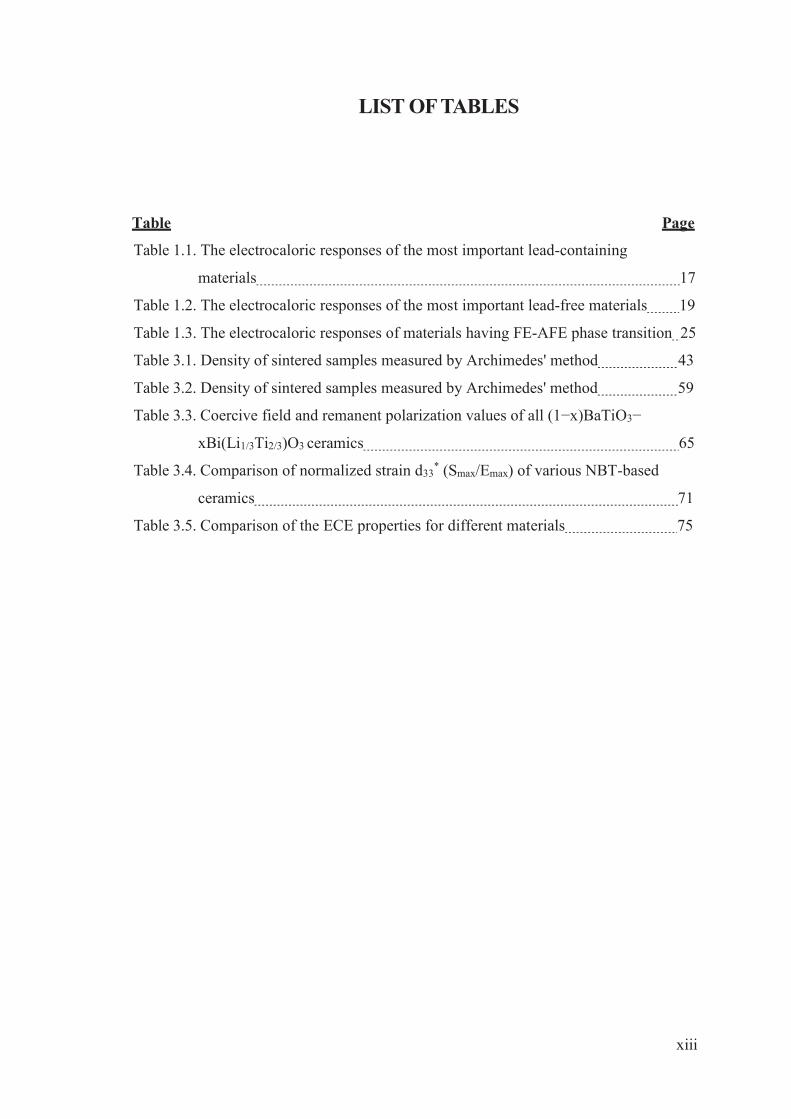
LIST OF TABLES
Table Page
Table 1.1. The electrocaloric responses of the most important lead-containing
materials 17
Table 1.2. The electrocaloric responses of the most important lead-free materials 19
Table 1.3. The electrocaloric responses of materials having FE-AFE phase transition 25
Table 3.1. Density of sintered samples measured by Archimedes' method 43
Table 3.2. Density of sintered samples measured by Archimedes' method 59
Table 3.3. Coercive field and remanent polarization values of all (1−x)BaTiO3−
xBi(Li1/3Ti2/3)O3 ceramics 65
Table 3.4. Comparison of normalized strain d33* (Smax/Emax) of various NBT-based
ceramics 71
Table 3.5. Comparison of the ECE properties for different materials 75

1
CHAPTER 1
INTRODUCTION
The alternative cooling technologies is needed to prevent the global warming and
climate changes as a result of greenhouse gas effect triggered by halocarbon gases emitted
by existing cooling technologies. One of the alternative technologies is based on the
electrocaloric effect that employs ferroelectric materials.
In order to understand the electrocaloric effect, the material classes and their
properties, an introduction is given in this chapter.
1.1. Ferroelectricity
The electrocaloric effect is observed in ferroelectric, relaxor ferroelectric and
antiferroelectric materials. In this subsection, these materials and material properties will
be explained.
1.1.1. Ferroelectric Materials
Ferroelectrics are type of pyroelectric crystal classes defined as polar insulator
materials. The lack of center of symmetry brings the spontaneous polarization property.
Therefore, ferroelectric materials exhibit polar symmetry having a spontaneous
polarization where the direction of polarization could be switched by application of
electric field. 1
These properties classify the ferroelectric materials under the dielectric material
class as shown in Venn diagram in Figure 1.1 with characteristic features of the materials.
Switchable polarization direction property of ferroelectrics yields hysteresis loop
behavior as shown in Figure 1.2.
In the beginning (in the absence of electric field), the randomly oriented domains
that minimize the electrostatic energy, are separated by domain walls. By applying
external electric field, the domains are oriented in the direction of the electric field and
grow at the expense of unfavorable ones and continue till to a single domain is formed

2
with the same direction with electric field. This corresponds to the saturation polarization
(Ps) shown at point D in Figure 1.2. When the electric field is removed, the domain
structure, in which polarization is in the same direction with the electric field, wishes to
return to its original state. However, this require a re-formation of the domain walls, and
a remanent polarization (Pr) value is kept in the material.
When the electric field direction is reversed, the same conditions are valid and
negative saturation polarization and negative remanent polarization (-Pr) are achieved
,respectively.2 Ec is term donating coercive field of the material that represents the
minimum electric field that must be applied to depolarize the material, the hysteresis loop
is characteristic for the materials.
Figure 1.1. Venn diagram showing the relation between dielectrics, piezoelectrics,
pyroelectrics and ferroelectrics.
Hysteresis behavior is preserved with narrowing of the loops as the temperature
increases until the temperature called as the Curie temperature,Tc at which the material
with ferroelectric property (low symmetry phase) have a phase transition to the non-polar
phase named as paraelectric phase (high symmetry phase).1,3

3
Figure 1.2. Hysteresis loop of a ferroelectric material.4
At the phase transition temperature (Tc), the ferroelectric materials have a peak in
the dielectric constant. Therefore dielectric constant is very high. The temperature
dependence of the dielectric constant is defined by Curie Weiss law1 as given in Equation
1.1.
T0 is the Curie Weiss temperature and defined as the temperature at which the
dielectric constant begins to be linear. C is the Curie Weiss constant.
Since the ferroelectric materials are also piezoelectric, a relative displacement is
obtained in the unit cell by the applied electric field. This is referred to as a piezoelectric
effect and leads to strain-electric field hysteresis with typical butterfly-shaped curve as
shown in Figure 1.3.

4
Figure 1.3. Strain-electric field hysteresis loop with butterfly shape in ferroelectrics.5
The strain of the crystal is zero in the absence of electric field. A displacement
occurs in the unit cell under the applied electric field and a strain value is obtained under
the formed stress or displacement. The maximum strain value is observed when the
polarization of material is saturated. When the electric field is removed, the strain drops
to the zero. If the electric field is applied in the opposite direction, same behavior occurs
in the material and negative strain values are obtained. Thus, butterfly shaped strain
electric field curve is formed.
Ferroelectric materials have perovskite type crystal structure with the chemical
formula ABO3. The perovskite structure is very important for ferroelectric materials
offering the possibility to dope the material at both A and B sites. The dopant atoms affect
the phase transition character and phase transition temperature of the ferroelectric
materials and cause changes in the tolerance factor that describe the stability or distortion
of the crystal structure. Thus doping brings different properties to the ferroelectrics. The
Goldschmidt tolerance factor (t) formula is given in Equation 1.21 where rA, rB and rO are
the radii of A and B sites and the oxygen atom, respectively.

5
The doping of the material either to the A or B sites causes distortion of the crystal
structure. The distortion weakens the bond between the B site ion and the oxygen ion,
which is the source of ferroelectricity. This affects the phase transition characteristics of
ferroelectric materials and change it from the first order phase transition (FOPT) at which
the materials have sharp permittivity maximum over a narrow temperature range, to the
diffuse phase transition (DPT) where the materials have a broad dielectric permittivity
maximum with no or little frequency dependence.
Further increase in the doping level changes the domain structure of the
ferroelectric materials and causes the formation of nanodomains, such ferroelectrics are
called as relaxor ferroelectrics. Relaxor ferroelectricity occurs due to compositional
disorder induced by doping which provides more than one element in the doped site of
the perovskite structure. This disorder does not include charge disorder due to charge
neutrality rule however it leads to change in off-center ionic shifts.3 The frequency
dependence and the shift in dielectric maxima with respect to the frequency are the
fingerprints of the dielectric behavior of the relaxor ferroelectrics.6
Relaxor ferroelectrics shows hysteresis behavior till Tm (the dielectric maxima).
Tm shifts to higher temperature with increasing frequency and dielectric loss is broad and
frequency-dependent. Relaxors can be divided into two subgroup as ergodic and
nonergodic relaxors.5 Figure 1.4 shows the schematic representation of domain structure
in the ergodic and nonergodic relaxors.
Two different temperatures are defined for polar nanoregions (PNRs) (relaxor
ferroelectrics). TB is the Burns temperature which is the phase transition temperature from
nonergodic relaxor to paraelectric phase as shown in Figure 1.4. TF is the freezing
temperature where the transition occurs between nonergodic relaxor to ergodic relaxor.
Below the TF, the nonergodic relaxors show ferroelectric hysteresis and this behavior is
induced by application of the electric field and the dielectric behavior is nearly frequency
independent at this temperature. When the material is cooled under the electric field,
ferroelectric domains become visible. The domain pattern disappeares at TF by removing
the electric field and reheating the material.
Figure 1.5 (a)-(c) shows the comparison of normal and relaxor ferroelectrics. In
summary, when ferroelectric and relaxor ferroelectrics are compared, ferroelectrics have
macro-sized domains, whereas relaxors consists of nanodomains. The coercive field and
remanent polarization values of the ferroelectric materials are much higher than the
relaxors and the slim loop is observed in the relaxors (see in Figure 1.5 (a)). While the

6
ferroelectrics have a sharp phase transition around the Curie temperature (TC), the
relaxors display a broad dielectric maximum at Tm and the change in polarization with
respect to the temperature is not sharp (Figure 1.5 (b)).
Figure 1.4. The polar nanodomains in different type of relaxor ferroelectrics.7
In terms of dielectric properties, ferroelectrics reach a dielectric maxima with a
sharp transition in a narrow temperature range without frequency dependence. In relaxor
ferroelectrics, frequency dependent dielectric behavior is observed over a wide
temperature range and dielectric maxima shifts with frequency to higher temperatures.
Relaxor ferroelectrics show a strong deviation from Curie-Weiss law while the
ferroelectrics follow the Curie-Weiss law. Relaxors can be described by the modified
Curie-Weiss law as given in Equation 1.3 where Ɛm is the maximum dielectric constant
observed in Tm temperature.
Where the ɣ is the diffuseness coefficient and equals to 1 for normal ferroelectrics
(undoped) and the increase in the doping level causes the ɣ value to approach 2 for relaxor
ferroelectrics.

7
Figure 1.5. Comparison of (a) hyteresis curves (b) phase transition behavior (c) dielectric
behavior of the normal ferroelectrics and relaxor ferroelectrics.8

8
1.1.2. Antiferroelectric Materials
Antiferroelectric materials have domain structures with antiparallel electrical
dipole moments and application of electric field induces a ferroelectric phase by
switching the polarization directions in parallel order.9 This type of materials have a non-
polar crystal symmetry and there must be a transition from the non-polar to polar
symmetry with application of the electric field which means that in antiferroelectrics there
is a competition between the polar and non-polar phases where the free energy difference
is small. Figure 1.6 (a) shows this situation. The double hysteresis loop (as shown in
Figure 1.6 (b)) in antiferroelectrics is the fingerprint of the induced phase transition.
Since the nonpolar and polar phases have different crystal symmetry, the
transition between these two phases, that takes place with the help of applied electric
field, provides a high strain value due to the large volume expansion.10
This type of materials also exhibit a dielectric anomaly at the structural phase
transition temprature from the antiferroelectric to the paraelectric phase and
antiferroelectric materials obey the Curie-Weiss law (Equation 1.1) above the transition
temperature.
Polarization switching under electric field due to phase transition from
antiferroelectric to the ferroelectric phase causes current switching and large current
values. Figure 1.7 shows the switching current behavior of antiferroelectrics.
Figure 1.6. (a) The free energy curves of the antiferroelectric PbZrO3 material. (b) Typical
double hysteresis curve of PbZrO3.10

9
Figure 1.7. Typical current density-electric field curves of antiferroelectric materials.11
4 peaks and large current values in the J-E curve are clearly shown in Figure 1.7.
When an electric field is applied to the antiferroelectric phase, antiparallel dipoles orient
in the direction of electric field and become parallel. This causes large current (AFE-FE
point in the Figure). Similarly, a large current is observed when the ferroelectric phase
reaches the antiparallel dipole arrangement again (FE-AFE point in the Figure). These J-
E curves can also be used to characterize the antiferroelectric behavior.
1.2. Electrocaloric Effect (ECE)
In this section, history of electrocaloric effect, its working principle, measurement
methods and application areas will be discussed.
1.2.1. History of ECE
The discovery of the electrocaloric effect was achieved by Kobeko and
Kurtschatov in 1930 with Rochelle salt. Since the values obtained with potassium
dihydrogen phosphate in 1950 are also as small as Rochelle salt, the electrocaloric effect
is not considered for utilization in alternative cooling technology until 2000s. In the

10
2000s, a large electrocaloric temperature change of 12 K was obtained by Mischenko et
al. in the PZT thin film.12 This giant value brings new excitement to the studies on
electrocaloric effect. After that, many studies have been done. These studies will be
explained in detail in sections 1.3 and 1.4.
1.2.2. Phenomenological and Thermodynamical Description of ECE
The electrocaloric effect (ECE) is observed in dielectric materials named as
ferroelectrics and this phenomenon is based on the change in dipolar entropy by
application of electric field under adiabatic conditions.13 The total entropy of the
ferroelectric material is equal to the sum of dipolar subsystem and thermal subsytem
(given in Equation 1.4). Therefore the electrocaloric effect could be defined as the
exchange entropy between these two subsystem.14
When the electric field is applied to the ferroelectric materials, the dipolar
orientation occurs. Change in the entropy of the dipolar subsystem is balanced with a
change (increase) in thermal subsystem to keep the total entropy constant under adiabatic
conditions and this leads to increase in temperature of the ferroelectric material. When
the electric field is removed from the system the material cools down. Figure 1.8 shows
the schematic representation of the ferroelectric dipoles under applied electric field.
Figure 1.8. Schematic representation of dipoles under applied electric field.14
The alternative cooling technologies become a necessity due to halocarbon gases
that are emitted by existing cooling technologies. The electrocaloric effect is a promising

11
alternative for cooling technology. Figure 1.9 shows the comparison between
electrocaloric and vapor-compression cooling cycle.
In the beginning, the dipoles of the materials are randomly oriented and
application of electric field causes alignment of the dipoles and dipolar entropy decreases.
Material heats up to keep the total entropy constant. This polarization process is equvalent
to the adiabatic compression step of current cooling technology. Then, resulting heat is
removed to the cold sink part of the electrocaloric coolers and electric field is kept
constant to prevent reabsorption of the resulting heat. Next, the electric field is removed
and dipoles become randomly oriented. Therefore, material cools down. This stage is
equvalent to the expansion step of the vapor compression technology. Finally, the
negative heat is transferred to the hot sink of the electrocaloric coolers and the cycle is
closed.
Figure 1.9. Comparison between the (a) electrocaloric cooling cycle and (b) the vapor-
compression cycle.15
1.2.3. Measurement Methods for ECE
One of the most important part of electrocaloric effect (ECE) studies is accurate
and precise measurement of ECE. ECE can be measured by using either the direct or
indirect method.

12
1.2.3.1. Direct Method
The temperature change or the resulting heat in the material caused by the
application of electric field is directly measured in this type of measurement method using
the differential scanning calorimeter (DSC) or adiabatic calorimeter.
Figure 1.10. Schematic representation of an adiabatic calorimeter.13
In the adiabatic calorimeter, the sample in the thermally insulated container is
exposed to the electric field and Figure 1.10 shows the schematic representation of
adiabatic calorimeter that not only measure the ECE as a function of temperature but also
the polarization. With this method a temperature change of 10-4 K can be measured.
However, there are some issues that need to be considered in order to determine the ECE
precisely. The thermocouples, electrodes or any parts used in the measurement should
have very small heat capacity compared to sample. Thermal insulation must also be
enough for precise determination of temperature change of sample.13
In the DSC method, the equal heat flows are applied to the sample and reference
while the electrocaloric material or sample exhibit a temperature change caused by
absorbtion or emission of heat due to electrocaloric effect. Precise temperature sensors
record this change. Schematic representation of modified DSC is shown in Figure 1.11
(a). Figure 1.11 (b) shows the heat flow occurring in the sample measured by DSC
method. An exothermic temperature change occurs in the sample with the applied electric
field. When the electric field is removed, the DSC signal decreases to the baseline level.

13
The endothermic peak is observed when the material cools down below the baseline with
the absence of electric field. However, it is difficult to provide adiabatic conditions in the
DSC method and the adibatic temperature change can only be determined correctly if the
electric field is switched on very quickly.13
Figure 1.11. (a) Schematic representation of a modified DSC. (b) Example of heat flow
of a material under an applied electric field.13
1.2.3.2. Indirect Method
The indirect determination of the electrocaloric effect is based on the Maxwell
relation (Equation 1.5).
To obtain ΔT value, the following electrocaloric temperature change formula
(Equation 1.6) is used. Here, E1 and E2 are the initial and final applied electric field,
respectively. Cp is the heat capacity of the sample determined by DSC method and ρ
denotes the density of the material. Equation 1.7 represents the adiabatic entropy change
formula.

14
The electrocaloric temperature change (ΔT) is determined by using polarization
versus temperature (P-T) graphs obtained from the upper branches of the measured
hysteresis loops at different temperature and constant electric field. The slope of P-T
curve is obtained either by numerical differentiation (Equation 1.8) or by fitting P-T
curves with a polynomial and then differentiating the curves.
Indirect determination of electrocaloric effect is more easier than direct
determinaion. Therefore, it is used by many groups.
However, there are some factors that restrict the applicability of the indirect
method. It is not a correct approach to determine the electrocaloric temperature changes
of the non-ergodic relaxor samples (mentioned in section 1.1.1). Very low relaxation
times of these materials limit the reproducibility of the method.13 In addition, saturated
polarization curves should be used when using the indirect method.
1.2.4. Application Areas
As mentioned earlier, the need for alternative cooling technologies increases due
to the negative effects of existing cooling tecnologies on the environment. Several
consortiums have been established to support the research on alternative cooling
technologies and studies have been accelerated. One of them is CaloriCoolTM - The
Caloric Materials Consortium. CaloriCoolTM includes Pacific Northwest and Oak Ridge
National Laboratories, University of Maryland, Pennsylvania State University, GE
Global Research, United Technologies Research Center, Astronautics Corporation of
America, and Citrine Informatics.

15
Some groups have focused on prototype studies. The most important one among
these studies is a small cooling device made by the group in the University of California.
This device uses a thin, flexible and elastic electrocaloric polymer that is shown in Figure
1.12 (a). In addition, a process called electrostatic activation is used to make this device
more energy efficient than traditional methods. This allows quick transfer of heat from
one side to another. This device can be used to prevent heating of smartphones and
laptops, or can be used for personal conditioning in wearable clothing.16 Figure 1.12 (b)
shows the result of the experiment. The difference in the temperature of the battery with
and without the EC cooling device is quite large.
Considering all these studies, prototypes and the properties and advantages of
electrocaloric effect, ECE is a promising alternative to existing cooling technologies.
Figure 1.12. (a) The flexible electrocaloric polymer. (b) The temperature of smartphone
battery with and without an electrocaloric device.16
1.3. Electrocaloric Materials
In this section, lead-containing and lead-free electrocaloric materials studied in
the literature will be explained and compared in detail.
These materials are in the form of polycrystalline samples, single crystals, thin
film or thick films, consisting of ceramics or polymers. When the electrocaloric response
of these forms of materials are compared, the single crystals are not suitable for

16
application because of the difficulties and cost of fabrication. Thin and thick films have
a high electrocaloric responses under a high electric field however this material form is
not suitable for macro-cooling applications because of the volumetric reason. (Only very
small areas can be cooled.) Therefore, researchers focused on the polymers and
polycrystalline ceramics.
1.3.1. Lead-Containing Perovskites
As previously mentioned in Section 1.2.1, the electrocaloric effect was discovered
in Rochelle salt and KH2PO4. Obtained electrocaloric temperature changes from these
materials were very small. The electrocaloric effect become popular again with the
discovery of giant 12 K temperature change in PbZrxTi(1−x)O3 (PZT).17 The reason for the
high temperature change obtained in PZT is that this material undergoes AFE-FE phase
transition. 17
One of the most studied lead-containing electrocalorics are (1-x)PbZn1/3Nb2/3O3-
(x)PbTiO3 (PZN-PT)18 systems and PMN-PT.19–27 The main reason for this is that it has
a high electromechanical effect in the MBP region and maximum ECE is obtained in the
same region.
Pb0.99Nb0.02(Zr0.75Sn0.20Ti0.05) (PNZST) is another material that exhibit a high
temperature change among lead-containing electrocaloric materials.28 The PbSc1/2Ta1/2O3
(PST) ceramic studied by the same group also showed a high ECE response under high
electric field.29
Table 1.1 shows and summarizes the electrocaloric reponses or temperature
changes (ΔT) of lead-containing materials with their form and applied electric fields. The
electrocaloric responses of lead-containing materials are relatively high however these
values are obtained under high electric field (ΔE). The important parameter to compare
the electrocaloric effects of materials is the temperature change per unit electric field, that
is ΔT/ΔE.
Development of lead-containing electrocaloric materials is pushed aside because
of the toxic effect of lead element since the main goal and idea in the electrocaloric effect
is to develop an environmentally friendly alternative cooling technology. Therefore,
researchers focus to develop lead-free electrocaloric materials.

17
Table 1.1. The electrocaloric responses of the most important lead-containing materials.
Material Form of Material T(°C) ΔE
(kV/cm) ΔT(K) ΔT/ΔE (10-6m.K/V)
Measurement Method Ref.
PZT (95/05)
Thin Film (350 nm) 222 776 12 0.15 Indirect 17
PZN-PT (92/08)
<110> Single Crystal
180 12 0.23 0.21 Direct 18
PMN-PT (92/08) Ceramic 23 15 1.4 0.93 Direct 19
PMN-PT (90/10)
<111> Single crystal
55 40 1 0.25 Indirect 20
PMN-PT (87/13) Ceramic 70 24 0.56 0.23 Direct 27
PMN-PT (85/15) Ceramic 17 16 1.7 1.06 Direct 26
PMN-PT (75/25) Ceramic 120 14 0.49 0.36 Direct 24
PMN-PT (75/25)
<111> Single crystal
100 10 0.78 0.78 Direct 25
PMN-PT (72/28)
<011> Single crystal
130 9 0.53 0.59 Direct 22
PMN-PT (72/28)
<111> Single crystal
130 12 2.7 2.25 Indirect 23
PMN-PT (65/35)
Thin Film (240 nm) 140 750 31 0.41 Indirect 21
PNZST Ceramic 163 25 2.6 1.04 Indirect 28
PST (50/50)
Multilayer Capacitor 23 138 2.4 0.17 Direct 29
1.3.2. Lead-Free Perovskites
Among the lead-free ferroelectric materials, the most studied one is BaTiO3 (BT).
This material has a perovskite structure and has three structural phase transition around -

18
80°C, 5°C and 125°C from rhombohedral to orthorhombic, orthorhombic to tetragonal
and tetragonal to cubic with the polar directions <111>, <110> and <001> ,respectively.
Higly polarisable character and the large dielectric strength of BaTiO3 makes the material
a potential candidate for electrocaloric cooling.30
Figure 1.13. A and B site dopants for BaTiO3 and the effect on transition temperatures.30
As mentioned earlier, the major advantage of ABO3 or perovskite structure is that
it allows doping at both A and B-sites. The factors that should be taken into consideration
during the doping process is the selection of compatible dopant atom based on the ionic
valency and ionic radius. Thus the distortion of the crystal structure is minimized and
charge neutrality will be conserved without any charge defect. The effect of common
dopants on the phase transition temperautres of BaTiO3 are shown in Figure 1.13.

19
Table 1.2. The electrocaloric responses of the most important lead-free materials.
Material Form of Material T(°C) ΔE
(kV/cm) ΔT(K) ΔT/ΔE
(10-
6m.K/V)
Measurement Method Ref.
BaTiO3 Ceramic 128 10 1.3 1.3 Indirect 31 BaTiO3 Single
Crystal 129 12 0.9 0.75 Direct 33 BaTi1-xSnxO3 (x=0.105) Ceramic 28 20 0.61 0.31 Indirect 37 Ba1-xCaxTi0,95Sn0,05O3
(x=0.05) Ceramic 113 10.8 0.53 0.49 Indirect 38 Ba(Zr0,1Ti0,9)1-xSnxO3
(x=0.075) Ceramic 30 8.7 0.19 0.22 Indirect 36 BaHfxTi1-xO3 (x=0.11) Ceramic 70 10 0.35 0.35 Indirect 41 Ba0,85Ca0,15Ti1-xHfxO3
(x=006) Ceramic 128 21 0.65 0.31 Indirect 39 Ba0,8Ca0,2(ZrxTi1-x)O3
(x=0.04) Ceramic 113 7.95 0.27 0.34 Indirect 40 BaSn0.1Ti0.9O3 Ceramic 64 15 0.48 0.32 Indirect 42 NBBST0.10 Ceramic 110 40 0.22 0.18 Indirect 43
NBT-ST (x=0.25) Ceramic 60 50 1.64 0.33 Indirect 44 KNN-ST Ceramic 67 159 1.9 0.12 Direct 45
0.94Bi0.5Na0.5TiO3-0.06KNbO3 Ceramic 76 70 1.73 0.24 Indirect 46
Na0.5Bi0.5TiO3–BaTiO3 Ceramic 25 50 0.12 0.24 Indirect 47 0.82NBT–0.18KBT Ceramic 80 77 1.62 0.21 Indirect 47 0.90NBT-0.05KBT-
0.05BT Ceramic 90 74 1.47 0.2 Indirect 47 0.96KNNSb-0.04BNK-
0.5Zr Ceramic 77 40 0.51 0.13 Indirect 48 0.97KNN-0.03LiSbO3 Ceramic 72 40 3.33 0.83 Indirect 49
The electrocaloric temperature changes obtained from pure and doped BT
studies31–37 are listed in Table 1.2 with applied electric field and phase transition

20
temperatures. Doping did not increase the electrocaloric responsivity of BT. However
maximum the response temperature or Tc was reduced from 128°C to 28°C. One of the
main objectives in electrocaloric research is to bring the phase transition temperature (Tc)
closer to room temperature for applications.
Bi-based ferroelectric materials wiht lone pair electrons are considered as one of
the most promising alternatives to lone pair electron containing Pb-based perovskites.
Most important Bi-based systems38–44 are listed in Table 1.2 with their electrocaloric
response.
The resulting temperature changes (ΔT) that is obtained from lead-free materials
are not sufficient yet to integrate these materials into refrigeration technologies. For this
reason, many studies are carried out to improve the electrocaloric properties of materials.
Therefore, it is necessary to understand the mechanisms that enhance the electrocaloric
effect of materials.
1.4. Mechanisms to Enhance the Electrocaloric Effect
In this section, the mechanisms that affect the electrocaloric effect will be
disccussed.
1.4.1. First Order Phase Transition, Diffuse Transition, Relaxor
Ferroelectricity
The effects of doping that changes the ferroelectric phase transition characteristics
and the phase transition temperature will be discussed.
As mentioned earlier, the perovskite structure (ABO3) of ferroelectric materials
allows the doping to both A and B sites. Due to doping, the phase transition character of
the normal ferroelectrics changes from, namely "the first order phase transition", where
the polarization changes sharply with respect to the temperature and the resulting large
increase in ∂P/∂T leads to high electrocaloric temperature change (ΔT) value in a narrow
temperature range. Increasing doping affects the phase transition character and the dopant
amount increases, first the diffuse phase transition (DPT) and then relaxor property is
observed. One of the main objectives of doping is to bring the operating temperature
closer to room temperature for cooling applications. The operating temperature range of

21
the materials that exhibit diffuse phase transition or relaxor properties is spread over a
wide temperature range. Doping can be used to achieve this. To sum up, doping is
essential for ECE because the ΔT value obtained from the materials with the first order
phase transition character is high but only in a narrow temperature range. Therefore, DPT
or relaxor property are promising for applications.
Relaxor ferroelectric materials include polar nano regions (PNRs) which increase
the entropy that might enhance the ECE. The most important relaxor ferroelectrics are
PMN and PMN-10PT. These materials show strong relaxor property and the resulting ΔT
values are quite high in a broad temperature range. Among lead-free ferroelectrics, Hf
and Zr doped BT are the important relaxor ferroelectric materials.34,35
Figure 1.14. The phase diagram of BaTi1-xSnxO3 ceramic.32
There is another mechanism called as critical point where more than one
ferroelectric phase coexist. The most relevant studies of critical point containing systems
in the literature are done on Sn, Zr and Hf doped BT.32,36. Figure 1.14 shows the phase
diagram obtained for Sn-doped BT (BaTi1-xSnxO3) and the critical point is observed in
the x = 0.105 composition and the ΔT value is very high for this composition. In critical
point region, the multiphase coexistance leads to larger EC temperature change due to the
ease of inducing remarkable polarization/entropy change with application of electric field

22
as well as large entropy change caused by multiphase coexistence. The disadvantage of
critical point is that the high ΔT is observed in a narrow temperature range.
Considering all these studies, importance of doping process is well understood
and the studies mainly continue on BT and NBT-based ceramic materials.
1.4.2. Morphotropic Phase Boundary (MPB)
Another mechanism that enhances ECE is called as morphotropic phase boundary
(MPB). The morphotropic phase boundary is an area of phase diagram where two
ferroelectric phase coexist at a certain composition and the crystal structure could easily
change from the first ferroelectric phase to another by changing the composition. This
leads to more polarization directions and therefore it is possible to orient the dipoles by
applying a lower electric field. Also, a large enhancement of the electromechanical
properties is observed in the MBP region in e.g. PZT45 and PMN-PT46 systems and their
piezoelectric coefficients equal to 750 pm/V and 700 pm/V, respectively. The field-
induced polarization rotations could lead to unit cell deformation and enhance the
piezoelectric and dielectric properties and the electrical polarization value is maximum at
the MBP region.
Figure 1.15. The phase diagram of PbZr1-xTixO3.47
Figure 1.15 shows the phase diagram of PbZr1-xTixO3 ceramic which is the best
piezoelectric material. Composition-dependent dielectric constant, polarization and

23
piezoelectric constant graphs of this system where the MBP is observed in x = 0.47
composition, are displayed respectively in Figure 1.16 (a)-(c). Considering these graphs,
the importance of the MBP is quite clear.
Figure 1.16. (a) Dielectric constant versus composition for the system PbTO3-PbZrO3.
(b) Polarization versus composition for the system PbTiO3-PbZrO3 .
. (c) Piezoelectric constant versus temperature for Pb(Ti0.47Zr0.53)O3.30
1.4.3. Ferroelectric-Antiferroelectric (FE-AFE) Phase Transitions
The antiferroelectricity previously described in section 1.1.2 was first observed in
PbZrO3, followed by lead-free materials such as (Na1/2Bi1/2)O3, AgNbO3 and NaNbO3
and their solid solutions.48 As previously mentioned, an arrangement of the antiparallel
dipole order exists in antiferroelectrics. Under the application of electric field, the low
energy barrier between the ferroelectric phase and the antiferroelectric phase causes a
switching from antiferroelectric to ferroelectric phase. When the applied electric field is
large enough, the dipoles of the metastable ferroelectric phase are oriented and the electric
field induced phase transition leads to a large volume expansion.10 Therefore, the
piezoelectric properties obtained from materials having this type of phase transition are
quite high.49,50
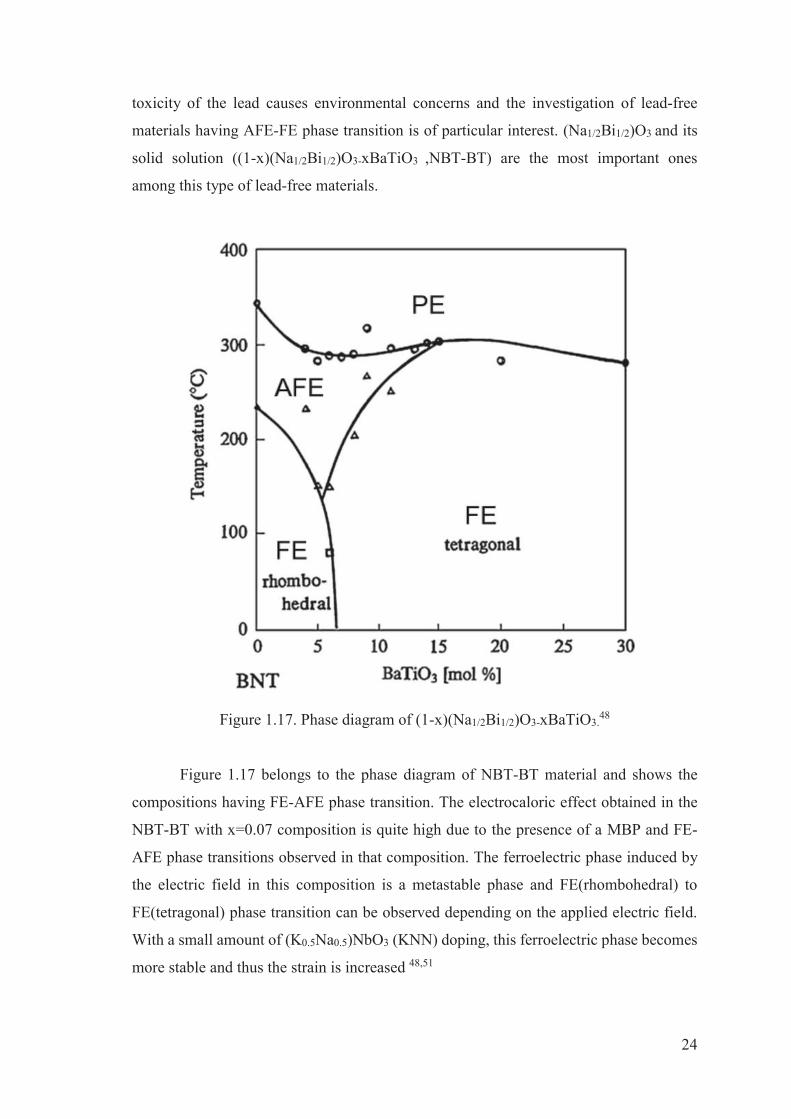
All of these properties were observed in Pb-based materials (PbZrO3, PNZST).48
Although these materials exhibit outstanding properties in engineering applications, the
24
toxicity of the lead causes environmental concerns and the investigation of lead-free
materials having AFE-FE phase transition is of particular interest. (Na1/2Bi1/2)O3 and its
solid solution ((1-x)(Na1/2Bi1/2)O3-xBaTiO3 ,NBT-BT) are the most important ones
among this type of lead-free materials.
Figure 1.17. Phase diagram of (1-x)(Na1/2Bi1/2)O3-xBaTiO3.48
Figure 1.17 belongs to the phase diagram of NBT-BT material and shows the
compositions having FE-AFE phase transition. The electrocaloric effect obtained in the
NBT-BT with x=0.07 composition is quite high due to the presence of a MBP and FE-
AFE phase transitions observed in that composition. The ferroelectric phase induced by
the electric field in this composition is a metastable phase and FE(rhombohedral) to
FE(tetragonal) phase transition can be observed depending on the applied electric field.
With a small amount of (K0.5Na0.5)NbO3 (KNN) doping, this ferroelectric phase becomes
more stable and thus the strain is increased 48,51

25
Table 1.3 shows the electrocaloric properties of the materials17,39,41,52,53 with FE-
AFE phase transitions.
Table 1.3. The electrocaloric responses of the materials having FE-AFE phase
transition.
Material Form of Material
T (°C)
ΔE (kV/cm)
ΔT (K)
ΔT/ΔE (10-
6m.K/V) Method Ref
Pb0.99Nb0.02(Zr0.75Sn0.20Ti0.05)0.98O3
Ceramic 161 30 2.5 0.83 Direct 57
PZT (95/5) Thin Film (350 nm) 222 776 12 0.15 Indirect 17
NBT-ST (x=0.25) Ceramic 60 50 1.64 0.33 Indirect 44
BNT–0.06KN Ceramic 76 70 1.73 0.25 Indirect 46
0.7BNT-0.3BT Ceramic 150 50 2.1 0.42 Indirect 48
1.5. Motivation of the Thesis
In 2011 Chukka et al. found a giant EC temperature change (ΔTmax) as 2.7 K at
127°C in MPB composition (0.7PMN-0.3PT) of single crystal of PMN-PT at 12 kV/cm
where the EC efficiency (ΔTmax/ΔE (10-6 K.m/V)) equals to 2,25.54 This giant ECE is a
proof that MPB is an effective mechanism. The coexistence of different ferroelectric
phases leads to an increase of the possible polarization directions. Therefore, polarization
of the ceramics becomes easier with application of smaller electric field and this enhance
the EC efficiency. In this respect, motivation of this thesis is to investigate the
electrocaloric effect of Bi-based (1−x)BaTiO3−xBi(Li1/3Ti2/3)O3 0.03≤x≤0.08 system
with a MPB.
According to the XRD measurements (Figure 1.18(a)-(b)) of the article55,
tetragonal peak splitting (002)T/(200)T was observed for the x≤0.07 compositions and
x=0.10 sample showed orthorhombic peak splitting (022)O/(200)O. Thus, it has been
suggested that there is an MPB between x=0.07 and 0.10 compositions. Piezoelectric (d33)
coefficient (Figure 1.18 (c)) for x=0.07 composition gives the maximum value at room
temperature confirming the existence of the MPB.

26
In the dielectric measurements (Figure 1.19), a dielectric peak at around 130°C
was observed in all compositions, which is the Curie temperature of the samples. Also,
depending on the composition, a frequency-dependent anomaly at lower temperatures is
clearly observed. Such double peak behavior is caused by microstructures called core-
shell. Dielectric measurements confirm the existence of the core-shell structure. The shell
region includes ferroelectric nanodomains and there are large ferroelectric lamellar
domains within the core. The reason for the formation of core-shell structure is
incomplete diffusion process due to the limited sintering temperature where a volatile
precursor is involved in the solid solution such as Li2CO3 and Bi2O3.
Figure 1.18. XRD patterns of (1−x)BaTiO3−xBi(Li1/3Ti2/3)O3 between (a) 20-60° and
(b) 44-46.5°. (c) Piezoelectric (d33) coefficient of all (1−x)BaTiO3−
xBi(Li1/3Ti2/3)O3 ceramics.55
This situation is common in BT-Bi(X)TiO3 solid solutions56,57 due to the limited
sintering temperature of these ceramics to prevent the loss of volatile Bi element. During

27
sintering, diffusion proceeds faster through the grain boundaries. BaTiO3 (BT) forms first
and Bi(Li1/3Ti2/3)O3 (BLT) diffusion takes place more quickly along the grain boundaries
than through the grains.
Figure 1.19: Dielectric behavior of (1−x)BaTiO3−xBi(Li1/3Ti2/3)O3 ceramics as a function
of temperature measured at 1 kHz, 10 kHz, 100 kHz and 1 MHz.55
28
The incomplete diffusion after sintering leads to formation of the core-shell
structure where the core area is BT-rich with minimum amount of BLT, while the shell
region is BLT-rich. The peak around 130°C which is observed in all compositions in the
temperature dependent dielectric measurements is associated with the core and
corresponds to the TC of BT. The second frequency dependent anomaly corresponds to
contribution from the shell which is rich in BLT. Large BLT content distrupts
ferroelectric order and induces frequency dependent relaxor ferroelectric behavior in the
dielectric constant.
In the BT ceramics, where the core-shell structure is desired, the dielectric peak
observed at lower temperatures due to the shell contribution provides high dielectric
constant in a wide temperature range. This is especially important for commercial
capacitor applications.58,59
The aim of this thesis is to investigate the effect of core-shell microstructure and
MPB on the electrocaloric response by changing the synthesis conditions of (1-x)BaTiO3-
xBi(Li1/3Ti2/3)O3 (0≤x≤0.2) ceramics. Even though the ferroelectric, piezoelectric and
dielectric properties of BT-BLT is reported by Ma. et al., high temperature ferroelectric
properties have not been reported and electrocaloric properties of this system are not
known.

29
CHAPTER 2
EXPERIMENTAL METHODS
The synthesis conditions and characterization techniques used for microstructure
and phase analysis and methods used in electrical measurements will be explained.
2.1. Material Preparation
In this section, different synthesis routes of the ceramics will be explained with
their flow charts.
2.1.1. Synthesis Route-I
Figure 2.1 shows the flow chart of route-I. The powders of Bi2O3 (99.9%, Sigma-
Aldrich), Li2CO3 (99.999%, Sigma-Aldrich), BaCO3 (99.9%, entekno), TiO2 (99.9%,
Sigma-Aldrich) were used as starting materials and (1−x)BaTiO3−xBi(Li1/3Ti2/3)O3
0.03≤x≤0.10 ceramic synthesis is initiated by drying of the starting powders at 200°C for
12 hours in oven. Stoichiometric amount of powders were mixed and homogenized in a
ball mill (Retsch PM 100) in ethanol medium with 7 zirconia balls (diameter of 10 mm)
in a Nalgene bottle (volume: 30 ml) with a 21:1 ball to powder mass ratio for 2 hours and
then dried in an oven until all solvent is evaporated. The mixture was calcined at 1000°C
for 5 hours.
The calcined powders were mixed with 2 wt % polyvinyl alcohol (PVA)-water
solution, by using ball milling for 1 hour with the same milling conditions. PVA was used
to facilitate pelletization of calcined powders. After all water is removed by drying at
80°C, the powders are pelletized at 375 MPa. Binder (PVA) was removed by heating at
600°C for 1 hour with ramp rate of 1°/min.
Sintering was performed at 1200°C for 3 hours for all compositions. Pellets were
buried in the calcined powder to minimize the loss of Bi3+ and Li+ during sintering.
30
Figure 2.1. Flow chart of the synthesis (Route-I) and the used characterization methods.

31
2.1.2. Synthesis Route-II
Figure 2.2 shows the flow chart of route-II. The powders of Bi2O3 (99.9%, Sigma-
Aldrich), Li2CO3 (99.999%, Sigma-Aldrich), BaCO3 (99.9%, entekno), TiO2 (99.9%,
Sigma-Aldrich) were used as starting materials and (1−x)BaTiO3−xBi(Li1/3Ti2/3)O3
0.03≤x≤0.08 ceramic synthesis is initiated by drying the starting powders at 200°C for 12
hours. Stoichiometric amount of powders were mixed and homogenized in a ball mill
(Retsch PM 100) in ethanol medium with 160 zirconia balls (diameter of 5 mm) in a
Nalgene bottle (volume: 30 ml) with a 10:1 ball to powder mass ratio for 6 hours and then
dried in oven until all solvent is evaporated. The mixture was calcined at 900°C for 5
hours and then milled for another 6 hours under the same milling conditions. After drying,
the powders were mixed with 2 wt % polyvinyl alcohol (PVA)-water solution by using
ball milling for 4 hours with the same milling conditions and the dried powders were
sieved with the help of 65 μm sieve that is used to prevent the negative effect of the
agglomeration on the sintering kinetics. Then powders are pelletized at 375 MPa. Binder
was burnouted at 600°C for 4 hours with ramp rate of 1°/min. The sintering was done
between 1200°-1250°C for 3 hours, according to the BLT content. Pellets were buried in
the calcined powder to minimize the loss of Bi3+ and Li+.
For both synthesis routes, the surfaces of the sintered samples were polished with
600,1000 and 2000 mesh SiC sandpaper to prepare the samples for the measurements of
density and electrical properties.
2.2. Characterization of the Materials
The used characterization methods for the synthesized ceramics are described in
this section.
2.2.1. Particle Size Analysis
Particle size analysis is done by using dynamic light scattering (DLS). DLS is a
technique used to determine the particle size distribution. When light hits to the particles,
the light scatters in all directions (called as Rayleigh scattering) as a function of the size
of the particles.60

32
Figure 2.2. Flow chart of the synthesis (Route-II) and the used characterization methods.

33
Scattering intensity fluctuates over a time. Small molecules in the solution receive
Brownian motion that cause to this fluctuation and the distance between the scattered
molecules changes with time. The Brownian motion of the particles depend on their size,
refractive index, measurement temperature and the viscosity of the solvent. The signal is
read out only the constructive phases occurs and it carries the information about the
fluctuation intensity of the scattered light as a function of the time. Figure 2.3 shows the
schematic representation of the dynamic light scattering experiment.61
To measure the particle size of the ceramic samples, 5 mg of the milled powder
was dissolved in 1.5 ml ethanol and ultrasonically disaggregated for 2 minutes. Then the
measurement is carried out by using a dynamic light scattering instrument (DLS;
Zetasizer Nano ZS, Malvern Instruments, Worcestershire, UK) provided by IZTECH
Material Science and Engineering Department. The particle size distribution of the
ceramics are determined by DLS measurements before and after the calcination and
before the sintering process.
Figure 2.3. A schematic representation of the dynamic light scattering experiment.61
2.2.2. Archimedes’ Method
The density of the sintered samples is measured based on the Archimedes’
principle using the density determination kit of Radwag –AS 220 R2 analytical balance.

34
Figure 2.4. A schematic representation of the Archimedes’ principle.
Archimedes’ principle is based on the balance of the buoyant or upward force and
the gravitational force acting on the sample. Figure 2.4 shows the schematic
representation of the principle. The buoyant force (Fb) is produced by the liquid on the
sample fully immersed in the liquid. This force is equal to the gravitational force (Fg),
where;
For an object having a volume V, the Fg = ρw.V.g, where the ρw is the density of
the water. The mass of object in the air is (M), M= ρ.V, where the ρ is the density of the
sample. The difference between the actual weight of an object and the magnitude of the
buoyant force gives the apparent mass (Mapp) of the sample that is the mass (Mw) when
the object is immersed in water totally.

35
2.2.3. X-Ray Diffraction
X-Ray Diffraction (XRD) was used to determine the symmetry of the phases and
phase purity in calcined powder and also to obtain the information about the incorporation
of the substituting atoms by following the shifts of the XRD peaks as a result of
substitution. XRD measurements were done with a high resolution X-ray diffractometer
(Philips X’Pert Pro) provided by the Izmir Institute of Technology (IZTECH) Material
Research Center.
XRD can define the interatomic distances and angles and the positions of the
atoms. This method is based on the fact that distances between atoms in the crystals and
the wavelength of the X-rays that are of the similar magnitude (1 Å or 100 pm).62
X-ray diffraction patterns of the samples were collected with 0.0170 step size
(°2θ) between 20-80 degrees. The scan step time (s) value for both calcined and sintered
samples synthesized following route-I and calcined samples synthesized following route-
II are equal to 15 seconds while the scan step time for sintered samples following route-
II is increased to 54 seconds. The phase analyses of the X-ray diffraction patterns of
samples were done by using search and match process in HighScore Plus program.63
2.2.4. Scanning Electron Microscopy
Scanning Electron Microscope (SEM) was used to determination of grain sizes,
porosity of samples and identification of impurity phases that are not detected by XRD.
Both secondary electron and back scattering (BS) imaging were used for these purposes.
The SEM instruments used in this work are Philips XL 30S FEG with and EDX (Energy
Dispersive X-Rays) detector provided by the IZTECH Material Research Center and Carl
Zeiss 300VP provided by Izmir Katip Celebi University (IKCU) Central Research
Laboratory.
In SEM, the focused beam of the electrons with high energy is used to produce
image of a sample. Imaging the surface topography, morphology, chemical composition
and crystalline structure is based on the interaction between electrons and the sample.
After the beam is produced in the vacuum and pass through the electromagnetic fields
and lenses, the beam is focused on the sample and interacts with it. Secondary electron
emission, back-scattered electrons and X-rays are formed due to this interaction. Detector

36
collects the emission and converts it to signal. For morphology and topography analysis
the secondary electrons are used. To see the contrast in samples with multiphases the
preferred emission is the backscattered electrons. For composition information, the X-
rays that are scattered by the sample surface are used with the help of the Energy
Dispersion X-Rays (EDX) detector.64 When the incident electron energy is sufficient to
ionize the surface atoms, it causes the excitation of surface electrons to the higher energy
levels. Due to relaxation of electrons to the lower energy levels, X-rays arev emitted and
elemental analysis can be done.65
The sintered samples are polished by using 600, 1000 and 2000 mesh SiC
sandpaper for SEM analysis. Thus, the surface morphological disorders were eliminated
and scattering was minimized. After polishing an etching procedure is required to image
the grains. In general, the etching process is carried out at a temperature of 100-150°C
below the sintering temperature for 15 minutes to several hours and these conditions vary
depending on the composition and grain structure of the sample.66,67 The thermal etching
process allows the diffusion of particles from boundary region, that is termodynamically
weak due to polishing, towards the grains. Thus heat treatment provides a contrast
between grain and grain boundary. In this thesis study, the thermal etching process was
done at a temperature that is 100°C below the sintering temperature and for 1 hour.
2.2.5. Tranmission Electron Microscopy
In this project, the Transmission Electron Microscope (TEM) was used to check
possible core-shell structure. and confirm the crystallographic symmetry using Selected
Area Electron Diffraction (SAED).
This method is based on the interaction between the transmitted electrons through
the sample and atoms. This interaction gives information about the crystal structure and
the microstructural properties of the sample such as dislocations, grain and grain
boundaries and domain structure in ferroelectrics. The speed and the wavelength of the
electrons directly affect the image. For high quality images, fast electrons with shorter
wavelength is preferred. The light areas in the image are the areas where more electrons
pass through the sample whereas the dark ones are the dense areas of the sample. These
differences give information about the feature of microstructure of the sample.

37
The TEM images contain series of spots and each spot has a diffraction condition
with respect to crystal structure of the sample. SAED is used to identify phases and lattice
parameters and also helpful for determination of structural growth. In this method, the
thin strip of metal is located into TEM instrument to block the beam to obtain the
diffraction information from the "selected" part of the sample. The interaction between
the sample and a parallel beam that is travelling in one direction provide these
information.
Sample preparation and Transmission Electron Microscopy (TEM) measurements
of the samples was done by Dr. Aziz Genç at the ICREA Institute in Barcelona.
2.3. Electrical Characterization
In this section, the techniques used in the electrical measurements of the samples
will be explained. The polished samples with 1 mm thickness and 10 mm diameter were
coated with silver paste and subsequently fired at 135°C for 7 minutes to form the
contants. During the electrical measurements, sample holder is filled with silicone oil to
prevent the formation of electric arcs.
2.3.1. Dielectrıc Permittivity Measurements
The measurements of dielectric permittivity were performed with a Keysight
E4980AL LCR meter on the unpoled samples. Dielectric measurements were done
between 25-200°C. 1 V AC signal was applied at different frequencies (120 Hz, 1 kHZ,
10 kHz, 100 kHz). The sample is placed into sample holder and the temperature is
controlled by the temperature controller of TF1000.
The LCR instruments that measure the inductance (L), capacitance (C) and
resistance (R) of a circuit and therefor named as LCR meter. Definition of impedance is
shown in Figure 2.5 to describe the working principle of LCR meter. The impedance has
two parts as real (resistance,Rs) and imaginary (reactance,Xs) parts. Impedance can be
defined in terms of Z and phase angle θ where Z=Rs+jXs. The reactance become as
inductive or capacitive if the θ >0 or θ <0, respectively.

38
Figure 2.5. Definition of impedance.68
After the capacitance value is obtained, the following parallel plate capacitor
equation (Equation 2.3) is used to calculate the dielectric constant of the materials.
Ɛr is the dielectric constant of the sample, A is the area of the sample, d is the
distance between the plates (thickness for our materials) and Ɛ0 is the permittivity of the
space and is equal to 8.85x10⁻¹² F/m.
2.3.2. Hysteresis Loop and Current-Voltage Measurements
In this study, polarization versus electric field (P-E) loops at different
temperatures are used to determine the electrocaloric temperature change based on
indirect method by using Maxwell relations.
P-E loops measurements were performed with an Aixacct TF Analyzer 1000 unit
that is connected with a high-voltage amplifier (TREK Model 610E) which allows to
apply up to 10 kV. The measurement frequency and the amplitude of the applied voltage
affects the shape of the hysteresis loops and TF analyzer assists to observe the evalution
of the loops.
The excitation signal to record a hysteresis loop consist of a prepol pulse and three
bipolar excitation signals. The relaxation time is 1 second for each signal. The defined
polarization states are identified by the prepol pulse and second pulse of the signals. The
negative state of the remanent polarization is observed due to the prepol pulse while the
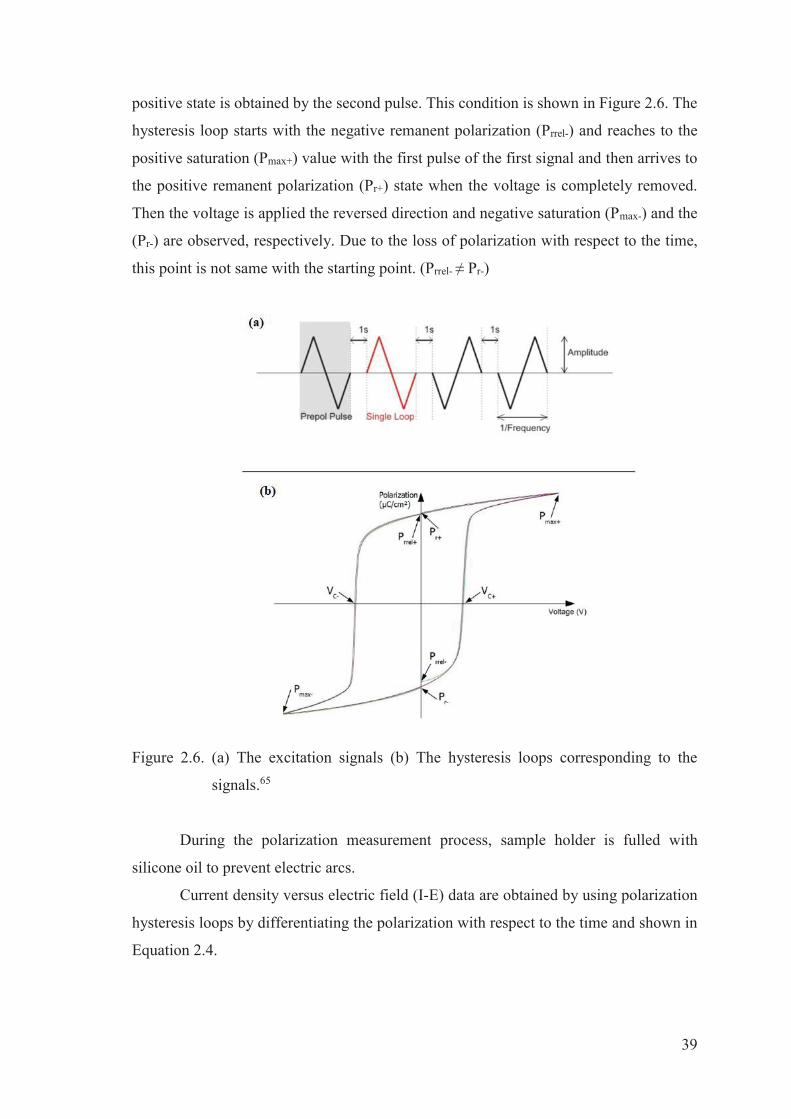
39
positive state is obtained by the second pulse. This condition is shown in Figure 2.6. The
hysteresis loop starts with the negative remanent polarization (Prrel-) and reaches to the
positive saturation (Pmax+) value with the first pulse of the first signal and then arrives to
the positive remanent polarization (Pr+) state when the voltage is completely removed.
Then the voltage is applied the reversed direction and negative saturation (Pmax-) and the
(Pr-) are observed, respectively. Due to the loss of polarization with respect to the time,
this point is not same with the starting point. (Prrel- ≠ Pr-)
Figure 2.6. (a) The excitation signals (b) The hysteresis loops corresponding to the
signals.65
During the polarization measurement process, sample holder is fulled with
silicone oil to prevent electric arcs.
Current density versus electric field (I-E) data are obtained by using polarization
hysteresis loops by differentiating the polarization with respect to the time and shown in
Equation 2.4.

40
I-E curves show characteristic peaks depending on the polar/nonpolar nature of
the sample and are helpful to probe the phase transitions and determine whether the phase
has ferroelectric or antiferroelectric character.
2.3.3. Strain Measurements
In this study, strain-electric field measurements were used to differentiate the
ferroelectric or antiferroelectric character of the samples. These measurements were
performed with a MTI 2100 Photonic Sensor that integrated within the Radiant Precision
LC ferroelectric property measurement system by Dr. Murat Avcı at the Prof. Dr. Ender
Suvacı's laboratory of the Eskişehir Technical University.
As previously mentioned, ferroelectric ceramics also have a piezoelectric
character, resulting in dimension change (displacement) of materials against the applied
electric field. The strain versus electric field graphs were obtained for x=0.03 and 0.07
ceramics by using the Equation 2.5 and the displacement values obtained from
measurement, and are shown in Figure 3.24.
The obtained strain values were converted to normalized strain coefficient (d33*
(pm/V)) values by using the Equation 2.669 where Smax and Emax are the maximum strain
and electric field, respectively. The calculated d33* values compared with the literature
and listed in Table 3.4.
(2.6)

41
CHAPTER 3
RESULTS AND DISCUSSION
3.1. Synthesis Route-I
In this section, the results obtained from materials synthesized by route-I will be
discussed in details.
3.1.1. XRD Measurements
X-Ray diffraction patterns were collected after both the calcination and sintering
processes.
Figure 3.1. XRD patterns of all (1−x)BaTiO3−xBi(Li1/3Ti2/3)O3 calcined samples in the
range of 2Ɵ (a) from 20° to 80° and (b) 40° to 50.
Figure 3.1(a)-(b) shows the room temperature XRD patterns collected on calcined
ceramics of different compositions in Figure 2.1. There are no extra peaks seen in XRD
diffractogram after calcination and this shows that pure perovskite structure is formed.

42
Figure 3.1(b) shows the close examination of peak splitting at the 45°. For low BLT
containing compositions splitting of the (002)/(200) peaks indicates tetragonal phase is
already formed. Tetragonality decreases as the amount of BLT increases.
Figures 3.2 (a)-(b) indicate the XRD patterns of sintered samples. For x≤0.07
samples tetragonal peak splitting at 45°is quite sharp implying tetragonal symmetry and
completion of the phase formation. x=0.03 and 0.05 samples have significant tetragonal
peak splitting whereas the splitting is low for x=0.07. Different to the other compositions,
x=0.10 sample shows orthorhombic splitting. As the Bi(Li1/3Ti2/3)O3 (BLT) content
increases, the stability of the tetragonal phase decreases at room temperature. Thus,
compositions containing a large amount of BLT (x˃0.07) are no longer tetragonal but
orthorhombic at room temperature. This symmetry change between the x=0.07 and 0.10
compositions suggests that there is a morphotropic phase boundary between these two
compositions, and these results are consistent with the literature.55
Figure 3.2. XRD patterns of all (1−x)BaTiO3−xBi(Li1/3Ti2/3)O3 sintered samples in the
range of 2Ɵ (a) from 20° to 80° and (b) 40° to 50.
3.1.2. Particle Size Analysis
The Dynamic Light Scattering (DLS) technique was used to analyze the particle
size that is important for the sintering process.

43
Figure 3.3. Part cle s ze d str but on of (1−x)BaTiO3−xBi(Li1/3Ti2/3)O3 ceramics.
Figure 3.3 shows the particle size distribution of all compositions. The same
particle distribution behavior was observed in all compositions and the powders before
the sintering process have two different particle sizes as 200 and 700 nm. The particle
with 200 nm size appears to be in the majority.
3.1.3. Density Measurements
The density of the ceramic samples were determined by Archimedes’ principle
and are listed in Table 3.1.
Table 3.1. Density of sintered samples measured by Archimedes' method.
x=0.10 x=0.07 x=0.05 x=0.03 5.76 g/cm3 5.27 g/cm3 4.57 g/cm3 4.07 g/cm3
93% 86% 75% 67%
Percent theoretical densities of the samples were calculated using tetragonal
(P4mm) BaTiO3 with the reference number 01-079-2265. As can be seen, the densities of
the x = 0.03 and 0.05 compositions are quite low. Some of the most important factors
affecting the density are particle size and sintering temperature. The sintering temperature

44
is 1200°C for all compositions and the particle sizes of the samples are similar as seen
above (Figure 3.3). The density difference between the samples might be caused by the
BLT content. In the literature, most commonly used compounds as sintering aid in the
liquid phase sintering process is Bi2O3 and Li2CO3
70–73 due to their low melting points
(817°C and 723°C, respectively). Therefore, the densities of compositions containing
high amounts of BLT (x=0.10 and x=0.07) are higher than the other compositions (x=0.05
and x=0.03).
3.1.4. Hysteresis Loop Measurements
The hysteresis loops were measured at different temperatures for each
composition to calculate the ECE based on the indirect method by using Aixacct TF1000
device. Hysteresis loops are shown in Figure 3.4 (a)-(d).
Figure 3.4. (a)-(d) Polarization hysteresis loops of all (1−x)BaTiO3−xBi(Li1/3Ti2/3)O3
ceramics measured at different temperatures.

45
Saturated hysteresis loops were obtained for the samples x=0.03 and 0.05. In the
case of x=0.07, the polarization value shows a faster decrease compared to the other
compositions. It is predicted that this rapid drop can cause an extra peak in the
electrocaloric effect of this composition. Furthermore, it is clear that the hysteresis loops
becomes slimmer as the amount of BLT increases at 30°C. x=0.10 composition exhibits
relaxor ferroelectric hysteresis behavior with low remanent polarization and low coercive
field values.
The coercive field, Ec and remanent polarization, Pr decreased as the temperature
is increased for all compositions as can be seen in Figure 3.4 (a)-(d). This is the behavior
of the general ferroelectric materials. Because as the temperature increases, the sensitivity
of the dipoles to the electric field increases and the material becomes easier to polarize
with a lower electric field, which implies the reduction of the coercive field.74
3.1.5. Electrocaloric Effect Calculations
The temperature-dependent hysteresis behavior was used to calculate the
electrocaloric effect of the ceramic samples indirectly by extracting the polarization
values corresponding to each temperature from the loops.
The polarization versus temperature graphs obtained from the hysteresis loop
measurements are shown in Figure 3.5(a)-(d) for all the compositions under various
electric fields. P(T) data are used to determine the electrocaloric effect indirectly.
Obviously, high polarization values were obtained in all compositions under high electric
field. It is clear that the increasing electric field leads to shifting of the polarization to the
higher temperatures for all compositions. Similar behavior has been reported by other
studies.35,75,76
The electrical polarization decreases with increasing temperature. The orientation
polarization of the permanent dipoles of ferroelectric materials decreases with increasing
temperature due to randomization effect of the temperature. However, the polarization
starts to increase as the temperature increases for x=0.03 composition in Figure 3.5(a)
that brings the negative electrocaloric effect (ECE) as is seen from Figure 3.7(a).
Polarization temperature P(T) curves were fitted with a sixth order polynomial
equation to obtain ∂P/∂T and are shown in Figure 3.6(a)-(d) for only 22 kV/cm. The
degree of polynomial equation was chosen according to best representation of the

46
polarization-temperature curves. The electrocaloric temperature change (ΔT) is
determined by using these curves obtained from the upper branches of the hysteresis loops
for both numerical differentiation (Equation 3.1) and fitting method based on the Maxwell
relations .77
Equation 3.2 represents the adiabatic temperature change formula, where E1 and
E2 are the initial and final applied electric field, respectively. Cp is the specific heat
capacity of material which is accepted as an average value of 0.50 J/g.K based on BaTiO3-
based studies in the literature33,78–80 for all calculations and ρ symbolizes the measured
density of the ceramics.
ΔT-T curves calculated using equation 3.2 (Figure 3.6(a)-(d)) at different electric
fields are shown in Figure 3.7(a)-(d). These calculations are checked by comparing with
the numerical differentiation method (the right part of the Figure 3.7(a)-(d)) for 22 kV/cm.
The two methods are in good agreement with each other which indicates that P-T curve
fits are sensible. Fitting of P-T curve becomes easier as the polarization changes more
slowly with temperature as the amount of BLT increases. The purpose of using both
numerical and fitting methods in calculating the electrocaloric effect is to check the extra
peaks that may arise from the imperfect fitting.
It can be seen from the Figure 3.7(a)-(d), as the electric field increases, ΔT
increases and the ΔT peaks shifts to the higher temperature under the electric field.
The highest electrocaloric response of the material is obtained at the phase
transition temperature. It can be seen in Figure 3.7(a)-(d) that all compositions have a ΔT
peak which does not change with the composition which occurs approximately at the
phase transition temperature (TFE-PE = 123°C) of undoped BaTiO3. However the
amplitude of the ΔT peaks decrease with increasing BLT content. Such peaks which does
not change with composition might have been caused by core-shell microstructure. Core-
shell microstructure was introduced earlier in section 1.5. The core-shell microstructure,
which is proven in the literature55, causes a dielectric anomaly that belongs to the core

47
and this anomaly’s temperature does not change depending on the composition.
Therefore, it is thought that the unchanged ΔT peak in all compositions might belong to
the core. Moreover, an extra peak can be observed in ΔT versus T graphs of x=0.07
composition (Figure 3.7(a)-(c)) and it is thought that it may correspond to the shell
contribution.
Figure 3.5. (a)-(d) Polarization versus temperature graphs of all (1-x)BaTiO3 -
xBi(Li1/3Ti2/3)O3 ceramics measured under different electric fields for
(a)x=0.03, (b)x=0.05, (c)x=0.07, (d)x=0.10.
As mentioned previously, a negative electrocaloric effect resulting from the
increase in polarization in the x=0.03 ceramic, was obtained and is shown in Figure 3.7
(a). There is no physical basis for this effect.
Figure 3.8(a)-(b) shows the electrocaloric temperature change of all ceramics with
respect to the composition obtained from both fitting and numeric differentiaton methods
at 22 kV/cm. The obtained electrocaloric behavior are the same for these two methods
showing the quality of the fits. As the amount of BLT increases, ΔT peak value decreases.
The structural changes in the BaTiO3 with the increasing amount of dopants also changes

48
the phase transition character and the first-order phase transition of BaTiO3 becomes
diffuse phase transition. This means the change of the polarization with temperature
become less sharp around the phase transition temperature. Therefore, the decrease of the
ΔT value with BLT content is expected.
Figure 3.6. (a)-(d) Polarization versus temperature graphs fitted with a 6th order
polynomial of all (1−x)BaTiO3−xBi(Li1/3Ti2/3)O3 ceramics measured at 22
kV/cm for (a) x=0.03, (b) x=0.05, (c) x=0.07, (d) x=0.10.
Core-shell structure which might be responsible from the electrocaloric behavior
may result from slow sintering kinetics. As mentioned before, particle size affect the
sintering kinetics. When the kinetics of diffusion and sintering is not sufficient to
incorporate the dopant atom in the host structure as explained in section 1.5, the core-
shell microstructure is observed. In the literature, the core-shell structure is common in
BT-Bi(X)TiO3 solid solutions56,57 due to the restricted sintering temperature to prevent
the loss of volatile precursor in the solid solution such as Li2CO3 and Bi2O3.

49
Figure 3.7. Temperature dependence of ΔT of all (1-x)BaTiO3-xBi(Li1/3Ti2/3)O3 ceramics
calculated at different electric field for both fitting (left) and numerical (right)
differentiation method for (a)x=0.03, (b)x=0.05, (c)x=0.07, (d)x=0.10.

50
Figure 3.8. Temperature dependence of ΔT of all (1-x)BaTiO3-xBi(Li1/3Ti2/3)O3 ceramics
measured at 22 kV/cm for (a) fitting method and (b) numerical differentiation.
3.1.6. Dielectric Measurements
Dielectric properties of ceramic samples were measured with LCR meter and
shown in Figure 3.9 (a)-(d) with dielectric loss as a function of temperature.
In the literature, there are two anomalies related to core and shell in the dielectric
behaviors of ceramic materials having core-shell structure. While the dielectric anomaly
of the core remains at the same temperature for all the compositions, the anomaly
belonging to the shell is seen at different temperatures depending on the frequency and
composition.55–57,81,82
In Figure 3.9(a)-(c) there is an anomaly in 0.03≤x≤0.07 samples corresponding to
the ferroelectric-paraelectric phase transition around the Curie temperature, Tc. No
secondary anomaly is seen and the frequency dependence is very low in these samples.
Despite the symmetry change in XRD, the unchanging dielectric anomaly at the same
temperature for all compositions shows us that there may be a core structure. However,
in the case of x = 0.10 sample, there is an anomaly at lower temperature in addition to the
anomaly in Tc. The frequency dependence is clearly evident in the general behavior of
this sample. This is due to the fact that, after certain amounts of dopants, the long range
order of ferroelectric materials is distorted, the material becomes a relaxor ferroelectric.3
The fingerprint of the relaxor property is the shift of the dielectric anomaly through the
lower temperature depending on the frequency.6,83 The fact that the dielectric behavior of
x = 0.10 sample is thought to be caused by the relaxor feature and this behavior consistent
with hysteresis loop character of this composition. Moreover, the possible shell formation
may be responsible for the anomaly at lower temperature.

51
Figure 3.9. Temperature dependence of dielectric constant εr and dielectric loss of all
(1−x)BaTiO3− xBi(Li1/3Ti2/3)O3 ceramics at different frequencies.
The dielectric behavior of the samples are different from the Ma et al.55 where the
shell contribution is increasingly seen as the BLT amount increase. This difference is
thought to depend on the synthesis conditions. Depending on the particle size the sintering
kinetics is affected, the amount of more/less BLT diffusing into the core may alter the
core-shell microstructure and thus causes the difference in dielectric behavior.
The peak seen in the dielectric constant at the phase transition temperature of all
samples is also present in the dielectric loss behavior. Two anomalies are also observed
in dielectric loss of x=0.10 composition.
3.1.7. Microstructural Analysis
Microstructure analyzes (TEM studies) were done for the determination of core-
shell structure as mentioned above. x=0.07 sample is used for this analysis and the TEM
micrographs of the sample is shown in Figure 3.10. The general features of the ceramic
sample is illustrated in (a)-(c) and the following figures (d)-(e) are HRTEM micrographs
obtained from Figure 3.10(a) from the red and green square region. Figure 3.10(d) shows

52
the HRTEM micrograph obtained from the red squared area, revealing the presence of a
domain-like defected area continued till the grain boundary. In the middle, detailed
HRTEM micrograph of the indicated region is shown where it the defects are quite clearly
visible. FFT (Fast Fourier Transform) pattern obtained from this micrograph revealed that
this grain is composed of tetragonal BaTiO3 phase with the space group P4mm with lattice
parameters of a= 0.3999 nm and c= 0.4017 nm. It is visualized along its [211] zone axis.
Figure 3.10. (a)-(c) Selection of low magnification TEM micrographs and (d) and (e)
selected area electron diffraction patterns of (1−x)BaTiO3−xBi(Li1/3Ti2/3)O3
for x=0.07.
(a) (b)
(c)
(d)
(e)

53
The green squared area in Figure 3.10(e), reveals similar features as the region
shown in Figure 3.10(d). These domain-like regions contain many defects however all of
the grains are identified as the same tetragonal BaTiO3 phase.
In conclusion, the shell contribution of the dielectric behavior of the x=0.07
ceramic could not be seen clearly.
3.2. Synthesis Route-II
It was aimed to improve the synthesis conditions in order to get rid of the core-
shell structure and to densify the samples. The ball milling was effectively used to
synthesize the samples and ball milling parameters (ball to powder ratios, grinding steps
and milling times) were changed for this purpose. Thus homogeneous and single particle
size (smaller than that obtained from synthesis route-I) was obtained.
3.2.1. XRD Measurements
XRD measurements were carried out after each heat treatment (i.e. calcination
and sintering) of ceramic samples and shown in Figures 3.11 and 3.12, respectively.
Figure 3.11(a)-(b) shows the room temperature XRD patterns performed on
calcined BT-BLT ceramics of different compositions. All samples show pure perovskite
structure. It is clear that peak splitting is not sharp when examined closely (Figure
3.11(b)).
The sintering was done to stabilize the phase after calcination and to obtain a
dense ceramic and Figure 3.12(a) demonstrates the sintered samples’ XRD patterns. All
ceramic samples exhibit pure perovskite structure and no secondary phases were
observed. This is a sign for complete diffusion of all Bi(Li1/3Ti2/3)O3 into the BaTiO3
lattice and solid solution formation. Figure 3.12(b) shows the close examination of the
2θ range between 40°-50° that indicates the strong (002)T/(200)T peak splitting of the
ceramics with x<0.07, consistent with tetragonal symmetry whereas for x=0.08 is
stabilized in the orthorhombic symmetry of the BaTiO3 with (002)O/(200)O peak
splitting.55 The peak positions for the samples 0.03≤x≤0.05 are almost the same. The
amount of BLT content between these three compositions is close to each other and

54
similar peak position in XRD patterns may be due to fact that the difference between the
amount of dopant is too small to cause a significant shifting.
Figure 3.11. XRD patterns of all (1−x)BaTiO3−xBi(Li1/3Ti2/3)O3 calcined samples
between (a) 20° to 80° and (b) 40° to 50°.
Figure 3.12. XRD patterns of all (1−x)BaTiO3−xBi(Li1/3Ti2/3)O3 sintered samples
between (a) 20° to 80° and (b) 40° to 50°.
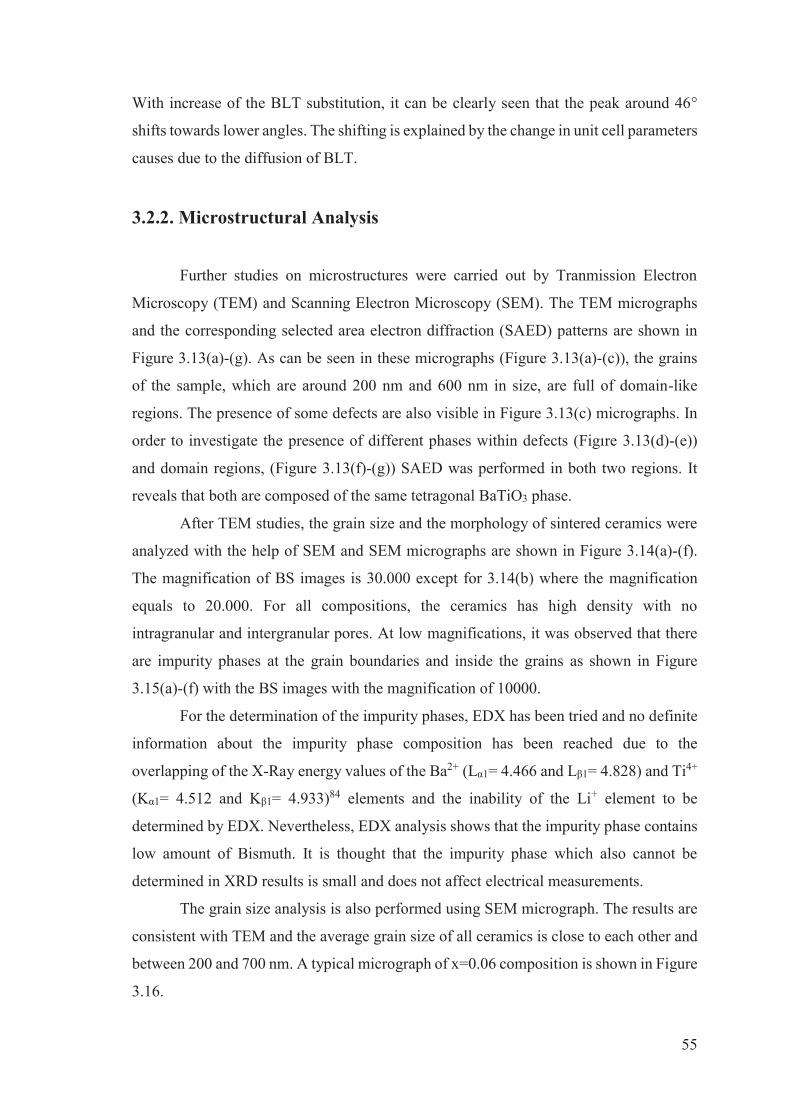
55
With increase of the BLT substitution, it can be clearly seen that the peak around 46°
shifts towards lower angles. The shifting is explained by the change in unit cell parameters
causes due to the diffusion of BLT.
3.2.2. Microstructural Analysis
Further studies on microstructures were carried out by Tranmission Electron
Microscopy (TEM) and Scanning Electron Microscopy (SEM). The TEM micrographs
and the corresponding selected area electron diffraction (SAED) patterns are shown in
Figure 3.13(a)-(g). As can be seen in these micrographs (Figure 3.13(a)-(c)), the grains
of the sample, which are around 200 nm and 600 nm in size, are full of domain-like
regions. The presence of some defects are also visible in Figure 3.13(c) micrographs. In
order to investigate the presence of different phases within defects (Figıre 3.13(d)-(e))
and domain regions, (Figure 3.13(f)-(g)) SAED was performed in both two regions. It
reveals that both are composed of the same tetragonal BaTiO3 phase.
After TEM studies, the grain size and the morphology of sintered ceramics were
analyzed with the help of SEM and SEM micrographs are shown in Figure 3.14(a)-(f).
The magnification of BS images is 30.000 except for 3.14(b) where the magnification
equals to 20.000. For all compositions, the ceramics has high density with no
intragranular and intergranular pores. At low magnifications, it was observed that there
are impurity phases at the grain boundaries and inside the grains as shown in Figure
3.15(a)-(f) with the BS images with the magnification of 10000.
For the determination of the impurity phases, EDX has been tried and no definite
information about the impurity phase composition has been reached due to the
overlapping of the X-Ray energy values of the Ba2+ (Lα1= 4.466 and Lβ1= 4.828) and Ti4+
(Kα1= 4.512 and Kβ1= 4.933)84 elements and the inability of the Li+ element to be
determined by EDX. Nevertheless, EDX analysis shows that the impurity phase contains
low amount of Bismuth. It is thought that the impurity phase which also cannot be
determined in XRD results is small and does not affect electrical measurements.
The grain size analysis is also performed using SEM micrograph. The results are
consistent with TEM and the average grain size of all ceramics is close to each other and
between 200 and 700 nm. A typical micrograph of x=0.06 composition is shown in Figure
3.16.

56
Figure 3.13. (a)-(d) and (f) Selection of high magnification TEM micrographs and (e) and
(g) selected area electron diffraction patterns of (1−x)BaTiO3−
xBi(Li1/3Ti2/3)O3 for x=0.05.
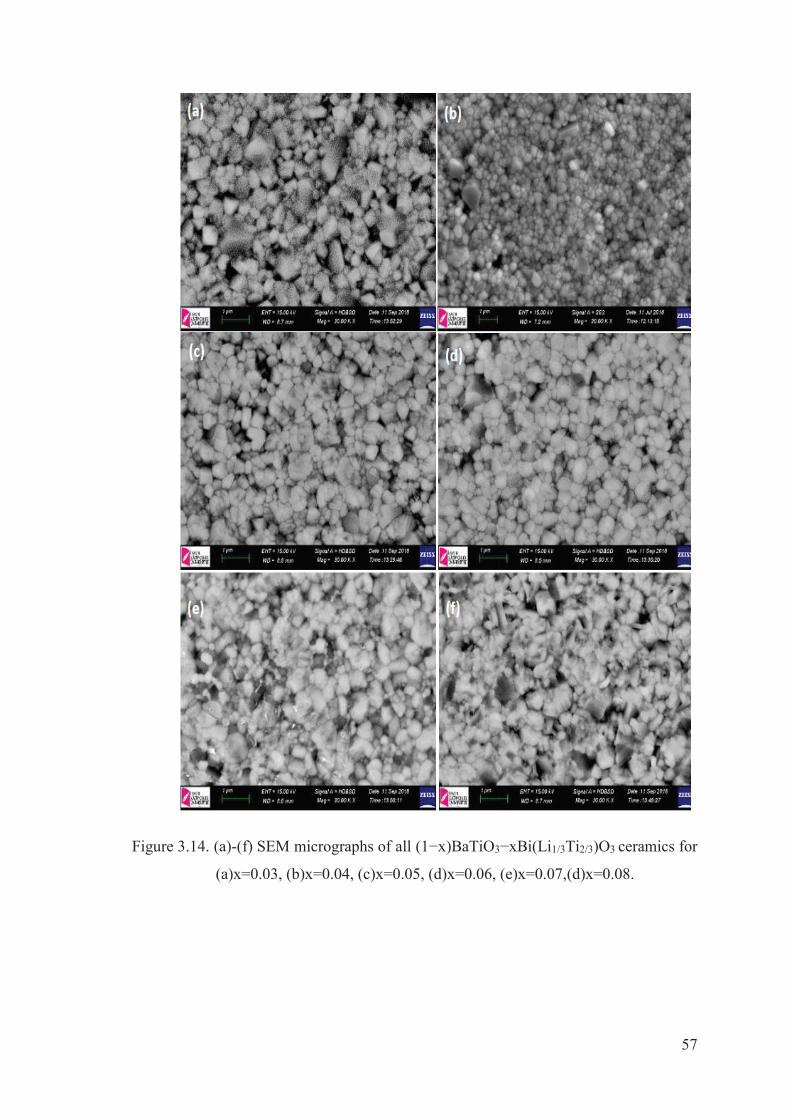
57
Figure 3.14. (a)-(f) SEM micrographs of all (1−x)BaTiO3−xBi(Li1/3Ti2/3)O3 ceramics for
(a)x=0.03, (b)x=0.04, (c)x=0.05, (d)x=0.06, (e)x=0.07,(d)x=0.08.
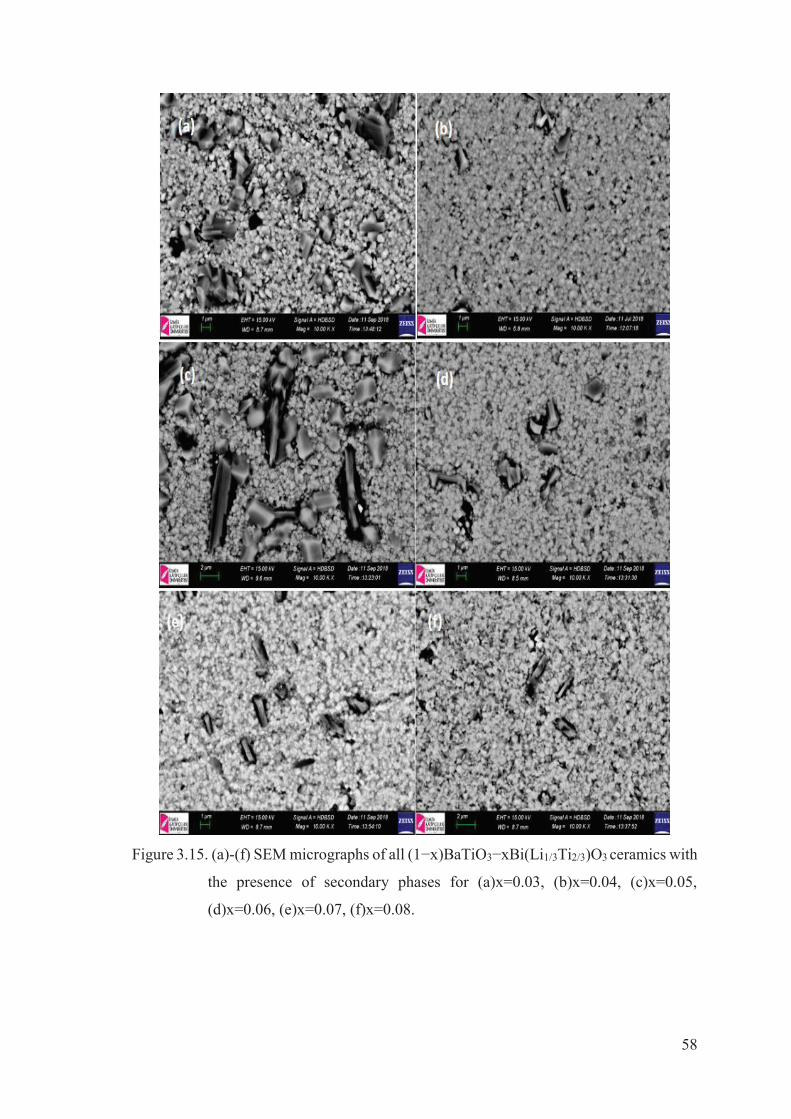
58
Figure 3.15. (a)-(f) SEM micrographs of all (1−x)BaTiO3−xBi(Li1/3Ti2/3)O3 ceramics with
the presence of secondary phases for (a)x=0.03, (b)x=0.04, (c)x=0.05,
(d)x=0.06, (e)x=0.07, (f)x=0.08.

59
Figure 3.16. SEM image of (1−x)BaTiO3− xBi(Li1/3Ti2/3)O3 (x=0.06).
3.2.3. Density Measurements and Particle Size Analysis
After the microstructural analysis, density of sintered ceramic samples are
determined by using Archimedes’ method and the values are shown in Table 3.2.
Table 3.2. Density of sintered samples measured by Archimedes' method.
x=0.08 x=0.07 x=0.06 x=0.05 x=0.04 x=0.03 5.71 g/cm3 5.73 g/cm3 5.66 g/cm3 5.63 g/cm3 5.65 g/cm3 5.65 g/cm3
(1200°C) (1200°C) (1225°C) (1225°C) (1250°C) (1250°C)
The density values given in Table 3.2 are higher than 93% of the theoretical
density calculated using BaTiO3 with tetragonal symmetry (space group P4mm)
(reference number 01-079-2265). Although ceramic materials were sintered at similar
temperatures compared to materials synthesized following synthesis route-I, high density
ceramics were obtained due to lower particle sizes obtained in route-II. The lower particle
size is the result of modified ball milling conditions. Due to the low particle size, there
will be less Bi3+ and Li+ evaporation as there is no need to increase the sintering
temperature to densify the samples.
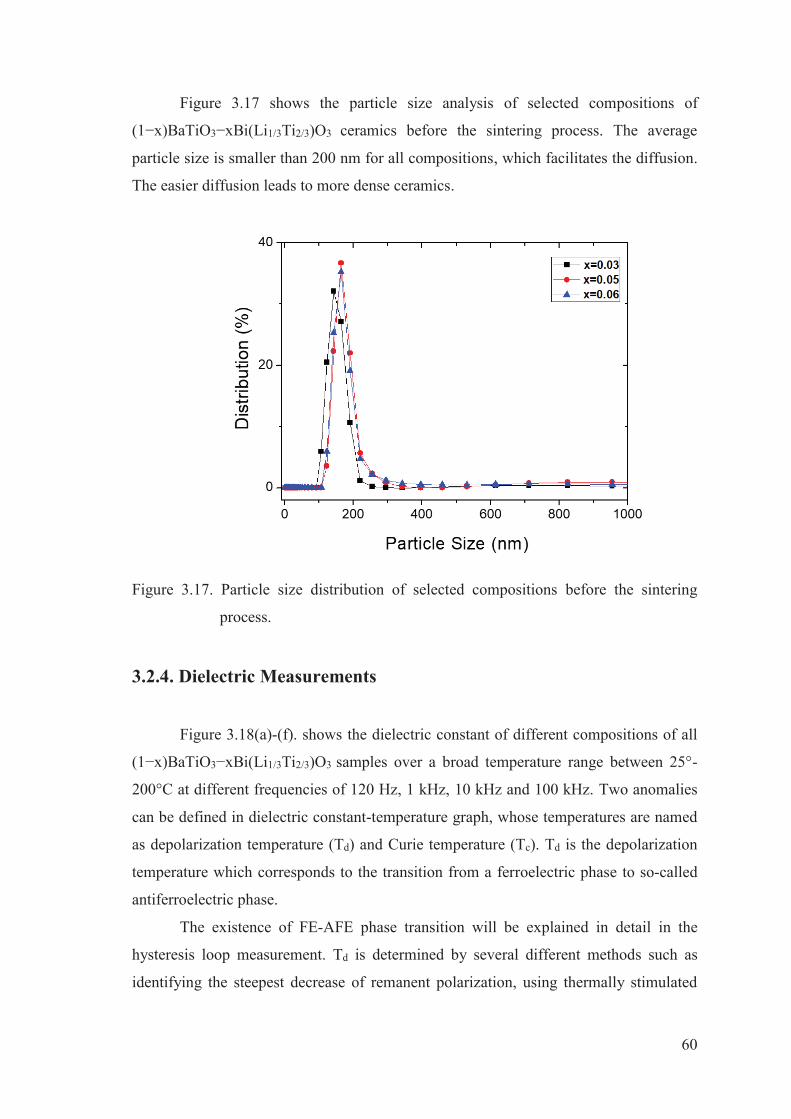
60
Figure 3.17 shows the particle size analysis of selected compositions of
(1−x)BaTiO3−xBi(Li1/3Ti2/3)O3 ceramics before the sintering process. The average
particle size is smaller than 200 nm for all compositions, which facilitates the diffusion.
The easier diffusion leads to more dense ceramics.
Figure 3.17. Particle size distribution of selected compositions before the sintering
process.
3.2.4. Dielectric Measurements
Figure 3.18(a)-(f). shows the dielectric constant of different compositions of all
(1−x)BaTiO3−xBi(Li1/3Ti2/3)O3 samples over a broad temperature range between 25°-
200°C at different frequencies of 120 Hz, 1 kHz, 10 kHz and 100 kHz. Two anomalies
can be defined in dielectric constant-temperature graph, whose temperatures are named
as depolarization temperature (Td) and Curie temperature (Tc). Td is the depolarization
temperature which corresponds to the transition from a ferroelectric phase to so-called
antiferroelectric phase.
The existence of FE-AFE phase transition will be explained in detail in the
hysteresis loop measurement. Td is determined by several different methods such as
identifying the steepest decrease of remanent polarization, using thermally stimulated

61
depolarization current (TDSC), from dielectric constant versus temperature (Ɛr-T) graph,
and dielectric loss versus temperature (tanδ-T) behavior.85
In this study, the depolarization temperature (Td) of different ceramics are
determined with the help of dielectric constant versus temperature graph (Under each
graph in Figure 3.18 (a)-(f), 1/εr versus temperature graphs are shown.) from the first
anomaly.86,87 Tc is defined as the temperature where the inverse dielectric constant
deviates from the linear behavior in 1/εr-T curves. Furthermore, the determined
temperatures were also controlled by comparing with the temperatures at which the
steepest decrease of remanent polarization occurs, as will be shown later.
Figure 3.18 (a)-(f) clearly shows that as the BLT ratio increases, Td approaches
the room temperature. Since the second anomaly that corresponds to the TC remains
almost the same for all compositions, the dielectric plateau is observed in a wide
temperature range for the 0.03≤x≤0.07 samples. In the case of x=0.08 sample, it is clear
that Td is observed at a temperature lower than the room temperature. Therefore, only the
Curie temperature was determined in this composition.
For all ceramic samples, an increase in frequency dependence of dielectric
behavior was observed between the Td and TC temperature range. Td is responsible for the
major peak of all ceramics where the frequency dependence of dielectric constant is
higher than that of the TC. This behavior is similar with (Bi1/2Na1/2)TiO3.48
The ceramic samples exhibit relaxor ferroelectric behavior with increasing
amount of BLT content due to the deteriorated long range ferroelectric domain order and
the frequency dependence of the dielectric constant increases with increasing amount of
BLT.
The change in dielectric constant and dielectric loss with respect to the
composition of ceramics are illustrated in Figure 3.19(a)-(b) respectively. As mentioned
above, the first anomaly in dielectric constant shifts to lower temperatures with increasing
BLT content whereas the temperature of the second anomaly does not change much.
Dielectric loss of ceramics behaves similar to the dielectric constant. Dielectric
loss peak corresponding to the Td shifts to lower temperatures with increasing BLT
content whereas no anomaly corresponding to the Tc can be observed. At temperatures
higher than 130°C, an artificial increase is observed in dielectric loss of all ceramics due
to the increasing conductivity of samples.

62

63
Figure 3.18. (a)-(f) Temperature dependence of dielectric constant Ɛr of all (1−x)BaTiO3−
xBi(Li1/3Ti2/3)O3 ceramics at different frequencies. Under each graph in
(a)-(f) 1/Ɛr versus temperature graphs are shown.
Figure 3.19. Temperature dependence of (a) dielectric constant and (b) tanδ of all
(1−x)BaTiO3−xBi(Li1/3Ti2/3)O3 ceramics at 1 kHz.
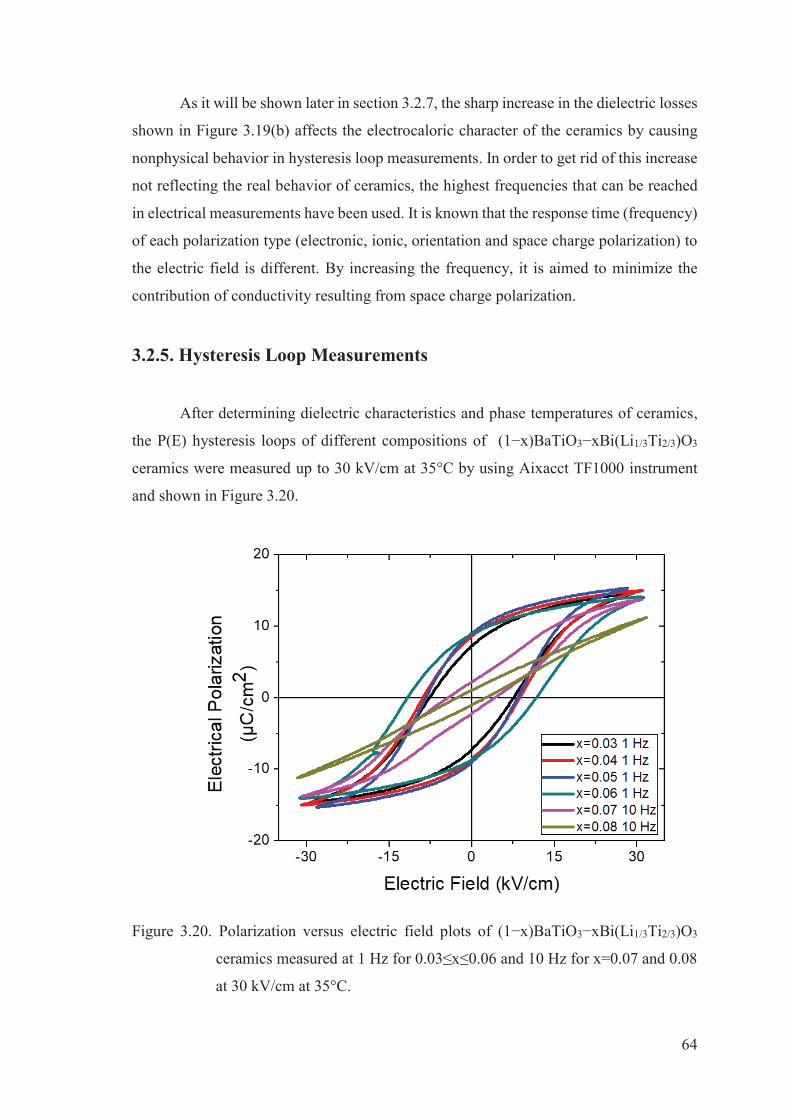
64
As it will be shown later in section 3.2.7, the sharp increase in the dielectric losses
shown in Figure 3.19(b) affects the electrocaloric character of the ceramics by causing
nonphysical behavior in hysteresis loop measurements. In order to get rid of this increase
not reflecting the real behavior of ceramics, the highest frequencies that can be reached
in electrical measurements have been used. It is known that the response time (frequency)
of each polarization type (electronic, ionic, orientation and space charge polarization) to
the electric field is different. By increasing the frequency, it is aimed to minimize the
contribution of conductivity resulting from space charge polarization.
3.2.5. Hysteresis Loop Measurements
After determining dielectric characteristics and phase temperatures of ceramics,
the P(E) hysteresis loops of different compositions of (1−x)BaTiO3−xBi(Li1/3Ti2/3)O3
ceramics were measured up to 30 kV/cm at 35°C by using Aixacct TF1000 instrument
and shown in Figure 3.20.
Figure 3.20. Polarization versus electric field plots of (1−x)BaTiO3−xBi(Li1/3Ti2/3)O3
ceramics measured at 1 Hz for 0.03≤x≤0.06 and 10 Hz for x=0.07 and 0.08
at 30 kV/cm at 35°C.

65
The measurement frequencies vary depending on the samples. In order to
eliminate the conductivity contribution, the measurement frequency is increased in some
samples.
For all compositions except x=0.07 and 0.08, at room temperature, the loops are
saturated which is the typical behavior of ferroelectric materials based on the domain
switching of long range ferroelectric order.88 As displayed in Figure 3.20, the coercive
field Ec and remanent polarization Pr sre nearly the same for 0.03≤x≤0.06 and Pr reaches
the maximum value of 9.03 μC/cm2 for x=0.05. However, further increase in
Bi(Li1/3Ti2/3)O3 content leads to sharp decrease in both remanent polarization and coercive
field due to the increasing B-site disorder and relaxor character as evidenced by the slim
loop of x=0.08.
The Ec and Pr values of all compositions at 35°C are summarized in Table 3.3. By
making a comparison with the previous BT-BLT study55 it can be concluded that a similar
trend with composition is observed in our study at 35°C. Howeve, unlike the previous
study, x=0.07 sample exhibits a pinched hysteresis loop at room temperature.
Table 3.3. Coercive field and remanent polarization values of all (1−x)BaTiO3−
xBi(Li1/3Ti2/3)O3 ceramics.
Composition x=0.08 x=0.07 x=0.06 x=0.05 x=0.04 x=0.03 Ec (kV/cm) 2.64 4.22 11.65 8.29 8.73 7.46
Pr ( C/cm2) 1.07 2.22 8.9 9.03 8.6 7.21
The P(E) hysteresis loops of different compositions of BT-BLT ceramics at
different temperatures are shown in Figure 3.21 (a)-(f). The temperature dependent
hysteresis curves for 0.03≤x≤0.07 clearly show that the temperature at which the pinched
loop was observed approaches the room temperature with increasing amount of BLT. For
x=0.08 sample, relaxor behavior was observed at all given temperatures with low Ec and
Pr.
Current density-electric field (J-E) graphs are plotted in order to better understand
the character of the hysteresis loops and ferroelectric-antiferroelectric phase transition
and are shown in Figure 3.22(a)-(f).
J-E graphs show that at a certain temperature (called as TFE-AFE which corresponds
to Td defined from dielectric measurements) depending on the composition, the current

66
density behavior changes. For compositions 0.03≤x≤0.06 at low temperatures, two peaks
corresponding to switching of domains can be observed. This is the proof of long-range
ferroelectric order. When Td ≤ T ≤ Tc two additional peaks (Figure 3.22(b)-(e)) were
observed. For example, for x=0.05 sample at 32°C only two peaks are observed
corresponding to the saturated hysteresis loop whereas at 85°C two more peaks can be
seen and the hysteresis loop at this temperature becomes pinched. The current peaks of 1
and 3 can be attributed to the transition from antiferroelectric phase to ferroelectric phase
that induced by application of electric field. The current peaks 2 and 4 indicate the reverse
transition. Four current peaks were also found in NBT-BT-based systems.89–91
Observation of four peaks in J-E graphs indicates that there is a reversible structure
change between weakly polar phase or antiferroelectric phase to ferroelectric phase.92
Above Tc, J-E loops do not show any peak and the loops become linear. At 30°C, x=0.07
sample already shows 4 peaks corresponding to its pinched hysteresis loop. On the other
hand, x=0.08 sample does not show any clear peaks in the J-E curves as the material
becomes relaxor which shows a slim hysteresis loop.
Rise in the content of Bi(Li1/3Ti2/3)O3 in BT-BLT ceramics lead to destabilize
ferroelectric phase and ‘’pinched’’ loops appear93 suggesting the coexistence of FE and
AFE-like behavior.86 The destabilization of ferroelectric phase might be due to the
decrease of the tolerance factor (t).94 The Goldschmidt tolerance factor for an ABO3
perovskite structure is calculated by using Equation 1.2, where rA, rB and rO are the ionic
radii of A, B-site ions and oxygen ions, respectively.95
It was reported that decreasing tolerance factor change polar order that is tuned
into antipolar order. This phenomena is observed in doped NaNbO396 and doped
BiFeO397–99. The same condition might be present here due to size difference between B-
site ions.
Destabilization of the ferroelectric phase can be correlated with the tolerance
factor as well as the character of the bond. Figure 3.23 shows the electronegativity
difference (x) vs tolerance factor of BT-BLT ceramics. Electronegativity difference is
calculated by using the following equation100 where xAO is the electronegativity difference
between oxygen and A site ion and xBO is the difference between oxygen and B site ion.

67
Figure 3.21. (a)-(f) Polarization hysteresis loops of all (1−x)BaTiO3− xBi(Li1/3Ti2/3)O3
ceramics measured at different temperatures.

68
Figure 3.22. Current-electric field (J-E) curves of all (1−x)BaTiO3− xBi(Li1/3Ti2/3)O3
ceramics measured at different tempeatures at 10 Hz.

69
Figure 3.23. Electronegativity difference vs tolerance factor plot of all (1−x)BaTiO3−
xBi(Li1/3Ti2/3)O3 ceramics.
Adding Bi(Li1/3Ti2/3)O3 decreases the tolerance factor and the ionic character of
the bonds. Increase in the covalency of the bonds lead to less stable perovskite structure
resulting in destabilization of the perovskite structure.96
3.2.6. Strain-Electric Field Measurements
Strain-electric field (S-E) measurements were done by using a MTI 2100 Photonic
Sensor that is integrated to the Radiant Precision LC ferroelectric property measurement
system to differentiate between the antiferroelectric and ferroelectric character of the
ceramics. Strain-electric field loops are measured simultaneously with the polarization-
electric field loops. Figure 3.24(c) illustrates the room temperature S-E curves of
(1−x)BaTiO3−xBi(Li1/3Ti2/3)O3 for x=0.07 and x=0.03, the samples which display
ferroelectric and antiferroelectric behavior in P-E loops, respectively. x=0.03 ceramic
sample shows the typical butterfly-shaped strain curve and negative strain, which is the
difference between zero-field strain and lowest strain. Negative strain and butterfly shape
are consistent with the ferroelectric behavior.101 In contrast, for x=0.07 the butterfly-
shaped loop transforms into sprout-shaped S-E loop and the negative strain that originates
from the long-range order disappears,102 consistent with antiferroelectric character.

70
Figure 3.24. (a) Electrical polarization versus electric field (b) current density versus
electric field and (c)Bipolar S(E) curves of (1−x)BaTiO3−xBi(Li1/3Ti2/3)O3
(x=0.03 and x=0.07) measured at room temperature.

71
This result is in good agreement with the behavior observed in polarization
hysteresis loops. The same phenomena is also observed in NBT-BT-KNN101, NBT-
BKT88, NBT-BT86, BMT-PT-NBT91 and BMT-NBT-BT49 ceramics. Table 3.4
summarizes the normalized strain values obtained in this study and provides a comparison
with some NBT-based ceramics.
As can be seen from the table, the value obtained for AFE x=0.07 is larger than
that of x=0.03 which is expected during the field induced AFE-FE transition large strain
values are obtained.101 The values obtained in this study are lower than literature values.
This can be due to lower dielectric breakdown strength of our samples which prevented
us to measure above 55 kV/cm.
Table 3.4. Comparison of normalized strain d33* (Smax/Emax) of various NBT-based
ceramics.
Composition d33* Ref. (1-x)BNKT-xBNbT (x=0.03) 683 103 (1-x)BNKT-xBNbT (x=0.01) 317 103
BNT-BT 240 69 0.03NBT-0.05BT-0.02KNN 276 101 0.02NBT-0.06BT-0.02KNN 567 101
PMN-PT 560-710 69 x=0.03 163.6 This study x=0.07 229.4 This study
3.2.7. Temperature Dependent X-Ray Diffraction
Temperature-dependent XRD measurements were performed to prove the FE-
AFE phase transition and to determine the phase transition temperature by Dr. Gwilherm
Nénert at PanAnalytical the Netherlands.
Figure 3.25 shows the change in unit cell parameters as a function of temperature
obtained from profile fits (done by Dr. Nénert) of the temperature-dependent XRD
measurements for x = 0.05 sample. The unit cell parameters change at the anomaly
temperature corresponding to the FE-AFE phase transition in the dielectric constant
measurements.
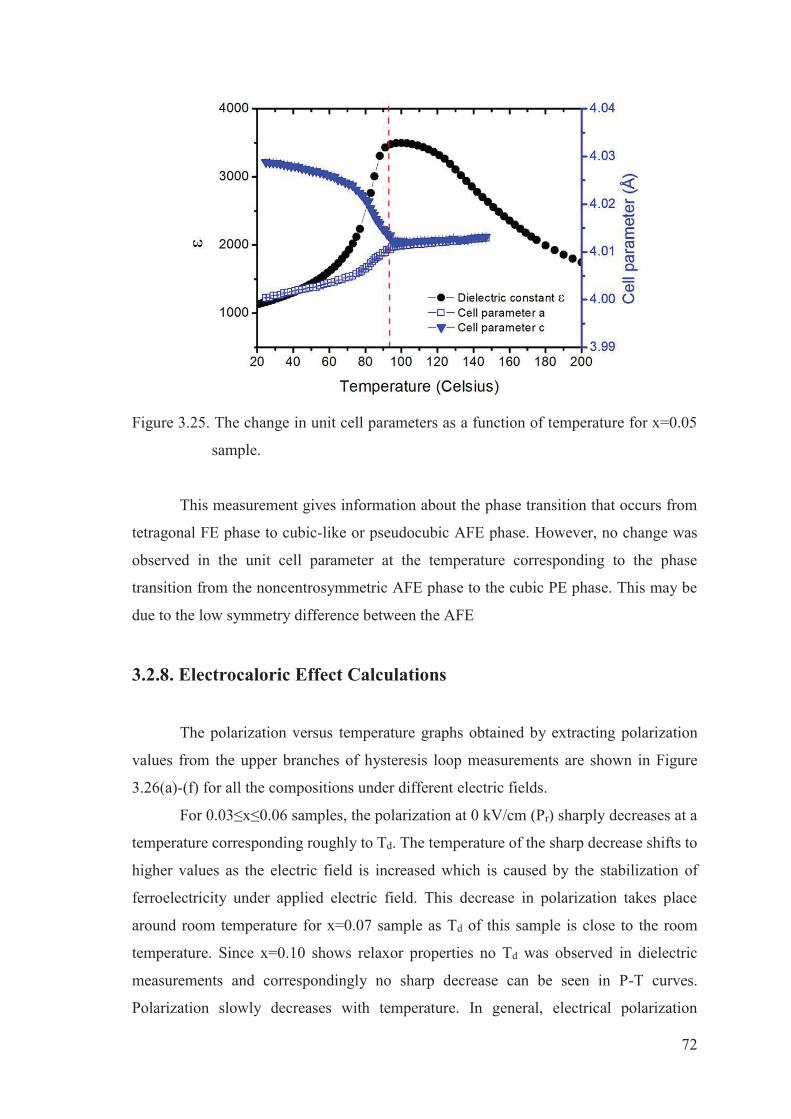
72
Figure 3.25. The change in unit cell parameters as a function of temperature for x=0.05
sample.
This measurement gives information about the phase transition that occurs from
tetragonal FE phase to cubic-like or pseudocubic AFE phase. However, no change was
observed in the unit cell parameter at the temperature corresponding to the phase
transition from the noncentrosymmetric AFE phase to the cubic PE phase. This may be
due to the low symmetry difference between the AFE
3.2.8. Electrocaloric Effect Calculations
The polarization versus temperature graphs obtained by extracting polarization
values from the upper branches of hysteresis loop measurements are shown in Figure
3.26(a)-(f) for all the compositions under different electric fields.
For 0.03≤x≤0.06 samples, the polarization at 0 kV/cm (Pr) sharply decreases at a
temperature corresponding roughly to Td. The temperature of the sharp decrease shifts to
higher values as the electric field is increased which is caused by the stabilization of
ferroelectricity under applied electric field. This decrease in polarization takes place
around room temperature for x=0.07 sample as Td of this sample is close to the room
temperature. Since x=0.10 shows relaxor properties no Td was observed in dielectric
measurements and correspondingly no sharp decrease can be seen in P-T curves.
Polarization slowly decreases with temperature. In general, electrical polarization

73
decreases with increasing temperature for a ferroelectric material. Only a transition from
antiferroelectric phase to a ferroelectric phase might cause an increase in polarization. In
all other circumstances the increase in the polarization is artificial and is caused by
conductivity contributions in not perfectly insulating materials. In this regard, for
example, the polarization increase above 125°C for x=0.05 sample is considered to be
artificial.
Figure 3.26. (a)-(f) Polarization-electric field graphs of all (1-x)BaTiO3-xBi(Li1/3Ti2/3)O3
ceramics measured at given frequencies for (a) x=0.03, (b) x=0.04,
(c) x=0.05, (d) x=0.06, (e) x=0.07 and (f) x=0.08.

74
Equations 3.2 and 3.3 based on the Maxwell relation (∂P/∂T)E=(∂S/∂E)T were
used to determine the adiabatic temperature change ΔT and isothermal entropy change
ΔS due to the applied electric field change from E1 to E2, for the material with measured
density ρ as in Table 3.2 and assumed heat capacity Cp (Cp= 0.50 J/g.K) based on BaTiO3-
based compositions in the literature.33,78–80
The calculated temperature dependence of ΔT and ΔS at 22 kV/cm are presented
in Figures 3.27(a) and 27(b), respectively. The samples show peaks in the EC responses
around the phase transition temperatures from the ferroelectric phase to the
antiferroelectric phase (TFE-AFE). As mentioned before, TFE-AFE transition temperature (Td)
decreases down to the room temperature as the BLT content increases. Thus, ΔTmax peak
shifts from 125°C to 60°C upon increasing the BLT content.
Figure 3.27. Temperature dependence of ΔT and ΔS of all (1−x)BaTiO3−xBi(Li1/3Ti2/3)O3
ceramics at 22 kV/cm.
No electrocaloric temperature change was obtained corresponding to the second
phase transition (TAFE-PE). It is thought that the absence of the electrocaloric temperature

75
change peak at the temperature around TAFE-PE is due to low symmetry difference between
nonpolar cubic-like AFE and cubic PE phases.
Table 3.5. Comparison of the ECE properties for different materials.
Material T
(K) ΔT (K)
ΔE (kV/cm)
ΔT/ΔE (10-6
K.m/V) Ref. NBT-ST (x=0.25) 333 1.64 50 0.33 39 NBT-ST (x=0.26) 323 1.52 50 0.3 39 BaTi0.895Sn0.105O3 301 0.61 20 0.31 32
KNN-ST 340 1.9 159 0.12 40 Ba0.65Sr0.35TiO3 303 2.1 90 0.23 104
0.94Bi0.5Na0.5TiO3-0.06KNbO3 349 1.73 70 0.24 41 0.87Pb(Mg1/3Nb2/3)O3–0.13PbTiO3 343 0.556 24 0.23 27
Na0.5Bi0.5TiO3–BaTiO3 298 -0.12 50 0.024 105 Ba0.8Ca0.2(Zr0.04Ti0.96)O3 389 0.27 7,95 0.34 35
NBBST0.10 383 0.22 40 0.18 38
x=0.03 398 0.66 22 0.3 Present study
x=0.04 383 0.61 22 0.28 Present study
x=0.05 373 0.59 22 0.27 Present study
x=0.06 353 0.52 22 0.24 Present study
x=0.07 323 0.38 22 0.17 Present study
x=0.08 298 0.23 22 0.10 Present study
According to the ECE parameters listed in Table 3.5, x=0.03 sample showed a
maximum ECE ΔTmax=0.66 K under 22 kV/cm. This composition has a electrocaloric
efficiency or electrocaloric strength (ΔT/ΔE) of 0.03 K.cm/kV which is relatively high
compared with the literature. The EC temperature change values of x =0.04 and 0.05
samples were very close to each other and found as 0.28 and 0.27 K ,respectively. The
increase in BLT amount lowers the ΔT value down to 0.10 K for x=0.08 sample. As the
amount of BLT increases, the first order phase transition character of BT is distorted and
the sharpness of the change in polarization as a function of temperature decreases. Thus,
the decrease in the ∂P/∂T causes the decrease in ΔT value. As can be seen in Figure

76
3.27(b) the entropy change follows the same trend with electrocaloric temperature
change.
After phase transition temperatures TFE-AFE and TAFE-PE are determined by the
dielectric measurements that are confirmed by other electrical measurements, the phase
diagram is obtained and given in Figure 3.28. As mentioned in dielectric measurements
part, there are several methods for determining the temperature of depolarization. The
two can be used for this thesis are the point of the steepest decrease of remanent
polarization and the first anomaly in the dielectric constant versus temperature graphs.
The blue dots represent the phase transition temperature from FE to AFE phase (TFE-AFE)
determined by the steepest decrease of Pr and the red circle shows the same temperature
determined using dielectric constant versus temperature graphs. The green triangle shows
the AFE-PE transition temperatures (TAFE-PE) of the samples determined from Ɛr-1-T.
As seen in Figure 3.28, there is a small difference between two different methods.
As the BLT content (x) increases, the ferroelectric-antiferroelectric phase transition
temperature (TFE-AFE) decreases while the antiferroelectric-paraelectric phase transition
temperature (TAFE-PE) almost same for all compositions. The obtained phase diagram is
similar to the unpoled (1-x)(Bi1/2Na1/2)TiO3-xBaTiO3 material.48
Figure 3.28. Phase diagram of the (1−x)BaTiO3−xBi(Li1/3Ti2/3)O3 ceramics.

77
In summary, comparing the results of synthesis route-I and route-II shows the
importance of processing-structure-property relationship. Sintering temperatures of the
ceramics were kept low in both synthesis routes in order to prevent the evaporation of
Bi3+ and Li+. In the synthesis route-I, the formation of the core-shell structure was
facilitated by inhomogeneous particle size distribution and all compositions exhibit a
peak in ΔT curve the temperature of which does not change with respect to the
composition. This peak corresponds to the core contribution. However, no shell
contribution was observed except for x=0.07. The same behavior confirmed by dielectric
measurements. Since the core-shell structure was thought to suppress the MBP effect,
sytnhesis route-II was followed in order to get rid of the core-shell structure. Milling
process is used more effectively in route-II and high density materials are obtained thanks
to the lower particle size obtained after calcination. In route-II, the electrical properties
of the ceramics completely changed and AFE property was observed in all samples. In
comparision with the other BT-BLT study in the literature,106 different dielectric behavior
is observed.

78
CHAPTER 4
CONCLUSIONS
This thesis includes studies on one of the alternative cooling technologies named
as "electrocaloric effect (ECE)".
The electrocaloric effect of the promising Bismuth-based system, (1−x)BaTiO3−
xBi(Li1/3Ti2/3)O3 was investigated with different synthesis conditions.
4.1. Synthesis Route-I
In the first part of this thesis study, the ECE of ceramics synthesized with synthesis
conditions similar to the literature was studied. In the literature how core-shell
microstructure affects the electrocaloric behavior has not been studied. For this reason,
the effect of the core-shell structure on ECE was studied.
ΔT graphs of all compositions exhibit a peak around the Curie temperature of
BaTiO3 that does not change with composition even if the symmetry changes are observed
in XRD measurements. This peak is attributed to the core. Same behavior was also
observed in the dielectric constant of all compositions. In contrast, a contribution of shell
structure could not be observed. Depending on the synthesis conditions, it is thought that
the core-shell structure and the size of the core and shell may change with the amount of
BLT diffusing into the core structure. Therefore, the shell contribution differs from the
literature.
Maximum electrocaloric temperature change was obtained as 0.532 K at 22
kV/cm electric field in x=0.03 sample. The ΔT values decreased with increasing BLT(x).
As the amount of dopant increases, B-site disorder increase and the polarization changes
less abruptly at the Curie temperature therefore ΔT value decreases.
4.2. Synthesis Route-II
The aim of the second part was to get rid of the core-shell structure and to obtain
highly dense ceramics by changing the synthesis conditions of ceramic materials.

79
Therefore, particle sizes were reduced by using the ball mill more effectively and highly
dense ceramics were obtained with density values greater than 93% of the theoretical
density.
Two anomalies can be defined in dielectric constant-temperature graph, which are
named as depolarization temperature (Td) and Curie temperature (Tc). Td is the
depolarization temperature which corresponds to the transition from a ferroelectric phase
to the antiferroelectric phase. The samples show peaks in the EC responses around the
phase transition temperatures from the ferroelectric phase to the antiferroelectric phase
(TFE-AFE). TFE-AFE transition temperature (Td) decreases down to the room temperature as
the BLT content increases. Thus, ΔTmax peak shifts towards the room temperature upon
increasing the BLT content. No electrocaloric temperature change was obtained
corresponding to the second phase transition (TAFE-PE). It is thought that the absence of
the electrocaloric temperature change peak at the temperature around TAFE-PE is due to
low symmetry difference between nonpolar or cubic-like AFE and cubic PE phases.
ΔT was calculated by using Maxwell relations and P-T curves obtained from
hysteresis loop measurements. x=0.03 ceramic sample showed a maximum ECE
ΔTmax=0.66 K under 22 kV/cm. This composition has an electrocaloric efficiency or
electrocaloric strength (ΔT/ΔE) of 0.03 K.cm/kV which is relatively high compared with
the literature. The EC temperature change values of x =0.04 and 0.05 samples were very
close to each other and found as 0.28 and 0.27 K ,respectively. The increase in BLT
amount lowers the ΔT value down to 0.10 K for x=0.08 sample.
In conclusion, in this thesis, it was discovered that BLT substitution induces AFE
behavior in (1−x)BaTiO3−xBi(Li1/3Ti2/3)O3 ceramics. FE-AFE phase transition observed
in samples causes a relatively large ECE. Obtained ECE values are comparable with other
prominent Pb-free systems. (1−x)BaTiO3−xBi(Li1/3Ti2/3)O3 therefore can be considered
as a promising system for EC cooling.
80
REFERENCES
(1) Neudeck, P. G.; Trunek, A. J.; Spry, D. J.; Powell, J. A.; Du, H.; Skowronski, M.; Huang, X. R.; Dudley, M. Ferroelectric Materials. Chem. Vap. Depos. 2006, 12 (8–9), 531–540.
(2) Callister, W.; Rethwisch, D. Materials Science: An Introduction., 9th ed. 2013,
990. (3) Setter, N. What Is a Ferroelectric-a Materials Designer Perspective.
Ferroelectrics 2016, 500 (1), 164–182. (4) Damjanovic, D. Hysteresis in Piezoelectric and Ferroelectric Materials. 2006, pp
337-462. (5) Wang, C.-M.; Lau, K.; Wang, Q. Dynamic Hysteresis and Scaling Behaviours of
Lead-Free 0.94Bi0.5Na0.5TiO3–0.06BaTiO3 Bulk Ceramics. RSC Adv. 2016, 6 (36), 30148–30153.
(6) Luisman, L.; Feteira, A.; Reichmann, K. Weak-Relaxor Behaviour in Bi/Yb-
Doped KNbO3 Ceramics. Appl. Phys. Lett. 2011, 99 (19), 1–4. (7) Milton, F. P.; Londono, F. A.; Botero, E. R.; Eiras, J. A.; Garcia, D. Thermal
Behavior of Electrically Induced Birefringence of La-Doped PMN-PT Ceramics. Integr. Ferroelectr. 2015, 166 (1), 180–185.
(8) Delgado, M. Phase Transitions in Relaxor Ferroelectrics. 2005, pp 1–11. (9) Handbook of Condensed Matter and Materials Data. Martiessen, W.; Warlimont,
H. Ed.; section 4.5 Ferroelectrics and Antiferroelectrics, pp 903-915. (10) Rabe, K. M. Antiferroelectricity in Oxides: A Reexamination. Funct. Met. Oxides
New Sci. Nov. Appl. 2013, 221–244. (11) Hao, X.; Zhai, J.; Kong, L. B.; Xu, Z. A Comprehensive Review on the Progress
of Lead Zirconate-Based Antiferroelectric Materials. Prog. Mater. Sci. 2014, 63, 1–57.
(12) Goupil, F. Le. Electrocaloric Effect in Ferroelectric Relaxors : The Road to Solid-
State Cooling. 2013. (13) Valant, M. Progress in Materials Science Electrocaloric Materials for Future
Solid-State Refrigeration Technologies. Prog. Mater. Sci. 2012, 57 (6), 980–1009.
(14) Kutnjak, Z.; Rozic, B.; Pirc, R. Effect, Electrocaloric Effect: Theory,
Measurements and Applications Electrocaloric Effect in Brief: General

81
Introduction. 2015, pp 1-19. (15) Kitanovski, A.; Tu, J.; Poredo, A. Electrocaloric Refrigeration :
Thermodynamics,State of the Art and Future Perspectives. Int. J. Refr. 2013, (40), 174-188.
(16) Ma, R.; Zhang, Z.; Tong, K.; Huber, D.; Kornbluh, R.; Ju, Y. S.; Pei, Q. Highly
Efficient Electrocaloric Cooling with Electrostatic Actuation. Science. 2017, 357 (6356), 1130–1134.
(17) Mischenko, A. S.; Zhang, Q.; Scott, J. F.; Whatmore, R. W.; Mathur, N. D. Giant
Electrocaloric Effect in PZT. Science. 2006, 104 (1), 9–13. (18) Valant, M.; Dunne, L. J.; Axelsson, A. K.; Alford, N. M. N.; Manos, G.; Peräntie,
J.; Hagberg, J.; Jantunen, H.; Dabkowski, A. Electrocaloric Effect in a Ferroelectric Pb(Zn1/3Nb2/3)O3-PbTiO3 Single Crystal. Phys. Rev. B - Condens. Matter Mater. Phys. 2010, 81 (21), 18–22.
(19) Zhang, R.; Wang, Y.; Zhang, W. Preparation and Characterization of (1-
x)Pb(Mg1/3Nb2/3)O3-xPbTiO3 Electrocaloric Ceramics. Cryst. Res. Technol. 1998, 33 (5), 827-832.
(20) Luo, L.; Chen, H.; Zhu, Y.; Li, W.; Luo, H.; Zhang, Y. Pyroelectric and
Electrocaloric Effect of 111 -Oriented 0.9PMN-0.1PT Single Crystal. J. Alloys Compd. 2011, 509 (32), 8149–8152.
(21) Saranya, D.; Chaudhuri, A. R.; Parui, J.; Krupanidhi, S. B. Electrocaloric Effect
of PMN-PT Thin Films near Morphotropic Phase Boundary. Bull. Mater. Sci. 2009, 32 (3), 259–262.
(22) Chukka, R.; Cheah, J. W.; Chen, Z.; Yang, P.; Shannigrahi, S.; Wang, J.; Chen,
L. Enhanced Cooling Capacities of Ferroelectric Materials at Morphotropic Phase Boundaries. Appl. Phys. Lett. 2011, 98 (24), 193–196.
(23) Wang, X. Composition Dependence of Electrocaloric Effect in
(1−x)Pb(Mg1/3Nb2/3)O3−xPbTiO3 Single Crystals. Commun. Theor. Phys. 2015, 64, 113-118
(24) Guyomar, D.; Sebald, G.; Guiffard, B.; Seveyrat, L. Ferroelectric Electrocaloric
Conversion in 0.75(PbMg1/3Nb2/3O3)-0.25(PbTiO3) Ceramics. J. Phys. D. Appl. Phys. 2006, 39 (20), 4491–4496.
(25) Sebald, G.; Seveyrat, L.; Guyomar, D.; Lebrun, L.; Guiffard, B.; Pruvost, S.
Electrocaloric and Pyroelectric Properties of 0.75Pb(Mg1/3Nb2/3)O3-0.25PbTiO3 Single Crystals. J. Appl. Phys. 2006, 100 (12).
(26) Liu, S.; Li, Y. Research on the Electrocaloric Effect of PMN/PT Solid Solution
for Ferroelectrics MEMS Microcooler. Mater. Sci. Eng. B Solid-State Mater. Adv. Technol. 2004, 113 (1), 46–49.
(27) Hagberg, J.; Uusimäki, A.; Jantunen, H. Electrocaloric Characteristics in

82
Reactive Sintered 0.87Pb(Mg1/3Nb2/3)O3-0.13PbTiO3. Appl. Phys. Lett. 2008, 92 (13), 2006–2009.
(28) Kabelka, H.; Fuith, A.; Birks, E.; Sternberg, A. Phase Transitions of Pb0.99Nb0.02
(Zr0.75Sn0.20Ti0.05)O3 Ceramics. Ferroelectrics 2001, 258 (1), 61–70. (29) Shebanovs, L.; Borman, K.; Lawless, W. N.; Kalvane, A. Electrocaloric Effect in
Some Perovskite Ferroelectric Ceramics and Multilayer Capacitors. Ferroelectrics 2002, 273, 137–142.
(30) Jaffe, B.; W., C.; H., J. Piezoeletric Ceramics. 1971, 3, pp 94. (31) Kaddoussi, H.; Gagou, Y.; Lahmar, A.; Allouche, B.; Dellis, J. L.; Courty, M.;
Khemakhem, H.; El Marssi, M. Ferroelectric Phase Changes and Electrocaloric Effects in Ba(Zr0.1Ti0.9)1−xSnxO3 ceramics Solid Solution. J. Mater. Sci. 2016, 51 (7), 3454–3462.
(32) Luo, Z.; Zhang, D.; Liu, Y.; Zhou, D.; Yao, Y.; Liu, C.; Dkhil, B.; Ren, X.; Lou,
X. Enhanced Electrocaloric Effect in Lead-Free BaTi1−xSnxO3 Ceramics near Room Temperature. Appl. Phys. Lett. 2014, 105 (10), 102904.
(33) Upadhyay, S. K.; Fatima, I.; Reddy, V. R. Study of Electro-Caloric Effect in Ca
and Sn Co-Doped BaTiO3 Ceramics. Mater. Res. Express 2017, 4 (4), 0–8. (34) Wang, X.; Wu, J.; Dkhil, B.; Zhao, C.; Li, T.; Li, W.; Lou, X. Large
Electrocaloric Strength and Broad Electrocaloric Temperature Span in Lead-Free Ba0.85Ca0.15Ti1-xHfxO3ceramics. RSC Adv. 2017, 7 (10), 5813–5820.
(35) Asbani, B.; Dellis, J. L.; Lahmar, A.; Courty, M.; Amjoud, M.; Gagou, Y.;
Djellab, K.; Mezzane, D.; Kutnjak, Z.; El Marssi, M. Lead-Free Ba0.8Ca0.2(ZrxTi1-
x)O3 ceramics with Large Electrocaloric Effect. Appl. Phys. Lett. 2015, 106 (4), 1–5.
(36) Li, J.; Zhang, D.; Qin, S.; Li, T.; Wu, M.; Wang, D.; Bai, Y.; Lou, X. Large
Room-Temperature Electrocaloric Effect in Lead-Free BaHfxTi1-xO3ceramics under Low Electric Field. Acta Mater. 2016, 115, 58–67.
(37) Qi, S.; Zhang, G.; Duan, L.; Zeng, T.; Cao, J. A Series of Annual Review
Articles. Eur. Heart J. 2014, 35 (5), 257. (38) Luo, L.; Jiang, X.; Zhang, Y.; Li, K. Electrocaloric Effect and Pyroelectric
Energy Harvesting of (0.94−x)Na0.5Bi0.5TiO3-0.06BaTiO3-xSrTiO3ceramics. J. Eur. Ceram. Soc. 2017, 37 (8), 2803–2812.
(39) Nieto, V. L.; Savioli, G. B.; Bidner, M. S. On the Inverse Problem of the
Estimation of Multiphase Flow Functions. 2004, 36, 1–8. (40) Koruza, J.; Rožič, B.; Cordoyiannis, G.; Malič, B.; Kutnjak, Z. Large
Electrocaloric Effect in Lead-Free K0.5Na0.5NbO3-SrTiO3 Ceramics. Appl. Phys. Lett. 2015, 106 (20).

83
(41) Jiang, X.; Luo, L.; Wang, B.; Li, W.; Chen, H. Electrocaloric Effect Based on the Depolarization Transition in (1-x)Bi0.5Na0.5TiO3-xKNbO3 lead-Free Ceramics. Ceram. Int. 2014, 40 (2), 2627–2634.
(42) Cao, W. P.; Li, W. L.; Xu, D.; Hou, Y. F.; Wang, W.; Fei, W. D. Enhanced
Electrocaloric Effect in Lead-Free NBT-Based Ceramics. Ceram. Int. 2014, 40, 9273–9278.
(43) Wang, X.; Wu, J.; Dkhil, B.; Xu, B.; Wang, X.; Dong, G.; Yang, G.; Lou, X.
Enhanced Electrocaloric Effect near Polymorphic Phase Boundary in Lead-Free Potassium Sodium Niobate Ceramics. Appl. Phys. Lett. 2017, 110 (6), 1–6.
(44) Kumar, R.; Singh, S. Giant Electrocaloric and Energy Storage Performance of
[(K0.5Na0.5)NbO3](1-x)-[LiSbO3]x nanocrystalline Ceramics. Sci. Rep. 2018, 8 (1), 1–9.
(45) Shrout, T. R. Relaxor Based Ferroelectric Single Crystals for Electro-Mechanical
Actuators. Mat. Res. Innovat. 1997, 3, 20–25. (46) Taylor, P.; Choi, S. W.; Shrout, R. T. R.; Jang, S. J.; Bhalla, A. S. Ferroelectrics
Dielectric and Pyroelectric Properties in the Pb(Mg1/3Nb2/3)O3-PbTiO3 System. 2012, 37–41.
(47) Gao, J. Recent Progress on BaTiO3-Based Piezoelectric Ceramics for Actuator
Applications. Actuators. 2017, 6, 24. (48) Tan, X.; Ma, C.; Webber, K. The Antiferroelectric-Ferroelectric Phase Transition
in Lead Containing and Lead-Free Perovskite Ceramics, J. Am. Ceram. Soc. 2011, 94 (12), 4091-4107.
(49) Li, L.; Zhu, M.; Wei, Q.; Zheng, M.; Hou, Y.; Hao, J. Ferroelectric P4mm to
Relaxor P4bm Transition and Temperature-Insensitive Large Strains in Bi(Mg0.5Ti0.5)O3-Modified Tetragonal 0.875Bi0.5Na0.5TiO3-0.125BaTiO3 lead-Free Ferroelectric Ceramics. J. Eur. Ceram. Soc. 2018, 38 (4), 1381–1388.
(50) Zhou, C.; Yuan, C.; Chen, G. Ferroelectric-Quasiferroelectric-Ergodic Relaxor
Transition and Ceramics. J. Am. Ceram. Soc. 2018, 64, 1554–1565. (51) Chen, D.; Ayrikyan, A.; Webber, K. G.; Kamlah, M. Time-Dependent
Electromechanical Response of 0.93(Na1/2Bi1/2)TiO3-0.07BaTiO3 Lead- Free Piezoceramic under Constant Electric Field. 2017, 93, 0–7.
(52) Tuttle, B. A.; Payne, D. A. The Effects of Microstructure on the Electrocaloric
Properties of Pb(Zr,Sn,Ti)O3 Ceramics. Ferroelectrics. 1981, 37, 603-606. (53) Zheng, X.; Zheng, G.; Lin, Z. Xiu-Cheng Zheng & Guang-Ping Zheng & Zheng
Lin & Zhi-Yuan Jiang. 2012, 20–26. (54) Chukka, R.; Cheah, J. W.; Chen, Z.; Yang, P.; Shannigrahi, S.; Wang, J.; Chen,
L.; Chukka, R.; Cheah, J. W.; Chen, Z.; et al. Enhanced Cooling Capacities of

84
Ferroelectric Materials at Morphotropic Phase Boundaries. 2016, 242902 (2011), 1–4.
(55) Dai, Y.-J.; Zhang, X.-W.; Chen, K.-P. Morphotropic Phase Boundary and
Electrical Properties of K1−xNaxNbO3 Lead-Free Ceramics. Appl. Phys. Lett. 2009, 94 (4), 42905.
(56) Ogihara, H.; Randall, C. A.; Trolier-McKinstry, S. Weakly Coupled Relaxor
Behavior of BaTiO3-BiScO3 Ceramics. J. Am. Ceram. Soc. 2009, 92 (1), 110–118.
(57) Xiong, B.; Hao, H.; Zhang, S.; Liu, H.; Cao, M. Structure, Dielectric Properties
and Temperature Stability of BaTiO3-Bi(Mg1/2Ti1/2)O3 perovskite Solid Solutions. J. Am. Ceram. Soc. 2011, 94 (10), 3412–3417.
(58) Kim, C.; Park, K.; Yoon, Y.; Sinn, D.; Kim, Y.; Hur, K. Effects of Milling
Condition on the Formation of Core–Shell Structure in BaTiO3 Grains. 2008, 28, 2589–2596.
(59) Liu, X.; Cheng, S.; Randall, C. A. The Core-Shell Structure in Ultrafine X7R
Dielectric Ceramics. 1998, 32, 312–315. (60) Stetefeld, J.; McKenna, S. A.; Patel, T. R. Dynamic Light Scattering: A Practical
Guide and Applications in Biomedical Sciences. Biophys. Rev. 2016, 8 (4), 409–427.
(61) Li, Y.; Barron, A. R. Dynamic Light Scattering. Sci. Technol. 2004, 49 , 1676–
1680. (62) Smart, L. E.; Moore, E. A. Solid State Chemistry. 3rd ed. pp. 91-147. (63) Degen, T.; Sadki, M.; Bron, E.; König, U.; Nénert, G. The HighScore Suite.
2014, 29, 13–18. (64) Lewis, D. B. Scanning Electron Microscopy and X-Ray Microanalysis. 2017,
2967, 2–7. (65) Analyzer, T. F. aixPlorer Software. pp 14–20. (66) Ta, U.; Carle, V.; Scha, U.; Hoffmann, M. J. Preparation and Microstructural
Analysis of High-Performance Ceramics. 2004, 9. pp 1057-1066. (67) Chinn, R. E. Ceramography. pp. 45-53. (68) Technologies, K. User’s Guide Keysight E4980A/AL Precision LCR Meter. pp
187-189. (69) Zhang, S. T.; Kounga, A. B.; Aulbach, E.; Ehrenberg, H.; Rödel, J. Giant Strain
in Lead-Free Piezoceramics Bi0.5Na0.5TiO3-BaTiO3-K0.5Na0.5NbO3 System. Appl. Phys. Lett. 2007, 91 (11).

85
(70) Iqbal, Y.; Jamal, A.; Ullah, R.; Khan, M. N.; Ubic, R. Effect of Fluxing Additive on Sintering Temperature, Microstructure and Properties of BaTiO3. Bull. Mater. Sci. Indian Acad. Sci. 2012, 35 (3), 387–394.
(71) Du, H.; Liu, D.; Tang, F.; Zhu, D.; Zhou, W.; Qu, S. Microstructure,
Piezoelectric, and Ferroelectric Properties of Bi2O3-Added (K0.5Na0.5)NbO3 Lead-Free Ceramics. J. Am. Ceram. Soc. 2007, 90 (9), 2824–2829.
(72) Naceur, H.; Megriche, A.; El Maaoui, M. Effect of Sintering Temperature on
Microstructure and Electrical Properties of Sr1−x(Na0.5Bi0.5)xBi2Nb2O9 Solid Solutions. J. Adv. Ceram. 2014, 3 (1), 17–30.
(73) Liu, H.; Li, Q.; Ma, J.; Chu, X. Effects of Bi3+ content and Grain Size on
Electrical Properties of SrBi2Ta2O9 ceramic. Mater. Lett. 2012, 76, 21–24. (74) Jin, L.; Li, F.; Zhang, S. Decoding the Fingerprint of Ferroelectric Loops:
Comprehension of the Material Properties and Structures. J. Am. Ceram. Soc. 2014, 97 (1), 1–27.
(75) Sanlialp, M.; Shvartsman, V. V.; Acosta, M.; Lupascu, D. C. Electrocaloric
Effect in Ba(Zr,Ti)O3–(Ba,Ca)TiO3 Ceramics Measured Directly. J. Am. Ceram. Soc. 2016, 99 (12), 4022–4030.
(76) Li, T.; Liu, X.; Shi, S.; Yin, Y.; Li, H.; Wang, Q.; Zhang, Y.; Bian, J.; Rajput, S.
S.; Long, C.; et al. Large Electrocaloric Efficiency over a Broad Temperature Span in Lead-Free BaTiO3-Based Ceramics near Room Temperature. Appl. Phys. Lett. 2017, 111 (20).
(77) Liu, Y.; Scott, J. F.; Dkhil, B. Direct and Indirect Measurements on
Electrocaloric Effect: Recent Developments and Perspectives. Appl. Phys. Rev. 2016, 3 (3).
(78) Kaddoussi, H.; Lahmar, A.; Khemakham, H. A. Room temperature electro-
caloric effect in lead-free Ba(Zr0.1Ti0.9)1-xSnxO3 (x=0, x=0.075) ceramics. Sol. State Commun. 2015, 201, 64-67.
(79) Morimoto, K.; Sawai, S.; Hisano, K.; Yamamoto, T. Simultaneous Measurement
of Specific Heat, Thermal Conductivity, and Thermal Diffusivity of Modified Barium Titanate Ceramics. Thermochim. Acta 2006, 442 (1–2), 14–17.
(80) Liu, X. Q.; Chen, T. T.; Fu, M. Sen; Wu, Y. J.; Chen, X. M. Electrocaloric
Effects in Spark Plasma Sintered Ba0.7Sr0.3TiO3-Based Ceramics: Effects of Domain Sizes and Phase Constitution. Ceram. Int. 2014, 40, 11269–11276.
(81) Randall, C. A.; Wang, S. F.; Laubscher, D.; Dougherty, J. P.; Huebner, W.
Structure Property Relationships in Core-Shell BaTiO3—LiF Ceramics. J. Mater. Res. 1993, 8 (4), 871–879.
(82) Beuerlein, M. A.; Kumar, N.; Usher, T.-M.; Brown-Shaklee, H. J.; Raengthon,
N.; Reaney, I. M.; Cann, D. P.; Jones, J. L.; Brennecka, G. L. Current
86
Understanding of Structure-Processing-Property Relationships in BaTiO3 -Bi(M)O3 Dielectrics. J. Am. Ceram. Soc. 2016, 99 (9), 2849–2870.
(83) Ramesh, G.; Ramachandra Rao, M. S.; Sivasubramanian, V.; Subramanian, V.
Electrocaloric Effect in (1-x)PIN-xPT Relaxor Ferroelectrics. J. Alloys Compd. 2016, 663, 444–448.
(84) Cullity, B. D.; Cohen, M. Elements of Diffraction. 2nd ed. 1978, pp 81-92 . (85) Anton, E. M.; Jo, W.; Damjanovic, D.; Rdel, J. Determination of Depolarization
Temperature of (Bi1/2Na1/2)TiO3-Based Lead-Free Piezoceramics. J. Appl. Phys. 2011, 110 (9).
(86) Wang, C. J.; Wu, Y. A.; Jacobs, R. M. J.; Warner, J. H.; Williams, G. R.; O’Hare,
D. Reverse Micelle Synthesis of Co-Al LDHs: Control of Particle Size and Magnetic Properties. Chem. Mater. 2011, 23 (2), 171–180.
(87) Hiruma, Y.; Yoshii, K.; Nagata, H.; Takenaka, T. Phase Transition Temperature
and Electrical Properties of (Bi1/2Na1/2)TiO3-(Bi1/2A1/2)TiO3 (A=Li and K) Lead-Free Ferroelectric Ceramics. J. Appl. Phys. 2008, 103 (8).
(88) Bai, W.; Shen, B.; Zhai, J.; Liu, F.; Li, P.; Liu, B.; Zhang, Y. Phase Evolution
and Correlation between Tolerance Factor and Electromechanical Properties in BNT-Based Ternary Perovskite Compounds with Calculated End-Member Bi(Me0.5Ti0.5)O3 (Me = Zn, Mg, Ni, Co). Dalt. Trans. 2016, 45 (36), 14141–14153.
(89) Guo, Y.; Gu, M.; Luo, H.; Liu, Y.; Withers, R. L. Composition-Induced
Antiferroelectric Phase and Giant Strain in Lead-Free (Nay,Biz)Ti1-xO3(1-x)-xBaTiO3 Ceramics. Phys. Rev. B - Condens. Matter Mater. Phys. 2011, 83 (5), 1–7.
(90) Gao, F.; Dong, X.; Mao, C.; Liu, W.; Zhang, H.; Yang, L.; Cao, F.; Wang, G.
Energy-Storage Properties of 0.89Bi0.5Na0.5TiO3-0.06BaTiO3-0.05K0.5Na0.5NbO3 Lead-Free Anti-Ferroelectric Ceramics. J. Am. Ceram. Soc. 2011, 94 (12), 4382–4386.
(91) Zhao, W.; Zuo, R.; Zheng, D.; Li, L. Dielectric Relaxor Evolution and
Frequency-Insensitive Giant Strains in (Bi0.5Na0.5)TiO3-Modified Bi(Mg0.5Ti0.5)O3-PbTiO3 ferroelectric Ceramics. J. Am. Ceram. Soc. 2014, 97 (6), 1855–1860.
(92) Ni, F.; Luo, L.; Li, W.; Chen, H. A-Site Vacancy-Induced Giant Strain and the
Electrical Properties in Non-Stoichiometric Ceramics Bi0.5+x(Na1-yKy)0.5-3xTiO3. J. Phys. D. Appl. Phys. 2012, 45 (41).
(93) Pu, Y.; Yao, M.; Zhang, L.; Jing, P. High Energy Storage Density of
0.55Bi0.5Na0.5TiO3-0.45Ba0.85Ca0.15Ti0.9−xZr0.1SnxO3 ceramics. J. Alloys Compd. 2016, 687, 689–695.

87
(94) Aguilar, B.; Navarro, O.; Carvajal, E.; Avignon, M. Effect of Mo / W Disorder on the Curie Temperature of Sr2FeMoxW1−xO6 Double Perovskite. Rev. Mex. Fis. 2007, 53 (7), 146–149.
(95) Charles Kittel. Introduction to Solid State Physics. 8th ed. 2010, pp 1-46. (96) Gao, L.; Guo, H.; Zhang, S.; Randall, C. A. Stabilized Antiferroelectricity in
xBiScO3-(1-x)NaNbO3 lead-Free Ceramics with Established Double Hysteresis Loops. Appl. Phys. Lett. 2018, 112 (9).
(97) Hiruma, Y.; Yoshii, K.; Nagata, H.; Takenaka, T. Phase Transition Temperature
and Electrical Properties of (Bi1/2Na1/2)TiO3-(Bi1/2A1/2)TiO3 (A=Li and K) Lead-Free Ferroelectric Ceramics. J. Appl. Phys. 2008, 103 (8).
(98) Goian, V.; Kamba, S.; Greicius, S.; Nuzhnyy, D.; Karimi, S.; Reaney, I. M.
Terahertz and Infrared Studies of Antiferroelectric Phase Transition in Multiferroic Bi0.85Nd0.15FeO3. J. Appl. Phys. 2011, 110 (7), 0–7.
(99) Karimi, S.; Reaney, I. M.; Levin, I.; Sterianou, I. Nd-Doped BiFeO3 ceramics
with Antipolar Order. Appl. Phys. Lett. 2009, 94 (11), 1–4. (100) Gao, L.; Guo, H.; Zhang, S.; Randall, C. A. A Perovskite Lead-Free
Antiferroelectric xCaHfO3-(1-x)NaNbO3 with Induced Double Hysteresis Loops at Room Temperature. J. Appl. Phys. 2016, 120 (20).
(101) Zhang, S. T.; Kounga, A. B.; Aulbach, E.; Granzow, T.; Jo, W.; Kleebe, H. J.;
Rödel, J. Lead-Free Piezoceramics with Giant Strain in the System Bi0.5Na0.5TiO3-BaTiO3-K0.5Na0.5NbO3. I. Structure and Room Temperature Properties. J. Appl. Phys. 2008, 103 (3), 3–10.
(102) Jo, W.; Granzow, T.; Aulbach, E.; Rödel, J.; Damjanovic, D. Origin of the Large
Strain Response in (K0.5Na0.5)NbO3-Modified (Bi0.5Na0.5)TiO3-BaTiO3 lead-Free Piezoceramics. J. Appl. Phys. 2009, 105 (9).
(103) Manotham, S.; Butnoi, P.; Jaita, P.; Kumar, N.; Chokethawai, K.; Rujijanagul,
G.; Cann, D. P. Large Electric Field-Induced Strain and Large Improvement in Energy Density of Bismuth Sodium Potassium Titanate-Based Piezoelectric Ceramics. J. Alloys Compd. 2018, 739, 457–467.
(104) Liu, X. Q.; Chen, T. T.; Wu, Y. J.; Chen, X. M. Enhanced Electrocaloric Effects
in Spark Plasma-Sintered Ba0.65Sr0.35TiO3-Based Ceramics at Room Temperature. J. Am. Ceram. Soc. 2013, 96 (4), 1021–1023.
(105) Bai, Y.; Zheng, G. P.; Shi, S. Q. Abnormal Electrocaloric Effect of
Na0.5Bi0.5TiO3-BaTiO3 lead-Free Ferroelectric Ceramics above Room Temperature. Mater. Res. Bull. 2011, 46 (11), 1866–1869.
(106) Zhou, C.; Feteira A. Observation of Multiple Dielectric Relaxations in BaTiO3-
Bi(Li1/3Ti2/3)O3 ceramics. Appl. Phys. A 2017, 712 (123).