Embed Size (px)
Citation preview
Determination of shear strength of unidirectional compositematerials with the Iosipescu and 10� o�-axis shear tests
G. Odegard, M. Kumosa *
Center for Advanced Materials and Structures, Department of Engineering, University of Denver, 2390 S. York, Denver, CO 80208, USA
Received 2 September 1999; received in revised form 8 June 2000; accepted 15 June 2000
Abstract
The purpose of this research was to determine the shear strength of a unidirectional carbon-®bre/epoxy composite by means of
the 10� o�-axis and 0� Iosipescu specimens subjected to shear. Detailed non-linear ®nite-element computations of these two testswere conducted, taking into account the actual non-linear material behavior of the composite. The tests were compared in terms ofstresses and strains at failure. It was found that the shear strength of the composite can be very accurately determined by using thetwo independent testing techniques only if fully non-linear ®nite element computations of the tests are performed. The stresses and
strains at failure in the 10� o�-axis specimen closely match the stresses and strains at the onset of intralaminar damage near theroots of the notches in Iosipescu specimens. Owing to the di�culties associated with the measurement of the shear strength of thecomposite using the Iosipescu test, and in particular, with the interpretation of the experimental data, this test was found to be
almost impractical for the determination of shear strength. The test can only be used if fully non-linear ®nite element computationsof uncracked and axially cracked Iosipescu specimens are conducted in conjunction with the continuous monitoring of intralaminardamage near the roots of the notches during testing. In addition, the shear strength results obtained from the Iosipescu specimen
should be independently veri®ed by using another method, such as the 10� o�-axis test. # 2000 Elsevier Science Ltd. All rightsreserved.
Keywords: Shear strength; Iosipescu test; 10� o� axis test
1. Introduction
The determination of the intralaminar shear strengthof unidirectional polymer-matrix composites is notstraight-forward. This is a result of the di�culty ofsubjecting a unidirectional composite material to a pureand uniform shear stress state while avoiding complica-tions caused by machining, high costs, and the e�ect ofother stresses. Over the years, many test methods havebeen devised for the characterization of the shearstrength of composite materials, each with its own lim-itations. Among these methods are the Iosipescu, tor-sional tube, slotted tensile, �45� tensile, two-rail, cross-beam sandwich, picture-frame panel, Arcan, and 10�
o�-axis shear tests. Perhaps the two most popular ofthese methods are the Iosipescu and the 10� o�-axisshear test methods. The popularity of these tests is
mostly a result of to the relative ease of specimen fabri-cation and testing, low cost, and accuracy of shearstrength values [1±4].The Iosipescu shear test was ®rst developed by Iosi-
pescu [5] and was subsequently applied to unidirectionalcomposites by Adams and Walrath [6±8] and Walrathand Adams [9]. In 1993, it became an ASTM standard(ASTM D 5379-93). The Iosipescu shear test consists ofa V-notched specimen mounted in both sides of theIosipescu test ®xture (Fig. 1). One side of the ®xture isdisplaced vertically while the other side remains sta-tionary, and opposing force couples prevent in-planebending of the specimen. The original belief was that astate of uniform shear stress would exist in the test sec-tion between the notches [5]. However, researchers havesince shown that non-uniform normal and shear stressesexist in the test section of the specimen, and stressconcentrations exist at the notch tips [7,8,10±17].The most common ®ber orientation in the Iosipescu
shear test for determination of intralaminar shearstrength and shear modulus is the 0� ®ber arrangement,
0266-3538/00/$ - see front matter # 2000 Elsevier Science Ltd. All rights reserved.
PI I : S0266-3538(00 )00141-X
Composites Science and Technology 60 (2000) 2917±2943
www.elsevier.com/locate/compscitech
* Corresponding author. Tel.: +1-303-871-3807; fax: +1-303-871-
4450.
E-mail address: [email protected] (M. Kumosa).
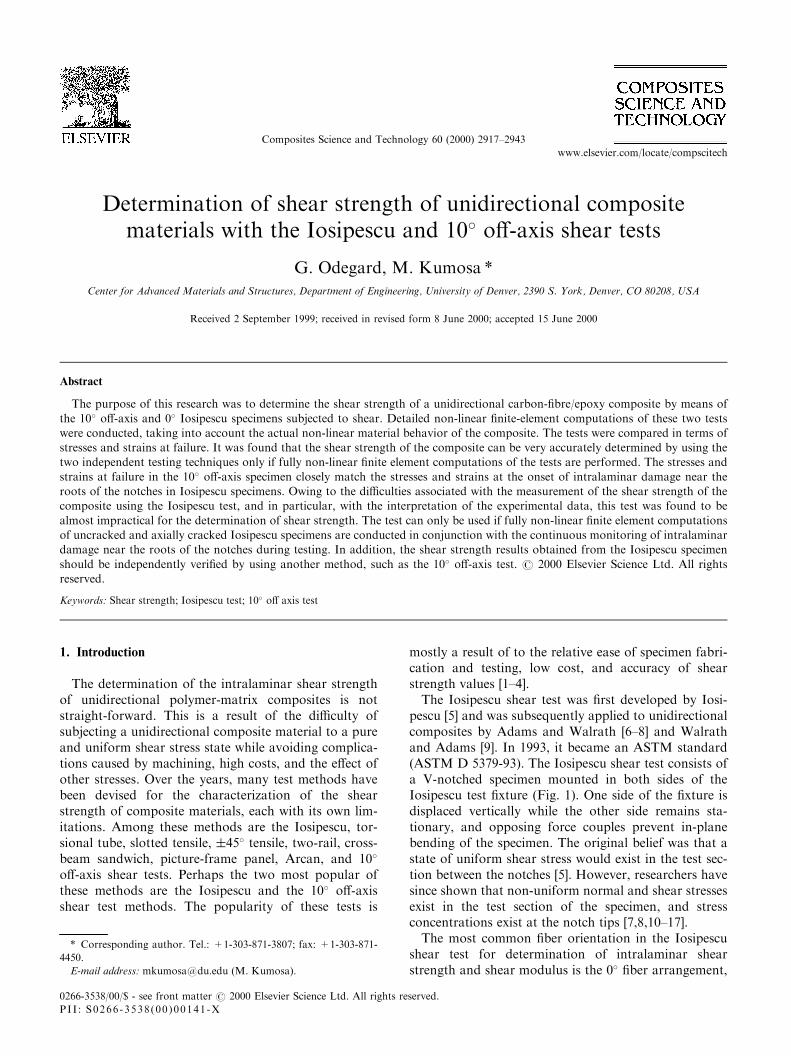
which is indicated in Fig. 1. When loaded, the ®rstobservable failure is notch-root splitting which startsnear the notch-roots and propagates away from theinner loading blocks along the ®bers (damage 1 inFig. 2). The splitting is predominantly a consequence oftransverse tension near the notch-roots, and it hasbeen shown that the splits create a more uniform stressdistribution along the notch-root axis [13,15,17]. Atabout the same time as the formation of the notch-rootsplits, damage starts to accumulate at the notch-roots
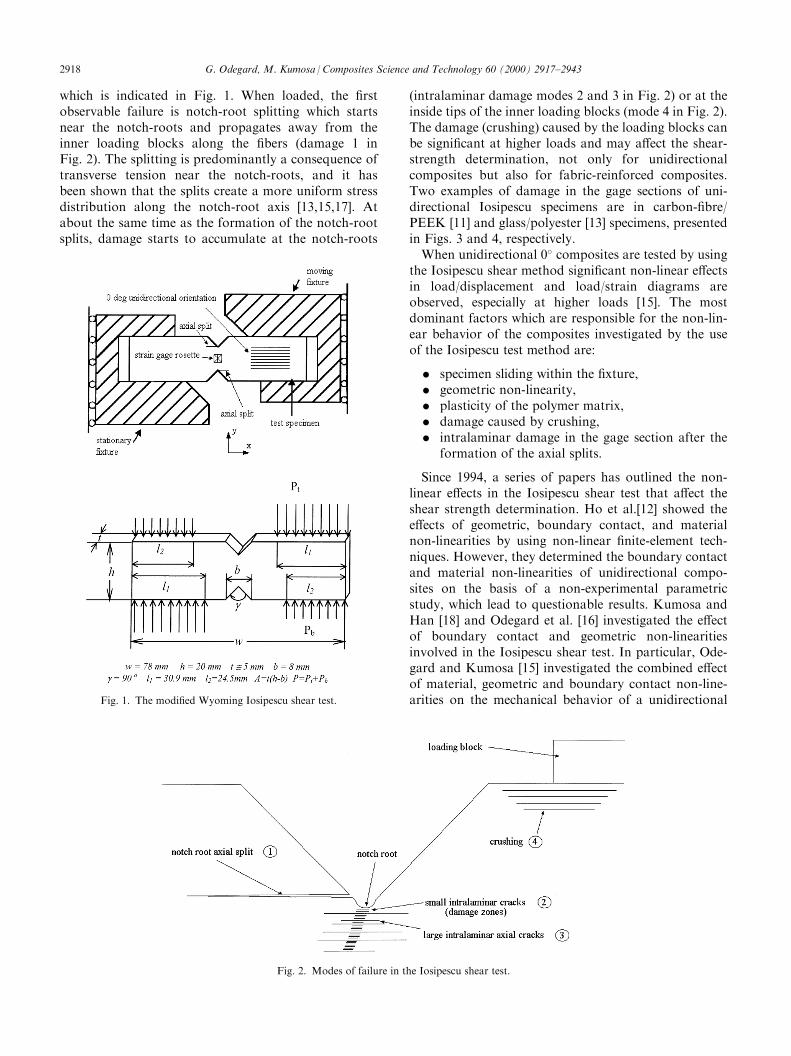
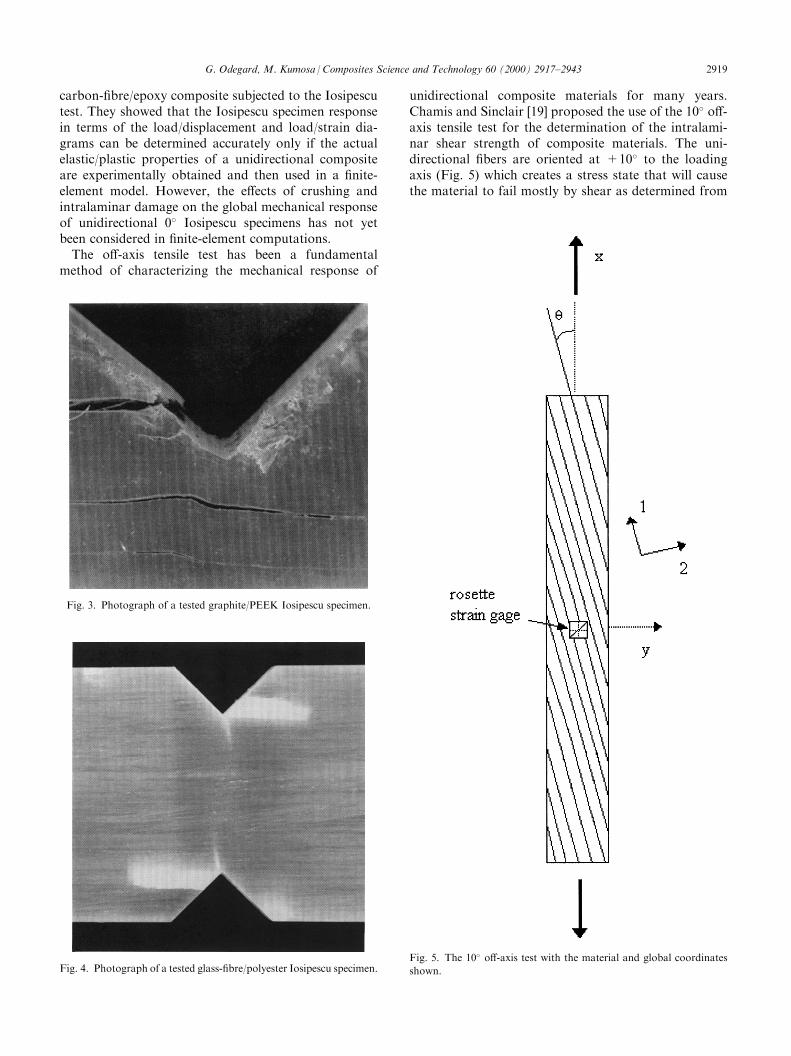
(intralaminar damage modes 2 and 3 in Fig. 2) or at theinside tips of the inner loading blocks (mode 4 in Fig. 2).The damage (crushing) caused by the loading blocks canbe signi®cant at higher loads and may a�ect the shear-strength determination, not only for unidirectionalcomposites but also for fabric-reinforced composites.Two examples of damage in the gage sections of uni-directional Iosipescu specimens are in carbon-®bre/PEEK [11] and glass/polyester [13] specimens, presentedin Figs. 3 and 4, respectively.When unidirectional 0� composites are tested by using
the Iosipescu shear method signi®cant non-linear e�ectsin load/displacement and load/strain diagrams areobserved, especially at higher loads [15]. The mostdominant factors which are responsible for the non-lin-ear behavior of the composites investigated by the useof the Iosipescu test method are:
. specimen sliding within the ®xture,
. geometric non-linearity,
. plasticity of the polymer matrix,
. damage caused by crushing,
. intralaminar damage in the gage section after theformation of the axial splits.
Since 1994, a series of papers has outlined the non-linear e�ects in the Iosipescu shear test that a�ect theshear strength determination. Ho et al.[12] showed thee�ects of geometric, boundary contact, and materialnon-linearities by using non-linear ®nite-element tech-niques. However, they determined the boundary contactand material non-linearities of unidirectional compo-sites on the basis of a non-experimental parametricstudy, which lead to questionable results. Kumosa andHan [18] and Odegard et al. [16] investigated the e�ectof boundary contact and geometric non-linearitiesinvolved in the Iosipescu shear test. In particular, Ode-gard and Kumosa [15] investigated the combined e�ectof material, geometric and boundary contact non-line-arities on the mechanical behavior of a unidirectionalFig. 1. The modi®ed Wyoming Iosipescu shear test.
Fig. 2. Modes of failure in the Iosipescu shear test.
2918 G. Odegard, M. Kumosa /Composites Science and Technology 60 (2000) 2917±2943
carbon-®bre/epoxy composite subjected to the Iosipescutest. They showed that the Iosipescu specimen responsein terms of the load/displacement and load/strain dia-grams can be determined accurately only if the actualelastic/plastic properties of a unidirectional compositeare experimentally obtained and then used in a ®nite-element model. However, the e�ects of crushing andintralaminar damage on the global mechanical responseof unidirectional 0� Iosipescu specimens has not yetbeen considered in ®nite-element computations.The o�-axis tensile test has been a fundamental
method of characterizing the mechanical response of
unidirectional composite materials for many years.Chamis and Sinclair [19] proposed the use of the 10� o�-axis tensile test for the determination of the intralami-nar shear strength of composite materials. The uni-directional ®bers are oriented at +10� to the loadingaxis (Fig. 5) which creates a stress state that will causethe material to fail mostly by shear as determined from
Fig. 3. Photograph of a tested graphite/PEEK Iosipescu specimen.
Fig. 4. Photograph of a tested glass-®bre/polyester Iosipescu specimen.Fig. 5. The 10� o�-axis test with the material and global coordinates
shown.
G. Odegard, M. Kumosa /Composites Science and Technology 60 (2000) 2917±2943 2919
a combined stress-failure criterion. There is currently noASTM standard for the 10� o�-axis test speci®cally,although ASTM D 3039-76 is a standard test methodfor o�-axis tests on composite materials in general.Pindera and Herakovich [20] examined the errors in
the measured values of elastic properties due to the end-constraint e�ects. Traditionally, the specimen is grippedby straight-edged tabs, which produce parasitic shearstresses near the tab/specimen interfaces. Pierron andVautrin [3] suggested the use of oblique tabs developedby Sun and Chung [21] to reduce these errors by pro-viding a more uniform displacement ®eld in the speci-men. However, Balakrishnan et al. [22] performed the10� o�-axis test on a unidirectional carbon-®bre/epoxycomposite with straight tabs and found that more thanhalf of the specimens failed in the test section (instead ofthe gripped section), which indicated that the parasiticshear stresses were relatively small and possibly negli-gible. ASTM standard D 3039-76 suggests using tabsmade of a material similar to that being tested in orderto reduce stress concentrations. The problem with usingcross-ply composite materials based on brittle matricesfor the tabs, as suggested by the standard, is that theirbrittle nature makes gripping di�cult. Most likely, thelargest source of error in the 10� o�-axis test is pre-mature failure as a result of inadequate machining,especially for very brittle unidirectional compositematerials. If the specimens are not carefully machined,then micro-cracks can form at the edges of the speci-men, therefore signi®cantly reducing the measured shearstrength.What has not yet been correctly addressed is the
question of how the intralaminar shear strength can beproperly determined from the Iosipescu and 10� o�-axistests so that similar values are obtained when testing thesame composite material (intralaminar shear strength isa material property and should not change from test totest). A single criterion based on either stresses orstrains should be able to predict the same shear strengthof a particular composite using either test. This criterioncan only be determined if the proper elastic/plasticproperties of a particular composite material are knownso that an accurate ®nite-element analysis can determinethe internal stresses and strains at the points where fail-ure occurs. In this paper, the time-independent elastic/plastic properties of a unidirectional carbon-®bre/epoxycomposite (Ciba-Geigy XAS-914) are determined andused to calculate numerically the stresses and strains inboth 0� Iosipescu and 10� o�-axis tensile specimens.
2. Plasticity model
Many researchers have developed macro-mechanicaltime-independent plasticity models for unidirectionalpolymer-matrix composite materials. Hill's model [23]
was originally developed for anisotropic cold-rolledmetals. Gri�n et al. [24] and Spencer [25] used approa-ches similar to that of Hill for modeling the non-linearbehavior of unidirectional composites. Sun and Chen[26] proposed a simple single-parameter plasticity modelto describe the nonlinear transverse tension and shearbehavior of composite materials. All of these approa-ches assume a relationship between an e�ective stressand e�ective plastic strain. This is an importantassumption in the plasticity of isotropic materials, andhas shown some promise in modeling the plasticity ofanisotropic materials. However, it may be an over-restrictive assumption when applied to polymer-matrixcomposite materials since they exhibit drastically di�er-ent modes of failure under di�erent load paths. Hansenet al. [27] proposed an invariant-based ¯ow rule whichincorporates a scalar hardening parameter that allowsthe hardening to be determined as a function of the loadpath, and not an e�ective-stress/plastic-strain relation-ship. Some research has suggested that hydrostaticstress (pressure) has an important in¯uence on the non-linear behavior of unidirectional composites [28,29].Voyiadjis and Thiagarajan [30] have proposed a pres-sure-dependent yield surface for transversely isotropicmaterials. The invariant-based ¯ow rule and the pres-sure-dependent transverse isotropic yield function areused in this paper to model the non-linear behavior ofthe Ciba-Geigy XAS/9l4 unidirectional carbon-®bre/epoxy composite subjected to the 10� o�-axis andIosipescu tests.
2.1. Yield function
A general form of a yield function may be expressedas:
� � � �ijÿ �ÿ �0 �1�
where � �ijÿ �
is the current yield surface and �0 is thelargest recorded value of � �ij
ÿ �and for initial yield is
taken as unity. Voyiadjis and Thiagarajan [30] proposeda pressure-dependent yield function for transverse iso-tropic materials assuming the behavior in axial tensionis the same as in axial compression:
� �ijÿ � � 2
9k21�
211 �
2
9k22 �
222 � �233
ÿ �ÿ 2
9k1k2�11 �22 � �33� � ÿ 2
9k22�22�33 �
2
3
� k1k2 � k24ÿ �
�212 � �213ÿ �� 2
3k22 � k26ÿ �
�223 �2�
where �ij are stress components in the material coordi-nate system (aligned with the principal axes of ortho-tropy) and k1, k2, k4, and k6 are constants which
2920 G. Odegard, M. Kumosa /Composites Science and Technology 60 (2000) 2917±2943
describe the yield behavior along various axes. The x1axis is assumed to be rotationally symmetric and istherefore parallel to the ®ber direction in a unidirec-tional composite. If a state of plane stress is assumed toexist �33 � �13 � �23 � 0� � then Eq. (2) becomes:
� �ijÿ � � 2
9k21�
211 �
2
9k22�
222 ÿ
2
9k1k2�11�22 � 2
3
� k1k2 � k24ÿ �
�212 �3�
The material behavior for any stress state is de®nedby:
� < 0 elastic� � 0 the stress state is on the yield surface, plastic
deformation occurring as loading progress� > 0 inaccessible state
If �yij represents the initial yield stresses along di�erent
directions, then Eq. (3) can be used to obtain expres-sions of the parameters k1, k2, and k4. In terms of theyield stresses they are:
k1 � 3���2p
2�y11
k2 � 3���2p
2�y22
k4 ������������������������������������3
2
1
�y212
ÿ 3
�y11�
y22
!vuut �4�
For unidirectional carbon-®bre/epoxy compositematerials with a ®ber-volume fraction of 0.5±0.6, theyield stresses (the start of non-linear behavior in thecase of transverse tension and shear) can be assumed tobe: �y
11 � 1300 MPa, �y22 � 2 MPa, and �y
12 � 1 MPa.These yield stresses were used for the purpose of theanalysis performed in this study. This assumes thatthere is no material plasticity along the ®bers and theplastic deformation in transverse tension and shearoccurs at very low loads. Such assumptions are certainlyreasonable considering experimental observations inthis research. From Eq. (4), the values of k are:k1 � 0:002, k2 � 1:061, and k4 � 1:224. The form of theyield function indicates that proportional hardening isassumed for this material.
2.2. Flow rule
Hansen et al. [27] have shown that the relationshipbetween the stresses and plastic strains in unidirectionalcomposite materials can be given through the following¯ow rule [31]:
d"pij � g �ij
ÿ � @�
@�rsd�rs
� �@�
@�ij�5�
where d"pij is the plastic strain increment tensor and
g �ijÿ �
is the scalar hardening parameter. Plastic ¯owoccurs when:
@� �ijÿ �@�rs
d�rs > 0 and � �ijÿ � � 0 �6�
The scalar hardening parameter, g �ijÿ �
, is a scalarfunction of a second-order tensor. It has been shown[27] that g �ij
ÿ �can be put into a form in which its value
depends on the location of the stress state on the yieldsurface, and is invariant with respect to the materialsymmetry of the composite. Spencer [32] has shown thatthe ®ve stress invariants with respect to arbitrary rota-tions about the axis of symmetry in a transverseisotropic material are:
a1 � �11 a2 � ��� a3 � �1���1 a4 � ������a5 � �1������1 �; � � 2; 3
�7�
g �ijÿ �
may be therefore put in the form:
g �ijÿ � � g a1; a2; a3; a4; a5� � �8�
If we assume that the material behaves the same intension and compression, then we must use quadraticforms of a1, a2, and a5. However, the square of the sec-ond invariant is the same as the third invariant underplane stress conditions, so we can disregard a2. Forsimplicity, we can also disregard the ®fth invariant sinceit will contain a sixth-order term. It is generally assumedthat there is no plastic deformation along the axis of the®bers, therefore a1 may also be disregarded. Now thescalar hardening parameter is:
g �ijÿ � � g a3; a4� � �9�
A general form of the scalar hardening parametermay be de®ned as [27]:
g �ijÿ � �X
n
ana�n
gn an� � �10�
where the superscript * indicates values of the invariantsat the current yield surface assuming a uniaxial invar-iant stress state. Using Eqs. (9) and (10), the form of thescalar hardening parameter is:
g a3; a4� � � a3a�3
g3 a3� � � a4a�4
g4 a4� � �11�
where and g3 a3� � and g4 a4� � are functions of eachindividual invariant and are determined by experiment.
G. Odegard, M. Kumosa /Composites Science and Technology 60 (2000) 2917±2943 2921
2.3. Experimental characterization
In the o�-axis tensile test, the applied tensile load isalong the long axis of the specimen, which is de®ned asthe x direction �xx� � and the ®bers are aligned at anangle � from the loading axis (Fig. 5). A three-elementstrain gage rosette is mounted at the center of the spe-cimen with one gage aligned along the loading axis,another aligned 45� away from the ®rst, and the thirdaligned 90� from the loading axis. The material normaland shear stresses (�11, �22, and �12) in the compositemay be related to the applied tensile load (�xx) by:
�11�22�12
24 35 � cos2 �� � sin2 �� � 2cos �� �sin �� �sin2 �� � cos2 �� � ÿ2cos �� �sin �� �
ÿcos �� �sin �� � cos �� �sin �� � cos2 �� � ÿ sin �� �
24 35�
�xx�yy�xy
24 35�12�
Similarly, the total strain components in the materialcoordinate system may be related to the strain gagestrains by transforming the coordinates:
"t11
"t22
"t12
24 35 � cos2 �� � sin2 �� � 2cos �� �sin �� �sin2 �� � cos2 �� � ÿ2cos �� �sin �� �
ÿcos �� �sin �� � cos �� �sin �� � cos2 �� � ÿ sin2 �� �
24 35�
"txx
"tyy
"txy
24 35�13�
where "txx is the strain in the gage aligned along the
loading axis "txx � "t
0�ÿ �
, "tyy is the strain in the gage
aligned transverse to the loading axis "tyy � "t
90�
� �, and
"txy is:
"txy � "t
45� ÿ1
2"t0� � "t
90�ÿ � �14�
The experimental plastic strains can be calculated bysubtracting the elastic strains from the total strains. Theelastic strain components may be calculated as afunction of stress components:
"e11
"e22
"e12
24 35 � S11 S12 0S12 S22 0
0 01
2S66
264375 �11
�22�12
24 35 �15�
where
S11 � 1
E1S12 � ÿ �12
E1� ÿ �21
E2S22 � 1
E2S66 � 1
G12�16�
where E1, E2 are the axial moduli parallel and trans-verse to the ®bers, respectively. G12 is the longitudinalshear modulus, and �12 and �21 are Poison's ratios. Theelastic properties of the composite were experimentallydetermined from 0�, 10� and 90� o�-axis tensile testsand were found to be:
E1 � 140 GPaE2 � 11 GPaG12 � 6 GPa�12 � 0:38
The scalar hardening parameter for a particularmaterial can be determined from two o�-axis tests. Theparameter g3 a3� � can be determined using Eq. (5) andthe plastic strains obtained from a 90� o�-axis test [inthis case g3 a3� � � g a3; a4� �]. An arbitrary o�-axis anglemay then be used to determine g4 a4� � by again using Eq.(5) and experimental data to obtain g a3; a4� �. Thus,from the experimentally determined g3 a3� � and g4 a3� �,g a3; a4� � may be calculated for any plane-stress state ofany unidirectional composite material.
3. Experimental procedure
3.1. Iosipescu shear test
0� Iosipescu specimens of Ciba-Geigy XAS-914 uni-directional carbon-®bre/epoxy composite material weremachined to the dimensions suggested by the ASTMstandard. Two three-element rosette strain gages (Mea-surements Group WK-06-060WR-350) were mountedin the center of the specimens (one on each side) inorder to measure the total strain in the middle of thenotch-root axis. A biaxial Iosipescu test ®xture was used[11,33] with loading blocks that are the same dimensionsas that suggested by the ASTM standard. The tests wereperformed on a servo-hydraulic MTS 880 with hydrau-lic grips and a displacement rate of 0.5 mm/min. Loadand strain data were taken up to a ®xture displacementof about 2.5 mm. The shear strain was calculated fromthe strain-gage reading by the relationship:
12 � "1 ÿ "2 �17�
where "1 and "2 are the strains measured by the straingage elements that are �45� to the principal materialcoordinates (see Fig. 1). The strains from the gages onboth sides of the specimen were averaged. The shearstress was determined by taking the load as read by theload cell and dividing by the cross-sectional area of thegage section of the specimen.
2922 G. Odegard, M. Kumosa /Composites Science and Technology 60 (2000) 2917±2943
3.2. O�-axis tensile tests
The 10� and 90� o�-axis test specimens weremachined to dimensions similar to those recommendedby ASTM D3039-76. The 10� o�-axis specimens were200 mm long, 12 mm wide, with an as-received thicknessof 5 mm. The 90� specimens were 120 mm long, 25 mmwide, and 5 mm thick. Three-element rosette straingages were mounted in the center of the specimenaligned as described above. Aluminum tabs were used atthe gripped portions of the specimen to prevent speci-men crushing by the serrated (diamond-faceted) gripfaces. The grips for the 90� specimen were straight andthose for the 10� specimen had an oblique angle of 22�.The tabs were bonded to the specimen with an epoxyadhesive. The tests were performed on the same testingmachine as that used for the Iosipescu specimens. All ofthe specimens failed in the gage section away from thegripped areas.In the 10� o�-axis test, the shear stress and shear
strain (in the material coordinate system) are calculatedby transforming the applied stresses and measuredstrains (from the strain gages) using Eqs. (12) and (13).The stress and strain data required to determine theelastic-plastic properties of the carbon-®bre/epoxycomposite were obtained from two 10� and two 90� o�-axis tensile tests. The values of the components of thescalar hardening parameter were determined to be(using the procedure described above):
g3 a3� � � 2:0� 10ÿ11ÿ �
a3
g4 a4� � � 1:25� 10ÿ8ÿ �
a4 �18�
Therefore, the scalar hardening parameter is:
g �ijÿ � � 2:0� 10ÿ11
ÿ ��212 � 1:25� 10ÿ8
ÿ ��222 �19�
This parameter was determined by using stress inunits of MPa and dimensionless tensorial strains.
4. Finite-element models
Three non-linear ®nite-element models (10� o�-axis,Iosipescu with no axial splits at the notches, and Iosi-pescu with two axial notch-root splits) were created inorder to examine the stresses and strains in the speci-mens. All three models assumed geometric non-linearityand material non-linearity. The Iosipescu models alsoassumed boundary contact non-linearity between thespecimen and loading blocks. The resulting numericalstress/strain data can be directly compared to theexperimental results in order to determine if the plasti-city model outlined in Section 2 can accurately describe
the composite behavior. Then, stresses and strains in thespecimens may be calculated and used to determine theactual shear strength.
4.1. Iosipescu models
Two ®nite-element models of the Iosipescu shear test(with and without notch-root axial splits) simulated theloading conditions of the modi®ed Wyoming ®xture.The computations were performed with ANSYS1 5.4.The models are two-dimensional (having a thickness ofunity, i.e. 1 mm) and use isoparametric elements witheight nodes (PLANE82). Point-to-surface contact ele-ments (CONTAC48) were used to simulate slidingbetween the loading blocks and the composite specimenwith a friction coe�cient of � � 0:3. This friction coef-®cient was chosen based on an expected value of a staticfriction coe�cient between steel loading blocks and anunidirectional carbon-®bre-reinforced polymer compo-site. It has been previously shown that the e�ect of thefriction coe�cient on the numerical load/strain andload/displacement curves is negligible for unidirectionalcomposite Iosipescu specimens within the range of 0.1±0.5 [15,16]. For the model with the notch-root splits, thelength of the cracks was 9 mm, which was chosen basedon the average split length observed experimentally forthis particular composite.The mesh and boundary conditions used in the ana-
lysis are shown (Figs. 6 and 7) with a deformed ®nite-element representation of the specimen. The specimencenter was constrained against vertical and horizontaldisplacements (ux and uy � 0). The blocks on the rightside of the specimen had prescribed displacements ofu=2 and the blocks on the opposite side were loaded bya negative displacement of the same magnitude. Thus,the total prescribed displacement acting on the specimenwas equal to u. The total reactions from each node onthe right loading blocks were summed (this is equal tothe load as read by a load cell in the experiment). Also,all stress and strain components were calculated alongthe notch-root axis of the specimens using the nodaldisplacements (including the strains in the middle formodeling the three-element rosette strain gage).The loading procedure for both models was divided
into a minimum of 40 load steps. Each load step had amaximum of 25 equilibrium iterations, and during eachiteration the square root of the sum of squares (SSRS)of the imbalance forces were calculated. The force con-vergence criterion was assumed with the SRSS of theimbalance forces smaller than 0.1% of the SRSS of theloading forces.
4.2. 10� o�-axis model
The model of the 10� o�-axis tensile test is three-dimensional and uses isoparametric 10 node tetrahedral
G. Odegard, M. Kumosa /Composites Science and Technology 60 (2000) 2917±2943 2923
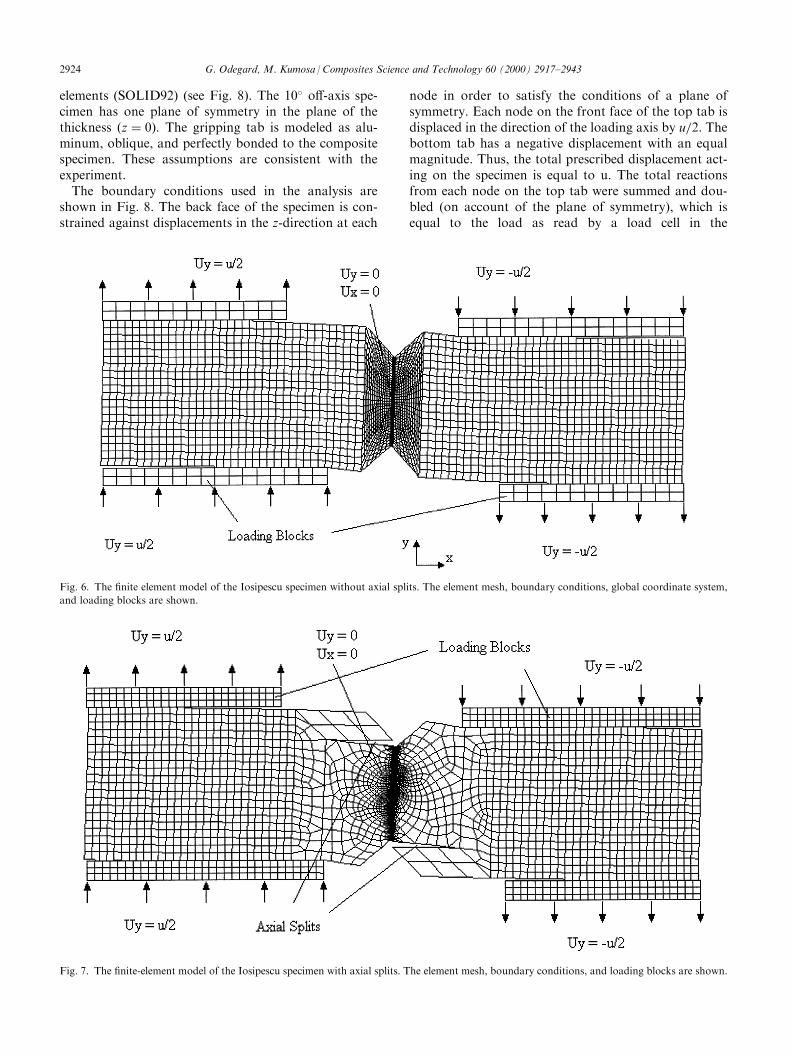
elements (SOLID92) (see Fig. 8). The 10� o�-axis spe-cimen has one plane of symmetry in the plane of thethickness (z � 0). The gripping tab is modeled as alu-minum, oblique, and perfectly bonded to the compositespecimen. These assumptions are consistent with theexperiment.The boundary conditions used in the analysis are
shown in Fig. 8. The back face of the specimen is con-strained against displacements in the z-direction at each
node in order to satisfy the conditions of a plane ofsymmetry. Each node on the front face of the top tab isdisplaced in the direction of the loading axis by u=2. Thebottom tab has a negative displacement with an equalmagnitude. Thus, the total prescribed displacement act-ing on the specimen is equal to u. The total reactionsfrom each node on the top tab were summed and dou-bled (on account of the plane of symmetry), which isequal to the load as read by a load cell in the
Fig. 6. The ®nite element model of the Iosipescu specimen without axial splits. The element mesh, boundary conditions, global coordinate system,
and loading blocks are shown.
Fig. 7. The ®nite-element model of the Iosipescu specimen with axial splits. The element mesh, boundary conditions, and loading blocks are shown.
2924 G. Odegard, M. Kumosa /Composites Science and Technology 60 (2000) 2917±2943
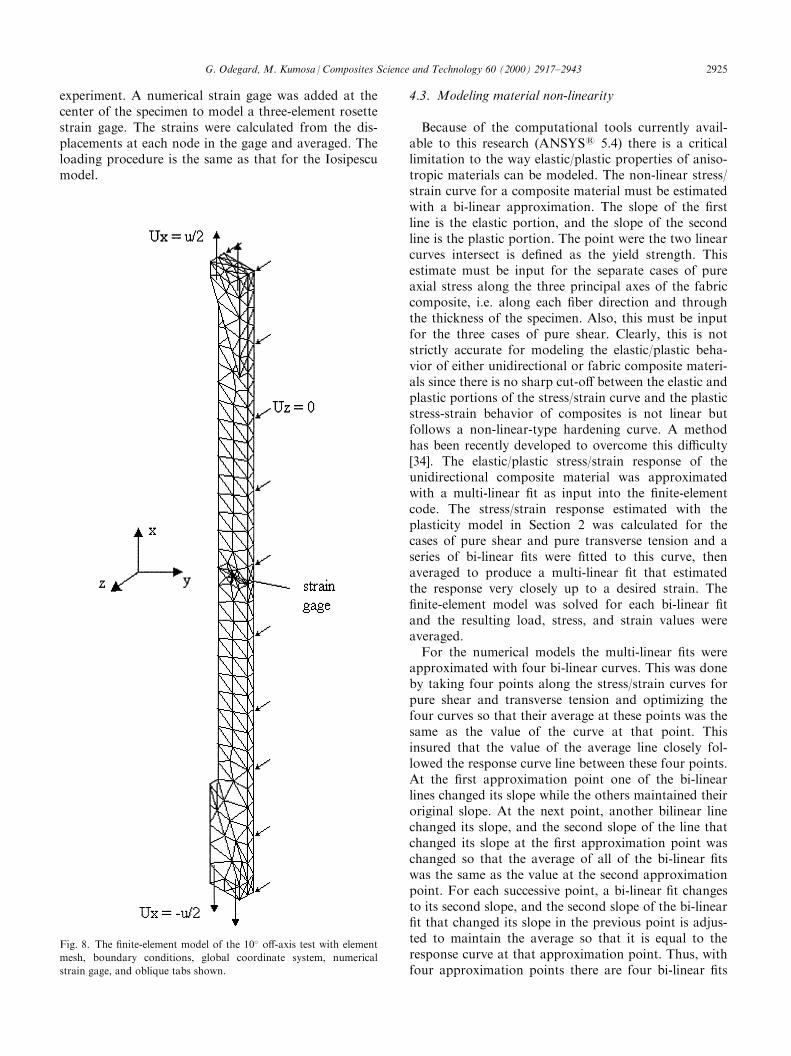
experiment. A numerical strain gage was added at thecenter of the specimen to model a three-element rosettestrain gage. The strains were calculated from the dis-placements at each node in the gage and averaged. Theloading procedure is the same as that for the Iosipescumodel.
4.3. Modeling material non-linearity
Because of the computational tools currently avail-able to this research (ANSYS1 5.4) there is a criticallimitation to the way elastic/plastic properties of aniso-tropic materials can be modeled. The non-linear stress/strain curve for a composite material must be estimatedwith a bi-linear approximation. The slope of the ®rstline is the elastic portion, and the slope of the secondline is the plastic portion. The point were the two linearcurves intersect is de®ned as the yield strength. Thisestimate must be input for the separate cases of pureaxial stress along the three principal axes of the fabriccomposite, i.e. along each ®ber direction and throughthe thickness of the specimen. Also, this must be inputfor the three cases of pure shear. Clearly, this is notstrictly accurate for modeling the elastic/plastic beha-vior of either unidirectional or fabric composite materi-als since there is no sharp cut-o� between the elastic andplastic portions of the stress/strain curve and the plasticstress-strain behavior of composites is not linear butfollows a non-linear-type hardening curve. A methodhas been recently developed to overcome this di�culty[34]. The elastic/plastic stress/strain response of theunidirectional composite material was approximatedwith a multi-linear ®t as input into the ®nite-elementcode. The stress/strain response estimated with theplasticity model in Section 2 was calculated for thecases of pure shear and pure transverse tension and aseries of bi-linear ®ts were ®tted to this curve, thenaveraged to produce a multi-linear ®t that estimatedthe response very closely up to a desired strain. The®nite-element model was solved for each bi-linear ®tand the resulting load, stress, and strain values wereaveraged.For the numerical models the multi-linear ®ts were
approximated with four bi-linear curves. This was doneby taking four points along the stress/strain curves forpure shear and transverse tension and optimizing thefour curves so that their average at these points was thesame as the value of the curve at that point. Thisinsured that the value of the average line closely fol-lowed the response curve line between these four points.At the ®rst approximation point one of the bi-linearlines changed its slope while the others maintained theiroriginal slope. At the next point, another bilinear linechanged its slope, and the second slope of the line thatchanged its slope at the ®rst approximation point waschanged so that the average of all of the bi-linear ®tswas the same as the value at the second approximationpoint. For each successive point, a bi-linear ®t changesto its second slope, and the second slope of the bi-linear®t that changed its slope in the previous point is adjus-ted to maintain the average so that it is equal to theresponse curve at that approximation point. Thus, withfour approximation points there are four bi-linear ®ts
Fig. 8. The ®nite-element model of the 10� o�-axis test with element
mesh, boundary conditions, global coordinate system, numerical
strain gage, and oblique tabs shown.
G. Odegard, M. Kumosa /Composites Science and Technology 60 (2000) 2917±2943 2925
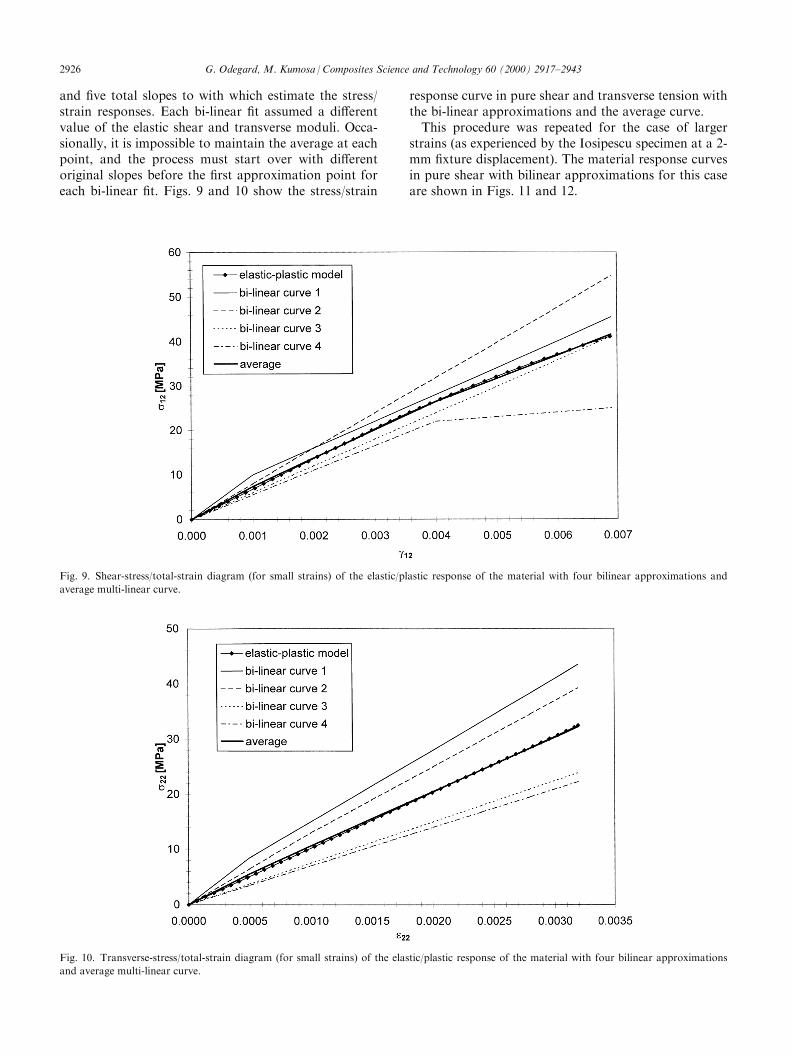
and ®ve total slopes to with which estimate the stress/strain responses. Each bi-linear ®t assumed a di�erentvalue of the elastic shear and transverse moduli. Occa-sionally, it is impossible to maintain the average at eachpoint, and the process must start over with di�erentoriginal slopes before the ®rst approximation point foreach bi-linear ®t. Figs. 9 and 10 show the stress/strain
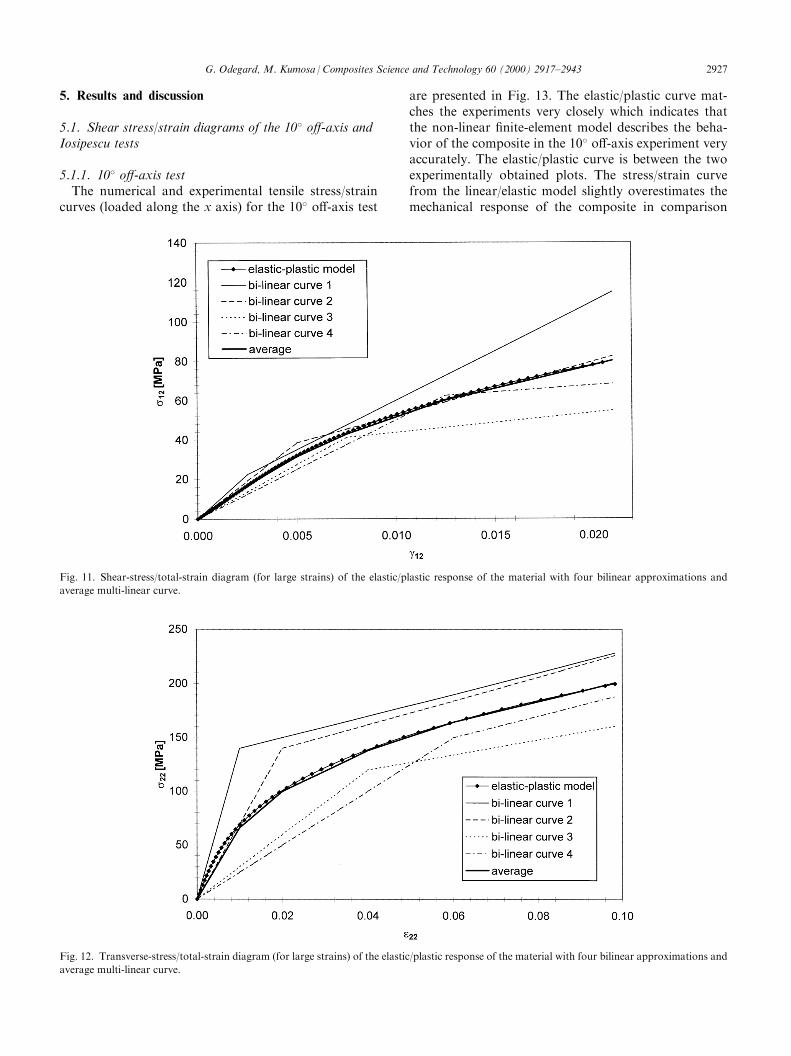
response curve in pure shear and transverse tension withthe bi-linear approximations and the average curve.This procedure was repeated for the case of larger
strains (as experienced by the Iosipescu specimen at a 2-mm ®xture displacement). The material response curvesin pure shear with bilinear approximations for this caseare shown in Figs. 11 and 12.
Fig. 9. Shear-stress/total-strain diagram (for small strains) of the elastic/plastic response of the material with four bilinear approximations and
average multi-linear curve.
Fig. 10. Transverse-stress/total-strain diagram (for small strains) of the elastic/plastic response of the material with four bilinear approximations
and average multi-linear curve.
2926 G. Odegard, M. Kumosa /Composites Science and Technology 60 (2000) 2917±2943
5. Results and discussion
5.1. Shear stress/strain diagrams of the 10� o�-axis andIosipescu tests
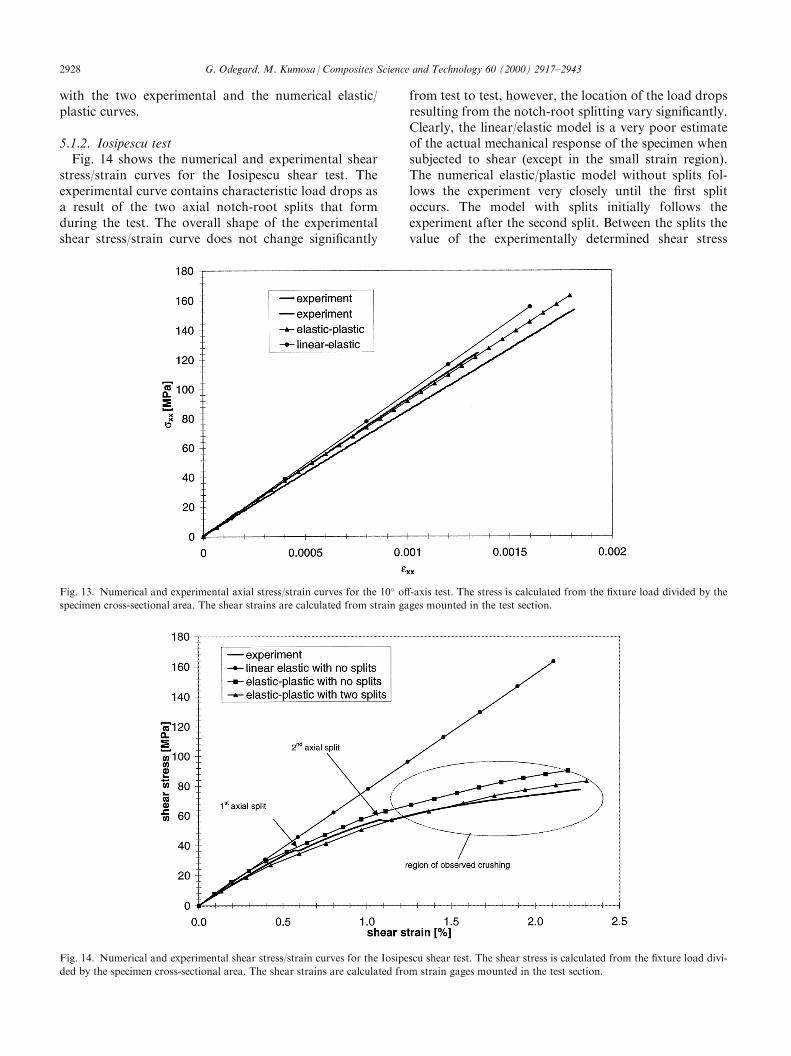
5.1.1. 10� o�-axis testThe numerical and experimental tensile stress/strain
curves (loaded along the x axis) for the 10� o�-axis test
are presented in Fig. 13. The elastic/plastic curve mat-ches the experiments very closely which indicates thatthe non-linear ®nite-element model describes the beha-vior of the composite in the 10� o�-axis experiment veryaccurately. The elastic/plastic curve is between the twoexperimentally obtained plots. The stress/strain curvefrom the linear/elastic model slightly overestimates themechanical response of the composite in comparison
Fig. 11. Shear-stress/total-strain diagram (for large strains) of the elastic/plastic response of the material with four bilinear approximations and
average multi-linear curve.
Fig. 12. Transverse-stress/total-strain diagram (for large strains) of the elastic/plastic response of the material with four bilinear approximations and
average multi-linear curve.
G. Odegard, M. Kumosa /Composites Science and Technology 60 (2000) 2917±2943 2927
with the two experimental and the numerical elastic/plastic curves.
5.1.2. Iosipescu testFig. 14 shows the numerical and experimental shear
stress/strain curves for the Iosipescu shear test. Theexperimental curve contains characteristic load drops asa result of the two axial notch-root splits that formduring the test. The overall shape of the experimentalshear stress/strain curve does not change signi®cantly
from test to test, however, the location of the load dropsresulting from the notch-root splitting vary signi®cantly.Clearly, the linear/elastic model is a very poor estimateof the actual mechanical response of the specimen whensubjected to shear (except in the small strain region).The numerical elastic/plastic model without splits fol-lows the experiment very closely until the ®rst splitoccurs. The model with splits initially follows theexperiment after the second split. Between the splits thevalue of the experimentally determined shear stress
Fig. 13. Numerical and experimental axial stress/strain curves for the 10� o�-axis test. The stress is calculated from the ®xture load divided by the
specimen cross-sectional area. The shear strains are calculated from strain gages mounted in the test section.
Fig. 14. Numerical and experimental shear stress/strain curves for the Iosipescu shear test. The shear stress is calculated from the ®xture load divi-
ded by the specimen cross-sectional area. The shear strains are calculated from strain gages mounted in the test section.
2928 G. Odegard, M. Kumosa /Composites Science and Technology 60 (2000) 2917±2943
(P=A) is between the values of the shear stresses fromthe models with and without the notch-root splits.However, it can be observed that the numerical non-linear two split model diverges from the experimentat higher shear strains. This is a result of the crush-ing of the specimen in areas directly adjacent to theloading blocks (mode 4 in Fig. 2). The plastic defor-mation of the material in the vicinity of the loadingblocks was simulated by the non-linear ®nite-elementmodels.However, the crush zones consist of numerous inter-
laminar and intralaminar cracks. The formation ofthese cracks was not considered in the ®nite-elementanalyses. Therefore, the numerical curve diverges fromthe experimental response because of the developmentof crush damage zones near the loading blocks whichthe present non-linear model cannot accurately handle.Moreover, failure modes 2 and 3 (in Fig. 2) will alsoa�ect the divergence of the numerical and experimentalcurves. Since crushing and intralaminar failure cause agreater load reduction than the material non-linearity(that is modeled by using the plasticity theory givenabove), the numerical model over-predicts the experi-ment when crushing becomes signi®cant. Adams andLewis [35] have shown that crushing may become sig-ni®cant after the second notch-root split occurs in cer-tain unidirectional composites, which reinforces thedata presented here. However, crushing can also occurat lower loads, even as low as those associated withnotch-root splitting [16]. Therefore, the location of thepoint where the numerical two-split model divergesfrom the experiment can vary from specimen tospecimen even for the same material.
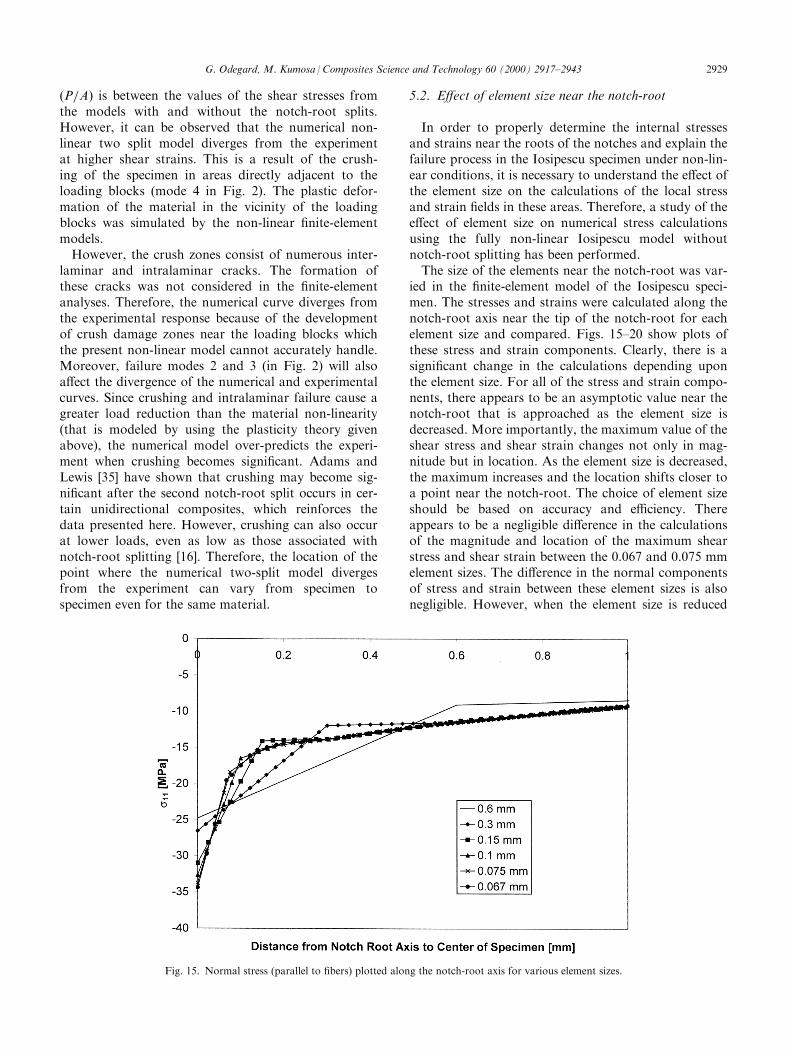
5.2. E�ect of element size near the notch-root
In order to properly determine the internal stressesand strains near the roots of the notches and explain thefailure process in the Iosipescu specimen under non-lin-ear conditions, it is necessary to understand the e�ect ofthe element size on the calculations of the local stressand strain ®elds in these areas. Therefore, a study of thee�ect of element size on numerical stress calculationsusing the fully non-linear Iosipescu model withoutnotch-root splitting has been performed.The size of the elements near the notch-root was var-
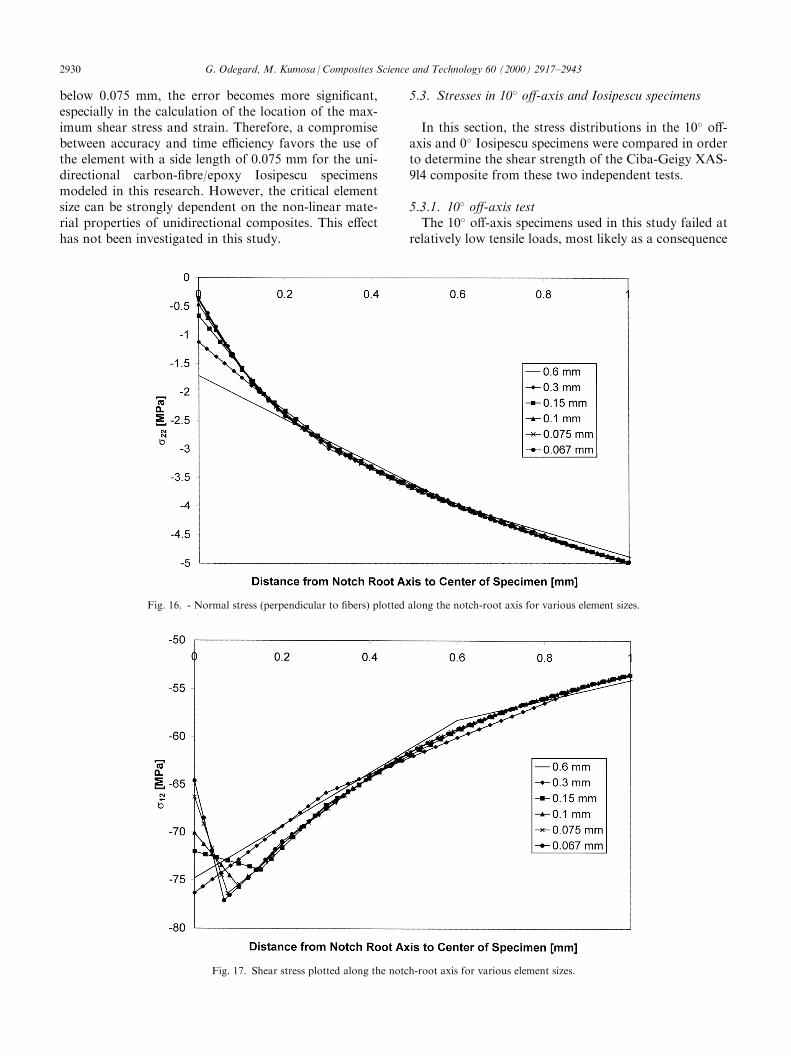
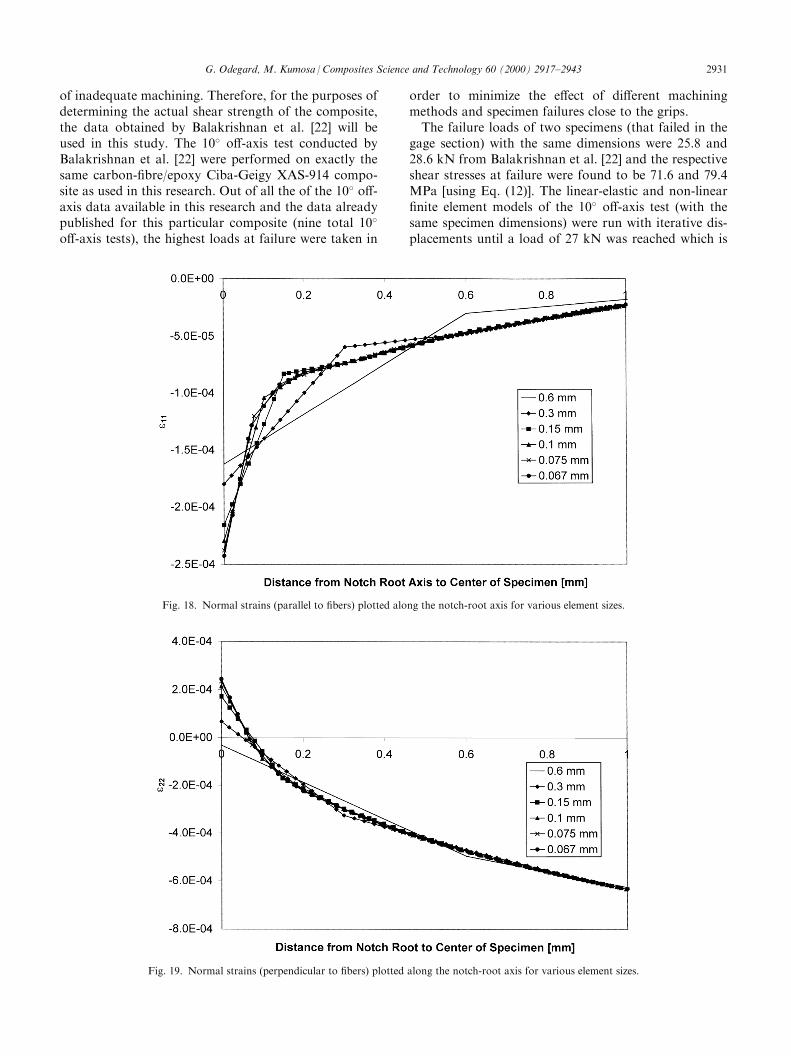
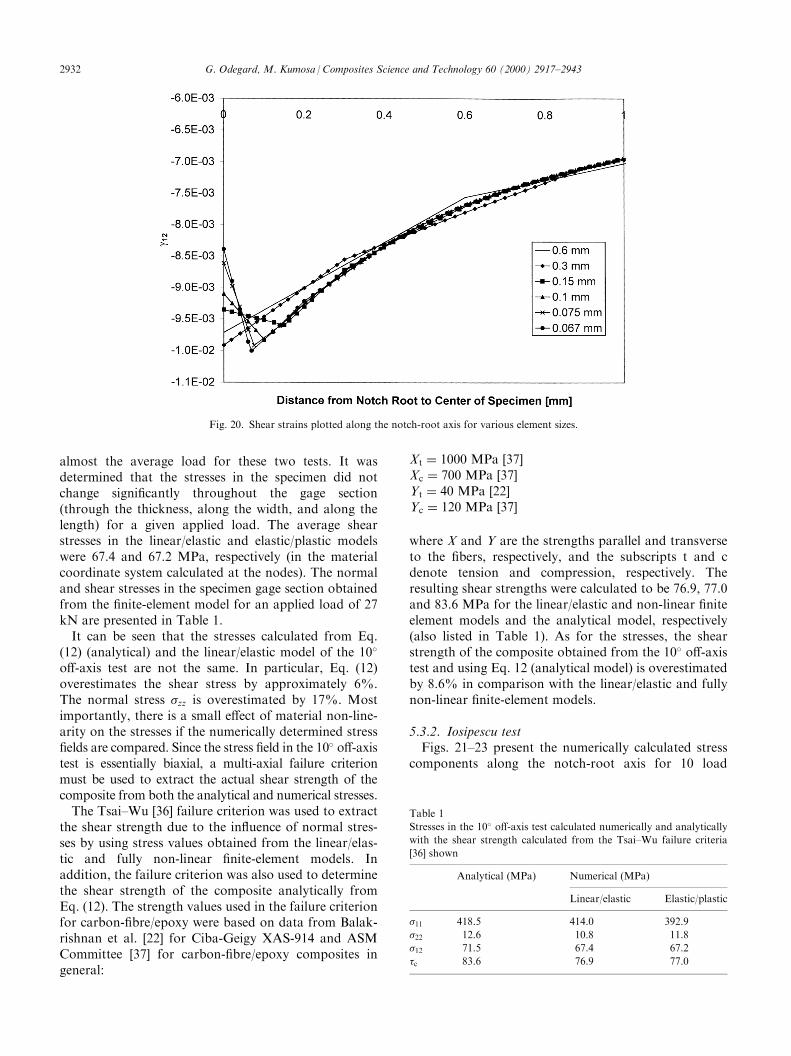
ied in the ®nite-element model of the Iosipescu speci-men. The stresses and strains were calculated along thenotch-root axis near the tip of the notch-root for eachelement size and compared. Figs. 15±20 show plots ofthese stress and strain components. Clearly, there is asigni®cant change in the calculations depending uponthe element size. For all of the stress and strain compo-nents, there appears to be an asymptotic value near thenotch-root that is approached as the element size isdecreased. More importantly, the maximum value of theshear stress and shear strain changes not only in mag-nitude but in location. As the element size is decreased,the maximum increases and the location shifts closer toa point near the notch-root. The choice of element sizeshould be based on accuracy and e�ciency. Thereappears to be a negligible di�erence in the calculationsof the magnitude and location of the maximum shearstress and shear strain between the 0.067 and 0.075 mmelement sizes. The di�erence in the normal componentsof stress and strain between these element sizes is alsonegligible. However, when the element size is reduced
Fig. 15. Normal stress (parallel to ®bers) plotted along the notch-root axis for various element sizes.
G. Odegard, M. Kumosa /Composites Science and Technology 60 (2000) 2917±2943 2929
below 0.075 mm, the error becomes more signi®cant,especially in the calculation of the location of the max-imum shear stress and strain. Therefore, a compromisebetween accuracy and time e�ciency favors the use ofthe element with a side length of 0.075 mm for the uni-directional carbon-®bre/epoxy Iosipescu specimensmodeled in this research. However, the critical elementsize can be strongly dependent on the non-linear mate-rial properties of unidirectional composites. This e�ecthas not been investigated in this study.
5.3. Stresses in 10� o�-axis and Iosipescu specimens
In this section, the stress distributions in the 10� o�-axis and 0� Iosipescu specimens were compared in orderto determine the shear strength of the Ciba-Geigy XAS-9l4 composite from these two independent tests.
5.3.1. 10� o�-axis testThe 10� o�-axis specimens used in this study failed at
relatively low tensile loads, most likely as a consequence
Fig. 16. - Normal stress (perpendicular to ®bers) plotted along the notch-root axis for various element sizes.
Fig. 17. Shear stress plotted along the notch-root axis for various element sizes.
2930 G. Odegard, M. Kumosa /Composites Science and Technology 60 (2000) 2917±2943
of inadequate machining. Therefore, for the purposes ofdetermining the actual shear strength of the composite,the data obtained by Balakrishnan et al. [22] will beused in this study. The 10� o�-axis test conducted byBalakrishnan et al. [22] were performed on exactly thesame carbon-®bre/epoxy Ciba-Geigy XAS-914 compo-site as used in this research. Out of all the of the 10� o�-axis data available in this research and the data alreadypublished for this particular composite (nine total 10�
o�-axis tests), the highest loads at failure were taken in
order to minimize the e�ect of di�erent machiningmethods and specimen failures close to the grips.The failure loads of two specimens (that failed in the
gage section) with the same dimensions were 25.8 and28.6 kN from Balakrishnan et al. [22] and the respectiveshear stresses at failure were found to be 71.6 and 79.4MPa [using Eq. (12)]. The linear-elastic and non-linear®nite element models of the 10� o�-axis test (with thesame specimen dimensions) were run with iterative dis-placements until a load of 27 kN was reached which is
Fig. 18. Normal strains (parallel to ®bers) plotted along the notch-root axis for various element sizes.
Fig. 19. Normal strains (perpendicular to ®bers) plotted along the notch-root axis for various element sizes.
G. Odegard, M. Kumosa /Composites Science and Technology 60 (2000) 2917±2943 2931
almost the average load for these two tests. It wasdetermined that the stresses in the specimen did notchange signi®cantly throughout the gage section(through the thickness, along the width, and along thelength) for a given applied load. The average shearstresses in the linear/elastic and elastic/plastic modelswere 67.4 and 67.2 MPa, respectively (in the materialcoordinate system calculated at the nodes). The normaland shear stresses in the specimen gage section obtainedfrom the ®nite-element model for an applied load of 27kN are presented in Table 1.It can be seen that the stresses calculated from Eq.
(12) (analytical) and the linear/elastic model of the 10�
o�-axis test are not the same. In particular, Eq. (12)overestimates the shear stress by approximately 6%.The normal stress �zz is overestimated by 17%. Mostimportantly, there is a small e�ect of material non-line-arity on the stresses if the numerically determined stress®elds are compared. Since the stress ®eld in the 10� o�-axistest is essentially biaxial, a multi-axial failure criterionmust be used to extract the actual shear strength of thecomposite from both the analytical and numerical stresses.The Tsai±Wu [36] failure criterion was used to extract
the shear strength due to the in¯uence of normal stres-ses by using stress values obtained from the linear/elas-tic and fully non-linear ®nite-element models. Inaddition, the failure criterion was also used to determinethe shear strength of the composite analytically fromEq. (12). The strength values used in the failure criterionfor carbon-®bre/epoxy were based on data from Balak-rishnan et al. [22] for Ciba-Geigy XAS-914 and ASMCommittee [37] for carbon-®bre/epoxy composites ingeneral:
Xt � 1000 MPa [37]Xc � 700 MPa [37]Yt � 40 MPa [22]Yc � 120 MPa [37]
where X and Y are the strengths parallel and transverseto the ®bers, respectively, and the subscripts t and cdenote tension and compression, respectively. Theresulting shear strengths were calculated to be 76.9, 77.0and 83.6 MPa for the linear/elastic and non-linear ®niteelement models and the analytical model, respectively(also listed in Table 1). As for the stresses, the shearstrength of the composite obtained from the 10� o�-axistest and using Eq. 12 (analytical model) is overestimatedby 8.6% in comparison with the linear/elastic and fullynon-linear ®nite-element models.
5.3.2. Iosipescu testFigs. 21±23 present the numerically calculated stress
components along the notch-root axis for 10 load
Fig. 20. Shear strains plotted along the notch-root axis for various element sizes.
Table 1
Stresses in the 10� o�-axis test calculated numerically and analytically
with the shear strength calculated from the Tsai±Wu failure criteria
[36] shown
Analytical (MPa) Numerical (MPa)
Linear/elastic Elastic/plastic
�11 418.5 414.0 392.9
�22 12.6 10.8 11.8
�12 71.5 67.4 67.2
�c 83.6 76.9 77.0
2932 G. Odegard, M. Kumosa /Composites Science and Technology 60 (2000) 2917±2943
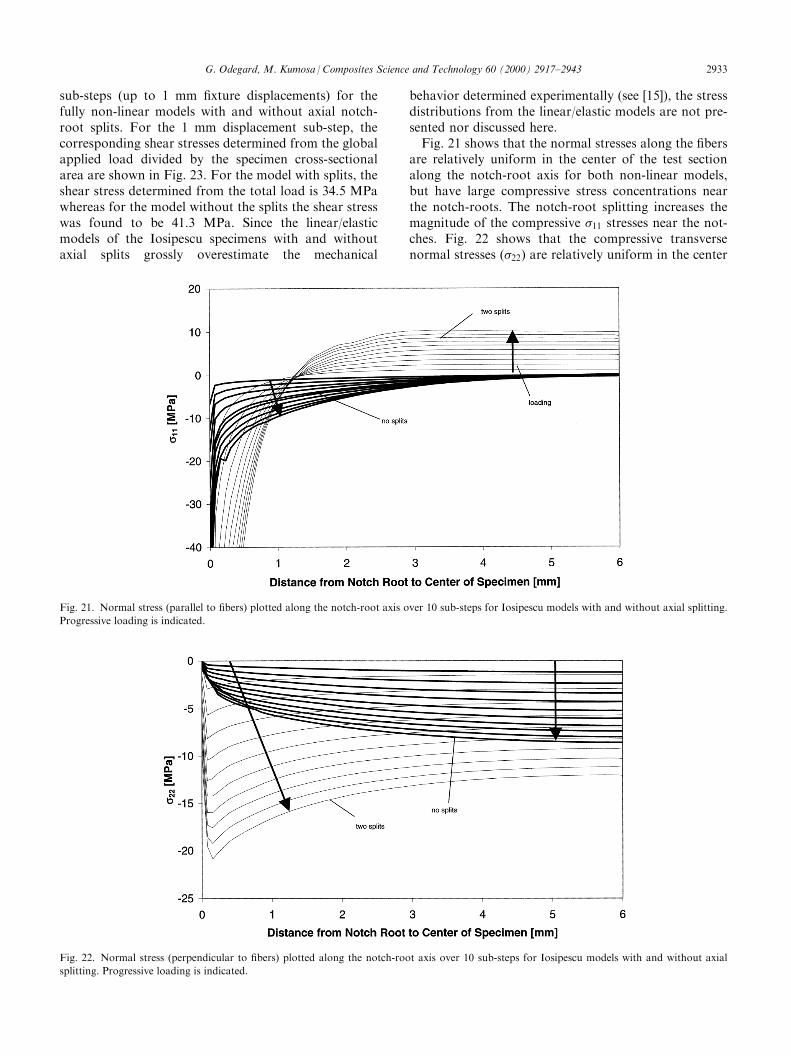
sub-steps (up to 1 mm ®xture displacements) for thefully non-linear models with and without axial notch-root splits. For the 1 mm displacement sub-step, thecorresponding shear stresses determined from the globalapplied load divided by the specimen cross-sectionalarea are shown in Fig. 23. For the model with splits, theshear stress determined from the total load is 34.5 MPawhereas for the model without the splits the shear stresswas found to be 41.3 MPa. Since the linear/elasticmodels of the Iosipescu specimens with and withoutaxial splits grossly overestimate the mechanical
behavior determined experimentally (see [15]), the stressdistributions from the linear/elastic models are not pre-sented nor discussed here.Fig. 21 shows that the normal stresses along the ®bers
are relatively uniform in the center of the test sectionalong the notch-root axis for both non-linear models,but have large compressive stress concentrations nearthe notch-roots. The notch-root splitting increases themagnitude of the compressive �11 stresses near the not-ches. Fig. 22 shows that the compressive transversenormal stresses (�22) are relatively uniform in the center
Fig. 21. Normal stress (parallel to ®bers) plotted along the notch-root axis over 10 sub-steps for Iosipescu models with and without axial splitting.
Progressive loading is indicated.
Fig. 22. Normal stress (perpendicular to ®bers) plotted along the notch-root axis over 10 sub-steps for Iosipescu models with and without axial
splitting. Progressive loading is indicated.
G. Odegard, M. Kumosa /Composites Science and Technology 60 (2000) 2917±2943 2933
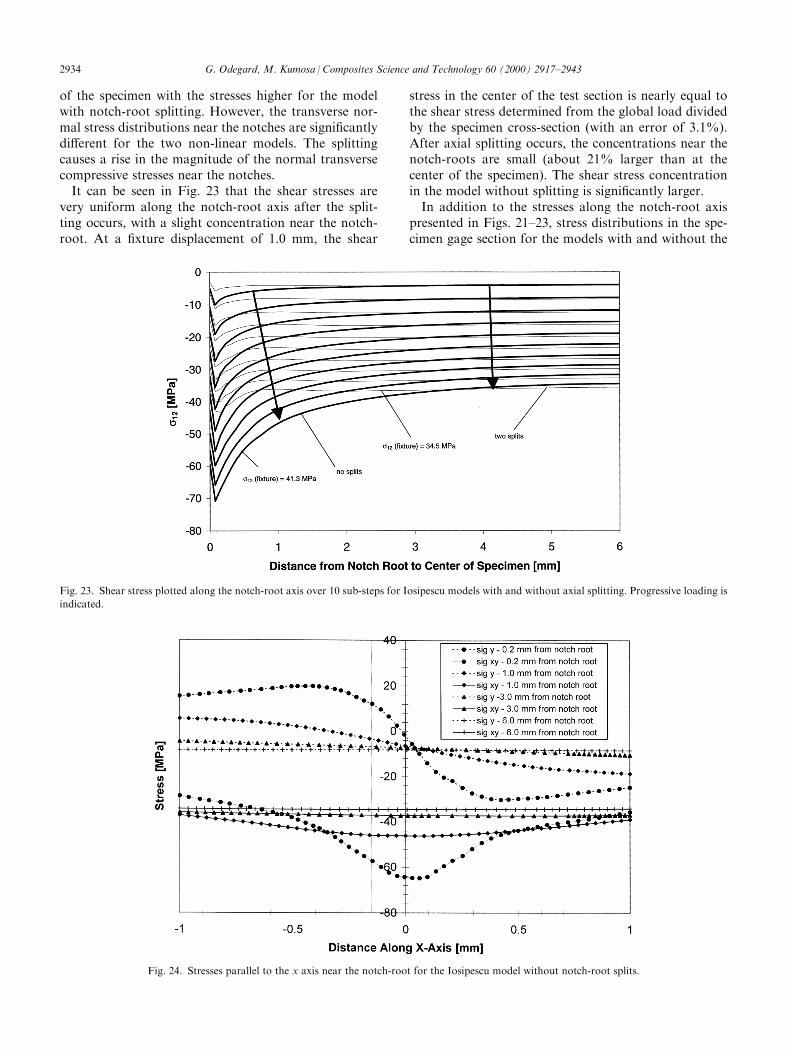
of the specimen with the stresses higher for the modelwith notch-root splitting. However, the transverse nor-mal stress distributions near the notches are signi®cantlydi�erent for the two non-linear models. The splittingcauses a rise in the magnitude of the normal transversecompressive stresses near the notches.It can be seen in Fig. 23 that the shear stresses are
very uniform along the notch-root axis after the split-ting occurs, with a slight concentration near the notch-root. At a ®xture displacement of 1.0 mm, the shear
stress in the center of the test section is nearly equal tothe shear stress determined from the global load dividedby the specimen cross-section (with an error of 3.1%).After axial splitting occurs, the concentrations near thenotch-roots are small (about 21% larger than at thecenter of the specimen). The shear stress concentrationin the model without splitting is signi®cantly larger.In addition to the stresses along the notch-root axis
presented in Figs. 21±23, stress distributions in the spe-cimen gage section for the models with and without the
Fig. 23. Shear stress plotted along the notch-root axis over 10 sub-steps for Iosipescu models with and without axial splitting. Progressive loading is
indicated.
Fig. 24. Stresses parallel to the x axis near the notch-root for the Iosipescu model without notch-root splits.
2934 G. Odegard, M. Kumosa /Composites Science and Technology 60 (2000) 2917±2943
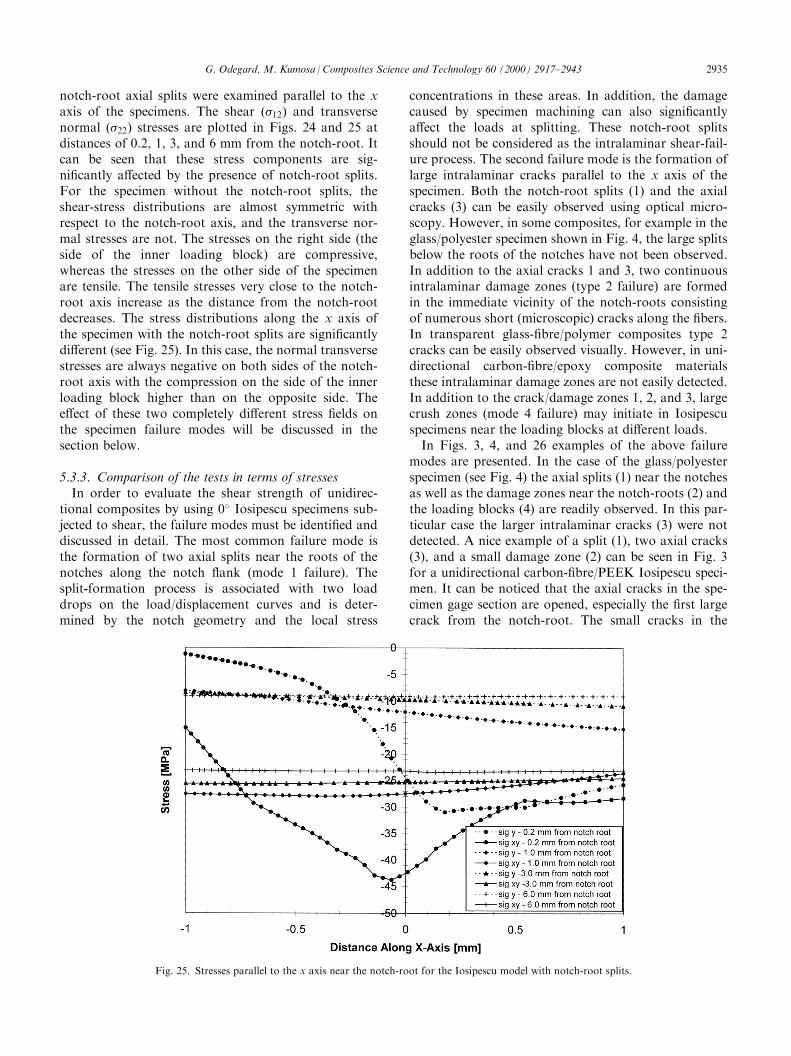
notch-root axial splits were examined parallel to the xaxis of the specimens. The shear (�12) and transversenormal (�22) stresses are plotted in Figs. 24 and 25 atdistances of 0.2, 1, 3, and 6 mm from the notch-root. Itcan be seen that these stress components are sig-ni®cantly a�ected by the presence of notch-root splits.For the specimen without the notch-root splits, theshear-stress distributions are almost symmetric withrespect to the notch-root axis, and the transverse nor-mal stresses are not. The stresses on the right side (theside of the inner loading block) are compressive,whereas the stresses on the other side of the specimenare tensile. The tensile stresses very close to the notch-root axis increase as the distance from the notch-rootdecreases. The stress distributions along the x axis ofthe specimen with the notch-root splits are signi®cantlydi�erent (see Fig. 25). In this case, the normal transversestresses are always negative on both sides of the notch-root axis with the compression on the side of the innerloading block higher than on the opposite side. Thee�ect of these two completely di�erent stress ®elds onthe specimen failure modes will be discussed in thesection below.
5.3.3. Comparison of the tests in terms of stressesIn order to evaluate the shear strength of unidirec-
tional composites by using 0� Iosipescu specimens sub-jected to shear, the failure modes must be identi®ed anddiscussed in detail. The most common failure mode isthe formation of two axial splits near the roots of thenotches along the notch ¯ank (mode 1 failure). Thesplit-formation process is associated with two loaddrops on the load/displacement curves and is deter-mined by the notch geometry and the local stress
concentrations in these areas. In addition, the damagecaused by specimen machining can also signi®cantlya�ect the loads at splitting. These notch-root splitsshould not be considered as the intralaminar shear-fail-ure process. The second failure mode is the formation oflarge intralaminar cracks parallel to the x axis of thespecimen. Both the notch-root splits (1) and the axialcracks (3) can be easily observed using optical micro-scopy. However, in some composites, for example in theglass/polyester specimen shown in Fig. 4, the large splitsbelow the roots of the notches have not been observed.In addition to the axial cracks 1 and 3, two continuousintralaminar damage zones (type 2 failure) are formedin the immediate vicinity of the notch-roots consistingof numerous short (microscopic) cracks along the ®bers.In transparent glass-®bre/polymer composites type 2cracks can be easily observed visually. However, in uni-directional carbon-®bre/epoxy composite materialsthese intralaminar damage zones are not easily detected.In addition to the crack/damage zones 1, 2, and 3, largecrush zones (mode 4 failure) may initiate in Iosipescuspecimens near the loading blocks at di�erent loads.In Figs. 3, 4, and 26 examples of the above failure
modes are presented. In the case of the glass/polyesterspecimen (see Fig. 4) the axial splits (1) near the notchesas well as the damage zones near the notch-roots (2) andthe loading blocks (4) are readily observed. In this par-ticular case the larger intralaminar cracks (3) were notdetected. A nice example of a split (1), two axial cracks(3), and a small damage zone (2) can be seen in Fig. 3for a unidirectional carbon-®bre/PEEK Iosipescu speci-men. It can be noticed that the axial cracks in the spe-cimen gage section are opened, especially the ®rst largecrack from the notch-root. The small cracks in the
Fig. 25. Stresses parallel to the x axis near the notch-root for the Iosipescu model with notch-root splits.
G. Odegard, M. Kumosa /Composites Science and Technology 60 (2000) 2917±2943 2935
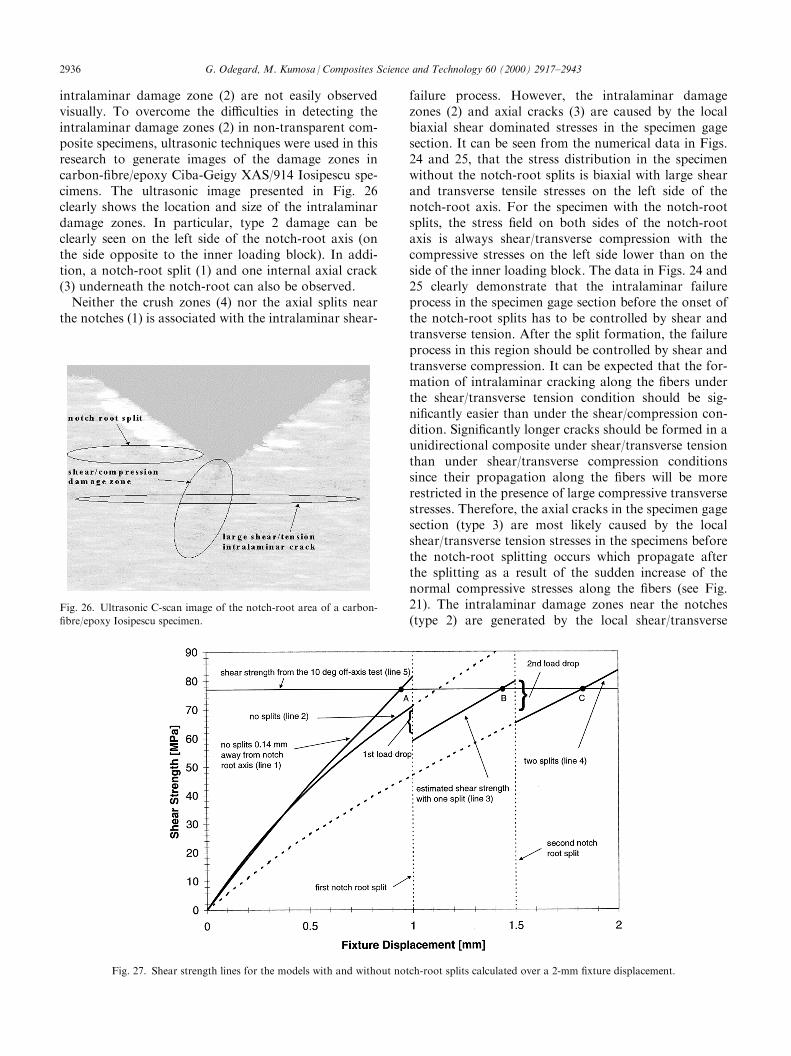
intralaminar damage zone (2) are not easily observedvisually. To overcome the di�culties in detecting theintralaminar damage zones (2) in non-transparent com-posite specimens, ultrasonic techniques were used in thisresearch to generate images of the damage zones incarbon-®bre/epoxy Ciba-Geigy XAS/914 Iosipescu spe-cimens. The ultrasonic image presented in Fig. 26clearly shows the location and size of the intralaminardamage zones. In particular, type 2 damage can beclearly seen on the left side of the notch-root axis (onthe side opposite to the inner loading block). In addi-tion, a notch-root split (1) and one internal axial crack(3) underneath the notch-root can also be observed.Neither the crush zones (4) nor the axial splits near
the notches (1) is associated with the intralaminar shear-
failure process. However, the intralaminar damagezones (2) and axial cracks (3) are caused by the localbiaxial shear dominated stresses in the specimen gagesection. It can be seen from the numerical data in Figs.24 and 25, that the stress distribution in the specimenwithout the notch-root splits is biaxial with large shearand transverse tensile stresses on the left side of thenotch-root axis. For the specimen with the notch-rootsplits, the stress ®eld on both sides of the notch-rootaxis is always shear/transverse compression with thecompressive stresses on the left side lower than on theside of the inner loading block. The data in Figs. 24 and25 clearly demonstrate that the intralaminar failureprocess in the specimen gage section before the onset ofthe notch-root splits has to be controlled by shear andtransverse tension. After the split formation, the failureprocess in this region should be controlled by shear andtransverse compression. It can be expected that the for-mation of intralaminar cracking along the ®bers underthe shear/transverse tension condition should be sig-ni®cantly easier than under the shear/compression con-dition. Signi®cantly longer cracks should be formed in aunidirectional composite under shear/transverse tensionthan under shear/transverse compression conditionssince their propagation along the ®bers will be morerestricted in the presence of large compressive transversestresses. Therefore, the axial cracks in the specimen gagesection (type 3) are most likely caused by the localshear/transverse tension stresses in the specimens beforethe notch-root splitting occurs which propagate afterthe splitting as a result of the sudden increase of thenormal compressive stresses along the ®bers (see Fig.21). The intralaminar damage zones near the notches(type 2) are generated by the local shear/transverse
Fig. 26. Ultrasonic C-scan image of the notch-root area of a carbon-
®bre/epoxy Iosipescu specimen.
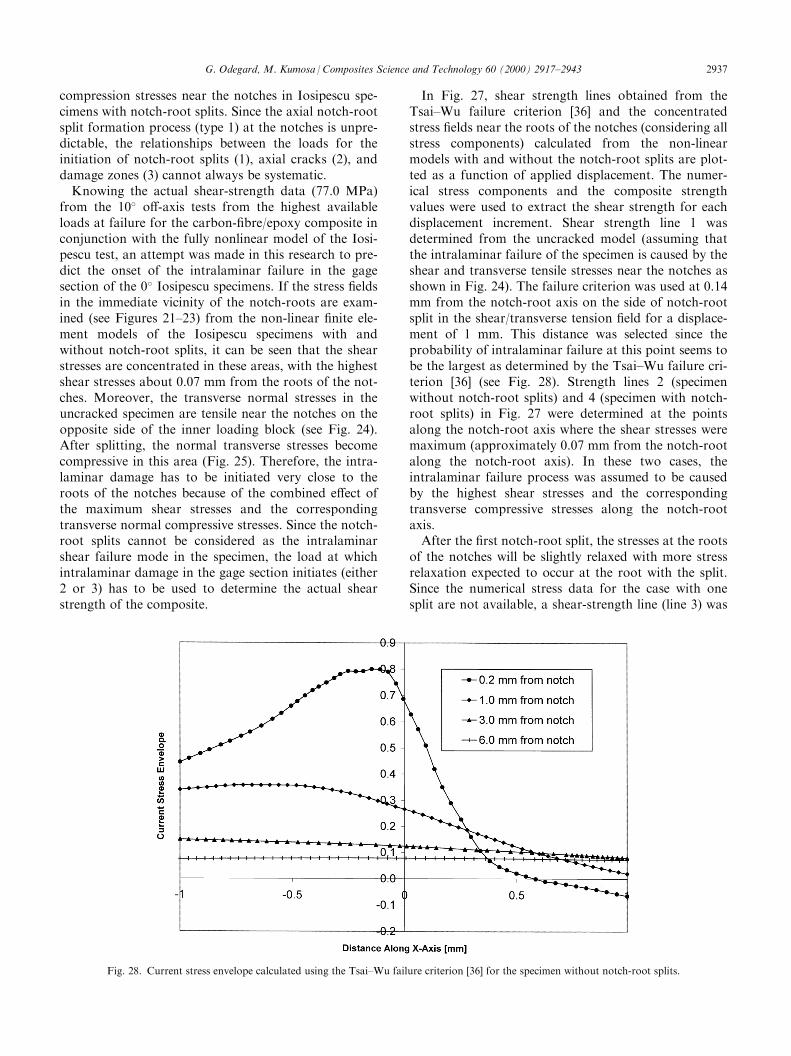
Fig. 27. Shear strength lines for the models with and without notch-root splits calculated over a 2-mm ®xture displacement.
2936 G. Odegard, M. Kumosa /Composites Science and Technology 60 (2000) 2917±2943
compression stresses near the notches in Iosipescu spe-cimens with notch-root splits. Since the axial notch-rootsplit formation process (type 1) at the notches is unpre-dictable, the relationships between the loads for theinitiation of notch-root splits (1), axial cracks (2), anddamage zones (3) cannot always be systematic.Knowing the actual shear-strength data (77.0 MPa)
from the 10� o�-axis tests from the highest availableloads at failure for the carbon-®bre/epoxy composite inconjunction with the fully nonlinear model of the Iosi-pescu test, an attempt was made in this research to pre-dict the onset of the intralaminar failure in the gagesection of the 0� Iosipescu specimens. If the stress ®eldsin the immediate vicinity of the notch-roots are exam-ined (see Figures 21±23) from the non-linear ®nite ele-ment models of the Iosipescu specimens with andwithout notch-root splits, it can be seen that the shearstresses are concentrated in these areas, with the highestshear stresses about 0.07 mm from the roots of the not-ches. Moreover, the transverse normal stresses in theuncracked specimen are tensile near the notches on theopposite side of the inner loading block (see Fig. 24).After splitting, the normal transverse stresses becomecompressive in this area (Fig. 25). Therefore, the intra-laminar damage has to be initiated very close to theroots of the notches because of the combined e�ect ofthe maximum shear stresses and the correspondingtransverse normal compressive stresses. Since the notch-root splits cannot be considered as the intralaminarshear failure mode in the specimen, the load at whichintralaminar damage in the gage section initiates (either2 or 3) has to be used to determine the actual shearstrength of the composite.
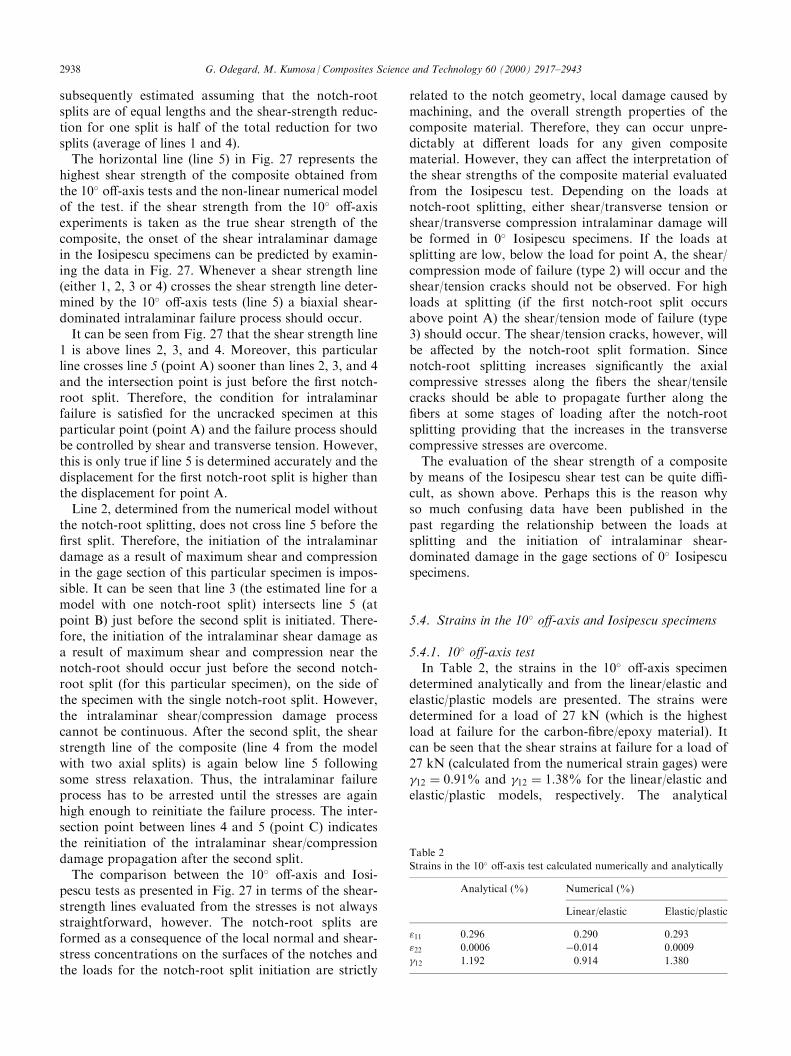
In Fig. 27, shear strength lines obtained from theTsai±Wu failure criterion [36] and the concentratedstress ®elds near the roots of the notches (considering allstress components) calculated from the non-linearmodels with and without the notch-root splits are plot-ted as a function of applied displacement. The numer-ical stress components and the composite strengthvalues were used to extract the shear strength for eachdisplacement increment. Shear strength line 1 wasdetermined from the uncracked model (assuming thatthe intralaminar failure of the specimen is caused by theshear and transverse tensile stresses near the notches asshown in Fig. 24). The failure criterion was used at 0.14mm from the notch-root axis on the side of notch-rootsplit in the shear/transverse tension ®eld for a displace-ment of 1 mm. This distance was selected since theprobability of intralaminar failure at this point seems tobe the largest as determined by the Tsai±Wu failure cri-terion [36] (see Fig. 28). Strength lines 2 (specimenwithout notch-root splits) and 4 (specimen with notch-root splits) in Fig. 27 were determined at the pointsalong the notch-root axis where the shear stresses weremaximum (approximately 0.07 mm from the notch-rootalong the notch-root axis). In these two cases, theintralaminar failure process was assumed to be causedby the highest shear stresses and the correspondingtransverse compressive stresses along the notch-rootaxis.After the ®rst notch-root split, the stresses at the roots
of the notches will be slightly relaxed with more stressrelaxation expected to occur at the root with the split.Since the numerical stress data for the case with onesplit are not available, a shear-strength line (line 3) was
Fig. 28. Current stress envelope calculated using the Tsai±Wu failure criterion [36] for the specimen without notch-root splits.
G. Odegard, M. Kumosa /Composites Science and Technology 60 (2000) 2917±2943 2937
subsequently estimated assuming that the notch-rootsplits are of equal lengths and the shear-strength reduc-tion for one split is half of the total reduction for twosplits (average of lines 1 and 4).The horizontal line (line 5) in Fig. 27 represents the
highest shear strength of the composite obtained fromthe 10� o�-axis tests and the non-linear numerical modelof the test. if the shear strength from the 10� o�-axisexperiments is taken as the true shear strength of thecomposite, the onset of the shear intralaminar damagein the Iosipescu specimens can be predicted by examin-ing the data in Fig. 27. Whenever a shear strength line(either 1, 2, 3 or 4) crosses the shear strength line deter-mined by the 10� o�-axis tests (line 5) a biaxial shear-dominated intralaminar failure process should occur.It can be seen from Fig. 27 that the shear strength line
1 is above lines 2, 3, and 4. Moreover, this particularline crosses line 5 (point A) sooner than lines 2, 3, and 4and the intersection point is just before the ®rst notch-root split. Therefore, the condition for intralaminarfailure is satis®ed for the uncracked specimen at thisparticular point (point A) and the failure process shouldbe controlled by shear and transverse tension. However,this is only true if line 5 is determined accurately and thedisplacement for the ®rst notch-root split is higher thanthe displacement for point A.Line 2, determined from the numerical model without
the notch-root splitting, does not cross line 5 before the®rst split. Therefore, the initiation of the intralaminardamage as a result of maximum shear and compressionin the gage section of this particular specimen is impos-sible. It can be seen that line 3 (the estimated line for amodel with one notch-root split) intersects line 5 (atpoint B) just before the second split is initiated. There-fore, the initiation of the intralaminar shear damage asa result of maximum shear and compression near thenotch-root should occur just before the second notch-root split (for this particular specimen), on the side ofthe specimen with the single notch-root split. However,the intralaminar shear/compression damage processcannot be continuous. After the second split, the shearstrength line of the composite (line 4 from the modelwith two axial splits) is again below line 5 followingsome stress relaxation. Thus, the intralaminar failureprocess has to be arrested until the stresses are againhigh enough to reinitiate the failure process. The inter-section point between lines 4 and 5 (point C) indicatesthe reinitiation of the intralaminar shear/compressiondamage propagation after the second split.The comparison between the 10� o�-axis and Iosi-
pescu tests as presented in Fig. 27 in terms of the shear-strength lines evaluated from the stresses is not alwaysstraightforward, however. The notch-root splits areformed as a consequence of the local normal and shear-stress concentrations on the surfaces of the notches andthe loads for the notch-root split initiation are strictly
related to the notch geometry, local damage caused bymachining, and the overall strength properties of thecomposite material. Therefore, they can occur unpre-dictably at di�erent loads for any given compositematerial. However, they can a�ect the interpretation ofthe shear strengths of the composite material evaluatedfrom the Iosipescu test. Depending on the loads atnotch-root splitting, either shear/transverse tension orshear/transverse compression intralaminar damage willbe formed in 0� Iosipescu specimens. If the loads atsplitting are low, below the load for point A, the shear/compression mode of failure (type 2) will occur and theshear/tension cracks should not be observed. For highloads at splitting (if the ®rst notch-root split occursabove point A) the shear/tension mode of failure (type3) should occur. The shear/tension cracks, however, willbe a�ected by the notch-root split formation. Sincenotch-root splitting increases signi®cantly the axialcompressive stresses along the ®bers the shear/tensilecracks should be able to propagate further along the®bers at some stages of loading after the notch-rootsplitting providing that the increases in the transversecompressive stresses are overcome.The evaluation of the shear strength of a composite
by means of the Iosipescu shear test can be quite di�-cult, as shown above. Perhaps this is the reason whyso much confusing data have been published in thepast regarding the relationship between the loads atsplitting and the initiation of intralaminar shear-dominated damage in the gage sections of 0� Iosipescuspecimens.
5.4. Strains in the 10� o�-axis and Iosipescu specimens
5.4.1. 10� o�-axis testIn Table 2, the strains in the 10� o�-axis specimen
determined analytically and from the linear/elastic andelastic/plastic models are presented. The strains weredetermined for a load of 27 kN (which is the highestload at failure for the carbon-®bre/epoxy material). Itcan be seen that the shear strains at failure for a load of27 kN (calculated from the numerical strain gages) were 12 � 0:91% and 12 � 1:38% for the linear/elastic andelastic/plastic models, respectively. The analytical
Table 2
Strains in the 10� o�-axis test calculated numerically and analytically
Analytical (%) Numerical (%)
Linear/elastic Elastic/plastic
"11 0.296 0.290 0.293
"22 0.0006 ÿ0.014 0.0009
12 1.192 0.914 1.380
2938 G. Odegard, M. Kumosa /Composites Science and Technology 60 (2000) 2917±2943
approach provided the shear strain somewhere betweenthe strains from the two numerical models. Balakrish-nan et al. [22] did not report any shear strain values intheir 10� o�-axis tests; therefore, there is no experi-mental comparison for the above numerical and analy-tical values. It was observed in the numerical modelsthat all three strain components were relatively uniformthroughout the gage section of the specimen. Similar tothe stress ®elds in Table 1, the strain ®elds in the ®bercoordinates are also biaxial.
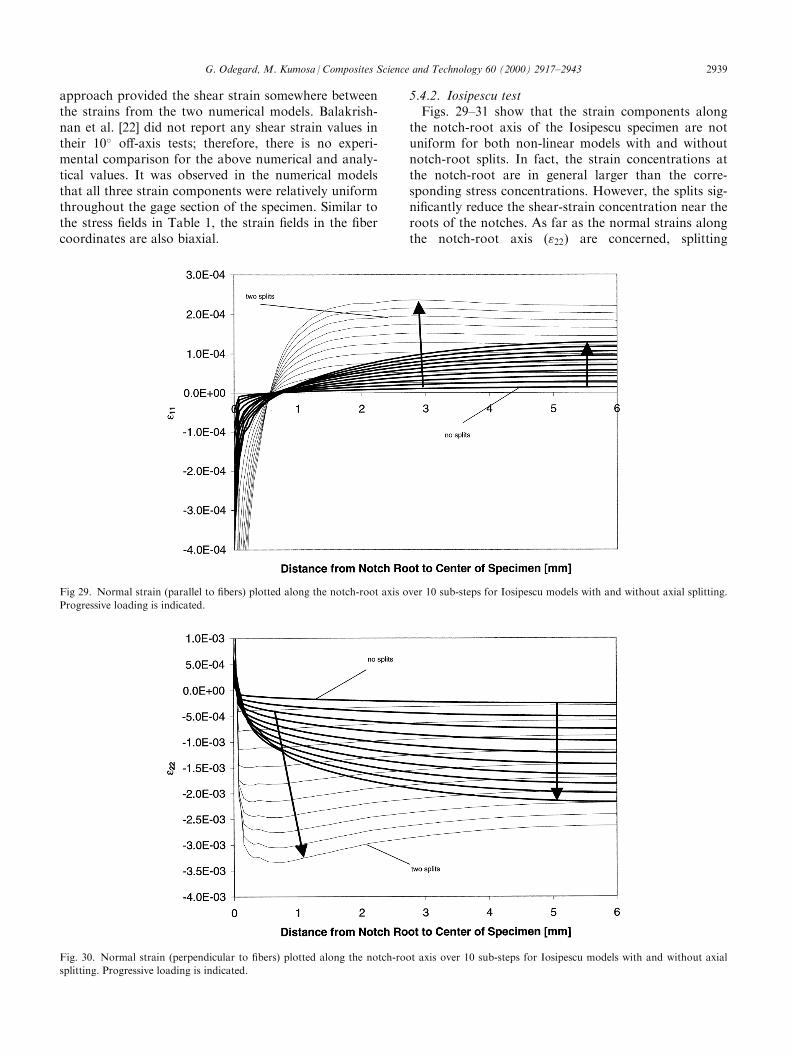
5.4.2. Iosipescu testFigs. 29±31 show that the strain components along
the notch-root axis of the Iosipescu specimen are notuniform for both non-linear models with and withoutnotch-root splits. In fact, the strain concentrations atthe notch-root are in general larger than the corre-sponding stress concentrations. However, the splits sig-ni®cantly reduce the shear-strain concentration near theroots of the notches. As far as the normal strains alongthe notch-root axis ("22) are concerned, splitting
Fig 29. Normal strain (parallel to ®bers) plotted along the notch-root axis over 10 sub-steps for Iosipescu models with and without axial splitting.
Progressive loading is indicated.
Fig. 30. Normal strain (perpendicular to ®bers) plotted along the notch-root axis over 10 sub-steps for Iosipescu models with and without axial
splitting. Progressive loading is indicated.
G. Odegard, M. Kumosa /Composites Science and Technology 60 (2000) 2917±2943 2939
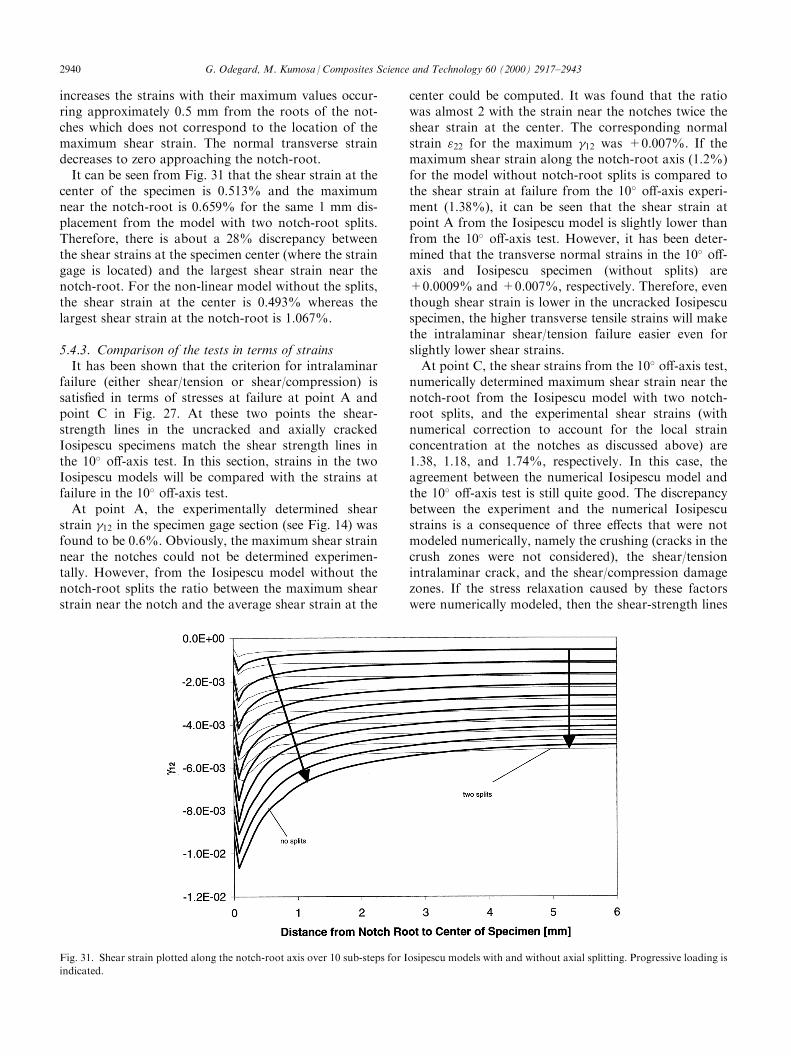
increases the strains with their maximum values occur-ring approximately 0.5 mm from the roots of the not-ches which does not correspond to the location of themaximum shear strain. The normal transverse straindecreases to zero approaching the notch-root.It can be seen from Fig. 31 that the shear strain at the
center of the specimen is 0.513% and the maximumnear the notch-root is 0.659% for the same 1 mm dis-placement from the model with two notch-root splits.Therefore, there is about a 28% discrepancy betweenthe shear strains at the specimen center (where the straingage is located) and the largest shear strain near thenotch-root. For the non-linear model without the splits,the shear strain at the center is 0.493% whereas thelargest shear strain at the notch-root is 1.067%.
5.4.3. Comparison of the tests in terms of strainsIt has been shown that the criterion for intralaminar
failure (either shear/tension or shear/compression) issatis®ed in terms of stresses at failure at point A andpoint C in Fig. 27. At these two points the shear-strength lines in the uncracked and axially crackedIosipescu specimens match the shear strength lines inthe 10� o�-axis test. In this section, strains in the twoIosipescu models will be compared with the strains atfailure in the 10� o�-axis test.At point A, the experimentally determined shear
strain 12 in the specimen gage section (see Fig. 14) wasfound to be 0.6%. Obviously, the maximum shear strainnear the notches could not be determined experimen-tally. However, from the Iosipescu model without thenotch-root splits the ratio between the maximum shearstrain near the notch and the average shear strain at the
center could be computed. It was found that the ratiowas almost 2 with the strain near the notches twice theshear strain at the center. The corresponding normalstrain "22 for the maximum 12 was +0.007%. If themaximum shear strain along the notch-root axis (1.2%)for the model without notch-root splits is compared tothe shear strain at failure from the 10� o�-axis experi-ment (1.38%), it can be seen that the shear strain atpoint A from the Iosipescu model is slightly lower thanfrom the 10� o�-axis test. However, it has been deter-mined that the transverse normal strains in the 10� o�-axis and Iosipescu specimen (without splits) are+0.0009% and +0.007%, respectively. Therefore, eventhough shear strain is lower in the uncracked Iosipescuspecimen, the higher transverse tensile strains will makethe intralaminar shear/tension failure easier even forslightly lower shear strains.At point C, the shear strains from the 10� o�-axis test,
numerically determined maximum shear strain near thenotch-root from the Iosipescu model with two notch-root splits, and the experimental shear strains (withnumerical correction to account for the local strainconcentration at the notches as discussed above) are1.38, 1.18, and 1.74%, respectively. In this case, theagreement between the numerical Iosipescu model andthe 10� o�-axis test is still quite good. The discrepancybetween the experiment and the numerical Iosipescustrains is a consequence of three e�ects that were notmodeled numerically, namely the crushing (cracks in thecrush zones were not considered), the shear/tensionintralaminar crack, and the shear/compression damagezones. If the stress relaxation caused by these factorswere numerically modeled, then the shear-strength lines
Fig. 31. Shear strain plotted along the notch-root axis over 10 sub-steps for Iosipescu models with and without axial splitting. Progressive loading is
indicated.
2940 G. Odegard, M. Kumosa /Composites Science and Technology 60 (2000) 2917±2943
(line 3 and 4) would cross the 10� o�-axis shear-strengthline (line 5) at higher displacements, which wouldincrease the numerical Iosipescu shear-strain valuegiven above. Considering the obvious limitations of thenon-linear Iosipescu models, it is not surprising that theexperimental strains are higher than the strains from the10� o�-axis and the numerical model. However, theabove three e�ects did not a�ect the analysis of strainsbefore the initiation of notch-root splits.Since point B for lines 3 and 5 in Fig. 27 was only
estimated and the strain values for a single notch-rootsplit model are not available, the Iosipescu and 10� o�-axis tests cannot be compared at this point with respectto strains.
5.5. Explanation of failure of unidirectional Iosipescuspecimens
The purpose of this research was ®nally to clarify theconfusion regarding the application of the Iosipescu testas recommended by ASTM standard (D 5379-93) forthe shear-strength measurements of unidirectional com-posites. The standard says ``In [0]n specimens tested inthe 1±2 plane, a visible crack typically develops at thenotch-root, causing a small load drop prior to ultimatefailure. The small load accompanying the notch-rootcrack is not considered the failure load: rather the loadthat accompanies failure in the test section shall be usedas the failure load.'' The problem is that the standarddoes not indicate which failure in the test section shouldbe considered as the shear failure. It has been shown inthis research that the intralaminar shear/tension failurenear the roots of the notches before notch-root splittingand the shear/compression failure after the formation ofthe axial splits can be taken as the predominantly shearfailure mode in unidirectional Iosipescu specimens. Thishas been accomplished by performing very detailed non-linear ®nite-element computations of the test consider-ing the actual non-linear behavior of the compositematerial. Very close agreements between the shear fail-ure of a unidirectional carbon-®bre/epoxy compositeobtained from two independent tests (10� o�-axis andunidirectional Iosipescu) have been achieved in terms ofstresses and strains. It has been shown that the shearstrength determined from the Iosipescu test closelymatches the strength determined from the 10� o�-axisexperiments.The shear failure of unidirectional 0� Iosipescu speci-
mens is associated with the formation of either axialcracks in the gage section near the notches of the speci-men before the formation of notch-root splits due toshear/tension or small intralaminar shear/compressiondamage zones which propagate from the roots of thenotches slightly away from the notch-root axis after theformation of notch-root splits. The shear/tension cracksshould form near the notches in the specimens without
notch-root splits just before the initiation of the ®rstsplit (at point A in Fig. 27). After notch-root splittingthe most favorable intralaminar failure process near thenotch-root with the split is the formation of the shear/compression damage zones near the notch (points B andC in Fig. 27). Since shear/compression damage is muchmore di�cult to form than shear/tension damagebecause of the higher compressive transverse strengththan the transverse tensile strength and the closing ofmicro-cracks in compression, it could be expected thatthe length of intralaminar cracks caused by shear/ten-sion should be signi®cantly larger than the size of crackscaused by shear/compression. Therefore, the damagezones (2 in Fig. 2) consisting of short cracks along the®bers must be formed under the shear/compressionconditions either between the axial splits (at the notchwith splitting) or above the second split. The muchlonger cracks in the gage section beneath the notch-root(3 in Fig. 2) must be generated due to the combinede�ect of the shear and transverse tension stresses andtheir subsequent propagation will be a�ected by thenotch-root split formation. However, axial cracks nearthe notches can also occur after the ®rst split at thenotch without the notch-root split.It has been shown by Kumosa and Hull [13] that the
intralaminar damage zones (2 in Fig. 2) propagate in thedirection slightly way from the notch-root axis on thesides of the axial splits. This can also be seen in Figs. 3and 4. Also, the shear/tension cracks are located under-neath the notch-root on the side of the notch-root split.The directions of the damage-zone propagation and thelocation of shear/tension crack initiation can beexplained by examining the local stress distributionsnear the notches from the fully non-linear numericalmodels with and without notch-root splits (see Figs. 24and 25). It can also be seen in Fig. 25 that the amount ofcompression near the notch on the side of the notch-root axis with the notch-root splits is lower than on theside of the loading block. That is the reason why theshear/compression zones propagate on this side of thespecimen. The propagation of the shear/compressionzones becomes more di�cult towards the specimen cen-ter since the shear and compressive stresses decreasesigni®cantly in this direction for a given applieddisplacement (see Fig. 25).The initiation of the shear/tension cracks (3 in Fig. 2)
must occur also on the side of the specimen with thenotch-root split before the split initiation since the nor-mal stresses on the inner block side are compressive (seeFig. 24). Their initiation further away from the notch-root towards the specimen center is more di�cult sincethe magnitudes of the shear and transverse tensile stres-ses in this direction decrease for a given displacement.The interpretation of the intralaminar shear domi-
nated failure process in the 0� Iosipescu specimens asshown in Fig. 27 will be changed if the splits occur at
G. Odegard, M. Kumosa /Composites Science and Technology 60 (2000) 2917±2943 2941
other loads. There are several possible combinations ofthe initiation of type 2 and type 3 cracking dependingon loads at notch-root splitting and the overall strengthproperties of the unidirectional composite material.Moreover, if crushing is signi®cant at low loads it willalso signi®cantly a�ect the stress distributions in eitherspecimen with or without notch-root splits and thus the®nal determination of the shear strength.The proposed non-linear failure model of 0� uni-
directional Iosipescu specimens has its limitations. Inparticular, the e�ect of crushing near the loading blockson the stress distributions was not adequately addres-sed. The plastic deformation of the composite within thecrush zone was modeled without considering the pre-sence of either interlaminar or intralaminar crackswithin the zones. These cracks (if present) must furtherrelax the overall stresses in the specimens. In addition,the presence of the shear/tension cracks and shear/compression damage zones in the gage section was alsonot considered in the non-linear models of the speci-mens. Finally, the proposed model of failure in the 0�
unidirectional carbon-®bre/epoxy Iosipescu specimen isonly true if the shear strength of the composite is accu-rately determined from another test. In this particular case,the highest available shear strength data for the compositefrom the 10� o�-axis test were employed to explain theintralaminar failure process in the Iosipescu specimens.If the Iosipescu shear test is used for the shear-
strength determination of unidirectional composites thedamage at the roots of the notches and its relation tothe split formation and the initiation of signi®cantcrushing should be continuously monitored. The stress®eld for the specimen (with the correct non-linearmaterial properties for the composite) must then bedetermined numerically. The problem is that intralami-nar failure is very di�cult to monitor during testing,especially in non-transparent unidirectional composites.Also, the actual nonlinear material behavior must bedetermined using other tests (for example the 10� o�-axis test). This makes the Iosipescu shear test very di�-cult and almost impractical if applied for the shearstrength determination of unidirectional composites.
6. Conclusions
1. It has been shown in this research that the 10� o�-axis and Iosipescu shear tests can be successfully used todetermine the shear-strength properties of unidirec-tional composites. This can only be accomplished iffully non-linear ®nite-element computations of the testsare performed which take into account the actual non-linear material behavior of a unidirectional composite.In particular, the Iosipescu shear test must be modeledwith three non-linearities, namely boundary contact,geometric, and material non-linearities.
2. The stresses and strains at failure for the Iosipescuand 10� o�-axis tests are in almost perfect agreement ifeither the fully non-linear models of the Iosipescu spe-cimen with or without axial splits are used. This isdetermined by the relationship between the notch-rootsplit formation and the initiation of intralaminardamage zones (either type 2 or type 3) at the roots of thenotches. If the damage zones are formed above the sec-ond notch-root split the non-linear model with two axialsplits should be used. However, if the intralaminardamage at the notch-root occurs before the initiation ofthe ®rst notch-root split the non-linear model withoutsplits should be used. In the case of the damage occur-ring between the splits the shear strength can beapproximated by using the average of the two models.In either case the obtained shear strength results shouldbe veri®ed and compared with another shear test forunidirectional composites. The 10� o�-axis test could beused for this purpose only if a signi®cant number oftests are performed. The highest loads at failure thenshould be used to determine the shear strength. This willpotentially minimize severe e�ects of specimen machin-ing and gripping, especially in the case of very brittlecomposites.3. To obtain the shear strength of a unidirectional
composite with the Iosipescu shear test the intralaminardamage near the roots of the notches should be con-tinuously monitored during testing. The critical loadsfor the initiation of the damage with respect to the loadsat splitting should be determined. Then, an appropriate®nite-element model should be used to determine thestresses and strains at failure near the roots of the not-ches. The ®rst intralaminar crack to form very close thenotch-root should be considered for the shear strengthdetermination. Since the stress ®elds in this area arealways biaxial, a multi-axial failure criterion should beused to extract the actual shear strength.
Acknowledgements
This research was supported by the National ScienceFoundation under grant CMS-9696160. The authorswould like to thank W.N. Cobb of the University of Den-ver Research Institute for his help in obtaining Fig. 26.
References
[1] Swanson SR, Messick M, Toombes GR. Comparison of torsion
tube and Iosipescu in-plane shear test results for a carbon ®bre-
reinforced epoxy composite. Composites 1985;16(3):220±4.
[2] Lee S, Munro M. Evaluation of in-plane shear test methods for
advanced composite materials by the decision analysis technique.
Composites 1986;17(1):13±22.
[3] Pierron F, Vautrin A. The 10� o�-axis tensile test: a critical
approach. Composites Science and Technology 1996;56:483±8.
2942 G. Odegard, M. Kumosa /Composites Science and Technology 60 (2000) 2917±2943
[4] Adams DF, Lewis EQ. Experimental assessment of four compo-
site material shear test methods. Journal of Testing and Evalua-
tion 1997;25(2):174±81.
[5] Iosipescu N. New accurate procedure for single shear testing of
metals. Journal of Materials 1967;2(3):537±66.
[6] Adams DF, Walrath DE. Iosipescu shear properties of SMC com-
posite materials. In: Composite materials: testing and design (Sixth
Conference) (ASTMSTP 787). Philadelphia: ASTM, 1982. p. 19±33.
[7] Adams DF, Walrath DE. Further developments of the Iosipescu
shear test method. Experimental Mechanics 1987a;27(2):113±9.
[8] Adams DF, Walrath DE. Current status of the Iosipescu shear
test method. Journal of Composite Materials 1987b;21:494±507.
[9] Walrath DE, Adams DF. The Iosipescu shear test as applied to
composite materials. Experimental Mechanics 1983;23(1):105±10.
[10] Barnes JA, Kumosa M, Hull D. Theoretical land experimental
evaluation of the Iosipescu shear test. Composites Science and
Technology 1987;28:251±68.
[11] Broughton WR, Kumosa M, Hull D. Analysis of the Iosipescu
shear test as applied to unidirectional carbon-®ber reinforced
composites. Composites Science and Technology 1990;38:299±325.
[12] Ho H, Morton J, Farley GL. Non-linear numerical analysis of
the Iosipescu specimen for composite materials. Composites
Science and Technology 1994;50:355±65.
[13] Kumosa M, Hull D. Mixed-mode fracture of composites using
Iosipescu shear test. International Journal of Fracture
1987;35:83±102.
[14] Morton J, Ho H, Tsai MY, Farley GL. An evaluation of the
Iosipescu specimen for composite materials shear property mea-
surement. Journal of Composite Materials 1992;26(5):708±50.
[15] Odegard G, Kumosa M. Elasto-plastic analysis of the Iosipescu
shear test. Journal of Composite Materials 1999;33(21):1981±2001.
[16] Odegard G, Searles K, Kumosa M. A critical examination of the
Iosipescu shear test as applied to 0� unidirectional composite
materials. Mechanics of Composite Materials and Structures
1999;6(3):229±56.
[17] Pierron F, Vautrin A. Measurement of the in-plane shear
strength of unidirectional composites with the Iosipescu test.
Composites Science and Technology 1997;57:1653±60.
[18] Kumosa M, Han Y. Non-linear ®nite element analysis of Iosi-
pescu specimens. Composites Science and Technology
1999;5:561±73.
[19] Chamis CC, Sinclair JH. Ten-deg o�-axis test for shear properties
in ®ber composites. Experimental Mechanics 1977;17(9):339±46.
[20] Pindera MJ, Herakovich CT. Shear characterization of unidirec-
tional composites with the o�-axis tension test. Experimental
Mechanics 1986;26(1):103±12.
[21] Sun CT, Chung I. An oblique end-tab design for testing o�-axis
composite specimens. Composites 1993;24(8):619±23.
[22] Balakrishnan MV, Bansal B, Kumosa M. Biaxial testing of
unidirectional carbon±epoxy composite using biaxial Iosipescu
test ®xture. Journal of Composite Materials 1997;31(5):486±
508.
[23] Hill R. A theory of the yielding and plastic ¯ow of anisotropic
metals. In: Proceedings of Royal Society of London, London,
1948. p. 281±97.
[24] Gri�n OH, Kamat MP, Herakovich CT. Three dimensional
inelastic ®nite element analysis of laminated composites. Journal
of Composite Materials 1981;15:543±60.
[25] Spencer AJM. Plasticity theory for ®bre-reinforced composites.
Journal of Engineering Mathematics 1992;26:107±18.
[26] Sun CT, Chen JL. A simple ¯ow rule for characterizing nonlinear
behavior of ®ber composites. Journal of Composite Materials
1989;23(10):1009±20.
[27] Hansen AC, Blackketter DM, Walrath DE. An invariant-based
¯ow rule for anisotropic plasticity applied to composite materials.
Journal of Applied Mechanics 1991;58(4):881±8.
[28] Chen JL, Sun CT. A plastic potential function suitable for ani-
sotropic ®ber composites. Journal of Composite Materials
1993;27(14):1379±90.
[29] Zhao YH, Weng GJ. Theory of plasticity for a class of inclusion
and ®ber-reinforced composites. In: Micromechanics and inho-
mogeneity: the Toshio Mura 65th Anniversary Volume. New
York: Springer-Verlag. 1990.
[30] Voyiadjis GZ, Thiagarajan G. An anisotropic yield surface model
for directionally reinforced metal-matrix composites. Interna-
tional Journal of Plasticity 1995;11(8):867±94.
[31] Mendelson A. Plasticity: theory and application. New York:
Macmillan, 1968.
[32] Spencer AJM. Theory of invariants. In: Continuum physics vol.
I. New York: Academic Press, 1971. p. 240±353.
[33] Bansal A, Kumosa M. Experimental and analytical studies of
failure modes in Iosipescu specimens under biaxial loadings.
Journal of Composite Materials 1995;29(3):334±58.
[34] Odegard G, Searles K, Kumosa M. Non-linear analysis of woven
fabric-reinforced graphite/PMR-15 composites under shear-
dominated biaxial loads. Mechanics of Composite Materials and
Structures 2000;7(2):129±52.
[35] Adams DF, Lewis EQ. Experimental strain analysis of the Iosi-
pescu shear test specimen. Experimental Mechanics
1995;35(4):352±60.
[36] Tsai SW, Wu EM. A general theory of strength for anisotropic
materials. Journal of Composite Materials 1971;5:58±80.
[37] ASM Committee on Forms and Properties of Composite Mate-
rials. High-strength medium-temperature thermoset matrix com-
posites. In: Composites, engineered materials handbook, vol. 1.
Metals Park (OH): ASM International, 1987. p. 399±415.
G. Odegard, M. Kumosa /Composites Science and Technology 60 (2000) 2917±2943 2943