Embed Size (px)
Citation preview

1
Determination of sediment phosphorus concentrations in St. Albans
Bay, Lake Champlain: Assessment of internal loading and seasonal
variations of phosphorus sediment-water column cycling
Final Report
09-30-2005
By Gregory Druschel, Aaron Hartmann, Rachel Lomonaco, and Ken Oldrid
University of Vermont
Department of Geology
180 Colchester Avenue
Burlington, VT 05405
Prepared for
Vermont Agency of Natural Resources
103 South Main St.
Waterbury, Vermont 05671

2
TABLE OF CONTENTS:
List of Tables 4
List of Figures 5
Acknowledgements 7
SECTION 1 – EXECUTIVE SUMMARY 8
SECTION 2 – INTRODUCTION 11
2.1. Problem description at St. Albans Bay 11
2.2. Phosphorus mobility associated with redox processes and 11
mineralogy changes
2.3. Summary of previous work on nutrients in St. Albans Bay 14
SECTION 3 - STUDY DESCRIPTION 14
3.1. Goals of this study 14
3.2. Description of study sites 15
3.3. Description of analytical techniques 16
SECTION 4 - SEASONAL MEASUREMENTS OF PHOSPHORUS, 20
IRON, MANGANESE
4.1. Electrochemical 20
4.2. Weather data 22
4.3. Overlying water chemistry data 23
4.4 Sediment extractions 25
4.5. Statistical analysis 31
SECTION 5 – ST. ALBANS BAY SEDIMENT SAMPLING AND 33
ASSESSMENT OF PHOSPHORUS LOAD
5.1. Sediment extractions 33
5.2. Potentially bioavailable inorganic phosphorus 34
5.3. Statistical analysis 36
5.4. Historical profile information 37
5.5. Historical comparison of basin samples 39
SECTION 6 - SUMMARY AND CONCLUSIONS 43
SECTION 7 – REFERENCES 45

3
APPENDIX A – TABULATED SEASONAL DATA
APPENDIX B – TABULATED BASIN DATA
APPENDIX C – TABULATED HISTORICAL COMPARISONS
APPENDIX D – RAW DATA COMPILATION

4
LIST OF TABLES
Table 1 – GPS logged locations of all sampling sites……………………………………15
Table 2 – Sediment extraction methods………………………………………………….18
Table 3 – Water column data…………………………………………………………….23
Table 4 – Mean Total Phosphorus data, Station 40, for 1992-2003 and 2004…………..23
Table 5 – Averaged data for Fe, Mn, P extracted from seasonal cores………………….27
Table 6 – Correlation coefficients for ascorbic acid extracted P with Mn and Fe……....30
Table 7 – Averages, minimums, maximums for cores study sections…………………..33
Table 8 – Total phosphorus load calculations…………………………………………...35
Table 9 – Correlation coefficients for all basin samples P-Mn and P-Fe……………….36

5
LIST OF FIGURES
Figure 1 – Depiction of processes governing a redox front………………………….…11
Figure 2 – Map of St. Albans Bay with sampling sites………………………………....14
Figure 3 – Selected porewater profiles from voltammetric analysis…………………...21
Figure 4 – Weather data from May 1 through September 30, 2004…………………....20
Figure 5 – Phosphorus in waters of St. Albans Bay, 2004 sampling by DEC………….24
Figure 6 – P and Fe concentrations (Ascorbic acid extractions) for seasonal samples…25
Figure 7 – P, Mn, and Fe concentrations (HCl extractions) for seasonal samples….…..25
Figure 8 - P concentrations (NaOH extractions) for seasonal samples………………....26
Figure 9 – P concentrations (HCl extractions) for top 2 cm of seasonal samples………26
Figure 10 – Profiles for Fe, Mn, P concentrations (Ascorbic acid and NaOH extracted) of
seasonal samples…………………………..…………………………..………….……..27
Figure 11 - Profiles for Fe, Mn, P concentrations (HCl and NaOH extracted) of seasonal
samples………………………………………………………………….…………..…..27
Figure 12 – Seasonal Fe concentrations plotted with Chlorophyll-A data……….......…29
Figure 13 – Seasonal Mn concentrations plotted with Chlorophyll-A data………….…29
Figure 14 – Profile of averaged total Fe, Mn, and P data for basin samples……………37
6
Figure 15 – Generalized sediment profile diagram……………..………………………38
Figure 16 – Comparison diagram 2004 – 1992………...………………………………..41
Figure 17 – Comparison diagram 2004 – 1982………...………………………………..41
Figure 18 – Comparison diagram 1982 – 1992………...………………………………..42
7
ACKNOWLEDGEMENTS
GKD would like to acknowledge the openness, inquisitiveness, and dedication of the
people of St. Albans, VT who have pressed to better understand the water quality issues
in St. Albans Bay. The St. Albans Area Watershed Association and Dan Lindley, town
Administrator of St. Albans, are especially recognized for their support of this project.
We gratefully acknowledge the assistance of the Vermont Department of Environmental
Conservation for assisting with the collection of the 43 basin-wide cores as well as
collecting additional samples and providing data from Site 40 in St. Albans Bay. The
author acknowledges the assistance of several students who played a significant role in
sample collection and testing for this project: Aaron Hartmann, who has headed the
seasonal aspect of this project; Rachel Lomonaco, Greg Lorenson, and Deb Schulman
who assisted with sample collection and voltammetric measurements, and Ken Oldrid,
who tirelessly worked in the fall processing sample extractions. Finally, GKD wishes to
thank Eric Smeltzer (VT DEC), Mary Watzin (UVM), Jack Drake (UVM), Andrea Lini
(UVM), and Paul Bierman (UVM) for their time towards discussions on a number of
issues related to this project.

8
SECTION 1 – EXECUTIVE SUMMARY
This study was undertaken to determine the current quantity of phosphorus in the
sediments of St. Albans Bay, Vermont, USA, and to address the role of seasonal
variations related to changing redox conditions and mineralization on phosphorus cycling
and mobility in those sediments.
43 separate cores were collected in the first week of August, 2004 with the assistance of
the Vermont Department of Environmental Conservation to assess the overall
concentration and spatial distribution of phosphorus, iron, and manganese in the
sediments of St. Albans Bay. These cores were sectioned into 0-1, 1-2, 2-3, 3-4, 4-5, 5-8,
and 8-12 cm aliquots and their porosity, organic content, soluble reactive phosphorus
(NH4Cl extracted), mineralizable phosphorus (NaOH extracted), residual inorganic
phosphorus (HCl extracted), acid-extractable iron and manganese (HCl extracted),
amorphous Fe and manganese (ascorbic acid extracted), reactive phosphorus (ascorbic
acid extracted), and total iron, manganese, and phosphorus (aqua regia extracted)
determined. Statistical analysis of the data indicates that the mobility of phosphorus is
tied to the mobility of iron and manganese, especially in the top 2 cm of sediment. The
total amount of phosphorus tied up in the bay is significant; in the top 10 cm there are
approximately 1200 tons of phosphorus associated with amorphous iron and manganese
oxyhydroxide minerals, and over 4000 tons of total phosphorus. An original purpose of
the study was to compare phosphorus concentrations in cores collected during 2004 with
cores sampled by previous studies in 1982 and 1992. However, comparison to previous
studies in a direct, quantitative fashion was determined to be inappropriate due to
problems with how sampling results would be influenced by redox front positions and to
potential mobility of phosphorus collected by the various studies at different points in
time during the summer season, potential problems with analytical procedures in older
reports not comparable to newer, more accurate methods employed here, spatial
heterogeneities in the system, and indeterminate sedimentation rates for different parts of
the bay.

9
A total of 10 separate sampling excursions were undertaken between late May and early
October of 2004 in order to gather data to determine the seasonal changes in redox
chemistry within the top few centimeters of sediments using in situ electrochemical
methods to investigate porewater iron, manganese, sulfur, and oxygen chemistry.
Sediment core samples were additionally sectioned and analyzed to determine the
distribution of iron, manganese and phosphorus for a comparative study looking at the
relative mobility of these elements over this time period. It is well known that Fe and Mn
oxyhydroxide minerals strongly sorb phosphorus to their surfaces (Shenker et al., 2005;
van der Zee et al., 2003; Roden and Edmonds, 1997).
When these minerals are reduced due to conditions in the sediments becoming more
anoxic, the sorbed phosphorus can be released into adjacent porewaters where it may
diffuse and potentially reach the overlying water column - where it would serve as a
nutrient source, potentially driving algal activity. Electrochemical results show that the
comparatively colder and windier conditions of summer 2004 kept iron oxyhydroxide
minerals in surficial sediments of the inner bay from being reduced, but that manganese
oxyhydroxide minerals were completely reduced up to the sediment-water interface and
soluble Mn was observed in the water column. This observation is coupled with
statistical analysis of the sediment core chemistry from our seasonal site which suggests
that phosphorus mobility is strongly correlated with changes in iron and manganese
mineralization. While manganese minerals can release significant Mn into the porewater
and overlying water columns, the continued presence of oxidized iron oxyhydroxides
through the summer should have effectively contained any significant phosphorus
released from manganese oxyhydroxide minerals. However, in summers where
conditions may select for more reducing conditions to drive iron reduction (generally
higher temperatures, less turbulence from wind shear, and greater photosynthetic
activity), or in parts of the bay where conditions select for greater anoxia, the redox front
may move well into the water column, transform a more significant proportion of
oxidized iron and manganese oxyhydroxide minerals, and release substantial phosphorus
into the overlying water column.
10
In summary, the results of this study indicate that there remains a substantial reservoir of
phosphorus in the sediments of St. Albans Bay which is mobile within the sediment
column due to changing redox front positions and associated changes in iron and
manganese mineralization. This sediment reservoir has the potential to contribute
phosphorus to the water in the bay for a long period of time into the future; flux of
sediment into the overlying water column will be at least partly based on highly reducing
events which may vary considerably in space and time.

11
2. INTRODUCTION
2.1. Problem description: St. Albans Bay: Sediment-bound phosphorus of St. Albans Bay
has been a problematic source of phosphorus driving seasonal algal blooms and
eutrophication of an important water body for many years (Smeltzer, 2003). This internal
load of phosphorus in the sediments has been the subject of several studies attempting to
characterize the total amounts held in the sediments as well as the rate and mechanism(s)
of release to the water column (Ackerly, 1983; Martin et al., 1994; Smeltzer et al., 1994;
Cornwell and Owens, 1999). Martin et al. (1994) used the results of their field work,
compared to those done 12 years prior by Ackerly, to develop a predictive model for the
rate at which phosphorus would naturally be removed from the sediments through a
combination of exchange out of the sediment and mass transport into the larger Lake
Champlain system. This projected self-cleaning effect has not proven to be accurate, in
that phosphorus concentrations in the bays and the occurrence of algal blooms has not
decreased as projected (Smeltzer, 2003). In light of this, we have undertaken this study
to both assess current P levels in the sediments of St. Albans Bay and to investigate
seasonal variations in redox properties and P levels in those sediments to better
understand the driving forces behind P mobility in this environment.
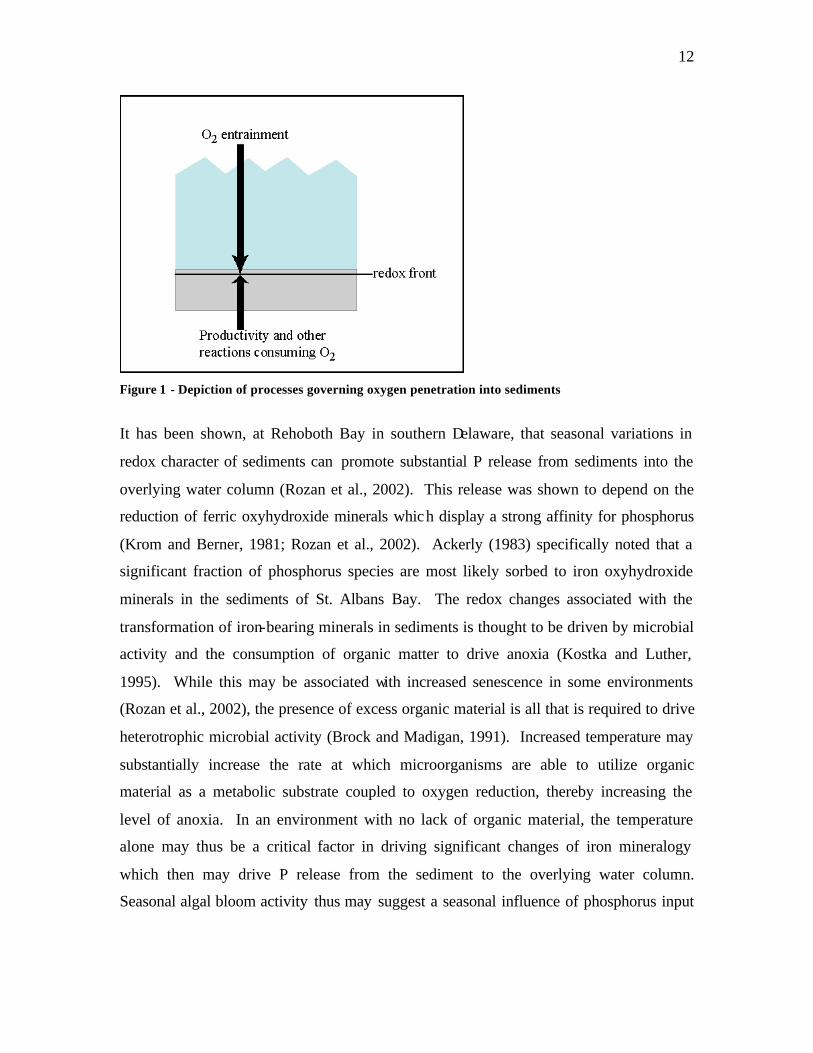
2.2. Phosphorus mobility associated with redox processes and mineralogy changes. The
competition between O2 entrainment into the water column (a function of both
photosynthesis and wind creating turbulence and increased O2 mixing of the water
column; Langmuir, 1997) and depletion as a result of primary productivity and
interaction with reduced species governs where the redox front in the sediment will be at
any particular time (Figure 1). This redox front describes where there is a transition from
oxic conditions (presence of significant O2) to anoxic conditions (no O2 and the presence
of reduced forms of iron, manganese, and/or sulfur).
12
Figure 1 - Depiction of processes governing oxygen penetration into sediments
It has been shown, at Rehoboth Bay in southern Delaware, that seasonal variations in
redox character of sediments can promote substantial P release from sediments into the
overlying water column (Rozan et al., 2002). This release was shown to depend on the
reduction of ferric oxyhydroxide minerals which display a strong affinity for phosphorus
(Krom and Berner, 1981; Rozan et al., 2002). Ackerly (1983) specifically noted that a
significant fraction of phosphorus species are most likely sorbed to iron oxyhydroxide
minerals in the sediments of St. Albans Bay. The redox changes associated with the
transformation of iron-bearing minerals in sediments is thought to be driven by microbial
activity and the consumption of organic matter to drive anoxia (Kostka and Luther,
1995). While this may be associated with increased senescence in some environments
(Rozan et al., 2002), the presence of excess organic material is all that is required to drive
heterotrophic microbial activity (Brock and Madigan, 1991). Increased temperature may
substantially increase the rate at which microorganisms are able to utilize organic
material as a metabolic substrate coupled to oxygen reduction, thereby increasing the
level of anoxia. In an environment with no lack of organic material, the temperature
alone may thus be a critical factor in driving significant changes of iron mineralogy
which then may drive P release from the sediment to the overlying water column.
Seasonal algal bloom activity thus may suggest a seasonal influence of phosphorus input

13
to the St. Albans Bay watershed tied to changing redox front positions through the
summer season.
Observation of these changing redox states in water and sediments requires
careful consideration of the tools and techniques used in assessing speciation changes for
oxygen, iron, sulfur, and manganese in the sediments and overlying water. It is
commonly accepted that redox disequilibrium is commonplace and results in erroneous
measurements of redox state with platinum ORP electrodes (Grenthe et al., 1992).
Oxygen probes are only sensitive to dissolved oxygen and do not work well in suboxic
environments or in sediments. Microelectrodes have been developed which are able to
measure O2, H2O2, Fe3+, Fe2+, H2S, HS-, S2O32-, Mn2+, Cu2+, and many other species in
situ and in real time (Brendel and Luther, 1995; Luther et al., 1999; Luther et al., 2003;
Druschel et al., 2003). These tools have been used in Lake Champlain to assess the
dynamics of redox speciation and their effect on porewater pH and pCO2 concentrations
(Cai et al., 2002). Rozan et al. (2002) combined the use of Au-amalgam microelectrodes
with sediment sampling and porewater extraction techniques to correlate the spatial
changes in Fe porewater speciation with changing sediment and porewater P
concentrations over time in Rehoboth Bay, Delaware.
2.3. Summary of previous work done in St. Albans Bay: The eutrophic conditions and
flux of nutrients into St. Albans Bay has seen considerable attention in the past 25 years.
Ackerly’s 1983 M.S. thesis was among the first reports on the phosphorus load contained
in the sediments of the bay. Ackerly found that increased phosphorus loading was
reflected in profiled gradients controlled by a combination of anthropogenic loading and
“microzone retention”. He hypothesized that the iron oxide fraction in the sediment did
not reflect trends with respect to HCl-extracted P, but did note several relationships of P
extracted other ways (NH4Cl and NaOH extracted) that suggest absorption to mineral
grains, including iron-rich organic muds. Ackerly’s report was followed up with the
1994 report from Martin et al., which repeated Ackerly’s sampling locations and
extraction methods. Martin et al. found that there was substantially less phosphorus in
the sediments of St. Albans Bay measured in 1992 than there was in 1982. This
conclusion noted that P loading to the bay had dropped off significantly with upgrades to

14
the St. Albans Waste Water Treatment Facility (WWTF) and the closure of the Hood
Dairy facility in 1986 and 1983, respectively. The response of the bay sediments was
subsequently modeled and the results extrapolated to predict that mean P levels in the
water column would drop to beneath the water quality goal of 17 µg/l by 1995. A report
by Smeltzer et al. (1994) looked more closely at modeling the loading and cycling of P in
the sediments of St. Albans Bay and modeled definitive links between sediment P release
and redox processes affected by temperature and wind. Cornwall and Owens (1999 and
HydroQual, Inc. 1999) next did a detailed study of a number of areas in Lake Champlain,
including St. Albans Bay, to look at processes of eutrophication and sediment P cycling.
Field studies (Cornwell and Owens 1999) noted higher rates of soluble P release rates
from the sediments associated with both microbial metabolic activity (noting specifically
metal oxide reduction leading to high soluble Fe and Mn concentrations). Modeling
exercises (HydroQual, Inc. 1999) were able to reproduce P dynamics in many areas of the
lake except in low oxygen environments such as St. Albans Bay. A lay monitoring
program at St. Albans Bay (Picotte 2002) and the monitoring program supported by the
Lake Champlain Basin program (DEC report 2004) have helped to create a database of
water column P concentrations
3. STUDY DESCRIPTION
3.1 Goals of this study: The goals of this study were twofold:
a. Assess the amount of phosphorus which is currently present in the sediments of
St. Albans Bay, and compare current amounts with levels measured during
previous studies conducted in 1982 and 1992, if appropriate.
b. Investigate seasonal changes in redox properties (the position of the redox
front, Figure 1) and determine if they may be linked to possible ways in which
phosphorus in the sediments may be made available to organisms in the water
column.
Comparison with previous studies (Ackerly, 1983 and Martin et al., 1994) is only
possible and appropriate if the overall amount of seasonal variation is negligible; i.e., if
there is any reason to think that P levels in the sediment may be variable due to

15
conditions that are not repeatable (like weather) then determining changes in P content of
the bay is not possible with any accuracy. Assessment of the phosphorus concentrations
present in the bay sediments combined with advances in understanding how phosphorus
may behave in the system will be of greater use to the community.
3.2. Description of Study Sites: 43 study sites in the inner, middle, and outer regions of
St. Albans Bay and the Stevens Brook wetland area were sampled in the first week of
August, 2004 (Figure 2 for map, Table 1 for specific locations catalogued by Global
Positioning System).
Figure 2 - Map showing study sites sampled in August 2004

16
Table 1 - GPS located positions of study sites sampled in August 2004
Site Lattitude Longitude Site Lattitude Longitude1 N44 47.400 W73 09.733 24 N44 47.967 W73 09.3172 N44 48.150 W73 09.067 25 N44 48.133 W73 08.8173 N44 48.517 W73 08.900 26 N44 47.150 W73 08.8834 N44 47.733 W73 08.833 27 N44 46.100 W73 10.6835 N44 46.621 W73 10.535 28 N44 49.317 W73 08.7506 N44 46.598 W73 10.155 29 N44 49.250 W73 08.4677 N44 46.386 W73 09.837 30 N44 49.217 W73 08.7008 N44 47.150 W73 09.683 31 N44 48.967 W73 08.7679 N44 46.900 W73 09.450 32 N44 49.000 W73 08.65010 N44 47.367 W73 10.117 33 N44 48.817 W73 08.81711 N44 47.647 W73 09.820 34 N44 48.783 W73 09.01712 N44 47.467 W73 09.383 35 N44 48.350 W73 09.16713 N44 47.317 W73 09.033 36 N44 48.333 W73 08.76714 N44 47.633 W73 09.167 37 N44 47.800 W73 08.48315 N44 47.933 W73 08.683 38 N44 47.967 W73 09.01716 N44 48.350 W73 09.033 39 N44 47.817 W73 09.18317 N44 49.200 W73 08.800 40 N44 47.817 W73 09.51718 N44 49.100 W73 08.850 41 N44 47.517 W73 08.73319 N44 48.883 W73 08.800 42 N44 47.167 W73 10.08320 N44 48.683 W73 09.067 43 N44 47.000 W73 10.38321 N44 48.617 W73 09.050 44 N44 46.233 W73 10.083
45 N44 46.400 W73 10.883
The study sites were reached using Vermont Department of Environmental Conservation
boats and the assistance of Pete Stangel during this sampling period. A seasonal site was
chosen close to site 16 and sampled over the course of the summer (between 06/23/04
and 10/07/04), accessed using a University of Vermont Department of Geology canoe
outfitted with an outrigger system. At least 2 duplicate cores were taken for each trip to
the seasonal site. The seasonal site was selected as a site whose position and depth were
likely to be strongly affected by the competing processes which govern the position of the
redox front (see Figure 1).
3.3. Description of analytical techniques:
Core Sampling. Sediment cores were collected in positions described above with a KB3
type (or Glew) gravity core sampler using a plastic liner tube 2.5” in diameter. The

17
sampler was rigged to take cores in water up to 100 ft depth, using a brass messenger to
trigger the seal and lead weights to drive the coring device into the sediment. Following
collection, the ends of the core tube were sealed with end caps and stored upright in a
cooler at approximate ambient bottom temperatures. The seasonal cores were brought
back to the lab and extruded under Ultra High Purity (UHP) Nitrogen flow using a piston
assembly attached to a stationary frame and sectioned as the cores emerge from the top at
0-1, 1-2, 2-3, 3-4, 4-5, 5-8, and 8-12 cm intervals using a PTFE coated spatula. The 43
sediment cores collected in August were extruded immediately after collection on site
(either on the boat or on shore) using identical techniques but without applied UHP
nitrogen. Sediment sections were collected in screw-top plastic tubes and stored for
analyses.
In situ electrochemistry. For the 2 seasonal sites we utilized Au-amalgam
microelectrodes prepared after the methods outlined in Brendel and Luther (1995) and
Luther et al. (2003). Briefly, 100 µm diameter gold wire was soldered to a shielded cable
and encased inside a drawn glass tube filled with WestMarine epoxy. The tip was
polished with a succession of diamond grits and plated with a thin film of mercury, which
was then amalgamated by applying a 9V potential vs. a platinum wire in 1 N NaOH.
The electrode was calibrated for O2, Fe2+, Mn2+, and H2S in the lab. A Pt counter
electrode and Ag/AgCl reference electrode are used in conjunction with the Au-amalgam
working electrode, which is lowered through the water and sediment in the sampled core
using an automated micromanipulator system (DLK-MAN1) integrated with the
potentiostat (DLK-60) and computer controller which drives the electrochemical
analyses. Voltammetric assessment of O2, H2O2, Fe2+, Fe3+, FeS(aq), H2S, HS-, SxOyn-,
Mn2+ was accomplished over 100 µm increments through the sediment-water interface
and extending through the top 3-4 cm of sediment, depending on the physical limitations
of driving the electrode through variably compacted sediment and the complete detection
of the redox properties which define the redox front. Measurements were made in real
time, using cyclic voltammetry measurements starting with an initial potential of -0.1V
held for 2 seconds, then scanned between -0.1V and -1.8V vs. Ag/AgCl at a rate of
1V/second.

18
Sediment Extractions. Sectioned sediment samples were processed and P extracted using
techniques identical to those used by Martin et al. (1994), except for total P extractions
for reasons described below. In summary, each sample sediment fraction was weighed
wet, dried at 105ºC for at least 48 hours, cooled in a dessicator and reweighed, then
ground with a ceramic mortar and pestle, sieved through a #140 sieve, and repartitioned
into fractions for extraction. Another aliquot of the sediment was ashed at 380ºC to
determine total organic content. Each dried sample was split into 0.25-0.5 g sections and
placed in 15ml tubes. One set up samples went through a sequential extraction, first
reacting on a rotator for at least 30 minutes with 1 N ammonium chloride (NH4Cl), the
supernatant collected and stored for analysis, and the solid then rinsed with 0.1 M KCl.
The same solid sample was then reacted with 1 M sodium hydroxide (NaOH) for at least
18 hours (again kept agitated by placing a sealed tube on a rotator), the supernatant
collected and stored for analysis, and the solid then rinsed with 0.1 M KCl. The same
solid sample was then reacted with 0.5 M HCl for at least 8 hours (again kept agitated by
placing a sealed tube on a rotator), the supernatant collected and stored for analysis, and
the solid then rinsed with 0.1 M KCl. This sequential extraction scheme ideally extracts
the soluble reactive P with the NH4Cl, mineralizable P with NaOH, and finally residual P
with HCl. The Fe and Mn will be very minimally extracted using the NH4Cl or NaOH
extractions, and acid-soluble fractions will be extracted with HCl. Another aliquot of
dried sediment was reacted with an Ascorbic Acid solution (made using 10 g sodium
citrate and 10 g sodium bicarbonate in 200 ml nitrogen-purged water, to which 4 g of
ascorbic acid is slowly added) for at least 24 hours (kept agitated by placing a sealed tube
on a rotator) before the supernatant was collected and stored for analysis. The ascorbic
acid extraction liberates reactive phosphorus in addition to amorphous iron and
manganese. A final aliquot of dried sediment samples underwent an aqua regia digestion
at 85ºC for at least 1 hour to dissolve all fractions containing P, Fe, and Mn. Aqua Regia
recovers total phosphorous, iron, and Manganese in sediment samples. This method was
tested for P, Fe, and Mn analysis against perchloric acid (85%), HCl-HNO3-H2O2 (Aqua
regia with 1% H2O2 addition), and nitric acid (18 M) digestion methods (both hot and

19
cold) and showed the greatest recovery and linearity of additions corresponding to the
range of values for these sediments. Table 2 summarizes the sediment extraction
techniques that were employed for both the large single sampling and the seasonal
samples. We did not use perchloric acid digestion for total P per the Martin et al. (1994)
study because in developing extraction and analytical procedures, we had better recovery
and fewer sample matrix interference effects using Aqua Regia extractions analyzed by
ICP-OES when compared to perchloric and nitric acid extractions. While these
differences in extraction methods may well be cause for some differences between the
past and previous studies, analytical techniques that were different likely contribute more
significantly to any differences between samples taken in 1992 or 1982 (as described in
extractant analysis section below). These extraction and analytical differences are likely
a small component of why there might be differences between samples collected in
different years (1982, 1992, 2004).
Parameter Extraction Method Reference
Total P HNO3 - HCl digestion at
85ºC
EPA 3050B
Soluble reactive P 1 N NH4Cl Williams et al. (1967)
Mineralizable P 1 N NaOH Jackson (1970)
Residual inorganic P 0.5 N HCl Williams et al. (1967)
Organic Matter Ignition at 380ºC Ackerly (1983)
Reactive P1
Amorphous Fe2
Ascorbic acid Anschutz et al. (1998)
Total Fe HNO3 - HCl digestion at
85ºC
EPA 3050B
Total Mn HNO3 - HCl digestion at
85ºC
EPA 3050B
Acid-extractable Fe
and Mn
0.5 N HCl Williams et al. (1967)
Table 2 – Sediment extraction methods and appropriate references 1 – Martin et al. (1994), called this P in extracts and digests 2 – Applied to seasonal samples and selected subset of other samples.

20
Extractant Analyses: Original plans to analyze phosphorus using ion chromatography
and colorimetric methods proved unfeasible due to the high concentrations of Fe in these
sediments which serve to interfere with the flow of eluent in ion chromatography and
interfere with color development in colorimetric methods. Phosphorus, iron, and
manganese for extractant samples were measured with Inductively Coupled Plasma –
Optical Emission Spectroscopy (ICP-OES) using a HY-Joriba Optima 2C ICP-OES
housed in the Department of Geology at the University of Vermont. Methods were
developed as part of this work to analyze these elements in aqua regia, ascorbic acid, and
HCl matrices, and P in NH4Cl and NaOH matrices. The samples were generally diluted
by 1:10 to 1:20 in water or matrix solution and placed in 15 ml falcon tubes in an
autosampler rack. The samples were aspirated into the plasma flame (at 10,000ºC) where
they are completely ionized, and the emission spectra collected using a monochromator
high resolution spectrophotometer. Emission lines were selected from a battery of
different possibilities for appropriate detection limit, linear response range, and minimal
interferences; lines used were: Fe 259.940, Mn 257.610, and P at 178.610 or 178.229.
Each analysis was done in triplicate with a check standard run every 10 samples to assess
instrument drift and determine baseline for quality control. Sample concentrations were
always insured to be within the linear, constrained ranges of the standards emp loyed, and
the mixed standards were matrix matched to ensure accurate determinations of each
element. All check standards were checked to be within 5% of their calibrated value, any
deviation from this and samples were re-run after calibration and a check of all optics.
SECTION 4 - SEASONAL MEASUREMENTS OF PHOSPHORUS,
IRON, MANGANESE
4.1 Seasonal sampling results: Seasonal samples of St. Albans Bay sediments from our
selected study site were analyzed by voltammetry and the redox front position was
observed to change over the course of the summer (Figure 3). The data points for each of

21
the points in each profile represented in figure 3 is determined from the voltammetry
analyses. Each profile depicts the concentration of oxygen, manganese (in Mn2+ form),
iron (as ferrous, Fe2+, or ferric, Fe3+ forms of iron), and iron sulfide clusters (which are
the predominantly observed chemical form of soluble reduced sulfur in these sediments)
as a measurement in nA, the current associated with each chemical species which reacts
at the electrode which is directly proportional to concentration. Profiles depict oxygen
(O2) depletion near the sediment/water interface (marked as 0 depth on these profiles), a
consequence of primarily biological activity which utilizes oxygen as an electron
acceptor and the copious organic matter in the sediments as substrate. When this oxygen
is consumed, bacterial species which can utilize alternate electron acceptors (essentially
breathing oxidized forms of manganese, iron, and sulfur for example) with organic matter
(as food) for metabolic energy are likely active in these sediments. The presence of
reduced manganese, iron, and sulfur in the sediments (seen as the increase of reduced Fe,
Mn, or FeS with greater depth in Fig. 3 profiles) indicates the presence and activity of
these organisms. The abiotic reactions which could generate these chemical species at
conditions similar to St.Albans Bay sediments are very slow. Note that these reactions
directly, or at least indirectly, cause dissolution or transformation of iron or manganese
oxyhydroxide minerals in these types of systems, and that where oxyhydroxide mineral
transformation is going on at any time is defined by the position of redox fronts in the
sediment profiles such as those presented in Figure 3.
Analyses indicate that even in the first electrochemically measured core on 06-23-04, the
sediments were anoxic very close to the sediment-water interface. Following this,
manganese reduction became more prevalent, with manganese reduction going through
the top of the sediment water interface in the samples from 07-26-04. While iron and
sulfate reduction were observed to occur in the porewaters from these sediments, notably
getting as high as 9 mm from the sediment-water interface in mid-August, at no time in
our sampling did either process breach the sediment-water interface. The apparent role of
manganese reduction in the sediments observed in the course of the summer caused us to
alter some of the original analysis plans to focus more on Mn relationships with respect
to phosphate levels as opposed to evaluating the role of iron sulfide mineralization.

22
6-23-04 Core 2 Profile 2
-35
-30
-25
-20
-15
-10
-5
0
5
10
0 20 40 60 80
Current (nA)
Dep
th (
mm
)
O2 (nA)
7-19-04 Core 1 Profile 1
-35
-30
-25
-20
-15
-10
-5
0
5
10
0 50 100Current (nA)
Dep
th (
mm
) Mn (nA)
O2 (nA)
Fe3+ (nA)
FeS (nA)
7-26-04 Core 2 Profile 1
-35
-30
-25
-20
-15
-10
-5
0
5
10
0 20 40 60 80Current (nA)
Dep
th (
mm
)
O2 (nA)
Mn (nA)
8-12-04 Core 1 Profile 1
-35
-30
-25
-20
-15
-10
-5
0
5
10
0 20 40 60 80Current (nA)
Dep
th (
mm
)
O2 (nA)
Mn (nA)
FeS (nA)
Fe3+ (nA)
9-13-04 Core 2 Profile 1
-35
-30
-25
-20
-15
-10
-5
0
5
10
-20 30 80
Current (nA)
Dep
th (
mm
)
O2 (nA)
Mn (nA)
FeS (nA)
Fe3+(nA)
Figure 3 - Profiles of porewater chemistry from voltammetric analysis of selected seasonal cores
4.2. Weather data: Given the potential importance of wind and temperature on the
positioning of the redox fronts in these systems (Figure 1) we have compiled weather

23
data from the closest monitoring station available (Burlington Airport). Data from
summer 2004, over the time span we sampled sites in Saint Albans Bay, are graphed in
Figure 4. Average and maximum daily temperatures are plotted as well as average daily
windspeeds. The summer was generally colder and had a greater number of windy days
than average, conditions that would affect the redox front in a manner which would keep
more of the sediment oxic as opposed to anoxic (refer to Figure 1).
Figure 4 – Graph of weather data collected May 1 through September 30, 2004 at Burlington International Airport. Temperature is in degrees Fahrenheit and windspeed is in miles per hour.
4.3. Overlying water chemistry data. Water samples collected through the course of the
summer by Pete Stangel (VT DEC) at the approximate location of the seasonal site are
tabulated in Table 3. Table 4 shows a comparison of the averaged monthly data from
2004 with the averages from the period 1992-2004 (data from the VT DEC long-term
monitoring program). Figure 5 plots the total phosphorous from this location and the
total P data collected and analyzed by the VT DEC at Station 40, part of the long-term
monitoring program database
Average Wind Speed
Temperatures – Average and Maximum

24
(http://www.anr.state.vt.us/dec/waterq/cfm/champlain/lp_longterm-lakes.cfm), for the
2004 season. The apparent disconnect between significant shifts in sediment redox front
positions and overlying water chemistry at station 40 is likely due to a combination of
undefined P fluxes from the sediment and possibly that activity in the sediment below
station 40 may be different from the seasonal spot where the sediments were collected for
this study. A seeming spike in total P concentrations measured at the seasonal station
which is above the averages for station 40 suggests that the flux of P from sediments may
have significant spatial and temporal constraints, i.e., different locations at different times
may exhibit very different P flux out of the sediment. These points require detailed study
of the specific flux of P out of the sediment in different locations, which was not a topic
specifically covered by the experiments or data in this study.
07/19/04 07/26/04 09/16/04 09/30/04 10/19/04DO 7.5 8.4 8.7 9.8TN 0.37 0.44 0.53 0.4 0.39TP (µg/l) 30 43 51 30 30Ca 16.7 19.1 20.9 18 19.1Fe 0.12 0.115 0.244 0.181 0.126K 1.63 1.97 2.2 1.86 1.85Mg 3.65 4.15 4.38 3.96 4.02Na 6.3 8.2 8.01 7.03 7.41 Table 3 - Water column data for seasonal site from VT DEC (Pete Stangel, pers. comm.), concentrations are in mg/l except as noted for total phosphorus (TP).
Mean TP (mg/l) Month 1992-2003 2004
Apr 0.019 May 0.023 0.023 Jun 0.027 0.029 Jul 0.028 0.029
Aug 0.030 0.027 Sep 0.031 0.034 Oct 0.024 0.024
Table 4 – Compilation of average values for St.Albans Bay waters (VT DEC Station 40) showing no significant differences for 2004 compared to the past years since 1992.

25
Surface Water Total P
0
10
20
30
40
50
60
05/03/04 06/22/04 08/11/04 09/30/04date
Con
cent
ratio
n (
g/l)
SAB seasonal siteStation 40
Figure 5 – Water column phosphorus at Station 40 and selected samples also taken above the seasonal sampling site used in this study. (Data from Pete Stangel, VT DEC, pers. Comm.)
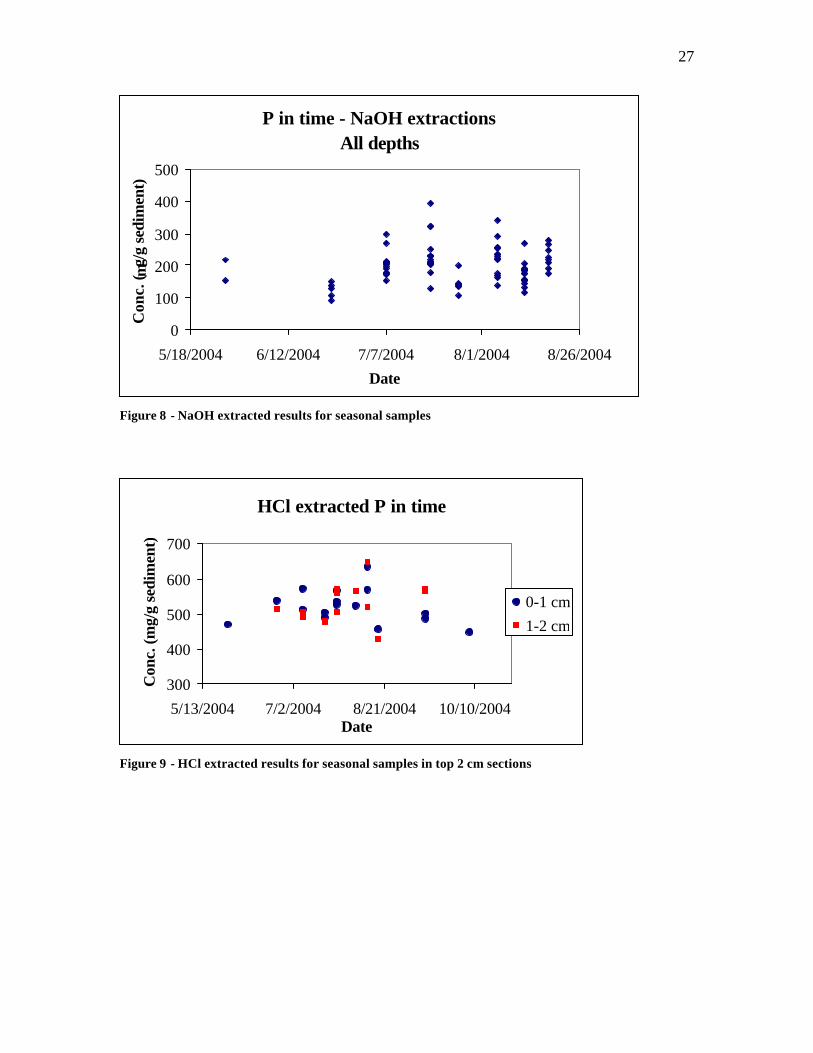
4.4 Sediment extraction data, seasonal: Sediment sections from seasonal samples taken
5/27/04, 06/23/04, 7/7/04, 07-19-04, 07/26/04, 08/05/04, 08/12/04, 08/18/04, 09/13/04,
and 10/07/04 were extracted with sequential HCl-NaOH and Ascorbic acid. Tabulated
analytical results for each of these extractions are in Appendix A. Summary plots of
these datasets in time are found in Figures 6-9. Replicate cores were fully analyzed for a
number of these dates; while internal check standards and triplicate measurements of
each sample indicate little error in the measurements, there is substantial heterogeneity in
different cores collected the same day at locations no more than 10 meters apart (Figure
7). Appendix A-2 tabulates the seasonal extraction data by section, averages for these
depths across the season are in Table 5. Plotted as profiles, Figures 10 and 11,
relationships between phosphorus concentrations and the Fe and Mn becomes clear,
especially for the samples extracted with Ascorbic Acid, which should selectively
solubilize the Fe and Mn oxyhydroxide minerals in the sediment and any P that may be
associated with it.

26
P, Fe in time - AA extraction All depths
0500
1000
1500200025003000
35004000
5/23/2004 6/12/2004 7/2/2004 7/22/2004 8/11/2004 8/31/2004 9/20/2004
Date
Con
c. (
µg/g
sed
imen
t)
PFe
Figure 6- Ascorbic Acid extraction results for seasonal samples
P, Fe, Mn in time - HCl extractionsAll depths
10.0
100.0
1000.0
10000.0
5/23/2004 7/12/2004 8/31/2004 10/20/2004
Date
Con
c. ( µ
g/g
sedi
men
t)
PFeMn
Figure 7 - HCl extr acted results for seasonal samples
27
P in time - NaOH extractionsAll depths
0
100
200
300
400
500
5/18/2004 6/12/2004 7/7/2004 8/1/2004 8/26/2004Date
Con
c. ( µ
g/g
sedi
men
t)
Figure 8 - NaOH extracted results for seasonal samples
HCl extracted P in time
300
400
500
600
700
5/13/2004 7/2/2004 8/21/2004 10/10/2004Date
Con
c. (m
g/g
sedi
men
t)
0-1 cm1-2 cm
Figure 9 - HCl extracted results for seasonal samples in top 2 cm sections

28
HCl extractions NaOH Ascorbic Acid extractionsµg/g sed µg/g sed µg/g sed µg/g sedµg/g sed µg/g sed µg/g sed
depth Fe Mn P P Fe Mn P0-1 cm 4081 111 519 269 2517 211 2961-2 cm 3906 77 528 219 2242 139 2372-3 cm 3633 62 519 210 1995 106 1963-4 cm 3737 61 506 201 2029 102 1924-5 cm 3563 61 520 196 1859 93 1795-6 cm 3285 61 531 181 1907 99 1786-8 cm 3475 63 536 178 1679 85 167
8-10 cm 3335 55 508 157 1573 79 156 Table 5 – Averaged values for Fe, Mn, and P extracted from 10 seasonal cores.
Profiles seasonal sample averages
0
1
2
3
4
5
6
7
8
90 100 200 300
Conc. (µg/g sediment)
Dep
th (
top
of s
ecti
on, c
m)
AA P
AA Fe / 10
AA Mn
NaOH P
Profiles seasonal sample averages
0
1
2
3
4
5
6
7
8
90 200 400 600
Conc. (µg/g sediment)
Dep
th (
top
of s
ecti
on, c
m)
HCl P
HCl Fe / 10
HCl Mn
NaOH P
Figure 10 – Profile of averages for seasonal site from ascorbic acid extractions
Figure 11 – Profile of averages for seasonal site from hydrochloric acid extractions

29
Comparing how iron, manganese, and phosphorus concentrations in the top of the
sediment column changes over time, compared to how chlorophyll-A (which generally
correlates with algal densities) in the water column changes over time may be another test
of whether there were any discernible links between P mobilized from the sediments and
algal densities in summer 2004. Direct statistical comparison of these datasets is not
appropriate, however, as the degree of heterogeneity in the sediments would be quite
different from any spatial heterogeneity in the water column. We can estimate any trends
only in the broadest sense, and plots of these data for Fe and Mn extracted from the top
centimeter can be found in Figures 12 and 13. While there appears to be some inverse
relationships between Chlorophyll-A and Mn, little relationship exists between
Chlorophyll-A and Fe. We concentrate on the top of the sediment column because the
activity of oxides at the top will be critical to the release of potentially bioavailable
phosphorus into the water column. This trend reflects the importance of Mn redox
changes through the course of summer 2004, changes which were observed to occur in
the pore water analyses (Section 4.1).

30
Fe extractions - 0-1 cm Seasonal Samples
0
1000
2000
3000
4000
5000
6000
7000
5/13/2004 7/2/2004 8/21/2004 10/10/2004date collected
Con
c. (m
g/g
sed) HCl
Ascorbic acid
Chlorophyll-A*250
Figure 12 – Plotted iron concentrations extracted with HCL and Ascorbic acid from seasonal samples with Chlorophyll-A data (Pete Stangel, VT DEC, pers. Comm..)
Mn extractions - 0-1 cm Seasonal Samples
050
100150200250300350400450500
4/23/2004 6/12/2004 8/1/2004 9/20/2004 11/9/2004
date collected
Con
c. (m
g/g
sedi
men
t)
HCl
AscorbicAcid
Chlorophyll-A *20
Figure 13 – Plotted manganese concentrations extracted with HCL and Ascorbic acid from seasonal samples with Chlorophyll-A data (Pete Stangel, VT DEC, pers. Comm..)

31
4.5. Statistical analysis of seasonal data: One of the primary questions this study seeks to
address regards the driving forces which may affect phosphorus mobility in the sediments
of St. Albans Bay. Particularly the role of FeOOH and MnOOH minerals and their
ability to sorb orthophosphate ions from solution will be impacted by the position of the
redox front which may thus have significant impacts on P mobility due to the reduction
and dissolution of those minerals. The correlation between P and Mn and/ or Fe is
therefore critical in starting to determine if this process may be an important factor in the
remobilization and essential cycling of phosphorus between the sediment and overlying
water column. Appendix A-3 contains a tabulation relating Mn, Fe, and P for samples
extracted with ascorbic acid or hydrochloric acid. The tables present Pearson correlation
coefficients (a number between 0 and 1 indicates none to perfect correlation, respectively
while a number between 0 to -1 indicates none to perfect inverse correlation) and P-
values (which is a statistical test of the significance of the correlation, if the P-value is
less than 0.050, the correlation is significant; if the P-value is greater than 0.050, there is
insufficient proof to statistically support the relationship). Table 6 lists Pearson
correlation coefficients between reactive phosphorus and amorphous manganese or iron
for depth intervals measured on seasonal samples through the 2004 sampling season. All
P-values for these samples were below 0.050, indicating a statistically significant and
strong correlation between these elements in time. Similar data for hydrochloric acid
extracted P, Mn, and Fe have P-values in excess of 0.050, indicating that there is no
statistically significant correlation to be made between those elements when extracted
with HCl.
Ascorbic AcidDepth P-Fe P-Mn0-1 cm 0.863 0.8941-2 cm 0.933 0.9212-3 cm 0.829 0.5673-4 cm 0.604 0.5594-5 cm 0.732 0.7775-6 cm 0.889 0.8956-8 cm 0.866 0.8048-10 cm 0.894 0.876
Table 6 – Pearson correlation coefficients for ascorbic acid extrac ted reactive phosphorus with amorphous iron and manganese.

32
The statistical analysis of seasonal sediment samples indicates that the mobility of
phosphorus within the sediment is closely tied to both iron and manganese. Significant
differences in how P is related to Fe and Mn depending on how the elements were
extracted further suggest that the mobility of P is tied to forms of manganese and iron that
are specifically solubilized by Ascorbic acid, namely iron and manganese oxyhydroxide
minerals. Combined with the electrochemistry data showing that redox fronts in this
system do change over time, these results show that changes in the iron and manganese
oxyhydroxide minerals are an important driving force in the mobility of phosphorus
within the sediments of St. Albans Bay.
Phosphorus Mobility: The arguments above show definitely that seasonal phosphorus
mobility is at least partly governed by changes in iron and manganese oxyhydroxide
mineralization within the sediment. This study does not specifically address the release
of phosphorus from the sediment into the overlying water column, though establishing
the mechanism by which phosphorus may be mobilized is a necessary step in properly
determining the flux of P in and out of the sediments of St. Albans Bay. In light of this
finding, it is likely that any release of phosphorus into the overlying water column would
require that mineral transformation should consume all available sites where any
mobilized phosphorus could stick on its way out of the sediment and into the water
column. Put another way, because reduction of iron and manganese occurs lower in the
sediment (see profiles, figure 3) the last oxyhydroxide minerals to be dissolved would be
at the top, nearest the sediment/water interface. As phosphorus released lower in the
sediment column diffuses upwards, if it encounters an iron and manganese oxyhydroxide
mineral which has spare space for another phosphorus ion, it will stick there. Only when
that phosphorus can diffuse through the top sediments to the overlying water column
without encountering an iron and manganese oxyhydroxide mineral WITH available
sorption sites (i.e., there can be iron and manganese oxyhydroxide minerals present but if
they are ‘full’ of P and no more can stick, the free P won’t be affected) will that
phosphorus continue to diffuse into the water column. This scenario may result in
significant flux of P over short time frames, an episodic event when the sediment is most
reduced (where the balance of oxygen penetration and oxygen consumption is pushed

33
well into the water column, after Figure 1). The only P flux measurements taken for St.
Albans Bay (Cornwell and Owens, 1999 ) did not take this into account and thus are not
representative of how significant reservoirs of P may be mobilized into the water column
in St. Albans Bay (a point which the authors were cognizant to point out in Cornwell and
Owens, 1999).
SECTION 5 – ST. ALBANS BAY SEDIMENT SAMPLING AND ASSESSMENT OF
PHOSPHORUS LOAD
5.1. Bay-wide samples sediment extraction: Results of the analysis of extractions from the
43 core samples collected in early August are tabulated in Appendix B-1. Sample
concentrations in general vary over 3 orders of magnitude bay-wide and can display
significant heterogeneity mineralogically and chemically over short intervals. Soluble
reactive phosphorus (NH4Cl extracted) has a minimum measured value of 0.2 µg/g
sediment to a maximum of 177 µg/g sediment and an average of 14 µg/g sediment.
Mineralizable phosphorus (NaOH extracted) averages 363 µg/ g sediment, with a
minimum of 2 µg/ g sediment, and a maximum of 2292 µg/ g sediment. Residual
phosphorus (HCl extracted) averages 358 µg/ g sediment, with a minimum of 2 µg/ g
sediment, and a maximum of 2413 µg/ g sediment. Reactive phosphorus (ascorbic acid
extracted) averages 372 µg/ g sediment, with a minimum of 9 µg/ g sediment, and a
maximum of 1880 µg/ g sediment. Total phosphorus (Aqua Regia extracted) averages
3400 µg/ g sediment, with a minimum of 493 µg/ g sediment, and a maximum of 4432
µg/ g sediment. When normalized to the sediment mass in each sampled section, the
average phosphorus is 3000 µg/ g sediment. Table 7 gives averages with
minimum/maximum values broken down by region of the bay: Inner Bay (IB), Middle
Bay (MB), Outer Bay (OB), and the Stevens Brook Wetland area (SBW). The Stevens
Brook wetland area contains the highest total, reactive, and mineralizable phosphorus
values in the area on average.

34
Totals Sequential Extraction ----->-------->Aqua Regia Extraction NH4Cl NaOH HCl Ascorbic Acid
PorosityOrganic Content Fe Mn P P P Fe Mn P Fe Mn P
average IB 55% 4.2 32883 794 1394 13 280 5066 83 400 3435 207 272MB 60% 4.1 39689 845 1474 10 263 5421 126 337 3620 288 263OB 65% 4.3 52864 2394 2058 18 567 8586 302 221 8188 1238 717SBW 52% 7.8 31343 797 2293 29 950 3044 46 213 2684 132 907
maximum IB 75% 35 63438 2445 3195 177 627 37361 440 2413 7303 565 579MB 77% 7.6 81945 3017 2868 23 751 11945 641 617 9171 1049 719OB 76% 6.6 68526 7654 3881 32 835 10783 920 291 12873 3605 1713SBW 75% 26 52515 2438 4432 69 2292 8461 122 416 5232 211 1880
minimum IB 15% 0.2 5497 48 493 2.8 18 534 15 134 372 20 23MB 21% 0.7 7487 16 525 0.2 36 481 9 126 207 18 9OB 21% 1.0 35096 628 1101 4 247 5442 118 143 4520 444 344SBW 24% 2.5 10681 130 667 8 229 118 7 2 881 47 274
Table 7 - Tabulated averages, minimums, and maximum values for each region of St. Albans Bay; IB=Inner Bay, MB=Middle Bay, OB=Outer Bay, SBW=Stevens Brook Wetland. 5.2. Potentially bioavailable inorganic phosphorus: Considering the area of the bay, the
total amount of reactive phosphorus that may be bioavailable is dependent on how much
of the sediment is potentially exchangeable with the overlying water column. From the
electrochemical data (Figure 3) collected in summer 2004 (this study), the top few cm are
certainly active with respect to potential P mobilization and escape as soluble phosphorus
into the water column. There are a number of ideas concerning what forms phosphorus
would be present in that may be bioavailable (Martin et al., 1994 expressed bioavailable
phosphorus as the total of NH4Cl and NaOH extracted phosphorus for instance). Given
that we are thinking about phosphorus that may be mobilized/immobilized by redox
processes governing iron oxyhydroxide minerals, the most appropriate data to use may be
the ascorbic acid extracted fraction. To determine how much phosphorus may potentially
be released through remineralization in the sediments due to anoxia we must make some
inferences from the available electrochemical data about how much sediment may be
potentially vulnerable to recycling into the water column through the action of changing
redox front position in time. We must keep in mind when looking at the electrochemical
data from summer 2004 (Figure 3) that while porewater fluctuations in Mn, Fe, and S
speciation were observed at 3-4 cm depth, this summer was a cooler and windier summer
(Figure 4) – summers prior or in the future will produce different mineralization

35
conditions, governed by the balance of processes that determines redox front position at
any time (Figure 1).
If we assume that the top 4 cm of sediment are potentially active with respect to
redox changes and potential remineralization which would release phosphorus, that the
porosity of that material is, on average, 60%, there are approximately 300 metric tons of
phosphorus in the bay which may be reworked and at least partially released into the
overlying water column as a result of increased anoxia in the sediments, and 1000 tons of
total phosphorus (Table 8). This amount of phosphorus increases to over 700 tons of
reactive P and 2400 tons of total P if we assume the reactive depth is 10 cm, as Cornwell
and Owens modeled (1999). Considering that current estimates of phosphorus loading
into the bay (from both point and nonpoint sources) is approximately 8 metric tons per
year (from the Lake Champlain Phosphorus TMDL, VT DEC and NYS DEC 2002), and
sedimentation rates are approximately 0.15 cm per year (Cornwell and Owens, 1999) the
top 4 cm should have accumulated approximately 200 tons of total phosphorus (in the
past 27 years, though this number is likely low as it does start to span the time before
significant improvements were made to the waste treatment facility, but it also assumes
that the majority of sediment discharge stays in the bay). Sedimentation rates likely do
not account for the high porosity in the top few centimeters and are likely off by as much
as 50% given compaction seen even in only the top 12 cm of these materials. Another P
component which would affect the total P amounts would be derived from any naturally
occurring phosphorus that would be contained in the sediment as different mineralized,
sorbed, or organic forms associated with the sediment’s geologic origin. Assessment of
this ‘background’ P for these materials was outside the scope of this study, and would
require much deeper cores to look at a significant record which would include pre-
industrial or settlement activity samples. Outside of this geologic reservoir, the
phosphorus currently in the system likely also represents an historical reservoir of
anthropogenically loaded P which has been reworked and mobilized through redox
processes to be concentrated towards the water interface.

36
Reactive P, µg/ g
sediment Area, m2reactive depth, m
volume sediment,
m3
volume sediment,
cm3
mass sediment,
g
mass sediment,
dryReactive
P, µgReactive P, tons
IB 272 2.59E+06 0.04 1.03E+05 1.0E+11 2.6E+11 1.0E+11 2.81E+13 28MB 263 4.33E+06 0.04 1.73E+05 1.7E+11 4.3E+11 1.7E+11 4.56E+13 46OB 717 7.03E+06 0.04 2.81E+05 2.8E+11 7.0E+11 2.8E+11 2.02E+14 202
SBW 907 1.78E+05 0.04 7.10E+03 7.1E+09 1.8E+10 7.1E+09 6.44E+12 6
density = 2.5 g/cm3 reactive P, bay-wide 282n= 0.4
Total P, µg/ g
sediment Area, m2 depth, m
volume sediment,
m3
volume sediment,
cm3
mass sediment,
g
mass sediment,
dryTotal P,
ugTotal P,
tonsIB 1394 2.59E+06 0.04 1.03E+05 1.0E+11 2.6E+11 1.0E+11 1.44E+14 144
MB 1474 4.33E+06 0.04 1.73E+05 1.7E+11 4.3E+11 1.7E+11 2.55E+14 255OB 2058 7.03E+06 0.04 2.81E+05 2.8E+11 7.0E+11 2.8E+11 5.79E+14 579
SBW 2293 1.78E+05 0.04 7.10E+03 7.1E+09 1.8E+10 7.1E+09 1.63E+13 16
density = 2.5 g/cm3 total P, bay-wide 994n= 0.4
Table 8 - Calculations for determining total amount of P potentially available through remineralization of Fe and Mn minerals. Where n is the sediment fraction and corresponds to a porosity of 60%.
5.3. Statistical analysis of bay-wide samples: Differences between P, Fe, and Mn for
samples collected at the same time, but varying in sample position provide a picture of
the spatial distribution of P, and an indication of whether any of the processes seen to
affect seasonal distribution within sediment profile translate to any lateral diffusion of P
across the bay. Correlation of Fe, Mn, and P for samples taken only in early August 2004
show a different trend with respect to the ascorbic acid extracted samples as compared to
samples taken as part of the seasonal study. Table 9 shows Pearson Correlation
Coefficients and P-values for both the aqua regia digested total Fe, Mn, and P
concentrations and for the reactive P - amorphous Fe and Mn

37
Aqua Regia Ascorbic AcidDepth P-Fe P-Mn P-Fe P-Mn0-1 cm 0.603/0.000 0.418/0.007 0.801/0.000 0.767/0.0001-2 cm 0.726/0.000 0.482/0.002 0.427/0.033 0.363/0.0742-3 cm 0.495/0.001 0.303/0.057 0.351/0.093 0.317/0.1313-4 cm 0.642/0.000 0.382/0.016 0.177/0.408 0.184/0.3904-5 cm 0.657/0.000 0.601/0.000 0.350/0.086 0.366/0.0725-8 cm 0.644/0.000 0.492/0.001 0.224/0.305 0.321/0.135
8-12 cm 0.508/0.001 0.201/0.220 0.254/0.254 0.322/0.143ALL 0.580/0.000 0.445/0.000 0.428/0.000 0.451/0.000
Table 9 - Person Correlation coefficients / P-values for basin samples 1-43 (Aqua Regia) and 1-27 (Ascorbic Acid). Values that are statistically valid are in bold, note that P-values greater than 0.050 indicate no statistically supported relationship between elements.
concentrations from ascorbic acid digestions. The differences between these correlations
and those for the seasonal sampling are especially noticeable for Fe, Mn, and P extracted
with ascorbic acid. Bay-wide differences across the bay and wetlands area are not
generally due to changes associated with Fe and Mn minerals EXCEPT in the top 1 or 2
cm, where there is good correlation. This may indicate that reactive phosphorus in the
system is constrained to the top 2 cm, afterwards phosphorus sorption to other materials
or as precipitation of a distinct mineral phase may be a more important control on the
overall. Spatial distribution of these materials across the bay is controlled by processes
which are distinctly different from processes which were shown to control the P mobility
seasonally. While seasonal variations in P positions tracked very well with changes in
iron and manganese oxyhydroxide minerals, variable P concentrations across the bay are
likely affected by a number of physical characteristics related to sediment provenance
(origin), and reworking associated with sediment transport.
Historical profile information: The spatial distribution of total phosphorus in the bay is
imprinted by the seasonal redox processes discussed above, which has resulted in the
redistribution of sediment-bound phosphorus (Figure 14). If one considers that sediment
loading rates in the bay have been estimated at approximately 0.15 cm of sediment per
year (Cornwell and Owens, 1999), then a 10 cm sediment profiles should represent
approximately 65 years of sediment. This would include time well before and after large
changes in the overall phosphorus loading to the St. Albans Bay system due to upgrades
to the waste treatment facility, closure of a large dairy, and continued significant

38
improvements to public education and community involvement in reducing P input into
the bay. If phosphorus was deposited with sediment over time and there was no
mobilization of that P with seasonal change, one may expect a profile such as the one
depicted in Figure 15. None of the profiles in this study (see data in appendices as well
as representative profiles in Figures 10, 11, and 14), regardless of spatial position, time of
sampling, or extraction method, show this type of profile. This strongly suggests that
significant, persistent, and seasonally active changes in redox fronts have induced
reworking of phosphorus to effectively smear out the historical (past ~65 year history
from this study) component. This effectively means that while significant improvement
has been made to limit P loading into St. Albans Bay, the historical legacy of high
phosphorus loading into the bay remains a significant component of near-surface
sediment chemistry.
Figure 14 – Profile plot of averaged aqua regia extraction data from all cores at specified depths (marked at top of core sections) collected in St. Albans Bay, August 2004. Iron (Fe) data corresponds to the top x-axis, while phosphorus (P) and Manganese (Mn) correspond to the bottom y-axis.

39
Figure 15 – Generalized diagram of a sediment P profile that should be observed
given significant decreases in P loading to St. Albans Bay.
5.4. Historical comparison of bay-wide samples: One of the original goals of this study
was to assess how the phosphorus levels may have changed from the time of the first
detailed study of sediment phosphorus concentrations in St. Albans Bay by Ackerly
(1983), followed by Martin et al. (1994). Appendix C lists all of the common sample
sites and depth intervals between this study, Ackerly (1983; samples collected 1982), and
Martin et al. (1994; samples collected 1992). While there can now be observed
significant differences between all of the study databases, the following points must be
made as potential difficulties in making a direct, quantitative comparison:
1. We have now shown that P is mobile in these sediments in large part due to
transformation of iron and manganese oxyhydroxide minerals, and the position of
redox fronts which would determine where this activity is actively occurring
changes on very short timescales and may additionally be variable depending on
spatial location. There is no constraint to base a comparison at times when the
redox chemistry in the sediment profile would have been at comparable
conditions, or even to base the sampling period on some combination of weather
conditions which would affect redox front positions.

40
2. The flux rate of phosphorus from sediments into the overlying water column is
almost completely unknown for sediments of St. Albans Bay, and given these
results, fluxes may differ significantly and in a very episodic fashion. There is
significant lack of constraint as to the flux of phosphorus from/to the sediment
into the overlying water column (and subsequent incorporation into algal
biomass) between these studies and no way to determine if significant P may have
been tied up as a suspended algal fraction when the sediments were sampled.
3. Chemical and physical heterogeneities seen on several scales in this study and
others, in addition to the significant effect of bioturbation due to bivalve activity
observed by Cornwell and Owens (1999), suggest that taking a core from the
exact same type of location 12 or 22 years later is most likely impossible.
4. Ackerly (1983) and Martin et al. (1994) used a colorimetric procedure for analysis
of their extraction solutions. The high amount of iron present in samples
processed for total P (aqua regia or perchloric acid extractions), HCl-extracted P,
or ascorbic acid extractions would serve as an analytical interference which would
yield lower P measurements due to competition between the Fe3+ and colorimetric
complex for the ascorbic acid. After experiencing problems with our matrix-
matched, mixed standard (standards containing not only P, but also Fe and Mn)
with the same colorimetric complex, we developed specific methods for ICP-OES
which do not suffer from this potential analytical difficulty. Repeating the
procedure to back-calculate what the Fe interference is not possible.
5. Sedimentation rates for St. Albans Bay are not well constrained, but Cornwell and
Owens (1999) give rates of 0.13 and 0.18 cm per annum, determined from 210Pb
dating of a core from two locations in St. Albans Bay from the 1996 sampling by
Horn Point Environmental Laboratories. Comparing levels of cores collected 22
and 12 years prior is an offset of approximately 3-4 and 1.5-2 cm, respectively, a
calculation which further assumes a sedimentation rate that is constant, something
that is almost certainly not the case in a small shallow basin with multiple inputs
and unresolved current transport. Observed differences in sediment compaction
(seen in this study as variation in porosity; Table 6) additionally support the idea

41
that sediment transport, deposition, and reworking is significantly heterogeneous
over the St. Albans Bay sediment surface.
While making any sort of direct comparison between samples from specific locations is
inappropriate for these reasons, there is certainly significant phosphorus contained in the
sediments of St. Albans Bay. On average, Ackerly found 1400 µg total P / g sediment,
Martin found 1100 µg total P / g sediment, and this study found 1800 µg total P / g
sediment in the bay. For reference to direct comparison of each sample, which as pointed
out above is not strictly appropriate, refer to Figures 16, 17, and 18. We DO NOT
contend that these numbers necessarily indicate an increase in the overall amount of
phosphorus contained in these sediments over time. A significant part could be due to
different sampling times when more P could have been mobilized from the sediment into
an algal fraction in the water column and a significant part could be due to analytical
differences. How much P could be liberated into an algal fraction which may exist in the
water column is impossible to determine from available data in 1982 and 1992, and there
is little indication from any trend of phosphorus gradients with depth at those sampling
times to suggest this may or may not have been an important process. There is also
significant Fe and Mn in these sediments, and significant indication that the presence,
reductive dissolution and transport followed by oxidation and reprecipitation of FeOOH
and MnOOH minerals plays a significant role in P mobility and bioavailability to the
overlying water column.

42
1992-2004 Comparison Total P
0
500
1000
1500
2000
2500
3000
3500
4000
4500
0 500 1000 1500 2000 2500 3000 3500 4000 4500
1992
2004
4
Figure 16 – Scatter plot comparing total P concentrations for each common site and spatial intervals
0-1, 1-2, 4-5, and 8-12 between 1992 and 2004 studies.
1982-2004 Comparison Total P
0
500
1000
1500
2000
2500
3000
3500
4000
4500
0 500 1000 1500 2000 2500 3000 3500 4000 4500
1982
2004
Figure 17 – Scatter plot comparing total P concentrations for each common site and spatial intervals
0-1, 1-2, 4-5, and 8-12 between 1982 and 2004 studies.

43
1982-1992 Comparison Total P
0
500
1000
1500
2000
2500
3000
3500
0 500 1000 1500 2000 2500 3000 3500
1982
1992
Figure 18 – Scatter plot comparing total P concentrations for each common site and spatial intervals
0-1, 1-2, 4-5, and 8-12 between 1982 and 1992 studies.
SECTION 6 – SUMMARY AND CONCLUSIONS
In this study, it was determined that there are significant amounts of phosphorus retained
in St. Albans Bay sediments, and that the mobility of phosphorus in those sediments is at
least partially controlled by changes in manganese and iron oxyhydroxide minerals. The
seasonal component of these redox changes, analytical differences, and a strong spatial
heterogeneity in these sediments make any direct comparison between this study and the
studies of Ackerly (1983) or Martin et al. (1994) inappropriate. It is of considerable
interest and importance to the St. Albans Bay community to assess whether the
phosphorus content in the sediments of the bay is at all decreasing with time, as had been
suggested would happen (Martin et al., 1994). It is reasonable to state from this data that

44
any net loss of phosphorus through exchange with the main lake is not occurring at the
rates which had been previously predicted and that the amount of phosphorus which is
currently in the sediments will likely persist for some time. Additionally, remobilization
of the phosphorus through the column as redox fronts move up and down through the
seasons may keep a significant fraction of the historical phosphorus load nearer the top of
the sediment column.
6.2. Recommendations for future study: A more thorough understanding of how
phosphorus may be released and made bioavailable as a function of the dissolution of
iron and manganese oxyhydroxides in the bay would be necessary in order to determine
the potential role that sediment recycling of phosphorus plays on overall algal activity of
the bay. Critical to this point is the flux of phosphorus out of the sediment into the water
column and how that phosphorus persists in the water column and potentially diffuses out
of the bay into the main lake. Another related question relates to whether there are
specific chemical conditions (especially affecting N:P ratios which are thought to be an
important factor in selecting algae species; M. Watzin, pers. Comm.) which may develop
in the bay which selects for blue-green algae over other varieties, and if those conditions
are selected by any process involving nutrient cycling in the sediments. Finally, what the
overall sorption capacity of the iron and manganese oxyhydroxides is would be critical
for understanding how they may or may not limit the amount of phosphorus that could
escape from the sediment column into the water column. An investigation of phosphorus
levels through a deeper section of sediments may give a better indication of phosphorus
loading changes in time and the potential role of phosphorus remobilization along
changing redox fronts. Any treatment option must also assess how the effects of seasonal
redox cycling will be affected by chemical or physical perturbation.

45
SECTION 7 - REFERENCES
Ackerly, S. 1983. Sediment-phosphorus relationships, St. Albans Bay, Lake Champlain.
M.S. Thesis, University of Vermont, Burlington, VT.
Anshutz, P., Sundby, B., Lefracois, L., Luther, G.W., and Mucci, A., 2000. Interactions
between metal oxides and species of nitrogen and iodine in bioturbated marine
sediments. Geochimica Et Cosmochimica Acta, V. 64, No. 16, p. 2751-2763.
Brendel, P.J., and Luther, G.W., 1995. Development of a Gold Amalgam Voltammetric
Microelectrode for the Determination of Dissolved Fe, Mn, O-2, and S(-Ii) in
Porewaters of Marine and Fresh-Water Sediments. Environmental Science &
Technology, V. 29, No. 3, p. 751-761
Brock, T.D., and Madigan, M.T., 1991. Biology of Microorganisms. 6th Edition.
Prentice Hall, Upper Saddle River. 874 p.
Cai, W., Zhao, P., Theberge, S.M., Witter, A., Wang, Y., Luther, G.W., 2002. Porewater
redox species, pH, and pCO2 in aquatic sediments: Electrochemical sensor studies in
Lake Champlain and Sapelo Island. In: Environmental Electrochemistry: Analyses of
trace element biogeochemistry (eds. Taillefert, M., and Rozan, T.F.) ACS
Symposium Series 811. p. 188-209.
Cornwell, J.C. and Owens, M., 1999. Benthic Phosphorus cycling in Lake Champlain:
Results of an integrated field sampling/water qua lity modeling study. Lake
Champlain Basin Program Technical Report No. 34A. Grande Isle, VT.
Druschel, G.K., Hamers, R.J., Luther, G.W., and Banfield, J.F., 2003b: Kinetics and
mechanism of trithionate and tetrathionate oxidation at low pH by hydroxyl radicals.
Aquatic Geochemistry. V. 9 No. 2, p. 145-164.

46
Grenthe, I., Stumm, W., Laaksuharju, M., Nilsson, A.C., and Wikberg, P., 1992. Redox
potentials and redox reactions in deep groundwater systems. Chemical Geology, V.
98, p. 131-150.
HydroQual, Inc. 1999. Benthic phosphorus cycling in Lake Champlain: Results of an
integrated field sampling/ water quality modeling study. Part A: Water quality
modeling. Lake Champlain Basin Program Technical Report, No. 34a. Grand Isle,
VT.
Jackson, M.L., 1970. Soil Chemical Analysis. Prentice Hall.
Kostka, J.E. and Luther, G.W., 1995. Seasonal cycling of reactive Fe in salt-marsh
sediments. Biogeochemistry, V. 29, p. 159-181.
Krom, M.D., and Berner, R.A., 1981. The diagenesis of phosphorus in near-shore marine
sediment. Geochimica et Cosmochimica Acta, V. 45, p. 207
Langmuir, D., 1997. Aqueous Environmental Geochemistry. Prentice Hall, Upper Saddle
River. 600 p.
Luther, G. W., Reimers, C. E., Nuzzio, D. B. and Lovalvo, D., 1999. In situ deployment
of voltammetric, potentiometric. and amperometric microelectrodes from a ROV to
determine dissolved O-2, Mn, Fe, S(-2), and pH in porewaters. Environmental
Science & Technology. V. 33, No. 23, p. 4352-4356.
Luther, G.W., III, Glazer, B., Ma, S., Trouwborst, R., Schultz, B.R., Druschel G.K.,
Kraiya, C., 2003: Iron and sulfur chemistry in a stratified lake: Evidence for iron-rich
sulfide complexes. Aquatic Geochemistry V. 9, No. 2, p. 87-110.
Martin, S.C., Ciotola, R.J., Maila, P., Urs, N.G.S., and Kotwal, P.B., 1994. Assessment
of sediment phosphorus distribution and long-term recycling in St. Albans Bay, Lake

47
Champlain. Lake Champlain Basin Program Technical Report No. 7C Grande Isle,
VT.
Picotte, A. 2002. 2001 Lake Champlain Lay Monitoring Report. Vermont Department of
Environmental Conservation. Waterbury.
Roden, E.E. and Edmonds, J.W., 1997. Phosphate mobilization in iron-rich anaerobic
sediments: microbial Fe(III) oxide reduction versus iron-sulfide formation. Archives
of Hydrobiology, V. 139, No. 3, p. 347-378.
Rozan, T.F., Taillefert, M., Trouwborst, R.E., Glazer, B.T., Ma, S.F., Herszage, J.,
Valdes, L.M., Price, K.S., Luther, G.W., 2002. Iron-sulfur-phosphorus cycling in the
sediments of a shallow coastal bay: Implications for sediment nutrient release and
benthic macroalgal blooms. Limnology and Oceanography, V. 47, No. 5, p. 1346-
1354.
Shenker, M; Seitelbach, S; Brand, S; Haim, A., Litaor, M.I., 2005. Redox reactions and
phosphorus release in re- flooded soils of an altered wetland. European Journal Of
Soil Science, V. 56 (4): 515-525.
Smeltzer, E., 2003. The phosphorus problem in St. Albans Bay, A summary of research
findings.
Smeltzer, E., Kamman, N., Hyde, K., and Drake, J.C., 1994. Dynamic mass balance
model of internal phosphorus loading in St. Albans Bay, Lake Champlain. Lake
Champlain Basin Program Technical Report No. 7A. Grande Isle, VT.
Van der Zee, C., Roberts, D.R., Rancourt, D.G., and Slomp, C.P., 2003. Nanogoethite is
the dominant reactive oxyhydroxide phase in lake and marine sediments. Geology,
V. 31, No. 11, p. 993-996.

48
Vermont Department of Environmental Conservation and New York State Department of
Environmental Conservation. 2005. Long-term water quality and biological
monitoring project for Lake Champlain: Cumulative report for project years 1992-
2003. Waterbury, VT and Ray Brook, NY. Report and data available at
http://www.anr.state.vt.us/dec/waterq/lakes/htm/lp_longterm.htm
Williams, J.D.H., Mayer, T., Nriagu, J.O., 1980. Extractability of phosphorus from
phosphate minerals common in soils and sediments. Soil Society of America Journal,
V. 44, p. 462-465.

49
Appendix A-1 – Seasonal data by date HCl extractions NaOH Ascorbic Acid extractions
µg/g sed µg/g sed µg/g sed µg/g sed µg/g sed µg/g sed µg/g sedSample Date
Core # IntervalPorosity
(%)Fe Mn P P Fe Mn P
5/27/2004 1 0-1cm 59 3151 168 470 216 2571 279 2495/27/2004 1 1-2cm 645/27/2004 1 2-3cm 68 2353 77 525 1925 136 1946/23/2004 1 0-1cm 74 2987 69 536 2042 129 2336/23/2004 1 1-2cm 71 2841 68 513 1949 125 2186/23/2004 1 2-3cm 67 2558 55 556 127 1328 82 1376/23/2004 1 3-4cm 67 2514 53 532 148 1519 89 1536/23/2004 1 4-5cm 62 88 948 62 926/23/2004 1 5-6cm 62 105 937 64 936/23/2004 1 6-8cm 65 136 1275 82 122
7/7/2004 1 0-1cm 81 4651 194 569 3297 307 3787/7/2004 1 1-2cm 79 4200 138 505 271 3323 274 3977/7/2004 1 2-3cm 77 3499 71 526 208 2136 100 2137/7/2004 1 3-4cm 76 3110 59 452 172 2415 107 2197/7/2004 1 4-5cm 76 3470 63 533 152 2210 98 1877/7/2004 1 5-6cm 75 3303 57 497 171 2204 108 2107/7/2004 1 6-8cm 74 3370 67 495 205 2310 120 2407/7/2004 1 8-10cm 71 3418 65 527 199 2195 116 2497/7/2004 2 0-1cm 82 6167 136 511 3015 228 3277/7/2004 2 1-2cm 79 6693 137 493 299 3188 195 3797/7/2004 2 2-3cm 77 5416 78 486 206 2231 101 2167/7/2004 2 3-4cm 5802 80 481 187 2748 107 2117/7/2004 2 4-5cm 75 5406 81 483 206 2407 113 2137/7/2004 2 5-6cm 71 5542 79 491 175 2552 120 2267/7/2004 2 6-8cm 72 5653 85 493 211 2374 117 2307/7/2004 2 8-10cm 72 5158 77 453 193 2485 122 230
7/19/2004 1 0-1cm 5227 169 489 394 3793 430 4727/19/2004 1 1-2cm 5101 97 476 323 3381 264 3617/19/2004 1 2-3cm 4337 69 480 231 2577 150 2527/19/2004 1 3-4cm 4139 61 491 201 2314 115 2217/19/2004 1 4-5cm 4034 61 494 204 2481 116 2067/19/2004 1 5-6cm 4145 64 472 203 2727 133 2327/19/2004 1 6-8cm 4267 66 510 208 2293 112 2007/19/2004 1 8-10cm 2836 42 390 127 1417 69 1307/19/2004 2 0-1cm 79 5473 156 503 325 3324 320 3827/19/2004 2 1-2cm 77 5091 97 4807/19/2004 2 2-3cm 75 4442 68 478 216 2319 118 2027/19/2004 2 3-4cm 75 4827 77 460 231 2733 140 253

50
HCl extractions NaOH Ascorbic Acid extractionsµg/g sed µg/g sed µg/g sed µg/g sed µg/g sed µg/g sed µg/g sed
Sample Date
Core # IntervalPorosity
(%)Fe Mn P P Fe Mn P
7/19/2004 2 4-5cm 75 5119 80 470 254 2705 139 2607/19/2004 2 5-6cm 58 4502 66 496 228 2524 122 2207/19/2004 2 6-8cm 71 4820 74 543 209 2282 113 1967/19/2004 2 8-10cm 68 4224 64 487 177 2091 100 1827/26/2004 1 0-1cm 75 3691 128 527 2225 221 2887/26/2004 1 1-2cm 70 3465 78 559 2185 162 2387/26/2004 1 2-3cm 69 3331 65 503 197 2186 133 2247/26/2004 1 3-4cm 66 2856 52 563 136 1597 96 1607/26/2004 1 4-5cm 63 2876 52 524 132 1709 94 1627/26/2004 1 5-6cm 62 2819 52 587 138 1582 87 1467/26/2004 1 6-8cm 62 2867 55 585 141 1571 86 1467/26/2004 1 8-10cm 56 2741 54 585 104 1296 67 1217/26/2004 2 0-1cm 74 3538 90 534 2567 203 3127/26/2004 2 1-2cm 69 3099 59 505 1854 109 1797/26/2004 2 2-3cm 67 2750 48 631 1813 91 1527/26/2004 2 3-4cm 66 3053 57 529 2006 102 1767/26/2004 2 4-5cm 66 2990 57 553 1905 98 1707/26/2004 2 5-6cm 64 2722 44 577 1666 86 1497/26/2004 2 6-8cm 61 1363 70 1257/26/2004 2 8-10cm 62 2674 44 523 1020 53 967/26/2004 3 0-1cm 74 3152 77 565 2005 147 2217/26/2004 3 1-2cm 66 2763 51 571 1478 79 1427/26/2004 3 2-3cm 67 2910 48 612 1635 81 1287/26/2004 3 3-4cm 65 2669 46 595 1801 90 1397/26/2004 3 4-5cm 63 2925 53 578 1712 85 137
8/5/2004 1 0-1cm 72 259 2502 179 2548/5/2004 1 1-2cm 71 172 2067 108 1698/5/2004 1 2-3cm 71 255 2061 104 1958/5/2004 1 3-4cm 74 294 2359 112 1768/5/2004 1 4-5cm 69 238 1968 96 1478/5/2004 1 5-6cm 59 167 1533 72 1168/5/2004 1 6-8cm 55 162 1217 58 1048/5/2004 1 8-10cm 53 134 1023 56 848/5/2004 2 0-1cm 76 3139 96 521 344 2852 219 2958/5/2004 2 1-2cm 71 2578 63 565 238 1813 102 1558/5/2004 2 2-3cm 66 2556 59 548 228 1775 84 1388/5/2004 2 3-4cm 60 2491 66 546 216 1966 97 1558/5/2004 2 4-5cm 62 2539 66 554 236 1873 102 164

51
HCl extractions NaOH Ascorbic Acid extractionsµg/g sed µg/g sed µg/g sed µg/g sed µg/g sed µg/g sed µg/g sed
Sample Date
Core # IntervalPorosity
(%)Fe Mn P P Fe Mn P
8/5/2004 2 5-6cm 61 2406 73 549 222 1764 93 1518/5/2004 2 6-8cm 54 950 45 107
8/12/2004 1 0-1cm 73 2333 67 633 153 1615 115 2338/12/2004 1 1-2cm 70 2291 43 647 130 1514 66 1758/12/2004 1 2-3cm 70 2397 49 557 1868/12/2004 1 3-4cm 70 3296 61 584 204 1756 94 2038/12/2004 1 4-5cm 65 2413 53 675 181 1509 70 1708/12/2004 1 5-6cm 64 2886 63 601 186 1927 109 1858/12/2004 1 6-8cm 61 1967 49 629 1518/12/2004 1 8-10cm 56 2196 35 658 1158/12/2004 2 0-1cm 76 3959 144 567 272 2540 252 3378/12/2004 2 1-2cm 72 2435 58 520 150 1855 106 1838/12/2004 2 2-3cm 69 2322 49 573 187 1672 89 1588/12/2004 2 3-4cm 67 3015 56 556 174 1638 85 1608/12/2004 2 4-5cm 66 2651 53 562 181 1630 84 1848/12/2004 2 5-6cm 63 2096 52 591 171 1507 77 1938/12/2004 2 6-8cm 60 1919 44 582 143 1345 60 1488/18/2004 1 0-1cm 73 2913 96 455 188 1617 134 2798/18/2004 1 1-2cm 72 3607 80 427 171 1562 99 2208/18/2004 1 2-3cm 74 3252 76 398 268 1767 160 2348/18/2004 1 3-4cm 72 3294 75 397 250 1846 131 2288/18/2004 1 4-5cm 76 3371 82 418 280 1821 118 2608/18/2004 1 5-6cm 65 2428 63 449 227 1964 121 2118/18/2004 1 6-8cm 64 2939 65 455 215 1486 70 2148/18/2004 1 8-10cm 60 3437 58 444 208 1059 46 1599/13/2004 1 0-1cm 4871 58 499 2080 99 2159/13/2004 1 1-2cm 5711 61 571 2662 128 2529/13/2004 1 2-3cm 4944 54 495 1674 60 2039/13/2004 1 3-4cm 4762 52 517 1959 85 2239/13/2004 1 4-5cm 4596 49 515 1840 76 1859/13/2004 2 0-1cm 4053 41 485 2229 118 2629/13/2004 2 1-2cm 4804 51 564 2554 124 2549/13/2004 2 2-3cm 5704 63 476 2826 104 2899/13/2004 2 3-4cm 4868 48 411 1785 75 2109/13/2004 2 4-5cm 3931 43 400 1171 46 14610/7/2004 1 0-1cm 5987 92 44810/7/2004 1 2-3cm 5357 59 45610/7/2004 1 3-4cm 5362 66 475

52
Appendix A-2 – Seasonal data grouped by depth 0-1 cm sections HCl extractions NaOH Ascorbic Acid extractions
µg/g sed µg/g sedµg/g sedµg/g sedµg/g sedµg/g sedµg/g sed
IntervalSample
DateCore
#Interval
Porosity (%)
Fe Mn P P Fe Mn P
0-1cm 5/27/2004 1 0-1cm 59 3151 168 470 216 2571 279 2490-1cm 6/23/2004 1 0-1cm 74 2987 69 536 2042 129 2330-1cm 7/7/2004 1 0-1cm 81 4651 194 569 3297 307 3780-1cm 7/7/2004 2 0-1cm 82 6167 136 511 3015 228 3270-1cm 7/19/2004 1 0-1cm 5227 169 489 394 3793 430 4720-1cm 7/19/2004 2 0-1cm 79 5473 156 503 325 3324 320 3820-1cm 7/26/2004 1 0-1cm 75 3691 128 527 2225 221 2880-1cm 7/26/2004 2 0-1cm 74 3538 90 534 2567 203 3120-1cm 7/26/2004 3 0-1cm 74 3152 77 565 2005 147 2210-1cm 8/5/2004 1 0-1cm 72 259 2502 179 2540-1cm 8/5/2004 2 0-1cm 76 3139 96 521 344 2852 219 2950-1cm 8/12/2004 1 0-1cm 73 2333 67 633 153 1615 115 2330-1cm 8/12/2004 2 0-1cm 76 3959 144 567 272 2540 252 3370-1cm 8/18/2004 1 0-1cm 73 2913 96 455 188 1617 134 2790-1cm 9/13/2004 1 0-1cm 4871 58 499 2080 99 2150-1cm 9/13/2004 2 0-1cm 4053 41 485 2229 118 2620-1cm 10/7/2004 1 0-1cm 5987 92 448
1-2 cm sections HCl extractions NaOH Ascorbic Acid extractions
µg/g sed µg/g sedµg/g sedµg/g sedµg/g sedµg/g sedµg/g sed
IntervalSample
DateCore
#Interval
Porosity (%)
Fe Mn P P Fe Mn P
1-2cm 5/27/2004 1 1-2cm 641-2cm 6/23/2004 1 1-2cm 71 2841 68 513 1949 125 2181-2cm 7/7/2004 1 1-2cm 79 4200 138 505 271 3323 274 3971-2cm 7/7/2004 2 1-2cm 79 6693 137 493 299 3188 195 3791-2cm 7/19/2004 1 1-2cm 5101 97 476 323 3381 264 3611-2cm 7/19/2004 2 1-2cm 77 5091 97 4801-2cm 7/26/2004 1 1-2cm 70 3465 78 559 2185 162 2381-2cm 7/26/2004 2 1-2cm 69 3099 59 505 1854 109 1791-2cm 7/26/2004 3 1-2cm 66 2763 51 571 1478 79 1421-2cm 8/5/2004 1 1-2cm 71 172 2067 108 1691-2cm 8/5/2004 2 1-2cm 71 2578 63 565 238 1813 102 1551-2cm 8/12/2004 1 1-2cm 70 2291 43 647 130 1514 66 1751-2cm 8/12/2004 2 1-2cm 72 2435 58 520 150 1855 106 1831-2cm 8/18/2004 1 1-2cm 72 3607 80 427 171 1562 99 2201-2cm 9/13/2004 1 1-2cm 5711 61 571 2662 128 2521-2cm 9/13/2004 2 1-2cm 4804 51 564 2554 124 254

53
2-3 cm sections HCl extractions NaOH Ascorbic Acid extractionsµg/g sed µg/g sedµg/g sedµg/g sedµg/g sedµg/g sedµg/g sed
IntervalSample
DateCore
#Interval
Porosity (%)
Fe Mn P P Fe Mn P
2-3cm 5/27/2004 1 2-3cm 68 2353 77 525 1925 136 1942-3cm 6/23/2004 1 2-3cm 67 2558 55 556 127 1328 82 1372-3cm 7/7/2004 1 2-3cm 77 3499 71 526 208 2136 100 2132-3cm 7/7/2004 2 2-3cm 77 5416 78 486 206 2231 101 2162-3cm 7/19/2004 1 2-3cm 4337 69 480 231 2577 150 2522-3cm 7/19/2004 2 2-3cm 75 4442 68 478 216 2319 118 2022-3cm 7/26/2004 1 2-3cm 69 3331 65 503 197 2186 133 2242-3cm 7/26/2004 2 2-3cm 67 2750 48 631 1813 91 1522-3cm 7/26/2004 3 2-3cm 67 2910 48 612 1635 81 1282-3cm 8/5/2004 1 2-3cm 71 255 2061 104 1952-3cm 8/5/2004 2 2-3cm 66 2556 59 548 228 1775 84 1382-3cm 8/12/2004 1 2-3cm 70 2397 49 557 1862-3cm 8/12/2004 2 2-3cm 69 2322 49 573 187 1672 89 1582-3cm 8/18/2004 1 2-3cm 74 3252 76 398 268 1767 160 2342-3cm 9/13/2004 1 2-3cm 4944 54 495 1674 60 2032-3cm 9/13/2004 2 2-3cm 5704 63 476 2826 104 2892-3cm 10/7/2004 1 2-3cm 5357 59 456
3-4 cm sections HCl extractions NaOH Ascorbic Acid extractions
µg/g sed µg/g sedµg/g sedµg/g sedµg/g sedµg/g sedµg/g sed
IntervalSample
DateCore
#Interval
Porosity (%)
Fe Mn P P Fe Mn P
3-4cm 6/23/2004 1 3-4cm 67 2514 53 532 148 1519 89 1533-4cm 7/7/2004 1 3-4cm 76 3110 59 452 172 2415 107 2193-4cm 7/7/2004 2 3-4cm 5802 80 481 187 2748 107 2113-4cm 7/19/2004 1 3-4cm 4139 61 491 201 2314 115 2213-4cm 7/19/2004 2 3-4cm 75 4827 77 460 231 2733 140 2533-4cm 7/26/2004 1 3-4cm 66 2856 52 563 136 1597 96 1603-4cm 7/26/2004 2 3-4cm 66 3053 57 529 2006 102 1763-4cm 7/26/2004 3 3-4cm 65 2669 46 595 1801 90 1393-4cm 8/5/2004 1 3-4cm 74 294 2359 112 1763-4cm 8/5/2004 2 3-4cm 60 2491 66 546 216 1966 97 1553-4cm 8/12/2004 1 3-4cm 70 3296 61 584 204 1756 94 2033-4cm 8/12/2004 2 3-4cm 67 3015 56 556 174 1638 85 1603-4cm 8/18/2004 1 3-4cm 72 3294 75 397 250 1846 131 2283-4cm 9/13/2004 1 3-4cm 4762 52 517 1959 85 2233-4cm 9/13/2004 2 3-4cm 4868 48 411 1785 75 2103-4cm 10/7/2004 1 3-4cm 5362 66 475
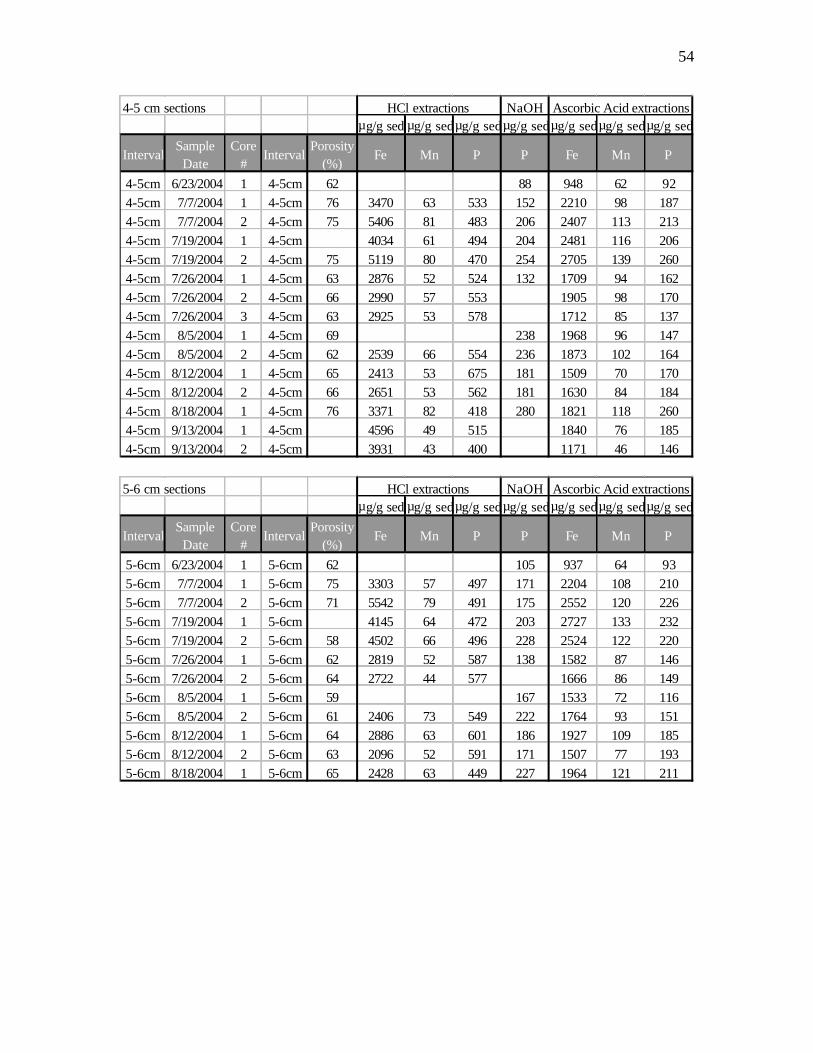
54
4-5 cm sections HCl extractions NaOH Ascorbic Acid extractionsµg/g sed µg/g sedµg/g sedµg/g sedµg/g sedµg/g sedµg/g sed
IntervalSample
DateCore
#Interval
Porosity (%)
Fe Mn P P Fe Mn P
4-5cm 6/23/2004 1 4-5cm 62 88 948 62 924-5cm 7/7/2004 1 4-5cm 76 3470 63 533 152 2210 98 1874-5cm 7/7/2004 2 4-5cm 75 5406 81 483 206 2407 113 2134-5cm 7/19/2004 1 4-5cm 4034 61 494 204 2481 116 2064-5cm 7/19/2004 2 4-5cm 75 5119 80 470 254 2705 139 2604-5cm 7/26/2004 1 4-5cm 63 2876 52 524 132 1709 94 1624-5cm 7/26/2004 2 4-5cm 66 2990 57 553 1905 98 1704-5cm 7/26/2004 3 4-5cm 63 2925 53 578 1712 85 1374-5cm 8/5/2004 1 4-5cm 69 238 1968 96 1474-5cm 8/5/2004 2 4-5cm 62 2539 66 554 236 1873 102 1644-5cm 8/12/2004 1 4-5cm 65 2413 53 675 181 1509 70 1704-5cm 8/12/2004 2 4-5cm 66 2651 53 562 181 1630 84 1844-5cm 8/18/2004 1 4-5cm 76 3371 82 418 280 1821 118 2604-5cm 9/13/2004 1 4-5cm 4596 49 515 1840 76 1854-5cm 9/13/2004 2 4-5cm 3931 43 400 1171 46 146
5-6 cm sections HCl extractions NaOH Ascorbic Acid extractions
µg/g sed µg/g sedµg/g sedµg/g sedµg/g sedµg/g sedµg/g sed
IntervalSample
DateCore
#Interval
Porosity (%)
Fe Mn P P Fe Mn P
5-6cm 6/23/2004 1 5-6cm 62 105 937 64 935-6cm 7/7/2004 1 5-6cm 75 3303 57 497 171 2204 108 2105-6cm 7/7/2004 2 5-6cm 71 5542 79 491 175 2552 120 2265-6cm 7/19/2004 1 5-6cm 4145 64 472 203 2727 133 2325-6cm 7/19/2004 2 5-6cm 58 4502 66 496 228 2524 122 2205-6cm 7/26/2004 1 5-6cm 62 2819 52 587 138 1582 87 1465-6cm 7/26/2004 2 5-6cm 64 2722 44 577 1666 86 1495-6cm 8/5/2004 1 5-6cm 59 167 1533 72 1165-6cm 8/5/2004 2 5-6cm 61 2406 73 549 222 1764 93 1515-6cm 8/12/2004 1 5-6cm 64 2886 63 601 186 1927 109 1855-6cm 8/12/2004 2 5-6cm 63 2096 52 591 171 1507 77 1935-6cm 8/18/2004 1 5-6cm 65 2428 63 449 227 1964 121 211

55
6-8 cm sections HCl extractions NaOH Ascorbic Acid extractionsµg/g sed µg/g sedµg/g sedµg/g sedµg/g sedµg/g sedµg/g sed
IntervalSample
DateCore
#Interval
Porosity (%)
Fe Mn P P Fe Mn P
6-8cm 6/23/2004 1 6-8cm 65 136 1275 82 1226-8cm 7/7/2004 1 6-8cm 74 3370 67 495 205 2310 120 2406-8cm 7/7/2004 2 6-8cm 72 5653 85 493 211 2374 117 2306-8cm 7/19/2004 1 6-8cm 4267 66 510 208 2293 112 2006-8cm 7/19/2004 2 6-8cm 71 4820 74 543 209 2282 113 1966-8cm 7/26/2004 1 6-8cm 62 2867 55 585 141 1571 86 1466-8cm 7/26/2004 2 6-8cm 61 1363 70 1256-8cm 8/5/2004 1 6-8cm 55 162 1217 58 1046-8cm 8/5/2004 2 6-8cm 54 950 45 1076-8cm 8/12/2004 1 6-8cm 61 1967 49 629 1516-8cm 8/12/2004 2 6-8cm 60 1919 44 582 143 1345 60 1486-8cm 8/18/2004 1 6-8cm 64 2939 65 455 215 1486 70 214
8-10 cm sections HCl extractions NaOH Ascorbic Acid extractions
µg/g sed µg/g sedµg/g sedµg/g sedµg/g sedµg/g sedµg/g sed
IntervalSample
DateCore
#Interval
Porosity (%)
Fe Mn P P Fe Mn P
8-10cm 7/7/2004 1 8-10cm 71 3418 65 527 199 2195 116 2498-10cm 7/7/2004 2 8-10cm 72 5158 77 453 193 2485 122 2308-10cm 7/19/2004 1 8-10cm 2836 42 390 127 1417 69 1308-10cm 7/19/2004 2 8-10cm 68 4224 64 487 177 2091 100 1828-10cm 7/26/2004 1 8-10cm 56 2741 54 585 104 1296 67 1218-10cm 7/26/2004 2 8-10cm 62 2674 44 523 1020 53 968-10cm 8/5/2004 1 8-10cm 53 134 1023 56 848-10cm 8/12/2004 1 8-10cm 56 2196 35 658 1158-10cm 8/18/2004 1 8-10cm 60 3437 58 444 208 1059 46 159

56
Appendix A-3 – Statistical Correlation matrices (P, Mn, Fe) for seasonal samples calculated with Minitab v13.32. Pearson Correlation Coefficient P-Values
AA - 0-1 Fe Mn AA - 0-1 Fe MnMn 0.9 Mn 0.000P 0.863 0.894 P 0.000 0.000
HCl - 0-1 Fe Mn HCl - 0-1 Fe MnMn 0.355 Mn 0.178P -0.414 -0.045 P 0.11 0.869
AA - 1-2 Fe Mn AA - 1-2 Fe MnMn 0.915 Mn 0.000P 0.933 0.921 P 0.000 0.000
HCl - 1-2 Fe Mn HCl - 1-2 Fe MnMn 0.618 Mn 0.019P -0.346 -0.573 P 0.225 0.032
AA - 2-3 Fe Mn AA - 2-3 Fe MnMn 0.449 Mn 0.093P 0.829 0.567 P 0 0.027
HCl - 2-3 Fe Mn HCl - 2-3 Fe MnMn 0.333 Mn 0.207P -0.608 -0.697 P 0.013 0.003
AA - 3-4 Fe Mn AA - 3-4 Fe MnMn 0.644 Mn 0.01P 0.604 0.559 P 0.017 0.03
HCl - 3-4 Fe Mn HCl - 3-4 Fe MnMn 0.444 Mn 0.097P -0.521 -0.44 P 0.047 0.101
AA - 4-5 Fe Mn AA - 4-5 Fe MnMn 0.883 Mn 0.000P 0.732 0.777 P 0.002 0.001
HCl - 4-5 Fe Mn HCl - 4-5 Fe MnMn 0.449 Mn 0.124P -0.591 -0.326 P 0.034 0.277
AA - 5-6 Fe Mn AA - 5-6 Fe MnMn 0.932 Mn 0.000P 0.889 0.895 P 0.000 0.000
HCl - 5-6 Fe Mn HCl - 5-6 Fe MnMn 0.595 Mn 0.069P -0.506 -0.491 P 0.136 0.149
AA - 6-8 Fe Mn AA - 6-8 Fe MnMn 0.965 Mn 0.000P 0.866 0.804 P 0.001 0.003
HCl - 6-8 Fe Mn HCl - 6-8 Fe MnMn 0.955 Mn 0P -0.543 -0.697 P 0.165 0.055
AA - 8-10 Fe Mn AA - 8-10 Fe MnMn 0.989 Mn 0P 0.894 0.876 P 0.003 0.004
HCl - 8-10 Fe Mn HCl - 8-10 Fe MnMn 0.927 Mn 0.001P -0.51 -0.387 P 0.197 0.344

57
All Concentrations in µg/g sediment Totals Sequential Extraction -------> -------->Aqua Regia Extraction NH4Cl NaOH HCl Ascorbic Acid
sample # cm Location
porosity (%)
organic content
(%) Fe Mn P P P Fe Mn P Fe Mn P1 0-1 MB 69% 4.3 60642 1409 2214 13.4 354 9802 186 355 4939 438 4291 1-2 MB 72% 4.5 59436 1542 1954 14.1 424 11438 261 355 4284 216 3651 2-3 MB 75% 1.5 60725 1078 2214 14.9 490 6880 84 239 6843 365 4491 3-4 MB 72% 4.8 81945 1473 2564 15.2 309 10343 174 319 1416 69 1371 4-5 MB 72% 4.6 55165 916 1745 17.3 290 9061 138 335 3704 202 2811 5-8 MB 68% 5.1 63286 1069 1983 11.9 244 8079 108 343 3504 195 2521 8-12 MB 67% 5.0 57503 940 1678 13.3 367 7441 100 358 3488 222 2792 0-1 IB 64% 3.5 63438 1722 3195 19.4 365 5419 176 451 4659 403 5792 1-2 IB 72% 2.7 48056 895 2203 17.6 451 2416 39 235 4495 319 3912 1-2 IB 66% 3.4 47338 1070 1778 29.6 254 4528 91 202 3088 187 2892 2-3 IB 63% 4.3 44708 764 2016 18.5 320 3503 59 286 3161 173 2902 3-4 IB 63% 4.2 44570 749 2018 13.0 372 4000 57 289 3556 193 3472 4-5 IB 64% 3.8 32066 509 1374 15.9 333 3297 50 278 3716 164 3642 5-8 IB 64% 3.9 52869 809 2252 17.7 108 2485 33 276 3325 168 3232 8-12 IB 55% 3.5 16980 260 1190 13.9 74 2906 29 333 2282 101 2213 0-1 IB 46% 2.1 13310 304 973 13.2 175 2115 45 546 1900 149 2113 1-2 IB 46% 2.4 29498 532 2277 6.0 127 3773 111 2413 2096 341 1353 2-3 IB 46% 2.0 16259 287 1159 12.1 192 1994 29 544 1945 98 1903 3-4 IB 40% 2.4 15646 289 1354 7.3 276 4803 45 235 2260 112 1683 4-5 IB 38% 2.1 14332 277 1060 10.5 147 2060 31 462 941 53 743 5-8 IB 32% 1.8 14163 206 1072 4.5 164 2210 22 429 1815 57 1553 8-12 IB 28% 1.7 19111 181 1305 3.9 128 3005 43 1174 0-1 IB 75% 4.5 44440 73 1541 21.7 392 11245 231 395 5898 415 4844 1-2 IB 74% 5.6 47451 56 1565 10.2 346 6305 98 248 5522 360 415
Appendix B – Tabulated Bay-wide samples
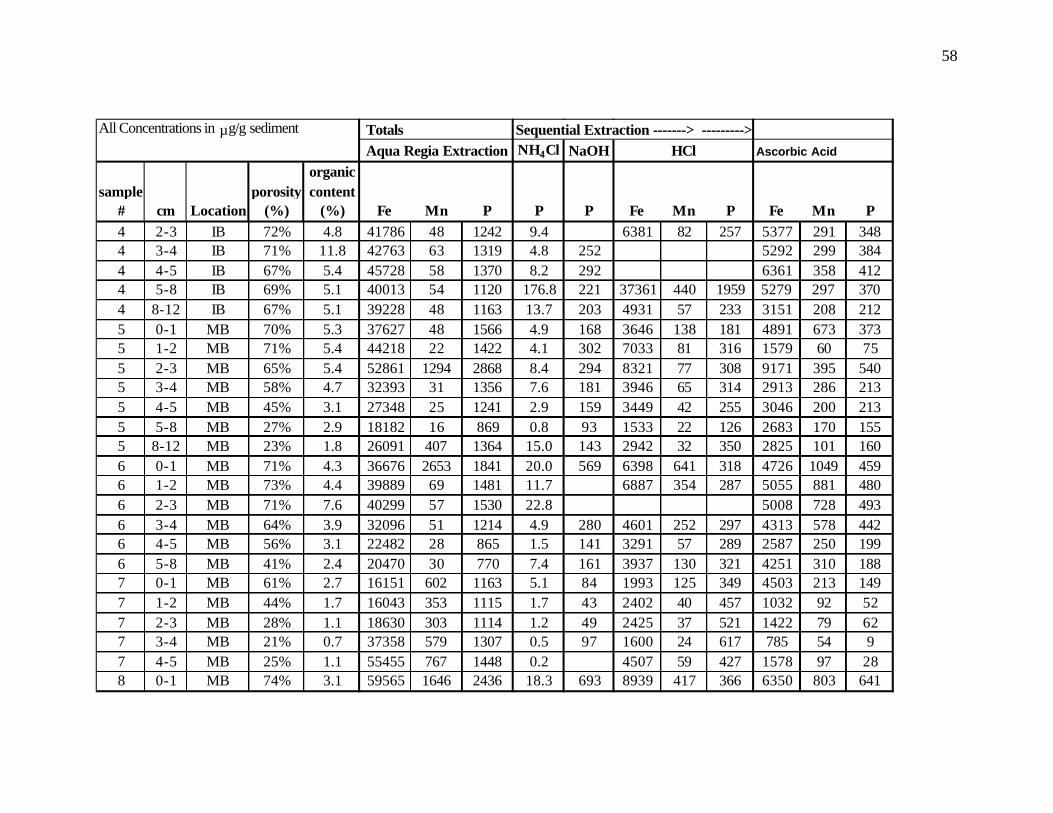
58
All Concentrations in µg/g sediment Totals Sequential Extraction -------> --------->Aqua Regia Extraction NH4Cl NaOH HCl Ascorbic Acid
sample # cm Location
porosity (%)
organic content
(%) Fe Mn P P P Fe Mn P Fe Mn P4 2-3 IB 72% 4.8 41786 48 1242 9.4 6381 82 257 5377 291 3484 3-4 IB 71% 11.8 42763 63 1319 4.8 252 5292 299 3844 4-5 IB 67% 5.4 45728 58 1370 8.2 292 6361 358 4124 5-8 IB 69% 5.1 40013 54 1120 176.8 221 37361 440 1959 5279 297 3704 8-12 IB 67% 5.1 39228 48 1163 13.7 203 4931 57 233 3151 208 2125 0-1 MB 70% 5.3 37627 48 1566 4.9 168 3646 138 181 4891 673 3735 1-2 MB 71% 5.4 44218 22 1422 4.1 302 7033 81 316 1579 60 755 2-3 MB 65% 5.4 52861 1294 2868 8.4 294 8321 77 308 9171 395 5405 3-4 MB 58% 4.7 32393 31 1356 7.6 181 3946 65 314 2913 286 2135 4-5 MB 45% 3.1 27348 25 1241 2.9 159 3449 42 255 3046 200 2135 5-8 MB 27% 2.9 18182 16 869 0.8 93 1533 22 126 2683 170 1555 8-12 MB 23% 1.8 26091 407 1364 15.0 143 2942 32 350 2825 101 1606 0-1 MB 71% 4.3 36676 2653 1841 20.0 569 6398 641 318 4726 1049 4596 1-2 MB 73% 4.4 39889 69 1481 11.7 6887 354 287 5055 881 4806 2-3 MB 71% 7.6 40299 57 1530 22.8 5008 728 4936 3-4 MB 64% 3.9 32096 51 1214 4.9 280 4601 252 297 4313 578 4426 4-5 MB 56% 3.1 22482 28 865 1.5 141 3291 57 289 2587 250 1996 5-8 MB 41% 2.4 20470 30 770 7.4 161 3937 130 321 4251 310 1887 0-1 MB 61% 2.7 16151 602 1163 5.1 84 1993 125 349 4503 213 1497 1-2 MB 44% 1.7 16043 353 1115 1.7 43 2402 40 457 1032 92 527 2-3 MB 28% 1.1 18630 303 1114 1.2 49 2425 37 521 1422 79 627 3-4 MB 21% 0.7 37358 579 1307 0.5 97 1600 24 617 785 54 97 4-5 MB 25% 1.1 55455 767 1448 0.2 4507 59 427 1578 97 288 0-1 MB 74% 3.1 59565 1646 2436 18.3 693 8939 417 366 6350 803 641

59
All Concentrations in µg/g sediment Totals Sequential Extraction -------> --------->Aqua Regia Extraction NH4Cl NaOH HCl Ascorbic Acid
sample # cm Location
porosity (%)
organic content
(%) Fe Mn P P P Fe Mn P Fe Mn P8 1-2 MB 77% 4.6 33627 896 1181 13.6 541 8153 261 314 6172 476 5278 2-3 MB 76% 59232 1425 2087 16.8 751 9698 251 548 5772 507 4238 3-4 MB 74% 3.3 63397 1148 1797 19.4 210 3900 66 233 3244 262 2588 4-5 MB 70% 5.0 38267 655 1531 12.0 260 5316 123 321 3745 329 2408 5-8 MB 72% 4.3 17.3 498 5109 77 384 3000 242 2278 8-12 MB 59% 4.7 10.0 192 6645 96 416 2062 141 1469 0-1 MB 44% 1.2 10030 223 827 15.7 54 997 18 487 973 70 969 1-2 MB 35% 0.0 7487 109 525 6.7 40 365 24 269 2-3 MB 31% 1.4 8932 148 583 4.3 107 481 10 311 207 18 169 3-4 MB 31% 2.0 10614 151 579 2.1 36 552 9 303 1115 35 499 4-5 MB 40% 2.9 19725 202 662 6.9 177 2429 31 501 605 62 489 5-8 MB 42% 3.6 30850 345 987 4.2 65 1903 43 379 687 102 42
10 0-1 MB 72% 4.1 67104 1623 1942 17.1 373 11926 257 347 6407 485 42910 1-2 MB 74% 3.2 58904 1280 1594 14.9 259 6473 111 238 5338 370 32010 2-3 MB 74% 3.2 60706 1634 2154 18.6 459 7294 137 191 6368 521 55510 3-4 MB 73% 4.6 74125 1756 2583 13.9 509 11591 222 319 5675 378 47310 4-5 MB 71% 4.2 70845 1607 2320 16.2 398 11945 227 333 5401 341 45510 5-8 MB 68% 4.1 63949 1740 2040 11.5 10666 289 299 7494 567 52910 8-12 MB 71% 4.4 65241 1356 1944 13.2 396 8268 137 297 5458 335 36011 0-1 MB 75% 5.0 57537 3017 2857 16.3 513 6948 419 260 6434 953 71911 2-3 MB 73% 5.2 47279 959 1701 10.4 219 5030 62 255 3708 192 20811 3-4 MB 69% 4.7 44252 898 1616 8.1 187 4405 39 189 4874 233 24511 4-5 MB 63% 4.4 35095 689 1397 5.4 231 3591 44 364 6756 288 50411 5-8 MB 50% 3.2 23791 468 1372 6.1 122 1854 31 312 1292 85 97

60
All Concentrations in µg/g sediment Totals Sequential Extraction -------> --------->Aqua Regia Extraction NH4Cl NaOH HCl Ascorbic Acid
sample # cm Location
porosity (%)
organic content
(%) Fe Mn P P P Fe Mn P Fe Mn P12 0-1 MB 74% 5.1 60254 1941 2277 9.8 374 6620 252 297 6144 586 48212 1-2 MB 72% 5.0 8014 128 619 7.9 532 5338 345 36712 2-3 MB 70% 5.1 50945 1038 1881 7.3 419 5014 103 273 0 0 012 3-4 MB 69% 4.6 58301 1167 1970 16.8 311 4180 79 237 5663 387 36912 4-5 MB 71% 4.6 53752 1021 2046 9.1 389 5598 89 255 5703 296 51012 5-8 MB 71% 5.0 44807 886 1550 5.7 251 6832 168 407 4184 268 29912 8-12 MB 57% 4.6 36397 626 1377 5.8 164 2857 44 279 2472 164 15113 0-1 MB 54% 2.8 23777 519 1237 6.8 85 4220 74 516 1587 128 10513 1-2 MB 34% 3.4 23216 497 1244 6.9 81 3497 57 350 2824 173 12813 2-3 MB 2.8 18388 337 1145 149 2846 30 451 1865 100 8113 3-4 MB 34% 2.4 11414 212 841 4.2 75 1700 104 7213 4-5 MB 34% 1.8 15439 228 784 7.1 248 3136 43 461 822 36 3813 5-8 MB 28% 1.2 19626 247 1103 3.2 79 1564 15 374 1631 42 4813 8-12 MB 27% 3.6 20526 231 1169 2.3 60 2822 21 289 1690 55 8614 0-1 IB 74% 4.9 59200 1558 2196 13.9 371 5025 147 253 4868 431 42014 1-2 IB 74% 5.5 51727 1206 2047 12.7 531 5380 141 181 7303 426 51814 2-3 IB 74% 7.0 53303 915 1942 0.0 627 7137 124 269 1790 112 13714 3-4 IB 73% 5.5 50255 879 1690 11.7 353 7317 120 336 5359 270 33414 4-5 IB 71% 5.6 52045 1020 1759 8.7 476 5050 94 255 4180 246 24814 5-8 IB 71% 5.7 46923 856 1509 9.1 538 7685 117 394 4976 276 31014 8-12 IB 64% 4.9 42102 795 1448 12.1 339 2719 57 234 3199 274 33215 0-1 IB 72% 3.7 46643 1106 1677 14.6 353 5012 93 256 4660 338 37715 1-2 IB 72% 4.9 42928 769 1514 12.2 355 10903 170 435 4135 238 30515 2-3 IB 73% 5.5 46254 732 1679 11.6 374 11578 168 440 5026 208 355

61
All Concentrations in µg/g sediment Totals Sequential Extraction -------> --------->Aqua Regia Extraction NH4Cl NaOH HCl Ascorbic Acid
sample # cm Location
porosity (%)
organic content
(%) Fe Mn P P P Fe Mn P Fe Mn P15 3-4 IB 70% 5.7 51525 944 1799 9.9 144 7078 107 271 6118 285 37015 4-5 IB 63% 5.1 40315 621 1399 12.9 237 7282 85 289 4471 197 30215 5-8 IB 69% 5.8 41420 673 1352 13.2 313 10760 135 479 3842 211 25915 8-12 IB 63% 5.3 47979 764 1891 18.0 335 12248 228 68916 0-1 IB 46% 3.7 15011 241 1272 6.2 211 4932 70 574 1556 88 18516 2-3 IB 45% 4.0 20849 336 1306 8.5 148 2016 23 271 1528 82 15416 3-4 IB 43% 4.4 5.4 18516 4-5 IB 39% 2.9 12709 188 987 5.9 169 1510 20 337 1320 60 12616 5-8 IB 37% 2.9 2.8 117 1924 23 391 1656 89 11116 8-12 IB 38% 3.4 15467 190 1112 3.9 171 2205 22 543 2021 86 15917 0-1 SBW 65% 8.4 46766 602 4327 40.2 1124 4042 64 251 5232 193 92717 1-2 SBW 70% 22.0 24.5 800 1179 29 85 2043 140 149217 2-3 SBW 73% 22.3 21314 402 4245 19.6 2292 1455 45 100 1752 144 164117 3-4 SBW 74% 26.5 15898 384 4432 23.9 1993 901 31 53 1400 140 188017 4-5 SBW 72% 16.3 13127 646 2581 69.1 909 511 15 37 1771 211 147117 5-8 SBW 71% 13.4 16164 737 2140 44.0 1430 879 29 54 881 99 138717 8-12 SBW 75% 22.9 11949 524 2711 30.1 1447 1083 57 51 1059 143 109619 0-1 SBW 52% 4.9 33707 438 2144 20.2 619 1667 81 38919 1-2 SBW 54% 5.2 48278 623 3206 28.2 923 118 7 2 2054 81 57119 2-3 SBW 48% 5.2 411 3185 54 38319 3-4 SBW 49% 4.6 24405 274 1525 229 2958 42 307 1504 52 34619 4-5 SBW 42% 5.7 26742 320 1642 12.9 470 2801 40 270 2052 67 42819 5-8 SBW 38% 6.0 20958 237 1335 10.6 2366 36 290 1847 62 32719 8-12 SBW 28% 3.0 22190 271 1295 7.7 1561 47 274

62
All Concentrations in µg/g sediment Totals Sequential Extraction -------> --------->Aqua Regia Extraction NH4Cl NaOH HCl Ascorbic Acid
sample # cm Location
porosity (%)
organic content
(%) Fe Mn P P P Fe Mn P Fe Mn P20 0-1 SBW 69% 4.2 42315 667 3253 41.0 572 2465 40 167 4367 193 91920 1-2 SBW 70% 7.4 32.4 674 4351 52 260 4503 189 86420 2-3 SBW 70% 8.6 39926 584 2797 31.7 796 5092 53 294 4493 167 84220 3-4 SBW 71% 9.4 36206 496 2437 31.1 904 8461 122 393 3673 161 80920 4-5 SBW 67% 6.5 32.4 972 5523 56 293 4250 163 85920 5-8 SBW 67% 9.9 26.4 896 6116 57 41620 8-12 SBW 57% 8.5 28257 373 2134 24.1 592 4358 48 339 4880 171 70421 0-1 IB 21% 5540 107 658 6.6 69 1974 46 415 825 64 7021 1-2 IB 21% 0.4 6551 100 765 3.5 852 18 515 531 29 3921 2-3 IB 19% 0.3 5497 85 679 3.5 654 15 394 401 20 2821 3-4 IB 19% 0.2 7157 106 828 3.9 37 1141 24 393 406 23 3421 4-5 IB 32% 0.3 6207 101 556 3.4 534 16 223 372 24 2321 5-8 IB 19% 0.4 7376 111 650 4.3 42 1281 25 314 2057 125 12521 8-12 IB 18% 0.6 6635 111 493 3.1 18 1343 28 244 658 40 8024 0-1 IB 70% 4.9 39276 1297 1800 11.8 496 6720 232 277 5690 565 52024 1-2 IB 71% 4.2 16.0 213 7004 150 301 5012 423 47324 2-3 IB 67% 4.8 9.9 213 2713 41 155 3997 270 29824 3-4 IB 64% 4.1 48100 949 1801 8.4 341 2982 46 139 4211 269 33324 4-5 IB 63% 4.7 48167 986 1861 10.0 330 3296 68 134 4591 318 45324 5-8 IB 59% 4.6 8.1 326 6300 79 42824 8-12 IB 46% 3.4 47126 662 2165 8.9 350 3741 43 429 1943 100 12325 0-1 IB 68% 4.1 34357 808 1602 16.8 347 4704 114 310 4871 355 48625 1-2 IB 70% 4.9 48600 806 1838 13.5 466 4501 50 240 4082 183 29525 2-3 IB 63% 4.4 51324 829 2187 13.2 1429 22 327 5706 202 407

63
All Concentrations in µg/g sediment Totals Sequential Extraction -------> --------->Aqua Regia Extraction NH4Cl NaOH HCl Ascorbic Acid
sample # cm Location
porosity (%)
organic content
(%) Fe Mn P P P Fe Mn P Fe Mn P25 3-4 IB 53% 4.7 36490 634 1540 13.4 367 4734 52 263 3721 209 27525 4-5 IB 61% 4.3 38997 710 1642 16.8 541 4521 69 318 3522 212 31525 5-8 IB 59% 4.8 36536 533 1460 11.9 280 4444 59 322 3746 151 22125 8-12 IB 49% 4.1 32596 493 1406 0.0 260 4532 50 482 2630 142 21927 0-1 OB 74% 1.0 68526 7654 3881 31.6 835 8316 920 160 12873 3605 171327 1-2 OB 75% 2.9 68178 3558 2576 27.5 8852 1354 86127 2-3 OB 74% 2.3 65365 2524 2147 21.5 247 5442 118 143 7703 821 50027 3-4 OB 73% 4.3 64492 3033 2055 3.9 431 10783 251 232 9612 1089 44327 4-5 OB 71% 4.3 64461 2156 2367 18.5 512 8677 129 224 6858 594 53927 5-8 OB 72% 5.0 59259 2250 2165 13.4 810 9779 221 280 6900 761 62027 8-12 OB 60% 3.3 49298 1455 1593 9.1 8518 174 291 4520 444 344

All Concentrations in µg/g sediment TotalsAqua Regia Extraction
sample #
cm interval Location
porosity (%)
organic content
(%) Fe Mn P28 3-4 SBW 53% 7.3 44177 2142 218128 4-5 SBW 59% 8.9 36074 1766 174828 5-8 SBW 48% 6.7 38588 1909 184028 8-12 SBW 59% 9.9 37806 1788 151629 0-1 SBW 44% 3.3 10681 489 66729 1-2 SBW 35% 3.2 15661 696 92929 2-3 SBW 29% 2.5 14062 173 98830 0-1 SBW 37% 4.8 32963 586 301830 2-3 SBW 31% 4.5 28181 347 213930 3-4 SBW 24% 4.5 33198 1653 224830 4-5 SBW 27% 3.9 38374 1859 253530 5-8 SBW 30% 3.0 29160 1391 165130 8-12 SBW 28% 3.4 13946 236 82331 0-1 SBW 55% 4.5 28263 363 209031 1-2 SBW 38% 4.7 26450 392 200931 2-3 SBW 39% 5.6 26416 364 196731 3-4 SBW 42% 5.6 32174 439 250031 5-8 SBW 36% 4.5 30248 396 237931 8-12 SBW 26% 3.1 15556 179 112632 0-1 SBW 60% 10.8 36605 452 273632 1-2 SBW 68% 12.3 43400 444 255132 2-3 SBW 68% 13.1 35940 381 253432 3-4 SBW 68% 12.2 52515 2438 305732 4-5 SBW 63% 12.8 11926 130 95132 5-8 SBW 66% 12.7 43950 473 2652

All Concentrations in µg/g sediment Totals
Aqua Regia Extraction
sample #
cm interval Location
porosity (%)
organic content
(%) Fe Mn P33 1-2 SBW 43% 4.8 29355 336 194533 2-3 SBW 47% 5.1 39220 1914 248633 3-4 SBW 47% 4.8 30360 334 219233 4-5 SBW 43% 5.2 28551 343 212233 5-8 SBW 34% 5.2 37021 461 267733 8-12 SBW 41% 5.5 33429 435 239234 0-1 SBW 59% 6.4 37657 461 252034 1-2 SBW 59% 5.2 49518 2430 297234 2-3 SBW 60% 6.2 44115 2172 283834 3-4 SBW 58% 5.3 42451 2029 278934 4-5 SBW 57% 5.5 44944 2197 285634 5-8 SBW 48% 5.0 35261 418 251734 8-12 SBW 51% 6.5 36096 447 247535 0-1 IB 68% 4.9 41294 2011 166335 1-2 IB 65% 5.0 40414 1989 143835 2-3 IB 62% 4.4 35355 1739 130635 3-4 IB 62% 4.3 36643 1771 141635 4-5 IB 58% 3.5 41408 1993 162735 5-8 IB 57% 4.9 36510 1705 135235 8-12 IB 56% 4.4 32672 1623 123936 0-1 IB 43% 1.8 13638 620 97036 1-2 IB 42% 1.8 12555 583 94336 2-3 IB 35% 1.5 11702 546 94436 3-4 IB 30% 1.4 11180 533 83936 4-5 IB 31% 0.9 9340 417 759
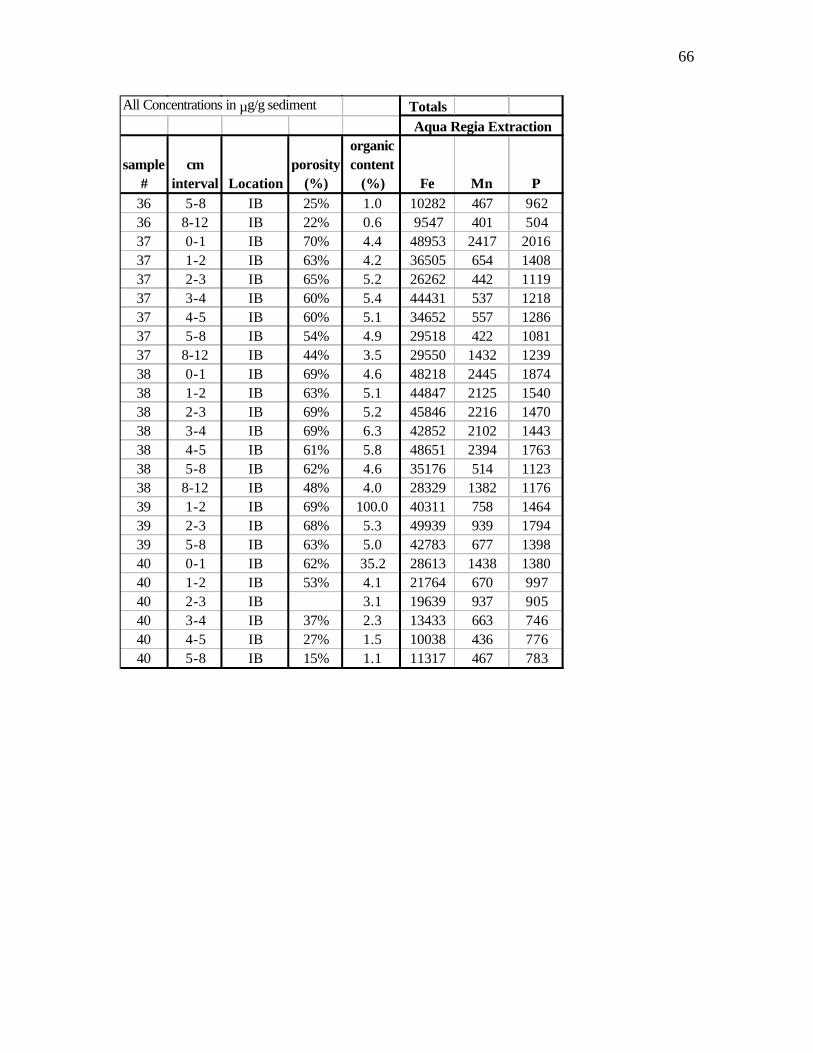
66
All Concentrations in µg/g sediment TotalsAqua Regia Extraction
sample #
cm interval Location
porosity (%)
organic content
(%) Fe Mn P36 5-8 IB 25% 1.0 10282 467 96236 8-12 IB 22% 0.6 9547 401 50437 0-1 IB 70% 4.4 48953 2417 201637 1-2 IB 63% 4.2 36505 654 140837 2-3 IB 65% 5.2 26262 442 111937 3-4 IB 60% 5.4 44431 537 121837 4-5 IB 60% 5.1 34652 557 128637 5-8 IB 54% 4.9 29518 422 108137 8-12 IB 44% 3.5 29550 1432 123938 0-1 IB 69% 4.6 48218 2445 187438 1-2 IB 63% 5.1 44847 2125 154038 2-3 IB 69% 5.2 45846 2216 147038 3-4 IB 69% 6.3 42852 2102 144338 4-5 IB 61% 5.8 48651 2394 176338 5-8 IB 62% 4.6 35176 514 112338 8-12 IB 48% 4.0 28329 1382 117639 1-2 IB 69% 100.0 40311 758 146439 2-3 IB 68% 5.3 49939 939 179439 5-8 IB 63% 5.0 42783 677 139840 0-1 IB 62% 35.2 28613 1438 138040 1-2 IB 53% 4.1 21764 670 99740 2-3 IB 3.1 19639 937 90540 3-4 IB 37% 2.3 13433 663 74640 4-5 IB 27% 1.5 10038 436 77640 5-8 IB 15% 1.1 11317 467 783
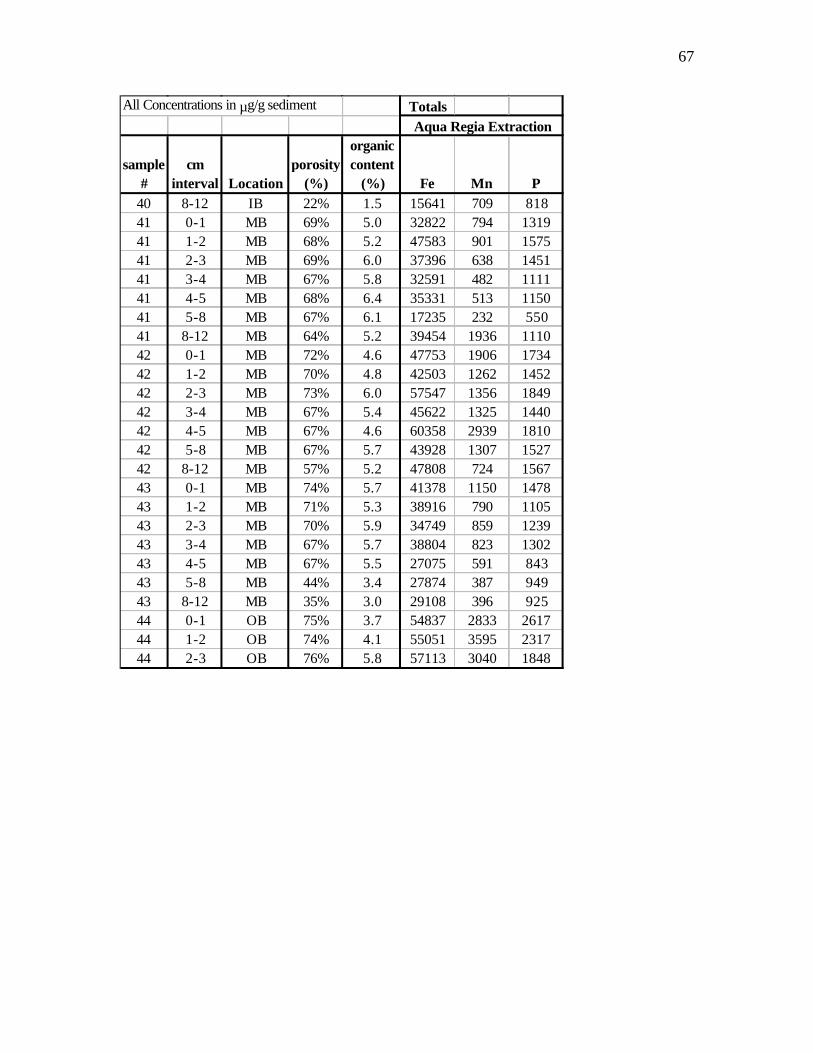
67
All Concentrations in µg/g sediment TotalsAqua Regia Extraction
sample #
cm interval Location
porosity (%)
organic content
(%) Fe Mn P40 8-12 IB 22% 1.5 15641 709 81841 0-1 MB 69% 5.0 32822 794 131941 1-2 MB 68% 5.2 47583 901 157541 2-3 MB 69% 6.0 37396 638 145141 3-4 MB 67% 5.8 32591 482 111141 4-5 MB 68% 6.4 35331 513 115041 5-8 MB 67% 6.1 17235 232 55041 8-12 MB 64% 5.2 39454 1936 111042 0-1 MB 72% 4.6 47753 1906 173442 1-2 MB 70% 4.8 42503 1262 145242 2-3 MB 73% 6.0 57547 1356 184942 3-4 MB 67% 5.4 45622 1325 144042 4-5 MB 67% 4.6 60358 2939 181042 5-8 MB 67% 5.7 43928 1307 152742 8-12 MB 57% 5.2 47808 724 156743 0-1 MB 74% 5.7 41378 1150 147843 1-2 MB 71% 5.3 38916 790 110543 2-3 MB 70% 5.9 34749 859 123943 3-4 MB 67% 5.7 38804 823 130243 4-5 MB 67% 5.5 27075 591 84343 5-8 MB 44% 3.4 27874 387 94943 8-12 MB 35% 3.0 29108 396 92544 0-1 OB 75% 3.7 54837 2833 261744 1-2 OB 74% 4.1 55051 3595 231744 2-3 OB 76% 5.8 57113 3040 1848

68
All Concentrations in µg/g sediment TotalsAqua Regia Extraction
sample #
cm interval Location
porosity (%)
organic content
(%) Fe Mn P44 3-4 OB 73% 5.2 50720 2593 149844 4-5 OB 76% 6.6 49531 2447 153344 5-8 OB 66% 4.4 43547 1630 217644 8-12 OB 44% 3.9 47753 2316 190045 0-1 OB 74% 4.8 47616 1445 168045 1-2 OB 70% 5.9 49159 1747 219945 2-3 OB 68% 6.2 51368 1951 214445 3-4 OB 57% 4.3 47024 1671 174545 4-5 OB 39% 4.8 44382 1093 234745 5-8 OB 21% 3.8 37366 666 132545 8-12 OB 46% 3.5 35096 628 1101

69
Appendix C - Historical Comparison
Total Phosphorus (µg/g) Total Iron (µg/g)Core
Number Depth 1982 1992 2004 1982 1992 2004∆ P - 1982
∆ P - 1992
∆Fe - 1982
∆Fe - 1992
1 1 1984 1090 2214 34520 35856 60642 230 1124 26122 247861 2 1864 1077 1954 30235 35986 59436 90 877 29201 234501 4 1625 1115 2564 30164 35961 81945 939 1449 51781 459841 8 1168 1183 1678 28259 35081 57503 510 495 29244 224222 1 1407 944 3195 27296 28051 63438 1788 2251 36142 353872 2 1338 877 2203 23745 25326 48056 865 1326 24311 227302 4 1299 914 2018 23407 25922 44570 719 1104 21163 186482 8 1194 801 1190 25736 25770 16980 -4 389 -8756 -87903 1 1171 995 973 16883 12376 13310 -198 -22 -3573 9343 2 1141 948 2277 13605 11674 29498 1136 1329 15893 178243 4 1176 868 1354 14586 9794 15656 178 486 1070 58623 8 1063 669 1305 10998 9612 19111 242 636 8113 94994 1 1086 158 1541 30382 33430 44440 455 1383 14058 110104 2 972 1002 1565 27480 35140 47451 593 563 19971 123114 4 931 1087 1319 26187 33968 41786 388 232 15599 78184 8 859 954 1163 24109 30542 39228 304 209 15119 86865 1 779 495 1566 13217 8632 37627 787 1071 24410 289955 2 460 397 1422 9158 6883 44218 962 1025 35060 373355 4 276 382 1356 6484 4626 32393 1080 974 25909 277675 8 276 955 1364 1088 4097 1 766 955 1163 9270 14928 16151 397 208 6881 12237 2 581 798 1115 9068 11347 16043 534 317 6975 46967 4 671 784 1307 9170 39457 37358 636 523 28188 -20997 8 683 824 1448 33353 44328 55454 765 624 22101 111268 1 1707 1518 29933 307028 2 1292 1115 2436 26923 27349 59565 1144 1321 32642 322168 4 1082 915 2087 26118 26988 59232 1005 1172 33114 322448 8 988 881 1531 20970 20886 38267 543 650 17297 173819 1 1418 619 827 14526 6710 10030 -591 208 -4496 33209 2 930 606 525 20010 6139 7487 -405 -81 -12523 13489 4 862 542 579 25314 6663 10614 -283 37 -14700 39519 8 846 571 987 12807 17528 30580 141 416 17773 1305210 1 1828 1283 1942 67104 114 65910 2 1716 1321 1594 35961 37671 58904 -122 273 22943 2123310 4 1541 1316 2583 28489 37301 70845 1042 1267 42356 3354410 8 1337 958 1944 33198 34518 65241 607 986 32043 3072311 1 1726 588 2857 21306 13053 57537 1131 2269 36231 4448411 2 1615 603 1701 24062 14629 47279 86 1098 23217 3265011 4 1346 566 1616 35278 15029 44252 270 1050 8974 2922311 8 1039 479 1372 58459 14287 23721 333 893 -34738 9434

70
Total Phosphorus (µg/g) Total Iron (µg/g)Core
Number Depth 1982 1992 2004 1982 1992 2004∆ P - 1982
∆ P - 1992
∆Fe - 1982
∆Fe - 1992
12 1 1660 1176 2277 33689 34845 60254 617 1101 26565 2540912 2 1373 1174 619 33224 44264 8014 -754 -555 -25210 -3625012 4 1287 1057 1970 33051 31969 58301 683 913 25250 2633212 8 1325 877 1377 30812 27214 36397 52 500 5585 918313 1 1061 702 1237 1663 14223 23216 176 535 21553 899313 2 1051 624 1244 23439 16516 18388 193 620 -5051 187213 4 1028 595 841 23355 18117 11414 -187 246 -11941 -670315 1 1465 1132 1677 212 54515 2 1381 1229 1514 133 28515 4 1305 1255 1799 494 54415 8 1281 1156 1891 610 73516 1 1185 1210 1272 87 6216 2 1081 1187 1306 225 11916 4 1109 790 987 -122 19716 8 1057 696 1112 55 41617 1 2370 2136 4327 23742 30578 46766 1957 2191 23024 1618817 2 2288 2108 4245 23885 28241 21314 1957 2137 -2571 -692717 4 2344 2067 4432 2088 236517 8 2195 1941 2711 516 77019 1 3255 1838 2144 24481 24040 33707 -1111 306 9226 966719 2 2982 1809 3206 23775 22391 48278 224 1397 24503 2588719 4 2898 1826 1525 24353 22392 24405 -1373 -301 52 201319 8 2752 1834 1295 22794 22986 22190 -1457 -539 -604 -79620 1 2565 1914 3253 24591 30204 42318 688 1339 17727 1211420 2 2444 1894 2797 16657 29889 39926 353 903 23269 1003720 4 2248 1757 2437 23981 27339 189 68020 8 1378 1337 2134 19053 18947 28257 756 797 9204 931024 1 1658 1040 1800 29264 29798 39276 142 760 10012 947824 2 1349 1070 28360 28478 48100 19740 1962224 4 1185 1064 1801 26235 26939 48167 616 737 21932 2122824 8 1013 977 1363 22185 23774 37823 350 386 15638 1404925 1 1238 1083 1602 20985 26181 34357 364 519 13372 817625 2 1265 1058 1838 22384 24679 48600 573 780 26216 2392125 4 1160 1116 1540 20110 23340 36490 380 424 16380 1315025 8 957 1238 1406 13677 24255 32596 449 168 18919 834127 1 3234 2080 3881 48893 42759 68526 647 1801 19633 2576727 2 2248 1587 2576 38174 37685 68178 328 989 30004 3049327 4 1507 1146 2055 34329 34553 64492 548 909 30163 2993927 8 1427 1023 1593 33160 34287 49298 166 570 16138 15011
AVERAGES 1433 1099 1832 24073 24515 39911 399 733 15838 15396

71
Appendix D Raw data files are available on an excel spreadsheet. Note that all ICP analyses presented are the result of triplicate analyses, analytical errors presented are from deviations in analysis.