Embed Size (px)
Citation preview
Concept Paper
DETERMINATION OF RATE OF RETURN FOR POWER
SECTOR
Tariff Division
National Electric Power Regulatory Authority
1
Introduction
The objective of this paper is to evaluate the prevalent practice followed by NEPRA for
determining/evaluating RoE and IRR for various technologies, and to offer recommendations for
more informed decision making in this regard. This paper is an attempt to use conventional
project finance technique to compute the expected cost of equity to commensurate the investors
interested to invest in Pakistan’s power sector. This is an initial draft expected to be revised
many times after an exhaustive in house reviews before it is open for external review. In this
report at first, a distinction has been made between Rate of Return or interchangeably referred in
this report as Return on Equity vis-à-vis Internal Rate of Return. Afterwards, a Capital Asset
Pricing Model (CAPM) has been used for calculating expected return on equity. CAPM can be
applied in many ways. Efforts have been made that the assumptions used are sound, reasonable
and reflective of the power sector’s unique offerings. Finally, some issues related to technology
specific return, RoE under Cost Plus regime versus Upfront regime, RoE review period have
been highlighted that needs to be further reviewed.
2
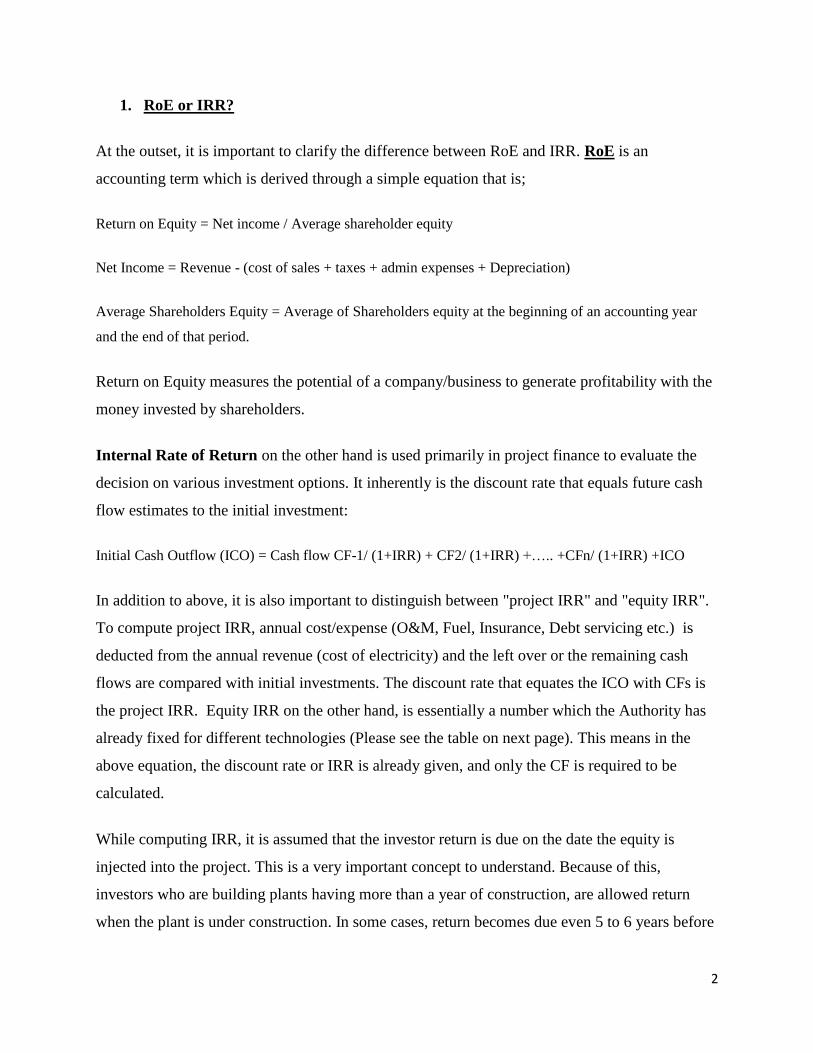
1. RoE or IRR?
At the outset, it is important to clarify the difference between RoE and IRR. RoE is an
accounting term which is derived through a simple equation that is;
Return on Equity = Net income / Average shareholder equity
Net Income = Revenue - (cost of sales + taxes + admin expenses + Depreciation)
Average Shareholders Equity = Average of Shareholders equity at the beginning of an accounting year
and the end of that period.
Return on Equity measures the potential of a company/business to generate profitability with the
money invested by shareholders.
Internal Rate of Return on the other hand is used primarily in project finance to evaluate the
decision on various investment options. It inherently is the discount rate that equals future cash
flow estimates to the initial investment:
Initial Cash Outflow (ICO) = Cash flow CF-1/ (1+IRR) + CF2/ (1+IRR) +….. +CFn/ (1+IRR) +ICO
In addition to above, it is also important to distinguish between "project IRR" and "equity IRR".
To compute project IRR, annual cost/expense (O&M, Fuel, Insurance, Debt servicing etc.) is
deducted from the annual revenue (cost of electricity) and the left over or the remaining cash
flows are compared with initial investments. The discount rate that equates the ICO with CFs is
the project IRR. Equity IRR on the other hand, is essentially a number which the Authority has
already fixed for different technologies (Please see the table on next page). This means in the
above equation, the discount rate or IRR is already given, and only the CF is required to be
calculated.
While computing IRR, it is assumed that the investor return is due on the date the equity is
injected into the project. This is a very important concept to understand. Because of this,
investors who are building plants having more than a year of construction, are allowed return
when the plant is under construction. In some cases, return becomes due even 5 to 6 years before
3
the plant sells the first unit. The return during construction is then accumulated and paid back to
the investors - principal along with the return on the outstanding amount- over the entire project
life. The treatment of Return on Equity during construction (RoEDC) is basically equal to
Interest during construction (IDC). If IDC is the lenders return during construction, RoEDC is
the investors compensation for the equity injected into the project. At NEPRA, the original
equity is added back at the end year of the project life to quantify the project residual value.
Once the long-term PPA is ended and the debt obligation is gone, the plant still has a value, so
the residual value needs to be included in the IRR calculation. Equity investment in Pakistan is
just like investing in bonds wherein, like bonds, you receive an annual coupon payment and once
the bonds mature, you get the principal bond value back again.
The issue of IRR also needs to be looked into from the perspective of a regulator. For instance,
why the Authority allows equity IRR and not the project IRR? The reason is that under the cost
plus regime, all prudent expected cost is established by the Authority for a particular project.
When, let’s say an EPC cost is fixed, ideally, the investor can neither earn profit, nor incur loss
on it because the EPC ought to reflect the market cost. In most thermal cases, a petitioner is
required to submit firmed non-reopenable EPC contract. This leaves little room for price
negotiation. Even, if the investor manages to reduce the EPC cost, post approval, the Authority
adjusts the EPC cost at a later stage and thus deny the investor the benefit of any cost saving. In
brief, the investors’ only interest in the project is the return that is allowed on the equity injected.
2. IRR for Generation Projects- Existing Scenario
The existing generation tariff regimes of NEPRA, both upfront and cost-plus, allow for a fixed
Internal Rate of Return (IRR). The IRR presently ranges in-between 15% and 20%. The table
below incorporates list of technologies and the corresponding returns allowed by the Authority:
RoE/IRR Small
Hydro
Large
Hydro Coal Solar Wind (RFO/Gas) Bagasse
RLNG
(interim)
Upfront 20% - 17% to
20% 17% 17% 15% - 16%
Cost-plus 17% 17% - - 17% - 17%
4
The working out of such IRR now needs to be effectively depicted against specific risk and return
matrix and its adjustment for a particular technology. The IRR thus allowed should clearly spell
out and be reflective of a return which has built-in approach to account for various parameters,
such as; (a) prevailing power sector incentive packages, (b) associated country risks, (c) variants
of that particular technology, (d) level of incentive to be created for investors and e) whether the
investor is opting for upfront or cost plus regime.
Determining the required rate of return for power generation projects is thus dependent on above
referred parameters. Regardless of the approach, an IRR to be effective, it has to correspond to the
risks associated with generating electricity and at the same time engaging enough to attract the
capital needed for a specific technology or purpose (generation or transmission). For example,
technologies that have not been explored to the fullest potential and/or needed to quickly add
power generation to the system may be offered a higher return to attract more rapid investment.
Equally important should be the idea that the IRR offered by Regulator must be more tailored
towards improving the energy mix that is more reflective of a Country’s available natural resources
and macro-economic conditions. An IRR offered that is segregated, will be able to clearly reflect
the incentive for investors for a particular technology or resource for improving energy mix that is
best optimized for the Country.
3. A Risk Adjusted IRR:
Previously, guidelines for Determination of Tariff for Independent Power Producers, 2005,
allowed for an IRR that was equal to the long-term interest rate based on the auction of 10-year
PIB plus a premium of X% to be determined by NEPRA. Later, according to the latest Power
Generation Policy, 2015, the Government has now indexed ROE component of tariff to US dollar,
ensuring a US Dollar based return to the equity holders of power generation projects in Pakistan.
There are various methods to determine RoE i.e. Arbitrage Pricing Model, Fama French 3 factor
model, etc. and all these models have their pros and cons. There is one method however that
stands out the most in term of its frequency of usage, despite having shortcoming that is, the
5
Capital Asset Pricing Model (CAPM). CAPM was first developed by William Sharpe and John
Lintner for which William Sharpe was given the Nobel Prize in 19901 (Rehman).
How to determine risk and return profile of the company and/or market is an intense academic
debate that has been taking place for decades. Due to the limited scope of this paper, we have not
delved into that discussion. In this paper, we will be exploring return based on the CAPM single
factor model. We will use a particular derivative of CAPM called the “Bludgeon Approach” for
determining expected return on equity. Under this approach, it is assumed that the companies in
the market are equally exposed to country risk premium2 (Damodaran 2003). In view thereof, the
cost of equity for a firm in a market with a country risk can be determined using the equation
below:
Cost of Equity = Risk Free rate + Beta (Market Risk Premium) + Country Risk Premium
3.1 Risk Free rate, or Rf represents the prevailing risk-free rate. It can be spot rate, annual,
5years, 10 years or 30 year rate. The Power Policy allows for dollar based return. Therefore, it is
advisable to take US based risk free rate and Market Risk Premium (MRP). For CAPM, we will
use US 5-year Treasury bond rate that any investor can get if he/she invests US Dollars in
Government securities. The interest rate differential between Pakistan risk-free rate and US risk-
free rate itself incorporates any impact of depreciation or appreciation of PKR value against the
US Dollar. Therefore, the US risk-free rate seems to an appropriate instead of earlier approaches
of Pakistani risk-free rate or PIB, keeping in mind that currency risk will be covered in this process
and will also be consistent with the spirit of Generation Policy, 2015. This information is
authentically available from the official website of the US Department of Treasury. Currently 5-
years US Treasury bonds offer a yield of 1.38%3. And the same is being used for estimating RoE.
3.2 Market Risk Premium (Rm-RF): Market risk premium is the difference between
expected return on the portfolio of stock (Rm) and the risk free rate (Rf). Generally, investment in
stock is risky, hence, MRP is the premium the investor would require above the riskless/risk-free
1 Impact of Capital Asset Pricing Model (CAPM) on Pakistan (The Case of KSE 100 Index) Hameed Ur Rehman,
Research Journal of Finance and Accounting Vol.4, No.7, 2013 2 Measuring Company Exposure to Country Risk: Theory and Practice Aswath Damodaran Stern School of Business 3 http://www.bloomberg.com/markets/rates-bonds/government-bonds/us
6
rate. For the purpose of determining expected rate of return using CAPM, Pakistan based market
return, which is actually the average return at Pakistan Stock Exchange (PSX), can be assumed.
However, the PSX is not mature market or big enough and don’t offer long term historical return
patterns to forecast future MRP. The S&P 500 which is the US equivalent of PSX, is approx. US$
18000 billion market against PSX’s US$73 billion and offer MRP since 1928.
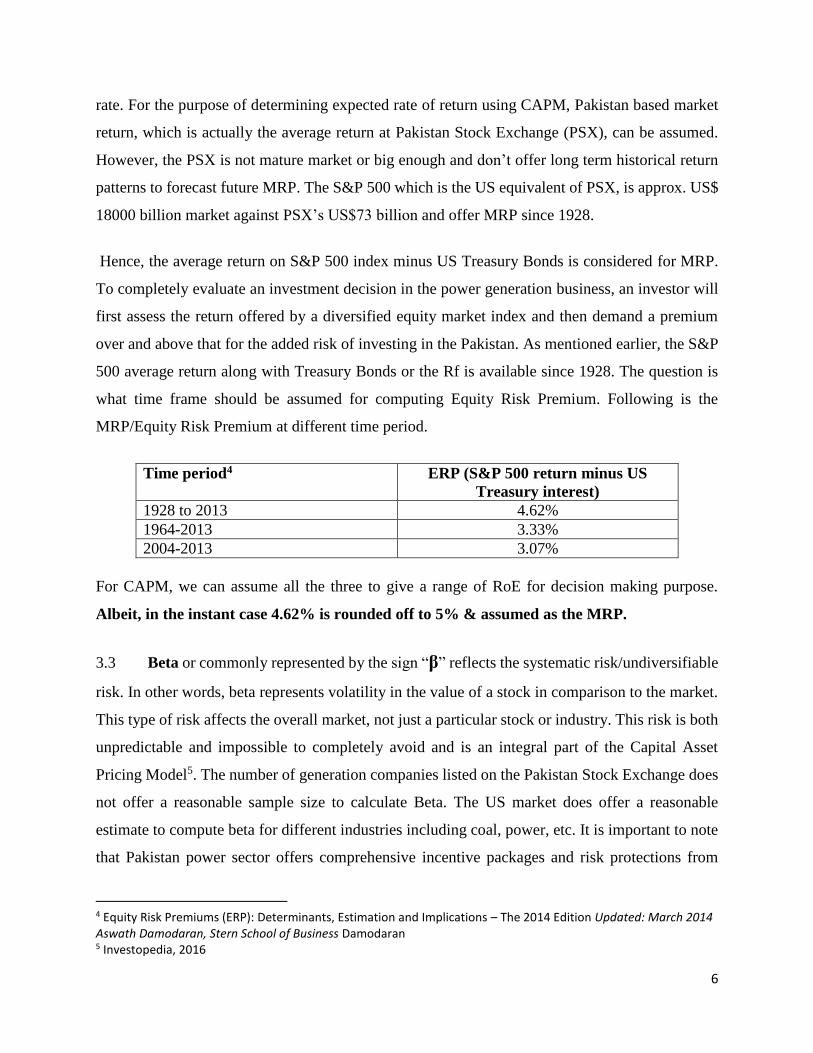
Hence, the average return on S&P 500 index minus US Treasury Bonds is considered for MRP.
To completely evaluate an investment decision in the power generation business, an investor will
first assess the return offered by a diversified equity market index and then demand a premium
over and above that for the added risk of investing in the Pakistan. As mentioned earlier, the S&P
500 average return along with Treasury Bonds or the Rf is available since 1928. The question is
what time frame should be assumed for computing Equity Risk Premium. Following is the
MRP/Equity Risk Premium at different time period.
Time period4 ERP (S&P 500 return minus US
Treasury interest)
1928 to 2013 4.62%
1964-2013 3.33%
2004-2013 3.07%
For CAPM, we can assume all the three to give a range of RoE for decision making purpose.
Albeit, in the instant case 4.62% is rounded off to 5% & assumed as the MRP.
3.3 Beta or commonly represented by the sign “β” reflects the systematic risk/undiversifiable
risk. In other words, beta represents volatility in the value of a stock in comparison to the market.
This type of risk affects the overall market, not just a particular stock or industry. This risk is both
unpredictable and impossible to completely avoid and is an integral part of the Capital Asset
Pricing Model5. The number of generation companies listed on the Pakistan Stock Exchange does
not offer a reasonable sample size to calculate Beta. The US market does offer a reasonable
estimate to compute beta for different industries including coal, power, etc. It is important to note
that Pakistan power sector offers comprehensive incentive packages and risk protections from
4 Equity Risk Premiums (ERP): Determinants, Estimation and Implications – The 2014 Edition Updated: March 2014 Aswath Damodaran, Stern School of Business Damodaran 5 Investopedia, 2016
7
inflation and exchange rate coupled with sovereign guarantees. Further, two part tariff along with
long term PPA essentially makes the generation in private sector a low risk sector. There is no
method to capture and quantify these incentives in the conventional financial method such as
CAPM. Nevertheless, ROE is required to be determined and we will have to work out ways to
determine RoE using techniques like CAPM. We believe we can do that by being as conservative
in our assumption as possible. This way we can hope to simulate the risk and return profile of the
generation business. In our opinion, IPPs based generation being driven by long-term supply
contract with single buyer closely mirror natural monopolies like utilities. In view thereof, we
believe Beta of US Utilities is more similar in risk and return profile with Pakistan IPP’s generation
business because of all the GoP/NEPRA incentive packages. Therefore, the US Utilities (general)
Unlevered Beta will be used. There is a method known as Hamada Equation through which one
can adjust a sector beta to a desired capital structure, i.e. debt to equity ratio of let’s say 70:30. But
we believe that is not required here. Generally, in conventional setup, leverage or debt increases
the level of risk for which RoE is calculated on the higher side. But under the regulatory regime
wherein debt is a pass through item and considering the fact that portion of debt has no bearing
whatsoever on RoE. De levering the unlevered beta using method like Hamada’s will
unnecessarily increase the beta & the resultant RoE. For instance, 70:30 debt equity structure
increases the unlevered beta of 0.38 to 1.26. Therefore, for CAPM, we will be using unlevered
beta of 0.36 of US Utilities (General)6
3.4 Country Risk Premium (CRP) can be determined at least in three different ways. The
first is the sovereign rating attached to a country by ratings agencies. The second is to subscribe
to services like Economic Intelligence Unit (EIU) country Risk Score. Similar services are also
offered by Political Risk Services (PRS) that you can get by paying a subscription fee. The
services include a broader measure of country risk that explicitly factor in the Economic,
political and legal risks in individual countries. The third is to go with a market based measure
such as the volatility in the country’s credit markets, i.e. Credit Default Swap (CDS) or bond
default rating7.
6 http://pages.stern.nyu.edu/~adamodar/New_Home_Page/datafile/Betas.html 7 Equity Risk Premiums (ERP): Determinants, Estimation and Implications – The 2014 Edition Updated: March 2014
Aswath Damodaran, Stern School of Business
8
We prefer measuring CRP through market based measures such as CDS. The CDS, we believe is
a better indicator of capturing CRP because it is an updated number, reflects investor perception
about a market at a particular point in time, unlike credit rating which is too slow in responding
to the country’s economic, political etc. changes.
3.5 CDS Credit Default Swap rate highlights investor sentiments about the health of a
country’s economy. It particularly measures the Government’s ability to meet its sovereign foreign
debt obligations. International investors evaluating to invest in Pakistan, particularly examine the
risk associated with default on the Country’s foreign debt and accordingly demand and expect a
compensation against that risk. If the country’s ability to meet its future sovereign foreign debt
obligations improves, the risk premium associated with this risk factor should actually contribute
to decreasing the risk-adjusted IRR for power generation. This information is also available from
reliable sources like Bloomberg. The Pakistan CDS as of January 2016 was 5.92%. This rate needs
to be adjusted to US CDS rate of 0.39% to get a pure Pakistan default rate of 5.53%. Some analyst
argues that 5.53% is the default associated with Pakistan foreign debt obligation. Equity market
on the other hand is more risky, so it has to be adjusted upward by a factor. This factor is generally
computed by dividing standard deviation of equity return with standard deviation of CDS rate.
This factor, which currently is quoted as 1.118 is further multiplied by the CDS rate to get the
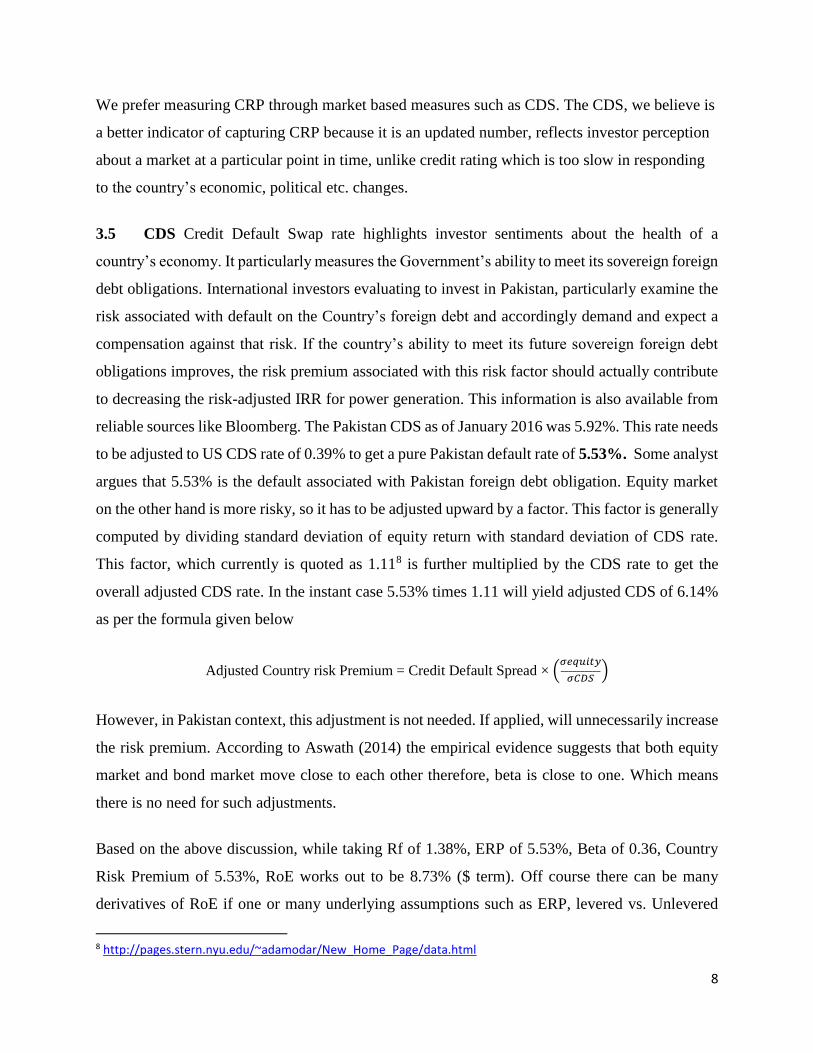
overall adjusted CDS rate. In the instant case 5.53% times 1.11 will yield adjusted CDS of 6.14%
as per the formula given below
Adjusted Country risk Premium = Credit Default Spread × (𝜎𝑒𝑞𝑢𝑖𝑡𝑦__________𝜎𝐶𝐷𝑆
)
However, in Pakistan context, this adjustment is not needed. If applied, will unnecessarily increase
the risk premium. According to Aswath (2014) the empirical evidence suggests that both equity
market and bond market move close to each other therefore, beta is close to one. Which means
there is no need for such adjustments.
Based on the above discussion, while taking Rf of 1.38%, ERP of 5.53%, Beta of 0.36, Country
Risk Premium of 5.53%, RoE works out to be 8.73% ($ term). Off course there can be many
derivatives of RoE if one or many underlying assumptions such as ERP, levered vs. Unlevered
8 http://pages.stern.nyu.edu/~adamodar/New_Home_Page/data.html
9
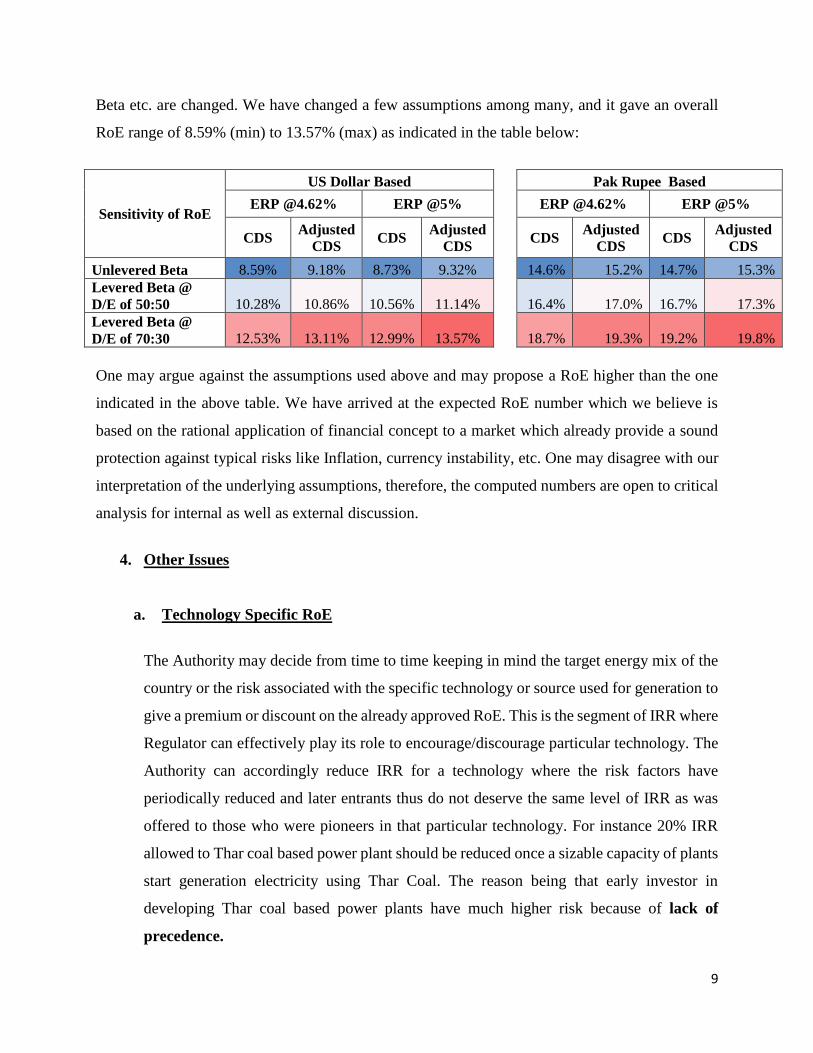
Beta etc. are changed. We have changed a few assumptions among many, and it gave an overall
RoE range of 8.59% (min) to 13.57% (max) as indicated in the table below:
Sensitivity of RoE
US Dollar Based Pak Rupee Based
ERP @4.62% ERP @5%
ERP @4.62% ERP @5%
CDS Adjusted
CDS CDS
Adjusted
CDS CDS
Adjusted
CDS CDS
Adjusted
CDS
Unlevered Beta 8.59% 9.18% 8.73% 9.32% 14.6% 15.2% 14.7% 15.3%
Levered Beta @
D/E of 50:50 10.28% 10.86% 10.56% 11.14% 16.4% 17.0% 16.7% 17.3%
Levered Beta @
D/E of 70:30 12.53% 13.11% 12.99% 13.57% 18.7% 19.3% 19.2% 19.8%
One may argue against the assumptions used above and may propose a RoE higher than the one
indicated in the above table. We have arrived at the expected RoE number which we believe is
based on the rational application of financial concept to a market which already provide a sound
protection against typical risks like Inflation, currency instability, etc. One may disagree with our
interpretation of the underlying assumptions, therefore, the computed numbers are open to critical
analysis for internal as well as external discussion.
4. Other Issues
a. Technology Specific RoE
The Authority may decide from time to time keeping in mind the target energy mix of the
country or the risk associated with the specific technology or source used for generation to
give a premium or discount on the already approved RoE. This is the segment of IRR where
Regulator can effectively play its role to encourage/discourage particular technology. The
Authority can accordingly reduce IRR for a technology where the risk factors have
periodically reduced and later entrants thus do not deserve the same level of IRR as was
offered to those who were pioneers in that particular technology. For instance 20% IRR
allowed to Thar coal based power plant should be reduced once a sizable capacity of plants
start generation electricity using Thar Coal. The reason being that early investor in
developing Thar coal based power plants have much higher risk because of lack of
precedence.
10
b. RoE under Upfront Vs. Cost Plus Regime
Under cost plus regime, as said earlier, the investor doesn’t have the option to keep the
saving arising from achieving better efficiency or reducing the cost of major CAPEX item
i.e. EPC, post NEPRA approval. The investor, primarily relies on the Authority approved
return. This is not the case in upfront tariff, wherein the investor is entitled to keep among
many things, the project cost/efficiency saving and thus can attain RoE higher than the
approved one. This means that the potential of earning profit is more in upfront tariff than
under cost plus regime and thus the return offer on upfront tariff regime should be lower
than the Cost Plus. One may argue that the potential of incurring loss in Upfront regime is
also higher so, with higher risk and return, investor opting for upfront tariff should be
compensated more. But this may not be true. The reason being that before an investor
approach NEPRA for unconditional acceptance of upfront tariff they already have done
market survey about EPC price/technology O&M cost and are reasonably sure that they
can achieve the approved cost/tech benchmarks. There will certainly be a level of risk
associated with cost increase, but that too would most likely related to project development
cost and not major items like EPC which constitute ~70% of the total project cost and for
which EPC quote can be obtained before unconditional acceptance. In view of the above,
the Authority may offer different RoE for the same technology for the investors opting for
either Upfront or Cost Plus regime.
c. Transmission & Distribution Sector
Although the current regulatory regime provides space for multiple transmission
companies, however, generally, there is one company that is responsible for
transmission of bulk of the generation that is National Transmission and Despatch
Company (NTDC). The market is now opening up, Fatima group has already obtained
special purpose transmission license and international investors have shown interest in
entering Pakistan high voltage DC transmission business as a builder and an operator.
This is certainly an exciting time for the transmission sector as the transmission sector
is where the major bottleneck lies when it comes to power evacuation from the
upcoming power plants. The prospective investor needs to be provided incentive so that
their interest remained focused in the transmission sector. A reasonable IRR
11
commensurate with the level of risk is the first step in this direction. The Federal
Government is also keen to privatize the Distribution Companies (Discos). Whether the
current returns offered Discos are sufficient to attract investment? It is understood that
generation, transmission and distribution are three separate businesses with distinct risk
profile. What are these risks? How can it be translated into a sector specific return?
These questions and many more required discussion and input from stakeholders in
arriving at reasonable rate of return for this sector which is lately seeing interest from
private players.
d. RoE Review Period
RoE once fixed for a particular period can’t be applied indefinitely to all projects. RoE
and its underlying assumption as stated earlier changes from one period to another. In
principal, RoE should be dynamic and the formula should offer flexibility to change one
or more variable so that the sector exposure to risk is adequately and timely addressed.
Two issues emerge from this discussion a) when should the overall formula including
all the underlying assumptions be reviewed or revised? b) What variables within the
RoE locking period could be revised/updated that could compute RoE to reflect
particular technology/project company risk at that point in time. To address the first
point, we believe 5 year review period is good enough to capture broad risk/return factor
for the sector. That is why in our assessment, we relied on 5 years, Rf. To address the
second issue, the CAPM equation can be updated every year only to the extent of the 5
year US Bond rate and the prevailing Country Risk Premium in addition to technology
specific premium/discount.