Embed Size (px)
Citation preview

NASA Contractor Report 3402
-_
Determination of Physical and Chemical States of Lubricants i Concentrated Contacts - Part 2
James L. Lauer
GRANT NSG-3 170 FEBRUARY 198 1
n
- ---
https://ntrs.nasa.gov/search.jsp?R=19810010770 2020-04-24T18:04:59+00:00Z

TECH LIBRARY KAFB, NM
NASA Contractor Report 3402
Determination of Physical and Chemical States of Lubricants in Concentrated Contacts - Part 2 1
James L. Lauer
Rensselaer Polytechic Iustittrte Troy, New York
Prepared for Lewis Research Center under Grant NSG-3 I 70
National Aeronautics and Space Administration
Scientific and Technical Information Branch
1981


TABLE OF CONTENTS
1. INTRODUCTION................................ 1
2. APPARATUS.................................. 3
2.1 New Ball/Plate Apparatus. ....................... 3 2.2 New Blackbody Reference ........................ 4 2.3 Polarizing Chopper, Second Interferometer ............... 6
3. RESULTS ................................... 9
3.1 Traction Fluid Spectra and Related Data . . . . . . . . . . . . . . . . 9 3.2 Effect of Trichloroethane Addition on the Infrared Emission Spectrum
of a Traction Fluid from an EHD Contact . . . . . . . . . . . . . . . . 11 3.3 Polarized Infrared Spectra of Traction Fluid with and without
Trichloroethane . . . . . . . . . . . . . . . . . . . . . . . . . . . . 13 3.4 Effect of Trichloroethane Addition on the Traction of Two Traction
Fluids....................... . . . . . . . . . . 15 3.5 Scanning Electron Microscope (SEM) Analysis and Surface X-ray Analysis
OfSteelBall............................. 16 3.6 Infrared Emission Spectra of 5P4E (Polyphenyl Ether) at Low Temperature
from an EHD Contact. Effect of Trichloroethane at Low Concentration (2-3%)................................. 16
3.6.1 EHD Spectra in the 1275-1850 c$,l Region . . . . . . . . . . . . 19 3.6.2 EHD Spectra in the 630-1230 cm Spectral Region . . . . . . . . 20 3.6.3 Dichroism of Infrared Emission Spectral Bands from 5P4E Poly-
phenyl Ether with or without 3% Trichloroethane from a Steel Ball/Diamond Contact under Different Sliding Speeds and Loads. . 22
3.6.4 Traction Measurements of 5P4E Polyphenyl Ether with and with- out 3% Trichloroethane Added . . . . . . . . . . . . . . . . . . 24
3.6.5 Dichroism of Infrared Emission Spectral Bands from a Bronze Ball/Diamond Plate Contact for Polyphenyl Ether (5P4E) with and without 3% Trichloroethane under Different Sliding Speeds andLoads............................ 24
4. DISCUSSION................. . . . . . . . . . . . . . . . . 25
4.1 Mechanism of Traction Fluid Deterioration by 1.1.2-Trichloroethane. .. 25 4.2 Mechanism of Polyphenyl Ether (5P4E) Deterioration by 1,1,2-Trichloro-
ethane ................................. 27 4.3 Influence of Bounding Surfaces on Lubricating Film Alignment. ..... 28 4.4 Traction Fluid. ............................ 29
5. WORXPLANNED ................................ 32
5.1 Failure of EHD Lubrication. ...................... 32 5.2 Improved Traction Fluids. ....................... 33
REFERENCES ................................. 34
APPENDIX I - POLARIZED INFRARED RADIATION . . . . . . . . . . . . . . . . . 35
APPENDIX II - ORIGIN OF INFRARED DICHROISM . . . . . . . . . . . . . . . . . 36
FIGURES................................... 37
iii

1. INTRODUCTION
The project whose setup phase was described in the earlier report [1]
proceeded in two main directions: (i) correlation of fluid, especially trac-
tion fluid, behavior with spectroscopic properties,related, in turn, to molec-
ular structure, and (ii) determination of at least one mechanism of lubricant
failure in concentrated contacts. Data collection and interpretation consti-
tuted the bulk of the work.
It turned out that the most important experiments involved both traction
and failure, for addition of substantial concentrations (5-20% by weight) of
1,1,2-trichlorethane to a traction fluid rapidly induced chemical changes
followed by failure in a heavily stressed operating elastohydrodynamic con-
tact. With smaller concentrations (-2%) chemical changes were not immedi-
ately noticeable, but significant physical changes--loss of traction, molec-
ular orientation, changes of surface temperature were observed. The chemical
changes agreed perfectly with a scheme proposed almost 20 years ago by Kovacic
[2] and coworkers, i.e. ionically promoted and catalyzed unsaturation, aromati-
zation, and polymerization by ferric chloride. An aromatic fluid, 5P4E poly-
phenyl ether, was rapidly attacked by chloride in lightly stressed contacts
at freshly abraded surfaces and formed polymeric carbons by cross-linking,
presumably as a consequence of aromatic anion formation, as visualized by
Goldblatt [3]. Here too significant physical changes preceded catastrophic
failure, when the chloride concentration was lower and the operating conditions
less severe. These changes could be observed only with operating contacts--
analogous experiments under stationary conditions could show similar chemical
changes but might not provide realistic information on the parameters neces-
sary for reaction, since the mechanical stresses, molecular orientations, very

large temperature gradients, etc., which occur in bearing contacts, could not
be easily simulated. A series of experiments with different surfaces and con-
ditions was therefore started and significant effects have already been found.
An interesting correlation was found between dichroic ratio (ratio of
infrared band intensity emitted parallel and perpendicular to the direction of
flow in a concentrated contact) and traction for a traction fluid. It would
seem that in a heavily stressed contact the traction fluid could behave anal-
ogously to a stretched rubbery solid. Further work now in progress could pro-
vide useful clues on improved traction fluids.
A separate unit was built to measure traction under essentially the
same conditions as those prevailing in the ball/plate apparatus coupled to
the infrared emission spectrophotometer. Furthermore, thanks to the gener-
osity of the Central Research Department of the Du Pont Company, Wilmington,
Delaware, it was possible to begin setting up another Fourier emission
spectrophotometer with a step drive and a rotating polarizing filter. It is
expected that this unit will provide greater sensitivity and faster data-
generating capability.
As in the past, some of the work reported here was also supported by
a grant from the Air Force Office of Scientific Research (AFOSR-78-3473).
2

2. APPARATUS
2.1 New Ball/Plate Apparatus
The apparatus shown in Figure 1 used the geometry of Winer [4] and co-
workers, i.e. the plate (window) is in a horizontal plane above and tangential
to the ball rotating about a horizontal axis, rather than the geometry of the
contact interfaced with our spectrometer, in which the plate (window) is in a
horizontal plane below the axis of rotation. The reason for the difference is
the need to provide ready optical access through a large (two-inch) diameter
sapphire window to read and photograph through a microscope Newton's rings for
film thickness measurements, to photograph the fluorescence of the contact region
for the generation of a temperature map (the fluorescence decreases with increased
temperature) and to record fluorescence spectra. Especially for fluorescence
work a large window is necessary, since ready access must be available to the
exciting radiation.
However, one of the main design considerations for this apparatus involved
the measurement of traction. Since facilities for heating or cooling were in-
corporated into the rectangular box under the ball, from which the lubricant is
dragged into the contact region by the rotating ball, it appeared to be more
practical to allow the plate holding the sapphire window to slide rather than
the entire reservoir, as in Winer's design. Since the plate must also be
loaded, the present design features a sliding plate within the loading plate;
in other words, the window can slide tangentially to the ball and in a hori-
zontal plane, since it is mounted on tracks attached to thelarger loading plate.
Motion along the tracks is essentially without friction since sliding bearings
( "super " ball bushings) are used as intermediates. The window motion is
restrained by a sheet-metal leaf spring to which a strain gauge is attached
which, in turn, is connected to another gauge (the reference gauge attached
3

to the platform) so that only the output difference is read by a meter.
The meter readings were calibrated for known conditions and constitute our
utractions".
Other features of the apparatus are the belt drive--to avoid vibrations
in the contact region--, two adjustable rollers under the ball--to avoid run-
out and a toothed gear with an electronic pickup near the perimeter--to read
ball speed with an electronic counter.
The microscope used for the measurements was built partly with available
and partly with purchased parts. Its heart is the Ealing Tetravar unit, a
housing containing a beamsplitter to which an objective lens, a camera, an
illuminator, and a binocular eyepiece can be attached simultaneously. The
objectives most useful to us are the reflecting 15x and 36x Ealing-Beck all-
mirror Cassegrainians, which have working distances of 22 and 8 nrm, respectively.
These long working distances are essential for reading through the half-inch
thich sapphire window.
The unit took longer to build than expected because of slow parts deliv-
eries. The camera adapter is still on order. However, most of the unit is
now in excellent working condition. We believe its flexibility is remarkable.
2.2 New Blackbody Reference
Most of our emission spectroscopy requires a blackbody reference source:
a mechanical chopper alternatingly introduces source and reference radiation
into the spectrometer-interferometer and the phase-locked amplifier brings only
the difference signal to the recording device. For high-quality spectra
of lubricant films, the background (i.e. the blackbody radiation from the
bounding surfaces) must be almost totally balanced by the reference source.
Since our sample is the thin lubricant film of an ehd contact and since
the heat generated in the contact depends on load, ball speed, and
4

of course, the nature of the fluid itself, it is necessary to vary the refer-
ence temperature frequently to match the changed conditions. This is a very
slow process. To be stable, a reference heat source or blackbody source must
be massive to present much thermal inertia, but to be readily changed with
respect to temperature, it should be light and small. Furthermore the black-
body radiation from the reference source should be directed toward the chopper
and controllable only by a temperature change; in other words, the body or
shield of the reference should not contribute to the reference radiation. And
lastly, the reference source must fit physically into the interferometer-
spectrometer source unit.
Such a source was built over a period of time and is shown in Figure 2.
The blackbody part is merely a hole, one millimeter in diameter,drilled three-
quarters down along the axis of a brass cylinder, one inch in diameter
and three inches long. A V-shaped mask in front of the hole permits changes
of aperture. The cylinder is wrapped with copper tubing through which water
can be circulated to provide cooling. Conversely, the cylinder can be heated
by three small electric cartridge heaters surrounding the central hole. Around
the cooling coils a narrow air space is provided and beyond that is a shield
of aluminum. Thermocouples are provided at various locations to monitor the
performance. Testing has shown that the blackbody can be brought to near 200°C
in a few minutes and maintained there by thermostatic switches. Even at that
high temperature no radiation would be detected from the shield; it remained
at ambient temperature. In a few minutes of water-cooling the temperature was
brought down to 100° and could be maintained there.
Since the blackbody is completely enclosed in the source section of our
interferometer, all controls, including the slit control, had to be made acces-
sible from the outside.
5
Strange as it may seem, such a blackbody is not a trivial development.
Our tests showed that its radiance closely matches the theoretical. Conuaercial
blackbodies are very much bulkier and very expensive. Our blackbody could find
use in radiometers other than ours. We have had a number of inquiries about it
from commercial instrument makers.
2.3 Polarizing Chopper, Second Interferometer
Our work has shown that some infrared emission bands of lubricants in
operating ehd contacts are dichroic; i.e. their intensity depends on whether
a plane polarizing filter is oriented about the optic exis of the objective
in such a way as to transmit radiation polarized in the conjunction plane
(plane containing the center of bearing ball and the perimeter contacting the
diamond window) or whether the filter is oriented so as to transmit radiation
polarized at right angles to the conjunction plane.* Hence most of the work
reported here required three separate runs to provide three independently
recorded spectra (not polarized, or N, then V and H). Everyone of these
spectra had to be run against a blackbody reference source at an appropriate
temperature. Why not make use of the polarization?
A chopper was therefore built in the form of a rotating polarizer, i.e.
a polarizing filter for the infrared rotating about the optic axis of the
instrumentation. Every quarter revolution, the plane of polarization changes
from V to H and the phase-locked amplifier allows only the difference between
V and H to be detected. This procedure automatically removes the blackbody back-
ground--being randomly polarized, it is substracted out--and reduces the number
of spectral runs needed to obtain spectral and polarization data from three
*For convenience, the first mentioned orientation will be referred to as V-polarized, the latter as H-polarized.
6

to two. The sensitivity is increased because of the greater signal/noise
ratio. However, the drawback is that only polarized spectral bands, i.e.
dichroic bands, are detected. For general use the reference source is there-
fore still needed. Figure 3 shows the rotating polarizer.
This chopper was designed and built as part of a new interface for emis-
sion Fourier infrared spectroscopy. The new reference source constitutes an-
other element of this interface. Fortunately, it was possible to design, build,
and test the new parts without disrupting data acquisition with the old inter-
ferometer, because an almost identical FS-720 Fourier Interferometer was do-
nated* to us by the Du Pont Company. The reason for the "almost" is the sub-
stitution of a step drive for the continuous drive of our old instrument. The
step drive moves the mirror for a set distance (the smallest built-in step is
2.5 pm), stops, triggers the detector to read, andthenmoves the mirror an-
other step.
The continuous drive keeps track of mirror displacement by counting Moire'
fringes generated between two combs (Moire' gratings), one stationary and one
moving with the mirror and recorded by a lamp/photocell arrangement. The advan-
tages of the step drive over the Moir6 system are (i) the possibility of placing
the central fringe of the interferogram exactly at a VeadV1 position, thus elim-
inating the need for phase corrections, (ii) greater accuracy in taking data
since the triggering signal is independent of mirror speed, (iii) the relative
ease with which step displacements can be altered by changing gear ratios,
whereas the Moire gratings are ruled at definite intervals (number of lines
per mm), and (iv) the option of faster mirror speed--as long as the detector
time constant is compatible with it. We have been able to divide the mirror
displacements per triggering interval of the Moire' system by an electronic
*We want to thank the Du Pont Company, Experimental Station, Wilmington Deleware, for their magnificant gift.
7

signal shape detector (our Klinetics unit), but with some difficulty; the
step drive can do this directly. The main disadvantage of the step drive, at
the time our interferometer was bought, was its very much higher cost when
compared to the Moire drive. We are therefore grateful to Du Pont for their
foresight in buying the step drive. New electronics had, however, to be
provided for the step drive, as well as a new gear ratio.
The new polarizing chopper and the step drive are basically working, but
are not yet fully functional. It will be possible to use all the new parts
with our old interferometer or --and this appeals to us more--to run the new
interferometer as a separate unit, sharing only the minicomputer.
The new reference, chopper, and the adaptations of the new interferometer
were designed and built as said before, without interfering with the operation
of the old one. We should soon be able to improve our rate and quality of
data collection with the new instrumentation.
3. RESULTS
3.1 Traction Fluid Spectra and Related Data -
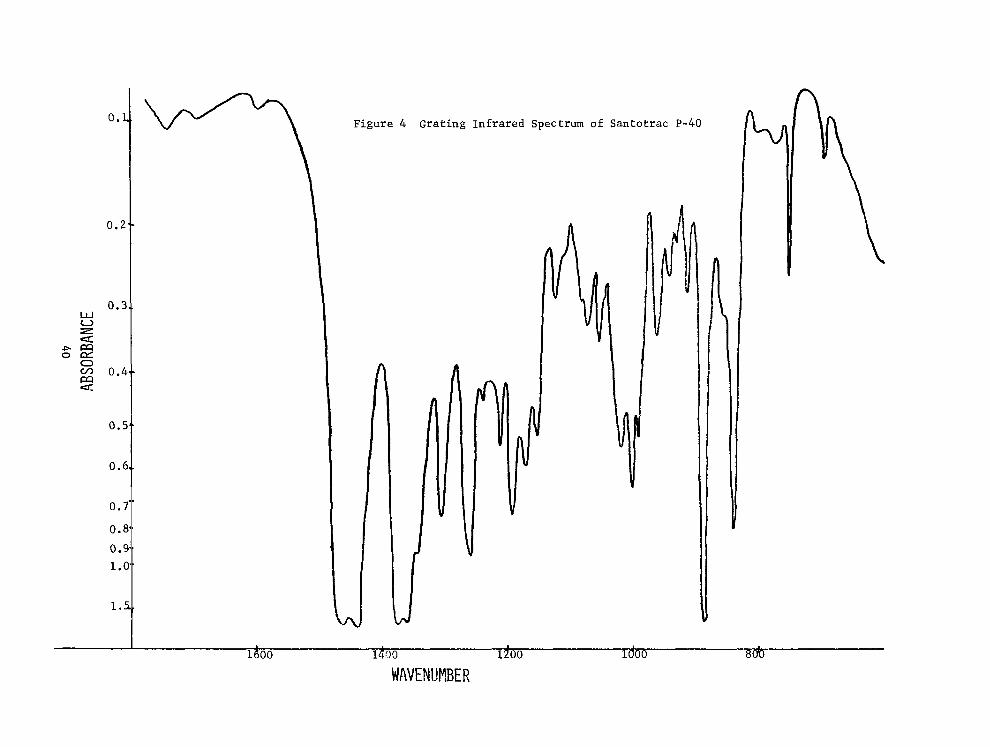
For reference Figures 4 and 5 give the standard grating absorption spectra
of Monsanto's Santotrac P-40 fluid and of 1,1,2-trichloroethane (containing some
l,l,l-isomer, which was distilled off before use). The latter material was used
as an additive in our deterioration studies.
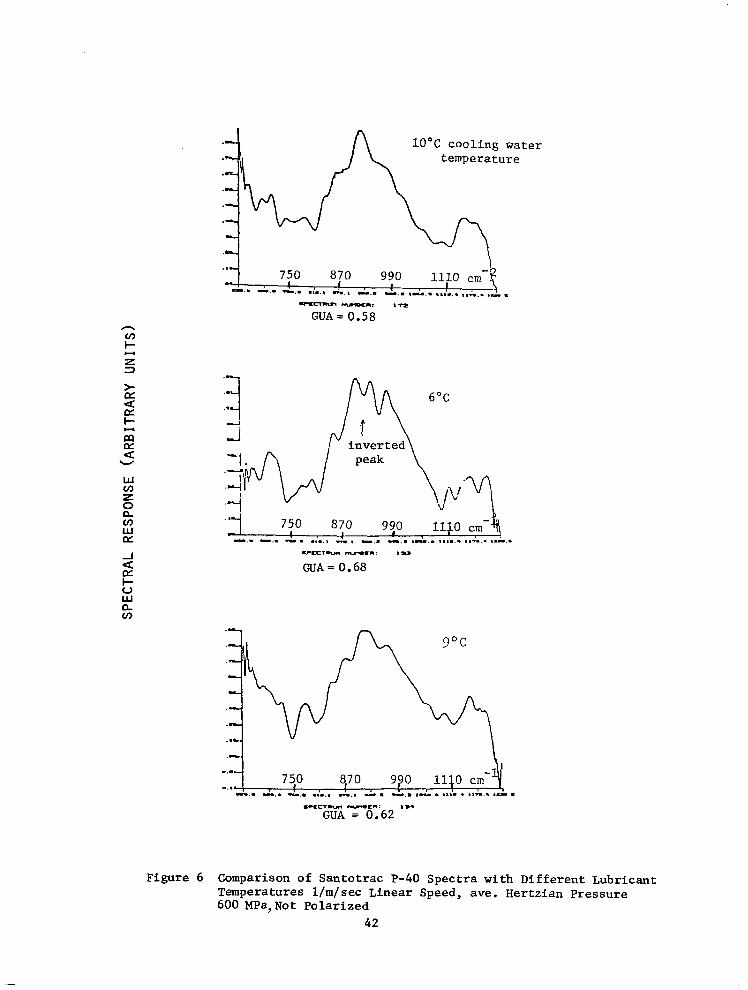
Figure 6 shows three EHD spectra in the 630-1230 cm -1 range of the P-40
fluid under moderately severe operating conditions. The temperatures of the
fluid reservoir were somewhat different and this circumstance is reflected in
spectral structure: the lower the temperature the more structure. However,
the difference between these spectra and the absorption spectrum of Figure 4
is striking--most of the resolution has been lost and the peaks are barely
standing out on a broad background. Figure 7 shows the spectrum of P-40 under
similar operating conditions in the 1275-1850 cm -1 spectral range (for reasons
connected with our Fourier interferometer these spectral ranges have to be
scanned separately). This spectrum, though an emission spectrum, resembles
the absorption spectrum of Figure 4 in its spectral region; in other words,
the emission bands appear as absorption bands, but again only the peaks are
discernable over a broad background.
This traction fluid is not the same as the one whose high pressure infra-
red absorption spectrum we obtained some time ago in the diamond cell (Sun Traction
Fluid) (Figure 8); however, chemically it is not very different and the vibrational
spectrum is very similar. It is therefore interesting to note that pressure
broadened the spectrum of the traction fluid very considerably, especially in
the region of the cyclohexane ring vibrations (800-1000 cm -l), which are character-
istic of the traction fluids. Since temperature invariably does the same, the
difference between the standard spectrum of Figure 4 and the emission spectra from
9

the operating contact of Figures 6 and 7 are not unreasonable. Aromatic fluids
and esters do not exhibit temperature/pressure broadening to anywhere near
the same extent.
To obtain a quantitative idea of the broadening we replotted the absorp-
tion spectrum of Figure 4 under lower resolution (Figure 9a) and then broadened
the bases of the principal bands by a factor of four, assuming simple triangular
band shapes as a first approximation. Accounting for the overlaps,Figure 9b
is obtained. This spectrum is very similar to the ehd spectrum of Figure 9c.
The reason for the very large broadening of the ring bands is usually ascribed
to changes of the mix of conformational isomers; the higher temperatures and
pressures shift the equilibria in the direction of higher energy forms. The
molecular movement that occurs when the cyclohexyl group changes from one con-
formation to another is illustrated in Figure 10. It has been associated with
a secondary transition (drop of elasticity modulus as the temperature is in-
creased) in polymers containing a cyclohexyl group. The temperature of the
secondary transition is just below that of the main transition (softening) and
is associated with the flip-flop. Because the behavior of a plastic in this
region has some of the aspects of a viscous liquid and some of an elastic,
it applies to lubricants which are viscous liquids.
The conformational changes associated with the cyclohexyl group would seem
to parallel the enormous spectral band broadening with temperature and pressure.
Broadening also occurs with paraffinic fluids in the C-C bond-stretching infrared
region. Here the changes (Figure 11) must be attributed to rotation of CH2 groups
in a paraffin chain. The CH2 groups in a cyclohexane ring can be considered anal-
gous to those in a paraffin section of four carbon atoms in one line. If the
10

cyclohexane rings were particularly outstanding with respect to traction, poly-
merized olefins whose monomers have four carbon atoms in a chain, i.e. poly-
butenes, should have higher traction coefficients than polypropylenes or poly-
pentens. Indeed, polyisobutylene fluid has the highest coefficient of trac-
tion of any polymerized 1-olefin. It also has a rather low viscosity index.
A sequence of four CH2 groups in a paraffinic chain--and, as just mentioned
in a cyclohexane ring --is also the minimum requirement for one or two infra-
red active CH2 -1 -rocking bands near 730 cm . There thus appear to be certain
structural aspects paralleling traction properties in a fluid.
3.2 Effect of Trichloroethane Addition on the Infrared Emission Spectrum of a Traction Fluid from an EHD-Contact
Contamination of bearing lubricants by chlorides is not uncommon. To
study the effect on the spectra and behavior of a traction fluid, 1,1,2-
trjchloroethane was used because of its (i) high content of available, i.e.
active,chlorine, (ii) relatively high boiling point (113'C) and (iii) readily
available commercially. Its infrared spectrum is also very well understood
and, initially, we planned to make use of this circumstance to determine its
molecular alignment in an ehd contact. The strongest C-Cl bands occur
outside the spectral range of this study and the ones that do overlap bands
of the traction fluid are not intense enough, even at 30% concentration, to
alter the traction fluid spectrum significantly. The molecular alignment
study will have to be cone in another spectral range, but it was deferred
when it became clear that the trichloroethane promoted lubricant failure. When
various amounts of the trichloroethane were added to the traction fluid, some
interesting changes occurred in the spectra of the 630-1230 cm -1 wavenumber
region. Figure 12 shows in the left column the spectra as they were ob-
tained and in the right column the differences between the corresponding
11

spectrum in the left column and the EHD spectrum of the pure traction fluid.
The spectra in the left column were normalized (maximum amplitude made equal
to unity and all the other amplitudes appropriately reduced by division by the
actual value of the maximum amplitude, i.e. the greatest unnormalized ampli-
tude or the GUA). The spectra in the right column were plotted, however, as
actual differences.
The outstanding changes with trichloroethane addition are the new bands
shown at the frequencies marked by the arrows in Figure 12. They are shown
more clearly in the difference'spectra than in the original spectra and con-
sist of two new bands, -1 one at 700 and one at 990 cm . These bands hardly
show at 5-percent trichloroethane concentration, but are quite prominent at
10 percent and higher. At 20 percent, the 990 cm -1 band is not clearly
observed because the peak is folded back on itself (peak inversion). Peak
emission in a hotter region of the fluid is reabsorbed in colder regions.
The new bands are definitely not trichloroethane bands, but correlate well
with most olefins and aromatics.
Figure 13 in a comparision of spectra obtained with the neat traction
fluid and with the fluid containing 15 percent of trichloroethane by volume.
The experiments were made in ascending order, i.e. b', a', b, and a. The
following observations can be made when comparing the solid line (no tri-
chloroethane and the broken line (containing trichloroethane) spectra:
(a) The GUA's (i.e. maximum band intensities) of the broken line
spectra are equal to or lower than those of the corresponding
solid-line spectra. The radiant intensity from the fluid was,
therefore, generally less when trichloroethane was present. This
observation also agrees with a slight lowering of the temperature
measured by a thermocouple next to the diamond window. Measurements
12

of traction also showed a reduction for these operating conditions
which, by the way, were outside the linear range of the traction
-versus speed curve.
(b) The bands at 700 cm-' and especially 990 cm-l aremore pronounced
in the broken-line spectra.
(c) The spectrum with the mostpronounced peak at 990 cm-' is also the
last spectrum of the series and has the lowest GUA.
3.3 Polarized Infrared Spectra of~Traction Fluid with and without - ~-__--- .-. Trichloroethane
Figure 14 shows a series of traction fluid EHD emission spectra com-
paring different angles of the polarization plane with the conjunction plane,
i.e. the plane containing the plate/ball conjunction line and the center of
the ball. The principal ixmnediate observations are that the spectra under
polarization are much more structured than the one without polarization and
that there are differences between the spectra at different angles of polar-
-1 ization. Of particular interest in the band near 990 cm ; it is barely a
shoulder in the non-polarized spectrum, but is prominent as an emission or
re-absorption peak in the polarized spectra. A similar situation occurs
-1 near 700 cm . These two bands are, as pointed out in the preceding section,
the new bands brought out in the unpolarized spectra by the addition of
trichloroethane. Their presence here--though weak, since polarization had
to be employed to bring them out --is an indication of some fluid deterioration
without the addition of trichloroethane in the same way as with addition.
Indeed, this sequence of spectra was run late in the series, when the fluid
had been stressed for many hours. It puzzled us until we became aware later
of the ubiquitous presence of chloride in our laboratory. Traces of chloride
provide the same mechanism of deterioration, though it is slower. The mech-
anism will be discussed in Section 3.4. 13

The polarization of the 990 cm -1 band relates to an orientation of
the C=C bond. It could be explained by an olefinic polymer laid down on
the bounding surfaces. An infrared examination of the traces of friction
polymer was, however, not carried out.
It is possible to define a dichroic ratio for an emission band as the
ratio of the band intensity when the plane of polarization is parallel to the
the ball/plate conjunction plane to the band intensity when the plane of
polarization is perpendicular to the conjunction plane. A dichroic ratio
of'unity is then an indication of random molecular orientation whereas a
dichroic ratio significantly greater or less then unity is an indication of
preferred orientation. The reason for this deduction lies in the origin
of infrared spectral bands, which is briefly explained in Appendix I.
Figure 15 shows plots of the dichroic ratio of four reasonably well
characterized infrared bands of the traction fluid with and without tri-
chloroethane (15%) against sliding speed for low and medium loads. Unfor-
tunately the spectral region above 1250 cm -1 was not run with the tri-
chloroethane so that comparisons cannot be made. Even though only two
points are shown for every line on these graphs, the results are con-
sistent with data on other bands so that comparisons can be made. Note
that
(i) in general, the dichroic ratio deviates from unity more for the
low load than for the intermediate load,
(ii) the dichroic ratio is near unity for all bands at the higher
speed except for 917 cm -1 and 1380 cm -1 bands at low load,
(iii) the slopes at 690 cm-' and at 917 cm -1 for the higher load,
trichloroethane-containing runs are opposite
14

(iv) the dichroic ratios at 690 cm-' and at 917 cm-l are unusually high
(the band is very strongly polarized, indicating a high degree of
molecular orientation) at low speed and low load for the fluid con-
taining trichloroethane, and
(v) the dichroic ratios for the fluid containing the trichloroethane
are generally more different from unity--indicating a higher
degree of fluid orientation-- than those for the fluid not containing
the trichloroethane, all under comparable operating conditions.
3.4 Effect of TrichloroethaneAddition on the Traction of Two Traction Fluids
The measurements of Figures 16 and 17 represent traction versus sliding
speed at different loads for both Santotrac P-50 and the new Sun Co. traction
fluid both with and without trichloroethane addition. The ordinate is the
strain gauge reading with the ball/plate apparatus described in Section 2.1.
Since the apparatus was built to duplicate the conditions of the ball/plate
contact interfaced with the infrared spectrometer, very low sliding speeds
could not be used (some minor design changes are underway to allow measurements
at smaller speeds) so that the ascending portion of the curves could not be
measured. The very low sliding speeds are interesting for traction measure-
ments--they determine the linear portion of the traction -versus- speed curves--
but very unlikely to produce enough infrared radiation for our spectral mea-
surements. The theoretical shape of these curves is shown schematically in
Figure 18, which has been taken fromTevaarwerk [S].
Inspection of both Figures 16 and 17 shows that trichloroethane addition
(2%) does not affect the traction curves significantly except in the case of
high loads and high speed for the Santotrac fluid, where it reduces traction.
It does not influence the traction of the Sun Fluid significantly at all,
15

_
although it would seem, if anything, to raise it. However, it should be
pointed out that the traction of the Sun fluid is considerably lower than
that of the Santotrac fluid in any case. The two fluids are therefore
quite different with respect both to traction and to trichloroethane suscep-
tibility of traction.
The lower traction of the Santotrac fluid containing the trichloroethane
at high speed and load is consistent with the lower infrared emission and film
temperature under these conditions.
3.5 Scanning Electron Microscope (SEM) Analysis and Surface X-ray Analysis of of Steel Ball
The stainless steel ball used extensively with the traction fluid/tri-
cloroethane mixtures was later used to obtain EHD infrared emission spectra
with 5P4E polyphenyl ether lubricant at room temperature in the reservoir cup.
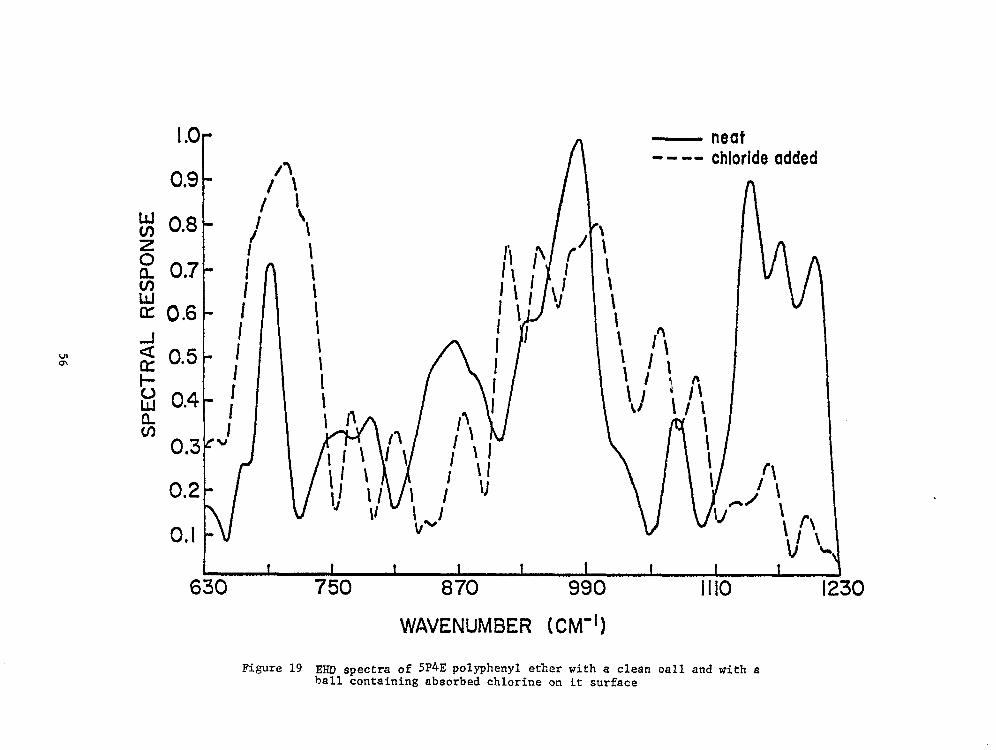
The first spectrum (Figure 19) obtained was very distorted compared to a
normal spectrum under these conditions. The system failed when a second
spectral run was attempted. The ball was seriously scored (it had shown a
barely perceptible track before it was used with 5P4E) and the fluid was
black and contained many carbon particles.
SEM X-ray analysis of the ball showed chlorine covering all the surface.
However, the covering was particularly thick on the track, because it was
not possible to obtain any metal peaks there. Clearly the fresh metal surface
of the track reacted more vigorously than the remainingly ball surface.
3.6 Infrared Emission Spectra of 5P4E (Polyphenyl Ether) at Low Temperature from an EHD Contact. Effect of Trichloroethane at Low Concentration (2-3x).
Since the Santotrac P-40 bands from the EHD contact were rather broad and
difficult to assign, it was decided to go back to polyphenyl ether (5P4E) for a
detailed spectal study of polarizatron and the effect of trichloroethane addition
16

on it (in very small concentration, 2-3%) as a function of the operating
parameters of our ball/plate sliding contact. The work reported here used
both a stainless steel and a bronze ball of the same diameter. Cold-coated
steel and ceramic balls will be studied in the future. In all cases the
fluid in the reservoir was cooled by circulating ice water through the
cooling coil surrounding the ball/plate (diamond) contact. lhe emphasis
was on the 630-1230 cm -1 spectral region, but many spectral runs were re-
peated in the 1275-1850 cm -1 spectral region. For these spectral runs
the apparatus was completely re-aligned and maximum attention was given to
detail; as a result, successive spectra under equal operating conditions
could be reproduced quantitatively to better than 5% in spectral response
and to better than 2 cm -1 in resolution.
With the help of results communicated in a recent report by Hamrock and
Dowson [6] it was possible to establish the EHD regime that prevailed when our
spectra were taken. Our ball/plate contact is circular and characterized by
Figure 20, which has been adapted from this report, mainly by extension of
the coordinate ranges. Since diamond's elastic modulus is very high (-10 12
Pascal), the reduced elastic modulus for the steel ball/diamond window
combination is also high, 4.30 to 0.35 x 10 12
, depending on the nature of
the particular diamond, compared to -0.22 x 10 12 for a steel ball on a
steel plate. The elastic modulus does not influence the viscosity parameter
(ordinate) at all, but does enter the elasticity parameter (Abscissa), which
it could reduce by a factor of at most (l/2) 213 = 0.63 compared to a steel/
steel combination. This factor is appreciable but is not enough ever to
force our system into the isoviscous-rigid regime. For example, we oper-
ated our apparatus with 5P4E polyphenyl ether cooled to an inlet tempera-
ture of 33OC (7, = 0.881 Pa.s) and at a ball speed of 200 RR4 or 0.6 m/set.
17

At this temperature the pressure-viscosity coefficient of 5P4H is 39.3 x
lo-' Pa . -1 We used minimumload(3 kg),i.e. theweight of the ball and platform
alone. Even for these conditions, which are conducive to very thick film,
we operated at the point marked "very low load" in Figure 20. It lies near
the viscous-rigid and viscous-elastic boundary, but probably in the former
regime (average Hertzian pressure 400 MPa), The corresponding infrared -1
emission spectrum was Figure 21a. Note the relatively strong band at 780 cm ,
almost as strong as the 690 cm -1 band to the left. When the load was doubled,
the spectrum of Figure 21b was obtained, for conditions corresponding to the
l'low load" operating point just within the viscous-elastic regime. Doubling
the ball's rotational velocity produced the operating conditions characterized
by the operating point just within the viscous-rigid regime and the infrared
absorption spectrum of Figure 21~. The most interesting result is the almost
complete absence of the 780 cm -1 emission band in the middle spectrum and a
bare indication of it in the bottom spectrum. Since all the other spectral
features remained nearly constant and since the 780 cm -1 band is well-known
to be caused by the "umbrella" mode of vibration of the aromatic ring, in
which the change of dipole moment vector is perpendicular to the plane of
the ring, it would seem logical to conclude that the ring is indeed
oriented with its plane parallel to the window when the load exceeds a
certain critical value. With this molecular orientation the optic axis
of the interferometer system is coincident with--or at least parallel to--
the change of dipole moment associated with this vibration so that an
electromagnetic wave cannot be propagated toward the detector. However,
because of different bubstituents on the phenyl ring of 5P4E, the dipole
moment vector of the umbrella vibration is not exactly perpendicular to
the plane of the ring. Rotation of the plane of polarization about the
18

optic axis by a polarizing disc will therefore change the intensity of this
band somewhat if the molecules are preferentially oriented with respect to
the flow direction. Other bands, whose dipole transition vectors have large
components in a plane parallel to the faces of the diamond window, are
also expected to change substantially, again if the molecule is preferen-
tially oriented with respect to the flow direction.
A more detailed discussion of the relationship between infrared polariza-
tion, dichroism, and molecular alignment is given in Appendix II.
Series of EXD contact spectra of 5P4E polyphenyl ether with and without
3% trichlorethane were then obtained with the steel ball/diamond setup and
ice-water cooling. Under these conditions the temperature measured by the
thermocouple next to the diamond window was still in the neighborhood of
39OC, but the spectra were more structured and reproducible than ever before.
The excellent quality of these spectra is the result of many factors, but
the lack of vibrations transmitted through the shaft, the isolated optical
table, and the new location of the chopper below the lens were the, principal
causes of the good results.
For understanding the following spectra it is important to explain
the coding. The first two digits stand for speed and load, N,V, or I-I stand
for not polarized, polarized in the conjunction plane, i.e. the plane con-
taining the ball center and the Hertzian contact, and polarized perpendicularly
to the conjunction plane. In most cases both the 630-1230 cm -1 and the
1275-1850 cm -1 spectral region were scanned. The presence of (3%) trichloro-
ethane is indicated by the letter A.
3.6.1 EHD Spectra in the 1275 -1850 cm -1 Region. Figures 22 and 23 con-
tain emission spectra under equal high load/high speed conditions: with and
without trichloroethane, in the 1275 - 1850 cm -1 spectral region. These
* 700 MPa average Hertzian pressure, 1.8 m/s linear speed 19

spectra are essentially identical as far as the major bands are concerned;
neither polarization nor trichloroethane addition seem to have a significant
me strongest bands are at about 1480 cm -1 effect. and at 1600 cm -1, both
non-degenerate C-C in-plane stretching fundamentals involving ring carbon
atoms. Since these vibrational modes involve dipole moment vector changes
in the plane of the ring plane parallel to the diamond window (in contrast
to the 780 cm -1 band mentioned earlier, which is caused by an out-of-plane
dipole moment vector change) or along the flow direction should not and does
not affect the band intensity. The constancy of the 1480/1600 cm-l band inten-
sity ratio to +_ 5% is an excellent measure, therefore, of our spectral repro-
ducibility. The spectra of the trichloroethane containing fluid were obtained
about two months later than the spectra of the neat fluid. During this time
the instrument was completely realigned and yet all the spectra are still
about equal! The situation of the other spectra in this region is similar
so that no further discussion is necessary.
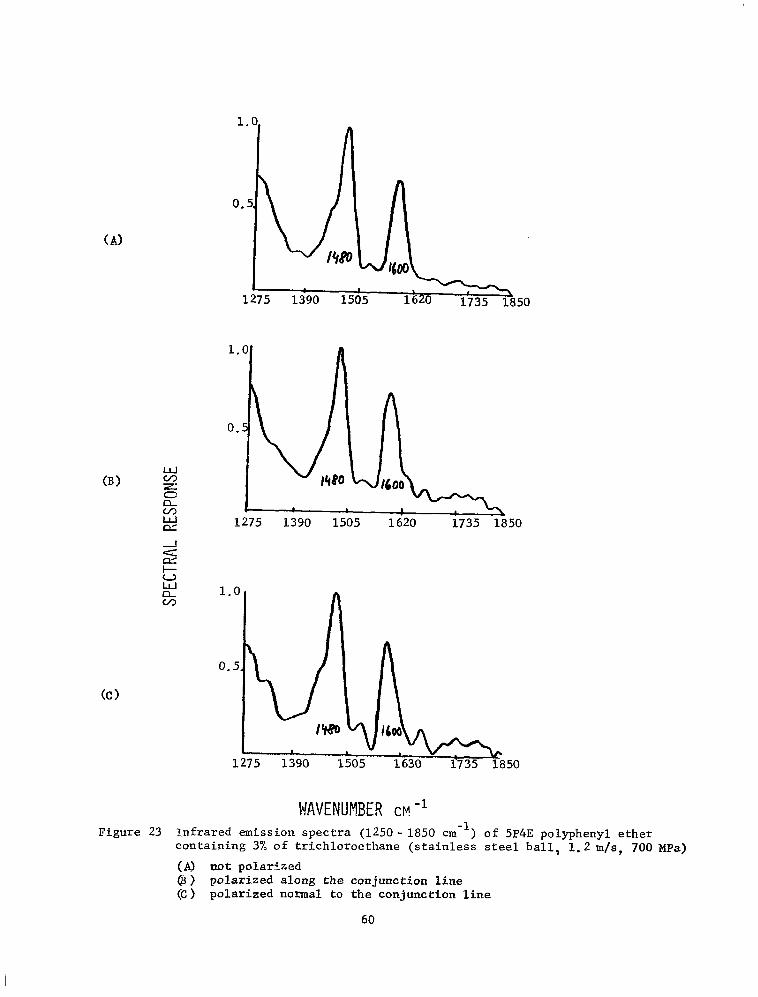
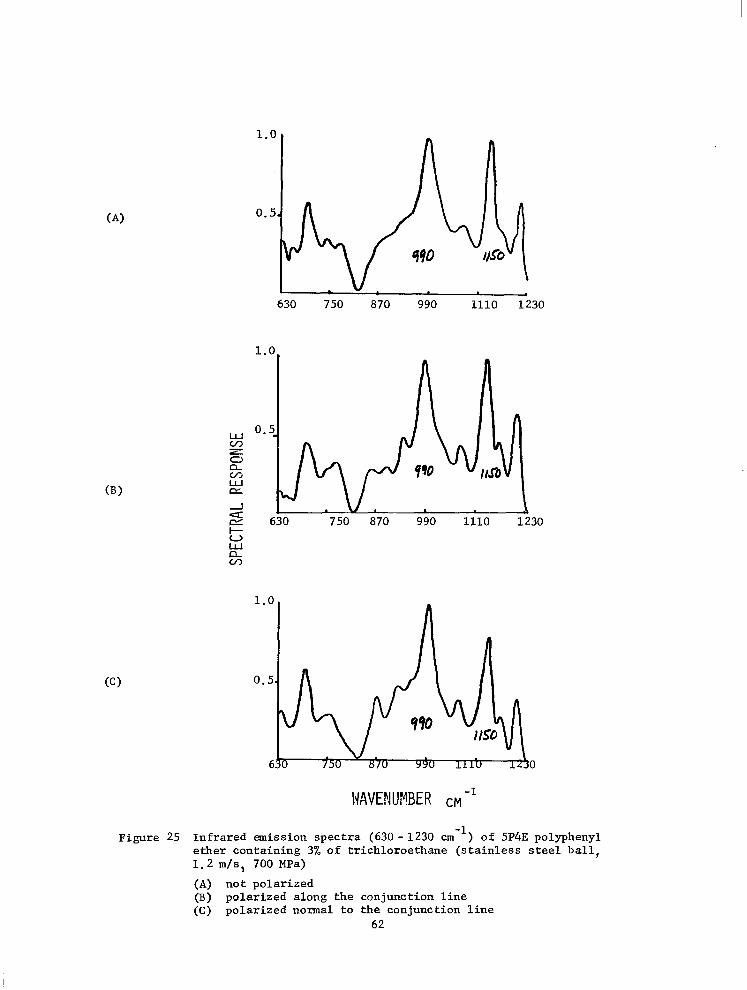
3.6.2 EHD Spectra in the 630-1230 cm -1 Spectral Region. Figures 24 and
25 contain the EHD emission spectra of the neat and additive-containing fluid
in the lower frequency region (630-1230 cm-') under the same high speed/high
load conditions as those used for the preceding two figures. Now it is quite
obvious that the intensity ratio of the strongest two bands at 990 cm -1 and
at 1150 cm -1 is changed with polarization; under H-polarization the 990 cm -1
is stronger than the 1150 cm -1 band, while the opposite is true, though to a
much smaller extent, under V-polarization. The intensities of these bands
change somewhat in the presence of trichloroethane, but the most evident
spectral changes brought about by 3% of trichloroethane are the improved
resolution of minor bands on the slope of the low frequency side of the 990 cm -1
band peak and the deteriorated resolution of minor bands on the high frequency
20

side of the same peak. The 990 and 1150 cm -1 bands originate from different
vibrational modes, the former from ring expansion (a kind of C-C stretch) and
latter from C-H in-plane deformation. Orientation of the molecule in the
flow direction should be reflected by an intensity change of the 1150 cm -1
band with respect to the 990 cm -1 band, which should not be affected.
Reduction of the load at the same speed inverts the 990/1150 cm -1 band
intensity ratio under V-polarization and reduces it under H-polarization under
neat conditions (Figure 26), but has essentially no effect when 3% of tri-
chloroethane is present (Figure 27). !&us the trichloroethane maintained the
lubricant in the same orientation as before when the load was doubled at the same
flow velocity. This effect of the chlorine additive seems to be significant,
Reduction of the speed at the highest load did not change the 990/1150 cm -1
band intensity ratio appreciably under N or H polarization (perhaps it did
cause a slight change under V-polarization) without the additive and pro-
duced even less change with the additive, consistent with the previous obser-
vation (Figures 28, 29).
Reduction of speed and load from the maximum to the intermediate reduced
the 990/1150 cm -1 band intensity ratio for H-polarization in the absence of
trichloroethane, but, as before, left the polarization ratio essentially the
same when trichloroethane was present (Figure 30, 31).
When the speed was minimized and the load kept at maximum and the chloride
was present, the 990/1150 cm -1 band intensity ratio was increased for both V and
H polarization over that at maximum speed/maximum load conditions (Figure 32).
From the foregoing it would thus appear that an effect on EHD emission
spectra of trichoroethane addition to 5P4E polyphenyl ether is to increase the
990/1150 cm -1 band intensity ratio. Since both of these bands are produced
by in-plane dipole moment vector changes at a constant angle with respect
21
to each other, the addition of trichloroethane causes 5P4E-polyphenyl ether
molecules to be oriented more readily with respect to the flow direction.
3.6.3 Dichroism of Infrared Emission Spectral Bands of 5P4E Polyphenyl
Ether with or without 3% Trichloroethane from a Steel Ball/Diamond Contact
under Different sliding Speeds and Loads. In order to recognize possible
effects of speed and load on the polarization of the infrared spectrum emitted
from the EHD sliding contact, a detailed analysis of the dichroic ratio was
made. For the purpose of this report it will be recalled that it is suffi-
cient to define ratio as the ratio of the band intensities for radiation
transmitted through mutally perpendicular planes of polarization (V and H
polarization). Accordingly, band intensities were obtained by graphical
integration of the band traces and correction of the result bymultiplication
with the appropriate normalization factors. The plots in the following figures
represent the V/H polarization ratio for the indicated bands. The 990 cm -1
band and the 1150 cm -1 band were described in the preceding section.
Figure 33 is a plot of dichroic ratio against load for the 1000 cm -1 band
for different speeds. Neat or (3%) trichloroethane-containing polyphenyl
ether fluids are differentiated by corresponding hollow and solid points.
Note that the black marked points are generally more distant from the unit
ordinate (unpolarized) line than the clear points and that the slopes are
opposite for black marked and clear points. This observation could mean
that the additive causes the cirection of orientation of the bulk fluid to
be different. Such a polarization reversal does not occur for the 1150 cm -1
band (figure 34); however, the additive generally increases the dichroic
ratio. These results are consistent with the molecular structure of the
polyphenyl ether and could be used to estimate it orientation with respect
to the contact plane.
22

Similar observations can be made from the plots of Figures 35 and 36;
here ball speed is the abscissa and different plots represent different loads.
Comparison of Figures 34 and 36 would seem to indicate that at 1150 cm -1
increased load at constant speed can increase the degree of polarization
while increased speed at constant load may change it but little. The dichroic
ratios for the 1150 cm -1 band are generally highest for the highest speed and
load, i.e. the highest shear rates, but for the 1000 cm -1 band they are generally
close to unity (low degree of orientation) for the highest shear rates; the
presence of trichloroetnane may invalidate this generalization.
Film thickness data should become available soon. At that time these
data will be replotted against shear rates.
The dichroic ratios for the 690 and 760 cm -1 bands representing diff-
erent out-of-plane C-H deformation vibrations are plotted against speed in
Figures 37 and 38. The 760 cm -1 band is caused by a dipole moment vector
change perpendicular to the phenyl ring and is of low intensity because the
ring appears to be aligned parallel to the diamond window in the conjunction
plane (see Section 3.6 ). If the ring were substituted completely symmetri-
cally, orientation of the emitted radiation by the axially turning polarizer
would be ineffective. As it is not, the band can be further polarized and
-1 ,theoretically in a direction opposite to that of the 690 cm band. Casual
inspection of Figures 37 and 38 shows that this is the case e.g. for the
highest load/trichloroethane situation. For these bands as well, the tri-
chloroethane additive has enhanced polarization and thus molecular orientation.
me corresponding plots of dichroic ratio against load are shown in Figures 39
and 40. Note that the slopes of the lines connecting equivalent points are
mostly of opposite sign for the two bands.
23
3.6.4 Traction Measurements of 5P4E Polyphenyl Ether with and without
3% Trichloroethane Added. With our new ball/plate apparatus, strain gauge
measurements were made to compare the traction of 5P4E polyphenyl ether with
and without 3% trichloroethane at several loads and at two temperatures,
ambient and at 50°C (reservior temperatures). The measurements could not be
carried out reliably at very low ball speeds because of the design of our
apparatus; however, the maximum readings were obtained for every set of
conditions (Figures 41, 42, 43, and 44).
It was gratifying for us to note that our traction/sliding speed plots
checked the literature, especially at the higher loads and at the higher temp-
erature; for example, Figure 45 taken from Tevaarwerk's article [5] resembles
our Figure 42. At room reservoir temperature the presence of trichloroethane
reduced the traction everywhere very considerably (Figures 41 and 42), but at
50°C reservoir temperature it increased the traction at the low speeds, but
decreased it slightly or left it unchanged at the higher speeds. Standard
viscosity determination (capillary viscometer)did not show a difference
between trichloroethane-containing and neat polyphenyl ether (5P4E); hence
the film thickness very likely remained the same. Therefore, it would appear
that trichloroethane, by absorbing on the bounding surfaces, changes the
tractions. The deduction in contradictory to the present view of traction as
a bulk fluid property unless an influence of the surface on the bulk fluid
is assumed. In addition to the dichroic ratio determinations discussed in
the proceding section, the bronze ball spectra and traction measurements
described in the following sections seem pertinent.
3.6.5 Dichroism of Infrared Emission Spectral Bands from a Bronze Ball/
Diamond Plate Contact for Polyphenyl Ether (5P4E) with and without 3% Tri-
chloroethane under Different Sliding Speeds and Loads. When the dichroic
24

ratio was obtained fro the 690 cm -1 aromatic band with a bronze ball under
the same conditions as for the steel ball of same dimensions, the plot of
Figure 45 against ball speed could be drawn. Comparison of this figure with
the corresponding one for steel (Figure 37) shows some interesting points.
Again the empty markers are drawn for the neat case and the double point
markers for the case of 3% trichloroethane added. Note that (i) for both the
steel and the bronze ball the dichroic ratio approches unity (unpolarized
state) at high speed, but with a positive slope for the steel ball and a
negative slope for the bronze ball and that (ii) the dichroic ratio is not
significantly changed by trichloroethane in the case of the bronze ball,
but is significantly changed in the case of the steel ball.
25

4. DISCUSSION
4.1 Mechanism of Traction Fluid Deterioration by 1,1,2-Trichloroethane
Originaaly we proposed a free radical mechanism because the traction
fluid (Santotrac P-40), even without the presence of the trichloroethane,
deteriorated to give olefins and aromatics in the same way as the fluid
containing substantial amounts of the trichloroethane, although at a con-
siderably slower rate. After a while, it became clear to us, however, that
some chlorine contamination existed all the time. X-ray analysis of the bearing
ball surface in the scanning electron microscope invariably showed the
presence of chlorine. We therefore changes our thinking and now believe
that an ionic mechanism is much more likely.
A review of the literature showed that Kovacic and co-workers [2] had
proposed a very pertinent mechanism for the reaction between methylcyclohexane
and ferric chloride some time ago. Since our traction fluid has a structure
not dissimilar from methylcyclohexane and since the Kovacic mechanism accounts
for both olefines and aromatics very beautifully it should be applicable.
The following steps are involved:
26

Note that intermediate II is a cyclohexene, an olefin, which can form
a polymer, and indeed "carbon" and friction polymer were found.
mile the above mechanism is very plausible, it has not been proved.
Kovacic's experiments started with 2:l mole ratios of methycyclohexane and
ferric chloride, while the situation in a bearing is quite different.
Obviously the study of some related chemistry would be very much to the
point.
4.2 Mechanism of Polyphenyl Ether (5P4E) Deterioration by 1,1,2-Trichloro- ethane
Ethers are basic because of the unpaired electron on the oxygen. Poly-
phenyl ether would therefore react readily with an alkyl halide to form alkyl
derivatives in the presence of ferric chloride formed on the steel ball and
at the same time break the ether linkage, e.g.
These materials would then react further on the metallic surface to
form radical ions, acids, and resins by a Goldblatt [S] mechanism as shown
below.
Metallic surface sliding > virgin metal surface (VM)
VM+aromatic (ARO) -> M; Aro (absorbed aromatic on metal) M; Aro\M+; Are'- (adsorbed radical anion) M ; Are'-->M+ + Are'- (desorbed radical anion) Are'- +metal or metal oxide-) reduced metal oxide or
abrasives + metal ____j abrasive wear Are'- + H20 -> Aro7I' + OH7 -> dihydronaphthale
Are'- + 02 -) Aro + O2 '--> peroxides ____$ acids or resins
Are'- + aliphatic A ) adduct + higher mol. wt. products Are'- + lliphatic + O2 ___) peroxides (of aliphatics)
p) acids (of aliphatics) or resins.
27

In presence of moisture a somewhat different mechanism will account
for the acids and resins eventually formed. The main point to be raised
here is that polyphenyl ethers, for all their thermal stability are really
very active chemically, especially in the presence of virgin metal surfaces.
Study of the chemistry involved should lead to better protection and avoid-
ance of lubricant and metal surface breakdowns.
4.3 Influence of Bounding Surfaces on Lubricating Film Alignment
Our EHD dichroic ratios for 5P4E polyphenyl ether have shown significant
changes, even inversions for some infrared bonds when trichloroethane was
present in small concentration in the case of the steel ball/diamond contact.
In the case of the bronze ball/diamond contact, the changes produced by trichloro-
ethane were much smaller or even insignificant. In the case of the Santotrac
p-40 traction fluid, the dichroic ratios were also affected by a small concen-
traction of trichloroethane , primarily at low speeds and loads and generally in
such a way as to alter the direction of dichroic ratio change with increasing
speed and load. These changes can best be interpreted in terms of adsorbed
boundary layers influencing the orientation of the bulk fulid, since it is only
the bulk fluid that our spectrometer is seeing.
Such a conclusion is not as far-fetched as it seemed to me at first,
for a literature review revealed that X-ray diffraction studies carried out
by Clark, Sterrett, and Lincoln [7] in 1936 showed such effects. They say:
II . . . . the addition of this chlorinated compound (viz. methyl dichloro-
stearate, ) greatly improves the orientation of the hydrocarbon molecules
of paraffin and paraffin-oil films. Thus, besides orienting in films
of the purepolar compounds, even in small amounts they show a marked
tendency to regiment surrounding molecules which are only weakly polar".
28

I believe our dichroic ratios not only confirm the results of these X-ray
studies--which, by the way, had to be performed with simulated materials,
Viz. solid wax instead of oil, in order to see the X-ray diffraction pattern--
but provide us with molecular orientation data likely to lead us to superior
fluid formulations.
Clark, Sterrett, and Lincoln also rated different metal surfaces in
terms of their ordering tendency for "addition agents" on a scale from 1 to 4,
in order of increasing orientation, the orientation being determined by the
X-ray diffraction pattern. The most oriented addition agent was trichlorophenol,
which was rated 4 on copper, but only 1 on iron. Stearic acid was rated 1 on
copper and 0 on iron. These authors' X-ray data are in remarkable agreement
with our dichroic ratio data for steel and bronze.
Furthermore, the same authors presented evidence from X-ray diffraction
data that chlorinated addition compounds alone and in oi:l blends when
heated in the presence of metals, form a resistant surface layer on the
metal and themselves undergo a chemical change, considered a chemical conden-
sation. Some of the chlorine atoms are pulled out from the organic compounds
presumably forming metal chlorides.
4.4. Traction Fluids
Traction is considered to be a fluid property in the EJID contact region, for
which the conditions are set in the EHD inlet sone. There is now abundant evi-
dence for the correctness of this view. Consistent with this view a small con-
centration of trichloroethane does not change the traction behavior of the Sun
traction fluid, as we have shown. On the other hand, this same material did
change (lower) the traction of the Monsanto fluid (Santotrac P-40) at high ball
speed and load. The traction of 5P4E, polyphenyl ether, (reservoir temperature
29

50') which is not considered a traction fluid, was increased by trichloroethane
(2%) at low speed, but decreased at high speed and low load, as we have seen.
Of course, prolonged use of high concentrations of the chloride caused failure.
Rounds [S') reported in 1972 that the addition of a chlorinated wax to hydro-
carbon base oils changed the measured coefficients of static and kinetic friction.
The addition of 2.5% of chlorinated wax to an oil containing less than 2% of
aromatic carbon decreased the friction only slightly at low speeds, but very much
at high speeds, while the same addition to an oil containing more than 15% of
aromatic carbon increased the traction at low speeds and slightly decreased it
at high speeds. These findings are in exact agreement with our results for the
Monsanto traction fluid Santotrac P-40 and polyphenyl ether (5P4E) at the 50°C
reservoir temperature. Rounds related these results to the surface concentration
of chlorine in the boundary surfaces and spoke of an "aromatic effect" in terms
of competition between an organic chloride and aromatic materials for surface
adsorption sites. Oxidation products of the aromatics in particular may also
affect surface coating formation.
Polycyclohexyls were included among Rounds' fluids and he states: 'I...
Although the improvement in tractive effort available from such fluids is
generally attributed to bulk-oil physical property changes occurring in the
contact region, the data of Figure 2 (showing the effect of chlorinated wax
addition) point out that surface chemistry cannot be ignored". Indeed, data
we obtained with the scanning electron microscope and corresponding surface
X-rays show chlorine reacted on with our bearing ball, and much more so on the track
containing the ERD contact than on the rest of the ball. On the other hand,
preliminary data with this ball used in measuring traction of neat Santotrac
P-40 fluid did not show reduced traction when compared to a clean ball.
If substantiated, it would mean that the trichloroethane reduces
30

traction by a bulk fluid effect and that the chloride coating is coincidental.
In this connection it is worth noting that the addition of chlorine to many
polymers changes the mechanical properties, notably an elastic/plastic trans-
ition. The presence of the cyclohexyl group in some of the polymers brings
in a secondary transition corresponding to the same movement that occurs in
low molecular weight cyclohexyl derivatives when the cyclohexyl group changes
from one conformation to another (Figure 40). This flip, called Hejboer flip,
after its discover, [g] could be of importance to traction.
31

5. WORK PLANNED
5.1 Failure of EHD Lubrication
The.effect of surface composition on traction and failure will be explored
with gold-plated and platinum-plated stainless steel balls, alumina balls,
silicon nitride balls and balls plated with titanium and vanadium carbides. For
this purpose various additives and contaminants will be studied. We have some
of these balls on hand already, donated to us through the courtesy of SKF Corpor-
ation (Sweden); others will be provided to us at nominal cost by Laboratoire
Suisse de Recherches Horlogeres (Dr. Hans Hintermann, Director). Some of these
surfaces are used without lubricants, notably the non-metallic ones. The non-
metallic surfaces alsopossess characteristic infrared spectra which are indi-
cative of their crystalline structure. For example, silicon nitride has dif-
ferent bands depending on whether it is cubic or hexagonal; near 200°C, it was
reported [9], the transition from one form to the other occurs. If lubricant
deterioration is catalyzed by a metal surface, as is likely to be the case for
Santotrac containing trichloroethane, then an inert metal (gold) or a non-
metallic surface should provide longer bearing life.
The problem of scuffing failure is intimately related to lubricant failure.
Dyson postulates two types of failure, hydrodynamic film failure and boundary
film failure. The latter must clearly be chemically influenced.
Additives to be looked at are tricresylphosphate, zinc dithiophosphate,
stearic acid and 12-hydroxystearic acid, and halogenated stearic acid. Among
the fluids under study will be wet and dry polyphenyl and C-ethers, esters,
and mixed polyphenyl ethers to provide constant film thickness for different
operating conditions. Our new interferometer with the rotating polarizers
should help reduce times considerably.
32
5.2 Improved Traction Fluids
We intend to pursue the clue infrared polarization changes (dichroic
ratios) seem to provide by their apparent correlation with the viscoelastic/
plastic transition (high dichroic ratio--low slip). Heijboer's transition
for cyclohexyl rings is related to free volume changes in fluid. A theoretical
analysis will be made, to be followed by a synthesis and tests of proposed
materials.
33

i
1. Lauer, James L., "Determination of Physical and Chemical States of Lubricants in Concentrated Contacts--Part 1". NASA CR-3204 (Grant NSG-3170), November 1979.
2. Kovacic, P., Morneweck, S.T., and Volz, H.C., "The Nature of the Methylcyclo-. /J
hexane--Ferric Chloride Reaction," J. Am. Chem. Sot. 28, 2551-4 (1963).
3. Goldblatt, I.L., "Model for Lubrication Behavior of Polynuclear Aromatics, "Ind. Eng. Chem. Prod. Res. Develop. l.0, 270-278 (1971).
4. Winer, W.O., and Sanborn, D.W., "Surface Temperatures and Glassy State Invest- igations in Triboloby," NASA CR-3031, June 1978.
5. Tevaarwerk, J.L., "Spin Traction Prediction" in Suh, N.T., "Fundamentals of Triboloby, I1 MIT Press, 1980, ISBN: 0-262-1918?--rO, pp 1129-47.
6. Hamrock, B.J., and Dowson, D., "Minimum Film Thickness in Elliptical Contacts for Different Regimes in Fluid Film Lubrication", NASA Technical Paper 1342, Oct. 1978.
7. Clark, G.L., Sterrett, R.R., and Lincoln, "X-ray Diffraction Studies of Lubricants", Ind. and Engng Chem. 28, 1318-1328 (1936).
8. Rounds, F.G., "Effect of Aromatic Hydrocarbons on Frictions and Surface Coating Formation with Three Additives." ASLE Transactions, l6, 2, 141-149 (1972).
9. Heijboer, J.,Kolloid, Z., 148, 36 (1956).
34

APPENDIX I
POLARIZED INFRARED RADIATION
Like any other electromagnetic radiation infrared radiation is produced
by oscillating dipoles. As the electric charges move back and forth, the
dipole moment vector changes and electromagnatic waves are generated whose
electric vector is parallel to the direction of the dipole moment. In
Figure 42, where the dipole moment change is along the z-axis, electromagnetic
waves are propagated in the x and y direction but not in the z-direction.
No polarizing filter is needed for this result which, conversely, is evidence
for the orientation of the change of dipole moment.
Polarizing filters (discs) are so constructed that they transmit radiation
plane-polarized for only one direction of the electric vector. Their rotation
about an axis perpendicular to their plane allows a different component of the
incident radiation to pass. Figure 48 shows two dipoles radiating along the
z-direction but differently oriented in the x/y plane, Intensity maxima occur
whenever the electric vector of the transmitted plane-polarized radiation is
parallel to one of the radiating dipoles.
35
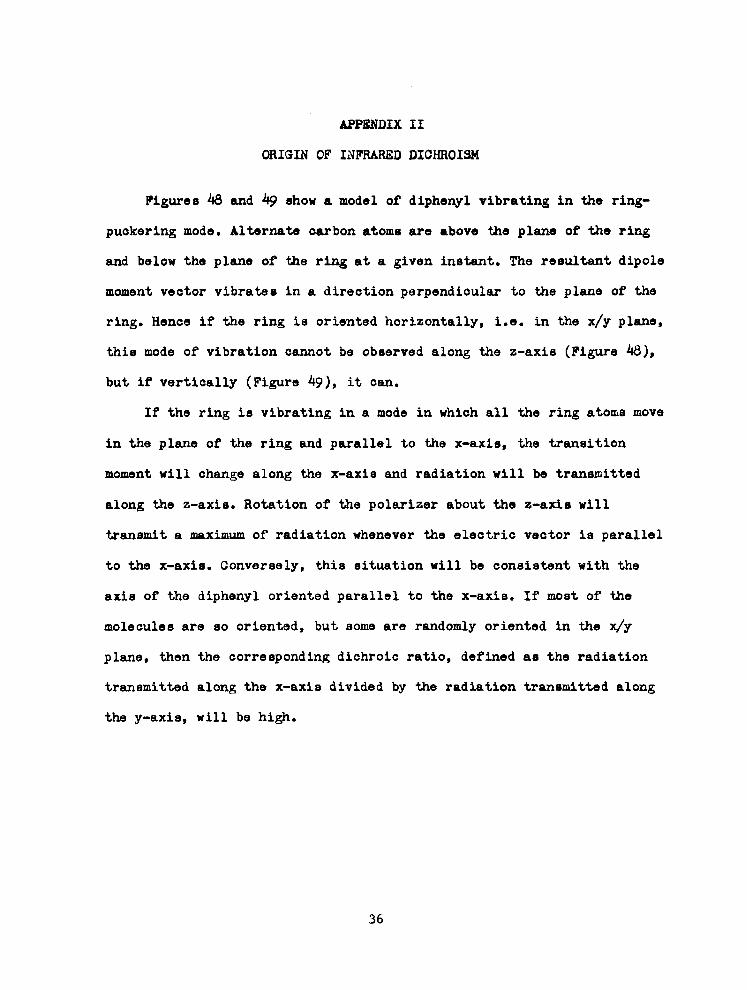
APPENDIX II
ORIGIN OF INFRARED DICHROISM
Figurea 48 and 49 ehow a model of diphenyl vibrating in the ring-
puckering mode. Alternate carbon atome are above the plane of the ring
and below the plane of the ring at a given inetant. The reeultant dipole
moment vector vibrates in a direction perpendicular to the plane of the
ring. Hence if the ring is oriented horizontally, i.e. in the x/y plane,
this mode of vibration cannot be observed along the z-axis (Figure 48),
but if vertically (Figure 49), it can.
If the ring ie vibrating in a mode in which all the ring atome move
in the plane of the ring and parallel to the x-axie, the traneition
moment will change along the x-axis and radiation will be tranemitted
along the z-axie. Rotation of the polarizer about the z-axis will
tranemit a maximum of radiation whenever the electric vector is parallel
to the x-axie. Conversely, this situation will be coneietent with the
axie of the diphenyl oriented parallel to the x-axie. If most of the
molecules are 80 oriented, but Borne are randomly oriented in the x/y
plane, then the correeponding dichroic ratio, defined ae the radiation
tranemitted along the x-axis divided by the radiation tranemitted along
the y-axis, will be high.
36

Figure 1 Apparatus for measuring lubricant film thickness, traction, and fluorescence of lubricants in oper- ating bearing contacts
37

Figure 2 Standard Blackbody Source
38

rotating polarizer
photocell reference
pickup
Figure 3 Polarizing Chopper Wheel
39
0.1
0.2
0.: % s
.bcQ OOC
=: 2 0.L
0.1
0.t
0.:
0.1
O.! 1.f
1.1
Figure 4 Grating Infrared Spectrum of Santotrac P-40
1600 1400 1200 1000 800
WAVENUYBER

0.1
0.2
0.5
0.6
0.7
0.8
0.9 1.0 , I
1700 1600 1500 1400 1300 1200 1100 1000 900 800 700
WAVENUMBER Figure 5 Grating Infrared Adsorption Spectrum OY 1,1,2-Trichloroethane
. . I
750 870 990 1 1110 cm I -.. -.- -.. .I.., m., -.m -_I IY.. a..*.. ,I".. I- I -crmul MC*: ITa!
GUA= 0.58
_. 750 870 990 I I -.. -.. -. A.. m, -_. -_. IN_
sPc.zrnun Nu-mI"' ,u GUA=0.68
StCcImNa-l MC”: I..
GUA = 0.62
Figure 6 Comparison of Santotrac P-40 Spectra with Different Lubricant Temperatures l/m/set Linear Speed, ave. Hertzian Pressure 600 MPs,Not Polarized
42

ki z 1.0 iz Lz .8 .6 H-POLARIZATIO~I
2 111 .4
& .2
fk0 -I275 1447 1620 1794
I I I I
1.0 I
.8 I NOT POLARIZED
.6 -
.4 -
.2 - 0, I 1275 1447 1620 1794
WAVENUMBER (CM”)
Figure 7 ENI spectra of Santotrac P-40 under high speed and load and with a ball that had much previous use. The upper spectrum was polarized in a plane perpendicular to the conjunction plane.
43

WAVENUMBER CM-’
1500 1400 1300 1200 1100 1000 900 BOO
ABSORBANCE
I /T ,/\’ . ./
TRACTION FLUID (100 MPa)
_---- TRACTION FLUID (I GPa)
Figure 8 Diamond Cell Infrared Adsorption Spectra of Sun Company Traction Fluid under Pressure
44

(A)
SPECTRUN NUPIBER: 13%
Santotrac 40 No Additive
800 &lOOQ Broadened by4 900 Broadened by 2
600 700 8dO -1900 1000 1100 1200 cm
Figure 9 Infrared Emission Spectrum of Santotrac p-40 compared with broadened Absorption Spectrum
A) Emission Spectrum B) Absorption Spectrum plotted as Absorbance
against wave number 45

Figure 10 The Molecular Movement in the Cyclohexyl Group which Corresponds to the Secondary Transition (The oxygen
atom shown schematically as a connecting link).
46

0.2
0.3
8 0.4
5 E 0 0.5 Ei
7 0.6
0.7
0.8 0.9 I .o
I .5
I‘
- - 100 MPa - I GPa
I I I I 1 1 1 0 1300 1200 1100 1000 900 800 700
WAVENUMBER (CM-‘)
Figure 11 Diamond CellInfrared Adsorption Spectra of Synthetic Paraffinic Oil
47
-

ORIGINAL SPECTRA
TR.~CHLOROETHANE
I I I I I I I 1 , 870 990 70 1230
0 I II I I I I I I\ 630 750 670 990 1110 1230
r 01 ‘.I ” ” ” ’ 1 630 750 670 990 1110 1230
630 750 870 990 1110 1230 630 750 870 990 Ill0 1230
WAVENUMBER (CM-‘)
DIFFERENCE OF SPECTRUM ON THE LEFT AND CORRESPONDING NEAT
IO c SPECTRUM
%I30 990 Ill0
I.Or
.8 -
.6 -
.2 Jr’
.4 -
0 I I I I I I I I 530 750 870 990 III7 1230
630 750 070 990 Ill0 1230
WAVENUMBER (CM-l)
Figure 12 EHD Infrared Spectra of Traction Fluid Containing Various amounts of Trichloroethane
48

750 630 I230
WAVENLJMBER (CM-‘) a) low rperd, low load low speed: 200 RPM or 0.6 m/s
high speed: 400 RPM or 1.2 m/s low load: 500 MPa ave. Hertzian
Pressure high load: 700 MPa ave. Hertzian
hi Pressure
-30 630
WAVENUMBER (CM-‘) b) low tpeed ,high loud
rr1rIIIII 630 750 870 990 1110 1230
WAVENUMBER (CM-‘] a’) high rprrd, low load
WAVENUMBER (CM-‘) b’) high ~prd, high load
NEAT TRICHLOROETHANE ADDED
Figure 13 EHD Infrared Spectra of traction fluid,both neat (solid line) and containing 15% trichloroethane by volume (broken line). All spectra are normalized to an ordinate (spectral response) scale of unity; however, the greatest unnormalized spectral response (GUA) is given for comparison
49
a

GUA
POLARIZATION
NONE
VERTICAL
-_I 5 I.. II.. -.. .Y.. .s... I.. I.. .-_. .,.a. ..x... U..
-;va: ‘“[0.76]=0.25
45O
HORIZONTAL
. .
-.. -.. w.. .I.. ‘t .I... d.. -.. .-.. .I”.. ..“.. Y..
--: -[0.71j=0.24 -
.“-
m.
-.
. . \ -.. -.. t-.. “.., m., I.. d.. ,-.. ..I._. ..I_. sm..
--: ‘=[0.78]=0.26 SPECTRA AT DIFFERENT POLARIZATION 200 RPM 600 MPa No chloride
Figure 14 Effect of polarization plane angle variation on a Santotrac p-40 fluid EHD contact emission spectrum (the bracketed GUA's were obtained at different gain).
50

Dichroic ratio,
3
2
(A) 1
690 cm -1
& \
\ \
\ A 400 MPa Ave. Hz. Pressure band \
\ no additive
\ \
\ l I\ a 600 MPa Ave. Hz. Pressure
'A no additive
0 -.
-- -&-B
A 400 MPa Ave. Hz. Pressure with 2% trichloroethane
lOtI 206 ball sliding speed RPM
Dichroic ratio
917 cm-l band
\ \ \ *A ,,G l
P 600 MPa Ave. Hz. Pressure with 2% trichloroethane
, 100 260
ball sliding speed REW
Figure 15 Relation between Dichroic ratio and Ball Speed for Different Loads with Santotrac P-40 and Trichloroethane Additive
(A)(B) 690 and 917 cm-l bands resp.
51

Dichroic ratio
Dichroic ratio
2.
CD)
A 400 MPa Ave. Hz. Pressure no additive
1600 cm -1
Q 600 MPa Ave. Hz. Pressure no additive
ball sliding speed RPM
I lb0 260
ball sliding speed RPM
Figure 15b Relation between Dichroic ratio and Ball Speed for Different Loads with Santotrac P-40 and Trichloroethane Additive
(C)(D) 1380 and 1600 cm -1 bands req.
52

h
._
L- :. :: :: :: ::
.: z-
.I
-- .: __ _
.:
: 1-
T 7
-1 :
1
.i _ : .T :
1 z z
z: _. :.I
1
-7 . :: =: :: :: _. - ::
_. :
3
Lntotrac 50 58 mm dia. stainless steel ball against sapphire, 18OC
J\ Santotrac 50 with 2% trichloroeth
same conditions .ane,
@ 3 kg load
Figure 16 Plots of Traction versus ball Speed for the Stainless Steel Ball and Santotrac-50 Fluid with and without 2% of Trichloro- ethane at18OC.
53


SLIP
Figure 18 Typical Traction curve with three commonly designated regions. Region A, small strain linear region; Region B, isothermal non- linear region; Region C, Tevaarwerk [S].)
thermally influenced region (after
55
0.5 ”
I I I I I I I
i \ /
- neat - - -- chloride added
I I I I I I 1 1 I I I I 1 1 630 630 750 750 870 870 990 990 ill0 ill0 1230 1230
WAVENUMBER (CM-‘) WAVENUMBER (CM-‘)
Figure 19 Em spectra of 5P4E polyphenyl ether with a clean oall and with a Figure 19 Em spectra of 5P4E polyphenyl ether with a clean oall and with a ball containing absorbed chlorine on it surface ball containing absorbed chlorine on it surface
i \ \ !

lOi
IO’
IO”
IO4
9v
Id
IO2
IO’
Highload
Viscous-rigid Low load-+ /
/ /-
9” /
/
/x / lsoviscous elastic
very low load / /
7 / ‘-7 elastic
0
/ /
/ /
/ /
/ /
o 5P4E x traction f!uid
I m-m
-\ / 1
lsoviscous 1 rigid I
I I I I I I J IO’ IO2 IO3 IO4 IO5 IO6
Figure 20 Lubrication regimes on log-log grid of dimensionless viscosity and elasticity parametegs for a circular contact (after Hamrock and Dowson )
57

0.0 630 870 Ill0
b)
cl
630 870 1110 cm-1
Figure 21 Infrared emission spectra of 5P4E from the ball/plate conjunction (a) low speed (200 RPM) and low load (400 MPa Ave. Hz. pressure) (b) low speed (200 Rl3l) and high load (600 MPa Ave. Hz. pressure) (c) high speed (400 RPM) and high load (600 MPa Ave. Hz. pressure)
Note the arrow pointing to the 780 cm-1 band
58

(A)
1275 1290 1505 1620 1735 1850
(C>
WAVENUMBER CM-1
3gure 22 Tnfrared mission spectra (1250 - 1850 cm-l) of 5P4E polyphenyl ether (stainless steel ball, 1.2 m/s, 700 MPa)
(A) not polarized (B) polarized along the conjunction line (C) polarized normal to the conjunction line
59
(A)
(B)
1735 1850
2 E % E 1275 1390 1505 1620 1735 1850
WAVENUMBER w-l Figure 23 Infrared emission spectra (1250- 1850 cm-') of 5P4E polyphenyl ether
containing 3% of trichloroethane (stainless steel ball, 1.2 m/s, 700 MPa)
(A> not polarized 0) polarized along the conjunction line (C) polarized normal to the conjunction line
60

(A)
630 750 870 990 1110 1230
630 750 870 990 1110 1230
w
630 750 870 990 1110 1230
WAVENUNBER CM-l
Figure 24 infrared emission spectra (630 -1230 cm-') of 5P4E polyphenyl ether (stainless steel ball,1.2 m/s, 700 MPa)
(A> not polarized (s) polarized along the conjunction line (C) polarized normal to the conjunction line
61
(A)
(B)
03
630 750 870 990 1110 1230
630 750 870 990 1110 1230
IdAVENUF?BER CM -1
Figure 25 Infrared emission spectra (630 -1230 cm-') of 5P4E polyphen ether containing 3% of trichloroethane (stainless steel bal 1.2 m/s, 700 MPa)
(A) not polarized (B) polarized along the conjunction line (C) polarized normal to the conjunction line
62
.Yl 1,

(A)
630 750 870 990 1110 1230
0)
% 7% E s 630 750 870 990 1110 1230
(Cl
630 750 870 990 1110 1230
WAVENLPIBER CM-I
Figure 26 Infrared emission spectra (630-1230 cm-l) of 5P4E polyphenyl ether (stainless steel ball, 1.2 m/s, 500 MPa)
(A) not polarized (B) polarized along the conjunction line (C) polarized normal to the conjunction line
63

(A)
630 750 870 9'90 1110 1230
1.0 I
630 750 870 990 1110 1230
630 750 870 990 1110 1230
WAVENUFIBER CM-' Figure 27 Infrared emission spectra (630 -1230 cm-') of 5P4E polyphenyl
ether containing 3% of trichloroethane (stainless steel ball, 1.2 m/s, 500 MPa)
(A) not polarized (B) polarized along the conjunction line (C) polarized normal to the conjunction line
64

(A)
03
1.0 .
0.5 '
630 750 870 990 1110 1230
630 750 870 990 1110 1230
1.0
0.5
630 750 870 990 1110 1230
WAVENUPIBER CM-~
Figure 28 Infrared emission spectra (630 -1230 cm-l) of 5P4E polyphenyl ether (stainless steel ball, 0.6 m/s, 700 MPa)
(A) not polarized (B) polarized along the conjunction line (C) polarized normal to the conjunction line
65

630 750 870 990 1110 1230
WAVENUMBER CM-'
Figure 29 Infrared emission spectra (630-1230 cm-') of 5P4E polyphenyl ether containing 3% of trichloroethane (stainless steel ball, 0.6 m/s, 700 MPa)
(A) not polarized (B) polarized along the conjunction line (C) polarized normal to the conjunction line
66
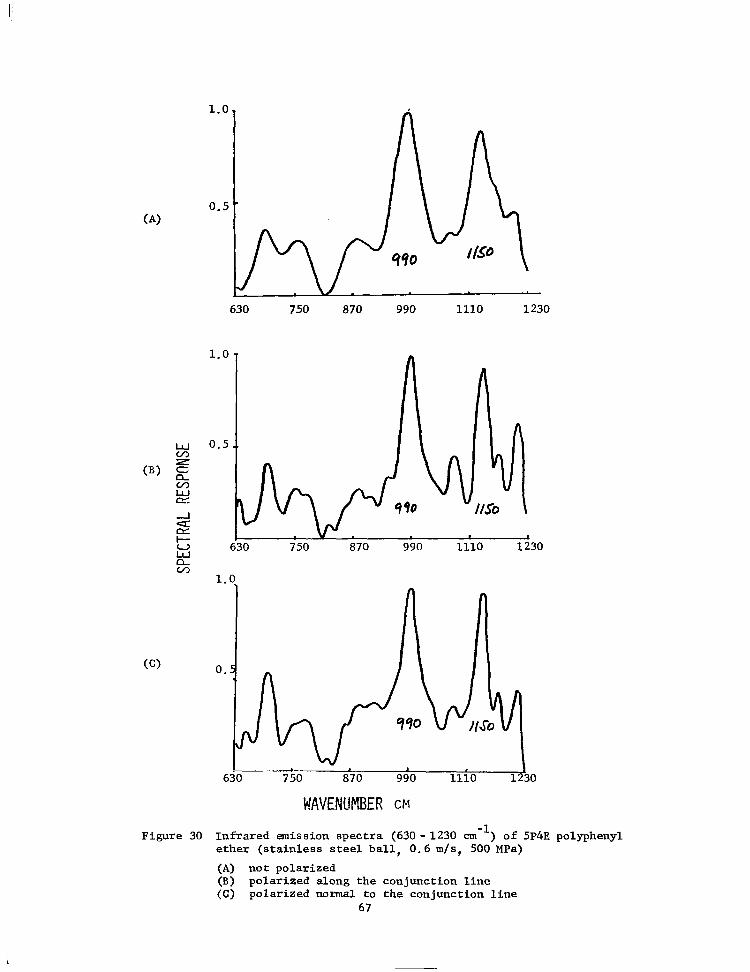
(A)
(0
630 750 870 990 1110 1230
630 750 870 990 1110 1230
WAVENUMBER CM
Figure 30 Infrared emission spectra (630 -1230 cm-') of 5P4E polyphenyl ether (stainless steel ball, 0.6 m/s, 500 MPa)
(A) not polarized (B) polarized along the conjunction line (C) polarized normal to the conjunction line
67

(A)
630 750 870 990 1110 1230
630 750 870 990 1110 1230
1.
0.
(0
630 750 870 990 1110 1230
-1 WAVENUMBER CM Figure 31 Infrared emission spectra (630-1230 cm-') of 5P4E polyphenyl
ether containing 3% of trichloroethane (stainless steel ball, 0.6 m/s, 500 MPa)
(A) not polarized (B) polarized along the conjunction line (C) polarized normal to the conjunction line
68

(4
630 750 870 990 1110 1230
630 750 870 990 1110 1230
WAVENUMBER CM
Figure 32 Infrared emission spectra (630-1230 cm-') of 5P4E polyphenyl ether containing 3% of trichloroethane (stainless steel ball, 0.2 m/s, 700 MPa)
(A) not polarized (B) polarized along the conjunction line (C) polarized normal to the conjunction line
69

Dichroic ratio
m- AA - --_ ---_ I -4- A I --em I / - I
2&r-' /iA'
load 0%)
Figure 33
RPM 0 100, 0.3 m/s
A 200, 0.6 m/s
u 400. 1.2 m/s
Dichroic ratio of the 990 cm -1 emission band in the EHD spectrum of 5P4E polyphenyl ether as a function of load, when a stainless steel ball was used.

Dichroic ratio
2
i
0 /
0 0
. / 0
/ 0
,
A%, 0.3 m/s
cl 200, 0.6 m/s
0 400, 1.2 m/s
Figure 34 Dichroic ratio of the 1150 cm -' emission band in the EHD spectrum of 5P4E polyphenyl ether as a function of load, when a stainless steel ball was used.

Speed. RPM (m/s)
I a2 El 4
Figure 35 Dichroic ratio of the 900 cm -1 emission band in the EHD spectrum of 5P4E polyphenyl
ether as a function of load, when a stainless ball was used

-
Dichroic
1 4 W I RPM
a 2 kg CI 4 kg
I Figure 36 Dichroic ratio of the 1150 cm -1 emission band in the EHD spectrum of 5P4E
polyphenyl ether as a function of ball speed, when a steel ball was used.
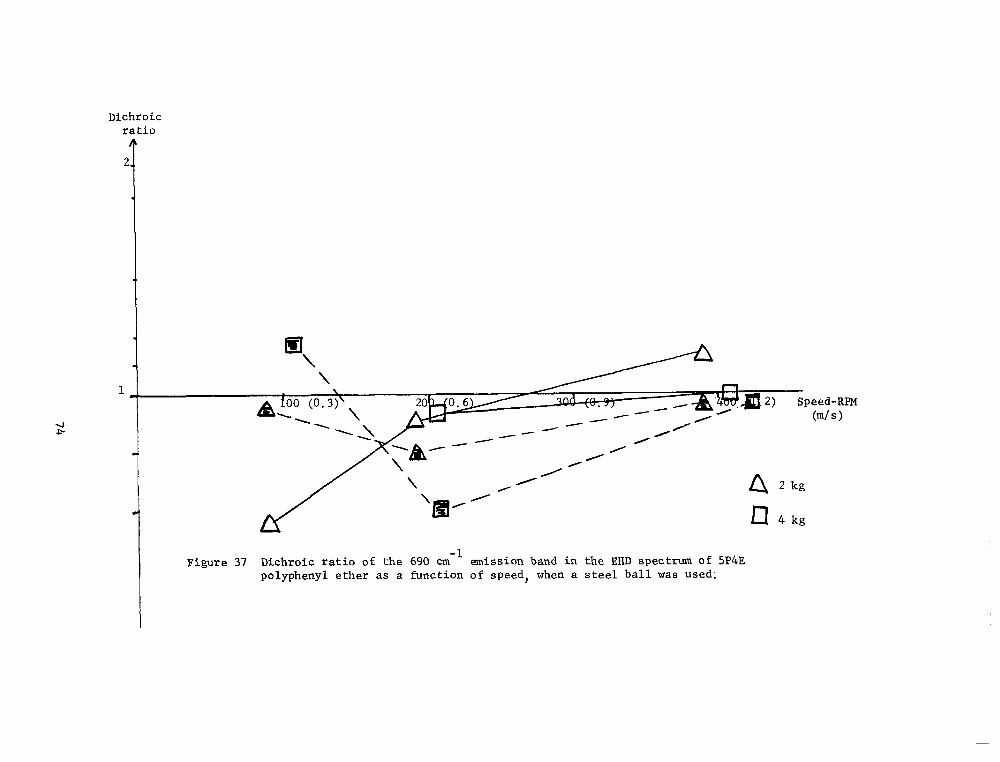
Dichroic ratio
Figure 37 Dichroic ratio of the 690 cm -1
emission band in the EHD spectrum of 5P4E polyphenyl ether as a function of speed, when a steel ball was used:

-
Dichroic atio
I 2 5
\ \ \
--- A m--e------
100 (0.3) a 2 kg cl 4 kg
Figure 38 Dichroic ratio of the 760 cm -1 emission band in the EHD spectrum of 5P4E polyphenyl ether as a function of ball speed, when a steel ball was used,

Dichroic ratio
Speed-RPM 44
--- A 100, (0.
0 400, (1.2)ds
3)ds
6)ds
'-1 Figure 39 Dichroic ratio of the 690 cm emission band in the EHD spectrum
of 5P4E polyphenyl ether as function of load, when a steel ball
load,kg
was used.

Dichroic ratio
Speed
4 0 100 RPM, 0.3111/s
A 200 RPM, 0.6m/s
13 400 RPM, 1.2n/s
V Figure 40 Dichroic ratio of the 760 cm -1 emission band in the EHD
spectrum of 5P4E polyphenyl ether as function of load, when a steel ball was used.

Strain p-in in
16C
14
10
8
4(
Figure 41 Traction of 5P4E polyphenyl ether at 18'C
78

Strain
ILLin in 18
140
120
100
80
60
40
20
I
IdO 2ob 360 460 rjbo Speed (RPM) \ ,
(0.3) (0.6) (0.9) (1.2) (1.5) (m/S> >
Figure 42 Traction of 5P4E polqhenyl ether containing 3% of trichloroethane at 18 c
79
3 kg load
!
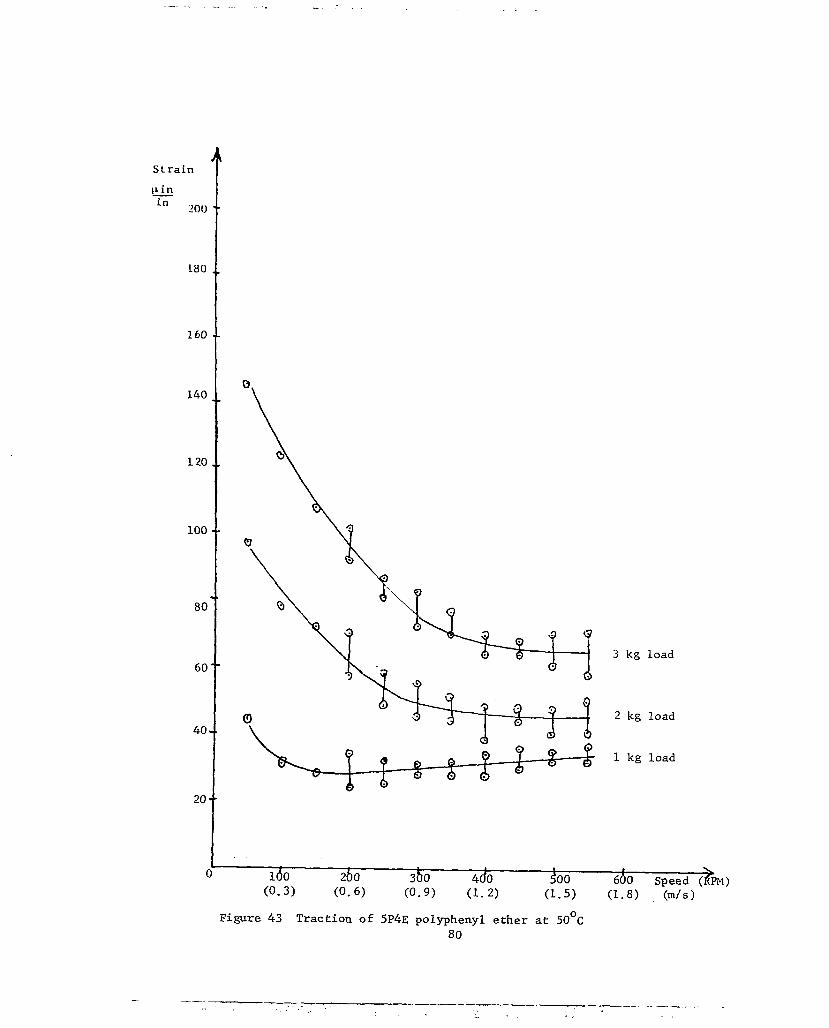
SLrain
IL in in 200
180
160
140
120
100
80
6(
4c
2C
--
Figure 43 Traction of 5P4E polyphenyl ether at 50°C 80
:. . . . . ...
-e-e--_ 1 ~. ---._. .
L _. . . ,

200
180 Strain
160
80
60
40
20
I-
3 kg load
2 kg load
1 kg load
* % I 1 . 1 >
100 200 300 400 500 600 Speed (Ri)l;l) (0.3) (0.6) (0.9) (1.2) (1.5) (1.8) (m/s>
Figure 44 Traction of 5P4E polyghenyl ether containing 3% of trichloroethane at 50 C
81

Dichroic ratio
A
load
cl 4 kg
0 6 kg
. I .
, l
\ I 1 I
100 200 300 400 Speed (RPM)
(0.3) (0.6) (0.9) (1.2) (m/s)
-1 Figure 45 Dichroic ratio of the 690 cm emission band in the EHD spectrum of 5P4E
polyphenyl ether as a function of speed, when a bronze ball was used.

Figure 46 Generation of infrared waves by an oscillating dipole along the z-axis.
Y
Figure 47 Generation of infrared waves by an oscillating dipole along the x and y axes.
83

..M)M DEVIATION
_,; ---- ---_ --------_____--_____------------------------”----------------- ----_ .@ Y
c- .* .I
/ ,/= x c*
Figure 48 Model of a diphenyl vibrating in the ring-puckering mode, generating a varying dipole moment normal to the phenyl ring plane and to the ball and window surfaces of a ball/ plate contact
84
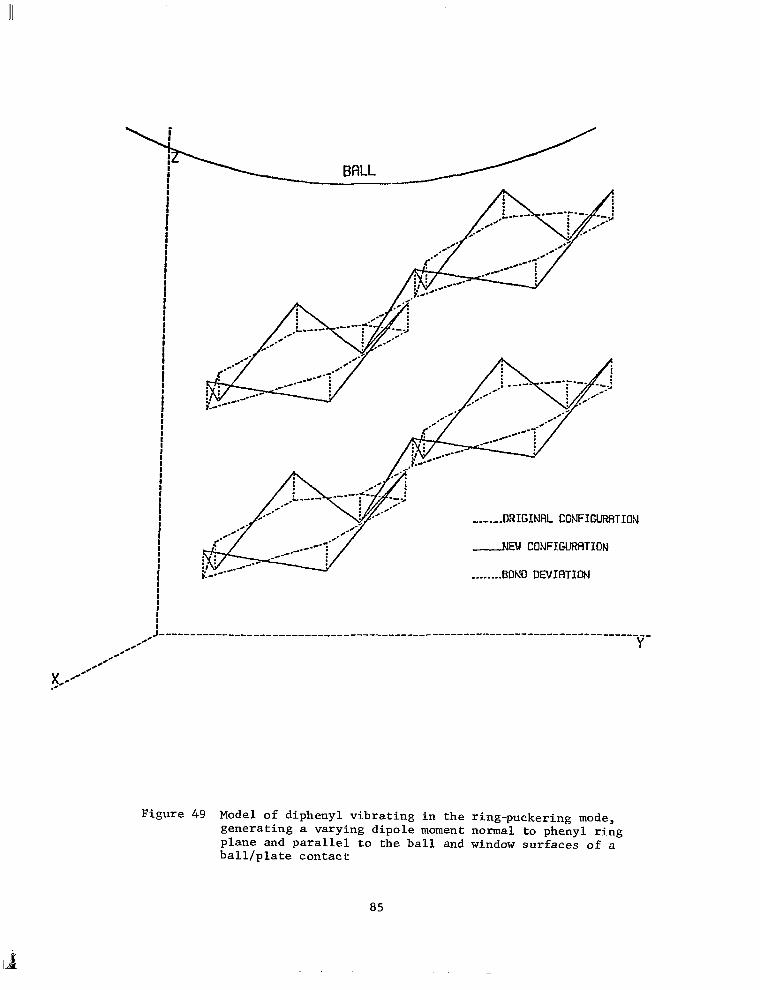
II
,.-.-.DRIGINAL CONFIGURRTION
NEW CONFIGL~R~ITION
. . . . . . ..BONP DEVIATION
I : I
c-- ,-e--S------ __-_________^_^____------------------------------------------------ / Y
p-“--- .-
Figure 49 Model of diphenyl vibrating in the ring-puckering mode, generating a varying dipole moment normal to phenyl ring plane and parallel to the ball and window surfaces of a ball/plate contact
85
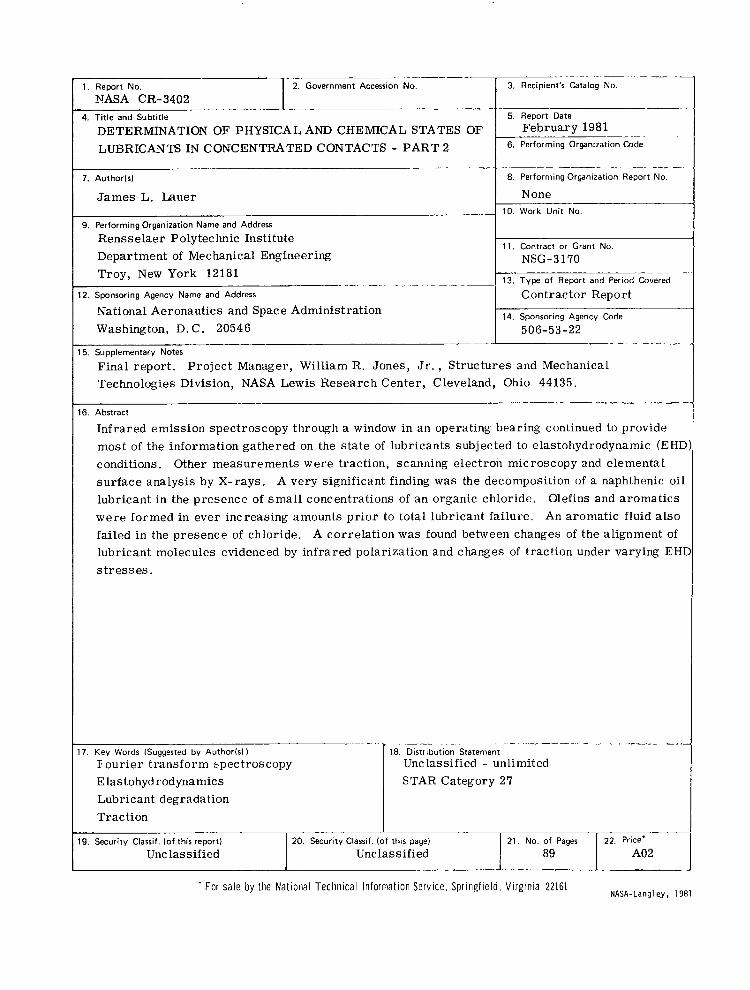
1
1. Report No.
4. Title and Subtitle
2. Government Accession No.
.~ DETERMINATION OF PHYSICAL AND CHEMICAL STATES OF LUBRICANTS IN CONCENTRATED CONTACTS - PART 2
-_ pz;;;;-y; .y
6. Performing Organization Code
7. Author(s)
James L. Lauer
9. Performing Organization Name and Address
Rensselaer Polytechnic Institute
8. Performing Organization Report No.
None 10. Work Unit No.
11. Contract or Grant No. Department of Mechanical Engineering NSG-3170 Troy, New York 12181
13. Type of Report and Period Covered __. _-. . . -_. .- -..- --
12. Sponsoring Agency Name and Address Contractor Report National Aeronautics and Space Administration 14. Sponsoring Agency Code
Washington, D. C. 20546 506-53-22
15. Supplementary Notes
Final report. Project Manager, William R. Jones, Jr., Structures and Mechanical Technologies Division, NASA Lewis Research Center, Cleveland, Ohio 44135.
16. Abstract
~.- -. “._. -.___ __-
Infrared emission spectroscopy through a window in an operating bearing continued to provide most of the information gathered on the state of lubricants subjected to elastohydrodynamic (EHI conditions. Other measurements were traction, scanning electron microscopy and elemental
surface analysis by X-rays. A very significant finding was the decomposition of a naphthenic oi lubricant in the presence of small concentrations of an organic chloride. Olefins and aromatics
were formed in ever increasing amounts prior to total lubricant failure. An aromatic fluid also
failed in the presence of chloride. A correlation was found between changes of the alignment of
lubricant molecules evidenced by infrared polarization and changes of traction under varying EH stresses.
17. Key Words (Suggested by AuthorIs )
Fourier transform spectroscopy E lastohyd rodynamics Lubricant degradation Traction
10. Distribution Statement
Unclassified - unlimited STAR Category 2’7
19. Security Classif. (of this report) 20. Security Classif. (of this page) 21. No. of Pages
Unclassified Unclassified 89 .-.-. -. -.-_ .~
’ For sale by the National Technical Information Service, Sprlnefleld. Virginia 22161
T 22. Price’
A02
NASA-Langley. 1981