Embed Size (px)
Citation preview

Determination of Organic Compound Classes Using Research and Regulatory Analytical Techniques for the Demonstration Project
Public Water Systems (PWS) Groundwater Investigation at Merchantville/Pennsauken and Fair Lawn Water Treatment
Facilities SR08-049
Principal Investigator: Brian Buckley, Rutgers UMDNJ EOHSI
EOHSI Analysts: Min Yoon and Hilly Yang
Field Sampling Coordinator: John Berchtold, NJDEP Bureau of Safe Drinking Water
NJDHSS PHEAL Analysts: Douglas Haltmeier, C. David Riker, and Julian Trexler
Project Manager: Lee Lippincott, NJDEP Division of Science, Research, and Environmental Health
Report Authors: Lee Lippincott and Brian Buckley
March 31, 2017

TABLE OF CONTENTS
EXECUTIVE SUMMARY .................................................................................................................... 1
INTRODUCTION ............................................................................................................................... 3
OBJECTIVES ..................................................................................................................................... 5
MATERIALS AND METHODS .......................................................................................................... 6
CARBON CONTACTOR MEDIA TYPES ......................................................................................... 7
CARBON CONTACTOR CONFIGURATION AT THE MERCHANTVILLE/PENNSAUKEN MARION AVENUE WATER TREATMENT PLANT ...................................................................... 8
CARBON CONTACTOR CONFIGURATION AT THE FAIR LAWN CADMUS PLACE WATER TREATMENT PLANT .................................................................................................................... 11
NJDOH/PHEAL SAMPLE COLLECTION .................................................................................... 12
RUTGERS EOHSI SAMPLE COLLECTION .................................................................................. 12
ISOLATION/EXTRACTION METHODS ...................................................................................... 13
INSTRUMENTAL ANALYSIS METHODS .................................................................................... 14
RESULTS .......................................................................................................................................... 16
POST PROCESSING OF THE MASS SPECTRAL DATA FROM NJDOH PHEAL AND RUTGERS17
EVALUATION PROCESS FOR DETERMINING THE THREE CARBON TYPE PERFORMANCE232
DISCUSSION ................................................................................................................................. 244
NATURAL PRODUCTS .................................................................................................................25
PHYTOSTEROL IDENTIFIED IN THE CARBON PRESSURE VESSELS ....................................25
EXCEPTIONS TO THE UNIVERSAL IMPLEMENTATION OF GAC AS A SOLUTION FOR MULTIPLE TRACE CONTAMINANTS ......................................................................................... 27
CONCLUSIONS ............................................................................................................................. 288
ADDITIONAL RESEARCH CONDUCTED AT RUTGERS EOHSI ................................................. 29
RECOMMENDATIONS FOR FUTURE RESEARCH ..................................................................... 311
REFERENCES ................................................................................................................................. 32
APPENDIX 1 - FAIR LAWN BREAKTHROUGH RESULTS ......................................................... 35
APPENDIX 2 -MERCHANTVILLE/PENNSAUKEN BREAKTHROUGH RESULTS ................ 422

LIST OF TABLES
Table 1. Sampling dates and analytical results file archive for the analyses completed by the NJDOH PHEAL and Rutgers EOSHI labs. ........................................................................................ 6
Table 2. Physical properties of the three commercially available granular activated carbon media evaluated in this study. Information is provided by the manufacturer of each material. Not all information was available for each product. ......................................................................................7
Table 3. Mass spectral data filtering summary of the Rutgers EOSHI research method results of tentatively identified compounds (TICs) for Fair Lawn and Merchantville/Pennsauken facilities. The Fairlawn sample was collected 03/22/2012 and the Merchantville/Pennsauken sample was collected 04/19/2011. Counts reflect the number of TICs identified throughout the treatment train. .................................................................................................................................................. 19
Table 4. Mass spectral data filtering summary of the NJDOH PHEAL method results of tentatively identified compounds (TICs) for Fair Lawn and Merchantville/Pennsauken facilities. The Fairlawn sample was collected 03/22/2012 and the Merchantville/Pennsauken sample was collected 04/19/2011. Counts reflect the number of TICs identified throughout the treatment train. .................................................................................................................................................. 19
Table 5. TIC results from the data filtering process for non-polar organic compounds isolated by NJDOH PHEAL laboratory using modified USEPA Method 525.2 low level analysis at the Fair Lawn facility. A total of 19 samples were collected along the treatment train on 7/29/2014. ....... 20
Table 6. TIC results from the data filtering process for non-polar organic compounds isolated by NJDOH PHEAL laboratory using modified USEPA Method 525.2 low level analysis at the Merchantville/Pennsauken facility. A total of 22 samples were collected along the treatment train on 9/22/2014. ................................................................................................................................... 21
Table 7. Regulated pesticides quantified by NJDOH PHEAL laboratory for the 07/29/2014 Fair Lawn sampling event. A total of 19 samples were collected along the treatment train. ................. 22
Table 8. Regulated pesticides quantified by NJDOH PHEAL laboratory for the 09/22/2014 Merchantville/Pennsauken sampling event. A total of 22 samples were collected along the treatment train. ................................................................................................................................ 22
Table 9. Summary of assumed preferential adsorption media type for polar organic compounds identified by the Rutgers SPME method(1) and nonpolar compounds identified by the NJDOH 525.2 LL method(2) at the Merchantville/Pennsauken (MP) and Fair Lawn (FL) Cadmus Avenue treatment plants. .............................................................................................................................. 24
Table 10. Physiochemical properties of 20 target compounds including molecular weight (MW), log Kow and pKa as presented in Yoon, 2010 [23]. Compounds are ordered by molecular weight........................................................................................................................................................... 30
Table 11. Percent removal and percent relative standard deviation (RSD) for the 20 target compounds in tested water disinfection-processes (in alphabetical order) at two spike concentrations. ................................................................................................................................. 31
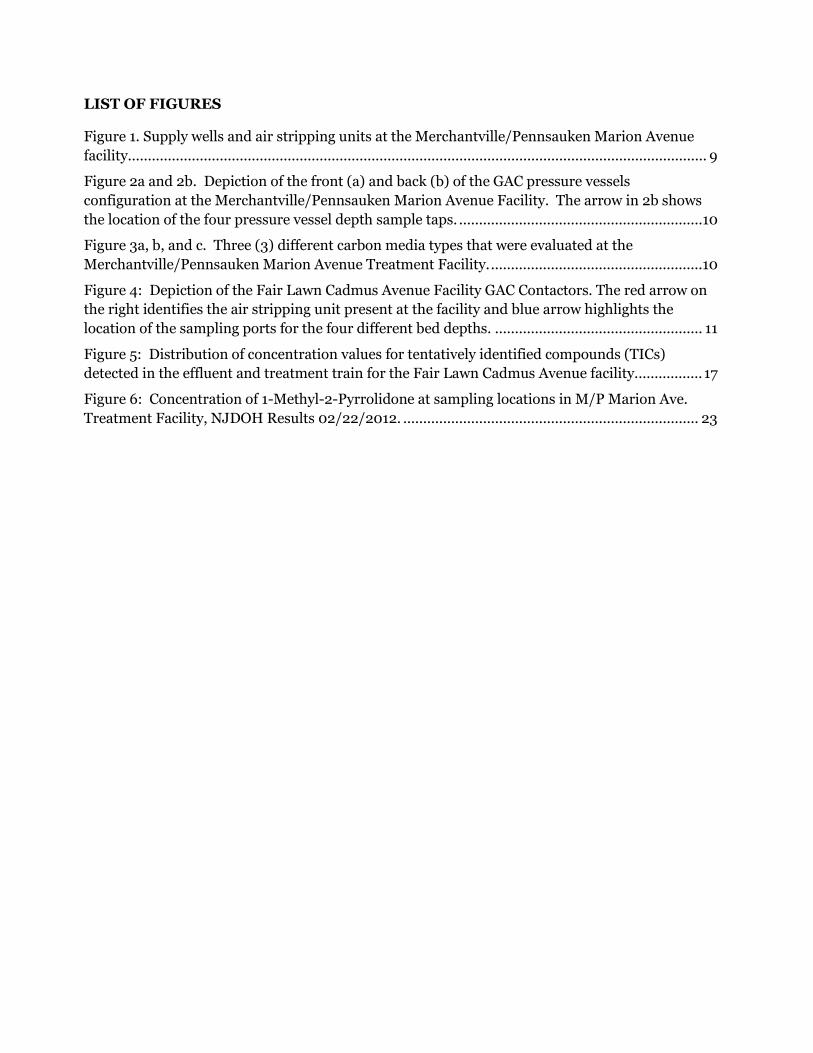
LIST OF FIGURES
Figure 1. Supply wells and air stripping units at the Merchantville/Pennsauken Marion Avenue facility. ................................................................................................................................................ 9
Figure 2a and 2b. Depiction of the front (a) and back (b) of the GAC pressure vessels configuration at the Merchantville/Pennsauken Marion Avenue Facility. The arrow in 2b shows the location of the four pressure vessel depth sample taps. .............................................................10
Figure 3a, b, and c. Three (3) different carbon media types that were evaluated at the Merchantville/Pennsauken Marion Avenue Treatment Facility. .....................................................10
Figure 4: Depiction of the Fair Lawn Cadmus Avenue Facility GAC Contactors. The red arrow on the right identifies the air stripping unit present at the facility and blue arrow highlights the location of the sampling ports for the four different bed depths. .................................................... 11
Figure 5: Distribution of concentration values for tentatively identified compounds (TICs) detected in the effluent and treatment train for the Fair Lawn Cadmus Avenue facility. ................ 17
Figure 6: Concentration of 1-Methyl-2-Pyrrolidone at sampling locations in M/P Marion Ave. Treatment Facility, NJDOH Results 02/22/2012. .......................................................................... 23

1
EXECUTIVE SUMMARY In establishing the priorities of monitoring emerging contaminants in finished drinking water, three elements must exist. The first is hazard identification and a human health assessment to determine criteria for levels of concern for the chemical identified as present in the environment. This is often accomplished on an individual chemical basis even though the chemical is only one of a class of chemicals with similar formulations. It must be remembered that State regulations stipulate a risk level of one in a million as the lifetime exposure threshold. This process creates very low human health criteria levels (part-per-billion or part-per-trillion) for quantification of the chemical of interest. Once the health based level is established, an exposure assessment occurs to identify the compound and its prevalence in finished-drinking water throughout the State. Sophisticated experimental designs are used to identify public water systems that have a high vulnerability of contamination using information present in the Department’s various program databases. Often, published analytical methods either do not exist or fall short of the sensitivity requirements needed to detect these emerging contaminants in the water column and occurrence studies do not detect the contaminant. During the mass spectral analysis phase, hundreds of low-level tentatively identified compounds are determined, but data reduction techniques do not exist for these myriad compounds to be tracked or data managed on a routine basis. If the analytical sensitivity available is not sufficient to achieve the health based level for the individual compounds, then the recommended monitoring level, or practical quantitation limit (PQL), becomes the assessment standard. The next step in the process is to determine the best available treatment technology. The third step is to evaluate the removal/reduction efficiency of various physical and chemical technologies that could potentially be recommended as a means to reduce the levels of a chemical of interest to the lowest level possible. Monitoring the actual efficiency of the removal media, like granular activated carbon, does not occur at low parts-per-trillion concentration levels. Typically, pilot or bench scale column studies have focused on sorptive capacity rather than ambient level removal efficiency. Often the media is evaluated at concentrations that are orders of magnitude higher than the levels in the water due to limitations of traditional measurement methods. Thus, the sorption efficiency, molecular diffusion into the GAC pore structure, and other physical parameters do not represent the trace organic matrix condition that the media is actually exposed to under normal operational conditions. Therefore, it is the objective of this study to evaluate the efficiency of the media at nominal parts per trillion levels. This project was initiated in 2008 but construction delays for the permitted facility did not allow initiation of the project until 2011. The first samples were collected in April 2011 and sampling continued through 2014 at the Merchantville/Pennsauken Water Treatment Plant Marion Avenue Facility (MPW) in Camden County and the Fair Lawn Cadmus Avenue Facility in Bergen County. Neither of the plants underwent a media change-out during the sample collection period. This research utilized optimized regulatory methodology in conjunction with state-of-the-art research methods to determine the full scale activated carbon treatment removal efficiencies of unregulated contaminants at ambient levels in ground water. This research not only evaluated target compounds of interest but considered monitoring the actual removal of a host of tentatively identified chemicals present at ultra-trace levels in raw and finished drinking water. Modified existing regulatory methods that enhanced sensitivity were utilized by the NJ Department of Health laboratory and split samples were evaluated using the sophisticated isolation and instrumental methods at Rutgers Environmental and

2
Occupational Health Sciences Institute (EOHSI) laboratory. Unregulated chemicals were tracked through the distribution system with the intention of recommending which of three different granular activated carbon (GAC) media was the most efficient barrier technology; reducing the levels of these unregulated contaminants at two public water treatment plants in New Jersey. A common point of use treatment system for residential exposure was also evaluated for twenty USGS identified emerging contaminants. Samples collected from two impacted water purveyors were analyzed by multiple organic analytical methods to determine the efficacy of three different granular activated carbon media. The objective of the study was to determine the most efficient barrier technology at reducing the levels of, or removing all together, unregulated semivolatile and nonvolatile unregulated organic contaminants. The complementary analytical methods were employed by Rutgers EOHSI and the NJ Department of Health’s (NJDOH) Public Health and Environmental Analytical Laboratory (PHEAL). Both laboratories used gas chromatography/mass spectrometric techniques but with different target analyte classes and extraction protocols for each method. The NJDOH laboratory analyzed for some volatile and semi-volatile targeted (known) analytes from a modified low level USEPA Method 525.2LL and tracked additional tentatively identified contaminant, whereas the Rutgers EOHSI laboratory scanned for semi-volatile to non-volatile unknowns, using a mass spectral library search for identification of the analytes. The PHEAL laboratory found very low level unregulated nonpolar contaminants that were tracked through the treatment train. The EOHSI laboratory found that only a select few, more polar compounds, made it all the way through the treatment train from source water to delivered effluent. Multiple data filters were applied to reduce the number of potentially identified compounds, e.g. compounds found in any blank sample were removed from the library search. Using the analytical method developed at Rutgers, both synthetic organic chemicals and natural chemical products, derived from plant extracts, were isolated and identified using mass spectral characterization and a library data search. This research demonstrated the ability to track trace-level unregulated contaminants through the treatment train at two facilities that are within the capture zone of a hazardous waste plume. Each facility utilized air-stripping technology to remove regulated VOC contamination prior to implementation of GAC treatment. Although the three different carbon types evaluated were similar in performance, the data indicated that performance differences existed in the GAC material and were related to the polarity of the observed unregulated contaminants. In terms of preferential adsorption and removal by GAC, the following was observed: • Coconut shell carbon showed preferential adsorption for low molecular weight polar organic
compounds like the three-carbon substituted acid, Propanoic acid, 2-methyl-, 1-(1,1-dimethyl) [Appendix 2, pg.44].
• Filtrasorb 600 product showed superior sorptive performance for long chain nonpolar compounds, like 9-octyl-Heptadecane [Appendix 2, pg.61], but was less efficient for polar trace organic contaminants.
• More polar compounds showed increased sorption on the Filtrasorb 300. The compound 1- Methyl-2-Pyrrolidone [Appendix 2, pg.50], is an example of the efficiency for Filtrasorb 300.
Additionally, the NJDOH analytical method identified very low levels of unregulated nonpolar contaminants throughout the drinking water treatment train. The percentage of TICs removed to below detection limit as analyzed by the 525.2LL method for both systems represented a 91-

3
99% reduction. On the other hand, the EOHSI laboratory technique identified a select few, more-polar compounds, which passed through the treatment train to delivered drinking water. The percentage of TICs removed to below detection limit as analyzed by the Solid Phase Micro Extraction (SPME) method for both systems represented a 72-85% reduction. Given the difference in preferential adsorption and removal by the GAC materials, none of the three carbon types can be used alone to remove the full suite of observed polar and non-polar organic compounds. This research can be used as guidance to tailor an appropriate removal strategy for particular water-quality needs. Further research could be performed to determine if each media type would remain as effective if bed materials were combined in a single vessel or if the three media types were staged in series. For these two locations GAC treatment served as a sufficient barrier for many unregulated organic contaminants. Media change out was specified in the conditions of the permit and was to be determined based on breakthrough of regulated pesticide compounds. Breakthrough was reported after four years of continuous operation. These two locations are similar to other locations in the State, but the effective life span of the treatment material will vary from location to location depending on water-quality, water demand, and contact times within the media vessels.
INTRODUCTION This project arose from the realization that the Division of Science, Research, and Environmental Health (DSREH) needed to use advanced analytical techniques to monitor the efficiency of carbon contactors being constructed as part of a demonstration project designed to reduce the concentration of unregulated contaminants that resulted from known contamination within the capture zone of two public ground water supplies in the State. Previous DSREH source water and drinking water research projects identified many unregulated contaminants at low levels in these locations (synthetic organic chemicals, SOC). Both facilities meet or exceed the water quality standards of the USEPA and State of New Jersey for regulated contaminants, particularly volatile organic compounds (VOCs), for which a remedial water treatment strategy (air stripping) has been implemented at both facilities.
One of the largest synthetic organic classes of compounds that are not routinely analyzed by regulatory methods is surfactants. The production of surfactants is estimated at around 15 million tons/year, about half of which are soaps like linear alkyl-benzene sulfonates, lignin sulfonates, fatty alcohol ethoxylates, and alkylphenol ethoxylates. Surfactants are employed in extremely different fields, such as textile, food, paint, polymer, cosmetic, pharmaceutical, microelectronic, mining, and oil recovery [1]. However, these compounds are among the most widely diffused xenobiotic substances that can be found in waste streams and are responsible for polluting the aquatic environment [2-4]. In fact, they are the main cause of foam production in rivers and lakes, contributing to a reduction in water quality [1, 3, and 4]. Surfactants are normally removed from water by using activated sludge techniques, but their complete

4
elimination cannot be guaranteed in drinking water treatment processes. Other traditional removal methods for such contaminants include biological processing, chemical treatment, incineration, air stripping followed by carbon adsorption, and landfilling [1, 8].
Granular activated carbon (GAC) adsorption is a versatile technology and particularly suited for removing both regulated synthetic organic chemicals (SOCs) and dissolved naturally occurring organic materials (NOMs) from drinking water and wastewaters. SOCs are generally of concern for reasons relating directly to human health and NOMs are considered to be the major precursor to disinfection byproducts (DBPs) formed during drinking water treatment disinfection operations. The United States Environmental Protection Agency (USEPA) has designated GAC adsorption as a “best available technology” for removing both SOCs and NOMs [1-3]. Activated carbon is a microporous adsorbent media that can be produced from a variety of carbonaceous materials, including wood, coal, lignin, coconut shells, and sugar. Its unique adsorption properties result from its high-surface area, micropores, and broad range of surface functional groups.
The structure of activated carbon is comprised of carbon atoms that are ordered in parallel stacks of hexagonal layers, extensively cross-linked and tetrahedrally bonded. Several heteroatoms, including oxygen, hydrogen, nitrogen, and others can be found in the carbon matrix, in the form of single atoms and/or functional groups. They are chemically connected to the carbon atoms with unsaturated valences that are located at the edges of graphite basal planes [4-5]. Adsorption of organic compounds by activated carbon is controlled by two primary interactions [6-13]. First, physical interactions include size exclusion and microporosity effects. Size exclusion may control access of molecules to finer carbon pores where the majority of the surface area for adsorption is located. Its impact is primarily a function of the accessible adsorbent surface area, which is governed by the relative size distributions of the carbon pores and the target molecules. This is an especially important phenomenon for mixtures of organic macromolecules, such as NOMs (as compared to small molecular weight SOCs), and its significance is discussed in detail in Karanfil et al. [14]. Although size exclusion reduces adsorptive uptake of macromolecules, the microporous nature of activated carbons has a positive impact on the adsorption of small molecules. With all other factors being equal, and assuming the adsorbate and the carbon surface are chemically compatible, it is likely that sorption energy is greater in micropores. As the pore width approaches the adsorbate dimensions, multiple contact points on the adsorbent surface become possible and surface forces overlap. Therefore, increasing microporosity is expected to increase the adsorption of low-molecular weight molecules. Second, chemical interactions involve the chemical nature of the surface, the adsorbate, and the solvent. They can be significant for both small and large organic compounds. Hydrophobic interactions relate primarily to the compatibility between the adsorbate and the solvent. In addition to adsorption by nonspecific dispersion forces, adsorbates may specifically interact with the carbon surface, including basal plane electrons, unpaired electrons located on the edges of terminated basal planes, and surface functional groups. Such groups can influence the polarity of the surface and its interaction with the solvent. Furthermore, such sorption mechanisms may be influenced by the composition of background water for ionizable adsorbates.

5
Furthermore, electrostatic interactions can be influenced by pH and ionic strength. Despite voluminous literature on adsorption of organic compounds by activated carbon, there is still much to learn about the mechanisms of chemical interactions occurring on the carbon surfaces. The need for mechanistic information is reflected in the empirical nature of several isotherm models, design tools, and mathematical models. Chemical interactions between organic molecules and carbon surfaces can be significant and, in some cases, may overwhelm physical interactions. These interactions are a function of three factors: molecular structure of the target compound, surface chemistry of activated carbon, and solution chemistry. For example, dispersion interactions have been reported to be dominant in the adsorption of aromatic compounds, whereas electrostatic interactions appear to be important for the adsorption of aliphatic anions [13-15].
The adsorption of several well-characterized organic macromolecules by a single commercially available GAC were previously examined and showed that the chemical composition of the surface can significantly impact the uptake [11]. In the present work, we undertook a systematic investigation to further explore the role of carbon surface chemistry on the adsorption of regulated hydrophobic pollutants and several NOMs that were characteristic of the existing ground water and of sufficient concentration to be tracked throughout the treatment train at two public water supply facilities. A thorough understanding of the role of GAC surface chemistry on adsorbate uptake is critical in the selection, design, and production of novel sorbents for removal of SOCs and NOMs from drinking water supplies.
This report summarizes the research objective of identifying compounds that can traverse the air stripping tower and breakthrough the granular activated carbon contactors at two drinking water treatment facilities. In addition, one household point-of-use system was examined.
OBJECTIVES The objectives of this study were to;
(1) Investigate how three different commercially available granular activated carbon media influenced the removal of synthetic organic compounds and natural (macromolecular) materials.
(2) Identify adsorbent characteristics between these three carbon types that optimize the uptake of SOCs and NOMs, potentially demonstrating a full range of compound class coverage.
(3) Provide the purveyors of these facilities with an assessment of the efficiency of GAC as a barrier technology for removal of a broad spectrum of trace organic contaminants and assess the potential life span of the filtration media.

6
MATERIALS AND METHODS In this project DSREH staff collected duplicate samples before and after each treatment operation for the duration of the “demonstration” project at two locations selected from previous research [16] on synthetic organic compounds (SOCs) detected in public water supplies (PWS) under the influence of a contaminant plume. The PWS were Merchantville/Pennsauken Water Treatment Plant Marion Avenue Facility (MPW) in Camden County and the Fair Lawn Cadmus Avenue Facility in Bergen County. Table 1 shows the dates of each sampling campaign that were conducted for this project and the archived analytical results files. Neither of the plants underwent a media change-out during the sample collection period.
Table 1. Sampling dates and analytical results file archive for the analyses completed by the NJDOH PHEAL and Rutgers EOSHI labs. Merchantville/Pennsauken Sample Dates
Analytical Results
Fair Lawn Sample Dates
Analytical Results File
04/19/2011 OSR104190
03/22/2012 OSR203110 02/22/2012 OSR202221
11/28/2012 2112810
02/06/2013 3020612 11/13/2013 3111318 09/22/2014 4092201 07/29/2014 4072901
Analyses were conducted at Rutgers Environmental and Occupational Health Sciences Institute (EOHSI) using headspace solid phase micro extraction (SPME) followed by Gas Chromatography/ion trap mass spectrometry (GC/ITMS) analysis and Solid Phase Extraction (SPE) followed by Ultra High Pressure Liquid Chromatography Mass Spectrometry (UPLC/MS) analysis. Additionally, a high volume (40 µl) split injection analysis was utilized by the New Jersey Department of Health Public Health and Environmental Laboratories (NJDOH PHEAL) to enhance the sensitivity of a modified USEPA regulatory method 525.2. This is a solid phase extraction followed by GC/MS instrumental analysis.
Identification of emerging contamination in groundwater is dependent upon the analytical method utilized. A standard misconception is that a single method adequately measures all the contaminants that a resident of New Jersey may be exposed to. This is not the case, since some chemicals are volatile, semi–volatile, or non-volatile and the required method targets only the volatile fraction. Each of these classes requires a different isolation strategy to efficiently extract the compound of interest from the environmental matrix. Methods utilized by the NJDOH primarily isolate non-polar, semi-volatile and volatile organic compounds while research methods utilized EOSHI primarily isolate polar semi-volatile and purgable organic compounds. Liquid chromatography methods were utilized at Rutgers EOSHI to analyze non-volatile compounds. Additionally, this research investigated the detection of purgable and polar organic compounds that have not been previously identified in water due to the lack of a suitable analytical method.

7
CARBON CONTACTOR MEDIA TYPES Three media types were utilized to evaluate their efficiency at removing chemicals of concern. They included Filtrasorb 300, Filtrasorb 600, and coconut shell (Table 2). All three media were installed at Merchantville/Pennsauken while only the Filtrasorb 300 and coconut shell materials were installed at Fair Lawn. Filtrasorb 3oo and Filtrasorb 600 are produced by Calgon™ and produced from a pulverized blend of high quality bituminous and lignite coals resulting in a consistent, high quality product. Carbon granules are designed to be uniformly activated through the whole granule, not just the outside, resulting in excellent adsorption properties and constant adsorption kinetics. The reagglomerated structure ensures proper wetting while also eliminating floating material. In addition, the carbon granules have high mechanical strength relative to other raw materials, thereby reducing the generation of fines during backwashing and hydraulic transport. Carbon bed segregation is retained after repeated backwashing, ensuring the adsorption profile remains unchanged and therefore maximizing the bed life. The media is reagglomerated with a high abrasion resistance, which provides excellent reactivation performance. High density carbon results in a greater adsorption capacity per unit volume.
Coconut GAC is designed for odor and VOC removal in vapor applications. It is made from select grades of coconut shell that imparts a hardness that is necessary for the long life expected in many applications. Produced under rigidly controlled conditions by high temperature steam activation, coconut shell carbon exhibits high surface area, fine pore structure, high density, and high volume activity. The coconut shell carbon has a high capacity for organic compounds, is equal to or higher than other virgin vapor phase carbons like the Filtrasorb products, and spent material can be thermally reactivated and reused, thereby eliminating disposal problems.
Table 2. Physical properties of the three commercially available granular activated carbon media evaluated in this study. Information is provided by the manufacturer of each material. Not all information was available for each product.
Carbon Type
Iodine Number (mg/m)
Moisture By
Weight Abrasion Number Screen Size
Apparent Density
(tamped)
Trace Capacity Number (mg/g)
FILTRASORB 300 900 2% 78
On 8 mesh 15%(max) through
30 mesh (4%)
0.56 g/cc Not Available
FILTRASORB 600 850 2% 80
On 12 mesh 5% (max) through
40 mesh (4%)
0.62 g/cc 16 (min)
Coconut Shell 1,050 <5% Not available
On 4 mesh 5%(max), on 8 mesh 5%(max)
0.45 g/cc 60 (min)
The iodine number for each material (Table 2) is an indication of the capacity for anions, and is slightly higher in the coconut shell product. The preliminary results agree with this specification parameter in that the more polar compounds showed increased sorption on the Filtrasorb 300 and coconut shell products. Iodine capacity is also an indicator of total surface area. Coconut

8
Granular Activated Carbon is designed for odor and VOC removal in water and vapor applications. Screen size indicates that the Filtrasorb 300 is a finer granular product. The superior sorptive performance of the Filtrasorb 600 product toward long chain nonpolar compounds supports this specification particle classification but was less efficient for polar trace organic contaminants. The apparent density for the Filtrasorb 300 carbon is slightly less than Filtrasorb 600, but both Filtrasorb products are greater than coconut shell. A higher density provides greater volume activity and normally indicates better-quality activated carbon.
CARBON CONTACTOR CONFIGURATION AT THE MERCHANTVILLE/PENNSAUKEN MARION AVENUE WATER TREATMENT PLANT The Figures below (Figures 1, 2, 3) illustrate the granular activated carbon pressure vessel arrangement at the Merchantville/Pennsauken Marion Avenue facility. A total of three identical pressure vessels are arranged into three parallel flow configurations. Three separate media, Filtrasorb 600, Filtrasorb 300, and Coconut Shell are in each of the three pressure vessels so that the absorption performance of each pressure vessel can be assessed separately and breakthrough can be determined if it occurs. Figure 1 shows the air stripping towers that were installed on the two ground water wells at the facility. Figure 2 shows the four sampling taps (arrow) that were installed in the pressure vessels design so that different depths in the bed volume could be sampled to identify the migration of unregulated contaminants through the virgin carbon material with time. Figures 3a, b, c shows the different carbon types present in the parallel pressure vessels that were evaluated in this study. Each of these three carbon types were loaded into the pressure vessels and equilibrated under standard conditions.

9
Figure 1. Supply wells and air stripping units at the Merchantville/Pennsauken Marion Avenue facility.
10
Figure 2a and 2b. Depiction of the front (a) and back (b) of the GAC pressure vessels configuration at the Merchantville/Pennsauken Marion Avenue Facility. The arrow in 2b shows the location of the four pressure vessel depth sample taps.
Figure 3a, b, and c. Three (3) different carbon media types that were evaluated at the Merchantville/Pennsauken Marion Avenue Treatment Facility.
2a 2b
3a 3b 3c

11
CARBON CONTACTOR CONFIGURATION AT THE FAIR LAWN CADMUS PLACE WATER TREATMENT PLANT The carbon contactors at the Fair Lawn Water treatment facility, (Figure 4), are in a different configuration than the Merchantville/Pennsauken plant. The pressure vessels are configured in a lead lag flow path with two parallel trains. The north pressure vessels (right side of picture) contain the Coconut Shell carbon and the south pressure vessels are loaded with the Filtrasorb 300 grade of carbon. The red arrow shows the air stripping unit and blue arrow illustrates the location of the sampling ports for the different bed depths. Filtrasorb 600 was not installed at this plant.
Figure 4: Depiction of the Fair Lawn Cadmus Avenue Facility GAC Contactors. The red arrow on the right identifies the air stripping unit present at the facility and blue arrow highlights the location of the sampling ports for the four different bed depths.

12
NJDOH/PHEAL SAMPLE COLLECTION The field sampling campaigns were coordinated through the NJDEP Bureau of Safe Drinking Water and the NJDEP DSREH. Samples were collected from each facility using the Department’s standard water sampling procedures and in accordance with the project’s Quality Assurance Project Plan. Samples were collected from the combined raw water, pre- and post-air stripping, combined influent to the carbon contactors, each of the four carbon-bed depths, effluent from each contactor at Merchantville/Pennsauken and the combined effluent at Fair Lawn. Trip and field blanks, as well as clean wide-mouth one-liter amber glass sample bottles and preprinted labels, were picked up each morning prior to sampling from the NJDOH PHEAL facility. In addition, standard custody forms were prepared as required by the NJDOH. Samples for the Rutgers EOSHI analyses were collected in lot-trace organic certified one-liter amber glass bottles. All sample collections were made after the sampling valves were open for a period of five minutes to allow the lines to purge so that a representative sample could be collected. For the pressure vessel depth sampling ports, all valves were open for the above referenced period at the same time so that discrete pressure vessel bed sampling could be accomplished. Additional spike samples and other instrument performance Quality Assurance check samples were prepared and determined by the DOH laboratory to ensure proper sample enrichment and instrument performance. Duplicate samples were collected from each point in the drinking water treatment process so that each unit operation (e.g. air stripper, enhanced coagulation, activated carbon absorption) could be evaluated. One triplicate sample was also collected per day as part of the standard sampling practice. The samples were pH stabilized to approximately a pH of 2 after collection with NJDOH PHEAL laboratory supplied high purity 1:1 dilute hydrochloric acid and immediately cooled to 4oC for transport to the health laboratory. The pH stabilization step is part of the standard operating procedure used by the laboratory to ensure that the filter disk extraction procedure will be uniform from sample to sample by protonating the functional moieties so that they uniformly adsorb to the C18 solid phase extraction disc that is utilized in EPA method 525.2 LL. The samples were delivered to the NJDOH/PHEAL laboratory the same day the samples were collected and temperature and pH were checked upon receipt by the sample receiving staff.
RUTGERS EOHSI SAMPLE COLLECTION Samples were collected in duplicate using one liter ICHEM Series 300 lot certified small mouth amber glass containers immediately after the collection of the samples for NJDOH/PHEAL. The samples were immediately cooled to 4oC in a cooler for transport to the Rutgers EOHSI laboratory the same day. Sample delivery and documentation used copies of the NJDOH analytical request forms so that both sets of samples would have identical documentation.

13
ISOLATION/EXTRACTION METHODS
NJDOH SOLID PHASE EXTRACTION (SPE) The 525.2 low level analysis uses a non-polar (C18) stationary phase on the 525.2LL SPE filter disk that is used to extract the sample. Therefore, non-polar chemicals will preferentially adsorb to the filter disk surface. The modified regulatory method 525.2 Low Level analysis conducted by NJDOH PHEAL targets a fixed class of known regulated compounds, but reports tentatively identified compounds (TICs) in addition to the standard parameter list. The NJDOH PHEAL standard operating procedure for the modified 525.2 Low Level Analysis method is available upon request.
RUTGERS SOLID PHASE MICRO EXTRACTION (SPME) Solid Phase Micro Extraction (SPME) uses a solid sorbent material on a silica bed and surrounded by a stainless-steel needle, to trap semi-volatile analytes either directly from a water sample or in the headspace above the water sample upon heating. The solid material is similar to a gas chromatographic solid stationary phase establishing equilibrium between the sorbent material and the sample matrix or headspace. This allows for multiple analyses of the same sample, generally without significant depletion of the analyte. It is ideal for semi-volatile chemical analysis because the sample can be heated to release the analytes from the matrix but is more versatile than a purge and trap system because it works directly with water samples. Unlike the 525.2LL method which uses C18 as a sorbent material, SPME can utilize more than one type of sorbent material.
The research team at Rutgers EOHSI has previously determined that in addition to leaching time, ionic strength of the water sample, agitation rate and other controlled variables, a compounds affinity for the sorbent affects the methods overall sensitivity. Semi-volatile organic compounds seem to perform the best under this method, although the fibers also trap volatile analytes. The SPME method is simple, direct and once optimized, capable of providing data on hundreds, if not thousands, of volatile and semi-volatile compounds in water samples. Coupled with a substantial MS library, most of the compounds detected by the GC/MS protocol can be identified.
Solid phase micro extraction followed by Gas Chromatography Ion Trap Mass Spectrometry (GC/ITMS) analysis has the capability of determining classes of organic compounds that are not routinely identified in finished drinking water. The extraction is conducted at a temperature above ambient conditions and determines contaminants that belong to the chemical class of purgable organic compounds. These classes of contaminants are semivolatile compounds, which may not be identified during an extraction by EPA Method 524.2, and represent the contaminants that were investigated.
The SPME is designed to trap more of the polar compounds using the direct insertion (DI) method. The headspace SPME traps more of the volatile species and is more likely to overlap

14
with the nonpolar results from the 525.2 Low Level method or 524.2 trap and purge technique for volatile organic compounds (VOCs). The polar compounds that migrate to the sorbent and are detected by the instrument can be determined in both the headspace and DI SPME fully automated injection and analysis available from Rutgers EOSHI.
The primary difference in the two isolation methods is the Rutgers EOHSI strategy was designed to be a semi-quantitative discovery method capable of scanning for many unknown compounds. In addition, the contact time for the filtration process as part of method 525.2 LL is minimal and requires only one pass, whereas the SPME fiber remains in contact with the sample until maximum sorption equilibrium on the fiber occurs.
RUTGERS HPLC/MS SAMPLE ISOLATION For the pre-concentration step of the extraction, the compounds present in the water samples were isolated by the Continuous Flow-solid-phase Extraction (CF-SPE) using C-18 as the sorbent. Prior to CF-SPE procedures, the water samples were first acidified with 4.3 mL of 6N HCl solution to establish a pH equal to 2. All CF-SPE procedures were performed using a VisiprepTM DL disposable liner-SPE vacuum manifold (Supelco Inc.) connected to super clean ENVI-18 columns (1.0g sorbent, Supelco Inc. Bellefonte, PA). Twelve solid phase extraction columns were connected to individual disposable liners in SPE vacuum manifolds that were directly linked to a vacuum supply by tubing. The columns were conditioned in the following order: 4mL of Ethyl Acetate 100%, 4mL of Methylene Chloride 100%, 2mL of Ethyl Acetate / Methylene Chloride 1:1 (v/v), 1mL of Acetone/ Hexane 3:2 (v/v) and 3mL of 100% Methanol then, rinsed with 6 mL of deionized water. Drying of the columns stationary phase was prevented once methanol was added and maintained above the level of the solid phase. The samples were loaded onto the conditioned columns at a vacuum gage pressure of 5 inch of mercury (or flow rate of 3.96 mL/min). During this loading procedure, columns were not allowed to go to dryness in order to preserve continuous flow. After all water samples from 1L amber glass bottles (I-CHEMTM certified) were passed through the columns, the columns were completely dried under a vacuum stream for approximately 1 h. After samples were loaded, the SPE columns were stored at -20ºC until elution. The analytes were then eluted off from the columns using the following scheme: 4mL of Ethyl Acetate 100%, 4mL of Methylene Chloride 100%, 2mL of Ethyl Acetate / Methylene Chloride 1:1 (v/v), 1mL of Acetone/ Hexane 3:2 (v/v) and 3mL of 100% Methanol. The solvent was evaporated and the eluent was concentrated under a gentle vacuum stream in the VisiprepTM manifold, until a final volume of 1mL remained.
INSTRUMENTAL ANALYSIS METHODS
GAS CHROMATOGRAPHY ION TRAP MASS SPECTROMETRY Volatile Organic Compounds (VOCs) were isolated and injected onto the GC by headspace Solid Phase Micro Extraction (SPME). Direct SPME injections were used for the Semivolatile Organic
15
Compounds (SVOCs) class. GC/ITMS for non-routine purgable organics was used to identify and quantify volatile compounds not previously detected. The semi-volatile organic compounds used as markers of contaminant mobility have been measured using a modified version of EPA methods 525.2 and 625 as well as 8270. Previously, this method has been used in other NJDEP monitoring projects for the analysis of compounds such as pesticides, PAHs, and PCBs in both raw and finished water samples [17]. The total ionic count maximums were used for retention time assignment and the mass spectral data were used for compound identification or confirmation. Tandem mass spectrometry (MSn) experiments to generate daughter ion spectra were used to help identify a specific compound or to clean up a complicated mass spectrum by isolating only a few mass units at a time. This was especially important when there was a question of peak overlap between an unknown and known compound or between two unknown compounds.
HIGH PRESSURE LIQUID CHROMATOGRAPHY Nonvolatile polar organic compounds were detected and quantified by Solid Phase Extraction followed by High Pressure Liquid Chromatography/Ion Trap Mass Spectrometry scan with targets. Thermally labile and polar organic molecules that typically pass through the filter disk or degrade during the preparation step of Nonvolatile Organic Compounds (NVOC) were identified by High Performance Liquid Chromatography HPLC/MS based methods to confirm the presence/absence of non-volatile, polar, and charged compounds suspected to be in the tested water supplies. Mass spectra of commercially available standards of the suspected contaminants were compared to those obtained from samples collected from the individual sites. When the compound was found to be present, it was quantified using calibration plots of the compound of interest. The ability to identify unknown compounds using HPLC/MS is limited by the fact that there is no significant data base available for comparison to known mass spectrum. If such a database did exist, identification of nonvolatile and polar compounds would become significantly easier. While many polar and high molecular weight organic compounds are believed to be present in the water supply and can only be analyzed by liquid chromatography, an HPLC based mass spectral library does not exist so a MS library was developed as the project progressed.
The BioworksTM software package was used to create a theoretical mass spectrum based both on the actual structure of the compound and its potential metabolites. As part of this project a theoretical searchable database was generated from a list of all of the possible compounds from sites thought to impact the source water wells. The theoretical mass spectrum was compared to mass spectra of commercially available standards. The database allows for expansion as more compounds are added to the list and more theoretical mass spectra are generated.
The HPLC consisted of a Waters 2690 dual-syringe solvent delivery system with an automatic sampler (Water, Milford, MA, USA). A 5µl or 10μl aliquot of the sample was injected though the automatic sampler onto a Discovery® C18 column, 24 cm X 4.6mm, 5μm (Supelco). The mobile phase was a linear gradient with 10mmole L-1 aqueous ammonium acetate solution (component A) and 100% methanol (component B). The gradient started at 60% B for 2 min, changed to

16
95% in 8 min, held for 5 min, then reverted back to 60% B in 15 min and finally reverted to 60%B for 10min stabilization time; the total analysis time was 40 min. The injection volume was 5 or 10μl with LC flow rate of 0.2 mL/min.
Ion trap mass spectrometry (IT-MS) was performed on a Finnigan (San Jose, CA) LCQ classic equipped with an electrospray interface operating in negative-ion mode. Argon (99.999% purity grade) was used as a carrier (collision) gas and nitrogen as auxiliary and sheath gas. The capillary temperature was 250ºC and the sheath gas flow rate was 89% of maximum flow. The spray and capillary voltages were 5kV and -4 V, respectively.
The analytes were then identified and quantified using liquid chromatography electrospray-ion trap mass spectrometry (LC -ESI-ITMS) employing a background subtraction method and single ion monitoring (SIM). The analyte was identified by comparison of chromatographic retention time and quantified by a parent ion, [M-H] ‾ of the analyzed compound with SIM mode during data acquisition. Instrumental control and data acquisition of the ESI-ITMS were done using Xcalibur software (Finnigan). Eight calibration curve points from 1ppb to 1ppm were prepared to check for linearity while six calibration curve points from 1 ppb to 100ppb were prepared to check for lower ranges of detection in current LC-MS analysis.
Laboratory results using NJDOH/PHEAL methods were available for each of the four sample campaigns at both Merchantville/Pennsauken and Fair Lawn locations. Results via the Rutgers EOSHI procedure were available for all four sample campaigns at Merchantville/Pennsauken but only available for the March 2012 sample campaign at Fair Lawn due to initial construction delays and subsequent problems related to the preferential flow path from the two parallel pressure vessels which resulted in the collection of samples from the unit operations that did not have identical flow through the vessels and therefore a representative comparison of the two media being studied was not possible.
RESULTS Using the GC/MS method 525.2 low level analysis at the NJDOH PHEAL laboratory and the research grade SPME GC/MS and HPLC/MS methods at Rutgers, chemicals present at the part-per-trillion (ng/L, ppt) level could be identified and quantified. A summary statistical spread was generated as an example for the reader to illustrate the range of values that were reported for chemicals detected in the treatment process and finished drinking water. Figure 5 illustrates the distribution of reported concentration values for tentatively identified compounds (TICs) detected in the effluent and the treatment track at the Fair Lawn Cadmus Avenue facility from the NJDOH data analyses. The median concentration value in the effluent was 32 ppt, the mean value was 37 ppt, and the 25th percentile and 75th percentiles were 17 ppt and 73 ppt. The sum of all of the reported concentrations was approximately 18 parts per billion (ppb). The treatment train at each system is operationally defined as each unique unit operation, whether a physical or a chemical process, that when combined constitutes the sequence of treatment at a particular drinking water treatment facility. In the case of the Fairlawn Cadmus Avenue facility, the sampling points were as follows:
1. Raw water from each well in the well field (total of eight wells)

17
2. Blended raw water from well field 3. Pre and post air stripping samples 4. North and south carbon contactor pairs at each of four bed depths 5. Combined effluent
Distribution of Effluent and Tracked TICsFair Lawn Cadmus Ave. Facility
Median; Box: 25%-75%; Whisker: Non-Outlier Range
Median 25%-75% Non-Outlier Range Outliers Extremes
EffluentTreatment Track
0102030405060708090
100110120130140150160170180190200210220230240250260270280290300
Con
cent
ratio
n (n
g/L)
Figure 5: Distribution of concentration values for tentatively identified compounds (TICs) detected in the effluent and treatment train for the Fair Lawn Cadmus Avenue facility.
POST PROCESSING OF THE MASS SPECTRAL DATA FROM NJDOH PHEAL AND RUTGERS A compound library containing mass spectra from 64,000 compounds was compared against the mass spectrum acquired from each sample to identify compounds possibly present. After removal of compounds observed to be present in the blank samples, the remaining compounds were categorized by class and further grouped to determine which compounds were removed and which broke through the carbon treatment. The semi-volatile compound classes identified using the EOHSI GC/MS included many that had either steroidal or hormonal-like chemical structural backbones, potentially representing pharmaceutical degradates or metabolites. Those include, 2-Aziridinylethylamine, 1, 3-Benzenediamine, 2-methyl-2-Butenoic acid, 3-phenyl-2-Propenal, 2-Methyl-Phenol, and 1-(1,1-dimethyl) Propanoic acid. 2-Aziridinylethylamine is a compound that is used in the textile industry for static control and has a potential application in commercial products. 1,3-Benzenediamine and 2-methyl Butenoic acid may have carcinogenic potential; the latter is used in hair dye manufacturing. The estimated total concentrations of these contaminants were very low, in the 0.1 ppb range, suggesting a diminished risk.

18
Laboratory analysis sample results were supplied by the NJDOH PHEAL and Rutgers EOHSI laboratories in spreadsheet format. These data not only contained the chemical identity of the regulated parameters that were part of the 525.2LL USEPA method, but also included tentatively identified parameters that were detected by the low-level analysis. For example, one data file from the Rutgers laboratory file for Fair Lawn contained over 3,267 tentatively identified chemical compounds (TICs) from nineteen samples that were collected from this facility on 3/22/2012. This is illustrated in Table 3. A data reduction strategy was needed to reduce the quantity of detected compounds and determine their relevance to the primary objective of the study.
The first step in the mass spectral data reduction process was the subtraction of TICs that were identified in the field and trip blanks. In addition, all compounds containing siloxane in the name were removed as likely to come from the GC column bleed. This data reduction operation greatly reduced the number of TICs identified in the combined effluents to 216 and 114 for the Fair Lawn and Merchantville/Pennsauken samples, respectively (Tables 3). This reflects a 72.3% and 84.7% reduction in the number of identified TICs after accounting for those identified in blanks. Additionally, only a small number of TICs were observed at multiple sampling locations throughout the treatment processes at Fairlawn and Merchantville/Pennsauken (Table 3). The remaining TICs were then custom filtered by concentration to identify and evaluate unique chemicals of concern and then sorted again by occurrence in each contactor, bed depth level, and combined effluent from the GAC unit operation. In similar fashion, a 99.1% and 90.8% reduction in the number of identified TICs after accounting for those identified in blanks was observed using the 525.2 LL determination by the NJDOH PHEAL laboratory. Overall, 21 and 19 compounds were detected at multiple sampling locations throughout the treatment processes using the 525.2 LL method (Table 4).
Although the number of TICs in the unfiltered database was greater for the Fair Lawn system, the Merchantville/Pennsauken system had more compounds that could be detected at multiple sampling locations through the treatment system as shown in Table 3 for the Rutgers EOHSI results of the mass spectral filtering process. The SPME isolation method at Rutgers extracted more polar compounds due to the engineered stationary phase on the SPME fiber. Conversely, the Merchantville/Pennsauken system had fewer ticks detected at multiple locations through the treatment system using the NJDOH PHEAL methodology (Table 4).

19
Table 3. Mass spectral data filtering summary of the Rutgers EOSHI research method results of tentatively identified compounds (TICs) for Fair Lawn and Merchantville/Pennsauken facilities. The Fairlawn sample was collected 03/22/2012 and the Merchantville/Pennsauken sample was collected 04/19/2011. Counts reflect the number of TICs identified throughout the treatment train.
Mass Spectral Data Set
Number of TICs at Fair
Lawn
Number of TICs at Merchantville/Pennsauken
Total TICs detected in raw water (after air-stripping)
3,267 1,521
TICs detected after subtracting those identified in field and trip blanks
952 747
TICs detected in the combined effluent 264 114 Removal efficiency 72.3% 84.7% TICs detected at multiple sampling locations through the treatment System
24 34
Table 4. Mass spectral data filtering summary of the NJDOH PHEAL method results of tentatively identified compounds (TICs) for Fair Lawn and Merchantville/Pennsauken facilities. The Fairlawn sample was collected 03/22/2012 and the Merchantville/Pennsauken sample was collected 04/19/2011. Counts reflect the number of TICs identified throughout the treatment train.
Mass Spectral Data Set
Number of TICs at Fair
Lawn
Number of TICs at Merchantville/Pennsauken
Total TICs detected in raw water (after air-stripping)
3,127 3,052
TICs detected after subtracting those identified in field and trip blanks
706 796
TICs detected in the combined effluent 6 73 Removal efficiency 99.1% 90.8% TICs detected at multiple sampling locations through the treatment System
21 19
Tables 5 and 6 show the average concentration and number of times that non-polar compounds were detected in the treatment train at Fair Lawn and Merchantville/Pennsauken via the NJDOH/PHEAL modified USEPA Method 525.2 LL. The method routinely identified acid and amine derivatives and long chain non-polar hydrocarbons through the treatment train. As discussed previously, this method uses an octadecane (C18) filter to isolate mostly nonpolar organic compounds.

20
Table 5. TIC results from the data filtering process for non-polar organic compounds isolated by NJDOH PHEAL laboratory using modified USEPA Method 525.2 low level analysis at the Fair Lawn facility. A total of 19 samples were collected along the treatment train on 7/29/2014.
Analyte Name
Average Result (ng/L)
Number of occurrences
throughout the treatment train
Decanoic Acid 21 15 1,2-Benzenedicarboxylic Acid, Dicyclohexyl Ester 16 13 Dodecanoic Acid 19 12 [(2-Fluorophenyl)Methyl]-1H-Purin-6-Amine 21 9 Octanoic Acid 56 7 2-Propenoic acid, dodecyl ester 11 6 Bicyclo[2.2.1]Hept-5-Ene-2,3-Dicarboxylic Acid 18 6 1-Phenyl-3-Methylpenta-1,2,4-Triene 95 5 Allyl Butyrate 20 4 Benzoflex or Diethylene Glycol Dibenzoate 15 4 Cis-3-Propoxy-B-Methyl-B-Nitrostyrene 34 4 Di-(2-Ethylhexyl)Phthalate 43 4 Dimethyl Ester Of N-Acetyl-D,L-Asparaginic Acid 17 4 3α,17β-Dihydroxy-5α-androstan-6-one 13 3 1,4,5,6,7,7-hexachloro-Bicyclo[2.2.1]hept-5-ene-2,3-dicarboxylic acid
6 3
1-methyl-α-(3-nitrophenyl)-1H-Benzimidazole-2-methanol 130 3 N-Tetradec-1-Ene, 1-Tetradecene 5 3 2-(5-Chloro-2-Methoxyphenyl) Pyrrole 24 3 Diethylene Glycol Dibenzoate (also called enzoflex) 17 3

21
Table 6. TIC results from the data filtering process for non-polar organic compounds isolated by NJDOH PHEAL laboratory using modified USEPA Method 525.2 low level analysis at the Merchantville/Pennsauken facility. A total of 22 samples were collected along the treatment train on 9/22/2014.
Analyte Name
Average Result (ng/L)
Number of occurrences
throughout the treatment train
Octadecanoic acid 18 21 n-Undecane 30 12 2-Propenoic acid, dodecyl ester 69 11 Tetradecane 12 9 (Z)-9-Octadecenamide 34 8 Heptadecane 2 8 Hexadecane 22 8 Isopropyl myristate 4 8 Tetradecanoic acid 20 8 1,2-bis(2-chloroethoxy)-Ethane 65 7 Hexadecanoic acid, methyl ester 1 7 dodecanoic acid 12 6 n-Heptadecane 17 6 Hexanedioic acid, dibutyl ester 108 6 n-Nonacosane 105 6 Allyl Butyrate 72 5 Docosane 53 5 Methyltribenzo[a,c,e]cyclooctatetraene 30 5 2-methyl-Pentadecane 2 5
Table 7 shows the concentration and frequency of regulated pesticides observed during the 07/29/2014 sampling event at the Fair Lawn Cadmus Ave. facility. Table 8 shows similar results for regulated pesticides throughout the treatment train at the Merchantville/Pennsauken Marion Ave. facility on 9/22/2014. New Jersey Ground Water and Drinking Water standards are presented for pesticides with established levels.

22
Table 7. Regulated pesticides quantified by NJDOH PHEAL laboratory for the 07/29/2014 Fair Lawn sampling event. A total of 19 samples were collected along the treatment train.
Analyte Name
Result Maximum
(ng/L)
NJ Ground Water Quality
Standard (ng/L)
Number of occurrences
through treatment
Heptachlor Epoxide 10.1 200* 8 gamma-Chlordane 8.9 n/a 7 alpha-Chlordane 5.5 n/a 6 trans-Nonachlor 1.1 n/a 5 Dieldrin 27.1 30 3 Chrysene 6.3 5,000 2 Pyrene 6.9 200,000 2 Anthracene 4.5 2,000,000 1
*Value is the same for the NJ Drinking Water Standard; where not marked, a drinking water standard is not established. n/a – a ground water or drinking water standard is not established.
Table 8. Regulated pesticides quantified by NJDOH PHEAL laboratory for the 09/22/2014 Merchantville/Pennsauken sampling event. A total of 22 samples were collected along the treatment train.
Analyte Name
Result Maximum
(ng/L)
NJ Ground Water Quality
Standard (ng/L)
Number of occurrences
through treatment
Dieldrin 40.0 30 22 Heptachlor Epoxide 6.9 200* 14 Anthracene 2.2 2,000,000 11 alpha-Chlordane 18.0 n/a 11 Metalaxyl 4.0 n/a 10 gamma-Chlordane 29. 3 n/a 10 trans-Nonachlor 3.3 n/a 7 Atrazine 98.1 3,000* 6 Simazine 12.5 800 (4,000) 1 Phenanthrene 4.0 100,000 1 Fluorene 1.2 300,000 1 Dacthal 0.3 n/a 1
*Value is the same for the NJ Drinking Water Standard. Value in ( ) is NJ Drinking Water Standard; where not marked, a drinking water standard is not established. n/a – a ground water or drinking water standard is not established.

23
EVALUATION PROCESS FOR DETERMINING THE THREE CARBON TYPE PERFORMANCE Table 9 shows the results of an evaluation of the performance of each individual carbon type using the analytical results for chemicals that could be tracked consistently through the water treatment process at both facilities for all sample campaigns. This evaluation is based on the relative efficiency of each carbon type for removal of different polar and nonpolar contaminants. Figures were prepared for each compound of interest listed in Table 9 (see Appendix 1 and 2). Certain organic compounds listed in Table 9 that represent unique classes of emerging contaminants of interest are discussed further in the Discussion and Conclusions section. Figure 6 is an example figure based on the Merchantville/Pennsauken facility findings for the chemical 1-Methyl-2-Pyrrolidone. Figure 6 shows that 1- Methyl-2-Pyrrolidone was detected multiple times at various coconut shell and Filtrasorb 600 media depths, but only one detection of this compound was found in the aqueous phase throughout the Filtrasorb 300 media. This suggests that the Filtrasorb 300 has better sorptive capability for 1-Methyl-2-Pyrrolidone. These figures can be used to aid in the determination and selection of the optimum carbon type adsorption performance.
Figure 6: Concentration of 1-Methyl-2-Pyrrolidone at sampling locations in M/P Marion Ave. Treatment Facility, NJDOH Results 02/22/2012.
0
20
40
60
80
100
120
140
160
Coc
onut
Upp
er
Coc
onut
Mid
dle
Coc
onut
Mid
dle
Coc
onut
Low
er
Filt
raso
rb30
0 M
iddl
e
Filt
raso
rb60
0 U
pper
Filt
raso
rb60
0 M
iddl
e
Filt
raso
rb60
0 E
fflu
ent
Est
imat
ed C
once
ntr
atio
n (
ng/
L)
Sample Name

24
Table 9. Summary of assumed preferential adsorption media type for polar organic compounds identified by the Rutgers SPME method(1) and nonpolar compounds identified by the NJDOH 525.2 LL method(2) at the Merchantville/Pennsauken (MP) and Fair Lawn (FL) Cadmus Avenue treatment plants. Facility Coconut Shell Filtrasorb 300 Filtrasorb 600
MP 9-Hexadecenoic acid (2) 1,1-Diphenyl-2-cyano-2-carbo-octoxy-acetylene (2)
4-methyl-1,3-Benzenediamine(1)
MP 9-Octadecenamide (2) 1,2-Benzenedicarboxylic acid, diisononyl ester (2)
2-(2-ethoxyethoxy)- Ethanol (1)
MP Hexadecane (2) Myristic Acid (2) 1-Octadecene (2) MP 9-Octadecenoic acid (2) Benzoic acid (2) Isopropyl Myristate (2)
MP Propanoic acid, 2-methyl-, 1-(1,1-dimethyl) (1)
Erythro-9,10-dihydroxyoctadecanoic acid (1) 9-octyl-Heptadecane (2)
MP Stephabyssine (1) 2-Nonadecanone 2,4-dinitrophenylhydrazine (1)
2,6-bis(1,1-dimethylethyl)-4-ethyl- Phenol, (1)
MP 1-Methyl-2-Pyrrolidone MP 3-phenyl-2-Propenal, (1)
MP
15-Hydroxy-7-oxodehydroabietic acid, methyl ester (1)
MP Cholestan-3-one, cyclic 1,2-ethanediyl a (1)
FL 2-(bicyclo[2.2.1] hept-5-en-2-ylidene) propanediol (2) 1,2 Benzenedicarboxylic Acid (2)
FL 1-bromo-2-chloro-Benzene (2) Dibutyl Ester of 1,2 Benzenedicarboxylic Acid (2)
FL Tetrachloro-1,3-Isobenzofurandione (2)
FL Cyclododecane (2) Preferential adsorption was assessed by comparing the relative concentrations of each compound in the aqueous phase across each media, i.e. the media type with the lowest aqueous–phase concentration had the greatest adsorption potential. This summary reflects compounds identified from all sample campaigns and were found in the effluent and at least two or more other locations throughout the carbon filtration units. Filtrasorb 600 was not analyzed at Fair Lawn.
DISCUSSION One of the advantages of collaborating with the NJDOH state primacy laboratory on this project was the strict adherence to standard operating procedures and protocols outlined in the modified USEPA Method 525.2 Low Level analytical procedure.
Results obtained from the filtered mass spectral data show that these chemicals migrate through the three different GAC contactors and each type of carbon has its own affinity for different classes of contaminants. The water flows through the carbon cell from the top sample tap, to upper, to middle, to lower, then to the combined effluent from the three contactors. Therefore,

25
if the chemical contaminant is detected in the base sample port, it has already migrated through the carbon vessel containing one of the three types of carbon. Increasing concentrations at later stages of the filtration process suggest compounds may actually be forming on the activated carbon due to biological activity. Alternatively, the increasing concentrations may represent early stages of breakthrough. Based on these findings, additional monitoring is recommended to track filter efficiency with time to determine eventual breakthrough of the compounds detected.
NATURAL PRODUCTS Several natural products that are derived from natural vegetative decay were detected and quantified using the SPME GC/MS and LC/MS methodology at Rutgers. The compound 1,3-dioxane-4-(hexadecyloxy)-2-pentadecyl was detected several times at the Merchantville/Pennsauken facility. It is a heterocyclic organic compound isolated primarily from willow bark extract. It has medicinal properties ranging from control of stomach diseases to contraception and abortion. 2-Nonadecanone 2,4-dinitrophenylhydrazine has been identified as a biologically active component of wood apple bark extract and has uses for medicinal purposes [18] and is isolated exclusively by headspace SPME.
3-phenyl-2-Propenal, was isolated in both the headspace SPME and direct insertion SPME at Rutgers. This compound is the main component of cinnamon oil, a volatile oil used as a flavoring agent for pharmaceuticals. The highest concentrations were identified in the Filtrasorb 600 carbon, but it was distributed throughout the coconut shell contactor as well at the M/P facility.
Stephabyssine is an alkaloid from a medicinal plant Stephinia abyssinica that is used as an antibacterial and antiviral agent. Filtrasorb 300 showed the least sorptive capability of the three carbons tested. This compound was only isolated in the headspace SPME.
PHYTOSTEROL IDENTIFIED IN THE CARBON PRESSURE VESSELS There has been a lot of interest in determining endocrine disrupting chemicals in groundwater, surface water and finished drinking water. These organic contaminants represent many classes of chemical compounds both natural and synthetic. Phytosterols, which are derived from plants, are one of these classes of organic compounds that affect the endocrine system in some fashion.
Cholestan-3-one, cyclic 1,2-ethanediyl a, is a phytosterol identified in the aqueous phase at the Merchantville/Pennsauken facility. It was isolated only in the headspace SPME by Rutgers EOSHI. It was identified in each of the three media types.

26
A new GC/MS scanning method with a data search filter was applied to water samples collected from this purveyor who installed GAC as a barrier treatment strategy to remove organic chemicals from the finished water. Both synthetic organic chemicals and natural organic chemical products, derived from plant decay in the water column, were isolated and identified in the Rutgers measurements of over 60 samples from the Marion Avenue facility in Merchantville/Pennsauken. These samples were collected from various depths in the three carbon contactors with different adsorption media (coconut shell, Filtrasorb 300, and Filtrasorb 600). Of the natural products that were isolated only a few were identified in every sample. For example, many sterol compounds appeared only sporadically in the samples throughout the treatment train. They were therefore eliminated using a data filter because they were not detected multiple times. These sterols are structurally similar to each other through a cholesterol backbone arrangement that imparts biological activity that may affect endocrine systems.
These types of sterol compounds are inherently polar in nature and not effectively isolated using the regulatory method 525.2 LL. Because of the difference in polarity of the stationary phase (C18 vs. Carbowax (PEG) SPME) used to isolate these trace compounds in the treated drinking water prior to and after carbon sorption, the organic compounds that were identified behaved differently on the three different carbon pressure vessels. The more nonpolar compounds that were isolated by the (C18) disk in the NJDOH PHEAL analysis were better adsorbed by the Filtrasorb 600 type of carbon. In contrast, this research study showed that the Filtrasorb 300 product had superior adsorptive capability for more polar constituents. The hexadeca-, heptadeca-, and octadeca-, long hydrocarbon chain substituted acids and amines, in addition to aromatic nonpolar acids like benzoic acid, that were reported by the NJDOH PHEAL laboratory have long hydrocarbon chains that impart a nonpolar nature to these molecules making them more amenable to adsorption on the nonpolar (C18) extraction disk. In contrast the SPME fibers extracted alcohols, acids, phenols, sterols, aldehydes, and ketones that are more polar in nature (see table 9). Due to solubility of the nonpolar parameters in water, a calculation of traditional GAC sorption isotherms is not possible.
The concentrations reported are based on estimates derived from raw signal counts for each compound. Almost none of the compounds listed have commercial standards for direct quantitation. Raw signal counts are compared to other compounds of known sensitivity with the understanding that the sensitivity of an analytes (signal counts/quantity of analyte) may be similar or very different from compound to compound and any reported concentration comes with a significant uncertainty.
Very few of the many tentatively identified chemicals were detected in the combined effluent of all carbon contactors. This indicates that GAC filter polishing of finished drinking water under the influence of volatile organic contamination is an effective barrier technology that can be practically implemented to improve the overall delivered water quality.
The low levels of detection achieved in this study allow us to determine the dynamics of carbon sorption at ambient levels in source water that few other techniques are able to measure. Overall, for the compounds found in the total effluent, the upper Filtrasorb 300 and middle coconut shell trapped more of the polar compounds identified by SPME than the other fractions.

27
The carbon contactors are configured so that the top bed depth sample taps are the first carbon contact samples. The flow is from top down through the carbon bed. Assuming that trapping a compound earlier in the process is an indicator of the sorption efficiency process; these two carbon types had superior performance for polar compounds. Agreement of observations between laboratory methods (complimentary) indicates that Filtrasorb 600 is not as efficient for adsorption of polar compounds but appears to preferentially adsorb long-chain non-polar surfactants. While the granulated activated carbon species evaluated did trap many compounds, neither media completely removed polar compounds efficiently. The results of this research may suggest a need for further water treatment processes prior to distribution of finished water for compounds such as 1,4 dioxane and other compounds that demonstrated poor sorption properties on activated carbon.
While most of these compounds are unlikely to create any public health risk at levels detected, compounds such as 2-methyl-1,3-Benzenediamine, have previously been identified to suggest carcinogenic potency above the NJDEP generic carcinogenic threshold of 1 ppb. It is typically used in hair dye formulations but also is used for neutralization reactions in exothermic synthesis processes. This compound was detected in both the headspace solid phase micro extraction (HSPME) experiments and in the direct insertion SPME (diSPME) GC/MS preliminary data. This compound was detected in the aqueous phase in the Filtrasorb 300 and coconut shell but not in the Filtrasorb 600 GAC contactor.
EXCEPTIONS TO THE UNIVERSAL IMPLEMENTATION OF GAC AS A SOLUTION FOR MULTIPLE TRACE CONTAMINANTS As part of the federal unregulated contaminant monitoring rule three (UCMR3), it was discovered that the Westmoreland facility in Fair Lawn had one of the highest concentrations for the UCMR3-monitoried organic chemical 1,4 Dioxane in the PWS that were sampled in 2015 [18]. All samples collected within the UCMR3 program are taken after full treatment has been completed.
A fouling factor for individual compounds can be determined using empirical relationships that are related to the octanol water partition coefficient (log Kow) [19]. The magnitudes of the fouling factor values were linearly correlated with the log Kow of each adsorbate. The relationship was developed for log Kow values in the range from 1.5 to 3. In their work Shimabuku et al. (2014) show that a log Kow of -0.3 allows for the inclusion of the fouling factor values for 1,4-dioxane. This value is far below the modeled range and indicates that adsorption to carbon media is unlikely and that GAC is a relatively ineffective removal technique for 1,4 dioxane.
When comparing the removal effectiveness of GAC type on low molecular weights organic compounds, like 1,4-dioxane, coconut shell-based GAC was the most effective while direct activated bituminous coal-based GAC, like Filtrasorb 300, was less effective. In general, coconut shell-based GACs are more microporous which could explain why the coconut-shell based GAC was more effective for compounds with relatively low molecular weights. The re-agglomerated

28
bituminous coal-based GAC (Filtrasorb 300) outperformed the lignite-based Filtrasorb 600 due to its higher apparent (bed) density. For all adsorbates, the Filtrasorb 300 outperformed the Filtrasorb 600 [20].
Based on rapid column testing [20], less than 1,000 bed volumes of water could be treated with the tested GACs and operating conditions before fouling and breakthrough of 1,4-dioxane would occur, further indicating that GAC adsorption is not a feasible treatment option for 1,4-dioxane removal.
CONCLUSIONS This research demonstrated the ability to track trace-level unregulated contaminants through the treatment train at two facilities that are within the capture zone of a hazardous waste plume. Each facility utilized air-stripping technology to remove regulated the VOC contamination prior to implementation of GAC treatment. Although the three different carbon types evaluated were similar in performance, the data indicated that performance differences existed in the GAC material and were related to the polarity of the observed unregulated contaminants. In terms of preferential adsorption and removal by GAC, the following was observed:
• Coconut shell carbon showed preferential adsorption for low molecular weight polar organic compounds like the three-carbon substituted acid, Propanoic acid, 2-methyl-, 1-(1,1-dimethyl) [Appendix 2, pg.44].
• Filtrasorb 600 product showed superior sorptive performance for long chain nonpolar compounds, like 9-octyl-Heptadecane [Appendix 2, pg.61], but was less efficient for polar trace organic contaminants.
• More polar compounds showed increased sorption on the Filtrasorb 300. The compound 1- Methyl-2-Pyrrolidone [Appendix 2, pg.50], is an example of the efficiency for Filtrasorb 300.
Additionally, the NJDOH analytical method identified very low levels of unregulated nonpolar contaminants throughout the drinking water treatment train. The percentage of TICs removed to below detection limit as analyzed by the 525.2LL method for both systems represented a 91-99% reduction. On the other hand, the EOHSI laboratory technique identified a select few, more-polar compounds, which passed through the treatment train to delivered drinking water. The percentage of TICs removed to below detection limit as analyzed by the Solid Phase Micro Extraction (SPME) method for both systems represented a 72-85% reduction. Given the difference in preferential adsorption and removal of the GAC materials, none of the three carbon types can be used alone to remove the full suite of observed polar and non-polar organic compounds. This research can be used as guidance to tailor an appropriate removal strategy for particular water-quality needs. Further research could be performed to determine if each media type would remain as effective if bed materials were combined in a single vessel or if the three media types were staged in series.

29
For these two locations GAC treatment served as a sufficient barrier for many unregulated organic contaminants. Media change out was specified in the conditions of the permit and was to be determined based on breakthrough of regulated pesticide compounds. Breakthrough was reported after four years of continuous operation. These two locations are similar to other locations in the State, but the effective life span of the treatment material will vary from location to location depending on water-quality, water demand, and contact times within the media vessels.
ADDITIONAL RESEARCH CONDUCTED AT RUTGERS EOHSI An additional study was conducted to assess the removal, disinfection, and microwave oblation for common point of use treatment technologies [23]. This research investigated a suite of 20 unregulated parameters that were part of the national USGS pharmaceutical and personal care products survey [21-25] of source water and the USEPA Unregulated Contaminant Monitoring Rule 3 (UCMR3). A commercial Brita™ filter (granular activated carbon/ion exchange resin), ozonator, and microwave oven were selected based on their general utilization for the household drinking water process. Efficiencies of these water decontamination processes were characterized based on the physicochemical properties, shown in Table 10, of the target compounds including molecular weight (MW), octanol-water partition coefficient (log Kow) and acid dissociation constant (pKa). Table 11 summarizes the performance of the various treatment technologies.
The percent removal of 20 target compounds at two spike concentrations (2.0 µg/l and 0.2 µg/l) varied from one compound to another and one treatment-process to another. Some of the highly removed/eliminated compounds included gemfibrozil (100 ± 0%), cis-diltiazem (99 ± 0%), albuterol (100 ± 0%), and fluoxetine (97 ± 1%) by one or more water processes tested. However, the least removable compound (< 5%) in all water processes was a pharmaceutical-degradation product of cimetidine, a common antacid (Tagamet). This demonstrated the feasibility of degradation/transformation products of pharmaceuticals to migrate to drinking water, thus suggesting further investigation of by-products is warranted. Examining the overall mean percent removal for the 20 target compounds, the Brita™ filtration (≤66%) was most effective followed by ozonator (≤54%) and microwave oven (≤36%). Overall, these unregulated compounds were only partially removed using these household technologies. Additional details of this study can be found in Yoon, 2010[23].

30
Table 10. Physiochemical properties of 20 target compounds including molecular weight (MW), log Kow and pKa as presented in Yoon, 2010 [23]. Compounds are ordered by molecular weight. Target compounds
MW (g)
log Kow
pKa (25°C)
Metformin 129.17 -2.64 2.8 Acetaminophen 151.17 0.49 9.51 L-Cotinine 176.22 0.07 4.3 Caffeine 194.19 -0.07 13.2 Ibuprofen 206.10 3.60 4.8 Methylphenidate 233.31 3.19 8.8 Albuterol 239.31 0.66 9.14 Gemfibrozil 250.34 2.8 4.7 Cimetidine 252.34 0.4 6.93 Estradiol 272.39 4.13 10.4 Testosterone 288.42 3.32 n/a Codeine 299.37 1.19 8.2 Warfarin 308.33 2.70 5 Fluoxetine 309.33 4.65 10.05 Ranitidine 314.41 0.27 8.2 Progesterone 314.47 3.87 n/a PFOA 414.07 1.02 3.8 cis-Diltiazem 414.52 2.70 7.7 PFOS 500.13 1.92 3.2 Chlortetracycline 515.35 -0.36 3.33

31
Table 11. Percent removal and percent relative standard deviation (RSD) for the 20 target compounds in tested water disinfection-processes (in alphabetical order) at two spike concentrations.
Treatment process GAC/ion resin filter Ozonation Microwave
Spike Concentration 2 µg/L 0.2 µg/L 2 µg/L 0.2 µg/L 2 µg/L 0.2 µg/L
% removal
% RSD
% removal
% RSD
% removal
% RSD
% removal
% RSD
% removal
% RSD
% removal
% RSD
Acetaminophen 71 3 73 8 88 2 79 5 <5 --- 57 8 Albuterol 93 0 94 0 100 0 100 0 97 1 96 0 Caffeine 78 1 79 2 51 2 68 7 9 15 <5 --- Chlortetracycline <5 --- 55 44 <5 --- 32 47 52 n/a 70 2 Cimetidine 20 13 14 24 <5 --- 27 11 <5 --- <5 --- Codeine 81 1 80 4 100 0 100 0 34 5 55 2 L-Cotinine 68 2 44 19 12 12 44 13 <5 8 26 Cis-Diltiazem 88 1 90 2 99 0 99 0 32 7 33 20 Estradiol 49 12 47 16 <5 --- <5 --- <5 --- <5 --- Fluoxetine 94 1 90 2 97 1 97 1 96 2 86 10 Gemfibrozil 78 1 85 5 100 0 99 0 14 6 20 31 Ibuprofen 59 6 73 3 15 16 11 24 5 28 15 20 Metformin 64 3 73 2 14 24 29 10 6 35 13 11 Methylphenidate 83 2 88 1 43 5 62 8 96 0 97 2 PFOA 51 11 48 4 <5 --- <5 --- <5 --- <5 --- PFOS 35 60 <5 --- 31 35 30 25 36 6 26 5 Progesterone 93 1 74 1 57 1 55 6 <5 --- 10 31 Ranitidine 61 4 35 13 71 2 61 7 <5 --- <5 --- Testosterone 85 1 62 3 47 2 55 9 <5 --- <5 --- Warfarin 71 4 84 1 19 1 33 26 86 1 97 0 Harmonic mean 39 37 15 24 9 11 Arithmetic mean 66 65 48 54 30 36
RECOMMENDATIONS FOR FUTURE RESEARCH Further research could be performed to determine if each GAC media type would remain as effective if bed materials were combined in a single vessel or if the three media types were staged in series.
Major advances in analytical instrumentation, data acquisition, and data reduction tools have occurred since this research was conducted. Inorganic analyses with speciation capabilities are now possible at femtogram per liter concentrations. Hyphenated instruments like Ion

32
Chromatography Inductively Coupled Plasma High Resolution Mass Spectrometers (IC/ICP/HRMS) in use at Rutgers EOHSI have reduced isobaric interferences that in the past have limited the low level sensitivity of these instruments for inorganic contaminants of concern, such as hexavalent chromium.
Organic chemical analyses have also advanced through the development of lower cost high resolution gas and liquid chromatographs with high resolution mass spectrometer detectors. The NJDOH PHEAL laboratory has recently purchased an HRGC/MS as part of their suite of advanced analytical instrumentation. The Department will benefit from its use because the sensitivity of this instrument will allow the achievement of human health criteria levels for many of the ground water quality standards where analytical detection remains an issue. In addition, the advanced quantitative time of flight (Q-TOF) mass spectrometer detectors preserve the entire mass spectral record of all analyzable compounds in a sample. Coupled with the current data acquisition, and data reduction tools, identification of unknown organic compounds in the environment is greatly simplified with sensitivities in the ng/L range. These new analytical tools offer the ability to enhance our knowledge of the efficiency of the drinking and wastewater treatment processes so that they may be further optimized for enhance treatment capability.
REFERENCES [1] Safe Drinking Water Act Amendments of 1986, PL-99-339.
[2] Pontius, F. W. An Update of the Federal Regs. J.sAm. Water Works Assoc. 1996, 88, (3), 36. http://www.jstor.org/stable/41295469
[3] Pontius, F. W. Legislation/regulation: Inside the Information Collection Rule. J.sAm. Water Works Assoc. 1996, 88, (8), 16. http://www.jstor.org/stable/41295628
[4] Snoeyink, V. L.; Weber, W. J., Jr. The surface chemistry of active carbon; a discussion of structure and surface functional groups. Environ. Sci. Technol. 1967, 228. http://dx.doi.org/10.1021/es60003a003
[5] Pan, D.; Jaroniec, M. Adsorption and Thermogravimetric Studies of Unmodified and Oxidized Active Carbons. Langmuir. 1996, 3657. http://dx.doi.org/10.1021/la951549s
[6] Leon y Leon, C. A.; Radovic, L. Interfacial Chemistry and Electrochemistry of Carbon Surfaces. Chem. Phys. Carbon 1994, 24, 213.
[7] Summers, R. S.; Roberts, P. V. Activated carbon adsorption of humic substances: I. Heterodisperse mixtures and desorption. J. Colloid Interface Sci. 1988, 122, 367. http://dx.doi.org/10.1016/0021-9797(88)90372-4
[8] Summers, R. S.; Roberts, P. V. Activated carbon adsorption of humic substances: II. Size exclusion and electrostatic interactions. J. Colloid Interface Sci. 1988, 122, 382. http://dx.doi.org/10.1016/0021-9797(88)90373-6

33
[9] Karanfil, T.; Kilduff, J. E.; Schlautman, M. A.; Weber, J. W., Jr. Adsorption of Organic Macromolecules by Granular Activated Carbon. 1. Influence of Molecular Properties Under Anoxic Solution Conditions. Environ. Sci. Technol. 1996, 30, 2187. http://dx.doi.org/10.1021/es9505863
[10] Karanfil, T.; Schlautman, M. A.; Kilduff, J. E.; Weber, J. W., Jr. Adsorption of Organic Macromolecules by Granular Activated Carbon. 2. Influence of Dissolved Oxygen. Environ. Sci. Technol. 1996, 30, 2195. http://dx.doi.org/10.1021/es950587v
[11] Radovic, L. R.; Silva, I. F.; Ume, J. I.; Menendez, J. A.; Leon y Leon, C. A.; Scaroni, A. W. An experimental and theoretical study of the adsorption of aromatics possessing electron-withdrawing and electron-donating functional groups by chemically modified activated carbons. Carbon 1997, 35, 1339. http://dx.doi.org/10.1016/S0008-6223(97)00072-9
[12] Snoeyink, V. L.; Hai, H. T.; Johnson, J. H.; Young, J. F. In Chemistry of Water Supply, Treatment and Distribution, Ann Arbor Sciences: Ann Arbor, MI, 1974.
[13] McGuire, J. The Optimization of Water Treatment Unit Processes for the Removal of Trace Organic Compounds with an Emphasis on the Adsorption Mechanism. Ph.D. Dissertation, Drexel University, 1977.
[14] Karanfil, T.; Kilduff, J. E.; Kitis, M.; Wigton, A. Role of Granular Activated Carbon Surface Chemistry on the Adsorption of Organic Compounds. 2. Natural Organic Matter. Environ. Sci. Technol. 1999, 33, 3225-3233. http://dx.doi.org/10.1021/es9810179
[15] Radovic, L. R.; Silva, I. F.; Ume, J. I.; Menendez, J. A.; Leon y Leon, C. A.; Scaroni, A. W. An experimental and theoretical study of the adsorption of aromatics possessing electron-withdrawing and electron-donating functional groups by chemically modified activated carbons. Carbon 1997, 35, 1339. http://dx.doi.org/10.1016/S0008-6223(97)00072-9
[16] Stiles, R., Yang, I., Lippincott, R., Murphy, E., Buckley, B., Measurement of Drinking Water Contaminants by Solid Phase Microextraction Initially Quantified in Source Water Samples by the USGS, Environ. Sci. Technol., 2008, 42 (8), pp 2976–298
[17] USEPA Methods 525.2, 625, and 8270
[18] Muthulakshmi, A, Jothibai, Margret R and Mohan, V.R., GC-MS Analysis of Bioactive Components of Feronia elephantum Correa (Rutaceae), Journal of Applied Pharmaceutical Science 02 (02); 2012:69-74
[19] Shimabuku, K., Hyukjin C., Townsend, E., Rosario-Ortiz, F., and Summers, R., Modeling Nonequilibrium Adsorption of MIB and Sulfamethoxazole by Powdered Activated Carbon and the Role of Dissolved Organic Matter Competition, Environ. Sci. Technol., 2014, 48 (23), pp 13735–13742
[20] Summers, R., Kennedy, A., Knappe, D., Reinert, A., Fotta, M., Mastropol, A., Corwin, C., Roccaro, J., “Evaluation of Available Scale-Up Approaches for the Design of GAC Contactors”,

34
AWWA Research Foundation, Web Report #4235, (2014) http://www.waterrf.org/PublicReportLibrary/4235.pdf
[21] Stackelberg, P. E.; Furlong, E. T.; Meyer, M. T.; Zaugg, S. D.; Henderson, A. K.; Reissman, D. B. Persistence of pharmaceutical compounds and other organic wastewater contaminants in a conventional drinking-water-treatment plant Sci.Total Environ. 2004, 329, 99-113.
[22] Stackelberg, P. E.; Gibs, J.; Furlong, E. T.; Meyer, M. T.; Zaugg, S. D.; Lippincott, R. L. Efficiency of conventional drinking-water-treatment processes in removal of pharmaceuticals and other organic compounds Sci.Total Environ. 2007, 377, 255-272.
[23] Yoon, M., Analytical Method Development for Measurement of Unregulated Organic Contaminants in Aqueous Samples using Liquid Chromatography – Tandem Mass Spectrometry, (Doctoral dissertation), Rutgers University EOHSI, (2010)
[24] Yoon, M., Lippincott, R., Yang, I., Murphy, E., and Buckley, B., “An Analytical Method Using Sequential Positive and Negative Ionization Modes for the Measurement of Twenty Unregulated Compounds In Drinking Water Samples by LC-MS/MS”. Submitted to Journal of Mass Spectrometry Manuscript ID:JMS-10-0056.
[25] Post, G. B.; Louis, J. B.; Cooper, K. R.; Boros-Russo, B. J.; Lippincott, R. L. Occurrence and Potential Significance of Perfluorooctanoic Acids (PFOA) Detected in New Jersey Public Drinking Water Systems Environ. Sci. Technol. 2009, 43, 4547-4554.

35
APPENDIX 1 - FAIR LAWN BREAKTHROUGH RESULTS
This appendix contains graphics that were utilized to determine the individual chemical contaminant preference for each type of carbon (scrubber/sorbent material) at the Fair Lawn Cadmus Avenue facility. It was assumed that a chemical adsorbed to the carbon if the contaminant was not identified in the water in one of the two (2) carbon types (Filtrasorb 300, or Coconut Shell) treatment trains. The analytical results are ordered from left to right consistent with the water flow through the vessels to the finished drinking water effluent. As part of the batch of samples collected during each sampling event, a triplicate sample was obtained to assess the repeatability of the analysis. Results are considered estimated concentrations by NJDOH. Higher concentrations reported in the combined effluent suggest a summation of all breakthrough from each contactor. Results are only presented for bed depths where a detectable concentration was determined.

36
FAIR LAWN BREAKTHROUGH RESULTS
0
50
100
150
200
250
300
350
Nor
th #
1, T
op T
ap F
iltra
sorb
300
Nor
th #
1, T
op T
ap F
iltra
sorb
300
Nor
th #
1, T
op T
ap F
iltra
sorb
300
DU
P
Nor
th #
1, U
pper
Tap
Filt
raso
rb30
0
Nor
th #
1, M
iddl
e Ta
p Fi
ltra
sorb
300
Nor
th #
2, U
pper
Tap
Filt
raso
rb30
0
Nor
th #
2, M
iddl
e Ta
p Fi
ltra
sorb
300
Sout
h#1
Top
Tap
Coc
onut
She
ll
Sout
h#1
Upp
er T
ap C
ocon
ut S
hell
Sout
h#1
Upp
er T
ap C
ocon
ut S
hell
DU
P
Sout
h#2
Top
Tap
Coc
onut
She
ll
Com
bine
d E
fflu
ent (
Vau
lt)
Com
bine
d E
fflu
ent (
Vau
lt)
Est
imat
ed C
once
ntra
tion
(ng/
L)
Sample Name
Concentration of 1,2-Benzenedicarboxylic acid at sampling locations in Fair Lawn Cadmus Ave. Treatment Facility, NJDOH Results 11/13/2013

37
020406080
100120140160180200220240
Nor
th V
esse
l #1
Top
Tap
Filt
raso
rb30
0
Nor
th V
esse
l #1
Mid
dle
Tap
Filt
raso
rb30
0
Nor
th V
esse
l #2
Top
Tap
Filt
raso
rb30
0
Nor
th V
esse
l #2
Upp
er T
ap F
iltra
sorb
300
Nor
th V
esse
l #2
Mid
dle
Tap
Filt
raso
rb30
0
Nor
th V
esse
l #2
Low
er T
ap F
iltra
sorb
300
Sout
h V
esse
l #1
Upp
er T
ap C
ocon
ut S
hell
Sout
h V
esse
l #1
Mid
dle
Tap
Coc
onut
She
ll
Sout
h V
esse
l #1
Low
er T
ap C
ocon
ut S
hell
Sout
h V
esse
l #2
Top
Tap
Coc
onut
She
ll
Sout
h V
esse
l #2
Upp
er T
ap C
ocon
ut S
hell
Sout
h V
esse
l #2
Low
er T
apC
ocon
ut S
hell
Com
bine
d E
fflu
ent (
Vau
lt)
Est
imat
ed C
once
ntra
tion
(ng/
L)
Sample Name
Concentration of Dibutyl ester of 1,2-Benzenedicarboxylic acid at sampling locations in Fair Lawn Cadmus Ave. Treatment Facility,
NJDOH Results 11/28/2012

38
0
10
20
30
40
50
60
70
80
Nor
th V
esse
l #1
Top
Tap
Filt
raso
rb30
0
Nor
th V
esse
l #1
Upp
er T
ap F
iltra
sorb
300
Nor
th V
esse
l #1
Low
er T
ap F
iltra
sorb
300
Nor
th V
esse
l #2
Low
er T
ap F
iltra
sorb
300
Sout
h V
esse
l #1
Top
Tap
Coc
onut
She
ll
Sout
h V
esse
l #1
Mid
dle
Tap
Coc
onut
She
ll
Sout
h V
esse
l #2
Top
Tap
Coc
onut
She
ll
Sout
h V
esse
l #2
Low
er T
ap C
ocon
ut S
hell
Com
bine
d E
fflu
ent (
Vau
lt)
Est
imat
ed C
once
ntra
tion
(ng/
L)
Sample Name
Concentration of Tetrachloro-1,3-Isobenzofurandione at sampling locations in Fair Lawn Cadmus Ave. Treatment Facility, NJDOH
Results 11/28/2012

39
0
10
20
30
40
50
60
70
80
90
Nor
th V
esse
l #1
Top
Tap
Filt
raso
rb30
0
Nor
th V
esse
l #1
Upp
er T
ap F
iltra
sorb
300
Nor
th V
esse
l #2
Upp
er T
ap F
iltra
sorb
300
Nor
th V
esse
l #2
Top
Tap
Filt
raso
rb30
0
Sout
h V
esse
l #1
Upp
er T
ap C
ocon
ut S
hell
Sout
h V
esse
l #1
Mid
dle
Tap
Coc
onut
She
ll
Sout
h V
esse
l #1
Low
er T
ap C
ocon
ut S
hell
Sout
h V
esse
l #2
Upp
er T
ap C
ocon
ut S
hell
Sout
h V
esse
l #2
Low
er T
ap C
ocon
ut S
hell
Com
bine
d E
fflu
ent (
Vau
lt)
Est
imat
ed C
once
ntra
tion
(ng/
L)
Sample Name
Concentration of 2-(bicyclo[2.2.1]hept-5-en-2-ylidene) propanediol at sampling locations in Fair Lawn Cadmus Ave.
Treatment Facility, NJDOH Results 11/28/2012

40
.
0
5
10
15
20
25
30
35
40
45
50
Nor
th V
esse
l #1
Top
Tap
Filt
raso
rb30
0
Nor
th V
esse
l #1
Low
er T
ap F
iltra
sorb
300
Nor
th V
esse
l #1
Low
er T
ap D
UP
Filt
raso
rb30
0
Nor
th V
esse
l #2
Top
Tap
Filt
raso
rb30
0
Nor
th V
esse
l #2
Upp
er T
ap F
iltra
sorb
300
Nor
th V
esse
l #2
Mid
dle
Tap
Filt
raso
rb30
0
Nor
th V
esse
l #2
Mid
dle
Tap
DU
P Fi
ltra
sorb
300
Nor
th V
esse
l #2
Low
er T
ap F
iltra
sorb
300
Sout
h V
esse
l #1
Top
Tap
Coc
onut
She
ll
Sout
h V
esse
l #1
Upp
er T
ap C
ocon
ut S
hell
Sout
h V
esse
l #1
Low
er T
ap C
ocon
ut S
hell
Sout
h V
esse
l #2
Top
Tap
Coc
onut
She
ll
Sout
h V
esse
l #2
Upp
er T
ap C
ocon
ut S
hell
Sout
h V
esse
l #2
Mid
dle
Tap
Coc
onut
She
ll
Sout
h V
esse
l #2
Low
er T
ap C
ocon
ut S
hell
Com
bine
d E
fflu
ent (
Vau
lt)
Est
imat
ed C
once
ntra
tion
(ng/
L)
Sample Name
Concentration of 1-bromo-2-chloro-Benzene at sampling locations in Fair Lawn Cadmus Ave. Treatment Facility,
NJDOH Results 11/28/2012

41
0
10
20
30
40
50
60
70
80
90
100
Nor
th V
esse
l #2
Top
Tap
Filt
raso
rb30
0
Nor
th V
esse
l #2
Upp
er T
ap F
iltra
sorb
300
Nor
th V
esse
l #2
Mid
dle
Tap
Filt
raso
rb30
0
Nor
th V
esse
l #2
Low
er T
ap F
iltra
sorb
300
Sout
h V
esse
l #1
Upp
er T
ap C
ocon
ut S
hell
Sout
h V
esse
l #1
Mid
dle
Tap
Coc
onut
She
ll
Sout
h V
esse
l #2
Upp
er T
ap C
ocon
ut S
hell
Sout
h V
esse
l #2
Mid
dle
Tap
Coc
onut
She
ll
Sout
h V
esse
l #2
Low
er T
ap C
ocon
ut S
hell
Com
bine
d E
fflu
ent (
Vau
lt
Est
imat
ed C
once
ntra
tion
(ng/
L)
Sample Name
Concentration of Cyclododecane at sampling locations in Fair Lawn Cadmus Ave. Treatment Facility, NJDOH Results
11/28/2012

42
APPENDIX 2 -MERCHANTVILLE/PENNSAUKEN BREAKTHROUGH RESULTS
This appendix contains graphics that were utilized to determine the individual chemical contaminant preference for each type of carbon (scrubber or sorbent material) at the Merchantville/Pennsauken Marion Avenue facility. If the contaminant was not identified in one of the three carbon types (Filtrasorb 300, Filtrasorb600, or Coconut Shell), then the assumption was that the chemical adsorbed to the carbon rather than being detected in the water column samples taken at several sampling port depths in the GAC pressure vessel. The analytical results are ordered from left to right consistent with the water flow through the vessels to the finished drinking water effluent. As part of the batch of samples collected during each sampling event, a triplicate sample was obtained to assess the repeatability of the analysis. In some cases, as noted below the figures, sample results were the same for duplicate analyses by head space (HS) and direct insertion (DI) SPME isolation methods for compounds identified by Rutgers EOHSI. Results are considered estimated concentrations by NJDOH. Results are only presented for bed depths where a detectable concentration was determined.
MERCHANTVILLE/PENNSAUKEN BREAKTHROUGH RESULTS
0
50
100
150
200
250
300
Filt
raso
rb60
0 U
pper
Filt
raso
rb60
0 M
iddl
e
Coc
onut
Low
er
Coc
onut
Mid
dle
Coc
onut
Eff
luen
t
Filt
raso
rb30
0 E
fflu
ent
Est
imat
ed C
once
ntra
tion
(ng/
L)
Sample Name
Concentration of 1,1-Diphenyl-2-cyano-2-carbo-octoxy-acetylene at sampling locations in M/P Marion Ave. Treatment Facility, NJDOH
Results 02/22/2012

43
*Sample results were the same for duplicate analysis by headspace (HS) and direct
insertion (DI) SPME isolation methods. Only paired data from both isolation techniques is
reported here.
0
0.05
0.1
0.15
0.2
0.25M
iddl
e Fi
ltra
sorb
300
Mid
dle
Filt
raso
rb30
0
Upp
er C
ocon
ut S
hell
Upp
er C
ocon
ut S
hell
Upp
er F
iltra
sorb
600
Upp
er F
iltra
sorb
600
Mid
dle
Filt
raso
rb60
0
Mid
dle
Filt
raso
rb60
0
Com
bine
d E
fflu
ent
Com
bine
d E
fflu
ent
Con
cent
rati
on (u
g/L)
Sample Name
Concentration of Propanoic acid, 2-methyl-, 1-(1,1-dimethyl) at sampling locations in M/P Marion Ave. Treatment Facility, Rutgers SPME DI and HS
Results 02/22/2012

44
0
0.02
0.04
0.06
0.08
0.1
0.12
0.14U
pper
Coc
onut
She
ll
Upp
er C
ocon
ut S
hell
Upp
er C
ocon
ut S
hell
Mid
dle
Coc
onut
She
ll
Mid
dle
Coc
onut
She
ll
Mid
dle
Coc
onut
She
ll
Mid
dle
Coc
onut
She
ll
Mid
dle
Coc
onut
She
ll
Low
er C
ocon
ut S
hell
Mid
dle
Filtr
asor
b300
Upp
er F
iltra
sorb
600
Upp
er F
iltra
sorb
600
Upp
er F
iltra
sorb
600
Upp
er F
iltra
sorb
600
Upp
er F
iltra
sorb
600
Upp
er F
iltra
sorb
600
Upp
er F
iltra
sorb
600
Low
er F
iltra
sorb
600
Com
bine
d E
fflu
ent
Con
cent
rati
on (u
g/L)
Sample Name
Concentration of 2-Nonadecanone 2,4-dinitrophenylhydrazine at sampling locations in M/P Marion Ave. Treatment Facility, Rutgers SPME HS results
02/22/2012

45
0
0.05
0.1
0.15
0.2
0.25
0.3
0.35
0.4
0.45
Upp
er F
iltra
sorb
300
Upp
er F
iltra
sorb
300
Upp
er F
iltra
sorb
300
Mid
dle
Filtr
asor
b300
Low
er C
ocon
ut S
hell
Upp
er F
iltra
sorb
600
Upp
er F
iltra
sorb
600
Mid
dle
Filtr
asor
b60
0
Com
bine
d E
fflu
ent
Con
cent
rati
on (u
g/L)
Sample Name
Concentration of Stephabyssine at sampling locations in M/P Marion Ave. Treatment Facility, Rutgers SPME Results 02/22/2012

46
*Sample results were the same for duplicate analysis by HS and DI SPME isolation methods.
Influent concentration does not represent loading at each sampling port with the carbon
beds.
0
0.02
0.04
0.06
0.08
0.1
0.12
0.14
0.16
0.18In
fluen
t to
GA
C C
onta
ctor
s
Upp
er F
iltra
sorb
300
Upp
er F
iltra
sorb
300
Low
er F
iltra
sorb
300
Low
er F
iltra
sorb
300
Mid
dle
Coc
onut
She
ll
Mid
dle
Coc
onut
She
ll
Mid
dle
Coc
onut
She
ll
Mid
dle
Coc
onut
She
ll T
ripl
icat
e
Mid
dle
Coc
onut
She
ll
Mid
dle
Coc
onut
She
ll T
ripl
icat
e
Upp
er F
iltra
sorb
600
Upp
er F
iltra
sorb
600
Tri
plic
ate
Upp
er F
iltra
sorb
600
Upp
er F
iltra
sorb
600
Upp
er F
iltra
sorb
600
Con
cent
rati
on (u
g/L)
Sample Name
Concentration of Cholestan-3-one, cyclic 1,2-ethanediyl a at sampling locations in M/P Marion Ave. Treatment Facility, Rutgers SPME
HS and DI Results 04/19/2011 to 09/22/2014

47
*Sample results were the same for duplicate analysis by HS and DI SPME isolation methods.
0
0.02
0.04
0.06
0.08
0.1
0.12
0.14
Influ
ent t
o G
AC
Con
tact
ors
Influ
ent t
o G
AC
Con
tact
ors
Influ
ent t
o G
AC
Con
tact
ors
Influ
ent t
o G
AC
Con
tact
ors
Influ
ent t
o G
AC
Con
tact
ors
Influ
ent t
o G
AC
Con
tact
ors
Mid
dle
Coc
onut
She
ll
Mid
dle
Coc
onut
She
ll
Low
er C
ocon
ut S
hell
Low
er C
ocon
ut S
hell
Low
er C
ocon
ut S
hell
Low
er C
ocon
ut S
hell
Upp
er F
iltra
sorb
600
Upp
er F
iltra
sorb
600
Upp
er F
iltra
sorb
600
Upp
er F
iltra
sorb
600
Con
cent
rati
on (u
g/L)
Sample Name
Concentration of Erythro-9,10-dihydroxyoctadecanoic acidat sampling locations in M/P Marion Ave. Treatment Facility, Rutgers SPME
DI and HS Results 02/22/2012

48
0102030405060708090
100
Wel
l #2,
Raw
Influ
ent
Wel
l #2,
Raw
Influ
ent
Filt
raso
rb30
0 M
iddl
e
Filt
raso
rb30
0 Lo
wer
Filt
raso
rb60
0 M
iddl
e
Filt
raso
rb60
0 Lo
wer
Filt
raso
rb60
0 Lo
wer
Coc
onut
Low
er
Coc
onut
Eff
luen
t
Est
imat
ed C
once
ntra
tion
(ng/
L)
Sample Name
Concentration of 1,2-Benzenedicarboxylic acid, diisononyl ester at sampling locations in M/P Marion Ave. Treatment Facility, NJDOH Results 02/22/2012

49
0
20
40
60
80
100
120
140
160
Coc
onut
Upp
er
Coc
onut
Mid
dle
Coc
onut
Mid
dle
Coc
onut
Low
er
Filt
raso
rb30
0 M
iddl
e
Filt
raso
rb60
0 U
pper
Filt
raso
rb60
0 M
iddl
e
Filt
raso
rb60
0 E
fflu
ent
Est
imat
ed C
once
ntra
tion
(ng/
L)
Sample Name
Concentration of 1-Methyl-2-Pyrrolidone at sampling locations in M/P Marion Ave. Treatment Facility, NJDOH Results 02/22/2012

50
0
50
100
150
200
250
300
Filt
raso
rb30
0 M
iddl
e
Filt
raso
rb30
0 Lo
wer
Coc
onut
Upp
er
Coc
onut
Mid
dle
Coc
onut
Eff
luen
t
Filt
raso
rb60
0 U
pper
Filt
raso
rb60
0 M
iddl
e
Filt
raso
rb60
0 Lo
wer
Filt
raso
rb60
0 E
fflu
ent
Est
imat
ed C
once
ntra
tion
(ng/
L)
Sample Name
Concentration of 9-Octadecenoic acid at sampling locations in M/P Marion Ave. Treatment Facility, NJDOH Results
02/22/2012

51
0
10
20
30
40
50
60
70
80
90
Wel
l #2
Coc
onut
Upp
er
Coc
onut
Mid
dle
Coc
onut
Low
er
Coc
onut
She
ll U
pper
2
Coc
onut
She
ll M
iddl
e 2
Coc
onut
Eff
luen
t
Coc
onut
She
ll E
fflu
ent 2
Filt
raso
rb30
0 U
pper
Filt
raso
rb30
0 Lo
wer
Filt
raso
rb30
0 Lo
wer
2
Filt
raso
rb30
0 Lo
wer
2
Filt
raso
rb30
0 E
fflu
ent 2
Filt
raso
rb60
0 U
pper
Filt
raso
rb60
0 Lo
wer
Filt
raso
rb60
0 M
iddl
e 2
Filt
raso
rb60
0 Lo
wer
2
Filt
raso
rb60
0 E
fflu
ent
Est
imat
ed C
once
ntra
tion
(ng/
L)
Sample Name
Concentration of 9-Octadecenamide at sampling locations in M/P Marion Ave. Treatment Facility, NJDOH Results 02/22/2012 and 02/06/2013

52
0
5
10
15
20
25
30W
ell #
2
Filt
raso
rb60
0 Lo
wer
2
Filt
raso
rb60
0 Lo
wer
Coc
onut
She
ll U
pper
2
Coc
onut
Mid
dle
Coc
onut
She
ll Lo
wer
2
Coc
onut
Eff
luen
t
Filt
raso
rb30
0 U
pper
Filt
raso
rb30
0 M
iddl
e
Filt
raso
rb30
0 Lo
wer
Filt
raso
rb30
0 Lo
wer
2
Filt
raso
rb30
0 Lo
wer
2
Filt
raso
rb30
0 E
fflu
ent
Est
imat
ed C
once
ntra
tion
(ng/
L)
Sample Name
Concentration of 1-Octadecene at sampling locations in M/P Marion Ave. Treatment Facility, NJDOH Results 02/22/2012 and 02/06/2013

53
0
10
20
30
40
50
60
70
80
90
Wel
l #2
Coc
onut
Mid
dle
Coc
onut
Low
er
Coc
onut
She
ll U
pper
2
Coc
onut
She
ll E
fflu
ent 2
Filt
raso
rb30
0 U
pper
Filt
raso
rb30
0 M
iddl
e
Filt
raso
rb30
0 Lo
wer
2
Filt
raso
rb30
0 E
fflu
ent
Filt
raso
rb30
0 E
fflu
ent 2
Filt
raso
rb60
0 U
pper
Filt
raso
rb60
0 M
iddl
e
Filt
raso
rb60
0 Lo
wer
Filt
raso
rb60
0 U
pper
2
Filt
raso
rb60
0 M
iddl
e 2
Filt
raso
rb60
0 Lo
wer
2
Filt
raso
rb60
0 E
fflu
ent
Filt
raso
rb60
0 E
fflu
ent 2
Est
imat
ed C
once
ntra
tion
(ng/
L)
Sample Name
Concentration of Hexadecane at sampling locations in M/P Marion Ave. Treatment Facility, NJDOH Results 02/22/2012 and 02/06/2013

54
*Sample results were the same for duplicate analysis by HS and DI SPME isolation methods.
0
0.05
0.1
0.15
0.2
0.25
0.3
0.35
Low
er C
ocon
ut S
hell
Low
er C
ocon
ut S
hell
Upp
er F
iltra
sorb
600
Upp
er F
iltra
sorb
600
Upp
er F
iltra
sorb
300
Upp
er F
iltra
sorb
300
Low
er F
iltra
sorb
300
Low
er F
iltra
sorb
300
Com
bine
d E
fflu
ent
Com
bine
d E
fflu
ent
Con
cent
rati
on (u
g/L)
Sample Name
Concentration of Phenol, 2,6-bis(1,1-dimethylethyl)-4-ethylat sampling locations in M/P Marion Ave. Treatment Facility, Rutgers
SPME HS and DI results 02/22/2012

55
0
10
20
30
40
50
60
Coc
onut
Upp
er
Coc
onut
Low
er
Filt
raso
rb30
0 U
pper
Filt
raso
rb30
0 Lo
wer
Filt
raso
rb60
0 U
pper
Filt
raso
rb60
0 E
fflu
entE
stim
ated
Con
cent
rati
on (n
g/L)
Sample Name
Concentration of 9-Hexadecenoic acid, eicosyl ester at sampling locations in M/P Marion Ave. Treatment Facility, NJDOH
Results 02/22/2012

56
*Sample results were the same for duplicate analysis by HS and DI SPME isolation methods.
00.010.020.030.040.050.060.070.080.09
0.1
Upp
er F
iltra
sorb
600
Upp
er F
iltra
sorb
600
Mid
dle
Filtr
asor
b60
0
Mid
dle
Filtr
asor
b60
0
Upp
er C
ocon
ut S
hell
Upp
er C
ocon
ut S
hell
Mid
dle
Coc
onut
She
ll
Mid
dle
Coc
onut
She
ll
Mid
dle
Coc
onut
She
ll
Mid
dle
Coc
onut
She
ll
Mid
dle
Coc
onut
She
ll
Mid
dle
Coc
onut
She
ll
Com
bine
d E
fflu
ent
Com
bine
d E
fflu
ent
Con
cent
rati
on (u
g/L)
Sample Name
Concentration of 2-Propenal, 3-phenyl-at sampling locations in M/P Marion Ave. Treatment Facility,
Rutgers SPME HS and DI results 02/22/2012

57
*Sample results were the same for duplicate analysis by HS and DI SPME isolation methods.
0
0.02
0.04
0.06
0.08
0.1
0.12
0.14
0.16
0.18
Influ
ent t
o G
AC
Con
tact
ors
Influ
ent t
o G
AC
Con
tact
ors
Upp
er C
ocon
ut S
hell
Upp
er C
ocon
ut S
hell
Upp
er C
ocon
ut S
hell
Upp
er C
ocon
ut S
hell
Mid
dle
Coc
onut
She
ll
Mid
dle
Coc
onut
She
ll
Low
er C
ocon
ut S
hell
Low
er C
ocon
ut S
hell
Low
er F
iltra
sorb
300
Low
er F
iltra
sorb
300
Con
cent
rati
on (u
g/L)
Sample Name
Concentration of Ethanol, 2-(2-ethoxyethoxy)-at sampling locations in M/P Marion Ave. Treatment Facility, Rutgers
SPME HS and DI results 02/22/2012

58
*Sample results were the same for duplicate analysis by HS and DI SPME isolation methods.
0
0.05
0.1
0.15
0.2
0.25
0.3
0.35
0.4
Upp
er F
iltra
sorb
300
Mid
dle
Filtr
asor
b300
Mid
dle
Filtr
asor
b300
Mid
dle
Filtr
asor
b300
Low
er F
iltra
sorb
300
Dup
Low
er F
iltra
sorb
300
Low
er F
iltra
sorb
300
Upp
er C
ocon
ut S
hell
Mid
dle
Coc
onut
She
ll
Mid
dle
Coc
onut
She
ll D
up
Mid
dle
Coc
onut
She
ll
Mid
dle
Coc
onut
She
ll
Mid
dle
Coc
onut
She
ll
Mid
dle
Coc
onut
She
ll
Low
er C
ocon
ut S
hell
Low
er C
ocon
ut S
hell
Dup
Low
er C
ocon
ut S
hell
Low
er C
ocon
ut S
hell
Low
er C
ocon
ut S
hell
Com
bine
d E
fflu
ent
Com
bine
d E
fflu
ent
Con
cent
rati
on (u
g/L)
Sample Name
Concentration of 1,3-Benzenediamine, 4-methyl- at sampling locations in M/P Marion Ave. Treatment Facility, Rutgers SPME HS and DI results 02/22/2012

59
0
0.02
0.04
0.06
0.08
0.1
0.12
0.14
Low
er F
iltra
sorb
300
Upp
er C
ocon
ut S
hell
Mid
dle
Coc
onut
She
ll
Upp
er F
iltra
sorb
600
Com
bine
d E
fflu
ent
Con
cent
rati
on (u
g/L)
Sample Name
Concentration of 15-Hydroxy-7-oxodehydroabietic acid, methyl- at sampling locations in M/P Marion Ave. Treatment Facility, Rutgers SPME HS and DI
results 02/22/2012

60
0
20
40
60
80
100
120
140
160
180
Wel
l #2
Coc
onut
Upp
er
Coc
onut
Low
er
Coc
onut
Eff
luen
t
Filt
raso
rb30
0 Lo
wer
Filt
raso
rb30
0 E
fflu
ent
Filt
raso
rb60
0 U
pper
Est
imat
ed C
once
ntra
tion
(ng/
L)
Sample Name
Concentration of 9-octyl-Heptadecane at sampling locations in M/P Marion Ave. Treatment Facility, NJDOH Results 02/22/2012

61
0
2
4
6
8
10
12
14
16
18
Coc
onut
She
ll U
pper
2
Coc
onut
Upp
er
Coc
onut
Mid
dle
Coc
onut
Bas
e
Filt
raso
rb60
0 U
pper
2
Filt
raso
rb60
0 M
iddl
e 2
Filt
raso
rb60
0 B
ase
Filt
raso
rb30
0 M
iddl
e
Filt
raso
rb30
0 U
pper
2
Filt
raso
rb30
0 Lo
wer
2
Filt
raso
rb30
0 B
ase
2
Filt
raso
rb30
0 E
fflu
ent 2
Est
imat
ed C
once
ntra
tion
(ng/
L)
Sample Name
Concentration of Isopropyl myristate at sampling locations in M/P Marion Ave. Treatment Facility, NJDOH Results 02/22/2012 and 02/06/2013

62
0
5
10
15
20
25
30
35
40
45
50
Wel
l #2
Coc
onut
Mid
dle
Coc
onut
Low
er
Coc
onut
Eff
luen
t
Coc
onut
She
ll E
fflu
ent 2
Filt
raso
rb30
0 U
pper
Filt
raso
rb30
0 M
iddl
e
Filt
raso
rb30
0 U
pper
2
Filt
raso
rb30
0 Lo
wer
2
Filt
raso
rb30
0 Lo
wer
2
Filt
raso
rb30
0 E
fflu
ent 2
Filt
raso
rb60
0 U
pper
Filt
raso
rb60
0 M
iddl
e
Filt
raso
rb60
0 U
pper
2
Filt
raso
rb60
0 Lo
wer
2
Filt
raso
rb60
0 E
fflu
ent 2
Est
imat
ed C
once
ntra
tion
(ng/
L)
Sample Name
Concentration of Myristic acid at sampling locations in M/P Marion Ave. Treatment Facility, NJDOH Results 02/22/2012 and 02/06/2013

63
0
10
20
30
40
50
60
70
80
Wel
l #2
Coc
onut
Mid
dle
Coc
onut
Low
er
Filt
raso
rb60
0 U
pper
Filt
raso
rb60
0 M
iddl
e
Est
imat
ed C
once
ntra
tion
(ng/
L)
Sample Name
Concentration of Benzoic acid at sampling locations in M/P Marion Ave. Treatment Facility, NJDOH Results 02/22/2012