Embed Size (px)
Citation preview
Determination of Organic and Inorganic Carbon in Forest SoilSamples by Mid-Infrared Spectroscopy and Partial LeastSquares Regression
MICHAEL TATZBER,* FRANZ MUTSCH, AXEL MENTLER, ERNST LEITGEB,MICHAEL ENGLISCH, and MARTIN H. GERZABEKInstitute of Soil Research, Department of Forest and Soil Sciences, University of Natural Resources and Applied Life Sciences, Peter Jordan
Strasse 82, 1190 Vienna, Austria (M.T., A.M., M.H.G.); and Federal Research and Training Centre for Forests, Natural Hazards and Landscape,Seckendorff-Gudent-Weg 8, 1131 Vienna, Austria (F.M., E.L., M.E.)
Analyses of organic and inorganic carbon are of great interest in the field
of soil analyses. Soil samples from a national monitoring project were
provided for this study, including more than 130 forest sites from Austria.
We investigated the humus layers (if present undecomposed litter (L), of
mixed samples of F- (intermediate decomposed organic matter) and H-
(highly decomposed organic matter) (FH)) and upper mineral soil layers
(0–5 and 5–10 cm) of the samples. Mid-infrared spectra were recorded
and evaluated by their band areas; subsequently we calculated models
with the partial least squares approach. This was done by correlating
calculated data of the mid-infrared spectra with gas-volumetrically
determined carbonate values and measurements of organic carbon from
an elemental analyzer. For carbonate determination, this approach gave
satisfying results. For measurements of organic carbon, it was necessary
to discriminate into humus layers and mineral soils or even more groups
to obtain satisfactory correlations between spectroscopically determined
and conventionally measured values. These additional factors were the
presence of carbonate, the forest type, and the dominant tree species. In
mineral soils, fewer subdivisions were necessary to obtain useful results.
In humus layers, groupings of sites with more similar characteristics had
to be formed in order to obtain satisfying results. The conclusion is that
the chemical background of soil organic matter leading to different
proportions of functional groups, especially in the less humified organic
matter of the humus layers, plays a key role in analyses with mid-infrared
spectroscopy. Keeping this in mind, the present approach has a significant
potential for the prediction of properties of forest soil layers, such as, e.g.,
carbonate and organic carbon contents.
Index Headings: Forest soils; Mid-infrared spectroscopy; Fourier trans-
form infrared spectroscopy; FT-IR spectroscopy; Carbonate; Organic
carbon; Partial least squares; PLS.
INTRODUCTION
Forest soils represent an important sink and source of carbonin the terrestrial carbon cycle. In times of increased interest incharacterizing and quantifying carbon pools, the importance ofanalyses of these pools is beyond doubt.1–3 Generally, thecarbon pool consists of both an inorganic pool (consisting ofcarbonate) and an organic one. Among other techniques, mid-infrared (mid-IR) spectroscopy is one of the methodsapplicable for these purposes.4–6
Several studies have been carried out investigating theapplicability of mid-IR spectroscopy to forest soil samples. Inthis context, qualitative questions have dealt with predictions ofNMR properties of soil organic matter (SOM) by diffusereflection (DR) Fourier transform infrared (FT-IR) spectrosco-py,4,5 following structural changes of humus with short-term
heating,6,7 organic matter characterizations of soil aggregatecoatings,8 and analyzing functional-group distribution in plantlitter.9 Quantifications were carried out mainly for basicparameters such as carbon and nitrogen content, the C/N ratio,particulate organic carbon, and charcoal carbon.10–15 Partialleast squares (PLS) regression was used for these purposes.
Common methods for measuring the carbonate content insoils are based on gas-volumetric approaches16 or elementalanalyses after combustion of organic material for four hours at450 8C.17 In one study, Sherrod et al.18 modified the pressurecalcimeter method by using sealed Wheaton serum bottles.Detection limits of 0.17 g inorganic carbon were reached usingthis approach.18 Organic carbon is usually measured byelemental analyzers. In this context, Wright and Bailey19
defined two combustion conditions for a dry combustionanalyzer. One was for minimizing the decomposition rate ofcarbonate C, while maximizing the recovery of organic C, andthe second was to maximize the recoveries of total C and N.19
Another method of optimization was shown in the work ofHarris et al.20 In this study, carbonate C was removed from thesoil samples by placing the samples in a desiccator containing abeaker with 12 M HCl for 6 to 8 hours.20 In a work dealingwith marine sediments,21 the contents of organic carbon weredetermined by the difference between inorganic (measuredwith DR/FT-IR spectroscopy) and organic carbon (measuredwith conventional methods). It was found that this approachwas applicable for the investigated samples.21 In a recentwork14 DR/FT-IR spectroscopy was applied to the determina-tion of carbon and nitrogen (and also for nonpolar extractablefractions, water-soluble fractions, and unhydrolyzable residues)in foliar litter of Canadian forests, yielding good estimates.McCarty et al. published a work including comparisons ofuntreated soils with acidified soils for mid- and near-infrareddeterminations of organic carbon.22 Reeves and Smith23
examined the potential of DR mid- and near-infraredspectroscopy for determinations not only for carbon but alsofor different metals (e.g., Co, Cr, Ni). In their study, theoutcome was that suitable spectroscopic calibrations were notpossible.23 In a previous work24 carbonate contents ofagricultural soils were measured using both mid-IR spectros-copy and a gas-volumetric determination. Good relations wereobtained between the two methods for a sample set fromdifferent soil depths of a long-term field experiment. In thisstudy, two bands in the mid-IR spectrum were used forcalibration of carbonate contents.24 Based on this work, thepresent study should further develop this method of carbonatedetermination. Organic carbon and nitrogen were determinedfor three different spruce forest sites in Austria and Ireland11,15
Received 29 January 2010; accepted 8 July 2010.* Author to whom correspondence should be sent. E-mail: [email protected].
Volume 64, Number 10, 2010 APPLIED SPECTROSCOPY 11670003-7028/10/6410-1167$2.00/0
� 2010 Society for Applied Spectroscopy
and two different sites in Brazil.10 In all cases satisfyingcorrelations between estimated values of mid-IR spectroscopyand the measured ones were obtained.
Investigations of the applicability of mid-IR spectroscopywere carried out with soil samples from Australia,25,26 foliarlitter samples from Canada,14 tropical forest soils fromBrazil,10,27 and a set of samples from Austria and Ireland11,15
with differing numbers of samples. None of these studiesincluded carbonate and organic carbon determinations withmid-IR spectroscopy for a diverse set of temperate forest soilsamples. The difference compared to tropical soils is thedifferent build-up of these forests, including mixed andconiferous forests with different ground vegetation. In theBioSoil project samples of soil sites all over Europe areinvestigated; in Austria, 139 forest sites are included in thisprogram. In the present study, the applicability of mid-IRspectroscopy for those determinations should be tested on thisdiverse set of Austrian forest soils. This set includes bothhumus and mineral layers of temperate forest soils frommountain sites as well as from lowlands, together with well-known site characteristics. The aim of this study was thedevelopment of an approach based on transmission mid-IRspectroscopy for organic carbon and carbonate determination
of these soil samples with focus on optimization for the humuslayers and upper mineral soils.
MATERIALS AND METHODS
Soil Sampling. Soil samples from 139 Austrian sites wereprovided from the BioSoil project. Ranges of basic parameters(contents of organic carbon, carbonate, nitrogen, and phospho-rus) of the investigated soil samples are given in Table I. Threepits were excavated per location and the material from thehumus (Corg . 20%) and top-soil (Corg . 20%) layers (thesewere: if present undecomposed litter (L), mixed samples of F-(intermediate decomposed organic matter) and H- (highlydecomposed organic matter) (FH) upper mineral soil layers: 0–5 cm and 5–10 cm) was air dried and sieved (2 mm).Subsequently small amounts of the samples were powdered inan agate mill. The soils were stored in airtight bottles. Detailsof the BioSoil project such as soil sampling can be found on itshomepage.28
Carbonate Determination. Approximately 0.5 to 2 g of drysoil samples were treated with 10 mL 10% HCl (which is aconcentration of 2.86 M) after connecting to the Scheiblerapparatus. Released CO2 was measured volumetrically. The
TABLE I. Ranges of some basic parameters, including Corg, carbonate, and nitrogen (all in mg g�1) of the samples for the calculated models and thenumber of samples (n) for every calculated model.
Description of model See Figure Corg Carbonate Ntot n
Carbonate, all samples 2 7.0–551.0 0.0–741.7 0.50–22.30 439Corg, all samples 3a 7.0–567.0 0.0–741.7 0.50–22.30 504Corg, carbonate-free samples 3b 7.0–567.0 0.0 0.50–21.87 422Corg, carbonate-containing samples 3c 16.7–503.7 0.7–741.7 0.77–21.10 82Corg, mineral soils 4a 7.0–226.0 0.0–741.7 0.50–13.90 264Corg, mineral soils, mixed forests, carbonate-free 4b 7.0–202.3 0.0 0.50–10.90 78Corg, mineral soils, coniferous forests, carbonate-free 4c 10.0–199.0 0.0 0.63–9.93 107Corg, mineral soils, mixed forests, carbonate-containing 4d 16.7–214.3 0.7–635.0 0.77–11.63 41Corg, mineral soils, coniferous forests, carbonate-containing 4e 35.7–202.7 3.0–741.7 1.70–11.83 13Corg, humus layers 5a 218.0–567.0 0.0–106.3 8.23–21.87 240Corg, humus layers, carbonate-free, mixed forests 5b 218.0–551.0 0.0 7.80–21.13 109Corg, humus layers, carbonate-free, coniferous forests 5c 260.0–569.5 0.0 8.13–21.87 106Corg, humus layers, carbonate-free, tree species: spruce/fir or pine 5d 263.7–543.3 0.0 8.23–17.70 18Corg, humus layers, carbonate-free, tree species: spruce only 5e 317.7–529.0 0.0 10.87–20.03 10
TABLE II. Conventional assignments of the bands integrated for the evaluation of the recorded infrared spectra of mineral soils.
Base points of the integrated bands(cm�1)/Band number Conventional band assignments inside the integrated bands
3719–3685/I and 3682–3577/II Si–O–H vibrations10
3107–3043/III Aryl–H, R2C¼CH2, R2C¼CHR31
2973–2874 /IV Asymmetrical CH2 stretching32
2873–2837/V Symmetrical CH2 stretching32
2562–2480/VI Carbonate21,24
1757–1481/VII C¼O stretch;6 C¼O vibrations of carboxylates and aromatic vibrations;33 O–H bending of water molecules inhydration layers of soil phyllosilicates;34 C¼O (amide I, carboxylates);35 esters (saturated), starurated carboxyls,a,b-unsaturated carboxyls, aryl-carboxyls, antisymmetr. stretch of carboxylates, ureas, carbonyls in 6-rings,carbonyls in 5-rings, –NH2, NH, –NH3
þ, amide I and II bands of primary, N-monosubstituted, andN,N-disubstituted amides31
1478–1309/VIII Carbonate,24 carboxylates31
1197–1160/IX C–O stretch of OH deformation of COOH36
1122–1071/X Si–O–Si,37 sulfates31
1049–1018/XI C–O stretch (1030–1080 ¼ carbohydrate region)6
1018–963/XII SiO32�, CH out-of-plane vibrations,37 trans-RHC¼CHR31
925–894/XIII C–H deformation of aromats,31 cyclopentane rings37
887–866/XIV Carbonate21,24
819–730/XV Inorganic materials, such as clay and quartz minerals,11 C–H deformation of aromats31
1168 Volume 64, Number 10, 2010
apparatus was calibrated with pure CaCO3, which was treatedin the same way.16
Elemental Analyses. Total carbon and total nitrogen in bulksoil samples were measured by combustion at 1250 8C in aLECO CN 2000 apparatus. Carbon dioxide is formed afterthermal dissociation of carbonates and oxidation of the organiccompounds. Organic carbon was determined by subtracting theinorganic carbon content (from the carbonate determination)from the measured total carbon.29 Phosphorus and sulfur weredetermined by hot extractions with aqua regia or with a mixtureof nitric and perchloric acid30 and following measurementswith inductively coupled plasma optical emission spectrometry(ICP-OES).
Fourier Transform Infrared Analyses. Potassium bromidepellets were prepared for transmission FT-IR spectroscopy.The full weight of each pellet was 200 to 201 mg. An amountof 0.5 mg of analyte was included for the L- and FH-layers and1.5 mg for the mineral soil samples from 0–5 and 5–10 cm. Theexact weights of analyte per pellet were noted for evaluationsof the obtained spectra. The spectra were recorded with a
Perkin Elmer Paragon 500 FT-IR Spectrometer in the mid-infrared range (meaning a range from 4000 to 400 cm�1). Themeasurements were carried out with a resolution of 4 cm�1,weak apodization, and 16 scans per sample. Backgroundcorrection against ambient air and pure KBr were carried out atleast every three hours. Band areas were integrated withcorrected baselines (this was done manually using the software‘‘Spectrum v2.00’’; the base points for band integrations aregiven in Tables II and III); the obtained units were‘‘Absorbance units times wavenumber’’ (AB cm�1). These bandareas were normalized via dividing the band area by theweighed amount of analyte in the pellet, leading to the unit AB
cm�1 mg�1. These values were taken for the calculations withthe partial least squares (PLS) regression. The signal stabilitywas verified by measuring three almost identical pellets oflignin (Organosolv, Aldrich) at least one time per series ofmeasurements. Detailed band interpretations are listed inTables II and III for the mineral soils and the humus layers.For correlations including both the mineral soils and the humuslayers a selection of bands was taken: 3107–3042, 2989–2877,
TABLE III. Conventional assignments of the bands integrated for the evaluation of the recorded infrared spectra of humus layers.
Base points of the integrated bands(cm�1)/Band number Conventional band assignments inside the integrated bands
3107–3042/1 Aryl-H, R2C¼CH2, R2C¼CHR31
2989–2877/2 Aliphatic C–H stretch6
2873–2836/3 Aliphatic C–H stretch6
2562–2480/4 Carbonate21,24
1775–1711/5 C¼O stretch6
1691–1642/6 C¼O stretch (amide I) of tertiary amides (1680–1630 secondary, 1650 primary); C¼N stretching of unsaturatedlinkages containing nitrogen (open chain and unconjugated cyclic); amide II of primary amides (CO–NH2), ureas31
1642–1569/7 Amide II of primary amides;37 carboxylates and amides,9 R–O–NO231
1537–1488/8 Aromatic skeletal vibrations;6 amide II and aromatic C¼C;11 aromatic skeletal (lignin)35
1479–1444/9 CH and NH of amide II;38 aliphatic C–H deformation39
1444–1408/10 Malonic and/or benzoic acids, amide III of primary amides, carbonates37
1403–1354/11 C–O of phenolic OH, COO� and O–H;39 C(CH3)3, CH3 bend,37 NO3, CO–CH331
1342–1307/12 Malonic acids;37 R–SO2–OR0 (sulfonamides);31 C–N of aromatic amines41
1293–1256/13 Benzoic acids, C–O of aryl ethers;37 R–O–NO2, P¼O,31 C–O of phenolic groups40
1256–1198/14 C–O and OH of COOH, C–O of aryl ethers and phenols;39 acetates,37 P–O aryl31
1185–1144/15 C–OH of aliphatic OH; R–SO2–OR0 (sulfonamides)31
1136–1070/16 Quartz;35 saturated secondary aliphatic alcohol and/or a-unsaturated or cyclic tertiary alcohol, C–O of alkyl ethers,RCH2–NH–CH2R, a-unsaturated secondary alcohol and/or straight-chain primary alcohol and/or alicyclicsecondary alcohol having a 5- or 6-membered ring-skeleton;37 C–OH, sulfates31
1056–945/17 C–O stretch (1030–1080 ¼ carbohydrate region);6 Si–OH,9 RHC¼CH2, sulfones, P–O aryl31
945–887/18 Malonic and/or benzoic acids, pyranose rings in carbohydrates,37 RHC¼CH2, R2C¼CH231
887–866/19 Carbonate21,24
820–752/20 Inorganic materials (e.g., clay and quartz minerals);11 R2C¼CHR, phenyls with three adjacent H’s31
TABLE IV. List of the mid-infrared bands used for the calculation of the models (in order of the stepwise selection of the model).
Description of model See Figure List of bands (as BN) for model calculation
Carbonate, all samples 2 IX/15, VI/4, III/1, and XIV/19Corg, all samples 3a XV/20, III/1, IV/2, V/3, XIV/19, IX/15, and XIII/18Corg, carbonate-free samples 3b XV/20, III/1, XIV/19, IV/2, V/3, XIII/18, and VI/4Corg, carbonate-containing samples 3c III/1, IV/2, and V/3Corg, mineral soils 4a IV, VIII, V, XII, XIV, and IICorg, mineral soils, mixed forests, carbonate-free 4b IV, VIII, IX, and VICorg, mineral soils, coniferous forests, carbonate-free 4c IV, V, and VIICorg, mineral soils, mixed forests, carbonate-containing 4d VII, I, XII, IX, IV, VIII, VI, II, and VCorg, mineral soils, coniferous forests, carbonate-containing 4e I, III, and VICorg, humus layers 5a 17, 13, 7, 20, and 10Corg, humus layers, carbonate-free, mixed forests 5b 13, 20, 12, 17, 15Corg, humus layers, carbonate-free, coniferous forests 5c 17, 7, 8, 10, 4Corg, humus layers, carbonate-free, tree species: spruce/fir or pine 5d 20, 17, 13, 16Corg, humus layers, carbonate-free, tree species: spruce only 5e 8, 10, 6
APPLIED SPECTROSCOPY 1169
2873–2836, 2562–2480, 1185–1144, 1136–1070, 945–887,887–866, and 820–752 cm�1 (see also Table IV).
Statistical Analyses. For model calculations, the baseline-corrected integrated band areas of the measured spectra(without any preprocessing such as smoothing or derivates)were exported to Microsoft Excel together with the results ofelemental analyses and site characteristics. Calculations ofpartial least squares were carried out using PSAW Statistics 18software. The models were calculated for linear regression, anda stepwise selection of bands contributing significantly to the
performance of the models was performed. The obtainedcoefficients of the models were exported and applied inMicrosoft Excel for calculations of the partial least squares datasets.
RESULTS AND DISCUSSION
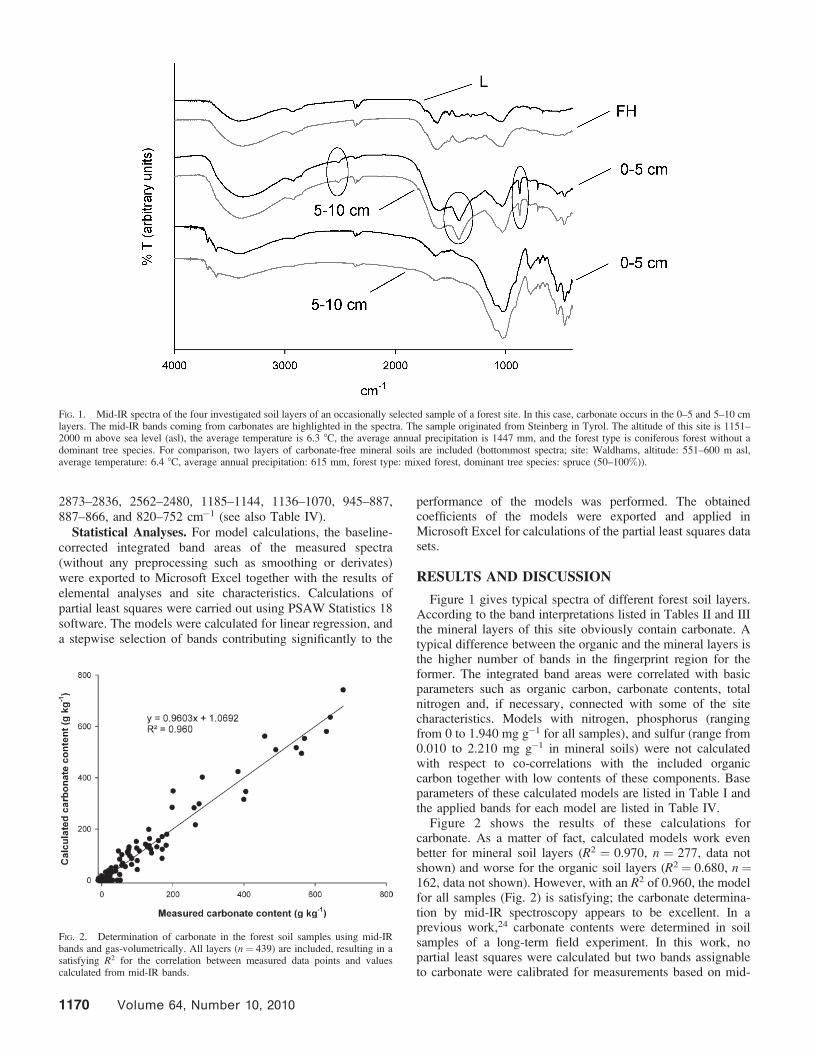
Figure 1 gives typical spectra of different forest soil layers.According to the band interpretations listed in Tables II and IIIthe mineral layers of this site obviously contain carbonate. Atypical difference between the organic and the mineral layers isthe higher number of bands in the fingerprint region for theformer. The integrated band areas were correlated with basicparameters such as organic carbon, carbonate contents, totalnitrogen and, if necessary, connected with some of the sitecharacteristics. Models with nitrogen, phosphorus (rangingfrom 0 to 1.940 mg g�1 for all samples), and sulfur (range from0.010 to 2.210 mg g�1 in mineral soils) were not calculatedwith respect to co-correlations with the included organiccarbon together with low contents of these components. Baseparameters of these calculated models are listed in Table I andthe applied bands for each model are listed in Table IV.
Figure 2 shows the results of these calculations forcarbonate. As a matter of fact, calculated models work evenbetter for mineral soil layers (R2 ¼ 0.970, n ¼ 277, data notshown) and worse for the organic soil layers (R2¼ 0.680, n¼162, data not shown). However, with an R2 of 0.960, the modelfor all samples (Fig. 2) is satisfying; the carbonate determina-tion by mid-IR spectroscopy appears to be excellent. In aprevious work,24 carbonate contents were determined in soilsamples of a long-term field experiment. In this work, nopartial least squares were calculated but two bands assignableto carbonate were calibrated for measurements based on mid-
FIG. 1. Mid-IR spectra of the four investigated soil layers of an occasionally selected sample of a forest site. In this case, carbonate occurs in the 0–5 and 5–10 cmlayers. The mid-IR bands coming from carbonates are highlighted in the spectra. The sample originated from Steinberg in Tyrol. The altitude of this site is 1151–2000 m above sea level (asl), the average temperature is 6.3 8C, the average annual precipitation is 1447 mm, and the forest type is coniferous forest without adominant tree species. For comparison, two layers of carbonate-free mineral soils are included (bottommost spectra; site: Waldhams, altitude: 551–600 m asl,average temperature: 6.4 8C, average annual precipitation: 615 mm, forest type: mixed forest, dominant tree species: spruce (50–100%)).
FIG. 2. Determination of carbonate in the forest soil samples using mid-IRbands and gas-volumetrically. All layers (n¼ 439) are included, resulting in asatisfying R2 for the correlation between measured data points and valuescalculated from mid-IR bands.
1170 Volume 64, Number 10, 2010
IR spectroscopy. One conclusion was that there were constantfactors between gas-volumetric measured and spectroscopical-ly determined values for two different bands originating fromcarbonates. In the work of Tung and Tanner,21 total organiccarbon was determined with an elemental analyzer andinorganic carbon was determined by DR/FT-IR spectroscopy.The calibration of the band at 2510 cm�1 gave an R2 of 0.9659.Our results support the previous work and prove theapplicability for diverse soil types.
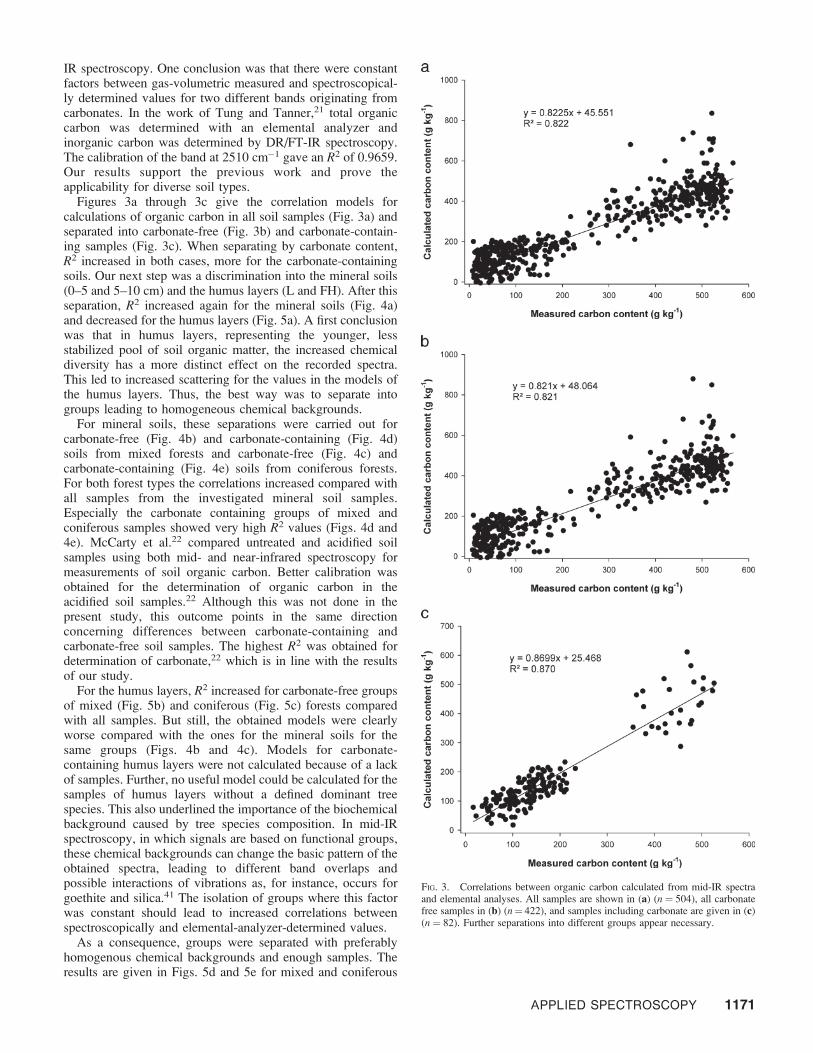
Figures 3a through 3c give the correlation models forcalculations of organic carbon in all soil samples (Fig. 3a) andseparated into carbonate-free (Fig. 3b) and carbonate-contain-ing samples (Fig. 3c). When separating by carbonate content,R2 increased in both cases, more for the carbonate-containingsoils. Our next step was a discrimination into the mineral soils(0–5 and 5–10 cm) and the humus layers (L and FH). After thisseparation, R2 increased again for the mineral soils (Fig. 4a)and decreased for the humus layers (Fig. 5a). A first conclusionwas that in humus layers, representing the younger, lessstabilized pool of soil organic matter, the increased chemicaldiversity has a more distinct effect on the recorded spectra.This led to increased scattering for the values in the models ofthe humus layers. Thus, the best way was to separate intogroups leading to homogeneous chemical backgrounds.
For mineral soils, these separations were carried out forcarbonate-free (Fig. 4b) and carbonate-containing (Fig. 4d)soils from mixed forests and carbonate-free (Fig. 4c) andcarbonate-containing (Fig. 4e) soils from coniferous forests.For both forest types the correlations increased compared withall samples from the investigated mineral soil samples.Especially the carbonate containing groups of mixed andconiferous samples showed very high R2 values (Figs. 4d and4e). McCarty et al.22 compared untreated and acidified soilsamples using both mid- and near-infrared spectroscopy formeasurements of soil organic carbon. Better calibration wasobtained for the determination of organic carbon in theacidified soil samples.22 Although this was not done in thepresent study, this outcome points in the same directionconcerning differences between carbonate-containing andcarbonate-free soil samples. The highest R2 was obtained fordetermination of carbonate,22 which is in line with the resultsof our study.
For the humus layers, R2 increased for carbonate-free groupsof mixed (Fig. 5b) and coniferous (Fig. 5c) forests comparedwith all samples. But still, the obtained models were clearlyworse compared with the ones for the mineral soils for thesame groups (Figs. 4b and 4c). Models for carbonate-containing humus layers were not calculated because of a lackof samples. Further, no useful model could be calculated for thesamples of humus layers without a defined dominant treespecies. This also underlined the importance of the biochemicalbackground caused by tree species composition. In mid-IRspectroscopy, in which signals are based on functional groups,these chemical backgrounds can change the basic pattern of theobtained spectra, leading to different band overlaps andpossible interactions of vibrations as, for instance, occurs forgoethite and silica.41 The isolation of groups where this factorwas constant should lead to increased correlations betweenspectroscopically and elemental-analyzer-determined values.
As a consequence, groups were separated with preferablyhomogenous chemical backgrounds and enough samples. Theresults are given in Figs. 5d and 5e for mixed and coniferous
FIG. 3. Correlations between organic carbon calculated from mid-IR spectraand elemental analyses. All samples are shown in (a) (n¼ 504), all carbonatefree samples in (b) (n¼ 422), and samples including carbonate are given in (c)(n ¼ 82). Further separations into different groups appear necessary.
APPLIED SPECTROSCOPY 1171
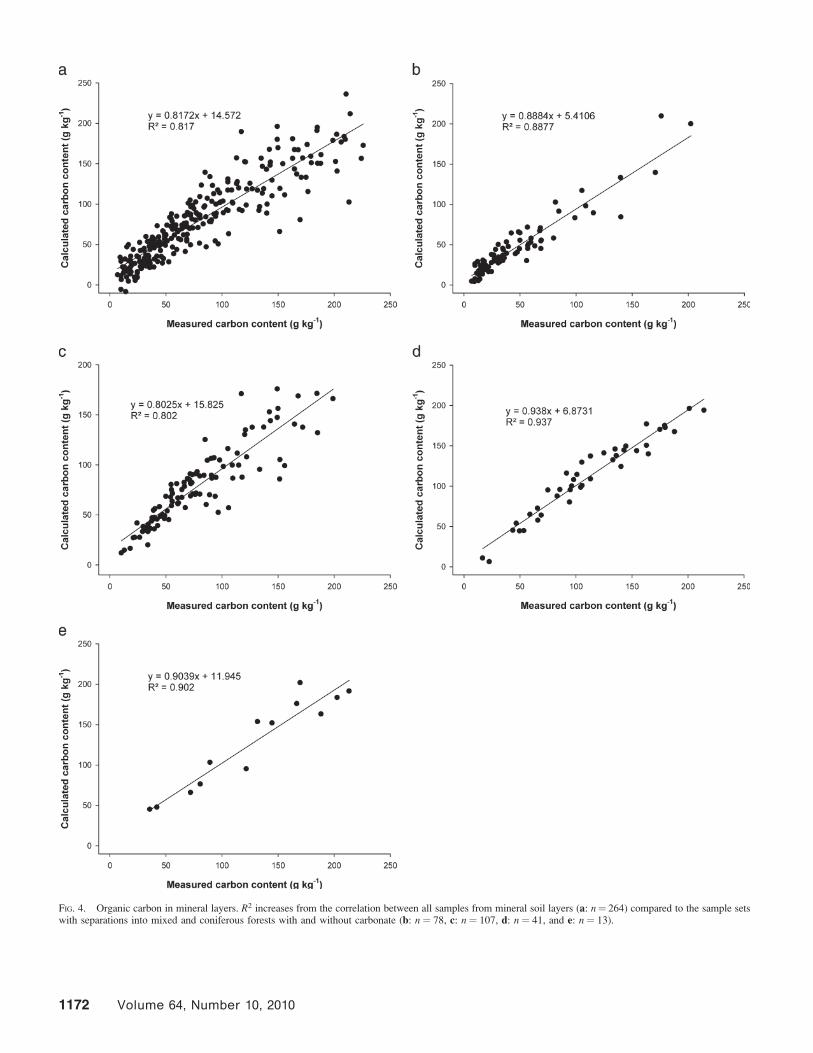
FIG. 4. Organic carbon in mineral layers. R2 increases from the correlation between all samples from mineral soil layers (a: n¼ 264) compared to the sample setswith separations into mixed and coniferous forests with and without carbonate (b: n ¼ 78, c: n ¼ 107, d: n ¼ 41, and e: n¼ 13).
1172 Volume 64, Number 10, 2010
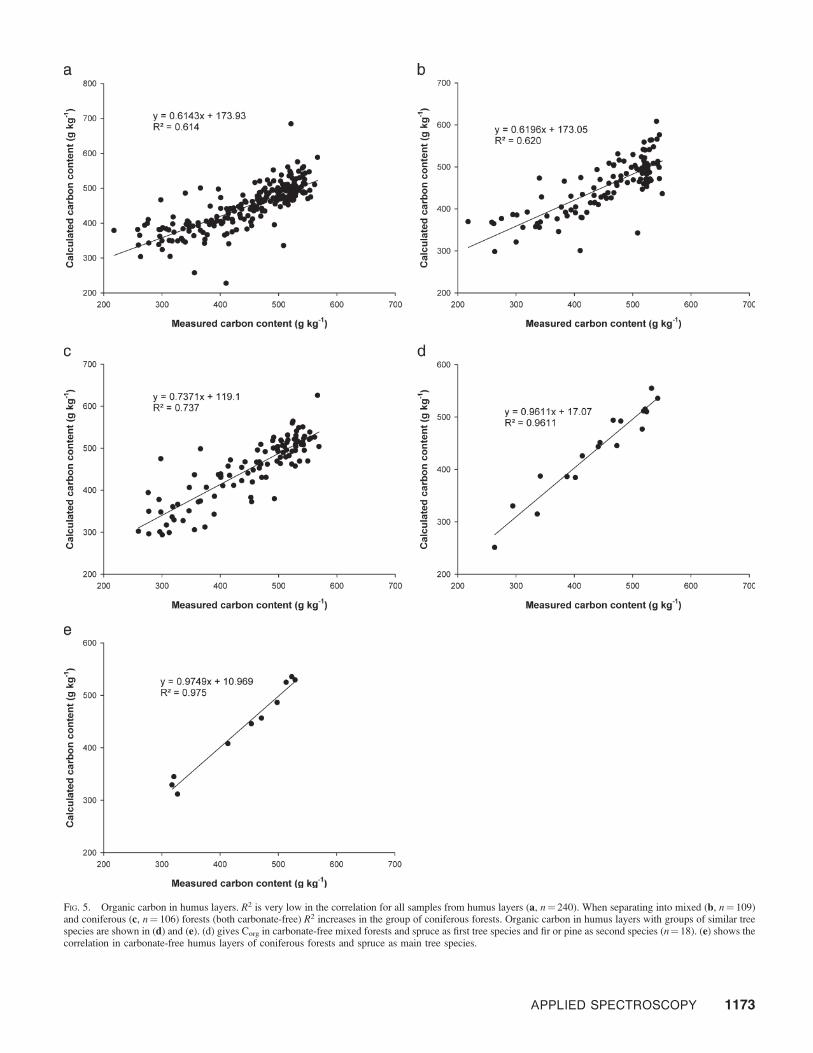
FIG. 5. Organic carbon in humus layers. R2 is very low in the correlation for all samples from humus layers (a, n¼ 240). When separating into mixed (b, n¼ 109)and coniferous (c, n¼ 106) forests (both carbonate-free) R2 increases in the group of coniferous forests. Organic carbon in humus layers with groups of similar treespecies are shown in (d) and (e). (d) gives Corg in carbonate-free mixed forests and spruce as first tree species and fir or pine as second species (n¼18). (e) shows thecorrelation in carbonate-free humus layers of coniferous forests and spruce as main tree species.
APPLIED SPECTROSCOPY 1173
forests, respectively. Samples from sites with specific charac-teristics were chosen, in this case sites with spruce as thedominant species, with a share of 50 to 100%. The secondgroup of chosen tree species contained fir and pine. Otherspecies such as larch and deciduous trees were excluded due totheir different chemical characteristics. The results given inFig. 5d show a very high correlation between organic carbondetermined using the elemental analyzer and using FT-IRspectroscopy for this selection: R2 was 0.961 for a group of 18samples. For spruce as the dominant tree species (50–100%)the very best R2 for a Corg model was calculated (0.975; n¼ 10,Fig. 5e). All models presented here had highly significant (P ,0.001) correlations between conventionally measured and FT-IR determined values. Delwiche and Reeves42 recentlypublished a report about spectral preprocessing in multivariateregression calibrations. One conclusion of their work was thatcalibrations with very low sample numbers together withpreprocessing of spectral data (smoothing, use of derivatives)could be problematic.42 Although none of these spectralpretreatments were carried out and the results of the equationsobtained with the small data sets were consistent with thebigger data sets, further investigations of these groups wouldbe useful to underline the outcome of this study with highernumbers of data points. However, the group separationsperformed had a positive effect on the calculated FT-IR basedmodels and their robustness for determining organic carbon inthe investigated soils.
In the work of Haberhauer et al. relative absorbances wereused and the band at 1510 cm�1 (assignable to aromaticskeletal vibrations, amide II and aromatic C¼C, and aromaticskeletal (lignin), see Table III) correlated with the C/N ratioand the total organic carbon content.15 For both cases thecorrelations were significant, the methodical base was thehumus layers and the Ah layer (uppermost mineral horizon,dark colored by humic substances) of two Austrian (n¼ 3) andone Irish forest soil (n ¼ 5).15 In a next step, the twelve soilprofiles from these spruce forest sites were used to developmodels with partial least squares for determination of theorganic carbon.11 For this model, an R2¼ 0.956 for n¼ 53 wasobtained.11 This result is in line with the separated groupshown in Fig. 5d; the only difference is the isolated calculationof the humus layers. Further, two tropical Brazilian soils wereinvestigated and models calculated for organic carbon (amongothers).10 In this study, R2 was 0.996 with n ¼ 24 and ninebands taken for the calculations of the models; one investigatedsite was forest and the other was pasture developed on the samesoil type (Tropodult).10 In the present study, group separationsled to comparable results (see Figs. 5d and 5e). As aconsequence, the obtained results10 are in accordance withthe outcome of the present study, which proved theapplicability for a further set of forest sites.
In 1995, Janik and Skjemstad calculated carbonate andorganic carbon with partial least squares of DR/FT-IRspectroscopy for a set of Australian soil samples.25 This setconsisted of 120 samples from the Brisbane region, 63 from theTownsville region, and 95 from the Handbook of AustralianSoils.25 The R2 of the model for carbonate was 0.948 (n¼ 38)and that for organic carbon was 0.915 (n¼298).25 A differencewas the assessment of arbitrary functions of the form y ¼ax10bx. The range of organic carbon corresponded to themineral soils of the present study; in their study, R2 wassomewhat higher. After separations into groups of carbonate
contents together with mixed and coniferous forests thecorrelations were in the same range. The work of Bertrand etal.26 included a comparison of neat and KBr diluted samplesfor DR/FT-IR spectroscopy applying partial least squares. Forsamples diluted with KBr, carbonate had an R2 of 0.97 andorganic carbon of 0.66.26 The circumstance of clearly highercorrelations for the carbonate determinations compared withorganic carbon is analogous to the results shown in Figs. 2 and3a, where no group separations were carried out. The lower R2
might be caused by the small concentration range of theorganic carbon (0.3 to 4.7%)26 in the investigated soil samples.Madari et al.27 published a work in 2005 including acomparison of DR mid-infrared and NIR spectra for a selectionof the National Soil Collection of Embrapa Soils (Brazil), intotal 1135 soil samples. In their work, groups were separatedinto carbon contents, soil classes, and soil textures. For totalcarbon, the obtained R2 values varied between 0.948 and 0.810for DR/FT-IR and between 0.712 and 0.952 for NIR.27 Theapplied approach for calculating the model functions wasslightly different. Another difference is the set of temperateforests in the present study where different tree speciescomposition led to separations into mixed and coniferousforests, as well as carbonate contents. However, after the groupdiscriminations the obtained correlations in our study were ofthe same value. Another interesting fact is the successfulapplication of NIR in their study for total carbon determina-tions,27 suggesting that this fast approach could also be used todevelop a method for measurements of carbonate in soils.
Reeves and Smith23 investigated a very diverse set of soilsamples with DR/FT-IR spectroscopy. In this investigation,Ctotal, Ccarbonate, Corg, and 46 major and trace elements wereinvestigated for determination using mid-IR spectroscopy.Suitable calibrations were generally not possible; this wasascribed to the extreme sample diversity of this investigation,such as widely varying parent material, land use, and climate.23
In our study, group separations were able to improvedeterminations of organic carbon by mid-IR spectroscopy.Their comparably high R2 values for the determination ofcarbonate23 are in line with the present study. Nault et al.14
applied PLS to DR/FT-IR spectra for the chemical analysis ofdecomposing foliar litter in Canadian forests. In their work,%N, %C, nonpolar extractables, water soluble extractables, andacid unhydrolyzable residue plus ash were calculated, leadingas well to highly significant correlations.14 For organic carbon,R2 varied between 0.43 and 0.65 for all sites with n ¼ 490.14
The different scientific question in this work (decomposition offoliar litter with time) complicates a comparison. As in ourstudy, the correlation of organic carbon determined bytransmission mid-IR spectroscopy with that determined usingan elemental analyzer in the foliar samples was highlysignificant. The range of organic carbon was between 35 and55%;14 this corresponds with the humus layers of our study.The clearly decreased R2 (compared to mineral soils) is in linewith the results of Fig. 4a. The performed group separationshad the largest effect on this group in our study, leading tocorrelations of 0.961 and 0.975 (Figs. 5d and 5e).
CONCLUSION
(1) Measuring the carbonate content in soils with mid-IRspectroscopy is possible with a model valid for allinvestigated soil samples.
(2) For determination of Corg, the chemical background in soils
1174 Volume 64, Number 10, 2010
appears to be the key parameter. Models can be calculatedfor groups with similar tree species. This effect is clearlystronger in the humus than in the mineral layers.
(3) Models calculated for mineral soils gave higher R2 valuesdue to higher humification of the soil organic matter and, asa consequence, increased resemblance compared to thehumus layers.
(4) Separations into groups as databases for model calculationswere necessary; increasing R2 values were the logicalconsequence. Hence, models for forest soils in temperateclimates should preferably be calculated with groups ofsimilar vegetation and constant carbonate contents.
ACKNOWLEDGMENTS
This work was financed by Federal Ministry of Agriculture, Forestry,Environment and Water Management. We thank Ruth Poll for powdering the 2-mm sieved soil samples and Andrea Fuhrmann for preparing the KBr pellets.We are much obliged to Raffaela Wettl and Eugenie Fink for the gas-volumetric carbonate measurements as well as for the carbon measurements byelemental analyzer of the BioSoil samples. Thanks to Florian Wittstock for hisinputs on the calculations of partial least squares. We further want to thankChristian Amann, Gunther Aust, Reinhold Pany, Hannes Pock, Rainer Reiter,and Christof Schweiger for sampling the huge number of forest sites.
1. D. R. Richter, D. Markewitz, S. E. Trumbore, and C. G. Wells, Nature 400,56 (1999).
2. H. H. Janzen, Agric. Ecosyst. Environ. 104, 399 (2004).3. Y. Malhi, D. D. Baldocchi, and P. G. Jarvis, Plant Cell Environ. 22, 715
(1999).4. J. Leifeld, Eur. J. Soil Sci. 57, 846 (2006).5. J. R. Nault, C. M. Preston, and J. A. T. Trofymow, Soil Sci. 174, 249
(2009).6. J. Pietikainen, R. Hiukka, and H. Fritze, Soil Biol. Biochem. 32, 277
(2000).7. I. Simkovic, P. Dlapa, S. H. Doerr, J. Mataix-Solera, and V. Sasinkova,
Catena 74, 205 (2008).8. R. H. Ellerbrock and H. H. Gerke, Eur. J. Soil Sci. 55, 219 (2004).9. M. E. Gallo, C. L. Lauber, S. E. Cabaniss, M. P. Waldrop, R. L.
Sinsabaugh, and D. R. Zak, Glob. Change Biol. 11, 1514 (2005).10. G. Haberhauer, B. Feigl, M. H. Gerzabek, and C. Cerri, Appl. Spectrosc.
54, 221 (2000).11. G. Haberhauer and M. H. Gerzabek, Vib. Spectrosc. 19, 413 (1999).12. L. J. Janik, J. O. Skjemstad, K. D. Shepherd, and L. R. Spouncer, Aust. J.
Soil Res. 45, 73 (2007).13. G. Haberhauer and M. H. Gerzabek, Trends Appl. Spectrosc. 3, 103
(2001).14. J. R. Nault, C. M. Preston, J. A. T. Trofymow, J. Fyles, L. Kozak, M.
Siltanen, and B. Titus, Soil Sci. 174, 130 (2009).15. G. Haberhauer, B. Rafferty, F. Strebl, and M. H. Gerzabek, Geoderma 83,
331 (1998).16. Austrian Standards Institute, ONORM L 1084, ‘‘Chemical Analyses of
Soils: Determination of carbonate’’ (Osterreichisches Normungsinstitut,
Vienna, April1, 1999); see also H.-P. Blume, B. Deller, R. Leschber, A.Paetz, S. Schmidt, and B. M. Wilke, Handbuch der Bodenuntersuchung(Wiley-VCH, Weinheim, 2000).
17. C. Santın, X. L. Otero, S. Fernandez, and M. Gonzalez-Perez, M. A.Alvarez, Sci. Total Environ. 378, 138 (2007).
18. L. A. Sherrod, G. Dunn, G. A. Peterson, and R. L. Kolberg, Soil Sci. Soc.Am. J. 66, 299 (2002).
19. A. F. Wright and J. S. Bailey, Commun. Soil Sci. Plant Anal. 32, 3243(2001).
20. D. Harris, W. R. Horwath, and C. Van Kessel, Soil Sci. Soc. Am. J. 65,1853 (2001).
21. J. W. T. Tung and P. A. Tanner, Mar. Chem. 80, 161 (2003).22. G. W. McCarty, J. B. Reeves, V. B. Reeves, R. F. Follett, and J. M.
Kimble, Soil Sci. Soc. Am. J. 66, 640 (2002).23. J. B. Reeves and D. B. Smith, Appl. Geochem. 24, 1472 (2009).24. M. Tatzber, M. Stemmer, H. Spiegel, C. Katzlberger, G. Haberhauer, and
M. H. Gerzabek, Environ. Chem. Lett. 5, 9 (2007).25. L. J. Janik and J. O. Skjemstad, Aust. J. Soil Res. 33, 637 (1995).
26. I. Bertrand, L. J. Janik, R. E. Holloway, R. D. Armstrong, and M. J.McLaughlin, Aust. J. Soil Res. 40, 1339 (2002).
27. B. E. Madari, J. B. Reeves, M. R. Coelho, P. L. O. A. Machado, H. De-Polli, R. M. Coelho, V. M. Benites, L. F. Souza, and G. W. McCarthy,Spectrosc. Lett. 38, 721 (2005).
28. http://biosoil.jrc.ec.europa.eu/.29. Austrian Standards Institute, ONORM L 1080, ‘‘Chemical Analyses of
Soils: Determination of Organic Carbon by Dry Combustion’’ (Osterrei-chisches Normungsinstitut, Vienna, April1, 1999); see also A. L. Page, R.H. Miller, and D. R. Keeney, Methods of Soil Analysis, Part 2 (AmericanSociety of Agronomy, Madison, WI, 1982), 2nd ed.
30. Austrian Standards Institute, ONORM L 1085, ‘‘Chemical Analyses ofSoils: Extraction of Elements with Aqua Regia or with a Mixture of Nitricand Perchloric Acid’’ (Osterreichisches Normungsinstitut, Vienna, April1,1999); see also A. L. Page, R. H. Miller, and D. R. Keeney, Methods ofSoil Analysis, Part 2 (American Society of Agronomy, Madison, WI,1982), 2nd ed.
31. M. Hesse, H. Meier, and B. Zeeh, Spektroskopische Methoden in derorganischen Chemie (Thieme, Stuttgart, 2005).
32. P. Capriel, T. Beck, H. Borchert, J. Gronholz, and G. Zachmann, Soil Biol.Biochem. 27, 1453 (1995).
33. M. H. Gerzabek, R. S. Antil, I. Kogel-Knabner, H. Knicker, H. Kirchmann,and G. Haberhauer, Eur. J. Soil Sci. 57, 485 (2006).
34. R. Spaccini, A. Piccolo, G. Haberhauer, M. Stemmer, and M. H. Gerzabek,Geoderma 99, 245 (2001).
35. E. Smidt and K. Meissl, Waste Manage. 27, 268 (2007).
36. M. Schnitzer and S. U. Khan, Soil Organic Matter (Elsevier ScientificPublishing, Amsterdam, 1978).
37. C. N. R. Rao, Chemical Applications of Infrared Spectroscopy (AcademicPress, New York, London, 1963).
38. R. S. Antil, M. H. Gerzabek, G. Haberhauer, and G. Eder, J. Plant Nutr.Soil Sci. 168, 108 (2005).
39. N. Senesi, V. D’Orazio, and G. Ricca, Geoderma 116, 325 (2003).
40. M. Tatzber, M. Stemmer, H. Spiegel, C. Katzlberger, and G. Haberhauer,A. Mentler , and M. H. Gerzabek, J. Plant Nutr. Soil Sci. 170, 522 (2007).
41. Y. Xu and L. Axe, J. Colloid Interface Sci. 282, 11 (2005).
42. S. R. Delwiche and J. B. Reeves III, Appl. Spectrosc. 64, 73 (2010).
APPLIED SPECTROSCOPY 1175