Embed Size (px)
Citation preview
WL-TR-91-4o86 AD-A248 883
DETERMINATION OF MINIMUlM AIHERENDTHICKNESS FOR CLIMBING DRUM ANDFLOATING ROLLE ADHESIVE TESTS
T.J. WhitneyD.R. Askins
University of DaytonResearch Institute300 College Park AvenueDayton, Ohio 45469-0130
January 1992
Interim Report for Period November 1988 to October 1990
Approved for public release; distribution unlimited. DTIQSAPR2 9~
MATEIAIS DIRECTORATEWRIGHT LABORATORYAMR FORCE SYSTM COW•ND
WRIG(T-PATTERSON AIR FORCE BASE, OHIO92 10092
9p2 4 20 111N1
NOTICE
When Government drawings, specifications, or other data are used forany purpose other than in connection with a definitely Government-relatedprocurement, the United States Government incurs no responsibility or anyobligation whatsoever. The fact that the government may have formulated or inany way supplied the said drawings, specifications, or other data, is not to beregarded by implication, or otherwise in any manner construed, as licensing theholder, or any other person or corporation; or as conveying any rights orpermission to manufacture, use, or sell any patented invention that may in anyway be related thereto. "
This report is releasable to the National Technical Information Service(NTIS). At NTIS, it will be available to the general public, including foreignnations.
This technical report has been reviewed and is approved for publication.
FRANK J. FE EK THEODORE J. RE T, ChiefProject Engineer Materials Engineering BranchMaterials Engineering Br Systems Support DivisionSysrems bupport vivislun Materials DirectorateIHaterials Directorate
THOMAS D. COOPERChiefSystems Support DivisionMaterials Directorate
If your address has changed, if you wish to be removed from our mailinglist, or if the addressee is no longer employed by your organization please notifyWL/MLSE, WPAFB, OH 45433-6533 to help us maintain a current mailinglist.
Copies of this report should not be returned unless return is required by securityconsiderations, contractual obligations, or notice on a specific document.
UNCLASSIFIEDSECURITY CLASSIFICATION OF THiS PAGE
REPORT DOCUMENTATION PAGE No0670-'o0188l. REPORT SECURITY CLASSIFICATION Ib RESTRICTIVE MARKINGS
UNCLASSIFIED2a. SECURITY CLASSIFICATION AUTHORITY 3. OISTRIBUTIONIAVAILABIUTY OF REPORT
Approved for public release; distribution2b, DECIASSIFICATION/•DOWNGRADING SCHEDULE urn limited.
4 PERFORMING ORGANIZATION REPORT NUMBER(S) S. MONITORING ORGANIATION REPORT NUMBER(S)
UDR-TR-91-35 WL-TR-9l-4086
6& NAME OF PERFORMING ORGANIZATION 16b OFFICE SYMBOL 17. NAME OF MONITOING ORGANIZATIONUniversity of Daytoni #A*kb !) Materials Directorate (WL/MLSE)Research Institute Wright Laboratory
6C. ADDRESS (City, State, and ZIP Code) 7o. ADDRESS (ft, State, and ZIP Code)300 College Park AvenueDayton, Ohio 45469-0130 Wright-Patterson AFB, Ohio 45433-6533
Ba. NAME OF FUNDINGISPONSORING l8b OFFICE SYMBOL 9 PROCUJiMENT INSTRUMENT IDENTIFICATION NUMBERORGANIZATION (If appika)Materials Directorate WL/MLSE F33615-85-C-5094
St. ADDRESS(City, $Stt., end ZIPCod) 10 SOURCE OF FUNDING NUMBERS
Wright-Patterson AFB, Ohio 45433-6533 PROGRAM I PROJECT ITASK iWORK UNITELEMENT NO. NO. NO rACcFSSKON NO.
, 69120 2418 04 | 4111. TITLE (Andude Surity h,•mfkaUon)
DETERMINATION OF MINIMUM ADHEREND THICKNESS FO1' (rIMBING DRUM AND FLOATING ROLLERADHESIVE PEEL TESTS
12. PERSONAL AUTHOR(S)T. J. Whitney and 0. R. Askins
13a. TYPE OF REPORT 13b. TIME COVERED 14. DATE OF REPORT (YeaarAontieDy) 11S. PAGE COUNTInterim FROM o 88 TOQQL29 1992 January 70
1S. SUPPLEMENTARY NOTATION
17. COSATI CODES j18. SUBJECT TERMS (Cwo v n inev OlfSWS f nmhisoy and Idniib lc ub.,)n I GROUP SUB-GROUP Climbing Drum Peel Test, Floating Roller Peel Test,adhesive, peel strength, cleavage stress, flexibleadherend, adherend thickness, deformation energy
ne +ltmo, ng urum Fee fEStIM S1 7W -76 and m Floating Roller Peel Test (ASTM D3167-76)are adhesive joint tests used to determine adhesive strength in honeycomb core tacticalshelter panels. The failure modes and geometries of these tests tend to differ fromspecimen to specimen, however, depending on the ratio of adhesive strength to flexibleadherend stiffness. This inconsistency generates peel strength data which cannot bedirectly compared. Although the problem can be solved by making the flexible adherend verythick so that all failure geometries are alike, the result is a loss in precision in thetest results. An analysis of these test methods was performed in order to specify theminimum flexible adherend thicknesses which produce consistent failures. Experimentsconfirmed these predictions. Parametric studies and experiments indicate that, among theproperties examined, glue line thickness and yield strength of the adherend most affect theminimum adherend thickness which can be used. A first order analysis was also conducted inorder to "correct" the results of peel tests which do not fail in a "consistent" manner(i.e.. the adherends detach from the test fixture rollers).
20. DISTRBUTIONIAVAJLASIUTY OF ABSTRACT 121. A2STRACT SECURITY CLASSIFICATION!iUNCLASIFIED1UNUMITED E3 SAME AS RPT. E OTIC USERS I UNCLASSIFIED
22a. NAME OF RESPONSIBLE INDMIDUA.L 22b TELEPHONE (fIdude Area Code) I 22 OFFICE SYMBOLuFrank Fechek 5(13) 255-7484 I MLSE
DD Form 1473, JUN 86 ftevlowedi•o aorbe . 5 ITY IF TIOECUR, CL N OF THI PAGE
UNCLASSIFIED
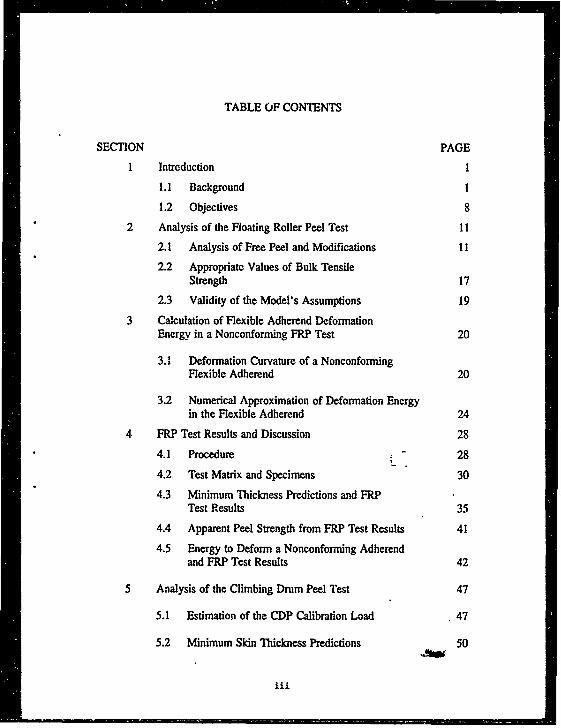
TABLE OF CONTENTS
SECTION PAGE
I Introduction 1
1.1 Background 1
1.2 Objectives 8
2 Analysis of the Floating Roller Peel Test 11
2.1 Analysis of Free Peel and Modifications I I
2.2 Appropriate Values of Bulk TensileStrength 17
2.3 Validity of the Model's Assumptions 19
3 Calculation of Flexible Adherend DeformationEnergy in a Nonconforming FRP Test 20
3.1 Deformation Curvature of a NonconformingFlexible Adherend 20
3.2 Numerical Approximation of Deformation Energyin the Flexible Adherend 24
4 FRP Test Results and Discussion 28
4.1 Procedure 28
4.2 Test Matrix and Specimens 30
4.3 Minimum Thickness Predictions and FRPTest Results 35
4.4 Apparent Peel Strength from FRP Test Results 41
4.5 Energy to Deform a Nonconforming Adherendand FRP Test Results 42
5 Analysis of the Climbing Drum Peel Test 47
5.1 Estimation of the CDP Calibration Load 47
5.2 Minimum Skin Thickness Predictions 50
iii.
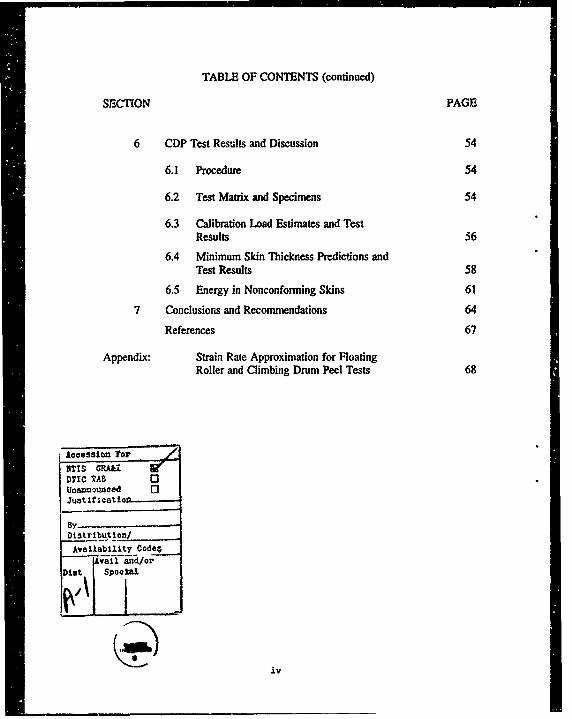
TABLE OF CONTENTS (continued)
SECTION PAGE
6 CDP Test Results and Discussion 54
6.1 Procedure 54
6.2 Test Matrix and Specimens 54
6.3 Calibration Load Estimates and TestResults 56
6.4 Minimum Skin Thickness Predictions andTest Results 58
6.5 Energy in Nonconforming Skins 61
7 Conclusions and Recommendations 64
References 67
Appendix: Strain Rate Approximation for FloatingRoller and Climbing Drum Peel Tests 68
loesslon 7o"
XTIS GRA&IDTIC TAB 0Unannounoed 0JustifIcatio-
ByDistribution/Avallabllity Code6
"vall and/or
Dist special
iv
LIST OF ILLUSTRATIONS
FIGURE PAGE
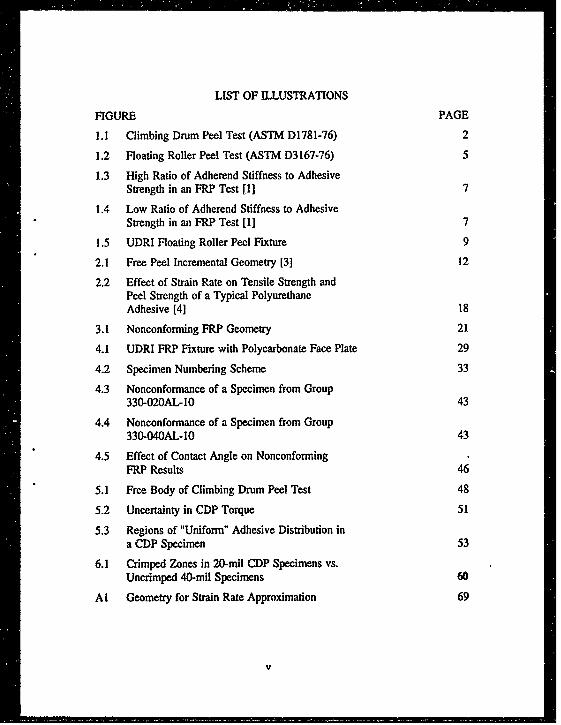
1.1 Climbing Drum Peel Test (ASTM D1781-76) 2
1.2 Floating Roller Peel Test (ASTM D3167-76) 5
1.3 High Ratio of Adherend Stiffness to AdhesiveStrength in an FRP Test [1] 7
1.4 Low Ratio of Adherend Stiffness to AdhesiveStrength in an FRP Test [1] 7
1.5 UDRI Floating Roller Peel Fixture 9
2.1 Free Peel Incremental Geometry [3] 12
2.2 Effect of Strain Rate on Tensile Strength andPeel Strength of a Typical PolyurethaneAdhesive [4] 18
3.1 Nonconforming FRP Geometry 21
4.1 UDRI FRP Fixture with Polycarbonate Face Plate 29
4.2 Specimen Numbering Scheme 33
4.3 Nonconformance of a Specimen from Group330-020AL-I0 43
4.4 Nonconformance of a Specimen from Group330-040AL-I0 43
4.5 Effect of Contact Angle on NonconformingFRP Results 46
5.1 Free Body of Climbing Drum Peel Test 48
5.2 Uncertainty in CDP Torque 51
5.3 Regions of "Uniform" Adhesive Distribution ina CDP Specimen 53
6.1 Crimped Zones in 20-mil CDP Specimens vs.Uncrimped 40-mil Specimens 60
Al Geometry for Strain Rate Approximation 69
V
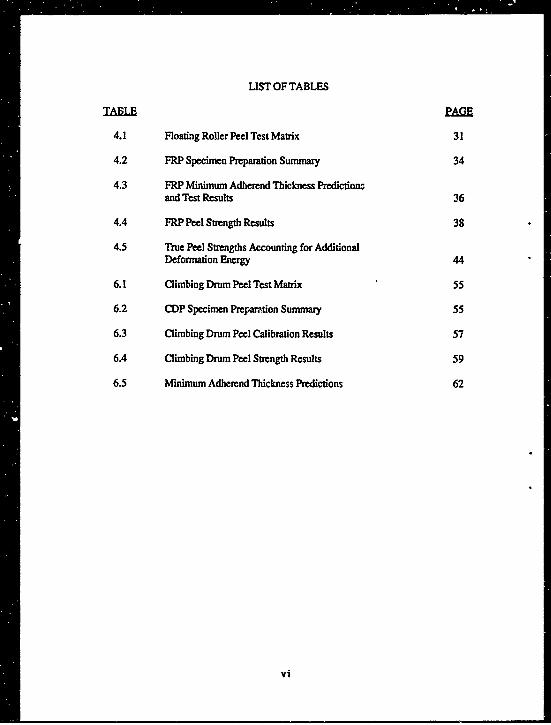
LIST OF TABLES
TABLE
4.1 Floating Roller Peel Test Matrix 31
4.2 FRP Specimen Preparation Summary 34
4.3 FRP Mininum Adherend Thickness Predictionzand Test Results 36
4.4 FRP Peel Strength Results 38
4.5 True Peel Strengths Accounting for AdditionalDeformation Energy 44
6.1 Climbing Drum Peel Test Matrix 55
6.2 CDP Specimen Preparation Summary 55
6.3 Climbing Drum Peel Calibration Results 57
6.4 Climbing Drum Peel Strength Results 59
6.5 Minimum Adherend Thickness Predictions 62
vi
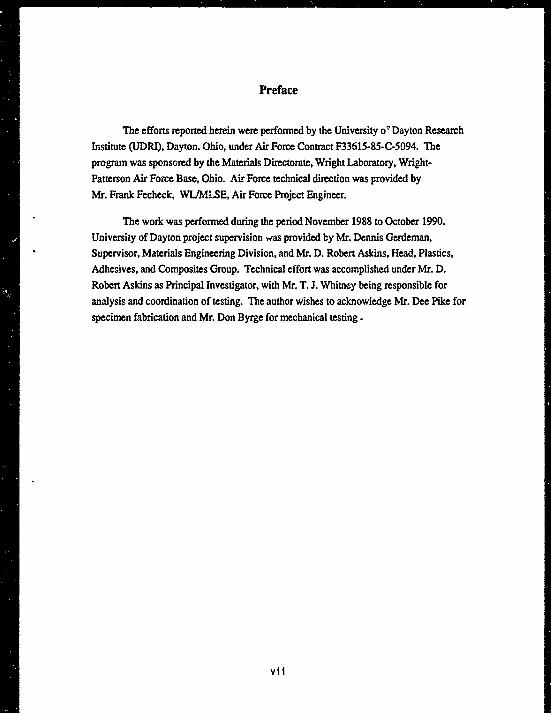
Preface
The efforts reported herein were performed by the University o- Dayton ResearchInstitute (UDRI), Dayton. Ohio, under Air Force Contract F33615-85-C-5094. Theprogram was sponsored by the Materials Directorate, Wright Laboratory, Wright-Patterson Air Force Base, Ohio. Air Force technical direction was provided byMr. Frank Fecheck, WL/MLSE, Air Force Project Engineer.
The work was performed during the period November 1988 to October 1990.University of Dayton project supervision was provided by Mr. Dennis Gerdeman,Supervisor, Materials Engineering Division, and Mr. D. Robert Askins, Head, Plastics,Adhesives, and Composites Group. Technical effort was accomplished under Mr. D.Robert Askins as Principal Investigator, with Mr. T. J. Whitney being responsible foranalysis and coordination of testing. The author wishes to acknowledge Mr. Dee Pike forspecimen fabrication and Mr. Don Byrge for mechanical testing.
vii
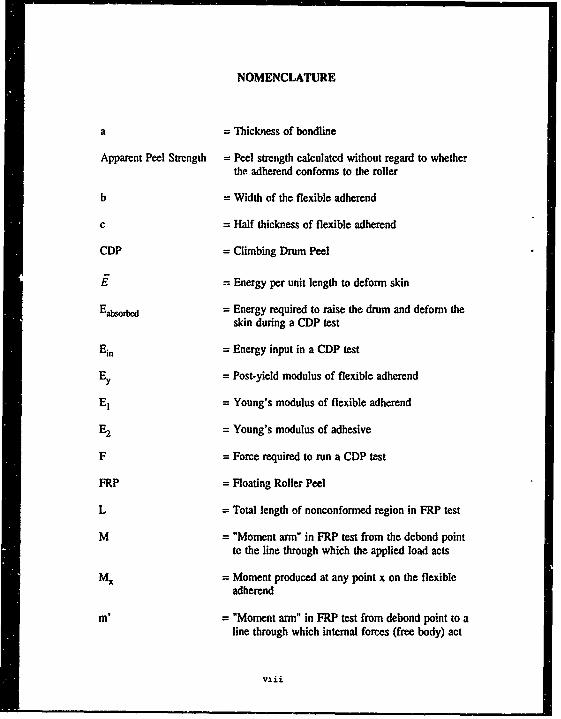
NOMENCLATURE
a = Thickness of bondline
Apparent Peel Strength = Peel strength calculated without regard to whetherthe adherend conforms to the roller
b = Width of the flexible adherend
c = Half thickness of flexible adherend
CDP = Climbing Drum Peel
i = Energy per unit length to deform skin
Eabsorbcd = Energy required to raise the drum and deform theskin during a CDP test
Ein = Energy input in a CDP test
Ey = Post-yield modulus of flexible adherend
E, = Young's modulus of flexible adherend
E2 = Young's modulus of adhesive
F = Force required to run a CDP test
FRP = Floating Roller Peel
L = Total length of nonconformed region in FRP test
M = "Moment arm" in FRP test from the debond pointto the line through which the applied load acts
M., = Moment produced at any point x on the flexibleadherend
m' = "Moment arm" in FRP test from debond point to aline through which internal forces (free body) act
viii
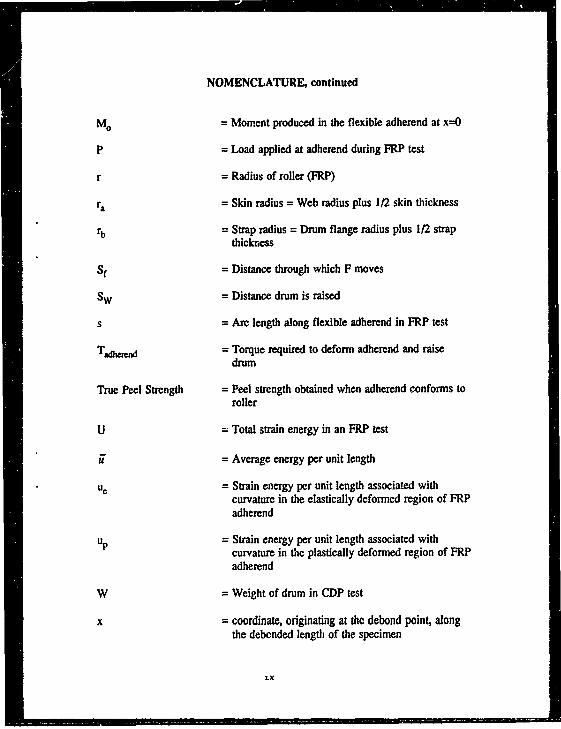
NOMENCLATURE, continued
M. = Moment produced in the flexible adherend at x=O
P = Load applied at adherend during FRP test
r = Radius of roller (FRP)
ra = Skin radius = Web radius plus 1/2 skin thickness
rb = Strap radius = Drum flange radius plus 1/2 strapthickness
Sf. = Distance through which F moves
Sw = Distance drum is raised
s = Arc length along flexible adherend in FRP test
Tadh..d = Torque required to deform adherend and raisedrum
True Peel Strength = Peel strength obtained when adherend conforms toroller
U = Total strain energy in an FRP test
W = Average energy per unit length
ue = Strain energy per unit length associated withcurvature in the elastically deformed region of FRPadherend
UP = Strain energy per unit length associated withcurvature in the plastically deformed region of FRPadherend
W = Weight of drum in CDP test
x = coordinate, originating at the debond point, alongthe debonded length of the specimen
Ix
NOMENCLATURE, continued
y = deflection of flexible adherend still bonded to therigid adherend
Ymax = Maximum deflection of unbonded adherend
8 3 aF . A convenient grouping of parameters
e = Strain in adhesive layer
0 = Dummy variable which represents co in a free bodydiagram of the adherend
Ic = Curvature of flexible adherend
1c = Curvature of FRP flexible adherend which deformselastically only
Sp = Curvature of FRP flexible adherend which deformsplastically
on= = Maximum cleavage stress in adhesive layer
130 = Tensile strength of bulk adhesive
Gy = Yield strength of flexible adherend
(o = Coordinate in FRP test specifying the angle from aline tangent to the point where a nonconformingflexible adherend reattaches to the roller, to a linetangent to a given point on the flexible adherend
= Maximum value of wo, occurring at the debondpoint
(0c = Angle at which flexible adherend begins toplastically deform in FRP test
X
NOMENCLATURE, concluded
Appendix
c Flexible adherend thickness
E = Young's modulus of adhesive
h Instantaneous thickness of adhesive layer
h. = Initial thickness of adhesive layer
R = Radius of roller (or drum)
t =time
u = Displacement in adhesive layer
V = Velocity of the peel test (= velocity of adherendmidplane)
VAD = Velocity of the adhesive (= velocity of theadhesive adherend interface)
e = Strain in adhesive layer
a- = Strain rate in adhesive layer
eu = Strain to failure of adhesive
0 = Angle coordinate formed by two radii of the roller.Origin is at the debond point
11 = Tensile strength of adhesive
Xi
SECTION 1
INTRODUCTION
Many transportable tactical shelters used by the various military services
for a multitude of applications consist of sandwich construction in the walls,
floer, and ioof. One of the important considerations for this type construction is
the strength and durability of the adhesive bond between the sandwich skins and
core.
1.1 Background
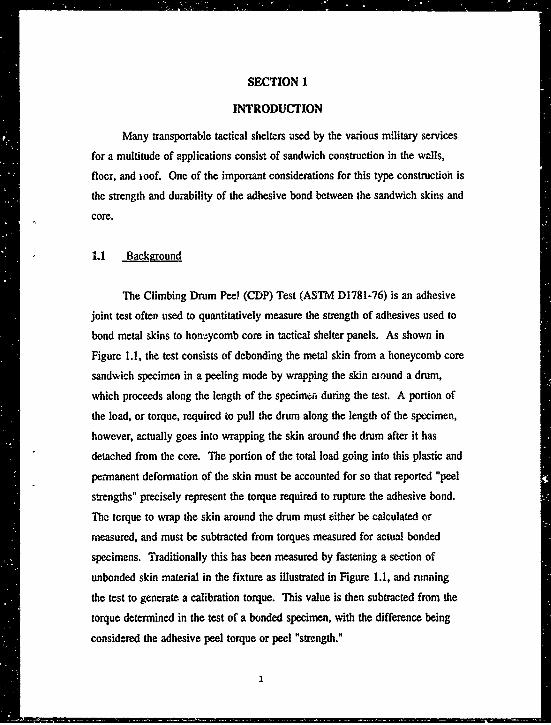
The Climbing Drum Peel (CDP) Test (ASTM D1781-76) is an adhesive
joint test often used to quantitatively measure the strength of adhesives used to
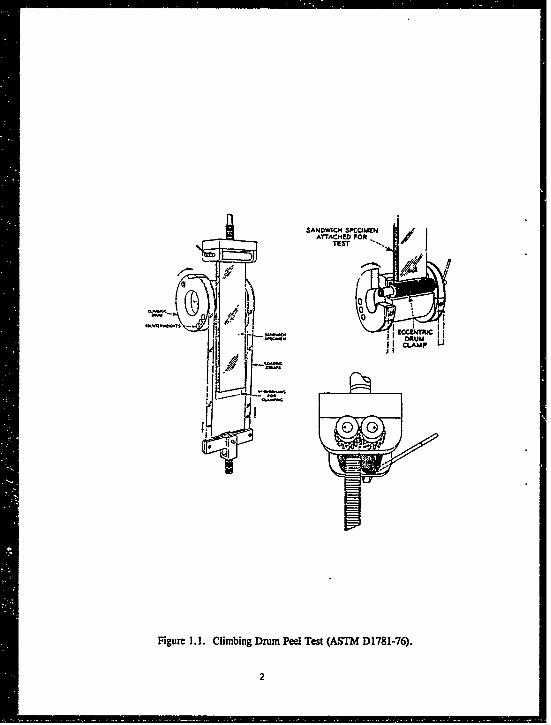
bond metal skins to honeycomb core in tactical shelter panels. As shown in
Figure 1.1, the test consists of debonding the metal skin from a honeycomb core
sandwich specimen in a peeling mode by wrapping the skin aound a drum,
which proceeds along the length of the specimen during the test. A portion of
the load, or torque, required to pull the drum along the length of the specimen,
however, actually goes into wrapping the skin around the drum after it has
detached from the core. The portion of the total load going into this plastic and
permanent deformation of the skin must be accounted for so that reported "peel
strengths" precisely represent the torque required to rupture the adhesive bond.
The torque to wrap the skin around the drum must either be calculated or
measured, and must be subtracted from torques measured for actual bonded
specimens. Traditionally this has been measured by fastening a section of
unbonded skin material in the fixture as illustrated in Figure 1.1, and running
the test to generate a calibration torque. This value is then subtracted from the
torque determined in the test of a bonded specimen, with the difference being
considered the adhesive peel torque or peel "strength."
l3
SANDWICH SICOMENA1rACKEO FOR
TEST
40
IJ~iii 4,.=MJi
Figure I.1I. Climbing Drum Peel Test (ASTM D1781-76).
2
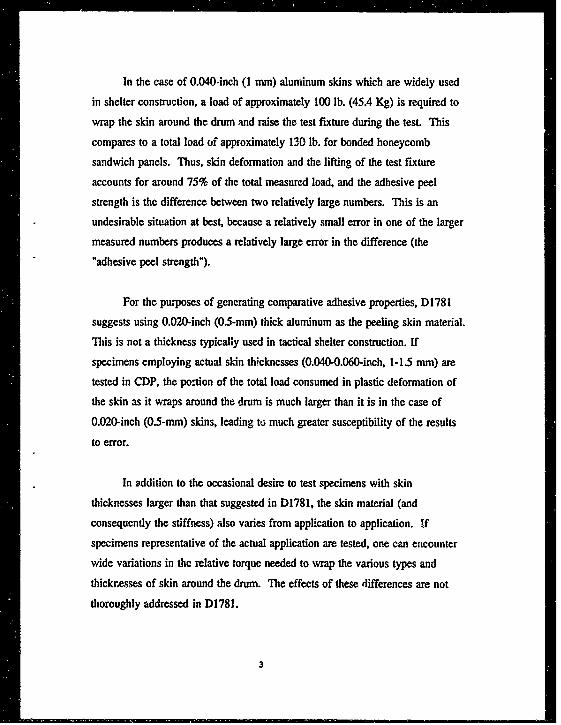
In the case of 0.040-inch (1 mm) aluminum skins which are widely used
in shelter construction, a load of approximately 100 lb. (45.4 Kg) is required to
wrap the skin around the drum and raise the test fixture during the test. This
compares to a total load of approximately 130 lb. for bonded honeycomb
sandwich panels. Thus, skin deformation and the lifting of the test fixture
accounts for around 75% of the total measured load, and the adhesive peel
strength is the difference between two relatively large numbers. This is an
undesirable situation at best, because a relatively small error in one of the larger
measured numbers produces a relatively large error in the difference (the
"adhesive peel strength").
For the purposes of generating comparative adhesive properties, D1781
suggests using 0.020-inch (0.5-mm) thick aluminum as the peeling skin material.
This is not a thickness typically used in tactical shelter construction. If
specimens employing actual skin thicknesses (0.040-0.060-inch, 1-1.5 mm) are
tested in CDP, the po-tion of the total load consumed in plastic deformation of
the skin as it wraps around the drum is much larger than it is in the case of
0.020-inch (0.5-mm) skins, leading to much greater susceptibility of the results
to error.
In addition to the occasional desire to test specimens with skin
thicknesses larger than that suggested in D1781, the skin material (and
consequently the stiffness) also varies from application to application. If
specimens representative of the actual application are tested, one can encounter
wide variations in the relative torque needed to wrap the various types and
thickresses of skin around the drum. The effects of these differences are not
thoroughly addressed in D1781.
3
Reducing skin thickness to reduce potential error also has drawbacks. A
skin of insufficient thickness, as it bends around a drum, would not have
sufficient stiffness to transfer the load required to fracture the adhesive while
remaining conformed to the drum surface. In order to develop the required
load, it would hay-- 'c bend to a greater curvature than that of the drum. This
requires the skin to detach slightly from the drum surface which, in turn, would
generate higher torques. The "peel strength" computed from such a test would
be artificially high, because more torque is required to bend the adherend to this
greater curvature than in the calibration specimen. Whether or not this
detachment occurs would be a function of the relative strength of the adhesive
and the stiffness or rigidity of the skin.
In order to investigate this phenomena, it is instructive to consider a similar
test for which the behavior is readily apparent. The Floating Roller Peel (FRP)
test (ASTM D3167-76) is another adhesive test which is affected by the
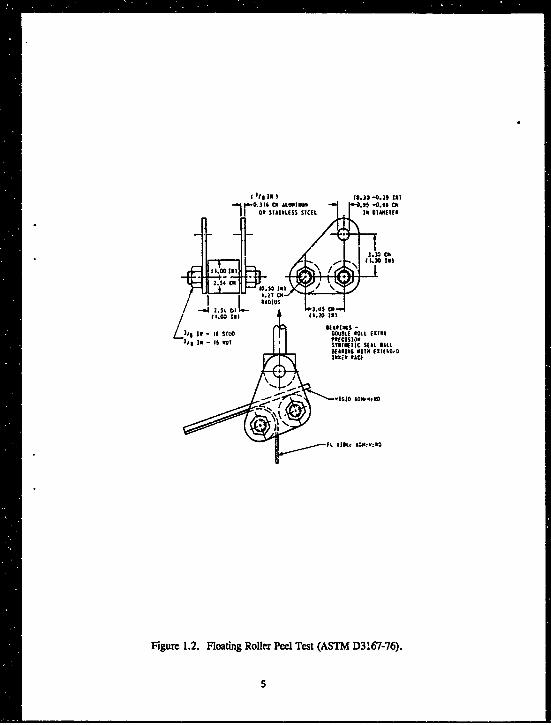
thickness (or rigidity) of a flexible "skin." As Figure 1.2 shows, the test
consists of pulling a bonded sample, consisting of rigid and flexible "adherends"
bonded together by a thin layer of adhesive, through a test fixture containing
rollers. The flexible adherend is peeled away from the rigid adherend and
wrapped around one of the rollers in a manner somewhat analogous to the
situation in a CDP test. Pulling the specimen through the fixture causes an
initial crack in the bond to propagate, and the specimen to debond. The force
required to fracture the bondline and wrap the flexible adherend around the
roller is taken as the "peel strength" of the adhesive. Although not suggested
by ASTM D3167-76, the energy to deform the adherend should be taken into
account to correctly calculate "peel strength." This is because the adherend
deforms plastically as it bends to the radius of the roller. All of the energy is
not recovered as the adherend straightens out. The result of failing to account
4
I is is 1 I9.38 -0.31 III1e r.CP.3 0 6 &LIIIIA6~e U .,, -0.,, 016
1.30 11
0 o.003 IN
La i 1u 6 SIU ow,330o IEx
Ii Im -S IIU 15311STINE3€C SEAL SILL14*1104• 633 6l10
-1303 ADW.6t03
It. 111L, ADW~.:.*
Figure 1.2. Floating Roller Peel Test (ASTM D3167-76).
5
for the energy required to plastically wrap the flexible adherend around the
roller is that the reported adhesive peel strengths are artificially high.
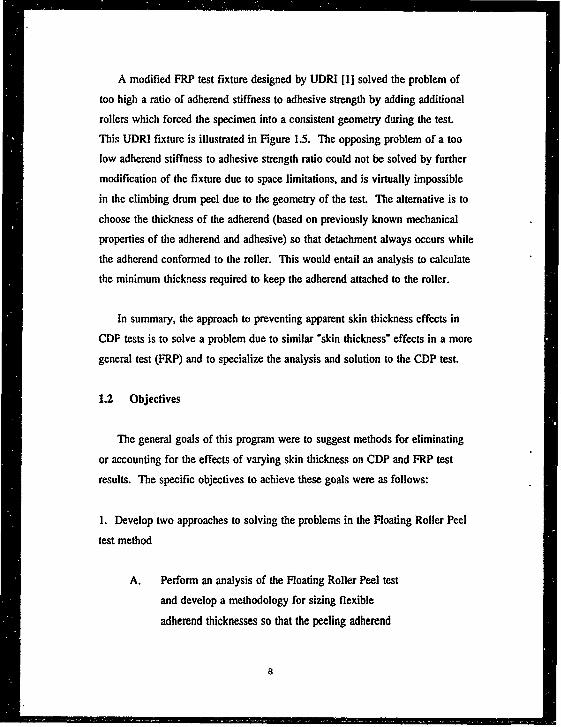
Extreme ratios (high or low) of the flexible adherend stiffness to the
adhesive strength cause the FRP test to progress incorrectly (Figures 1.3 and
1.4) since the ratio significantly affects the point at which the adherend detaches
from the rigid member and the degree of permanent curvature imposed upon the
adherend (a low ratio is analogous to the problem of the adherend in a CDP
pulling away from the drum). ASTM D3167-76 states that the angle of peel
must be consistent from specimen to specimen if peel strengths are to be
compared. This requirement stems from the possibility that should the adherend
not confonn to the roller as fracture occurs, or if the fracture occurs at various
points from test to test, the peel strengths measured may represent different test
geometries and different modes of fracture. Even if the fracture modes are
similar, the relative energy required for adherend deformation around the roller
is either lower or higher (depending on whether the behavior is that illustrated in
Figures 1.3 and 1.4, respectively) than that required during a test in which the
adherend conforms to the roller. An adherend deformation energy value
obtained through testing of an unbonded adherend or through available
calculation techniques [1l is valid only for an adherend which conforms to the
roller. Subtracting this value from the results of actual FRP tests will result in
validly corrected peel strengths only if testing of the bonded specimens results
in the flexible adherend conforming perfectly to the roller. If, instead, the
flexible adherend behavior is as illustrated in either Figures 1.3 or 1.4, the
subtraction of the adherend deformation load from the bonded sample load will
produce adhesive peel strength values that are artificially lower or higher,
respectively, than the true case.
6
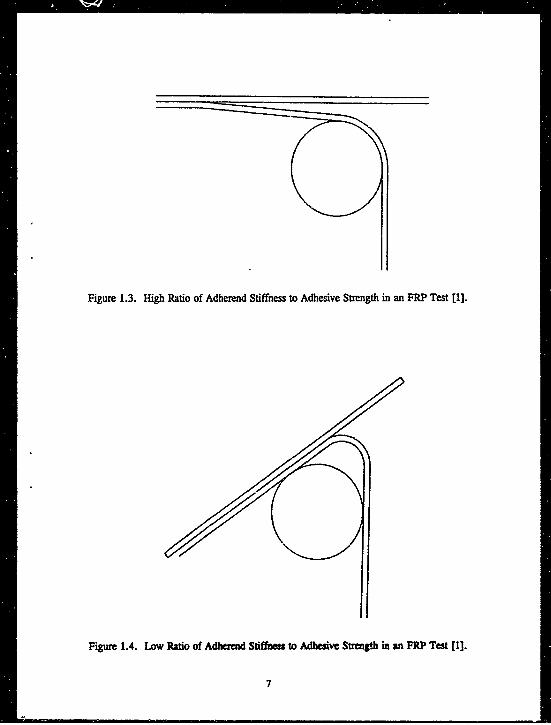
Figure 1.3. High Ratio of Adherend Stiffliess to Adhesive Strength in an FRP Test [1].
Figure 1.4. Low Ratio of Adherend Stiffness to Adhesive Strength in an FRP Test [1].
7
A modified FRP test fixture designed by UDRI [11 solved the problem of
too high a ratio of adherend stiffness to adhesive strength by adding additional
rollers which forced the specimen into a consistent geometry during the test.
This UDRI fixture is illustrated in Figure 1.5. The opposing problem of a too
low adherend stiffness to adhesive strength ratio could not be solved by further
modification of the fixture due to space limitations, and is virtually impossible
in the climbing drum peel due to the geometry of the test. The alternative is to
choose the thickness of the adherend (based on previously known mechanical
properties of the adherend and adhesive) so that detachment always occurs while
the adherend conformed to the roller. This would entail an analysis to calculate
the minimum thickness required to keep the adherend attached to the roller.
In summary, the approach to preventing apparent skin thickness effects in
CDP tests is to solve a problem due to similar "skin thickness" effects in a more
general test (FRP) and to specialize the analysis and solution to the CDP test.
1.2 Objectives
The general goals of this program were to suggest methods for eliminating
or accounting for the effects of varying skin thickness on CDP and FRP test
results. T'he specific objectives to achieve these goals were as follows:
1. Develop two approaches to solving the problems in the Floating Roller Peel
test method
A. Perform an analysis of the Floating Roller Peel test
and develop a methodology for sizing flexible
adherend thicknesses so that the peeling adherend
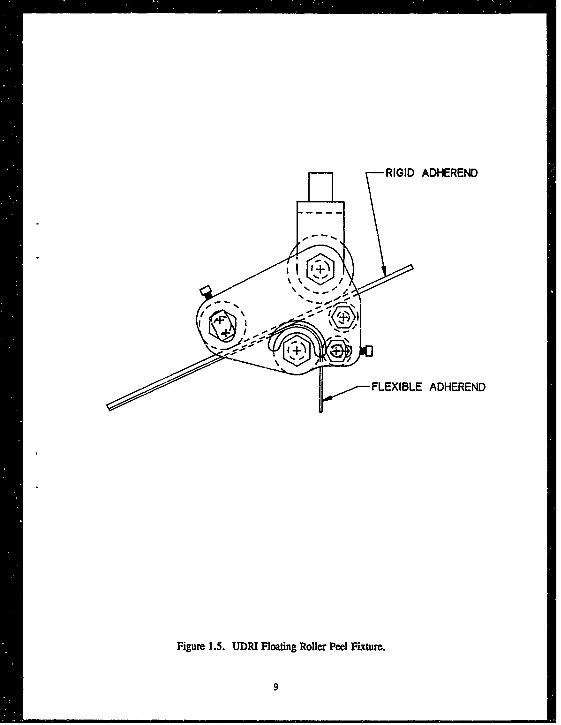
RIGID ADHEREND
\-_-,, " -J -.. I|| l
FLEXIBLE ADHEREND
Figure 1.5. UDRI Floating Roller Peel Fixture.
9
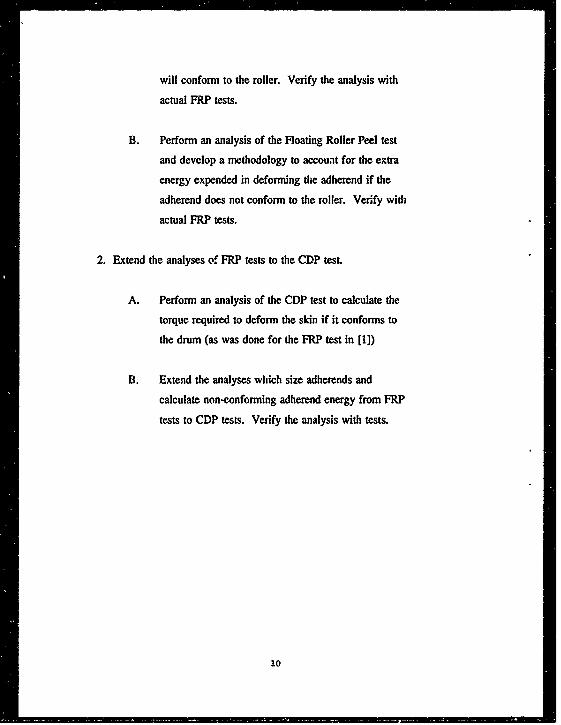
will conform to the roller. Verify the analysis with
actual FRP tests.
B. Perform an analysis of the Floating Roller Peel test
and develop a methodology to account for the extra
energy expended in deforming the adherend if the
adherend does not conform to the roller. Verify with
actual FRP tests.
2. Extend the analyses of FRP tests to the CDP test.
A. Perform an analysis of the CDP test to calculate the
torque required to deform the skin if it conforms to
the drum (as was done for the FRP test in [1])
B. Extend the analyses which size adherends and
calculate non-conforming adherend energy from FRP
tests to CDP tests. Verify the analysis with tests.
10
SECTION 2
ANALYSIS OF THE FLOATING ROLLER PEEL TEST
2.1 Analysis of Free Peel and Modifications
Kaeble and others [2,3] performed a first order analysis of the free peel
phenomenon to calculate the stresses in the bondline between a flexible
adherend and a rigid member. That analysis, with some modifications and
assumptions, provided the basis for a model to size the flexible adherend so that
it would conform to the roller. The basic approach is to assume that the
fracture in the adhesive layer will propagate when the cleavage stress (the stress
normal to the plane of the test specimen) exceeds the tensile strength of the
adhesive. The thickness of a flexible adherend which will produce this stress as
the adherend conforms to the roller can then be back calculated.
The expression for the cleavage stress in the bondline of a free peel test is
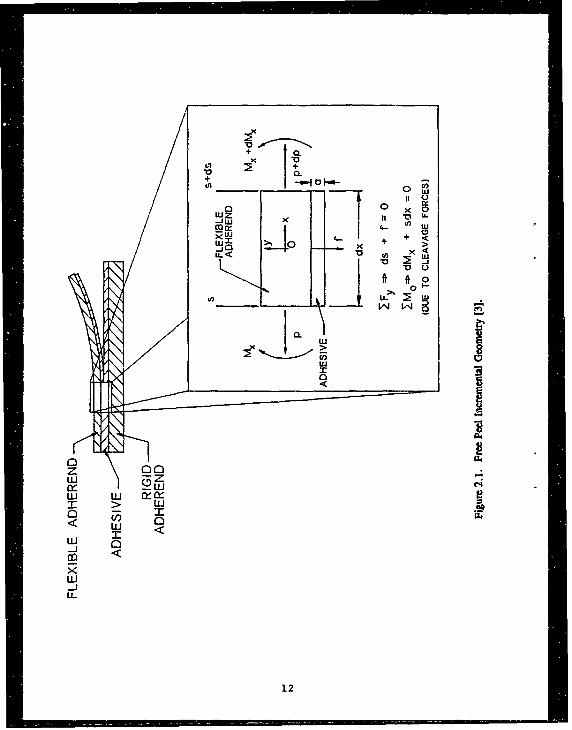
derived by considering the geometry shown in Figure 2.1. The forces and
moments produced on a differential piece of the flexible adherend are assumed
to equilibrate, yielding the following differential equation for the deflection of
the flexible adherend near the fracture point:
d~ly (3E 2 y= (2.1)1Tfr 2E~c~a J
in which
11
73
+
d)
0 I 0LlJZ -0 LL
I'- +
U.~< X
ft fo
014
w 1I9
u-iu-JL
U-
12
y = deflection of flexible adherend still bonded to the rigid adherend
x = coordinate along the length of the specimen
E2 = Young's modulus of the adhesive
El = Young's modulus of the flexible adherend
c = half-thickness of the flexible adherend
a = thickness of the bondline
The assumptions are linear elastic material behavior for the adherend portion not
yet debonded, and that the slope of the deflected adherend is small at the
fracture point.
Solving this equation by traditional techniques and assuming that the
resultant transverse shear force at the fracture point is negligible yields the
following equation for the deflection of the adherend
S3a MO eP ( cosox + sinox) (2.2)Y -2b 2 C3EIE2 M
in which
y = deflection of adherend still bonded to the adhesive
Mo = moment produced in the flexible adherend at x=O
b = width of the flexible adherend
Since this equation is valid for (-x) only, the maximum deflection occurs at x=O.
The resulting maximum deflection is therefore given by
13
Y 3 aMO2 (2.3)Ymax IN 21b2c 3EIE2
To convert this deflection to stress, a simple 1-dimensional definition of strain is
adopted:
e (2.4)a
in which e is the engineering strain. Using Hooke's Law, (a=E2e), the
maximum cleavage stress in the adhesive layer is given by
S 3E2 (2.5)Omax = C-E Mo,•2b 2ac 3EI
The moment, Mo, is the moment at x=O caused by the loading of the
flexible adherend during the test, and is simply the moment required to bend the
adherend around the roller. The expression for the moment in ap elastic/linear
plastic adherend (modeled as a thin beam) in bending is given by
b +Y . G cO E 11 C1+ . 3EK (2.6)
in which
b = width of flexible adherend
EY = post-yield modulus of flexible adherend
cry = yield strength of flexible adherend
ic = curvature to which adherend is bending
14
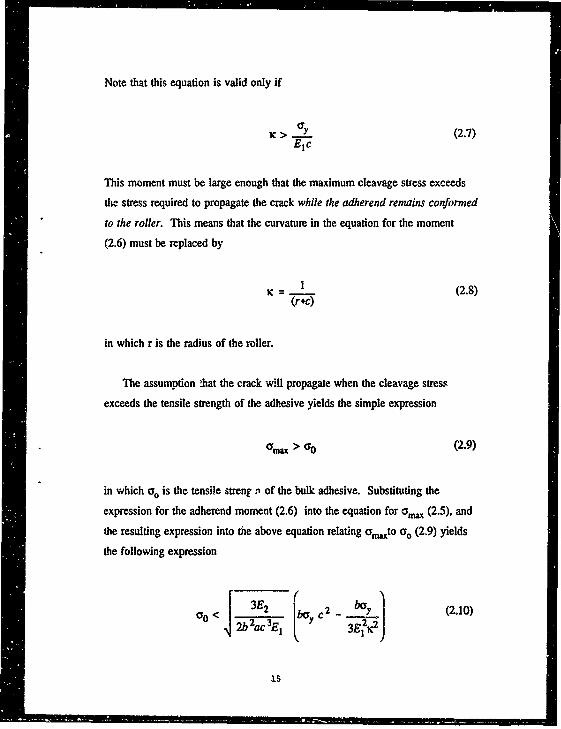
Note that this equation is valid only if
K> (ry (2.7)Etc
This moment must be large enough that the maximum cleavage stress exceeds
the stress required to propagate the crack while the adherend remains conformed
to the roller. This means that the curvature in the equation for the moment
(2.6) must be replaced by
(2.8)(r+c)
in which r is the radius of the roller.
The assumption !hat the crack will propagate. when the cleavage stress
exceeds the tensile strength of the adhesive yields the simple expression
Gmax > C0 (2.9)
in which oo is the tensile strenr P of the bulk adhesive. Substituting the
expression for the adherend moment (2.6) into the equation for C;,. (2.5), and
the resulting expression into the above equation relating qmaxto Yo (2.9) yields
the following expression
.J 2b2ac3E, 2 (2
is
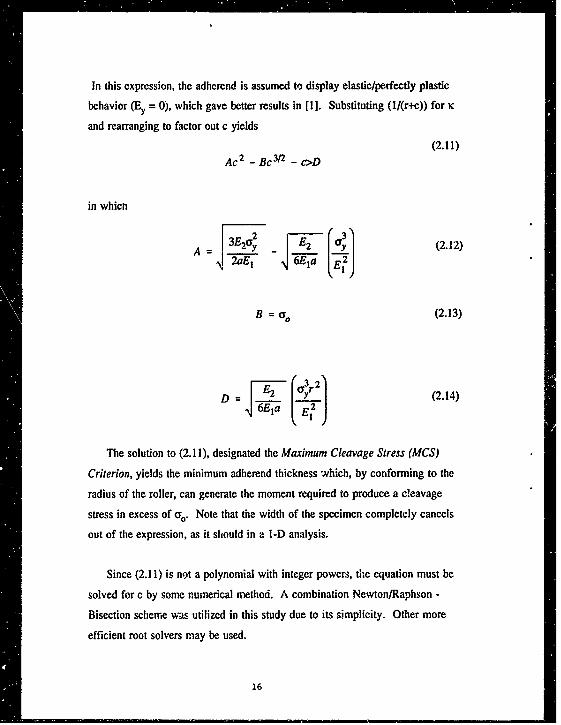
In this expression, the adherend is assumed to display elastic/perfectly plastic
behavior (Ey = 0), which gave better results in [1]. Substituting (1/(r+c)) for 1C
and rearranging to factor out c yields
(2.11)
Ac 2 - Bc 3'1 - c>D
in which
A fýE'3y2 2 UY(2.12)
2'aE1 6Eta
B = ao (2.13)
F-C2 Ur (2.14)
6E~a IE 2
The solution to (2.11), designated the Maximum Cleavage Stress (MCS)
Criterion, yields the minimum adherend thickness which, by conforming to the
radius of the roller, can generate the moment required to produce a cleavage
stress in excess of cro. Note that the width of the specimen completely cancels
out of the expression, as it should in a I-D analysis.
Since (2.11) is not a polynomial with integer powers, the equation must be
solved for c by some numerical method. A combination Newton/Raphson -
Bisection scheme was utilized in this study due to its simplicity. Other more
efficient root solvers may be used.
16
Note that this equation can be readily applied to the Climbing Drum Test,
since no assumptions have been made as to how the force which bends the
adherend around the roller is introduced into the adherend. The only differences
in the application to FRP and CDP test should be in the radius of the roller to
which the adherend should conform.
2.2 Appropriate Values of Bulk Tensile Strength
The failure criterion being used in this analysis states that the adhesive crack
will propagate when the cl-.avage stress exceeds the tensile strength of the bulk
adhesive. Most manufacturer's data supplies approximate values for both
stiffness and tensile strength that could readily be used in this analysis.
However, these values were most likely obtained under test conditions different
from those in the FRP or CDP test, namely highly different strain rates.
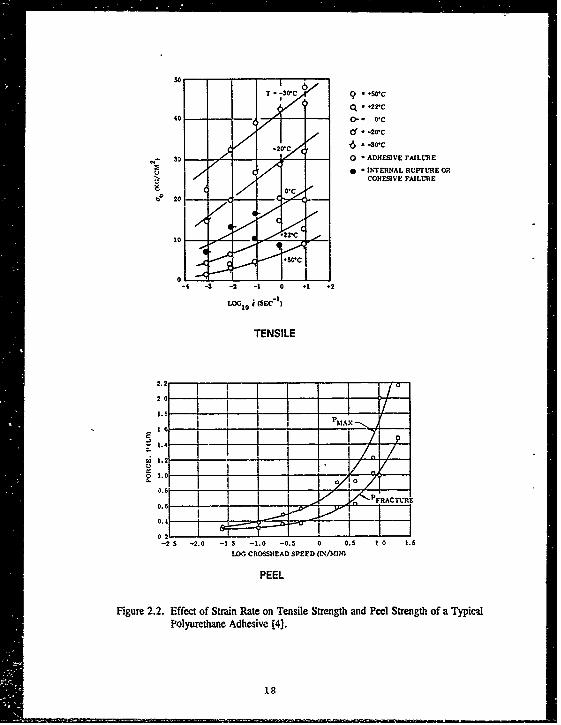
Data presented by Anderson et al. [4] and Gent [5] show significant
increases in tensile breaking stress and free peel strength with increasing rate of
extension and increasing peel rate, respectively. Strain rates for typical tensile
tests (6 inch gage section, 0.01 in/rmin) cross-head rate) are in the range of 0.17
%m/min. A first order kinematic analysis of an FRP specimen with a 0.01 inch
glue line thickness (Appendix) shows a strain rate uf 24.3%/rmin, if the test is
conducted at a cross-head rate of 6 inmin as suggested by ASTM D3167-76.
This represents an increase of two orders of magnitude in the strain rate at
failure. Figure 2.2 indicates that increasing the strain rate to this degree
approximately doubles the tensile breaking stress in a typical adhesive. This
material behavior must be accounted for in the analysis, aanely, by multiplying
the bulk tensile strength by an appropriate rate correction factor.
17
T - -30'C . .WOC
40~QL - -22-C00 - 01C
0' -* -20-c
-20*C 6--30-C
30 r 0 - ADHESIVE FAILLRE
9 " INTERNAL RUPrLRE ORCOHESIVE FAILURE
tePt 20 (S ý4;
'A:
10-
0-4 -3 -2 -1 0 .1 2.
-=-18
LOG1 0 (SEC )
TENSILE
P161AX
7 2. -I0 -. 0 -. 0 041 .
1.12
The specific effect of strain rate on tensile strength is most likely a material
property that will vary from material to material. Therefore an empirical
approach must be taken to suggesting appropriate rate correction factors for use
in FRP and CDP tests. If this approach to predicting minimum thickness is
correct, the appropriate factors should be in the range of 1.0 to 3.0, based on the
work described in Reference 5. Section 4.5, which details test results, will
discuss the strain rate factors and their influence on predicted minimum
adherend thicknesses.
2.3 Validity of the Model's Assumptions
In closing the discussion of the minimum adherend thickness analysis, a
contradiction which exists in the first order analysis presented in 2.1 and 2.2
must be acknowledged. If the moment produced by the flexible adherend is the
only mechanism which induces the fracture to progress, the load required to run
the test (the peel load) should be no greater than the load required to run an
unbonded specimen (simply pulling a flexible adherend through the fixture).
The reasoning is as follows. The moment in the unbonded specimen is reacted
by the rear roller. In the bonded specimen, the reaction is shifted to the
adhesive. In either case, however, the moment in the adherend should be the
same since the adherend curvature is the same (that of the roller). Since the
force on the adherend must produce the curvature, it would appear the force
should be the same in both cases. Test results [I] show this conclusion to be
incorrect. This contradiction, however, for a first order analysis, is recognized
and accepted.
19
SECTION 3
CALCULATION OF FLEXIBLE ADHEREND DEFORMATION
ENERGY IN A NON-CONFORMING FRP TEST
An analysis is now undertaken which will calculate the deformation energy
in an adherend which does not conform to the roller.
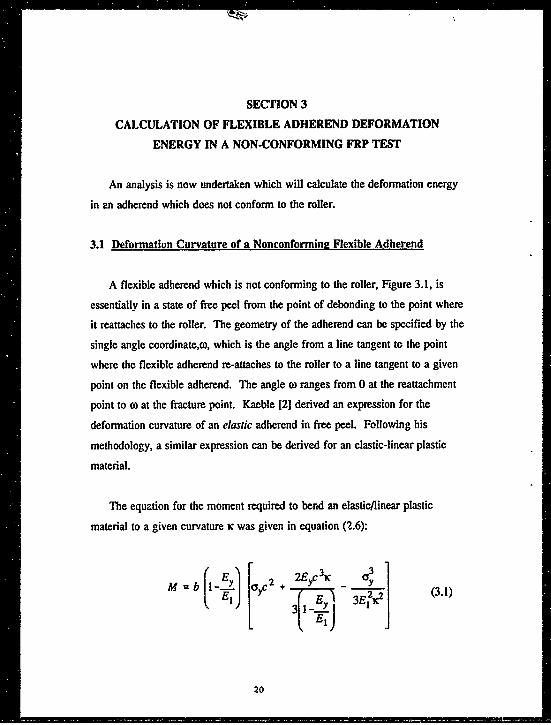
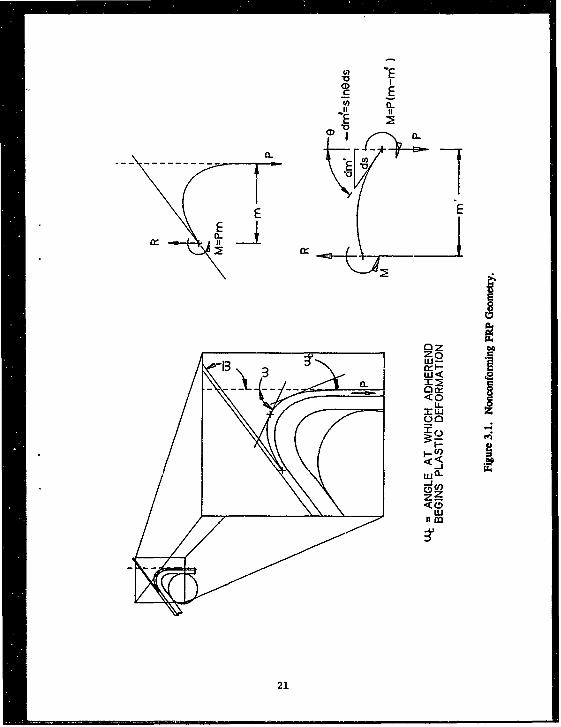
3.1 Deformation Curvature of a Nonconforming Flexible Adherend
A flexible adherend which is not conforming to the roller, Figure 3.1, is
essentially in a state of free peel from the point of debonding to the point where
it reattaches to the roller. The geometry of the adherend can be specified by the
single angle coordinate,o, which is the angle from a line tangent to the point
where the flexible adherend re-attaches to the roller to a line tangent to a given
point on the flexible adherend. The angle (a ranges from 0 at the reattachment
point to o) at the fracture point. Kaeble [2] derived an expression for the
deformation curvature of an elastic adherend in free peel. Following his
methodology, a similar expression can be derived for an elastic-linear plastic
material.
The equation for the moment required to bend an elastic/linear plastic
material to a given curvature c was given in equation (2.6):
(E~ F 2Eyc 3 3 _
M = b 5 + 2 3 ij 3+121c2] (3.1)
20
E
c
a--
u<0
U-
00
LU a--i
<0Lu
21
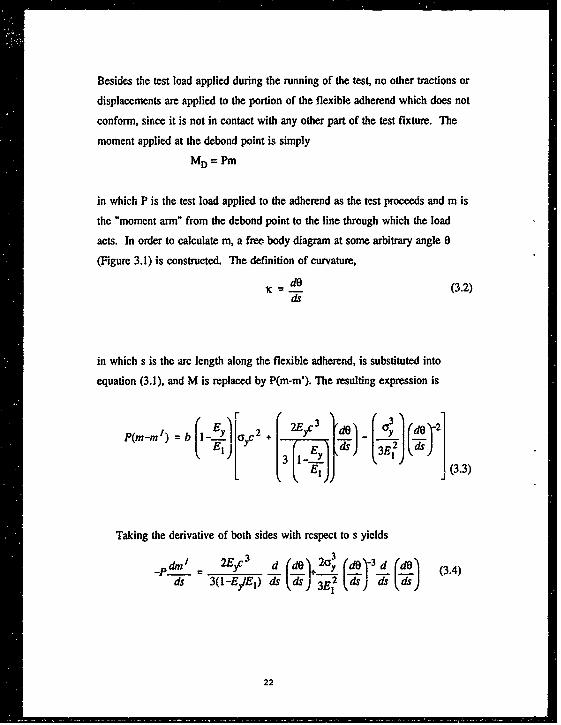
Besides the test load applied during the running of the test, no other tractions or
displacements are applied to the portion of the flexible adherend which does not
conform, since it is not in contact with any other part of the test fixture. The
moment applied at the debond point is simply
MD = Pm
in which P is the test load applied to the adherend as the test proceeds and m is
the "moment arm" from the debond point to the line through which the load
acts. In order to calculate m, a free body diagram at some arbitrary angle 0
(Figure 3.1) is constructed. The definition of curvature,
dOic = A (3.2)
in which s is the arc length along the flexible adherend, is substituted into
equation (3.1), and M is replaced by P(m-m'). The resulting expression is
P(m-m 1) = b j 24. EYY dr
Taking the derivative of both sides with respect to s yields
- 2Ec 3 d (dOa s-3 3 (as)-3 (3.4)S(3.4)
22
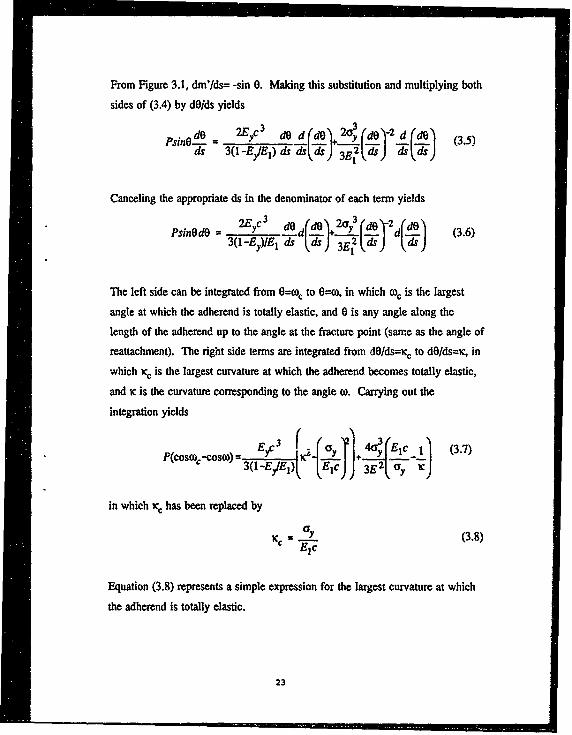
From Figure 3.1, dm'/ds= -sin 0. Making this substitution and multiplying both
sides of (3.4) by d0/ds yields
A _ede 2E,,C3 ded(dI 20V2 ~ el 2 3dd, 3(1-Eý,I) ds ds- ds ) 23E q -d (3.5)
Canceling the appropriate ds in the denominator of each term yields
2E~c3 AO d' o (deL2Fy 3 rtdoPsinOdO = - d i(±6 (3.6)S3(1 -Ey)IE1 W d$y kd)3E_2ds dS
The left side can be integrated from 0--wo to 0=o, in which co, is the largest
angle at which the adherend is totally elastic, and 0 is any angle along the
length of the adherend up to the angle at the fracture point (same as the angle of
reattachment). The right side terms are integrated from dO/ds=iC to d0/ds=ic, in
which icc is the largest curvature at which the adherend becomes totally elastic,
and ic is the curvature corresponding to the angle o. Carrying out the
integration yields
p(coscO)..cosoi,= 3( Ey _1) { + Y EJcJJ (3.7)3(l -Eý,)[ flEcj 3E2 oy KCJ
in which icc has been replaced by
1C ,= Gy(3.8)
Equation (3.8) represents a simple expression for the largest curvature at which
the adherend is totally elastic.
23
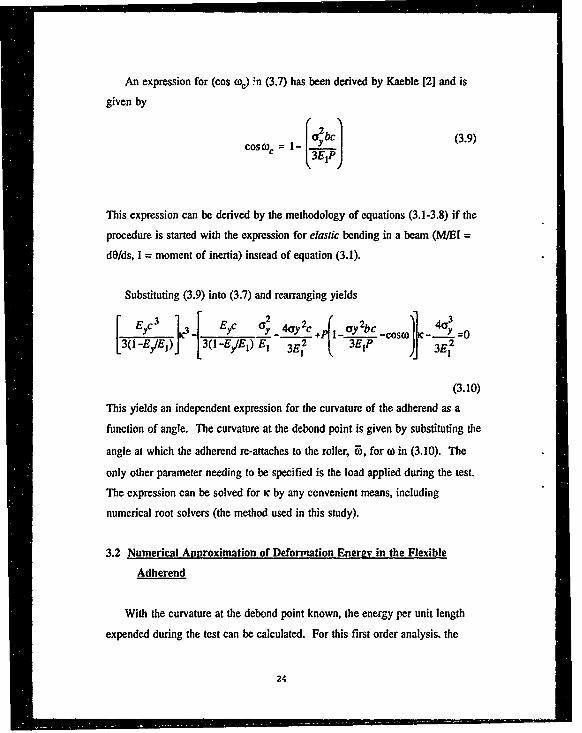
An expression for (cos od) ;n (3.7) has been derived by Kaeble [2] and is
given by
(2bY C] (3.9)CosO)c = I-
IThis expression can be derived by the methodology of equations (3.1-3.8) if the
procedure is started with the expression for elastic bending in a beam (M/El =
d0/ds, I = moment of inertia) instead of equation (3.1).
Substituting (3.9) into (3.7) and rearranging yields
_____ [ 2-( _ _3
1 2 a. 2c r .2bc2
[3(1-EIEI)} -Ey/E) 3E2 3EIP c J 3E 2
(3.10)
This yields an independent expression for the curvature of the adherend as a
function of angle. The curvature at the debond point is given by substituting the
angle at which the adherend re-attaches to the roller, @, for co in (3.10). The
only other parameter needing to be specified is the load applied during the test.
The expression can be solved for K by any convenient means, including
numerical root solvers (the method used in this study).
3.2 Numerical Approximation of Deformation Energy in the Flexible
Adherend
With the curvature at the debond point known, the energy per unit length
expended during the test can be calculated. For this first order analysis. the
24
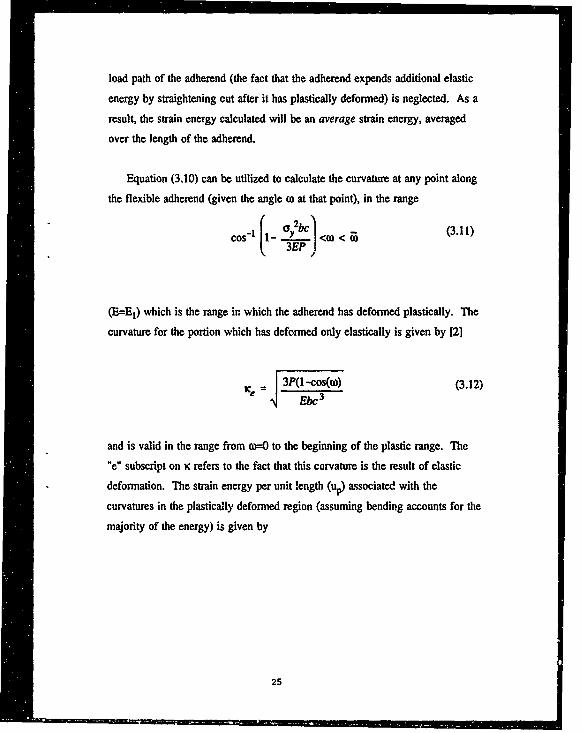
load path of the adherend (the fact that the adherend expends additional elastic
energy by straightening out after it has plastically deformed) is neglected. As a
result, the strain energy calculated will be an average strain energy, averaged
over the length of the adherend.
Equation (3.10) can be utilized to calculate the curvature at any point along
the flexible adherend (given the angle (o at that point), in the range
cOs- l- 0"C'j) <0< (1( 3YEP)
(E=EI) which is the range in which the adherend has deformed plastically. The
curvature for the portion which has deformed only elastically is given by [2]
C 3P(l -cos(o)) (3.12)efi Ebc 3
and is valid in the range from a3=0 to the beginning of the plastic range. The"e" subscript on ic refers to the fact that this curvature is the result of elastic
deformation. The strain energy per unit length (UY) associated with the
curvatures in the plastically deformed region (assuming bending accounts for the
majority of the energy) is given by
25
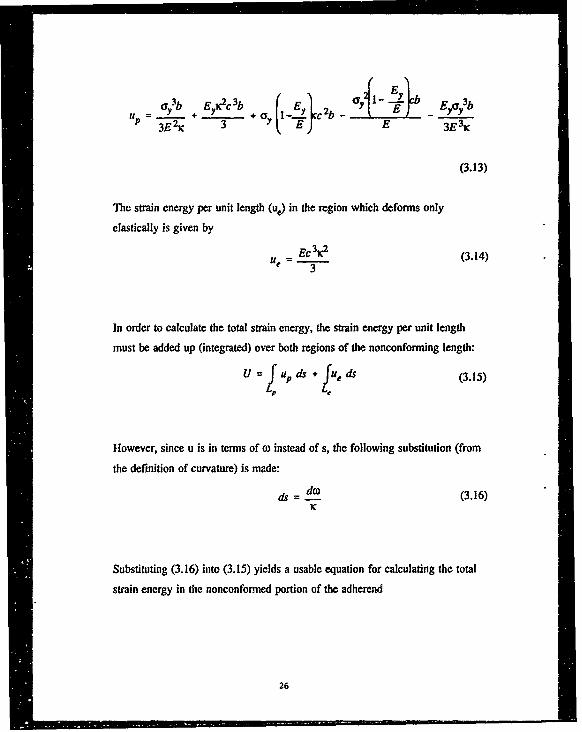
I 3 b E XC c3b EE 1- B b E 3bup = Y' + + Uo Il-! ý"c
2 b- - Y__3E2i 3 E E 3E 3'i
(3.13)
The strain energy per unit length (u.) in the region which deforms only
elastically is given by
Ue = E 3C (3.14)
In order to calculate the total strain energy, the strain energy per unit length
must be added up (integrated) over both regions of the nonconforming length:
u = f Up + fue ds (3.15)LP L'
However, since u is in terms of wo instead of s, the following substitution (from
the definition of curvature) is made:
dos (3.16)K
-41C
Substituting (3.16) into (3.15) yields a usable equation for calculating the total
strain energy in the nonconformed portion of the adherend
26
0 == = - . . .
U = f do) + •do) (3.17)
The total length of the nonconfonned adherend is calculated in a similar fashion,
yielding
Coe
L =f __ dv + f -- dco .8
o e moCP
in which L is the total length of the nonconformed adherend. The averaged
energy per unit length, u), is then given by the simple expression
U= (3.19)L
Since the values of curvature for a given angle are calculated numerically,
so must the average strain energy expressions (3.17-3.19) be evaluated
numerically. Even if the closed form solutions for a cubic equation were used
to solve (3.10) for r,, the resulting integral would be so complex that numerical
techniques would still be required. In this study, Simpson's rule for numerically
integrating a function was utilized.
27
SECTION 4
FRP TEST RESULTS AND DISCUSSION
A series of floating roller peel tests was conducted to establish the validity
of, and confirm, minimum adherend thickness predictions from the maximum
cleavage stress criterion. Because the strain rate dependence of the adhesives
was unknown, the tests essentially were used to back calculate the correct strain
rate factors. Factors around 2 were considered to establish the validity of the
model. Parameters varied in the tests included adhesive strength and stiffness,
adherend modulus and yield strength, glue line thickness, and adherend
thickness.
4.1 Procedure
Tests were conducted according to ASTM D3167-76, with the exception
that the UDRI fixture (Figure 1.5) was utilized instead of the ASTM fixture.
This ensured that incorrect failures due to the specimen "flipping up" (Figure
1.3) would not occur. In addition, the front plate of the fixture was replaced
with a 7/16-inch thick polycarbonate plate, which allowed observation of
whether or not the adherend conformed to the roller during the test. A polar
coordinate grid, with the origin at the center of the main roller (Figure 4.1),
permitted measurement of the angle at which nonconforming adherends
reattached to the roller. All tests were videotaped in order to make this
measurement at a later time.
All tests were conducted at room temperature and humidity on an Instron
Universal Test machine (model 1123) at a crosshead rate of 6 inches/min. Data
28
Figure 4.1. UDRI FRP Fixture with Polycmtonato Face Plate.
29
were collected via microcomputer with A/D capabilities, as well as on an
autograph machine. Conformance of the adherend to the roller was noted
visually. Measurements of the angle to re-conform to the roller were made by
producing Polaroid photographs from still video images and measuring the angle
with a protractor.
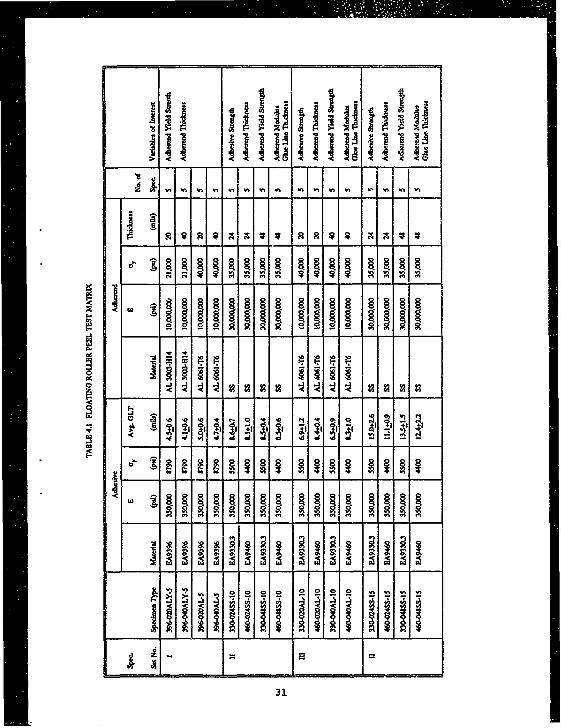
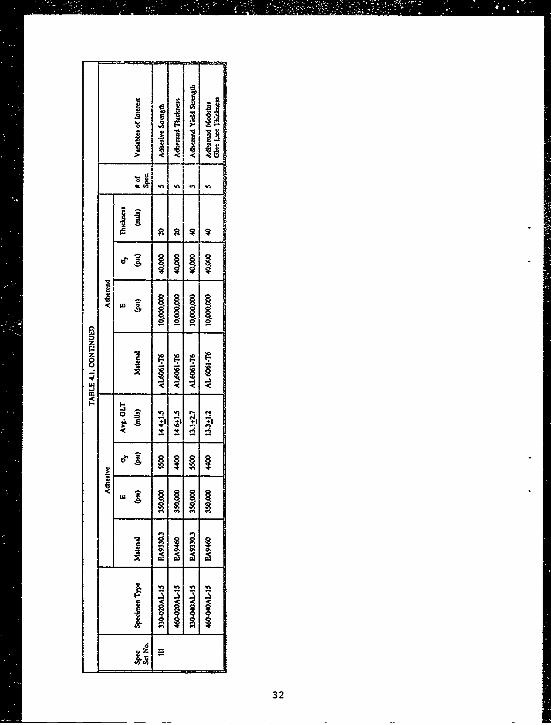
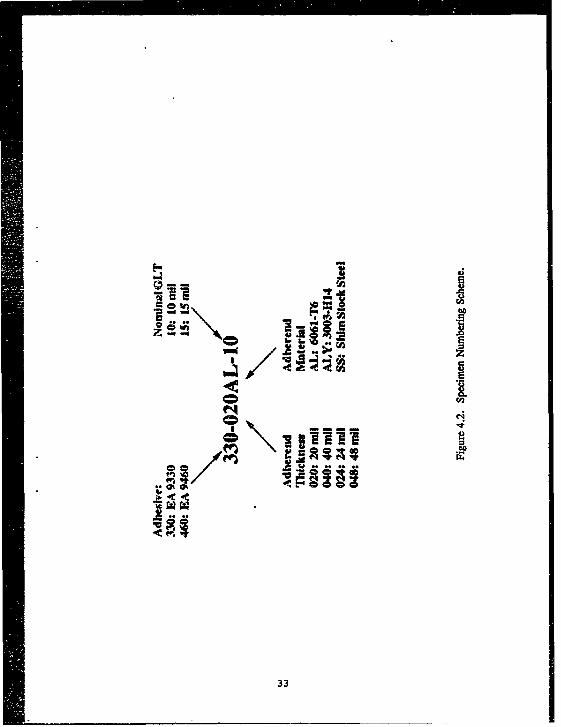
4.2 Test Matrix and Specimens
Table 4.1 shows the various adhesives and adherends used in the floating
roller peel tests. Figure 4.2 displays the manner in which samples were
numbered, in order to easily distinguish the characteristics of the sample. Two
groups of tests were conducted. The first group (Set I) examined different yield
strengths on the adherend material, with 6061-T6 aluminum (40,000 psi yield)
and 3003-H14 aluminum (21,000 psi yield) serving as the two extremes. The
second group (sets II and Ill) included variations in adhesive strength (5500 psi
for EA 9330-3; 4400 psi for EA 9460), glue line thickness (-10 rnil and -15
mil), and modulus of the adherend (30,000,000 psi for steel, 10,000,000 psi for
aluminum). Two values of adherend thickness were chosen in each set of tests,
in order to obtain both conforming and nonconforming behavior.
Specimens were prepared according to the requirements of ASTM D
3167-76 and individual manufacturer's guidelines. Specimen preparation
summaries are given in Table 4.2. In addition to the preparations listed,
specimens labeled with "-40" and "-15" suffixes contained 8-10 rili and 12-15
mil glass beads, respectively, in order to control glue line thickness.
30
•- = - .i ij.;iij•jz.-.' i"--
j;IZ W-b•• •• • V-•
t< .-',f b i'o .6.,' - --: ".
I-
- I
•~ §. §. §1 •
w - -C-.-
TI 1111
8
32
CDC
C4
en
33O
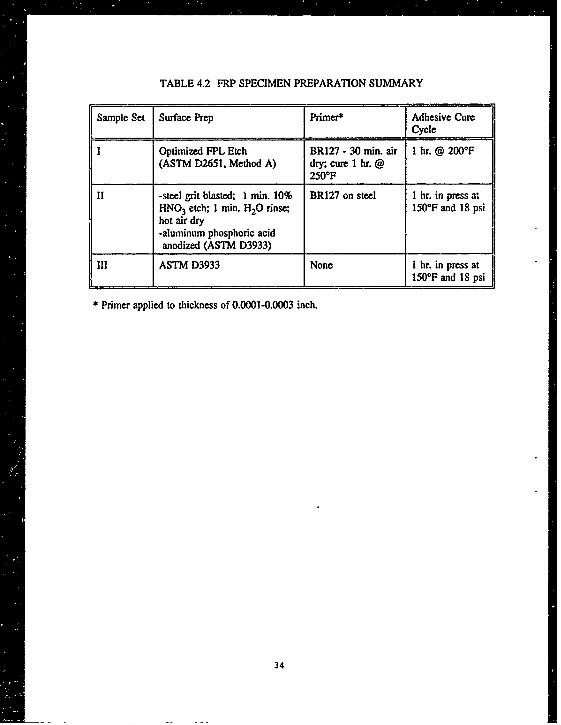
TABLE 4.2 FRP SPECIMEN PREPARATION SUMMARY
Sample Set Surface Prep Primer Adhesive Cure__I Cycle
I Optimized FPL Etch BR127 - 30 min. air I hr. @ 200°F(ASTM D2651, Method A) dry; cure 1 hr. @
250OF
II -steel grit blasted; I min. 10% BR127 on steel 1 hr. in press atHNO3 etch; 1 min. H20 rinse; 150'F and 18 psihot air dry-aluminum phosphoric acidanodized (ASTM D3933)
III ASTM D3933 None I hr. in press atS~150*F and 18 psi
* Primer applied to thickness of 0.0001-0.0003 inch.
34
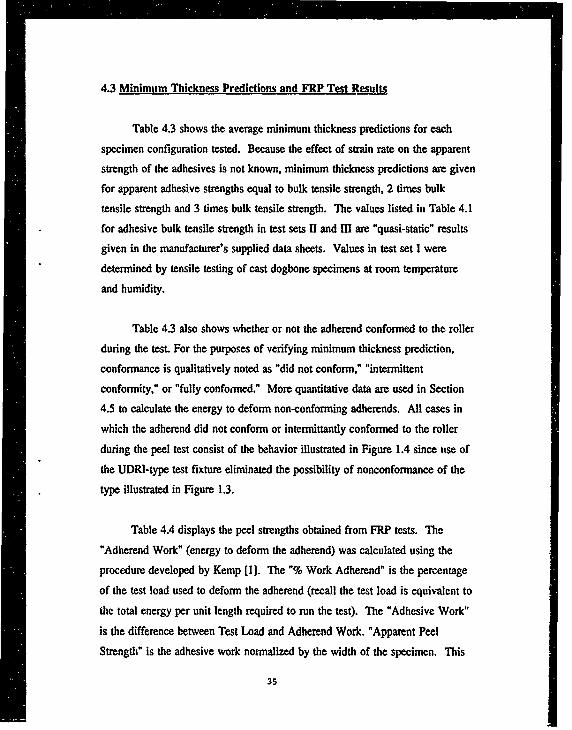
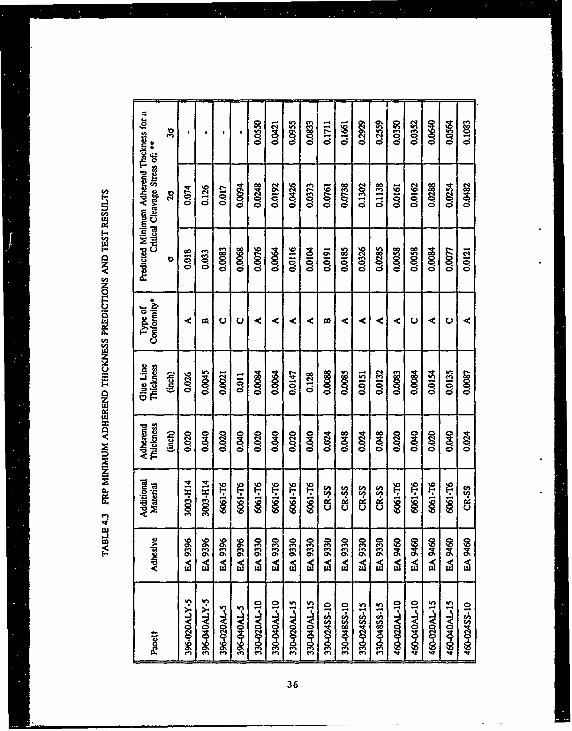
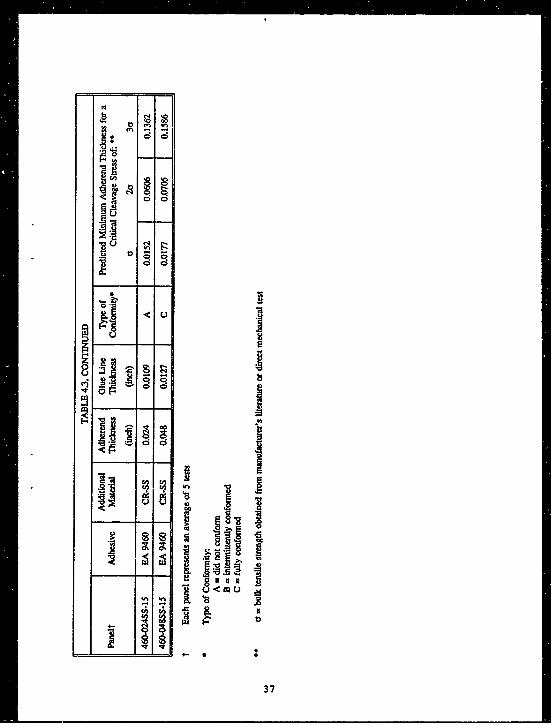
4.3 Minimum Thickness Predictions and FRP Test Results
Table 4.3 shows the average minimum thickness predictions for each
specimen configuration tested. Because the effect of strain rate on the apparent
strength of the adhesives is not known, minimum thickness predictions are given
for apparent adhesive strengths equal to bulk tensile strength, 2 times bulk
tensile strength and 3 times bulk tensile strength. The values listed in Table 4.1
for adhesive bulk tensile strength in test sets II and m are "quasi-static" results
given in the manufacturer's supplied data sheets. Values in test set I were
determined by tensile testing of cast dogbone specimens at room temperature
and humidity.
Table 4.3 also shows whether or not the adherend conformed to the roller
during the tesL For the purposes of verifying minimum thickness prediction,
conformance is qualitatively noted as "did not conform," "intermittent
conformity," or "fully conformed." More quantitative data are used in Section
4.5 to calculate the energy to deform non-conforming adherends. All cases in
which the adherend did not conform or intermittantly conformed to the roller
during the peel test consist of the behavior illustrated in Figure 1.4 since use of
the UDRI-type test fixture eliminated the possibility of nonconformance of the
type illustrated in Figure 1.3.
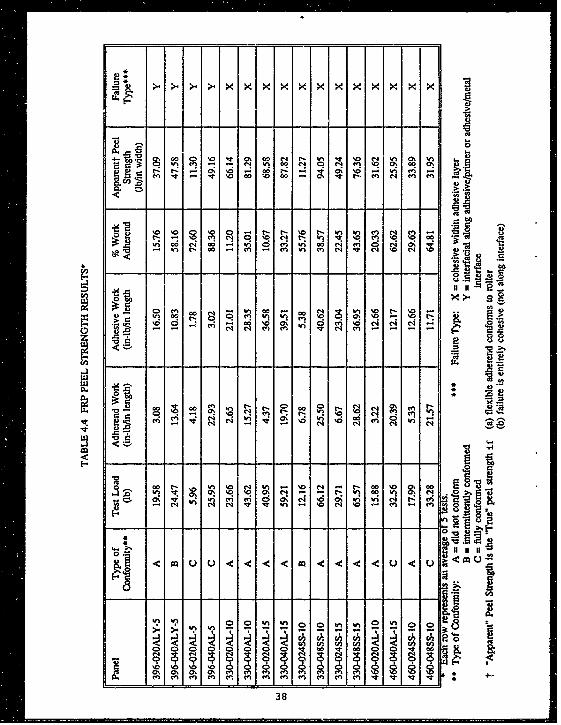
Table 4.4 displays the peel strengths obtained from FRP tests. The
"Adherend Work" (energy to deform the adherend) was calculated using the
procedure developed by Kemp [1]. The "% Work Adherend" is the percentage
of the test load used to deform the adherend (recall the test load is equivalent to
the total energy per unit length required to run the test). The "Adhesive Work"
is the difference between Test Load and Adherend Work. "Apparent Peel
Strength" is the adhesive work normalized by the width of the specimen. This
35
oc
t-.
Ugo
00
Ueft
~3
0 C
Ln
3u37
en -:11
%0 10 E 0 N 'f %
- C, N0 m m0 N v.' C4 C4 G0 -
W) ~ ~ ~ ~ .00 0 q% C
00 '0o 0 en %a.
(n 4% . 0 Go
- q N cl
V' t-00 %
q t OR0'IC- % vm m mC
C' 0% 0% Ch S C, cn 00% cN en0 t fI Tn I (n I t a cn I (n ~ In M T V
43
value should be unique for a given adhesive and glue line thickness, and should
not vary among tests using diffeient adherend thicknesses if the tests conform to
the roller.
The results in Table 4.3 indicate several interesting trends. None of the
EA 9330 specimens conformed to the roller. For these combinations of
adherend material and adhesive, an adherend thickness greater than 0.040 inches
is required to ensure the adherend conforms. For the aluminum adherends, the
predicted minimum thicknesses agree with the requirement for critical cleavage
stresses equal to approximately 2 to 3 times the bulk tensile strength listed in
vendor data sheets for this adhesive. Since no specimen conformed to the
roller, a precise value for critical cleavage stress is not possible. However, since
the moment induced by the adherend increases with the cube of the thickness, it
is reasonable that using a critical stress value of 3 will yield a correct minimum
thickness. Alternatively, it is possible that the bulk tensile strength listed in the
vendor data sheets may be somewhat inaccurate.
The EA 9330 specimens with steel adherends had higher minimum
thickness predictions than those with aluminum adherends. Although this seems
intuitively incorrect, it is consistent with the assumptions made in the model. A
stiffer adherend will deflect less for a given moment. Since the stresses in the
adhesive layer are based on the deflection of the adherend, a stiffer adherend
results in less stress. Although the steel should intuitively generate a higher
moment as it bends to the roller radius, the moment increase over aluminum is
actually very small. The elastic/perfectly plastic assumption results in a moment
that is strongly dependent on the yield strength, and for the radius of the roller
used here, less dependent on modulus. Therefore, the small increase in
elastic/plastic moment is overwhelmed by the large decrease in the elastic
deflection. The net result is lower stress and a larger minimum thickness.
39
Another trend readily noted in Table 4.3 is the increase in minimum
predicted thickness with increasing glue line thickness. From equation 2.10, the
strain for a given deflection decreases with increasing glue line thickness. Since
the stress is proportional to the one dimensional strain in the adhesive layer,
increasing the glue line thickness also decreases the stress. This is reflected in
equation 2.10, in which the stress in the adhesive layer varies inversely with the
square root of the glue line thickness. To increase the stress to the critical stress
level requires a thicker adherend.
All the EA9460 specimens followed a distinct pattern: specimens with the
thinner adherends did not conform, while those with thicker adherends did.
Comparing these trends in aluminum adherend specimens with the predicted
minimum thicknesses shows the critical cleavage stress to be approximately 2 to
3 times bulk tensile strength as listed in vendor literature. The steel specimens
show the critical cleavage stress to be slightly greater than 2 times bulk tensile
strength for a 0.010 inch glue line, and slightly less than 2 times bulk tensile
strength for a 0.010 inch glue line. This result qualitatively verifies that the
Maximum Cleavage Stress Criterion can be used to predict minimum adherend
thicknesses.
The data for EA9396 shows the critical stress to be between one and two
times bulk tensile strength for the adherends of 3003-H14 aluminum. The
specimens with 6061-T6 adherends conformed for both adherend thicknesses,
although the failures appeared to occur between adherend and primer. While
the failure mode is not ideal, the loads sustained represent a lower bound on
adhesive failure load. The rate correction factor for these tests (EA 9396 tests)
should therefore be lower than for the other tests, which all failed cohesively.
40
4.4 Apparent Peel Strength from FRP Test Results
In comparing specimens with the same adherend material and glue line
thickness, the EA 9460 results show that most specimens with non-conforming
adherends have higher apparent peel strengths than specimens with conforming
adherends, because the adherend work in the nonconformed specimens has not
been correctly calculated. The exception is the 15 mil glue line thickness steel
specimens, on which the Apparent Peel Strengths of the conformed specimens
are actually higher than nonconformed specimens. This is likely due to
uncertainty in the properties of the steel (speifically, yield slrength) and in
whether or not the material is actually elastic/perfectly plastic. Note also that
specimens with conforming adherends possess higher values in the "% Work
Adherend" column. This fact again emphasizes that adherend work has not
been correctly calculated in nonconforming specimens. The error consists in too
little energy being computed from adherend deformation. This results in
attributing too much energy into the breaking of the adhesive bond.
The high percentage of work that goes into deforming the adherend raises
an interesting issue of precision and accuracy. Since the calculated peel strength
is the difference between two numbers of sirn. ar magnitude (the peel load
* during the test and the calculated work to deform the adherend), a small
uncertainty in either number may create a large uncertainty in the peel strength.
This is one reason why a minimum thickness specification is critical. The
adherend must be thick enough to enforce the correct failure mode, but as thin
as possible so that as much energy as possible goes into fracturing the bond.
Finally, an examination of Table 4.4 indicates that specimens with the same
adhesive and glueline thickness range do not in general show the same Apparent
Peel Strength. This would seem to indicate a dependence on glueline thickness.
41
Although beyond the scope of this effort, it may be prudent in the future to
carry out a more extensive test program to find a way to normalize Apparent
Peel Strength calculations on the basis of glueline thickness.
4.5 Energy to Deform a Nonconformine Adherend and FRP Test Results
Using the methods of Sections 3.1 and 3.2, the energy to deform a
non-conforming adherend can be calculated, and the apparent peel strength
corrected for this additional energy. Figures 4.3 and 4.4 show typical still
images taken from the video of nonconforming FRP adherends. Angles of
reattachment were measured by a protractor and substituted into 3.10 to
calculate the adherend curvature at the fracture point. The angle of reattachment
and curvature at fracture were substituted into 3.19, and tde additional energy to
deform the adherend to the larger curvature was calculated.
Table 4.5 shows the additional work calculated for one sample from
several of the groups which contained EA9330 or EA9460 adhesive. As the
table shows, "% Work Adnerend" increases for the EA9330 samples to levels
more typical of conformed specimens, indicating the deformation energy has
been more correctly accounted for. The "Apparent Peel Strength" also becomes
more uniform. However, since none of the specimens conformed, no basis
exists for knowing if the Apparent Peel Strengths represent values which would
have been obtained if the specimens had conformed.
The EA9460 specimens, however, do indicate that, when the additional
energy consumed by nonconforming adherends is accounted for, the Apparent
Peel Strength is very close to that calculated for specimens which do conform.
Again, the "% Work Adherend" column shows values close to those expected of
conforming specimens. It is also interesting to note the close agreement
42
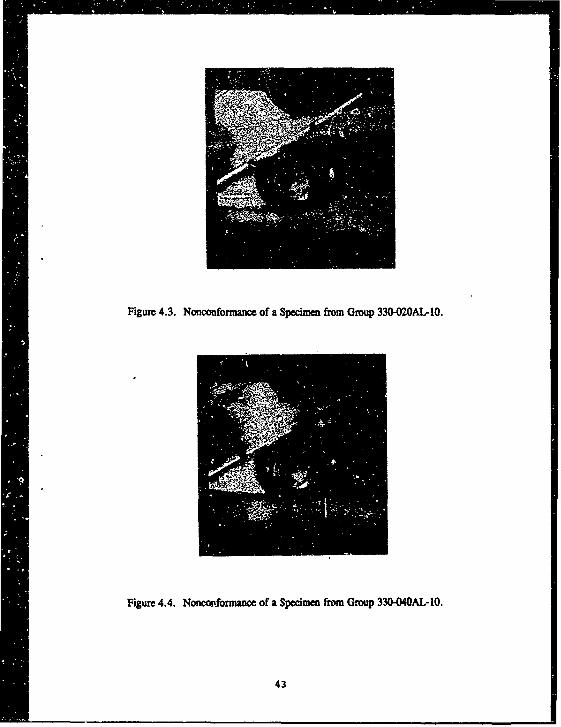
Figure 4.3. Nonconformance of a Specimen from Group 330-2OAL- 10.
Figure 4.4. Nonconformance of a Specimen from Group 330-020AL-10.
43
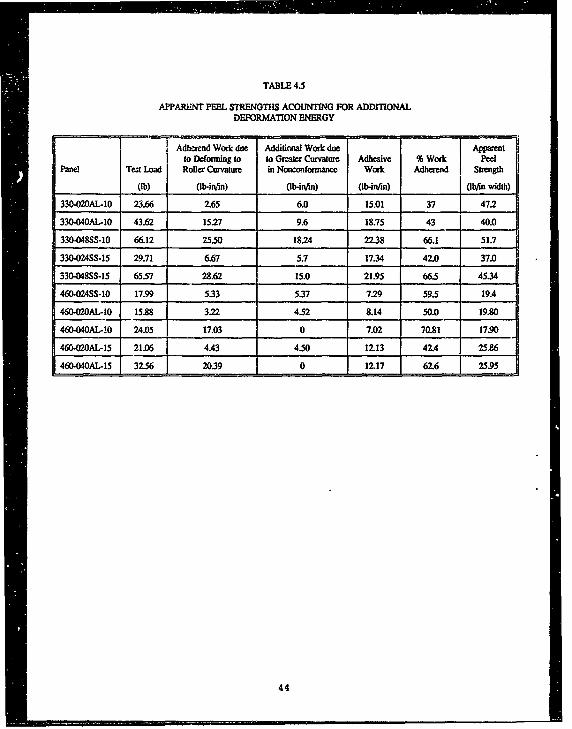
TABLE 4.5
APPARENT PEEL STRENGTHS ACOUNING FOR ADDITIONALDEFORMATION ENERGY
Adherend Work due Additional Work due Apparentto Deforning to to Greater Curvature Adhesive % Work Peel
Panel Test Load Roller Curvature in Nonconformance Work Adherend Strength
(Ib) 0b-infin) (b-inji) (b-in/'n) (b/In width)
330-020AL-10 23.66 2.65 6.0 15.01 37 47.2
330-040AL-I0 43.62 15.27 9.6 18.75 43 40.0
330-048SS-10 66.12 25.50 18.24 22.38 66.1 51.7
330-0245S-15 29.71 6.67 5.7 17.34 42.0 37.0
330.048SS-15 65.57 28.62 15.0 21.95 66.5 45.34
460-024SS-10 17.99 5.33 5.37 7.29 59.5 19.4
460-020AL-10 15.88 3.22 4.52 8.14 50.0 19.80
460-040AL-10 24.05 17.03 0 7.02 70.81 17.90
460-020AL-15 21.06 4.43 4.50 12.13 42.4 25.86
460-040AL-15 32.56 20.39 0 12.17 62.6 25.95
44
between specimens with similar glue line thicknesses, indicating a possible
relationship between glue line thickness and peel strength.
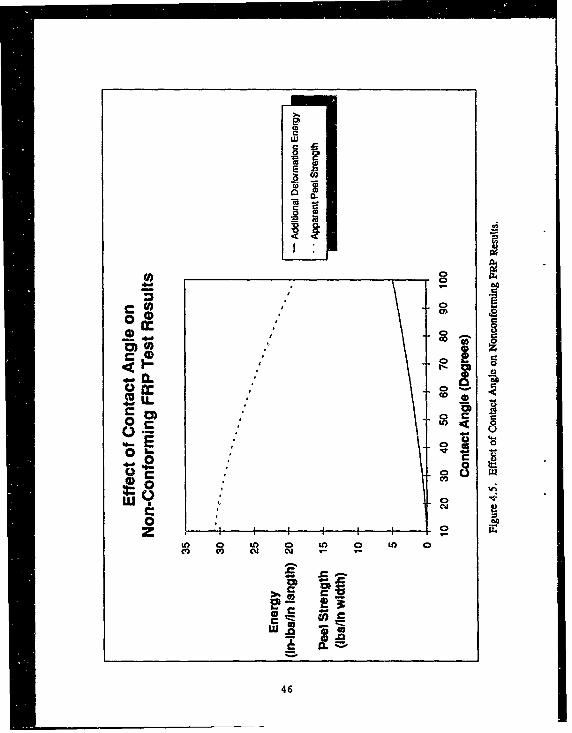
The measurement of the contact angle (angle at which the adherend
reattaches to the roller) involves some judgement, as photographs of the test
present some uncertainty as to where the adherend actually reattaches. Figure
4.5 indicates that an uncertainty of +100 at an angle of 900 (a typical contact
angle) results in a change in Apparent Peel Strength of less than 5 lb/in. While
on a percentage basis this is large, it represents an acceptable uncertainty in
absolute terms.
45
w
4.5
* Cl
0 Lo
C0 )
0 M)
CC00
It) 0 ) 0 LO U) 0V) 0l) N~ N .
46
SECTION 5
ANALYSIS OF THE CLIMBING DRUM PEEL TEST
The analyses for the Floating Roller Peel test are now applied to the
Climbing Drum Peel test. First, an expression which estimates the deformation
energy in the CDP skin is presented. Use of this equation eliminates the need
to run calibration specimens as required by ASTM D1781-76. Then, the
Maximum Cleavage Stress Criterion -ill be applied to the CDP test in order to
prescribe skin thicknesses which will prevent incorrect failure modes.
5.1 Estimation of the CDP Calibration Load
Kemp [1] produced an analysis which calculated the energy to deform the
flexible adherend in an FRP teSt. Similarly in a CDP test, the adherend is
permanently deformed, absorbing energy in the process. While the adherend
deformation energy in an FRP test can be calculated in a tedious closed form
solution or numerically as in [1], the adherend deformation energy in a CDP test
is more easily computed because the flexible adherend does not straighten out as
the test progresses. Thertn'ore, load path changes accompanying load reversal
(as in the FRP analysis of [1]) do not need to be accounted for. Although
Kemp's numerical scheme [1] can perform this calculation, the lack of load
reversal simplifies the analysis and leads to a straightforward expression for the
skin deformation energy.
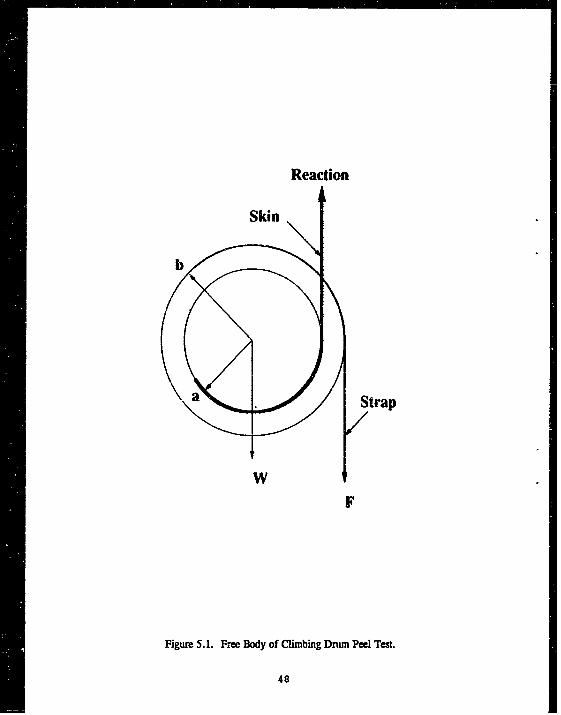
Figure 5.1 schematically depicts a calibration test in which an unbonded
sample is tested. A simple energy balance yields the required force necessary to
deform the adherend. The energy put into the system is merely the test force
(F) moving through some distance (sf):
47
Reaction
Skin
_ ~ \< Strap
W
F
Figure 5.1. Free Body of Climbing Drum Peel Test.
48
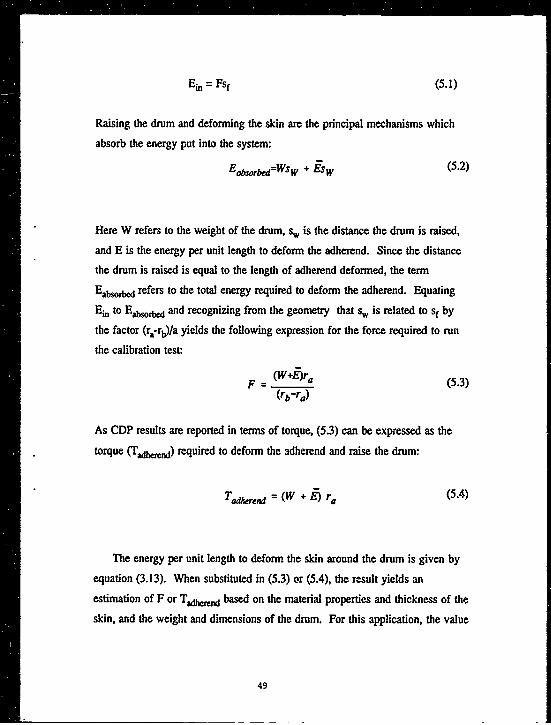
Ein = Fsf (5.1)
Raising the drum and deforming the skin are the principal mechanisms which
absorb the energy put into the system:
Eabsorbed=WSW + 'Esw (5.2)
Here W refers to the weight of the drum, sw is the distance the drum is raised,
and E is the energy per unit length to deform the adherend. Since the distance
the drum is raised is equal to the length of adherend deformed, the term
""Eabsobed refers to the total energy required to deform the adherend. Equating
Eim to Eabsorbe and recognizing from the geometry that sw is related to sf by
the factor (ra-rb)/a yields the following expression for the force required to run
the calibration test:
F (W+E)ra (5.3)(rb-ra)
As CDP results are reported in terms of torque, (5.3) can be expressed as the
torque (Tadhend) required to deform the adherend and raise the drum:
TW oa, = (W + E) r, (5.4)
The energy per unit length to deform the skin around the drum is given by
equation (3.13). When substituted in (5.3) or (5.4), the result yields an
estimation of F or Tsdemd based on the material properties and thickness of the
skin, and the weight and dimensions of the drum. For this application, the value
49
of curvature (x) used should include the radius of the drum web and 1/2 the
thickness of the skin.
5.2 Minimum Skin Thickness Predictions
The CDP test suffers from the same uncertainty problem as the FRP test:
the deformation of the skin can account for a large percentage of the total
energy absorbed by a bonded specimen. As a result, the calibration torque and
test torque numbers can be relatively close. Subtraction of the two could result
in large errors even if the errors in the two numbers are individually relatively
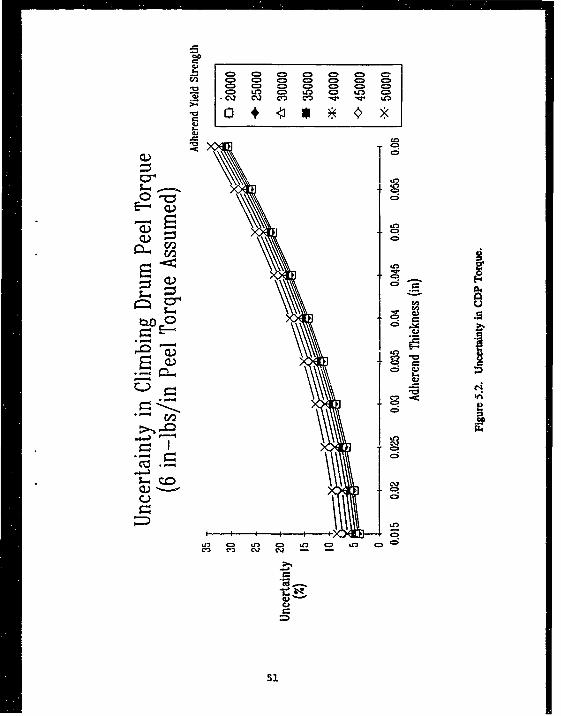
small. Figure 5.2 illustrates this fact graphically, depicting uncertainties as high
as 35% for 0.060-inch skins. A minimum thickness criterion would ensure the
best possible trade-off between high uncertainties in thick adherends and
incorrect failure modes in thin adherends.
The Maximum Cleavage Stress Criterion (2.11) is directly applicable to the
CDP test for predicting minimum skin thicknesses. Several issues must be
addressed in doing so, however. First, the curvature to which the adherend must
conform is smaller than in the FRP test. As a result the strain rate may not
affect the adhesive strength to the degree it did in FRP tests. Strain rate factors
below 2 should be expected in CDP verification tests.
Second, the analysis may not correctly account for the effect of the
adhesive in determining minimum thickness. Precise glueline thickness
measurements are impossible in sandwich panels because of nonuniformity of
the glueline and the presence of adhesive fillets on the walls of honeycomb
cells. For this first order analysis, this possible source of error is neglected. A
typical value of 0.010 in. is assumed for this effort.
50
Lo CD LtLO
CQ C%2_ _ _ _m _ _ _ _,:
0)
ul= a=LO C
ssf
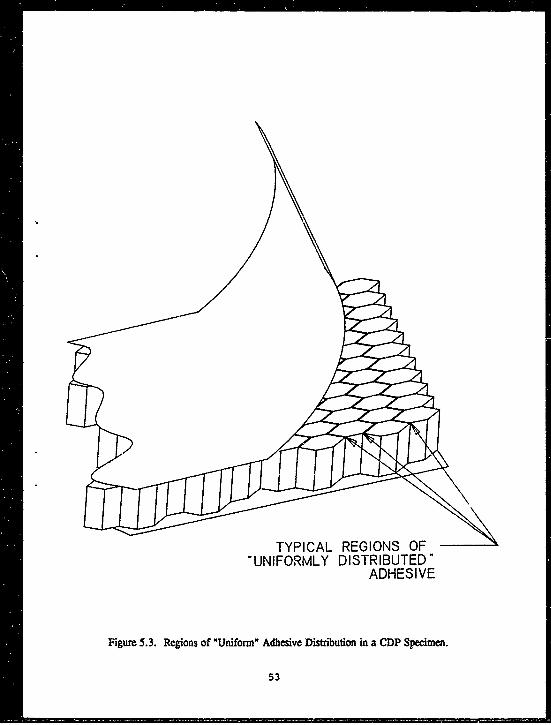
Finally, adhesive is not distributed evenly across the face of the skin, since
the glue adheres only to the edges of the cell walls. Due to this fact, it may
seem that thin adherends (thinner than what would be expected if the entire skin
surface area was adhering to the core)should be capable of maintaining
conformance to the drum. However, very small regions exist at cell wall
intersections where the adhesive may be considered to be uniformly distributed
(Figure 5.3). To ensure skin conformance at these locations, the adhesive
distribution can be considered uniform at all points across the adherend skin.
However, this may result in prescribed thicknesses too large for non-uniformly
distributed regions (and hence in higher uncertainty). Exchanging errors due to
nonconformity for smaller errors due to higher uncertainty is considercd
desirable.
52
TYPICAL REGIONS OF"UNIFORMLY DISTRIBUTED"
ADHESIVE
Figure 5.3. Regions of *Uniform* Adhesive Distribution in a CDP Specimen.
53
SECTION 6
CDP TEST RESULTS AND DISCUSSION
A series of climbing drum peel tests was conducted to establish the validity
of both calibration load estimations and minimum adherend thickness
predictions from the maximum cleavage stress criterion. Calibration load
estimates should be within 5% to reduce uncertainty in the calculation of peel
torque. Again, because the strain rate dependence of the adhesives was
unknown, the tests essentially were used to back calculate the correct strain rate
factors. Factors between I and 2 were considered to establish the validity of the
model. Parameters varied in the tests included adhesive strength and stiffness
and adherend thickness.
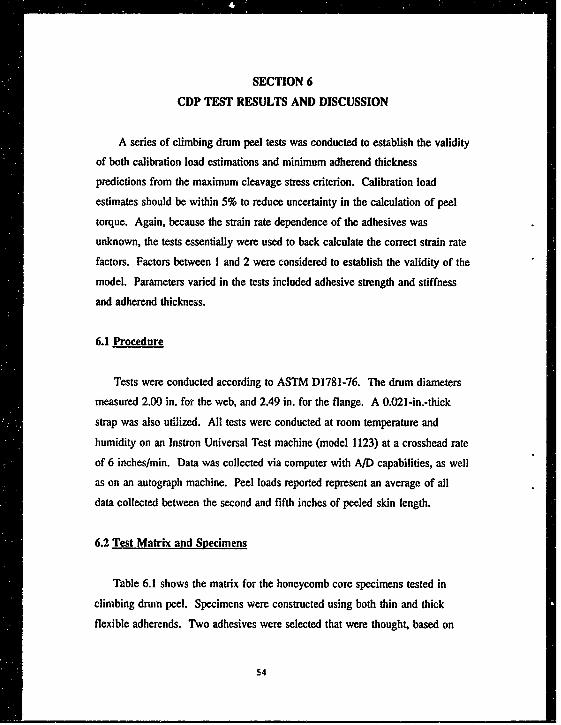
6.1 Procedure
Tests were conducted according to ASTM D1781-76. The drum diameters
measured 2.00 in. for the web, and 2.49 in. for the flange. A 0.021-in.-thick
strap was also utilized. All tests were conducted at room temperature and
humidity on an Instron Universal Test machine (model 1123) at a crosshead rate
of 6 inches/min. Data was collected via computer with A/D capabilities, as well
as on an autograph machine. Peel loads reported represent an average of all
data collected between the second and fifth inches of peeled skin length.
6.2 Test Matrix and Specimens
Table 6.1 shows the matrix for the honeycomb core specimens tested in
climbing drum peel. Specimens were constructed using both thin and thick
flexible adherends. Two adhesives were selected that were thought, based on
54
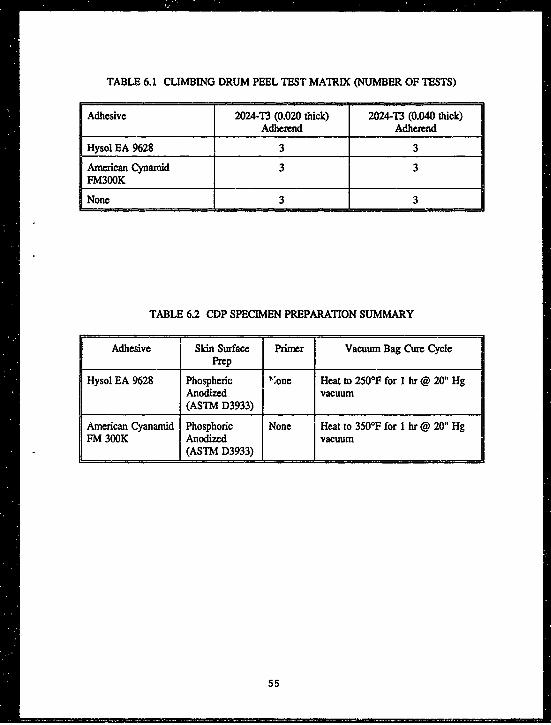
TABLE 6.1 CLIMBING DRUM PEEL TEST MATRIX (NUMBER OF TESTS)
Adhesive 2024-T3 (0.020 thick) 2024-T3 (0.040 thick)Adherend Adherend
Hysol EA 9628 3 3
American Cynamid 3 3FM300K
None 3 3
TABLE 6.2 CDP SPECIMEN PREPARATION SUMMARY
Adhesive Skin Surface Primer Vacuum Bag Cure CyclePrep
Hysol EA 9628 Phospheric ",one Heat to 250OF for I hr @ 20" HgAnodized vacuum(ASTM D3933)
American Cyanamid Phosphoric None Heat to 350OF for 1 hr @ 20" HgFM 300K Anodized vacuum
(ASTIM D3933)
55
vendor data, to provide dissimilar peel strength levels. Three specimens were
tested for each combination of adhesive and adherend thickness.
Specimens were prepared according to ASTM D1781-76 and individual
manufacturer's guidelines. Core material consisted of 1-inch aluminum
honeycomb with a nominal density of 7.9 PCF. Table 6.2 summarizes surface
preparations and cure conditions for the 12 bonded sandwich samples.
6.3 Calibration Load Estimates and Test Results
Table 6.3 displays the results of the 6 CDP unbonded skins run for
comparison to estimated adherend deformation energy (equation 5.3). For
comparison purposes, the same calculation was made using the numerical
technique of Kemp [I]. This was accomplished by neglecting the second and
third "stages" of the deformation model in [11, in which the adherend (or skin in
this case) travels around the roller and the load reverses, straightening out the
adherend.
As shown, the closed form (equation 5.3) and numerical approximations
slightly underestimate the force (within 5%) required to deform the 40 mil
calibration adherend (in comparison to the experimental results), while
overestimating (within 11%) the force required to deform the 20 mil adherend.
This is considered good agreement. The clos s form solution also gives
consistently higher values of deformation energy than the numerical method.
This is because the closed form solution considers only bending strain energy in
its formulation, while the numerical scheme superimposes the measured force as
an additional axial strain on the bending strain. Lower deformation energy (and
hence force) results.
56
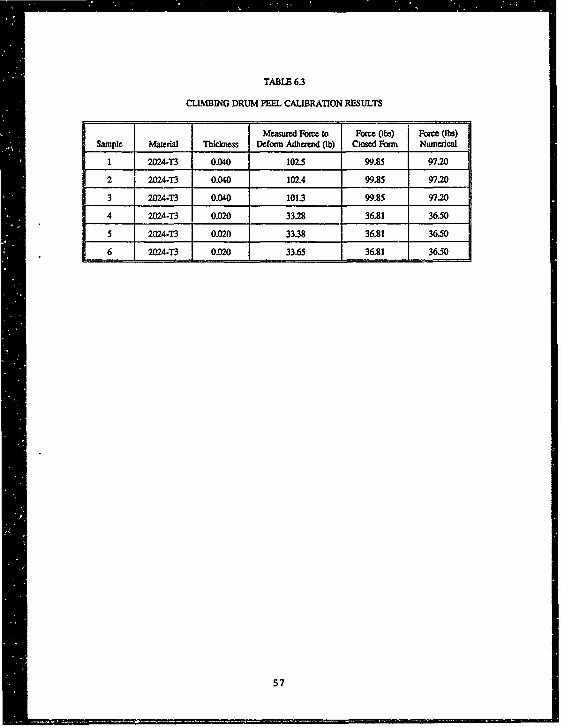
TABLE 6.3
CLLMBING DRUM PEEL CALIBRATION RESULTS
Measured Fore to Force (ebs) Force (lbs)Sample Material Thicatess Deform Adlerend Ob) Closed Form Numerical
1 2024-T3 0.040 102.5 99.85 97.20
2 2024-T3 0.040 102.4 99.85 97.20
3 2024-T3 0.040 101.3 99.85 97.20
4 2024-T3 0.020 33.28 36.81 36.50
5 2=024-T3 0.020 33.38 36.81 36.50
6 2024-T3 0.020 33.65 36.81 36.50
57
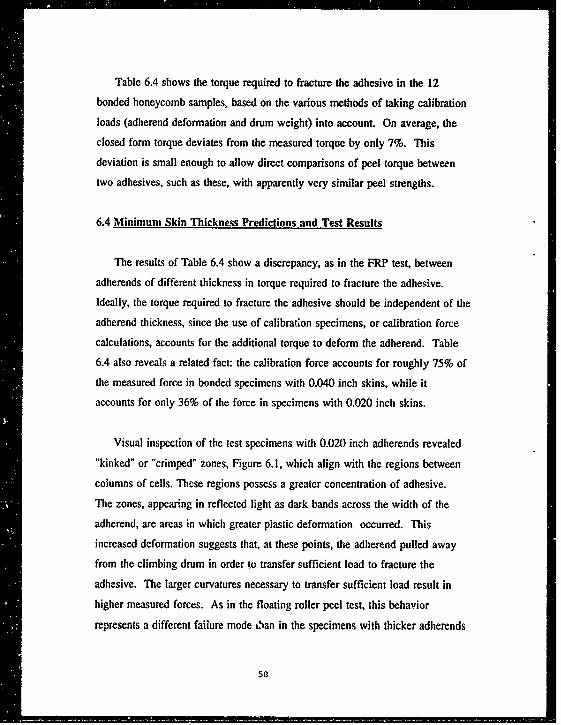
Table 6.4 shows the torque required to fracture the adhesive in the 12
bonded honeycomb samples, based on the various methods of taking calibration
loads (adherend deformation and drum weight) into account. On average, the
closed form torque deviates from the measured torque by only 7%. This
deviation is small enough to allow direct comparisons of peel torque between
two adhesives, such as these, with apparently very similar peel strengths.
6.4 Minimum Skin Thickness Predictions and Test Results
The results of Table 6.4 show a discrepancy, as in the FRP test, between
adherends of different thickness in torque required to fiacture the adhesive.
Ideally, the torque required to fracture the adhesive should be independent of the
adherend thickness, since the use of calibration specimens, or calibration force
calculations, accounts for the additional torque to deform the adherend. Table
6.4 also reveals a related fact: the calibration force accounts for roughly 75% of
the measured force in bonded specimens with 0.040 inch skins, while it
accounts for only 36% of the force in specimens with 0.020 inch skins.
Visual inspection of the test specimens with 0.020 inch adherends revealed
"kinked" or "crimped" zones, Figure 6.1, which align with the regions between
columns of cells. These regions possess a greater concentration of adhesive.
The zones, appearing in reflected light as dark bands across the width of the
adherend, are areas in which greater plastic deformation occurred. This
increased deformation suggests that, at these points, the adherend pulled away
from the climbing drum in order to transfer sufficient load to fracture the
adhesive. The larger curvatures necessary to transfer sufficient load result in
higher measured forces. As in the floating roller peel test, this behavior
represents a different failure mode 0ban in the specimens with thicker adherends
58
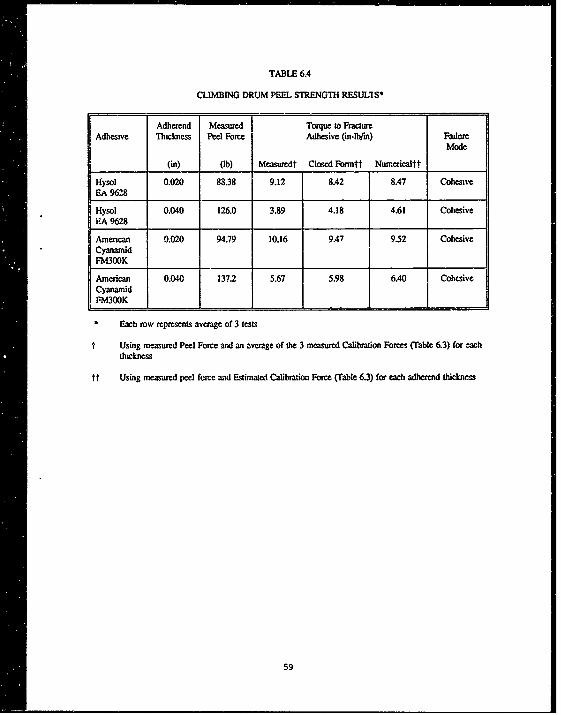
TABLE 6.4
CLIMBING DRUM PEEL STRENGTH RESUL'S*
Adherend Measured I Torque to FractureAdhesive Thickness Peel Force Adhesive (im-lbfm) Fadure
Mode
(in) (Ib) Measuredt Closed Formitt Numericalft
Hysol 0.020 88.38 9.12 8A2 8.47 CohesiveEA 9628
Hysol 0.040 126.0 3.89 4.18 4.61 CohesiveEA 9628American 0.020 94.79 10.16 9.A7 9.52 CohesiveCyanamid
FM300K
American 0.040 137.2 5.67 5.98 6.40 CohesiveCyanamidFM300K
Each row represents average of 3 tests
t Using measured Peel Force and an average of the 3 measured Calibration Forces (Table 63) for eachthickness
tt Using measured peel force and Estimated Calibration Force (Table 6.3) for each adherend thickness
59
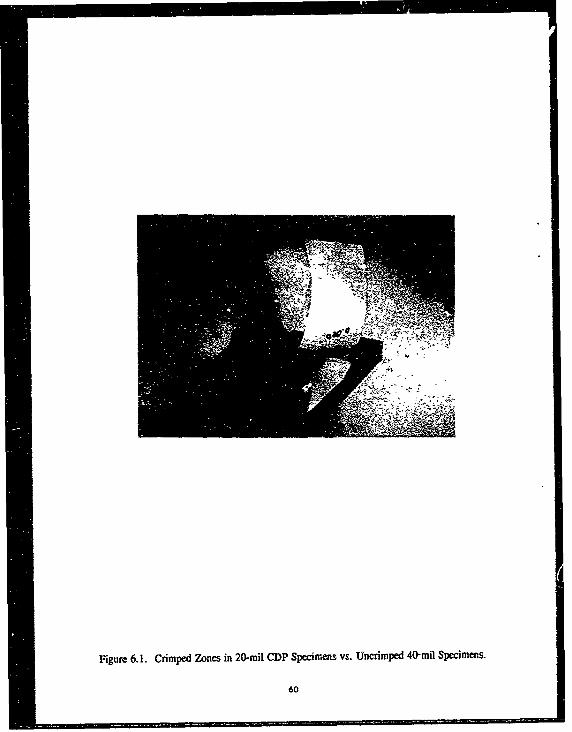
Figure 6. 1. Crimped Zones in 20-mil CDP Specimees vs. Uncrimped 40-mil Specimens.
60
which remain conformed to the roller, and results in higher apparent peel
strength.
The MCS Criteria for minimum adherend thickness, if valid, should predict
the above results. Table 6.5 shows the predicted minimum thicknesses for the
bonded CDP tests for a range of typical glueline thicknesses. Given that the
sample glue-line thicknesses are generally between 0.007 and 0.010 inches, and
the minimum adherend thickness is between 0.020 and 0.040 inches (since
0.040-inch specimens conformed while 0.020-inch specimens did not), the
predictions are too low.
This is the same result seen in the FRP predictions. It would appear that
strain rate may have some effect on the strength of the adhesive, as the CDP
test is conducted at stroke rates similar to the FRP. However, since the CDP
drum diameter is larger than the FRP roller diameter, the effect should be less
pronounced in the CDP test. Table 6.5 shows this to be the case, as the
required increase in adhesive strength is between I and 2 times. FRP tests
showed this value to be between 2 and 3 times. These results validate the use
of the MCS Criterion for predicting minimum adherend thickness to assure
conformance to the drum.
6.5 Iner" in NaneonfmLS w
Although it would be possible to calculate the additional energy expended in
nonconforming CDP skins, this procedure was not implemented. A simple
means for mounting a stationery grid (for angle measurements) to the test
fixture could not be found in a timely manner. From visual inspection during
the test, the distance the skin pulled away from the drum was very small
compared to the non-conforming FRP adherends. Estimations of additional
61
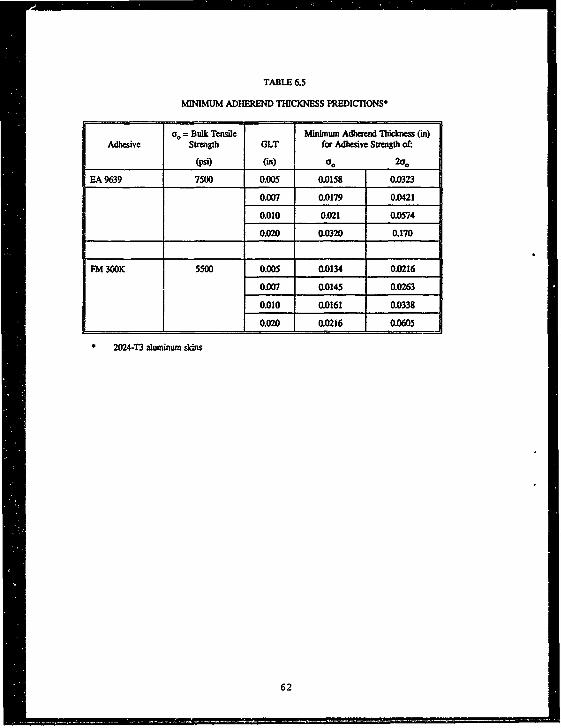
TABLE 6.5
MINIMUM ADHEREND THICKNESS PREDICTIONS*
oG= Bulk Tensile Minimum Adherend Thickness (in)Adhesive Strength OLT for Adhesive Strength of:
(1si) (im) FOo 2__o
EA 9639 7500 0.005 0.0158 0.0323
0.007 0.0179 0.0421
0.010 0.021 0.0574
0.020 0.0320 0.170
FM 300K 5500 0.005 0.0134 0.0216
0.007 0.0145 0.0263
0.010 0.0161 0.0338
0.020 0.0216 0.0605
* 2024-"3 aluminum skins
62
deformation energy without the benefit of a reference grid would be difficult. A
means for making angle measurements needs to be developed before accurate
data can be obtained.
63
SECTION 7
CONCLUSIONS AND RECOMMENDATIONS
The following conclusions are made:
The Maximum Cleavage Stress Criterion, as a first order estimate,
appears to reasonably predict the minimum flexible adherend thickness in
FRP and CDP tests if strain rate effects are accounted for. The predicted
thicknesses are particularly sensitive to the glueline thickness and strength
of the adhesive, and to the yield strength of the adherend material.
The bulk tensile strength of the adhesive utilized in the calculations
appears, from the literature, to be highly dependent on strain rate. Since
manufacturer's data consists of data derived from quasi-static tests, and
FRP and CDP tests are run considerably faster, the tensile strengths used
in minimum thickness calculations need to be increased. Factors in this
study range from just over 1 to 3 times. Values of this magnitude agree
with strength increases reported in the literature.
The additional energy consumed by adherends which do not conform
may be calculated in order to compare peel strengths with adherends
which do. However, results may still differ slightly since failure modes
are slightly different. In addition, this calculation requires collection of
additional data to measure the geometry of the nonconforming adherend,
"This may nnt be desirable in some cases.
The "% Work" of the adherend can be used as a diagnostic tool to
determine if adherends are indeed conforming. Adherend deformation
accounts for 60-75% of the test load measured in a bonded sample if the
64
adherend has conformed. If it has not, the adherend will appear to
account for less energy, 20-50%.
The calibration loads in a CDP test can be accurately calculated (to
within an average of 7% for the adherends tested in this study) with a
simple equation, eliminating the need for the testing of dummy samples.
CDP results suggest that the 20-rail adherend thickness suggested by
ASTM D1781-76 is inappropriate for higher peel strength adhesives. For
instance, a low strength adhesive (or high strength adhesive which
becomes low strength at elevated temperature) may result in a CDP test
in which a 20-mil adherend does conform to the drum. Comparison to
higher strength adhesives (or the same adhesive at room temperature)
would not be possible because adherend work in the higher strength test
would not be correctly calculated.
The following recommendations are made:
Investigate glue line effects of both FRP and CDP core samples.
- Experimentally investigate the behavior of CDP and FRP tests at other
temperatures. Validate that the temperature effects on minimum
thickness predictions can be based solely on changes in the material
properties of adhesive and adherend.
Investigate a wide array of typical adhesives to find out if the strain rate
effect is consistent from adhesive to adhesive for FRP and CDP tests.
Correlate these results to a battery of tensile tests which determine the
effect of strain rate on tensile properties.
65
An alternative approach may be developed to predict minimum adherend
thicknesses based on peel strength of the adhesive rather than bulk tensile
strength and strain rate effects. Although the criterion would require
knowing the peel strength of the material before the peel test is
conducted, it may be possible to develop a criterion in which uncertainty
in minimum adherend thickness is affected only slightly by uncertainty in
peel strength. In that case, the criterion would require only a ball-park
estimate of peel strength in order to adequately predict minimum
thickness.
Changes should be made in ASTM D3167 and D1781 that address the
question of adherend nonconformance to the roller or drum and what
adjustments in specimen design should be undertaken to correct
nonconformance.
Changes should be made in ASTM D3167 data reduction procedures to
account for adherend energy absorption and to report a more "pure"
adhesive peel strength.
66
REFERENCES
1. Kemp, R. David, R. A. Brockman and G. J. Stenger, "A Study of the
Floating Roller Peel Test for Adhesives," AFWAL-TR-87-4082, October
1987.
2. Kaelble, D. H., "Theory and Analysis of Peel Adhesion: Mechanisms and
Mechanics," Transactions of the Society of Rheology III 1959.
3. Kaelble, D. H., "Theory and Analysis of Peel Adhesion: Bond Stresses and
Distributions," Transactions of the Society of Rheolosy IV 1960.
4. Anderson, G. P., S. J. Bennett, and K. L. DeVries. Analyses and Testing of
Adhesive Bonds. Academic Press, New York, 1977.
5. Gent, A. N., "Adhesion of Viscoelastic Materials to Rigid Substrates II:
Tensile Strength of Adhesion Joints," Journal of Polymer Science, Part A-2,
Vol. 9, 1971.
67
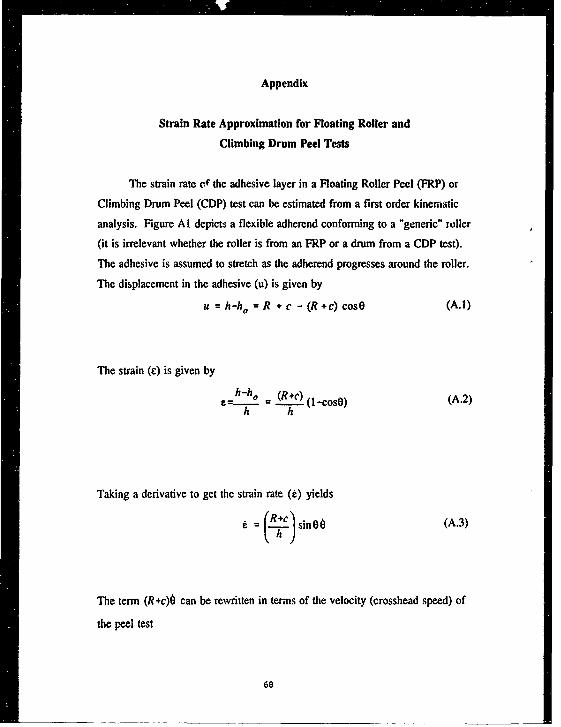
Appendix
Strain Rate Approximation for Floating Roller and
Climbing Drum Peel Tests
The strain rate of the adhesive layer in a Floating Roller Peel (FRP) or
Climbing Drum Peel (CDP) test can be estimated from a first order kinematic
analysis. Figure Al depicts a flexible adherend conforming to a "generic" ruller
(it is irrelevant whether the roller is from an FRP or a drum from a CDP test).
The adhesive is assumed to stretch as the adherend progresses around the roller.
The displacement in the adhesive (u) is given by
u = h-ho = R + c - (R +c) cosO (A.1)
The strain (E) is given by
h-h= (R+c() (A.2)h h
Taking a derivative to get the strain rate (E) yields
C = (.R ) sinO6 (A.3)
The term (R+c)O can be rewritten in terms of the velocity (crosshead speed) of
the peel test
68
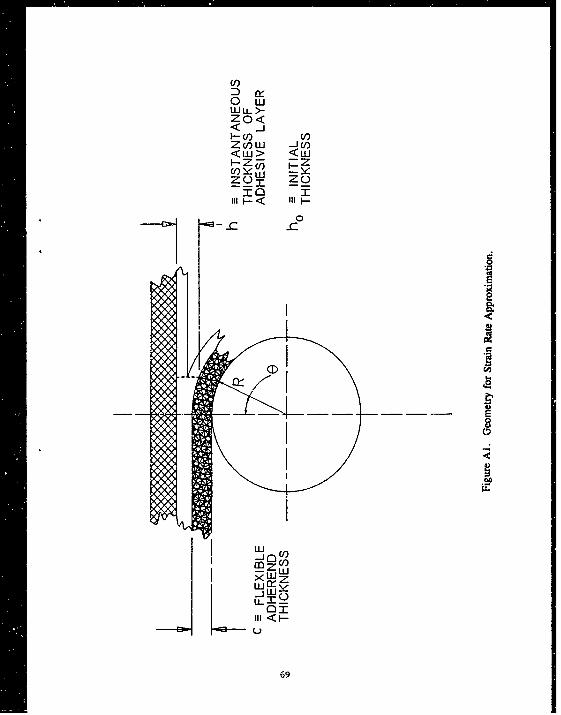
(f)
0Ow
ZO<< -
<Wi> <Lw
III< lIII -
-C 0-C
0
40
U)
SW
Wof z
69
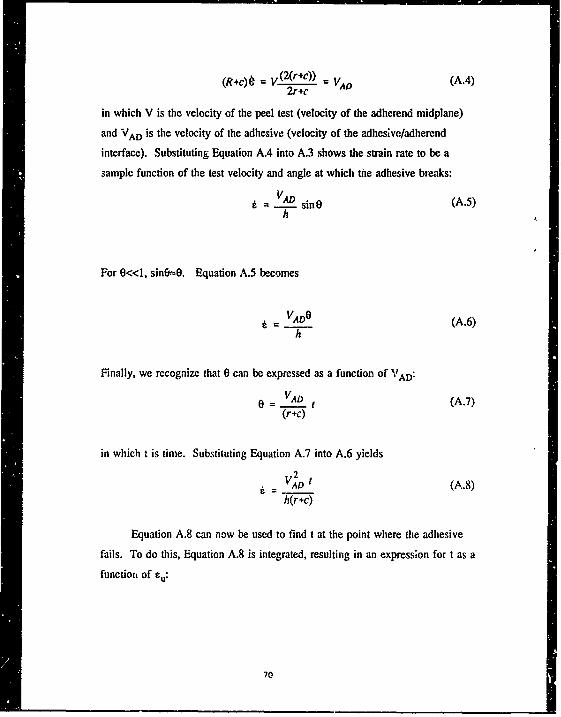
(R+c)ý = v(2(r+c)) = v, (A.4)
2r+c
in which V is the velocity of the peel test (velocity of the adherend midplane)
and VAD is the velocity of the adhesive (velocity of the adhesive/adherend
interface). Substituting Equation A.4 into A.3 shows the strain rate to be a
sample function of the test velocity and angle at which the adhesive breaks:
e =-VAD sin0 (A.5)h
For 0<<I, sin-•-O. Equation A.5 becomes
VADO (A.6)
h
Finally, we recognize that 0 can be expressed as a function of VAD:
0 = • VAD t (A.7)(r+c)
in which t is time. Substituting Equation A.7 into A.6 yields
VAD t (A.8)
h(r+c)
Equation A.8 can now be used to find t at the point where the adhesive
fails. To do this, Equation A.8 is integrated, resulting in an expression for t as a
function of cu:
70
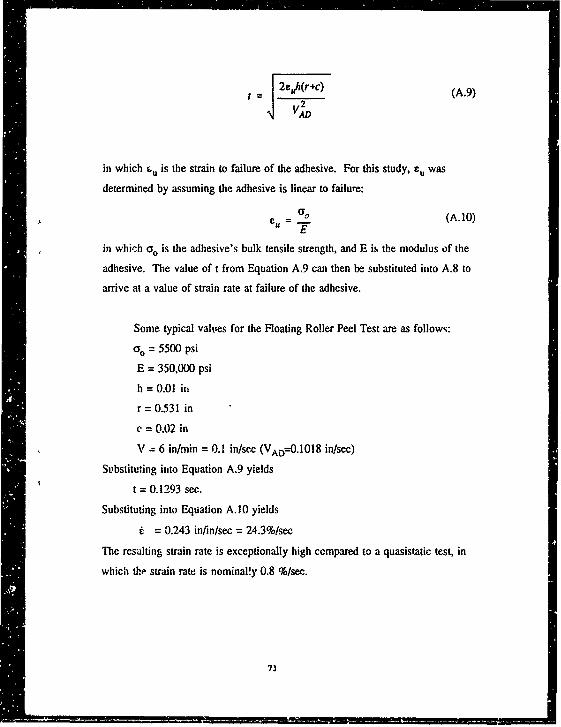
2eh(r+c) (A.9)
VAD
in which r, is the strain to failure of the adhesive. For this study, eu was
determined by assuming the adhesive is linear to failure:ia
C = (A.1O)E
in whic~h a. is the adhesive's bulk tensile strength, and E is the modulus of the
adhesive. The value of t from Equation A,9 can then be substituted into A.8 to
arrive at a value of strain rate at failure of the adhesive.
Some typical values for the Floating Roller Peel Test are as follows:
oo = 5500 psi
E = 350,000 psi
h = 0.01 in
0.531 in
c = 0.02 in
V = 6 in/min = 0.1 in/se c (VAD=0.101 8 in/sec)
Substituting into Equation A.9 yields
t = 0.1293 see.
Substituting into Equation A.10 yields
S= 0.243 in/n/sec = 24.3%/sec
The resulting strain rate is exceptionally high compared to a quasistatic test, in
which the strain rate is nominally 0.8 %/sec.
71
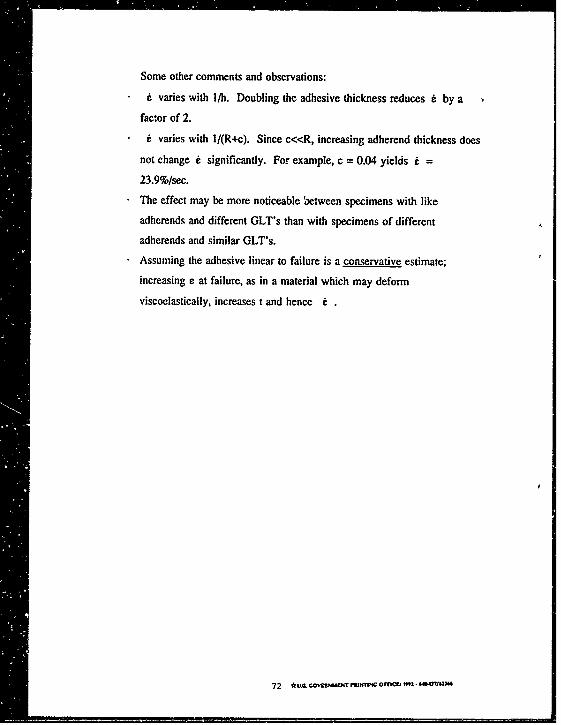
Some other comments and observations:
* e varies with 1/h. Doubling the adhesive thickness reduces , by a
factor of 2.
_ c varies with l/(R+c). Since c<<R, increasing adherend thickness does
not change e significantly. For example, c = 0.04 yields t =
23.9%/sec.
1 The effect may be more noticeable between specimens with like
adherends and different GLT's than with specimens of different
adherends and similar GLT's.
SAssuming the adhesive linear to failure is a conservative estimate;
increasing e at failure, as in a material which may deform
viscoelastically, increases t and hence t
72 *•t tO~@. O•4t " Iv' OFTTN 1991. Ul- -ts