Embed Size (px)
Citation preview
DETERMINATION OF MERCURY AND MERCURY
EXPOSURE IN PAKISTAN
A THESIS SUBMITTED TO
UNIVERSITY OF THE PUNJAB
FOR THE AWARD OF DEGREE OF
DOCTOR OF PHILOSOPHY
by
ZAIGHAM ABBAS
SUPERVISOR:
Prof. Dr. MUHAMMAD NAWAZ CH.
College of Earth and Environmental Sciences University of the Punjab, Quaid-e-Azam Campus,
Lahore – Pakistan
2014
i
DEDICATED
TO
My Loving Family Specially My Sweet
Daughter Sibgha Abbas
Their prays and guidance helped and enabled
me to
ACCOMPLISH THIS RESEARCH
ii
DECLARATION CERTIFICATE
This thesis which is being submitted for the degree of Ph.D. in the University of the Punjab
does not contain any material which has been submitted for the award of Ph.D. degree in
any University and to the best of my knowledge and belief, neither does this thesis contain
any material published or written previously by another person, except when due reference
is made to the source in the text of the thesis.
(Zaigham Abbas)
Ph.D. Scholar
College of Earth and Environmental Sciences
University of the Punjab
Lahore
iii
ACKNOWLEDGEMENTS
All praises to the Almighty Allah who induced the man with intelligence,
knowledge, sight to observe, mind to think and judge. Peace and blessings of Allah be upon
the Holy Prophet (PBUH) and his pure and pious progeny who exhorted his followers to
seek knowledge from cradle to grave.
I owe my heartfelt thanks to my worthy supervisor Prof. Dr. Muhammad Nawaz
Chaudhary (Professor Emeritus). Whose knowledge, skillful guidance, encouragement
and kindness have helped me in each and every stage of my research work. Indeed it is an
honor and pleaser for me to work with him.
I am also grateful to the Prof. Dr. Firdous-e-Bareen, Principal College of Earth &
Environmental Sciences, University of the Punjab, Lahore. I am thankful to Mr. Waheed uz
Zaman Scientific Officer, Institute of Chemistry, University of the Punjab, Lahore for
providing me research facilities during my research work. I would like to thank fellows of
Department of Chemistry, University of Aberdeen, Scotland, UK and UNEP Chemicals
Branch, Geneva, for providing me the necessary funds and advanced laboratories for
carrying out my research project.
I can never forget the prayers and untiring efforts of my parents, brothers and
sisters, who guided me and prayed for me in every step of my life.
In the last I want to thank my friends, Colleagues and labs fellows including Mr.
Abid Ali, Mr. Muhammad Ashraf, Ms. Khalida Bashir, Iqbal Hussain, Arshad Mahmood
Muzafar Majeed and Imran for their good wishes and moral support during the course of
my research work.
Zaigham Abbas
iv
ABSTRACT
The overall aim of this study was to identify and quantify mercury releases in
Pakistan. It was observed that most of the waste water and solid samples collected from all
the four provinces of the country, show mercury contamination. Although the results are
lower than NEQS limits but only marginally. It also reflects that all the sectors of society
and industry have exposure to mercury. This study was focused only on limited industries
as well as industrial, sewerage effluents and solid waste sites.
The maximum mercury concentration was found at the solid waste disposal sites in
all areas of provinces of Pakistan. These high results are due to the dumping of mercury
and its compounds in municipal and industrial waste without prior segregation. However,
this value of mercury is dangerous for humans as well as a disaster for aquatic life. The
proper disposal or removal of mercury from the solid waste could be a reliable mitigation
measure for the toxicity of mercury.
This study was also focused on the determination of mercury in exposed people. It
can be seen that in human hair sample groups 1, 2 and 3, most of the hair samples (T-Hg
concentration) exceed the normal value (2.0 µg/g) recommended by the WHO (1990). This
can be related to prolonged exposure of workers to the mercury vapour. Apparently, longer
the duration of exposure, higher the value of total mercury (T-Hg) found in their hair
samples. For example, in group No.1, the workers come into contact with mercury and
mercury vapour at the work place (Ittehad Chemicals Limited employing chlor-alkali
process using mercury cell technology) thus resulting in high concentration of T-Hg in
their hair samples.
In group No.2 were the workers of the factory who have completely phased out
mercury cell technology. The high concentration of T-Hg in hair samples of these workers
might be due to exposure to the contaminated areas. The group No. 3 in close vicinity to
mercury usage has an even lower level of mercury, owing to better occupational practices
and proper knowledge. However, in group No.4, lower concentrations of total mercury in
hair samples were recorded as a result of limited exposure to mercury involving students
v
and staff at Punjab University, Lahore.
It is for the first time in the history of Pakistan that a preliminary study on the issue of
the use and release of mercury in the country has been carried out for its use as a key
document for nationally sound management of mercury release. In this study area, the
responsible stakeholders of concerned ministries, their line agencies and local authorities
were involved in conducting survey on mercury use and release sources in all the four
provinces of Pakistan.
While carrying out the survey at the concerned ministries, provincial departments,
local authorities and various sites, many problems were faced regarding critical gaps in
making and keeping statistical records, such as lack of reliable data and information from
various generating/releasing sources. In this regard, most data/information was obtained by
estimations made by local line institutions and as a result, some difficulty was faced in
calculating actual levels of the release of mercury into the environment. Despite these
challenges, the survey activities have sensitized the stakeholders on mercury issues and
related harmful effects to human health and the ecosystem. Nevertheless, a concerted effort
was made in obtaining and calculating the release of quantity of mercury into the
environment and it is concluded that the total quantity of mercury released in Pakistan is:
Maximum emission and transfer: 36898 Kg per year
Minimum emission and transfer: 10842 Kg per year
This study is the first step which would prove a milestone towards conducting a
full-fledged assessment covering all the sectors in due course of time. For such a full
inventory, it will be necessary to collect all information from various sectors/fields as
specified in categories and sub-categories addressed in the UNEP’s Toolkit, which reflects
Pakistan’s context.
This mercury inventory will assist the decision makers of the country in the sound
management of mercury leading to the provision of benefits for not only the existing
generation but also the future generations.
vi
ABBREVIATIONS
UNEP United Nations Environment Programme
WHO World Health Organization
ATSDR Agency for Toxic Substances and Disease Registry
RPA Risk and Policy Analysis Limited
USGS United States Geological Survey
EC European Commission
Me-Hg Methyl mercury
US EPA United States Environmental Protection Agency
NJ MTF New Jersey Mercury Task Force
ESPs Electrostatic Precipitators
OECD Organization for Economic Cooperation and Development
B.P Blood Pressure
EPAs Environmental Protection Agencies
NGOs Non-Government Organizations
PPM Parts Per Million
vii
TABLE OF CONTENTS Dedication i
Declaration Certificate ii
Approval Certificate
Acknowledgment iii
Abstract iv
Abbreviations vi
Table of Contents vii
List of Tables x
List of Figures xiii
INTRDUCTION ------------------------------------------------------------------------------------ 1
1.1. Historical background -------------------------------------------------------------------------- 2
1.2. Chemistry ---------------------------------------------------------------------------------------- 3
1.3. Production, uses and environmental fate ---------------------------------------------------- 4
1.3.1. Production ------------------------------------------------------------------------------------- 4
1.3.2. Uses ----------------------------------------------------------------------------------------- 6
1.3.3. Environmental fate --------------------------------------------------------------------------- 6
1.3.3.1. Atmosphere --------------------------------------------------------------------------------- 6
1.3.3.2. Soil ------------------------------------------------------------------------------------------- 7
1.3.3.3. Vegetation ---------------------------------------------------------------------------------- 8
1.3.3.4. Aquatic systems, sediments and methylation ------------------------------------------ 8
1.4. Objectives of the study ----------------------------------------------------------------------- 11
REVIEW OF LITERATURE ------------------------------------------------------------------- 13
2.1 Sources and releases of mercury ------------------------------------------------------------- 13
2.2 Uses of mercury and mercury compounds -------------------------------------------------- 23
2.3 Mercury exposure ------------------------------------------------------------------------------- 28
MATERIALS AND METHODS --------------------------------------------------------------- 33
3.1. Identification and quantification methodology -------------------------------------------- 33
viii
3.1.1. Identification of mercury releases --------------------------------------------------------- 35
3.1.2. Quantification of mercury releases -------------------------------------------------------- 35
3.2. Collection of samples-------------------------------------------------------------------------- 36
3.2.1. Waste water and soil samples -------------------------------------------------------------- 36
3.2.2. Hair samples ---------------------------------------------------------------------------------- 36
3.3. Preparation of samples ------------------------------------------------------------------------ 37
3.3.1. Waste water sampling ----------------------------------------------------------------------- 37
3.3.2. Sampling of soil matrices ------------------------------------------------------------------- 37
3.3.3. Hair sample preparation -------------------------------------------------------------------- 38
3.4.Techniques used for determining of mercury ----------------------------------------------- 39
3.4.1 Method of Cold Vapour Atomic Absorption Spectroscopy (CV-AAS) -------------- 39
3.4.1.1. Chemical reagents ------------------------------------------------------------------------ 40
3.4.1.2. Glassware ---------------------------------------------------------------------------------- 40
3.4.2 Cold Vapour Atomic Fluorescence Spectrometry (CV-AFS) ------------------------- 40
3.4.2.1. Chemical reagents ------------------------------------------------------------------------ 41
3.4.2.2. Glassware ---------------------------------------------------------------------------------- 41
3.4.2.3. General operation procedure ------------------------------------------------------------ 41
3.5. Analytical performance characteristics ----------------------------------------------------- 42
3.5.1 Quality control -------------------------------------------------------------------------------- 42
3.5.2. Limit of detection (L.O.D) ----------------------------------------------------------------- 42
3.5.3 Calibration data ------------------------------------------------------------------------------- 43
RESULTS AND DISCUSSION ----------------------------------------------------------------- 44
4.1 Results of waste water and solid samples from the country ---------------------------- 45
4.1.1 Discussion ------------------------------------------------------------------------------------- 52
4.2 Results of mercury from human hair samples ---------------------------------------------- 52
4.2.1. Comparison with other studies ------------------------------------------------------------- 61
4.3. Data from the markets of Lahore, Karachi, Quetta, Kasur, Rawalpindi and Research
Institutes ---------------------------------------------------------------------------- 64
ix
4.4. Quantification of mercury releases ---------------------------------------------------------- 69
4.4.1 Natural gas - extraction, refining and use ------------------------------------------------ 72
4.4.2. Primary metal production-small scale gold mining ------------------------------------ 73
4.4.3. Production of other minerals and materials with mercury impurities ---------------- 74
4.4.4 Intentional use of mercury in industrial processes --------------------------------------- 75
4.4.5 Consumer products with intentional use of mercury ------------------------------------ 78
4.4.6 Other intentional products/process uses --------------------------------------------------- 84
4.4.6.1 Source description ------------------------------------------------------------------------- 84
4.4.7 Production of recycled metals (secondary metal production) -------------------------- 86
4.4.8 Waste incineration ---------------------------------------------------------------------------- 86
4.4.9 Waste deposition/land filling and waste water treatment ------------------------------- 89
4.4.9.1. Controlled landfills sites ----------------------------------------------------------------- 89
4.4.9.2. Informal waste disposal ------------------------------------------------------------------ 91
4.4.9.3. Waste water treatment ------------------------------------------------------------------- 92
4.4.10 Crematoria and cemeteries ---------------------------------------------------------------- 93
4.4.11 Identification of potential hot-spots ------------------------------------------------------ 93
4.5.Overview of the mercury inventory results ------------------------------------------------- 94
4.6.Overall Conclusion --------------------------------------------------------------------------- 100
CONCLUSIONS AND RECOMMENDATIONS ---------------------------------------- 102
5.1. Conclusions ----------------------------------------------------------------------------------- 102
5.2. Recommendations --------------------------------------------------------------------------- 104
REFERENCES ----------------------------------------------------------------------------------- 106
APPENDICES
x
LIST OF TABLES
Table 1: Determination of T-Hg in CRM NIES -13& CRM IAEA 085 -------------------- 42
Table 2: Calibration data for mercury ------------------------------------------------------------ 43
Table 3: Results of samples from Sindh (Karachi etc) ----------------------------------------- 45
Table 4: Results of samples from Punjab (Lahore, Sheikhupura, Faisalabad etc) --------- 47
Table 5: Results of samples from Baluchistan (Quetta etc) ----------------------------------- 49
Table 6: Results of samples from N.W.F.P (Peshawar etc) ----------------------------------- 50
Table 7:Total mercury concentration in human hair samples of workers in Ittehad
Chemicals Limited, Kala Shah Kaku ---------------------------------------------------- 53
Table 8:Total mercury concentration in human hair samples of workers in Sitara
Chemicals Industries Limited, Faisalabad ---------------------------------------------- 54
Table 9: ----- Total mercury concentration in human hair samples of technicians/doctors in
Punjab Dental College and Hospital, Lahore ------------------------------------------ 55
Table 10:Total mercury concentration in human hair samples of students and staff of
Punjab University, Lahore ---------------------------------------------------------------- 56
Table 11:Comparison of T-Hg concentrations from this study with other different studies
of different exposed populations worldwide ------------------------------------------- 62
Table 12: Cheap Chemicals Store, Lahore ------------------------------------------------------ 64
Table 13: Akbari Chemicals Store, Lahore ------------------------------------------------------ 64
Table 14: Merck (Pvt.) Ltd, Lahore -------------------------------------------------------------- 65
Table 15: Nawab Chemical Store, Karachi ------------------------------------------------------ 65
Table 16: Dawawala Chemical Corporation, Karachi ----------------------------------------- 65
Table 17: Mohammad Jamil Sons, Karachi ----------------------------------------------------- 65
Table 18: Rahat Chemicals, Quetta --------------------------------------------------------------- 65
Table 19: Alam Instruments & Chemicals, Quetta --------------------------------------------- 66
Table 20:Kasur Tannery Waste Management Agency (KTWMA), Kasur ----------------- 66
xi
Table 21:Shalimar Scientific Store, Rawalpindi ------------------------------------------------ 66
Table 22: Scientific Home, Rawalpindi ---------------------------------------------------------- 66
Table 23: Nobel Scientific Traders, Rawalpindi ------------------------------------------------ 67
Table 24: Medi Plus Chemist, Rawalpindi ------------------------------------------------------ 67
Table 25: Shaheen Chemist, Rawalpindi -------------------------------------------------------- 67
Table 26: Khattak Chemist, Rawalpindi --------------------------------------------------------- 67
Table 27: City Surgical, Rawalpindi ------------------------------------------------------------- 68
Table 28: The Mall Chemist, Rawalpindi ------------------------------------------------------- 68
Table 29: W. Watson Chemist, Rawalpindi ----------------------------------------------------- 68
Table 30: Institute of Chemistry, University of the Punjab, Lahore ------------------------- 68
Table 31: Pakistan Council for Scientific and Industrial Research (PCSIR), Lahore ----- 69
Table 32: Local production of coal in Pakistan (July 07 to 30 June, 2008) ----------------- 70
Table 33: Toolkit calculation for mercury releases from coal sector ------------------------ 70
Table 34: Toolkit calculation for mercury releases from extraction of crude oil ---------- 71
Table 35: Toolkit calculation for mercury releases from use of gasoline, diesel and other
distillates ------------------------------------------------------------------------------------- 72
Table 36: Toolkit calculation for mercury releases from natural gas ------------------------ 73
Table 37:Toolkit calculation for mercury releases from cement production --------------- 75
Table 38: Chlor-alkali industry in Pakistan ----------------------------------------------------- 76
Table 39: Toolkit calculation for mercury releases from chlor-alkali sector --------------- 77
Table 40: Toolkit calculation for mercury releases from thermometer with mercury ----- 79
Table 41: Toolkit calculation for mercury releases from fluorescent tubes (double end) 80
Table 42: Toolkit calculation for mercury releases from metal halide lamps -------------- 81
Table 43: Toolkit calculation for mercury releases from alkaline, other than button cell
shapes ---------------------------------------------------------------------------------------- 82
xii
Table 44: Toolkit calculation for mercury releases from mercury oxide (all sizes) also
called mercury-zinc cells ------------------------------------------------------------------ 83
Table 45: Toolkit calculation for mercury releases from other intentional product/process
use -------------------------------------------------------------------------------------------- 85
Table 46: Quantity of medical waste incinerated per year ------------------------------------ 87
Table 47: Toolkit calculation for mercury releases from medical waste incineration ----- 88
Table 48: Toolkit calculation for mercury releases from controlled landfills/deposits --- 90
Table 49: Toolkit calculation for mercury releases from informal dumping of general waste
------------------------------------------------------------------------------------------------ 91
Table 50: Toolkit calculation for mercury releases from waste water treatment ---------- 92
Table 51: Summary of mercury release from all categories ---------------------------------- 94
Table 52: Type of mercury release per category ------------------------------------------------ 96
xiii
LIST OF FIGURES
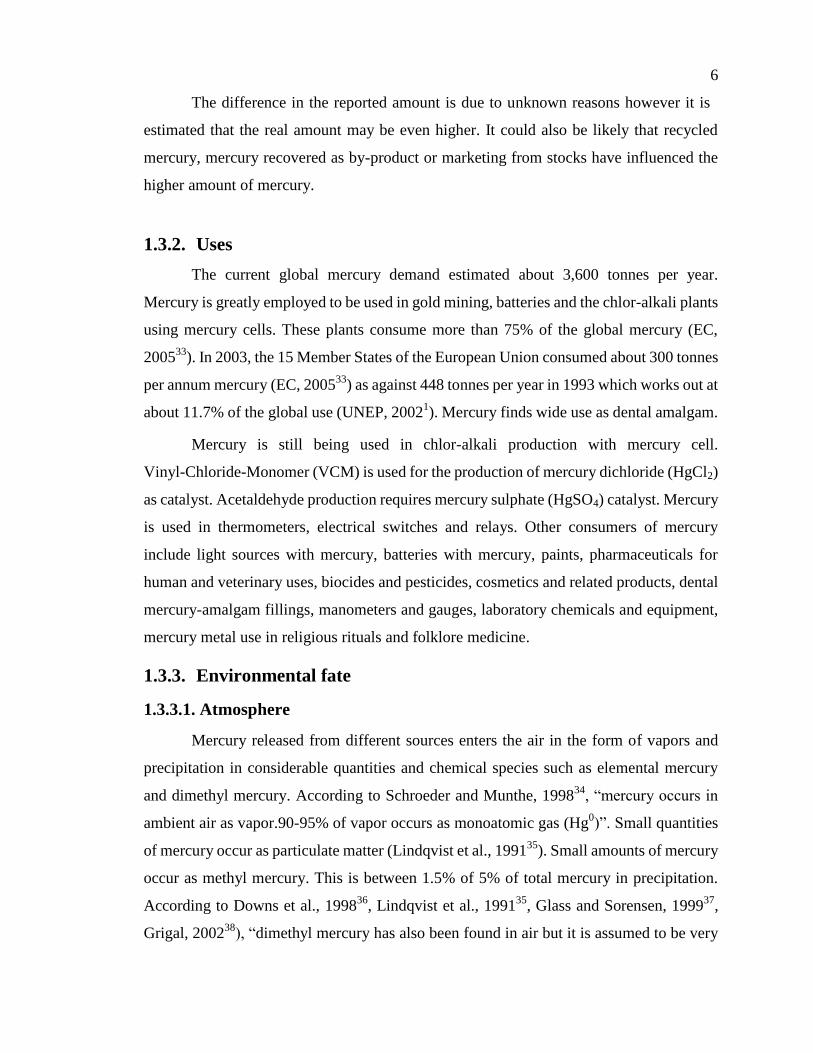
Fig.1: Global Annual Mercury Mining Production --------------------------------------------- 5
Fig 2: Schematic diagram of continuous flow vapour generator and AFS detector.
(Modified from PS Analytical 10.125 Millennium Excalibur, User Manual .Issue No 2.2)
--------------------------------------------------------------------------------------------------------- 41
Fig 3:Concentration of T-Hg (µg/g) in human hair samples ranked for their concentration.
--------------------------------------------------------------------------------------------------------- 57
Fig.3a: Concentration of T-Hg (µg/g) in human hair samples (n=72). The line indicates the
WHO value of 2 µg/g. ------------------------------------------------------------------------------ 57
Fig. 3b: Concentration of T-Hg (µg/g) in human hair samples (n=72). CA1 is Ittehad
Chemicals, Sheikupura; CA2 is Sitara Chemicals, Faisalabad. Dental represents the
samples from workers in dental surgery facilities. --------------------------------------------- 58
Fig. 4: Location of study area in Punjab Province, Pakistan ---------------------------------- 59
Fig. 5: Mercury input in environment ------------------------------------------------------------ 96
Fig.6: Total mercury releases in air (Kg per year) ---------------------------------------------- 97
Fig.7: Mercury releases in water (Kg per year) ------------------------------------------------- 97
Fig.8: Mercury releases in land (Kg per year) -------------------------------------------------- 98
Fig 9: Regional mercury consumption (2005) -------------------------------------------------- 99
1
CHAPTER 1
INTRDUCTION
Mercury and mercury compounds exist in the globe and are stable in the
atmosphere. Mercury is found in the natural form that is liberated due to usual phenomena
as well as anthropogenic activities. Once mercury is exposed into the atmosphere, it
changes into a range of chemical and physical transformations amongst atmosphere,
lithosphere and hydrosphere. Humans, plants, and animals usually get exposed to mercury
and gather it during this biogeochemical cycle which might affect various health impacts
(UNEP, 20021).
According to WHO, 1990, 19912-3
, ―mercury and mercury compounds are harmful
substances that are categorized in the main cluster of environmental pollutants. The
hazardousness of mercury and mercury compounds depend on chemical structure.
Inhalation of mercury vapor and intake of methyl mercury are the two major routes of
human revelation to mercury. Workers are exposed to mercury in industry and business
during mercury mines, gold mining where Hg is used for gold recovery, mercury
dispensing and sales and thermometer manufacturing factories and dental clinics‖. One of
the significant source of human exposure to elementary mercury is dental amalgam filling
(Clarkson, 1988)4.
Mercury occurs in inorganic, organic and elemental forms. At ordinary temperature
and pressure metallic mercury exist in liquid form. Metallic mercury is potential source of
vapors in air. A large amount of mercury is found in the form of elemental mercury vapor
in the environment. In other spheres, apart from environment, inorganic mercury salts and
organomercurials predominate.
Inorganic mercury compounds are used in a number of manufacturing processes.
Mercury compounds have been extensively employed in batteries and various other
products including fungicides, sanitizers or disinfectants. Numbers of mercury compounds
are available, though, methyl mercury is most known in the foodstuffs and atmosphere.
Organic mercury compounds are known for their use as fungicides and in pharmaceutical
compounds like mercurochrome are used topical antiseptics likewise thiomersal are
employed for their use as a preservative in vaccines. The salts of phenyl mercury have been
2
used as pharmaceutical, fungicides and in cosmetics to hinder the propagation of
micro-organisms. Phenyl mercury acetate had been used in paint as a preservative. Ethyl
mercury, methyl mercury and phenyl mercury occur mostly as acetates and chlorides.
According to ATSDR, 19995, ―the inhalation of mercury vapor, intake of mercury
contaminated drinking water and exposure to mercury through medical treatments may
impact animals and humans. Intake through food is the main source of unintentional and
non-professional exposures to mercury‖.
1.1. HISTORICAL BACKGROUND
Mercury, also known as quicksilver, is a heavy, silvery-white metal (D=13.56)
which is liquid at room temperature and evaporates easily. In nature, it is usually found in
the form of cinnabar (HgS), used in the past as a red pigment. Cinnabar deposits have been
mined for centuries to produce mercury. However, mercury minerals may occur associated
with deposits of other metals such as lead and zinc and mercury may be produced as a
byproduct. Mercury may also be found in small amounts in a wide range of rocks including
coal and limestone. Mercury can be released into the air, water and soil through
anthropogenic as well as natural sources.
Mercury has been used since antiquity. Archaeologists have recovered traces from
Mayan tombs and from the remains of Islamic Spain (Bank, 2012 6). The first emperor of
unified China is said to have died after ingesting mercury pills intended to give him eternal
life (Asia History website). Metallic mercury is still used in some herbal and religious
remedies in Latin America, Asia and Caribbean rituals (ATSDR, 1999 5).
Mercury was discovered from Egyptian tombs as old as 1500 BCE7. Earlier in
Tibet and China, mercury was intended to treat fractures, provide good health and prolong
life8. Mercury was an important constituent of ointments used by ancient Greeks. Use of
mercury in cosmetics dated back to old Egyptians and Romans where it rarely faded the
face 9-10
.Whereas significance of mercury in ancient metallurgy can be visualized by their
use in making amalgams with other metals in 500 BC11
. The Indian word for alchemy is
―rasavātam‖ which meant for "the way of mercury‖ 12
.
Alchemists regarded mercury as the mother of all elements i.e. altering the quality
and quantity of sulfur present with mercury other metals could be synthesized. The main
3
focus of the alchemists was to alter the impure metals to gold. Mercury is the only metal
for which the alchemical terrestrial name became the common name13
.
Hg is the symbol for mercury stands for hydrargyrum, that is Latinized form of the
Greek word Ύδραργσρος (hydrargyros) which is a hybrid meant for "water" and "silver‖.
This is in allusion to the fact that mercury is a liquid like water and it possess silver metallic
sheen14
. The name mercury is given after the name of Roman god (linked with planet
mercury) which is related to swiftness and mobility.
The oldest mine around 2500 years ago in Europe was the Almadén mine of Spain
followed by other important mines namely Monte Amiata (Italy) and Idrija (now
Slovenia). These three mines remained the major focus for production in Almadén about
2500 years ago until new deposits were explored at the end of 19th
century15
.
Use of mercury in making pools was reported from Islamic Spain, Later on,
Alexander Calder an American artist, in 1973 at the World Exhibition in Paris fabricated a
mercury fountain for the Spanish Pavilion which is at present on display at Fundació Joan
Miró in Barcelona16
.
In making of felt hats from the mid-18th to the mid-19th centuries "carroting" was
used where an orange coloured compound mercuric nitrate, Hg (NO3)2·2H2O, was used for
rinsing animal skins to separate the hairs from the skin of animals and to tangle hairs
together17
. The solution used was highly toxic and produce strong vapours. Thus it was
banned by the United States Public Health Service in the felt industry by December 1941.
Elemental mercury has unique characteristics. It is liquid at room temperature,
good electrical conductor, very high density and high surface tension. It is the only liquid
metal that is used in a large number of products and procedures exploiting its unique
characteristics.
1.2. CHEMISTRY
According to Cotton and Wilkinson, 198818
, ―mercury occurs in three valence
states: elemental mercury (also known as metallic mercury, Hg0), mono-valent mercurous
(Hg2++
), and the divalent mercuric (Hg++
). Elemental mercury is the most stable form and
does not react readily with oxygen or water‖ Mercuric and mercurous mercury are
thermally unstable. They decompose readily to elemental mercury under heat, light
4
exposure and treated with reducing agents. Hg0 is only merely soluble in water. However
greater solubility is observed in organic solvents as compare to water. Elemental mercury
could be source of vapors even at room temperature posing hazard during spillages‖.
The main mineral of mercury is cinnabar (HgS) which is water insoluble. Hg++
has
generally high affinity for sulfur and mercaptans. Elemental mercury reacts with elemental
sulfur and hydrogen sulfide (but not mercaptans) (Nowak and Singer, 200019
, Wilhelm et
al., 200620
). Humic compounds in sediments, soil and water form stable complexes with
Hg++
which are relatively least effected by change in pH (Jackson, 199821
, Skyllberg et al.,
200622
). Another mercury compound namely mercuric chloride (HgCl2) is covalent and
linear molecule in its aqueous as well as organic solvent solutions (Greenwood and
Earnshaw, 199723
). According to Nowak and Singer, 200024
, ―HgCl2 is soluble in water as
well as in some organic solvents‖.
According to Jackson, 199821
, ―halides of methyl mercury, as well as together with
dimethyl mercury are linear molecules like HgCl2. Organometallic Hg++
compounds are
resistant to oxidation and hydrolysis and are kinetically stable in water and O2‖. ―The
chemical affinities of methyl mercury for ligands, including organic matter, is equivalent
to Hg++
but the stability constants of methyl mercury complexes with these ligands are
always lower than for the corresponding Hg+2
complexes. Furthermore, unlike Hg+2
,
methyl mercury easily and quickly exchanges one thiol group for another‖ (Jackson,
199821
,Boudou et al., 199125
).
1.3. PRODUCTION, USES AND ENVIRONMENTAL FATE
1.3.1. Production
Mercury is a lithophil element. Its average crustal abundance is projected
approximately 0.05µg/g (DeVito, 200526
). The mercury content in mercury ores is around
one percent. However, mercury content is 12-14 percent in ores excavated from Spain.
Mercury in trace amounts is present throughout the biosphere. Mercury in coal, oil and gas
is manly derived from precursor, terrestrial and marine flora
According to UNEP, 20021, RPA, 2002
27, ―the Hg production has varied widely
since it came into use at about 2500 years ago. After the industrial revolution, the global
production peaked in the early 1970s at approximately 10,000 tons per year. In 2000, the
5
global production from Hg ores was about 2,000 tonnes/year which was supplement by
approximately2,000 tonnes/year as a byproduct of other metals‖.
The world production was estimated at about 4100 metric tons/year by USGS
(199028
) and 5356 metric tons/year according to Gobi International 199829
and Sznopek
and Goonan, 200030
). USGS (199631
) assessed the production of mercury at 2795 metric
tons whereas; according to Gobi International 199829
it is 3337 metric tons. The difference
in the reported amount is due to unknown reasons however it is estimated that the real
amount may be even higher. It could also be likely that recycled mercury, mercury
recovered as by-product or marketing from stocks have influenced the higher amount of
mercury.
Accordance to Lawrence, (200032
) ―on a worldwide basis, the amount of
by-product mercury was estimated at about 4000 metric tons per year‖.
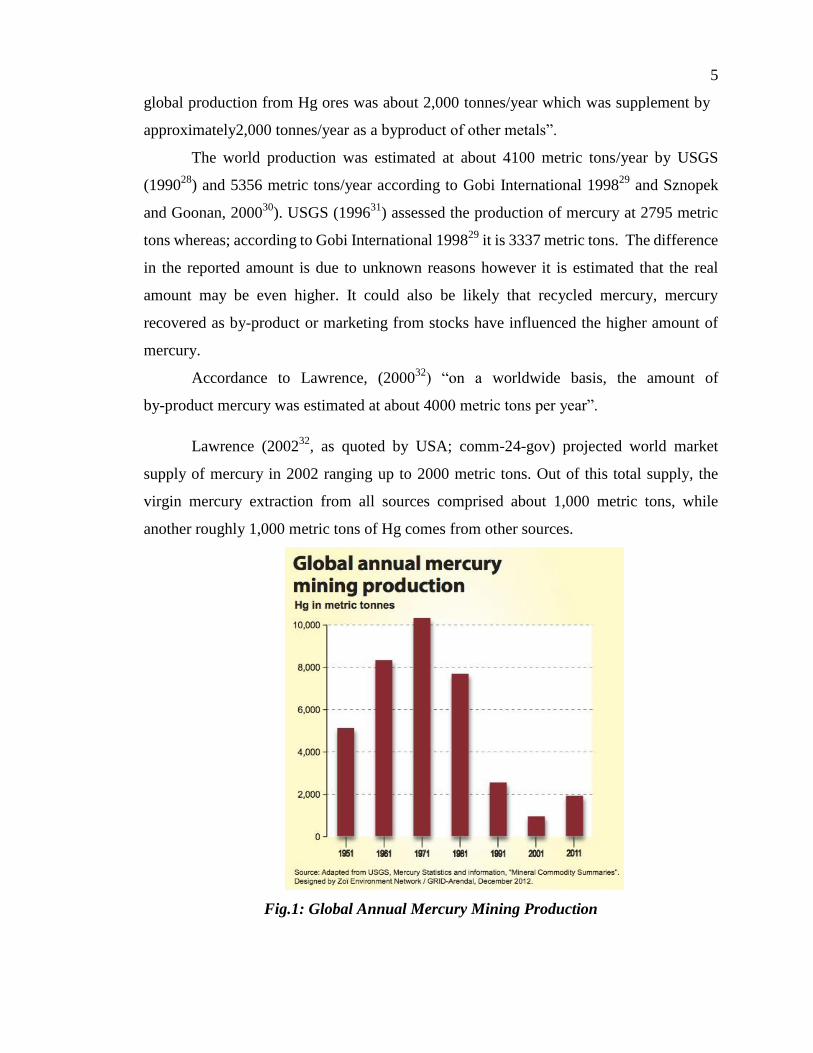
Lawrence (200232
, as quoted by USA; comm-24-gov) projected world market
supply of mercury in 2002 ranging up to 2000 metric tons. Out of this total supply, the
virgin mercury extraction from all sources comprised about 1,000 metric tons, while
another roughly 1,000 metric tons of Hg comes from other sources.
Fig.1: Global Annual Mercury Mining Production
6
The difference in the reported amount is due to unknown reasons however it is
estimated that the real amount may be even higher. It could also be likely that recycled
mercury, mercury recovered as by-product or marketing from stocks have influenced the
higher amount of mercury.
1.3.2. Uses
The current global mercury demand estimated about 3,600 tonnes per year.
Mercury is greatly employed to be used in gold mining, batteries and the chlor-alkali plants
using mercury cells. These plants consume more than 75% of the global mercury (EC,
200533
). In 2003, the 15 Member States of the European Union consumed about 300 tonnes
per annum mercury (EC, 200533
) as against 448 tonnes per year in 1993 which works out at
about 11.7% of the global use (UNEP, 20021). Mercury finds wide use as dental amalgam.
Mercury is still being used in chlor-alkali production with mercury cell.
Vinyl-Chloride-Monomer (VCM) is used for the production of mercury dichloride (HgCl2)
as catalyst. Acetaldehyde production requires mercury sulphate (HgSO4) catalyst. Mercury
is used in thermometers, electrical switches and relays. Other consumers of mercury
include light sources with mercury, batteries with mercury, paints, pharmaceuticals for
human and veterinary uses, biocides and pesticides, cosmetics and related products, dental
mercury-amalgam fillings, manometers and gauges, laboratory chemicals and equipment,
mercury metal use in religious rituals and folklore medicine.
1.3.3. Environmental fate
1.3.3.1. Atmosphere
Mercury released from different sources enters the air in the form of vapors and
precipitation in considerable quantities and chemical species such as elemental mercury
and dimethyl mercury. According to Schroeder and Munthe, 199834
, ―mercury occurs in
ambient air as vapor.90-95% of vapor occurs as monoatomic gas (Hg0)‖. Small quantities
of mercury occur as particulate matter (Lindqvist et al., 199135
). Small amounts of mercury
occur as methyl mercury. This is between 1.5% of 5% of total mercury in precipitation.
According to Downs et al., 199836
, Lindqvist et al., 199135
, Glass and Sorensen, 199937
,
Grigal, 200238
), ―dimethyl mercury has also been found in air but it is assumed to be very
7
short-lived‖. Half-life of mercury is only a few hours thus; it oxidizes quickly (Niki et al.,
198339
, Lin and Pehkonen, 199940
).
According to Lamborg et al., 200241
, ―the global average level of mercury in the
atmosphere at present is 1.6 ng/ m3‖.The total mercury levels range between 1-50 ng/L
(Lindqvist et al., 199135
, Hall, 199542
, Downs et al., 199836
). However, reported volume
weight ranges from to 5-15 ng/L in unpolluted North Temperate areas (Grigal, 200238
).
Hg+2
following oxidation of elemental mercury is found in precipitation as a major form
(Munthe et al., 199143
Hall, 199542
,Lin and Pehkonen, 199940
). Reduction in Long term
mercury levels has been found through various studies in the atmosphere of Europe and
North-America during the last 20-30 years (Iverfeldt et al., 199544
Slemr and Schell,
199845
Kock et al., 200546
Steffen et al., 200547
Temme et al., 200748
,Wängberg et al.
200749
).
1.3.3.2. Soil
According to Skyllberg et al., 200650
, ―the main form of mercury found in soil is
Hg+2
‖.Complexing of Hg+2
with soil organic phases is the dominant process by which
mercury is fixed in soil. The most toxic form of mercury i.e. methyl mercury occurs is very
small proportion (at 0.01- 2% of the total mercury) (Lindqvist et al., 199135
Davis et al.,
199751
, Grigal, 200352
).The dimethyl mercury compared to methyl mercury occurs in very
low concentration. The dimethyl mercury is less than 1/1000 times of methyl mercury
(Davis et al., 199751
). Because of strong complexing of Hg with soil organic matter, it
retention time is long. The assimilated mercury thus potentially contribute to other media
for hundreds to thousands years (UNEP, 20021, Hissler and Probst, 2006
53).
Notwithstanding the fact that a significant range of mercury contents have been
reported from soils, most agricultural soils and the vegetation have very low values of
mercury. According to Archer and Hodgson, 198754
, ―an average range was 0.02 to 0.40
µg/g, the contents of mercury in excess are to be considered contaminated‖(Kabata-
Pendias, 200155
).
According to Schlüter, 200056
, Tack et al., 200557
, Rodrigues et al., 200658
, ―urban
soils contain quite variable but generally higher levels of mercury compared to
rural/agricultural soils. However, soils within the influence of natural or anthropogenic
emission sources are likely to contain very high levels of mercury‖.
8
1.3.3.3. Vegetation
Mercury plays no role in the metabolism of vascular plants. The roots of plants
retard mercuric mercury transport up the plant. The concentration of mercury in plants is
usually lesser than in water and soil (Grigal, 200238
, 200352
, Millhollen et al., 200659
). The
atmospheric route is the main source of mercury for plants (Grigal, 200352
, Ericksen et al.,
200360
, Rea et al., 200161
, Millhollen et al., 200659
). Mercury is taken from air as dry
deposition as well as in gaseous Hg0 form (and gaseous Hg
+2-compounds) (Grigal, 2002
38).
Again the plant transport system does not transmit mercury to other parts. At best the
transportation is to a very narrow range (Lindqvist et al., 199135
). According to Grigal,
200238
, 200352
, ―the relative proportions of methyl mercury to total mercury in plant
foliage, is generally comparable to that in precipitation. This would very strongly suggest
atmospheric derivation‖.
1.3.3.4. Aquatic systems, sediments and methylation
The aquatic environment contains mercury in different physical and chemical
forms. The chemical species that matter are differential complexes of the mercuric ion
formed with various ligands both organic and inorganic, methyl mercury, dimethyl
mercury and elemental mercury.
According to Ullrich et al., 200162
, ―speciation chemistry of the Hg+2
ion in oxidic
waters is dominated manually by organic complexes. In freshwater (oxygenated water)
more than 90% of Hg+2
is complexed by dissolved organic matter‖. Sulphides are the key
control in anoxic waters on the speciation chemistry of Hg+2
and methyl mercury (Jackson,
199863
).
According to Ullrich et al., 200162
, ―between 10 and 30% of dissolved mercury in
oceans and lake water is elemental mercury‖. During summer season, the surface waters
are mostly supersaturated with Hg0 in the context of water atmosphere equilibrium
(Gårdfeldt et al., 200164
, Anderson et al., 200765
).
According to Lindqvist et al., 199135
, ―methyl mercury containing up to 10% total
mercury in lake waters of Sweden have been reported‖. However, dimethyl mercury was
not found in detectable amounts (Ullrich et al., 200162
). Methyl mercury is usually between
10% to 40% of total mercury in ocean waters (Leermarkers et al., 200166
, Kotnik et al.,
200767
, Horvat et al., 200368
, Mason and Sullivan, 199969
, Mason et al., 199870
).
9
Formulation of methyl mercury in water and sediments usually takes place through
methylation process by biotic processes.
According to Kotnik et al., 200767
; Horvat et al., 200368
, ―dimethyl mercury at
<0.5% of total mercury in the Mediterranean Sea is found at depths below 20 to 40 m‖.
Sediment dimethyl mercury is known to form by methyl mercury in the presence of a
sulfide phase (Quevauviller et al., 199271
; Baldi et al., 199572
; Weber et al., 199873
; Stein et
al., 199674
).
The mercury level in uncontaminated freshwaters may generally in accounts <5
ng/L. Median values of 3.1 to 6.2 ng/L of mercury were reported in 25 Swedish lakes
(Lindqvist et al., 199135
). Higher concentrations 10 or 20 ng/L could be recovered in humic
lakes or rivers which are rich in particulate mercury (Ullrich et al., 200162
). The
concentration of mercury may reach up to μg/L range in contaminated water (Ullrich et al.,
200162
). The marine concentrations of mercury are much lower and range from 0.1 to 1
ng/L (Leermarkers et al., 200166
, Kotnik et al., 200767
, Horvat et al., 200368
, Mason and
Sullivan, 199969 ,
Mason et al., 199870
).
In aquatic systems methylation of mercury takes place. Due to this reason, water
dwelling life forms and fish eating birds and animals have usually higher levels of mercury
compared to terrestrial animals. No wonder the concentration of ethyl mercury increase
with trophic level and age. According to Dehn et al., 200675
, ―arctic zooplanktons contain
between 1 to 10 g/kg wet weight while top predators like beluga whale (toothed whale,
Delphinapterus leucas), polar bears (Ursus maritimus) and ringed seals (Phoca hispida)
may contain >10,000 g/kg in their livers‖. Livers and kidney of marine mammals contain
for more methyl mercury than other body parts. In muscle tissue, the main form of mercury
is methyl mercury. However due to a process of demethylation, the livers of many marine
mammals and seabirds show a decrease in methyl mercury with increase in total
concentration of mercury (Gaskin et al., 197976
, Falconer et al., 198377
, Chen et al., 200278
, Endo et al., 200479
, Thompson and Furness, 198980
, Wagemann et al., 199881
, 200082
).
The aforementioned statistics and data bring up clearly the fact the mercury has
significantly been entered in the environment through human industrial activities. It is not
only the environmental issue but directly and seriously related to the biological systems in
and around us. As the problem has been diagnosed and the data collected, now is the right
10
time to take serious steps towards reduction in production and release of mercury in
environment so that it no longer is a threat for earth’s eco system. The Minamata
Convention is one such effort where the global consensus is observed for the reduction and
finally elimination of mercury from industrial processes.
The Minamata Convention on Mercury is a global treaty to protect human health
and the environment from the adverse effects of mercury. It was agreed at the fifth session
of the Intergovernmental Negotiating Committee in Geneva, Switzerland on 19 January
2013.The Diplomatic Conference of Plenipotentiaries on the Minamata Convention on
Mercury and its preceding open-ended intergovernmental Preparatory Meeting were held
from 7-11 October 2013 in Kumamoto and Minamata, Japan. The Minamata Convention
on Mercury was officially opened for signature on 10 October, and in its first two days was
signed by 91 countries and the European Union. Currently, 100 countries signed and one
country ratified this Convention.
The major highlights of the Minamata Convention on Mercury include a ban on
new mercury mines, the phase-out of existing ones, control measures on air emissions, and
the international regulation of the informal sector for artisanal and small-scale gold mining.
The Convention draws attention to a global and ubiquitous metal that, while
naturally occurring, has broad uses in everyday objects and is released to the atmosphere,
soil and water from a variety of sources. Controlling the anthropogenic releases of mercury
throughout its lifecycle has been a key factor in shaping the obligations under the
Convention.
Under the provisions of the Minamata Convention, Governments have agreed on a
range of mercury-containing products whose production, import and export will be banned
by 2020. These items have non-mercury alternatives that will be further phased in as these
are phased out. They include:
Batteries, except for 'button cell' batteries used in implantable medical devices
Switches and relays
Some compact fluorescent lamps
11
Mercury in cold cathode fluorescent lamps and external electrode fluorescent
lamps
Soaps and cosmetics (mercury is used in skin-whitening products)
Some mercury-containing medical items such as thermometers and blood pressure
devices.
Mercury from small-scale gold-mining and from coal-fired power stations
represent the biggest source of mercury pollution worldwide. Miners inhale mercury
during smelting, and mercury run-off into rivers and streams contaminates fish, the food
chain and people downstream.
Under the Minamata Convention, Governments have agreed that countries will
draw up strategies to reduce the amount of mercury used by small-scale miners and that
national plans will be drawn up within three years of the treaty entering into force to reduce
- and if possible eliminate - mercury. The Convention will also control mercury emission
and releases from large-scale industrial plants such as coal-fired power stations, industrial
boilers, waste incinerators and cement clinkers facilities. Besides the Minamata
Convention, there is another entity focusing the mercury issue, the UNEP global mercury
partnership.
1.4. OBJECTIVES OF THE STUDY
Mercury is proven toxic and persistent in the environment. It directly affects human
beings and ecosystem. The control of mercury use and its release needs a clear picture of
mercury route at national and global level. To cure and prevent the mercury toxicity to
environment/humans, there must be a baseline information on the use, reuse and
processing of mercury at national level. Such data would help policy makers prepare
guidelines for stakeholders and to predict any alarming situations on mercury toxicity.
Prior to this study, there was hardly any information on mercury and its products in
Pakistan. The people are unaware of identification of potential mercury sources, the
exposure risk, environmentally safe methods of disposal and reuse of mercury and its
products. The workers of the industries/users are being exposed carelessly to mercury and
mercury products. Assessment and quantification of mercury in Pakistan would play a
critical role in saving human and wildlife from toxic mercury exposure.
12
Different mercury and mercury products are being used in Pakistan. Unfortunately,
there are no or insufficient regulations over the usage and safe disposal of mercury related
products. Mercury using industries in other countries have made some developments in the
reuse of mercury wastes though they are still in the initial stages. The current practices of
the disposal of mercury products within Pakistan have been studied with respect to their
environmental and economic aspects. The following steps have been taken:
Evaluation of current status of mercury and mercury products.
Selection of areas susceptible to mercury contamination.
Collection and analysis of wastewater, solid and hair samples for detection of
mercury.
Preparation of mercury base line data about the current situation.
Assessment of risk to general public based on the collected data.
Establishing a relationship between data collected/generated and point / area source
locations.
Awareness on the health impacts of mercury exposed people.
Developing of mercury waste management plans for priority sectors
This study will help to estimate as to which source is contributing to what extent
towards the mercury releases to the environment. With the help of facts and figures
obtained in this research, the necessary documents are being prepared which will serve as
future guidelines for control of mercury pollution.
This research is aimed to provide baseline study and awareness of environmentally
safe reuse/disposal options of mercury products. The adoptions of these reuse options may
provide the users some financial recovery thus mitigating impacts on the products cost as
well. The communities suffering from unsafe disposal of mercury products will be direct
beneficiaries of the outcome of this research. The overall objectives of this study are given
below;
i. To develop the baseline data of mercury and its products in Pakistan.
ii. To identify the sources of mercury exposure to the different sectors of society.
iii. study the impacts of mercury and mercury products on workers.
iv. quantify the mercury exposure sources.
v. To develop mercury waste management plans to reduce the risk of mercury
exposure.
13
CHAPTER 2
REVIEW OF LITERATURE
Mercury is a naturally occurring element found in air, water and soil, though its
ultimate source is the crust of the Earth. Its distribution in the environment is due to both
natural processes as well as anthropogenic activities. Mercury occurs in various inorganic
and organic forms and is obstinate in the environment. The main three forms of the
mercury include: a) elemental mercury identified by chemical symbol Hg0; b) ionic or
inorganic mercury having chemical symbol Hg (II)or Hg2+
. Hg2+
occurs in nature as Hg (II)
mercuric compounds or complexes in solution; and c) The organic mercury or methyl
mercury with the chemical symbol of Me-Hg. Its occurrence in environment is of
particular concern.
2.1 SOURCES AND RELEASES OF MERCURY
The most significant mercury releases to the environment are through emissions to
air but mercury is also released from industrial, health and other sources directly to water
and land. A fact that is basic to the understanding of mercury’s pathways in society and the
environment is that mercury is an element and, although it may change between different
forms in its cycle, it cannot be broken down or degraded into harmless substances.
Food chains both aquatic and terrestrial, which are harvested from mercury
contaminated areas, bio-accumulate methyl mercury. Although substitutes are available,
mercurial sphygmomanometer and fever thermometers are widely marketed throughout
the world. Cost effective and safe devices are now replacing mercurial devices and
products.
UNEP Mercury Products Partnership, a mechanism for delivery of immediate
actions, has set the goal of reducing demand for mercurial sphygmomanometer and fever
thermometers devices by at least 70 per cent by 2017.
Most of the world’s 600,000 tonnes of mercury reserves are found mainly in China,
Kyrgyzstan, Mexico, Peru, Russia, Slovenia, Spain and Ukraine (USGS, 201283
). Out of
these countries, only one namely Kyrgyzstan is still exporting mercury from primary ore.
14
In 2005, UNEP estimated global annual mercury demand between 3,000 and
3,900 tonnes (UNEP, 200684
). Demand for mercury has fallen significantly over the last 50
years, from 9,000 tonnes a year in the 1960s to 7,000 in the 1980s and 4,000 tonnes a
decade later (UNEP, 200684
). Mercury under the programme of UNEP is being phased out
due to the availability of substitutes and the realization of its toxicity.
Considering the present trends, the overall use of mercury will decline. However,
reduction in mercury use is problematic in the production of Vinyl Chloride Monomer
(VCM), small scale gold mining and in artisanal applications which together account for
45% of global demand.
Anthropogenic mercury emissions into the air accounted for 1960 tons in the year
2010.According to UNEP (201385
), the total emission of mercury on global scale has
remained more or less stable between 1990 and 2010.The geographical distribution has
varied significantly. Due to economic development and population increase, the regions of
Southern and Eastern Asia now account for almost 50% of anthropogenic mercury vapour
emissions into the air. The regions of South America and Sub- Saharan Africa now account
for 30 % of global anthropogenic atmospheric mercury emissions. The mercury emissions
in these regions are still increasing .On the other hand due to concerted efforts, legislation
and control measures, the mercury emissions in North America and Europe have touched a
low level of 8 % (UNEP, 201385
).
Restriction on the use of mercury will, over time result in reduction of mercury
containing devices and products requiring disposal and storage in environmentally
acceptable ways. In 2012, UNEP helped Argentina and Uruguay to develop a regulatory
framework and to find environmentally sound solutions for the storage and disposal of
excess mercury. Both countries developed National Action Plans for the environmentally
sound management of mercury and mercury wastes.
The Global Mercury Assessment: Sources, Emissions, Releases and Environmental
Transport (UNEP, 201385
) states that total global atmospheric emissions of mercury from
human activity in 2010 were estimated to be approximately 1960 (1010 – 4070)
tonnes/year.
Fitzgerald et al., 199886
, Jackson 199787
and Lamborg et al., 200288
tried to
15
estimate and differentiate between natural and anthropogenic mercury emissions in
order to emphasize the significance of human contributions. According to Coolbaugh et al.,
200289
, ―natural mercury sources are responsible for less than 50 percent of the total
mercury releases‖.
According to Lindquist et al., 198490
and Bergan et al., 199991
, ―on the global level
the anthropogenic emissions and deposition rates of mercury are 1.5 to 3 times higher than
those of pre-industrial period. The deposition rates of mercury in environment increased by
2 to 10 fold during the last 200 years in and around industrial areas‖.
According to Mason et al., 199492
, ―the worldwide natural emissions of mercury
are about 1650 metric tons/ year‖. Lamborg et al., 200288
expected 1400 metric tons/ year.
Bergan and Rohde, 200193
expected global natural mercury emissions up to 2400 metric
tons out of which about 1300 metric tons per year comes from land and oceans contribute
up to 1100 metric tons.
According to Lacerda, 199794
, ―the worldwide annual mercury releases into
environment of 460 metric tons from gold extraction in the late 1980’s/early 1990’s which
constituted about 10 percent of the total global anthropogenic releases‖.
According to Pilgrim, 199895
, ―the atmospheric mercury concentrations were
measured at 360 – 4470 ng/m3
over three landfill sites compared to ambient mercury
concentration of 1.5 – 2.0 ng/m3
across Ontario, Canada‖. Mercury also evaporates from
landfill sites. Environment Canada reported mercury concentration in landfill gas of about
10 ng/m3
(Canadian submission, sub 42 gov). Meanwhile, Lindbergh et al., 200196
indicated that mercury emissions from landfills may be higher than earlier assessment.
Maag et al., 199697
reported that around 3.5-4 metric tons of mercury a year was
transported to Denmark during 1992-1993 for recycling. According to Groupe de travail de
1, AGHTM, 199998
, ―2.8 metric tons a year recycled mercury was present in France.
However, major wastes from chlor-alkali production, electrical contacts and laboratories,
among others were not included in the evaluation‖.
According to Pirrone et al., 200199
, ―the amount of mercury in coal varies
considerably depending on the type and the origin of the coal. For example, mercury
contents may vary by an order of magnitude even within the same coal field. Available data
16
indicate that the amount of mercury in coals may vary between 0.01 - 8.0 ppm‖.
According to Bragg et al., 1998100
, ―mercury contents in 7000 samples of US coal at an
average of 0.17 mg/kg where 80% were below 0.25 mg/kg and the main single value was
1.8 mg/kg‖.
According to Pacyna and Pacyna, 2000101
, the removal/retention of vapour mercury
by spray dryers for coal combustors and incinerators is in Scandinavia and the USA. In
general, removal of mercury varied between 35 to 85% in different spray dry systems. The
maximum removal efficiencies were achieved in spray dry systems fitted with downstream
fabric filters‖.
According to US EPA, 1997102
, ―mercury contents in crude oil are nearly between
0.023 - 30 mg/kg. Mercury concentrations in oil depend on the local geology. The use of
certain types of drilling mud is another input of mercury to oil extraction‖. Pirrone et al.,
200199
reported that mercury is present in crude oil on average up to 10 ppb but in some
cases as it may reach high as 30,000 ppb.
Wilhelm and Bigham, 2002103
noted that 0.2 % of crude oil was processed with
high mercury concentration samples from a small field in California, USA. Shah et al.,
1970104
, Filby and Shah, 1975105
and Bloom, 2000106
excluded the samples from this field.
The mean value decreased up to 1000 times for three datasets with unusual high mean
values.
According to COWI, 2002107
and US EPA, 1997102
, ―the mercury contents in
natural gas depend on the geology of the hydrocarbon fields. Mercury emissions may occur
during extraction, refining, gas cleaning steps and use‖.
According to Pirrone et al., 200199
, ―the mercury contents in pipeline quality gas
are mostly below 10 μg/m3 level in Europe. However, the unrefined natural gas is likely to
have higher mercury contents‖.
COWI, 2002107
determined that a mercury emission in environment is dependent
on the level of mercury in fuel and amount of fuel burnt. Friedli, H.R. et al., 2001108
found
that the tree and mainly their needles and leaves absorb the atmospheric mercury and this
mercury is again released when wood and other biomass is burnt in the atmosphere.
17
According to US EPA, 1997102
and NJ MTF, 2002109
, ―the average content of
mercury from wood burned is about 0.002 ppm in the USA. All of the mercury emitted
from the wood burned is released into the air‖.
US EPA, 1997102
recommended an average atmospheric emission factor of 0.0026
g mercury per metric ton of wood burned .The same factor is in USA for wood combusted
in boilers.
In USA, Friedli et al., 2001108
found the mercury contents in garbage and
vegetation from seven different locations ranged between 0.01 – 0.07 mg Hg/kg dry
weight.
In Denmark Skårup et al., 2003110
estimated mercury content of burned straw and
wood between 0.007 - 0.03 mg/kg dry weight.
According to Kindbom and Munthe, 1998111
, ―in Sweden mercury content in fuel
wood on dry basis was between 0.01 - 0.02 mg/kg dry weight and 0.03 - 0.07 mg/kg dry
weight in willow wood. In bark, mercury content was 0.04 mg/kg dry weight whereas the
mercury content was 0.3 - 0.5 mg/kg dry weight in fir needles‖.
Feng et al., 2004112
reported that broad local ambient mercury pollution from zinc
production with original technology took place in the Hezhang area in the Guizhou
province in China. They calculated mercury contents in ores and coals used and in smelting
residues and coal ashes. Nriagu and Pacyna, 1988113
reported 25 g Hg/metric ton of zinc
production. They further verified that mercury produced in zinc smelting residues is
readily leachable by water.
According to US EPA, 1997102
, ―the releases of mercury occur mainly during the
drying/roasting of the feed stock and during the smelting. Converters and refining furnaces
may also emit mercury residues from the material during the copper extraction process‖.
The levels of mercury in the ores vary and can be high compared to other natural
raw materials in some cases (COWI, 2002107
).
According to Maag, 2004114
, ―gold extraction processes from the placers and other
ores is an important source of mercury emissions. Gold extraction from ores is one of the
main sources of mercury releases among metal extraction activities in the Arctic countries.
Mercury releases to both land and the atmosphere from this activity may be significant‖.
18
According to US EPA, 2003a115
, ―5474 kg of mercury were emitted to air, 0.4
kg to water, 1,886 kg to site land while 594 kg were released off-site from a total of 25 gold
mines in the western USA‖. Jasinski, 1994116
reported that 114 metric tons of mercury was
produced from gold mining operations in 1990 as byproduct. One silver mine in Nevada
remained source of 6.4 kg of mercury in air and 15911 kg in land during the year 2001(US
EPA 2003 a115
).
According to Lassen et al., 2004117
, ―the main sources of iron ores contain
0.02-0.085 mg/kg Hg in the Russian Federation while the release of mercury is 0.06 mg/kg
during pig iron manufacturing in the Russian Federation‖.
According to Berndt, 2003118
, ―the amount of mercury lies between 0.001 to 0.016
mg/kg in the ore concentrate and varied from 0.001 to 0.040 mg/kg in the tailings‖.
Pacyna and Pacyna, 2000101
estimated the release factor 0.04g per metric ton
production of pig iron in Russian Federation, inclusive of all raw materials used. About
99% of the mercury from this source was released in to the air.
According to Cembureau, 1999119
, ―a small proportion of mercury is retained by
the clinkers. The balance escapes the kiln along with dust and exhaust gas. Mercury
condenses between 120-150° C on particles in the kiln system‖. Kiln emissions may be
reduced by fabric filters (FFs) and ESPs. However, the efficiency of these devices in the
removal of mercury is not clear (Pirrone et al., 200199
).
The average content of mercury in 418 samples was 0.07 mg/kg reported from
Germany in 1991. The mercury concentration was between <0.02 mg/kg (detection limit)
to 0.3 mg/kg (VDZ, 2000120
). According to Skårup et al., 2003110
, ―the average content of
mercury in cement in Denmark in 2001 was between 0.02 to 0.05 mg/kg‖.
It is estimated that total annual mercury emissions were 1.6 metric tons from Kraft
and soda recovery furnaces and lime kilns of 153 units in USA in 1994(US EPA, 1997a121
).
The main source of emissions of mercury is the recovery furnace.
From chlor-alkali plants in France out of total Hg released, 3 to 14% is emitted to
air, 16 to 90% is discharged along solid wastes or semi-solid wastes like sludge. A total of
10 to 70% of the losses are internal while less than 2% mercury is released through water
discharge, land, and products from chlor-alkali plants (OSPAR, 2002122
).
19
According to Lassen et al., 2004117
, ―amounts of mercury in the soil were large at
the mercury cell facilities (which have been shut down) in Russia in the 1980's and 1990's.
The sources of this mercury were handling losses, leaks and on site storage of mercury
waste‖.
Chlor-alkali plant sites were studied by Southworth et al., 2004123
and Kinsey et al.,
2004124
.According to these investigators these plants pose significant challenges during
the cleanup process. This process may result in mercury contamination of groundwater,
surface water, soils, sediments and debris.
According to Qi et al., 2000125
, ―mercury releases, including mercury in wastes,
from chlor-alkali manufacturing units of China were from 500-1400 g of mercury/ton of
sodium hydroxide production before 1977 but dropped to 160-180 g of mercury/ton of
sodium hydroxide (caustic soda) production in 1997. However, these decreased values
were still higher than some other countries‖.
According to US EPA, 1997102
, ―phenyl mercuric compounds have been used in
the past as a catalyst to manufacture poly urethane. This process lead to mercury releases.
At present, phenyl mercuric compounds are no longer produced in the United States‖.
Mercury releases occur during filling of the metal in thermometers. Sealed mercury
thermometers pose no health risks (US EPA, 1997a121
). However, breakage of the
thermometers may lead to mercury ambient air levels that may pose risk to small children
(Carpi and Chen, 2001126
).
The mercury containing thermometers may be recycled and the mercury
recovered. In other cases mercury may be collected separately and recycled (Barr,
2001127
).
The estimates released by the Unilever (2003128
) show that not more than 10
kg/metric ton mercury was released from their thermometer factory in India.
Based on a telephone survey in 1990, the breakage rate of thermometers was
estimated 5% (US EPA, 1992129
).According to Barr, (2001127
), ―limited data show this rate
20
to be as high as 50% in the USA. Out of these broken thermometers, 10% mercury is
released into the air while 20% mercury is washed and released to waste water. The
balance 70% mercury is divided amongst municipal solid waste, infectious waste and is
recycled‖.
According to Skårup et al., 2003110
, ―in Denmark about 1/3 of mercury from broken
domestic medical thermometers ends up in waste water due to clean up of the spills and the
balance is dispersed between municipal solid waste and hazardous waste. It is estimated
that 90% of mercury in thermometers used by industry/laboratories is disposed of with
hazardous waste for recycling whereas 5% is disposed of with municipal waste and waste
water respectively. In Denmark, mercury from thermometers used in the hospital sector is
reported generally to be disposed of as chemical waste‖.
The reported lifetime of fluorescent light sources ranges from 8-10 years under
Danish conditions (Skårup et al., 2003108
).
According to Hansen and Hansen, 2003130
, ―20-30% consumed button cells and
30-60% large alkali batteries were collected separately in Denmark in 2001‖.
Barr, 2001131
estimated that form the mercury used in paints approximately 5 % is
discharged with wastewater, whereas 3% goes with municipal solid waste and remaining
92% is emitted to the atmosphere.
According to Maag et al., 1996132
and Skårup et al., 2003110
, ―mercury amalgam
filled teeth after removal are disposed as general waste or separately collected as hazardous
waste and may be sent for recycling. In Denmark as in other countries of European Union,
a large number of extracted teeth are sent to dental schools for use in practical dentist
teaching‖.
Mercury constantly loses in very minimal amount during teeth fillings. Such
mercury productions have been considered slightly paltry by some workers. Skare and
Engquist, 1994133
estimated mercury discharge from tooth filling amalgam based on
excretion rates which were 60 μg/ (day*person) with feces and urine. However, this
21
estimate lack the food intake contribution (Sörme and Lagerkvist, 2002134
; Sörme et al.,
2003135
).
According to Lassen et al., 2004117
, ―laboratories are required to defuse the
mercury containing wastes in the Russian Federation. Overall, the waste is transported to
landfills but small laboratories may defuse the reagent wastes before discharging to the
sewerage system‖.
Reportedly mercury concentrations in medical waste was 50 times more compared
to the general municipal waste, whereas general medical incinerators accounts for 60 times
more mercury as compare to the pathological waste incinerators (US EPA, 2004136
).
In 1995, 28% of the total waste incinerator emissions were recorded in Canada
from 218 biomedical plants. This contributed approximately 580 kg of mercury in the air
(Environment Canada, 2000137
). Similarly, from USA, atmospheric mercury emissions
was recorded upto14.6 metric tons through pathological waste incineration weighing up to
204,000 metric tons and general medical waste of total 1,410,000 metric tons in 1996 (US
EPA, 1997102
). This accounts to an average atmospheric emission to the tune of 8.9
g/metric ton of waste.
According to US EPA, 2004136
, ―average for the general medical waste was
calculated in 2004 to be a little higher i.e. 8.2 g mercury per metric ton of medical waste‖.
In Denmark, dry sludge in 1999 was contaminated with 1.2 g Hg/metric ton of
sludge. Approximately 41% of this sludge was applied to forest or used for agricultural
purposes while 28% was incinerated and the balance was stored, treated or land filled
(Skårup et al., 2003110
, based on Danish EPA, 2001).
In big cities like Moscow and St. Petersburg, the content of mercury in sludge on
dry basis is from 1 to 2 g Hg/metric ton. In smaller cities of Russian Federation, the
mercury content in sludge on dry basis varies from 0.1 to 1 g Hg/metric ton (Lassen et al.,
2004117
).
22
According to Lindberg et al., 2001138
, ―both dimethyl and monomethyl mercury
are produced in landfills‖. Methyl mercury is produced from elemental mercury due to
anthropogenic as well as natural biological processes (UNEP, 20021).
Mercury released to the atmosphere from waste is higher during day time compared
to night (Shunlin Tang et al., 2004139
).
According to Lindberg, 2004140
, ―the mercury fluxes from landfills face operations
are significant but generally below 10% of the total release of mercury from landfills. In
the state of Florida, USA, estimated 10 to 50 kg mercury is released to the air per year from
landfills‖.
Most of the mercury from crematoria is emitted into atmosphere (NJ MTF, 2002109
)
while a small amount is retained by bricks and ash (Reindl, 2003141
). According to
Hylander and Meili, 2005142
, ―mercury releases to the atmosphere from crematoria of 0.28
metric tons per year in Sweden‖.
According to Axenfeld et al., 1991143
, Pirrone et al., 200199
, ―in Europe
approximately 60 percent of the anthropogenic releases were in gaseous elemental form,
30 percent as gaseous divalent mercury and only 10 percent as elemental mercury on
particles‖.
According to Mason and Fitzgerald, 1996144
, 1997145
, ―the mercury cycle in oceans
and other water bodies. Elemental mercury, dimethyl mercury and to some extent, methyl
mercury are common components of the dissolved mercury pool in deep ocean waters‖.
Mercury supplied by OECD countries is being widely used in limited gold mining
operations in the Amazon Basin as well as other parts of the World (Maxson and
Vonkeman, 1996146
) as quoted by (Scoullos et al., 2000147
) .This is happening
notwithstanding the fact that deal and usage of mercury is banned in Brazil (Maxson and
Vonkeman, 1996146
) as cited by (Scoullos et al., 2000147
). Another specific case include the
export of a complete old chlor-alkali production plant containing mercury from Denmark
to Pakistan. However the involvement of the Danish Minister of the Environment
23
restricted the factory from being assembled in Pakistan and the facilities were returned
for disposal.
Mercury was being smuggled into Brazil from Colombia and Venezuela (Maxson
and Vonkeman, 1996146
) as cited by (Scoullos et al., 2000147
).Since the price of mercury is
low, therefore there is no incentive to use mercury saving technologies in small scale
artisanal gold mining.
According to Lindley, 1997148
, ―conversion costs of a standard West European
chlor-alkali plant is about $US 500 per metric ton of chlorine capacity‖. According to
Harris, 2001149
―estimated conversion costs of chlor-alkali plants is between $US 400 to
700 per metric ton of chlorine capacity. However, there are operating cost savings between
$30 to 50 per metric ton of chlorine capacity‖.
2.2 USES OF MERCURY AND MERCURY COMPOUNDS
Mercury is being used in many products and processes all over the world including
in small-scale gold mining; manometers and thermometers; electrical switches; fluorescent
lamps; dental amalgams, batteries and VCM (vinyl-chloride-monomer) production and
some pharmaceuticals.
Artisanal Small Scale Gold (ASGM) mining sector is one of the largest user of
mercury which is used to separate gold from the ore. Ten to fifteen million gold miners
mainly in Africa, Asia and South America are exposed to mercury vapors. An estimated
three million of them are women and children (UNEP, 2012150
). Mercury use in ASGM
was estimated by Mercury Watch at 1,400 tonnes in 2011, and rising gold prices were
likely to increase that use (UNEP, 2012150
). The practice threatens the health of the
workers and their families as well as downstream people who consume
mercury-contaminated fish or drink the water. This type of gold extraction, using mercury
should be replaced by low mercury or mercury free methods but socio-economic
conditions often retard the adoption of better practices (UNEP, 2012150
). The Global
Mercury Partnership promotes the establishment of national action plans and reduction
targets, encourages collaboration and the sharing of best practices to reduce mercury use,
and helps take-up innovative market-based approaches.
24
Second largest user of mercury is the VCM industry. Polyvinyl chloride (PVC) is
used as catalyst in the production of plastics. China is the major consumer of VCM and
used about 800 metric tons in 2012. In China, the mercury catalyst is recycled by
enterprises that hold permits for hazardous waste management. The amounts that may be
emitted or released are not known (UNEP, 2013151
).
Once a globally-binding treaty is in place, there is hope that global mercury
demand will decline sharply since industries that use mercury in products and processes or
release it to the environment will be required to meet the obligations set out in the
instrument.
Despite serious efforts to phase out, mercury is still being used in devices and
articles of common use. Similarly, thermostats, relays, fluorescent light, batteries,
cosmetics, specially skin lightening creams, dental fillings and host of other articles
contains mercury.
Mercury is widely used in compact fluorescent lamps (CFLs). The demand for
these lamps is increasing in the quest for energy efficiency. According to the EU Directive
2002/95/EC, mercury content in CFLs not exceeding 5 mg per lamp is allowed. These
lamps reduce electricity consumption and help reduce mercury emissions by 10% in
countries that generate electricity largely from coal (EU, 2010152
). It may be mentioned
here that coal combustion releases mercury into atmosphere.
Intentional uses of mercury take place in many products in the Europe. The three
main intentional uses of mercury products accounts for 18 percent of the total mercury
emissions to air in European region in mid-1990’s (Munthe and Kindbom, 1997153
).
According to Lawrence, 2000154
, ―the amount of mercury byproducts used on
worldwide basis might be 400 metric tons. Most countries do not reveal their mercury
production, due to which there is a high degree of uncertainty on the current world
production‖.
Worldwide 1344 metric tons of mercury was employed in chlor-alkali industry in
1996 (UNEP, 20021).
25
Rendering to Skårup et al., 2003110
, ―mercury is used in ABS systems of 4-wheel
drive vehicles. However in US, the new cars do not have mercury in ABS systems‖.
Forty-nine metric tons or 13% of the total intentional use of mercury is US was in
the production electronics including switches and wiring devices (Sznopek and Goonan,
2000155
). According to Barr, 2004156
, ―the annual use of mercury in switch/relay products
which include thermostats represented 42% of product use in the US, i.e. a total of 103
short tons‖.
The linear fluorescent light tubes with mercury constitute 95 % while the remaining
5 % are either, neon lamps, mercury vapour, compact tubes or metal halide and
high-pressure sodium (NESCAUM, 1998157
,NJ MTF, 2002109
). The amount of mercury
used per lamp has now been reduced by a factor 10.But these lamps are more expensive.
Alternative lamps without mercury are under development (COWI, 2002107
).
The reduction in mercury content of 4 feet lamp is 48 mg in 1985 and in 1999 it is12
mg in USA (NJ MTF, 2002109
).
According to UNEP, 20021, ―a number of mercury compounds have been used in
biocides, paints, paper industry, paints and for preserving seed grains and other agricultural
applications. These uses have been discontinued or banned in many countries. The use of
mercury for seed dressing is common. Use of such wheat seed was the cause of mercury
poisoning in Iraq some decades ago‖.
According to Lassen et al., 2004117
, ―Russian Federation had used 14 compounds of
organomercuric pesticides. The production of such compounds has been discontinued but
such compounds have been used from stocks to the tune of 20-40 tons‖.
To control pine apple disease in Australia around 120g/L of mercury is used in
fungicide as methoxy-ethyl mercuric chloride in sugarcane earth (UNEP, 20021).
According to Wankhade, 2003158
, ―eighty five metric tons of organic mercurial
pesticides were used in India in 1999-2000 from stockpiles. These pesticides are now
banned in India‖.
26
In USA, the use of mercury biocides in latex paint was banned in 1991. Air is the
main receiving medium for mercury vapor from latex paints (US EPA 1992129
, Agos et al,
1990159
, NJ MTF 2002109
).
According to Husar and Husar 2001160
, ―mercury used in interior latex paint
amounted roughly to 45 ppm while in exterior latex paint it amounted to 1050 ppm‖.
The recommended rate of mercury in paint is 460 mg Hg/L in Australia (Alphen,
1998161
). Alphen further identified mercury level 300ppm in some of the paints through
limited survey of South Australian paints. In Costa Rica, the limit for mercury and lead in
paints is maximum 50 ppm (US EPA, 2002162
).
Mercury compounds find application as a preservative in a number of
pharmaceutical preparations like eye drops, vaccines and of some herbal medicines
(COWI, 2002107
). For instance, thimerosal/thiomersal (ethyl thiosalicylate) is known to
prevent pathogen growth in vaccines for decades. But such uses have decreased recently
(UNEP, 20021). Mercury emissions from such compounds may occur through
manufacture, usage and disposal of these products (UNEP, 20021 and COWI, 2002
107).
Mercury compounds are still in practice as preservative in some vaccines in
Denmark. The influenza vaccines contain only 50 μg thimerosal per dose .With this
minimal amount per dose, the use of thimerosal (mercury compound), and total influenza
vaccine utilization is less than 20g/ year in Denmark having population of 5 million.
According to UNEP, 20021 and COWI, 2002
107, ―mercury compounds are widely
used in skin lightening creams and soaps. Some eye cosmetics also contain mercury
compounds. The production and use of mercury compounds as cosmetic preventatives or
in skin lightening creams have decreased radically in the developed world. However, the
case of developing world is different. Production and disposal of such compounds release
mercury‖.
Skin whitening soaps contain approximately 3% of mercury iodide (HgI2) while in
creams the concentration of ammoniated mercury may reach upto 10% (OECD, 1994163
).
27
According to Mahe et al., 1993164
, ―the skin lightening cosmetics are widely used
in African countries. 25% of 210 surveyed women in Bamako, Mali reported using skin
bleaching cosmetics). Out of these, 11% used mercury containing compounds whereas
16% used agents of unknown composition‖.
According to Adebajo, 2002165
, ―77% of 440 interviewed male and female traders
used skin lightening cosmetics. Hydroquinolone based products were commonly used
products while cortico steroids and mercury based products were also widely used in
Lagos, Nigeria‖.
Mercury compounds were the active ingredients in 31% cosmetics used amongst
536 women in Lome, Togo. Fourteen brands of toilet soap from Kisumu, Kenya were
analysed by Harada et al., 2001166
. They found that European made soaps contained
0.47-1.7 % of mercury iodide while in the local brands only traces of mercury were
observed. According to Glahder et al., 1999167
, the three brands of soap analysed from
Tanzania contain mercury. The soaps could have proportion of 2% mercury iodide. The
observed mercury content was 0.69%.
Mercury bearing skin lightening soaps were banned in European Union in the year
2000(Danish EPA, 2000168
). The Danish EPA analysed 7 types of mercury containing
soaps from the markets in Denmark which contained 1-3 % mercury iodide.
According to Maxson, 2004169
, ―Ireland imported 17 metric tons of mercury in
1999 for use in skin lightening soaps which were exported out to Europe‖. Under Annex 5
of European Union regulations implementing Rotterdam Convention the production of
cosmetics containing mercury was banned in 2003.
In the USA, use of mercury as laboratory chemical decreased from 32 metric tons
in 1990 to 20 metric tons in 1996 (Sznopek and Goonan, 200029
). Approximately one third
of the total mercury was utilized in laboratory instruments. In Denmark the use of mercury
in laboratory chemicals has declined from 510 kg per year in 1982-1983 (Hansen, 1985170
)
to 20-40 kg per year in 200 (Skårup et al., 2003110
).According to AGHTM, 2000171
, ―the
decrease in mercury use in laboratories is due to its replacing in Kjeldahl and Chemical
28
Oxygen Demand (COD) methods. About 900 g mercury was used as mercury sulphate
for COD analysis‖.
In New Jersey, USA, dental filling resulted in Emission of mercury. Reportedly,
each corpse contains average 2.9 g/ corpse mercury where the concentrations may vary
from 0.8 and 5.6 grams (NJ MTF, 2002109
). This mercury comes from dental fillings in
New Jersey, USA. According to Reindl, 2003172
, ―the balance in each corpse comes from
body tissues like blood, hair, etc. which is due to largely fish consumption and other
exposures in the range of 1 x 10⁻⁵
- 0.1 g mercury‖.
2.3 MERCURY EXPOSURE
Although it was not clear in start but prolonged exposure if mercury resulted in
medical conditions in human beings and animals so much that it was noticeable by the
1970s. The mercury exposure can lead to various toxic effects in human beings like CNS
damage, renal complication etc. In animals the exposure resulted in growth rate,
reproduction rate etc.
Mercury once released from anthropogenic or natural sources because of its
propensity to travel through air and water can impact soil, sediments and organisms over
large areas.
Mercury bio-accumulates up the food chains. Mercury through metabolism of
microbes/phytoplanktons in aquatic environment changes to highly toxic methyl mercury.
Methyl mercury accounts for 90% of the mercury in fish. In aquatic ecosystem, it reaches
the highest level in predator fish such as swordfish and shark that may be consumed by
humans. It is known to effect reproductive systems of birds and predatory mammals
According to Dufault et al., 2009173
, the Institute for Agriculture and Trade Policy
in USA recently found that high fructose corn syrup (used in sodas, ketchup and bread)
could also contain elevated mercury levels. Zhang et al., (2010174
) suggested that in areas
of intensive mercury mining and smelting as well as areas with big coal fired power plants,
rice crops could be contaminated.
Mercury can seriously harm human health, and is a particular threat to the
development of fetuses and young children. It affects humans in several ways. As vapour it
29
is rapidly absorbed into the blood stream when inhaled. It damages the central nervous
system, thyroid, kidneys, lungs, immune system, eyes, gums and skin.
Neurological and behavioral disorders may be signs of mercury contamination,
with symptoms including tremors, insomnia, memory loss, neuromuscular effects,
headaches, and cognitive and motor dysfunction. According to Smith et al., 1970175
, ―the
workers exposed to elemental mercury vapour showing a clear increase in symptoms of
dysfunction of the central nervous system levels at concentration greater than 0.1 mg/ m3‖.
According to Bidstrup et al., 1951176
, obvious mercury poisoning symptoms in urine
appear at concentrations higher than 300 g in a 24 hr sample. Langwarth et al., 1992
177conducted that ―several studies showing evidence of neurotoxicity at approximately 2 –
4 fold lower concentration. Self-reported memory disturbance, sleep disorder, anger,
fatigue and /or hand tremors were increased in workers chronically exposed to an estimated
air concentration of 0.025 mg/ m3
".
Mercury effects central nervous system, eye sight, cardiovascular system and
causes tremors (McKelvey and Oken, 2012178
). Heart function normalities were reported
by Jalili and Abbasi, 1961179
in patients in Iraq who consumed ethyl mercury coated grains
and were hospitalized for severe poisoning. In 1995, Salonen et al.,180
studied 1,833 fishing
men focusing their dietary constituent primarily fish in relation to the concentration of
mercury in hairs and urine in relation to Acute Myocardial Infarction (AMI) and death
from coronary heart disease or cardiovascular disease. Concentrations of mercury in the
studied group ranged from 1.1 to 95.3 g per day (average 7.6g/day). Reported from
seven years study men in the highest tertile with hair mercury content 2µg/g had a twofold
higher risk (1.2 – 3.1) of AMI than men in the two lowest tertiles. According to Rissanen et
al., 2000181
, ―a protective effect of omega 3 fatty acids shows with respect to acute
coronary disease. However, it was found that the less evident in those high mercury content
in fish could reduce the protective effect of Omega-3 in individuals having >2g/g Hg in
hair‖.
According to Boucher et al., 2012182
, the Inuit population of Quebec has among the
highest levels of exposure to mercury of any population in the world. It was recently
concluded that children with higher levels of contamination are more likely to be
30
diagnosed with attention deficit hyperactivity disorder. In young generations, it can
affects neurological damage resulting in symptoms such as mental retardation, seizures,
vision and hearing loss, delayed development, language disorders and memory loss.
The study of people exposed to high level of mercury vapour or those constantly
exposed to high levels showed negative impacts on personality, motor functions, sensory
and cognitive abilities (US EPA, 1997102
, Aronow et al., 1990183
).
The ―elemental mercury can oxidize in body tissues to divalent mercury. Kidneys
concentrate this mercury more than other organs. The concentration of this divalent
mercury in occupationally unexposed groups varies normally from 0.1 – 0.3 µg/g‖ (
Drasch et al., 1996184
; Barregard et al., 1999185
; Hac et al., 2000186
; Falnoga et al., 2000187)
According to Kazantzis et al., 1962188
; Borjesson et al., 1995189
and Barregard et
al., 1999185
, ―mercury concentration in kidney of a person with occupational exposure may
be as high as 35 µg/g‖.
High mercury concentrations in hair are also known for abnormal visual fields
(Lebel et al., 1998190
). The dosage linked decline in visual and motor functions are known
to be effected by with hair mercury concentrations. Mercury intoxication is not clinically
significant below 50 g/g (Lebel et al., 1998190
).
According to Tamashiro et al., 1986191
, ―evaluated causes of death among residents
of a small area of Minamata City are due to the highest occurrence of Minamata disease
and used age specific rates for the entire city as a standard. Between 1970 and 1981, the
number of deaths in women resided in Minamata area due to nephritic diseases was higher
than expected‖.
According to US ATSDR, 1999192
; Pelclova et al., 2002193
, ―the exposure to
inorganic, elemental, and organic mercury can occur due to the use of skin lightening
creams containing mercury, mercury containing traditional medicines, ritualistic uses of
mercury and certain pharmaceuticals. Ethyl mercury thiosalicylate commonly called
thiomersal is used as a preservative medicine for some types of vaccines and
31
immunoglobulins‖. According to Ernst and Coon 2001194
; Koh and Woo, 2000195
and
Garvey et al., 2001196
, ―significant exposures may occur by the use of mercury containing
traditional Chinese or Asian medicines‖.
According to Feng et al., 1998197
, ―total mercury and methyl mercury
concentrations in scalp hair of 243 male persons in three areas of the Tokushima
Prefecture, Japan as well as in 64 males of the Chinese city of Harbin and 55 males in the
Indonesian city of Medan. All subjects were randomly chosen males aged 40-49 years.
They found the highest concentrations in subjects living in a seaside area reported to be
without local direct anthropogenic contamination. Total mercury concentrations here
ranged from 1.7-24 g/g hair (mean 6.2 g/g, 78 subjects) thus close to and exceeding the
adverse effect benchmark level of about 10 g/g maternal hair derived from the Faroe
Islands studies. The mean concentration for all three investigated areas in Japan was only
slightly lower i.e 4.6 g/g hair (243 subjects)‖.
According to Feng et al., 1998197
quoted Suzuki (1991198
), ―mercury hair
concentration levels found in residents of three villages in Papua New Guinea which were
not influenced by local direct anthropogenic contamination. The highest concentrations
were found in the seaside village Dorogi with means 4.1 and 4.4 µg/g hair for males and
females respectively. However, concentrations were slightly lower in a riverside village
6 kilometers from the coast and lowest in a village 25 kilometers from the coast‖.
According to Akagi and Naganuma, 2000199
, ―separate measurements for methyl
mercury and total mercury to distinguish between exposures through an aquatic diet and
direct exposures of elemental mercury from gold extraction activities. They found methyl
mercury concentrations exceeding the adverse effects level for adults i.e. 50 g/g in hair.
They surveyed 3.2 percent of the 559 inhabitants with the highest individual level being
132 g/g. These values are considerably higher than the adverse effect benchmark level of
10 g/g maternal hair derived from the Faroe Islands studies‖.
According to Vasconcellos et al., 1998200
, ―total mercury concentrations in scalp
hair in 13 out of 17 tribes of Indians inhabiting the Xingu Park in the Brazilian Amazon.
Methyl mercury concentrations in hair were also measured in six investigated groups.
Geometrical means for total mercury concentrations varied among the tribes in the range of
32
3.2-21 g/g hair but most group means were between 10 and 20 g/g. In the tribes,
methyl mercury was also measured and found in the hair samples. In the same study, three
groups of inhabitants were also investigated in the Brazilian State of Amapá‖.
According to Franchi et al., 1994201
, ―there was found a correlation between the
prevalence of micronuclei in peripheral lymphocytes and blood mercury concentrations in
fishermen who had been eating mercury contaminated seafood‖.
Usually the concentrations of mercury are below the detection level in many food
stuff less than 20 ng Hg/g fresh weight (US EPA, 1997102
). The main source of methyl
mercury is fish and marine mammals. The highest concentrations of mercury are found in
king mackeral, shark, pike, walleye, swordfish, marlin, barracuda, scabbard toothed
whales and seals.
Von Rein and Hylander, 2000202
reported that an important constituent of diet in
Sweden due to long coastline, many lakes and rivers. According to Louekari et al., 1994203
,
―the accumulation of mercury in fish present during several decades in Finland. In the late
1960's about 10-15 percent of the lakes and coastal waters were affected by high mercury
concentrations generally caused by direct aqueous releases from pulp and paper industry
and related mercury based chlor-alkali production in Finland. Average concentrations of
mercury in northern pike measured 1.52 mg/kg wet weight in these freshwaters and
brackish coastal waters at that time‖.
On the other hand, Hg0 vapors are rapidly absorbed by lungs to the extent of 80%
and distributed in the body and cross placental and blood brain barriers (ATSDR, 19995).
Mercury levels in urine of miners who frequently burn gold mercury amalgams in
open pans were detected 20 µg/L in urine. Similarly in gold shop workers in Amazonian
village the mercury concentrations in urine was reported 1,168 µg/L. Higher concentration
of mercury was observed in the worker who worked in confined environment.
33
CHAPTER 3
MATERIALS AND METHODS
This study focuses on identification and quantification of mercury releases in
Pakistan. The mercury is released into the environment through the use of mercury and
mercury containing products as well as through use of certain high volume materials with
mercury trace concentrations. The calculation of mercury releases into our environment
has been made on the basis of guidelines, methods, sources and factors contained in the
United Nations Environment Programme (UNEP)’s Toolkit for identification and
quantification of mercury releases (UNEP, 2005204
)
The Toolkit comprised of a standardized procedure to develop reliable and
comparable source inventories which are given below;
1. Apply screening matrix for identification of main source categories present in the
Pakistan and classify this main source categories into further sub-categories and
gather supplementary qualitative evidence to identify existing activities and
sources of mercury releases in the country; and if feasible, the relative importance
of each
2. Collect detailed quantitative information on the identified sources, and quantify
releases with source specific data or default mercury input and output distribution
factors from the Toolkit
3. Apply nationwide to establish full inventory and report results using guidance
given in the standard format.
3.1. IDENTIFICATION AND QUANTIFICATION
METHODOLOGY
A pragmatic and viable methodology was formulated to identify and quantify
mercury emission sources in Pakistan to make an assessment of total volume of mercury
available in the country. This exercise included the following steps;
34
1. Identification of mercury and mercury products usages and emissions by
federal and provincial Environment Protection Agencies.
2. Selection of the areas prone to mercury contamination in the Pakistan.
3. Collection of wastewater and solid waste samples from the country.
4. Collection of human hair samples from chlor-alkali, dental and control group
sectors
5. Analysis of the samples in the laboratories of the Institute of Chemistry,
University of the Punjab, Lahore and University of Aberdeen, Scotland, UK.
6. Collection of data related to mercury and mercury products from markets/
industries of Pakistan.
7. Preparation of baseline data of mercury and mercury products related to the
current mercury situations in Pakistan.
To accomplish the objectives of mercury data, UNEP’s Toolkit (UNEP, 2005204
)
was used for preparing the inventory throughout the country. Mercury issue is a new
subject for Pakistan. Before this study, nobody had any experience in preparing an
inventory of mercury releases in the country. The field exercise revealed that the
knowledge on the inventory process and concepts and techniques regarding data gathering
and analysis is very limited in the country.
Emission factor is a parameter that essentially plays role in the scheming emission
of mercury into the environment. If emission factors are not assigned values, it is
complicated to effectively calculate the mercury releases. In this regard, the UNEP’s
Toolkit clearly identifies emission factor values according to specific source
categories/sub-categories. Although the UNEP’s Toolkit is a very useful document for the
development of a mercury release inventory report, even though it mostly seems to be
designed for use in developed countries rather than developing countries. This may create
some confusion for developing countries with limited experience (UNEP, 2005204
).
Determining release sources for Pakistan mainly depended on the UNEP’s Toolkit.
However, in a few cases, it poses some difficulty and complexity. Based on available
knowledge and information, the following sources were focused;
35
1. Chlor-alkali plants.
2. Health sector (hospitals, health care units, and clinics) for both mercury contained
in products (thermometers and amalgam fillings) and mercury released from waste
incineration.
3. Landfill (municipal waste dumping).
Besides undertaking field survey for primary data acquisition, the desk study was also
carried out on other sources of possible mercury releases including;
4. Production of secondary ferrous and non-ferrous.
5. Energy sources.
6. Waste burning (industrial and medical waste).
7. Production of lime, etc.
3.1.1. Identification of mercury releases
In order to identify mercury releases, a team was set up for the identification of
mercury releases in the country. The sampling points were also identified by the team .The
team comprised of representatives of provincial Environmental Protection Agencies. The
author coordinated and visited all four provinces regarding the collection of 181 solid,
waste water and hair samples for the analysis of mercury. The identification codes were
allotted for the samples by using fixed marker on paper tape. All the samples were
immediately labeled in the field .The detailed labeling was performed in the laboratory.
3.1.2. Quantification of mercury releases
In order to quantify mercury use and releases data, a country wide team was set up
for the quantification of mercury and mercury compounds, its uses, releases and import.
The team comprised of representatives of federal and provincial Environmental Protection
Agencies, Customs Department and Institute of Chemistry, Punjab University, Lahore.
The author coordinated and visited all four provinces regarding the collection of data from
markets about the mercury and its compounds.
The data was collected from Custom Department, relevant line ministries
especially Ministry of Industries and Production, Ministry of Petroleum and Natural
Resources, Ministry of Science and Technology, Ministry of Health, Federal and
36
Provincial Environment Protection Agencies and different chemical stores.
From January 2008 to September 2008, the data was collected from all major
industrial areas of the country. The data was stored in the Ministry. Approximately 90 %
responses were received from all the sectors as described in the Toolkit (UNEP,
2005204
).Sector wise data was mentioned in the results. The collected data was fed in
UNEP’s Toolkit for the quantification of mercury releases in the country.
3.2. COLLECTION OF SAMPLES
The data gathered by the quantification team was analyzed to figure out the
mercury usage and release hotspots. After the quantification of mercury releases in the
country, the team members with the help of UNEP’s Chemicals Expert prioritized the
samples from all the four provinces of the country. The samples were based on mercury
releases as well as on hotspots like chlor-alkali industries. Hotspots represent 57 % of the
mercury releases in the country. All the 181 identified and prioritized samples of soil,
water and hair were collected from four provinces by the author with the help of provincial
Environmental Protection Agencies.
3.2.1. Waste water and soil samples
The wastewater and soil samples were obtained from selected mercury affected
sites in all the four provinces of Pakistan to assess the mercury pollution level and water
contamination. For this purpose, 109 samples were collected and analyzed for mercury at
the laboratories of the Institute of Chemistry, University of the Punjab, Lahore, Pakistan.
Cold Vapour Atomic Absorption Spectrometry method was used for mercury analysis.
3.2.2. Hair samples
The study was designed to collect hair samples from the workers of hotspots as well
as prioritized sectors like chlor-alkali industries (One industry which is using mercury cell
technology and other industry which has phased our mercury cell technology), health
sector (dental amalgam) and control group. The people were selected of different age
groups with different working experience. The workplace was the only discriminator for
the exposure of mercury. Since, the workers were usually locals of the neighboring areas,
and the food they consumed was mostly imported from other regions of the country
(having no or little industrial exposure). Hence, the chances of Hg contamination through
37
food were almost negligible.
It is recognized that the mercury in human hair is mainly methyl mercury (MeHg) i.e.
roughly 80% (Margaret et al; 2004205
) .The standards used during this study were hair
certified reference materials (NIES No 13 and IAEA 085) and 72 hair samples that were
obtained from the workers of chlor-alkali sector (Ittehad Chemicals Limited, Kala Shah
Kaku, Sheikhupura and Sitara Chemicals Industries Limited, Faisalabad), dental amalgam
sector (Punjab Dental College and Hospital, Lahore) and control group sector (students,
gardeners etc). Dried washed human hairs, blank and dried certified reference materials
(NIES No 13 and IAEA 085) were used. Washed samples were digested by
autoclave-assisted digestion (closed vials) in 5.0 ml concentrated nitric acid for 90 min at
100 ºC in water bath. This was necessary to break down the Hg – C bond in methyl mercury
(Me-Hg) to form inorganic mercury.
3.3. PREPARATION OF SAMPLES
3.3.1. Waste water sampling
a) Flowing streams/ waste drain channels
Sample liquid of one liter was withdrawn from 3 meter depth. The mixture was
homogenized in polyethylene container and 120 ml of mixed sample was taken sample
bottle containing 20 drops of 5% HNO3.
b) Stagnant liquid reservoirs
One liter liquid samples were taken from four points at least 10 meter apart along
the vertices of a hypothetical rectangle, mixed in polyethylene containers and immediately
transferred in 120 ml sample bottles of polyethylene, already containing 20 drops of 5%
HNO3.The remaining liquid was discarded into the same reservoir.
3.3.2. Sampling of soil matrices
a) Soil samples
For sampling of soil, typically an area of 100 m² was sampled. The sampling areas
were open space land / different types of soil were sampled such as agricultural fields,
forests and from vicinity of potential hot spots. Samples were taken with a clean spoon.
Each soil sample consisted of at least five individual pick-ups, each of them approximately
50 g. All 50 g samples were placed into a bowl in the field, small twigs and other organic
material was removed; the sample was mixed and placed into a zip-lock bag. Total
38
samples size was approximately 200 g. These samples were taken to analytical
laboratory and stored in brown bags until analysis. Before analysis the samples were
air-dried and sieved through a 300 mesh sieve.
b) Sludge
In case of sludge underneath a water channel, a plastic cup attached to a long stick
was used to collect samples weighing 200 gm each. These samples were preserved in
double zipper bags or 120ml flasks through funnel. 20 drops of 5% HNO3 were added to
the sample bottles.
3.3.3. Hair sample preparation
Two steps were performed in the preparation of hair samples;
a) Collection of hair samples
b) Washing of hair samples
c) Closed vials digestion procedure
a) Collection of Hair Samples
72 human hair samples from four different areas with expected mercury exposure
were selected, the areas were;
i. The industry where mercury cell technology is being used
ii. The industry where mercury cell technology has been phased out
iii. Dental college and hospital
iv. General public.
A small bundle of hair from the center of head were tied with thread loosely and cut 1cm
above the root to avoid scalp tissue contamination. The collected hair were stored in
polythene zipper bags. The bags were coded with sticky paper labels for further processing.
b) Procedure for washing of hair samples
Processing was carried out at room temperature. Hair sample were weighed
separately into a 150ml ultra-clean conical flask and 100 ml of detergent solution (1% alkyl
benzene sulfonate in deionized water) was further added in the samples. The flasks
containing samples were whirled for one hour and the final soapy solution was discarded.
The samples follow addition of 100ml of deionized water and shaken, this step was
repeated four times until samples were rinsed thoroughly, during washing the hair samples
39
were shaken vigorously. Hair Samples in the flasks were oven dried at 50 ºC for 12
hours. Followed by the drying the hair samples were optimized with atmospheric humidity
by placing flasks in open for 5 hours (Egeland et al; 2009206
).
c) Closed vials digestion procedure
Total mercury was determined by closed vials digestion procedure. Roughly 10 mg
of hair sample was weighed in two separate 20 ml glass vials. 5ml of concentrated nitric
acid (HNO3) was added into each of the glass vials. The vial was left open under a fume
hood for 20 minutes, then, it was sealed and autoclaved in water bath for 90 minutes at 100
ºC. The glass vial was allowed to cool and the digested solution was weighed. 1ml of each
digested sample was weighed and transferred into 25 ml measuring volumetric flask.
Afterwards, the volume was made up to make a total volume of 25 ml with deionized water
(dilution to 1: 25 v/v). The mercury (total) was measured by CV-AFS.
3.4. TECHNIQUES USED FOR DETERMINING OF
MERCURY
Two sets of instrumentation/ techniques were used for the determination of mercury:
Cold Vapour Atomic Absorption Spectrometry (CV-AAS)
Cold Vapour Atomic Fluorescence Spectrometry (CV-AFS)
The CV-AAS method was employed for soil and waste-water samples analysis
whereas the CV-AFS was used for human hair samples analysis.
3.4.1 Method of Cold Vapour Atomic Absorption Spectroscopy
(CV-AAS)
Mercury was analyzed on Perkin Elmer Analyst 100 atomic absorption
spectrometer fitted with a 100mm quartz tube. The HNO3 digested sample solution was
treated with a reducing agent (20% SnCl2) to convert the ionic mercury into mercury atoms
in the form of fine vapours. Nitrogen gas was purged through the solution at a constant rate
of 1 L/min and then the atomic vapour of mercury was swept into the 100mm glass cell.
The cell consists of a quartz window, transparent to radiation at 253.7nm of the mercury
line that was used for detection. A mercury hollow cathode lamp was used as source. A
series of standards ranging from 0.1-0.9 µg of mercury/Litre and in another range from 1
40
to 10 µg Hg/L were analyzed to establish the 10-point calibration curve. In a similar
way, different samples were analyzed and concentration of Hg was determined.
3.4.1.1. Chemical reagents
i) Mercuric sulphate (Hg2SO4) Fluka
ii) Stannous chloride (SnCl2) Fluka
iii) Sulphuric acid 98%(H2SO4) [Hg <0.0000005%] Fluka
iv) Conductivity water
v) Hg Standard stock solutions (1000 µg/L), Hg Calibration Standards (1-10
µg/L), (0.1-0.9µg/L)
3.4.1.2. Glassware
i) Pyrex™ Measuring flasks (1000 ml,100 ml)
ii) Glass Pipettes (10 ml, 1 ml) (HBG Germany)
iii) Glass Beakers (100 ml,250 ml) (HBG Germany)
iv) Funnel (HBG Germany)
v) China Crucible
3.4.2 Cold Vapour Atomic Fluorescence Spectrometry (CV-AFS)
Cold Vapour Atomic Fluorescence Spectrometry (CV-AFS) is the commonly used
method to analyze very low concentration of mercury (Hg) due to its greater sensitivity,
selectivity and comparatively low cost. CV AFS model [Millennium Merlin- satellite spur
(PSA 10.125), PSA instrumentation, England] was used to determine the concentration of
total mercury (Hg) in hair certified reference materials (CRM IAEA 085, NIES-13) and
human hair samples. The first requirement of the method is conversion of all organic
mercury forms utilizing various digestion and oxidation processes (seven procedures) to
inorganic mercury.
The graphic representation diagram of a continuous – flow vapour generator and
AFS detector is shown in Figure 2. The CV AFS consists of two main parts, the mercury
vapour generator and the AFS detector.
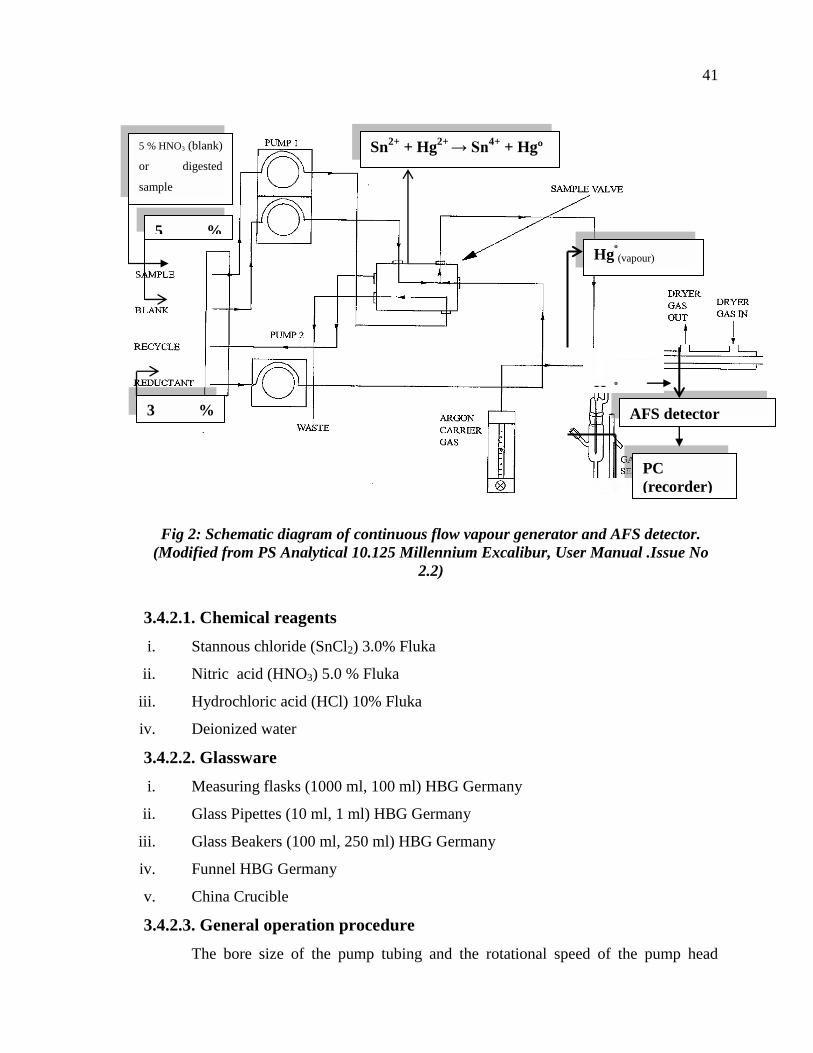
41
Fig 2: Schematic diagram of continuous flow vapour generator and AFS detector.
(Modified from PS Analytical 10.125 Millennium Excalibur, User Manual .Issue No
2.2)
3.4.2.1. Chemical reagents
i. Stannous chloride (SnCl2) 3.0% Fluka
ii. Nitric acid (HNO3) 5.0 % Fluka
iii. Hydrochloric acid (HCl) 10% Fluka
iv. Deionized water
3.4.2.2. Glassware
i. Measuring flasks (1000 ml, 100 ml) HBG Germany
ii. Glass Pipettes (10 ml, 1 ml) HBG Germany
iii. Glass Beakers (100 ml, 250 ml) HBG Germany
iv. Funnel HBG Germany
v. China Crucible
3.4.2.3. General operation procedure
The bore size of the pump tubing and the rotational speed of the pump head
3 %
SnCl2
PC
(recorder)
AFS detector
Hgº
Waste
Hgº(vapour)
Sn2+
+ Hg2+
→ Sn4+
+ Hgº 5 % HNO3 (blank)
or digested
sample
5 %
HNO3
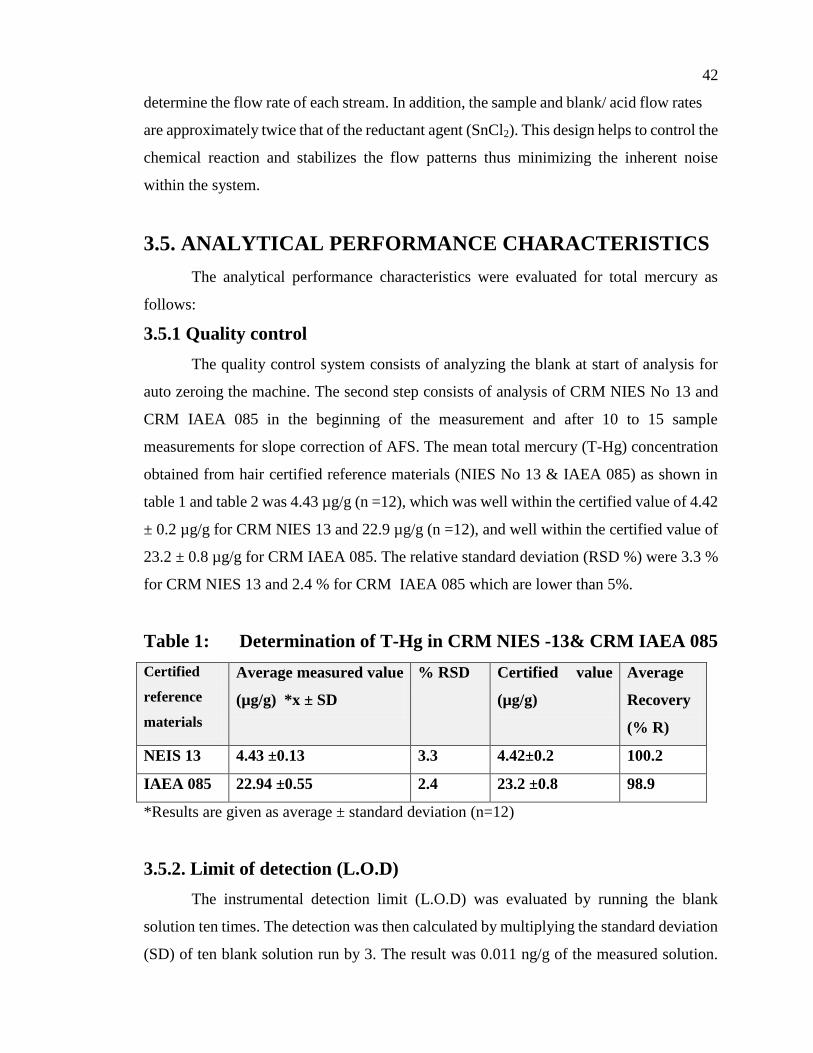
42
determine the flow rate of each stream. In addition, the sample and blank/ acid flow rates
are approximately twice that of the reductant agent (SnCl2). This design helps to control the
chemical reaction and stabilizes the flow patterns thus minimizing the inherent noise
within the system.
3.5. ANALYTICAL PERFORMANCE CHARACTERISTICS
The analytical performance characteristics were evaluated for total mercury as
follows:
3.5.1 Quality control
The quality control system consists of analyzing the blank at start of analysis for
auto zeroing the machine. The second step consists of analysis of CRM NIES No 13 and
CRM IAEA 085 in the beginning of the measurement and after 10 to 15 sample
measurements for slope correction of AFS. The mean total mercury (T-Hg) concentration
obtained from hair certified reference materials (NIES No 13 & IAEA 085) as shown in
table 1 and table 2 was 4.43 µg/g (n =12), which was well within the certified value of 4.42
± 0.2 µg/g for CRM NIES 13 and 22.9 µg/g (n =12), and well within the certified value of
23.2 ± 0.8 µg/g for CRM IAEA 085. The relative standard deviation (RSD %) were 3.3 %
for CRM NIES 13 and 2.4 % for CRM IAEA 085 which are lower than 5%.
Table 1: Determination of T-Hg in CRM NIES -13& CRM IAEA 085
Certified
reference
materials
Average measured value
(µg/g) *x ± SD
% RSD Certified value
(µg/g)
Average
Recovery
(% R)
NEIS 13 4.43 ±0.13 3.3 4.42±0.2 100.2
IAEA 085 22.94 ±0.55 2.4 23.2 ±0.8 98.9
*Results are given as average ± standard deviation (n=12)
3.5.2. Limit of detection (L.O.D)
The instrumental detection limit (L.O.D) was evaluated by running the blank
solution ten times. The detection was then calculated by multiplying the standard deviation
(SD) of ten blank solution run by 3. The result was 0.011 ng/g of the measured solution.
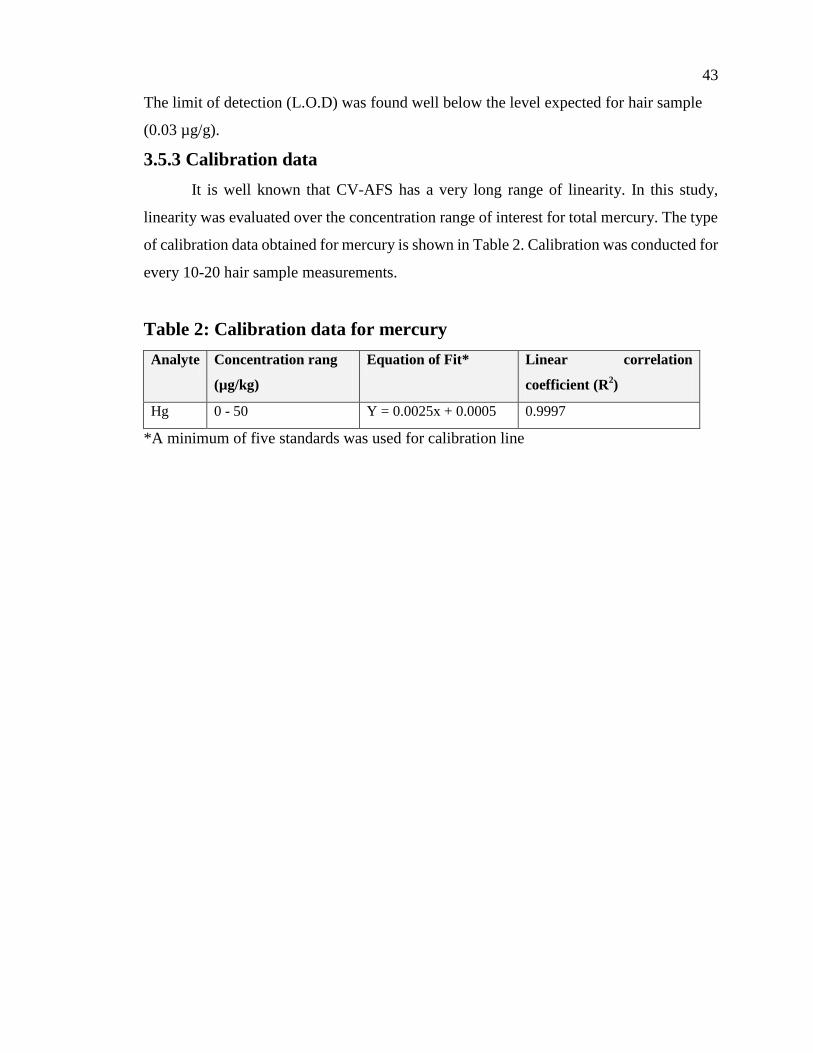
43
The limit of detection (L.O.D) was found well below the level expected for hair sample
(0.03 µg/g).
3.5.3 Calibration data
It is well known that CV-AFS has a very long range of linearity. In this study,
linearity was evaluated over the concentration range of interest for total mercury. The type
of calibration data obtained for mercury is shown in Table 2. Calibration was conducted for
every 10-20 hair sample measurements.
Table 2: Calibration data for mercury
Analyte Concentration rang
(µg/kg)
Equation of Fit* Linear correlation
coefficient (R2)
Hg 0 - 50 Y = 0.0025x + 0.0005 0.9997
*A minimum of five standards was used for calibration line
44
CHAPTER 4
RESULTS AND DISCUSSION
Several products of mercury or derived compounds have been in practice in
commercial and domestic sectors in Pakistan for long time, with the product lifecycle
ultimately ending up as waste, adding up to the environment. The detail of these mercury
products in Pakistan is given in Appendix-1. The chlor-alkali production activities, dental
amalgamation, lime production and certain other manufacturing, handling and ignition
activities are other major causes of mercury release into the atmosphere
Regarding the management of mercury release into the environment, proper
management of products and equipments having mercury or its derivatives, there is no
specific guideline, exact inventory or any legislation in Pakistan.
This study was focused on the preliminary field survey on mercury uses and
releases during the period of January to August, 2008 throughout Pakistan. The specific
aim was the establishment of true inventory of mercury and its products in the environment
of Pakistan.
The major target areas were the followings;
a- Soil and water samples surrounding the chlor-alkali industries.
b- Municipal solid waste and sewerage samples.
c- Hospital waste incinerators.
d- Minerals – Coal and Lime.
e- Human hair samples – from the industries/occupations having mercury
exposure.
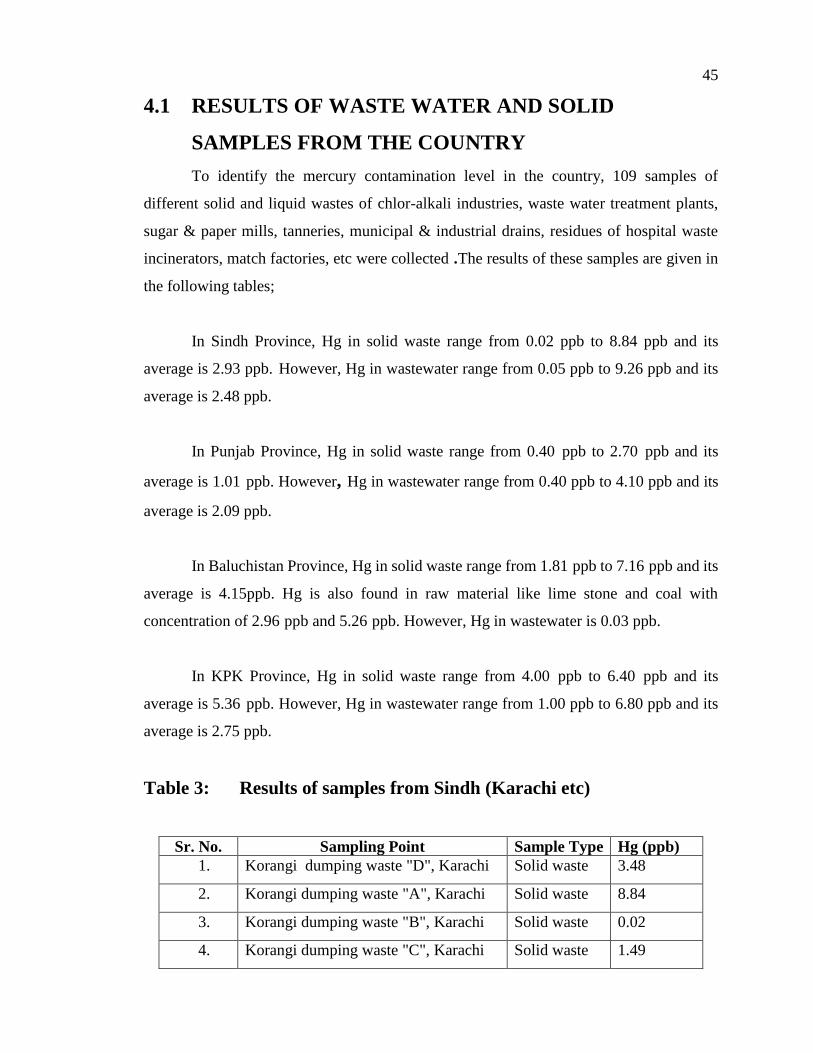
45
4.1 RESULTS OF WASTE WATER AND SOLID
SAMPLES FROM THE COUNTRY
To identify the mercury contamination level in the country, 109 samples of
different solid and liquid wastes of chlor-alkali industries, waste water treatment plants,
sugar & paper mills, tanneries, municipal & industrial drains, residues of hospital waste
incinerators, match factories, etc were collected .The results of these samples are given in
the following tables;
In Sindh Province, Hg in solid waste range from 0.02 ppb to 8.84 ppb and its
average is 2.93 ppb. However, Hg in wastewater range from 0.05 ppb to 9.26 ppb and its
average is 2.48 ppb.
In Punjab Province, Hg in solid waste range from 0.40 ppb to 2.70 ppb and its
average is 1.01 ppb. However, Hg in wastewater range from 0.40 ppb to 4.10 ppb and its
average is 2.09 ppb.
In Baluchistan Province, Hg in solid waste range from 1.81 ppb to 7.16 ppb and its
average is 4.15ppb. Hg is also found in raw material like lime stone and coal with
concentration of 2.96 ppb and 5.26 ppb. However, Hg in wastewater is 0.03 ppb.
In KPK Province, Hg in solid waste range from 4.00 ppb to 6.40 ppb and its
average is 5.36 ppb. However, Hg in wastewater range from 1.00 ppb to 6.80 ppb and its
average is 2.75 ppb.
Table 3: Results of samples from Sindh (Karachi etc)
Sr. No. Sampling Point Sample Type Hg (ppb)
1. Korangi dumping waste "D", Karachi Solid waste 3.48
2. Korangi dumping waste "A", Karachi Solid waste 8.84
3. Korangi dumping waste "B", Karachi Solid waste 0.02
4. Korangi dumping waste "C", Karachi Solid waste 1.49
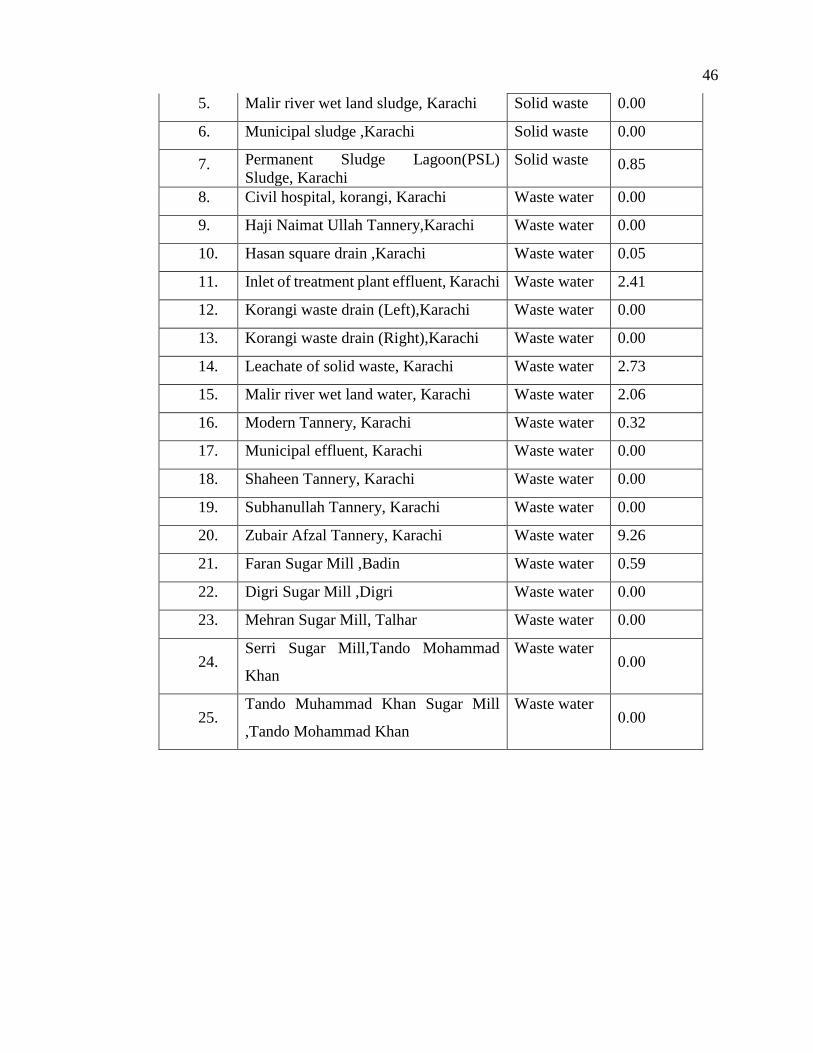
46
5. Malir river wet land sludge, Karachi Solid waste 0.00
6. Municipal sludge ,Karachi Solid waste 0.00
7. Permanent Sludge Lagoon(PSL)
Sludge, Karachi
Solid waste 0.85
8. Civil hospital, korangi, Karachi Waste water 0.00
9. Haji Naimat Ullah Tannery,Karachi Waste water 0.00
10. Hasan square drain ,Karachi Waste water 0.05
11. Inlet of treatment plant effluent, Karachi Waste water 2.41
12. Korangi waste drain (Left),Karachi Waste water 0.00
13. Korangi waste drain (Right),Karachi Waste water 0.00
14. Leachate of solid waste, Karachi Waste water 2.73
15. Malir river wet land water, Karachi Waste water 2.06
16. Modern Tannery, Karachi Waste water 0.32
17. Municipal effluent, Karachi Waste water 0.00
18. Shaheen Tannery, Karachi Waste water 0.00
19. Subhanullah Tannery, Karachi Waste water 0.00
20. Zubair Afzal Tannery, Karachi Waste water 9.26
21. Faran Sugar Mill ,Badin Waste water 0.59
22. Digri Sugar Mill ,Digri Waste water 0000
23. Mehran Sugar Mill, Talhar Waste water 00 00
24. Serri Sugar Mill,Tando Mohammad
Khan
Waste water 0 000
25. Tando Muhammad Khan Sugar Mill
,Tando Mohammad Khan
Waste water 00 00
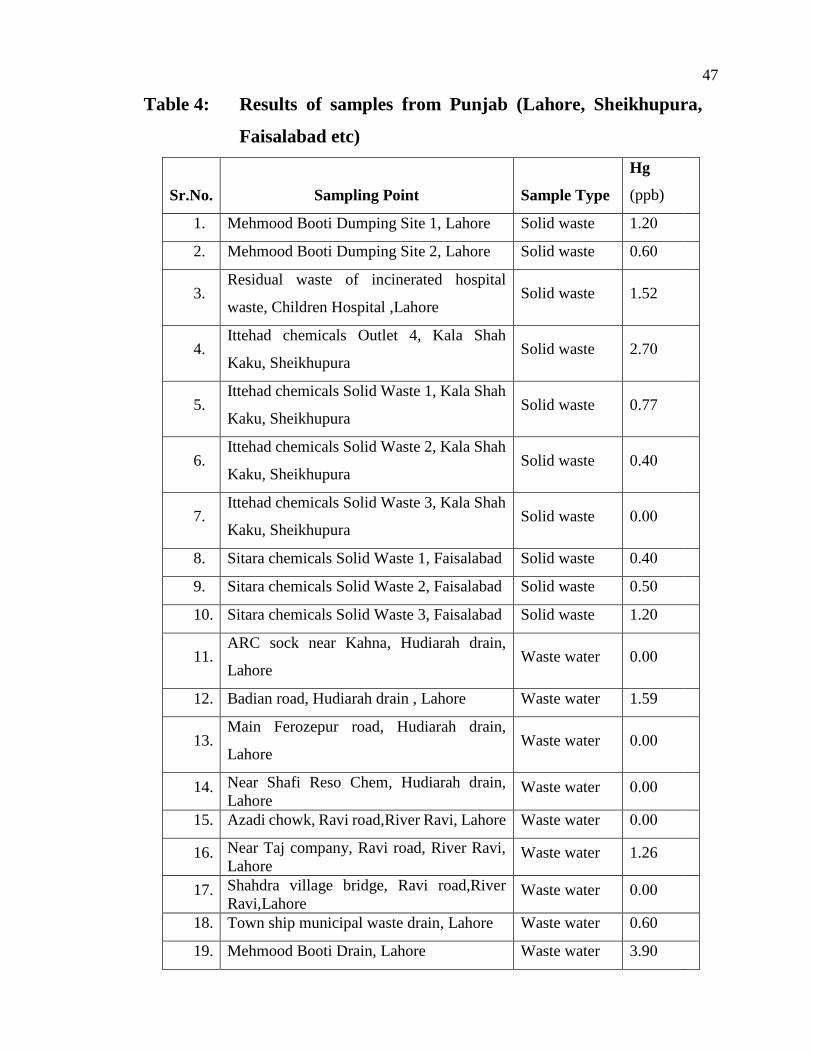
47
Table 4: Results of samples from Punjab (Lahore, Sheikhupura,
Faisalabad etc)
Sr.No. Sampling Point
Sample Type
Hg
(ppb)
1. Mehmood Booti Dumping Site 1, Lahore Solid waste 1.20
2. Mehmood Booti Dumping Site 2, Lahore Solid waste 0.60
3. Residual waste of incinerated hospital
waste, Children Hospital ,Lahore Solid waste 1.52
4. Ittehad chemicals Outlet 4, Kala Shah
Kaku, Sheikhupura Solid waste 2.70
5. Ittehad chemicals Solid Waste 1, Kala Shah
Kaku, Sheikhupura Solid waste 0.77
6. Ittehad chemicals Solid Waste 2, Kala Shah
Kaku, Sheikhupura Solid waste 0.40
7. Ittehad chemicals Solid Waste 3, Kala Shah
Kaku, Sheikhupura Solid waste 0000
8. Sitara chemicals Solid Waste 1, Faisalabad Solid waste 0.40
9. Sitara chemicals Solid Waste 2, Faisalabad Solid waste 0.50
10. Sitara chemicals Solid Waste 3, Faisalabad Solid waste 1.20
11. ARC sock near Kahna, Hudiarah drain,
Lahore Waste water 0 000
12. Badian road, Hudiarah drain , Lahore Waste water 1.59
13. Main Ferozepur road, Hudiarah drain,
Lahore Waste water 00 00
14. Near Shafi Reso Chem, Hudiarah drain,
Lahore Waste water 0000
15. Azadi chowk, Ravi road,River Ravi, Lahore Waste water 0000
16. Near Taj company, Ravi road, River Ravi,
Lahore Waste water 1.26
17. Shahdra village bridge, Ravi road,River
Ravi,Lahore Waste water 0000
18. Town ship municipal waste drain, Lahore Waste water 0.60
19. Mehmood Booti Drain, Lahore Waste water 3.90
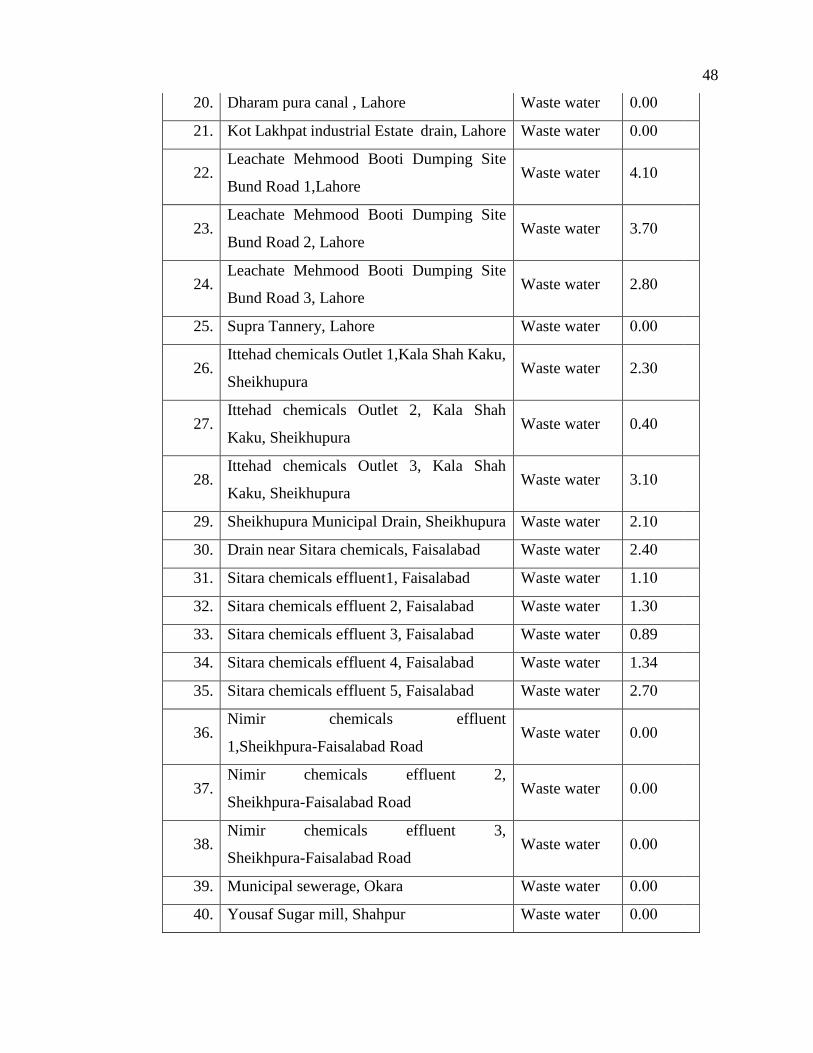
48
20. Dharam pura canal , Lahore Waste water 0000
21. Kot Lakhpat industrial Estate drain, Lahore Waste water 0000
22. Leachate Mehmood Booti Dumping Site
Bund Road 1,Lahore Waste water 4.10
23. Leachate Mehmood Booti Dumping Site
Bund Road 2, Lahore Waste water 3.70
24. Leachate Mehmood Booti Dumping Site
Bund Road 3, Lahore Waste water 2.80
25. Supra Tannery, Lahore Waste water 0000
26. Ittehad chemicals Outlet 1,Kala Shah Kaku,
Sheikhupura Waste water 2.30
27. Ittehad chemicals Outlet 2, Kala Shah
Kaku, Sheikhupura Waste water 0.40
28. Ittehad chemicals Outlet 3, Kala Shah
Kaku, Sheikhupura Waste water 3.10
29. Sheikhupura Municipal Drain, Sheikhupura Waste water 2.10
30. Drain near Sitara chemicals, Faisalabad Waste water 2.40
31. Sitara chemicals effluent1, Faisalabad Waste water 1.10
32. Sitara chemicals effluent 2, Faisalabad Waste water 1.30
33. Sitara chemicals effluent 3, Faisalabad Waste water 0.89
34. Sitara chemicals effluent 4, Faisalabad Waste water 1.34
35. Sitara chemicals effluent 5, Faisalabad Waste water 2.70
36. Nimir chemicals effluent
1,Sheikhpura-Faisalabad Road Waste water 0000
37. Nimir chemicals effluent 2,
Sheikhpura-Faisalabad Road Waste water 0000
38. Nimir chemicals effluent 3,
Sheikhpura-Faisalabad Road Waste water 0000
39. Municipal sewerage, Okara Waste water 0000
40. Yousaf Sugar mill, Shahpur Waste water 0000
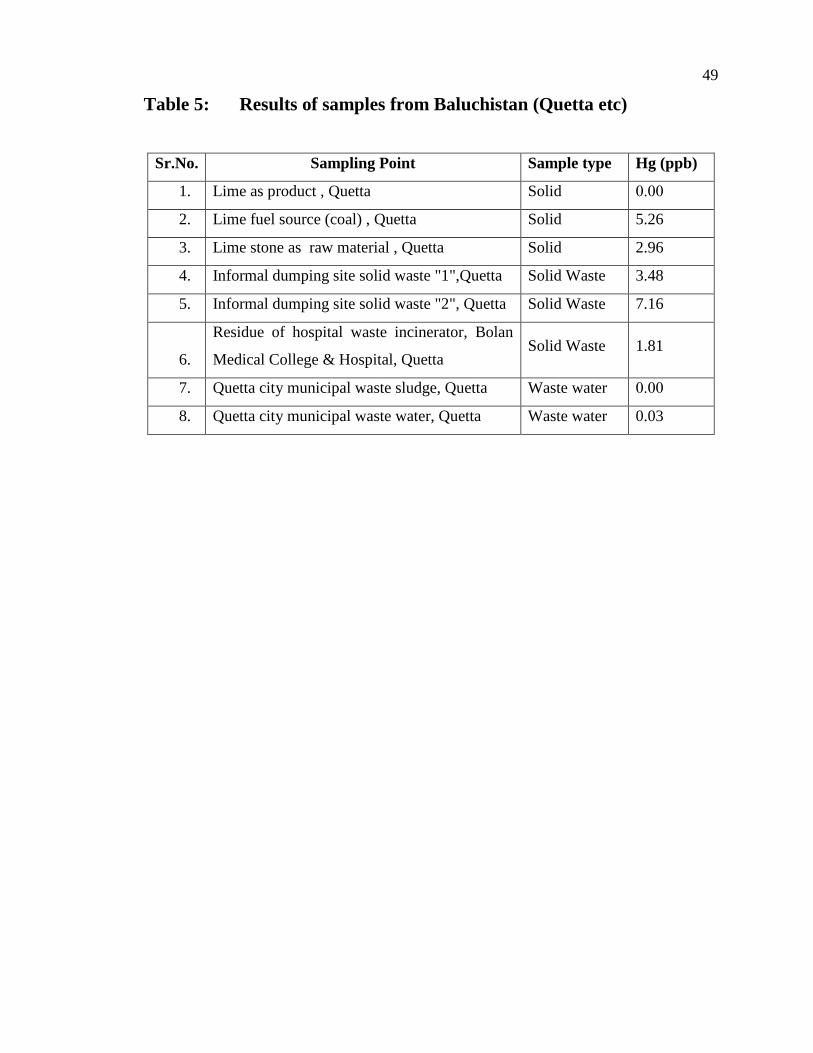
49
Table 5: Results of samples from Baluchistan (Quetta etc)
Sr.No. Sampling Point Sample type Hg (ppb)
1. Lime as product , Quetta Solid 0000
2. Lime fuel source (coal) , Quetta Solid 5.26
3. Lime stone as raw material , Quetta Solid 2.96
4. Informal dumping site solid waste "1",Quetta Solid Waste 3.48
5. Informal dumping site solid waste "2", Quetta Solid Waste 7.16
6.
Residue of hospital waste incinerator, Bolan
Medical College & Hospital, Quetta Solid Waste 1.81
7. Quetta city municipal waste sludge, Quetta Waste water 0000
8. Quetta city municipal waste water, Quetta Waste water 0.03
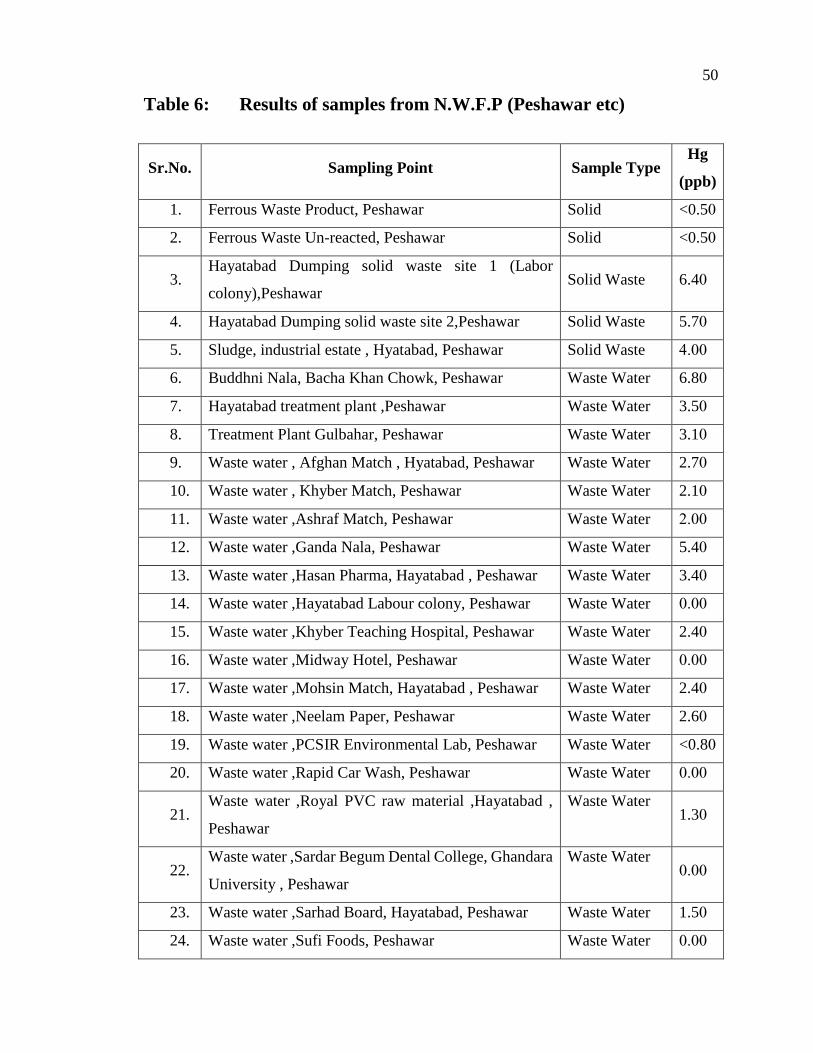
50
Table 6: Results of samples from N.W.F.P (Peshawar etc)
Sr.No. Sampling Point Sample Type Hg
(ppb)
1. Ferrous Waste Product, Peshawar Solid <0.50
2. Ferrous Waste Un-reacted, Peshawar Solid <0.50
3. Hayatabad Dumping solid waste site 1 (Labor
colony),Peshawar Solid Waste 6.40
4. Hayatabad Dumping solid waste site 2,Peshawar Solid Waste 5.70
5. Sludge, industrial estate , Hyatabad, Peshawar Solid Waste 0000
6. Buddhni Nala, Bacha Khan Chowk, Peshawar Waste Water 6.80
7. Hayatabad treatment plant ,Peshawar Waste Water 3.50
8. Treatment Plant Gulbahar, Peshawar Waste Water 3.10
9. Waste water , Afghan Match , Hyatabad, Peshawar Waste Water 2.70
10. Waste water , Khyber Match, Peshawar Waste Water 2.10
11. Waste water ,Ashraf Match, Peshawar Waste Water 0000
12. Waste water ,Ganda Nala, Peshawar Waste Water 5.40
13. Waste water ,Hasan Pharma, Hayatabad , Peshawar Waste Water 3.40
14. Waste water ,Hayatabad Labour colony, Peshawar Waste Water 0000
15. Waste water ,Khyber Teaching Hospital, Peshawar Waste Water 2.40
16. Waste water ,Midway Hotel, Peshawar Waste Water 0000
17. Waste water ,Mohsin Match, Hayatabad , Peshawar Waste Water 2.40
18. Waste water ,Neelam Paper, Peshawar Waste Water 2.60
19. Waste water ,PCSIR Environmental Lab, Peshawar Waste Water <0.80
20. Waste water ,Rapid Car Wash, Peshawar Waste Water 0000
21. Waste water ,Royal PVC raw material ,Hayatabad ,
Peshawar
Waste Water 1.30
22. Waste water ,Sardar Begum Dental College, Ghandara
University , Peshawar
Waste Water 0000
23. Waste water ,Sarhad Board, Hayatabad, Peshawar Waste Water 1.50
24. Waste water ,Sufi Foods, Peshawar Waste Water 0000
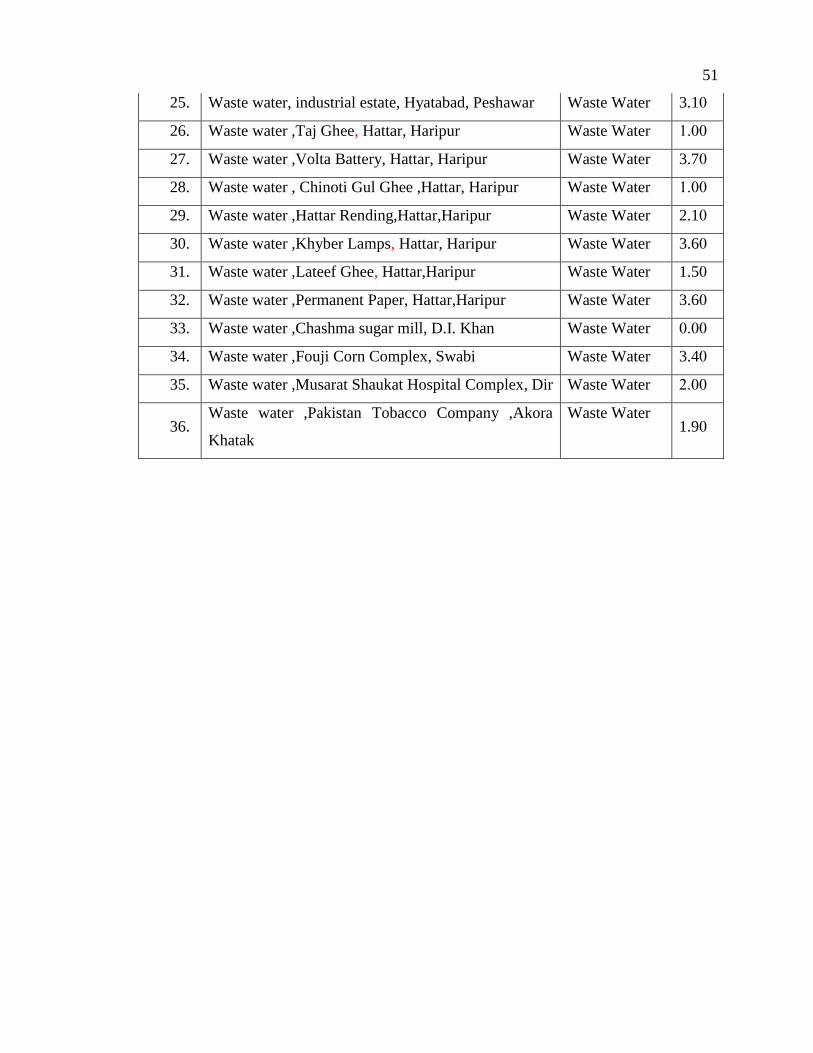
51
25. Waste water, industrial estate, Hyatabad, Peshawar Waste Water 3.10
26. Waste water ,Taj Ghee, Hattar, Haripur Waste Water 0000
27. Waste water ,Volta Battery, Hattar, Haripur Waste Water 3.70
28. Waste water , Chinoti Gul Ghee ,Hattar, Haripur Waste Water 0000
29. Waste water ,Hattar Rending,Hattar,Haripur Waste Water 2.10
30. Waste water ,Khyber Lamps, Hattar, Haripur Waste Water 3.60
31. Waste water ,Lateef Ghee, Hattar,Haripur Waste Water 1.50
32. Waste water ,Permanent Paper, Hattar,Haripur Waste Water 3.60
33. Waste water ,Chashma sugar mill, D.I. Khan Waste Water 0000
34. Waste water ,Fouji Corn Complex, Swabi Waste Water 3.40
35. Waste water ,Musarat Shaukat Hospital Complex, Dir Waste Water 0000
36. Waste water ,Pakistan Tobacco Company ,Akora
Khatak
Waste Water 1.90
52
4.1.1 DISCUSSION
The results indicate that all the sectors of society and industry have exposure to
mercury at least to some extent as revealed by the data in above tables. It has become more
of concern because this study touches the narrowly selected windows of samples which
are, but meager representative of real image.
The results also indicate that the maximum mercury concentration is limited to the
solid waste disposal sites in all areas of provinces of Pakistan. The sources contributing to
the higher mercury concentration in municipal solid waste is apparently due to the waste
batteries cells, fluorescent lamps, some switching devices. No doubt, this figure of the
finding is disturbing but on the other hand, the solid waste can be managed more easily and
it spreads much less as compared to liquid waste. The proper disposal or removal of
mercury from the solid waste could be reliable mitigation measure for the toxicity of
mercury. The need is to identify sources adding the maximum mercury in the solid waste,
be it some industry or occupation.
4.2 RESULTS OF MERCURY FROM HUMAN HAIR
SAMPLES
To identify the mercury exposure of the workers in mercury related occupations, 72
human hair samples were obtained from chlor-alkali sector (Ittehad Chemicals Limited,
Kala Shah Kaku, Sheikhupura & Sitara Chemicals Industries Limited, Faisalabad), dental
amalgam sector (Punjab Dental College and Hospital, Lahore) and control group sector
(students, gardeners etc).
The concentrations of total mercury (T-Hg) in hair samples are summarized in
tables 7, 8,9,10 and Figures 3, 3a & 3b.
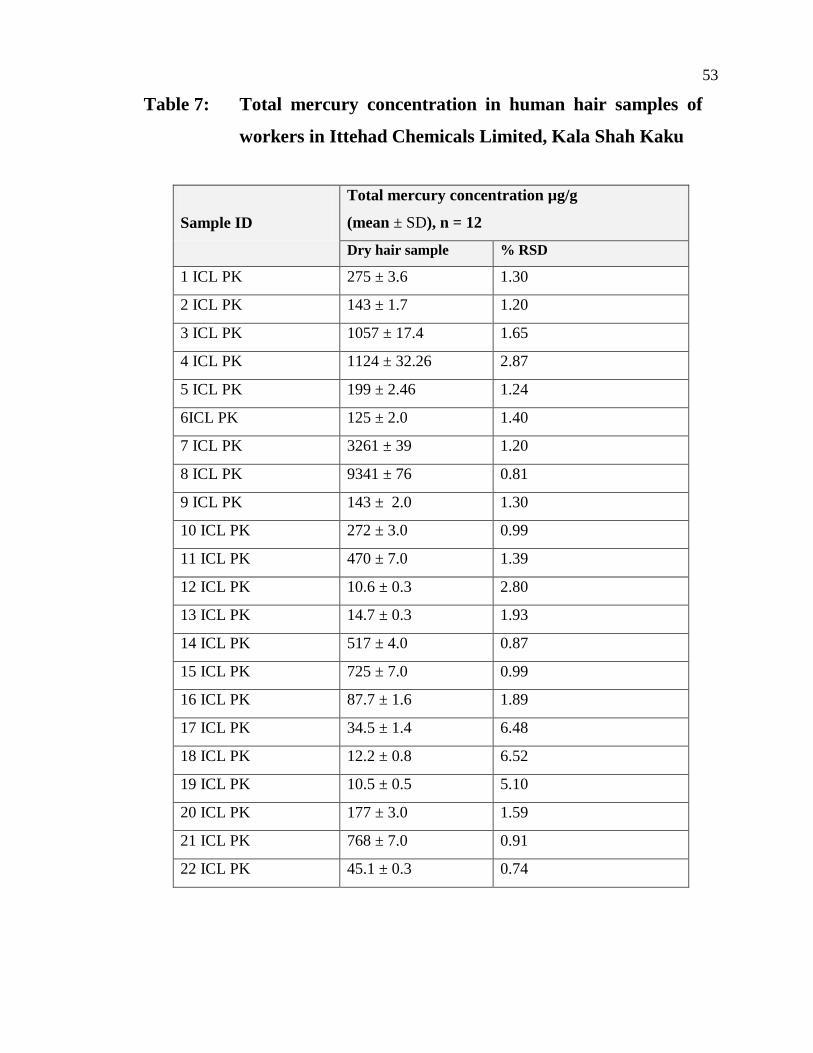
53
Table 7: Total mercury concentration in human hair samples of
workers in Ittehad Chemicals Limited, Kala Shah Kaku
Sample ID
Total mercury concentration µg/g
(mean ± SD), n = 12
Dry hair sample % RSD
1 ICL PK 275 ± 3.6 1.30
2 ICL PK 143 ± 1.7 1.20
3 ICL PK 1057 ± 17.4 1.65
4 ICL PK 1124 ± 32.26 2.87
5 ICL PK 199 ± 2.46 1.24
6ICL PK 125 ± 2.0 1.40
7 ICL PK 3261 ± 39 1.20
8 ICL PK 9341 ± 76 0.81
9 ICL PK 143 ± 2.0 1.30
10 ICL PK 272 ± 3.0 0.99
11 ICL PK 470 ± 7.0 1.39
12 ICL PK 10.6 ± 0.3 2.80
13 ICL PK 14.7 ± 0.3 1.93
14 ICL PK 517 ± 4.0 0.87
15 ICL PK 725 ± 7.0 0.99
16 ICL PK 87.7 ± 1.6 1.89
17 ICL PK 34.5 ± 1.4 6.48
18 ICL PK 12.2 ± 0.8 6.52
19 ICL PK 10.5 ± 0.5 5.10
20 ICL PK 177 ± 3.0 1.59
21 ICL PK 768 ± 7.0 0.91
22 ICL PK 45.1 ± 0.3 0.74
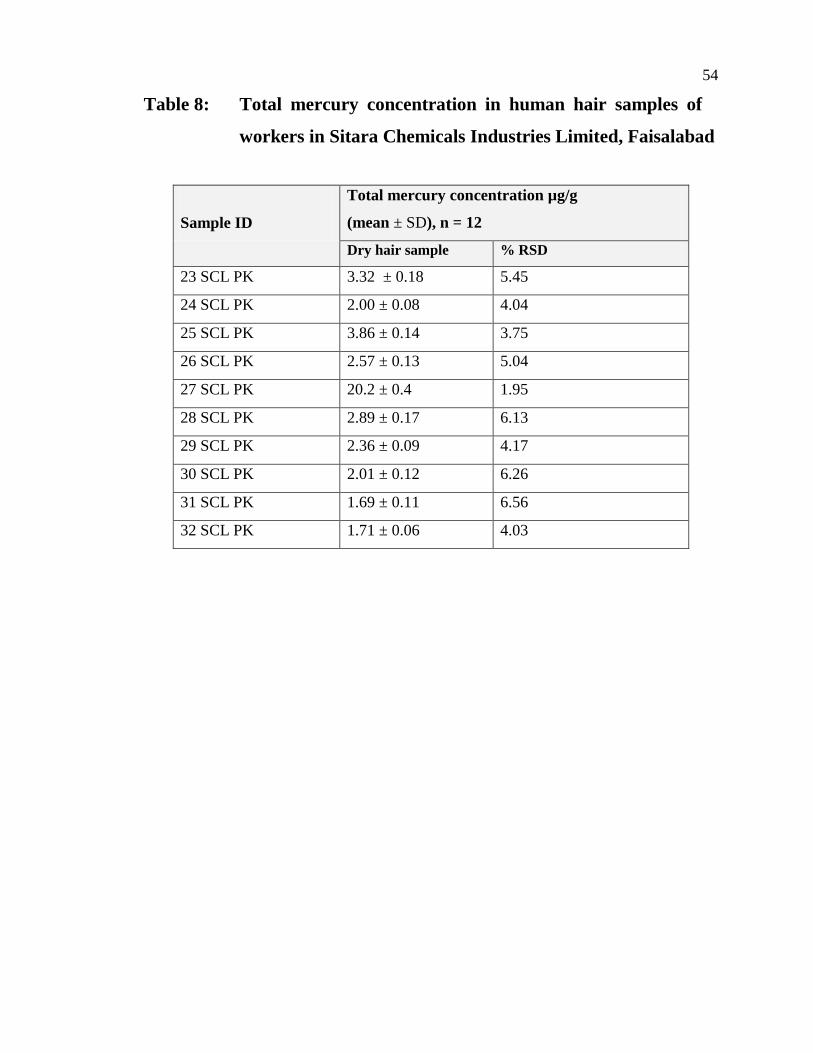
54
Table 8: Total mercury concentration in human hair samples of
workers in Sitara Chemicals Industries Limited, Faisalabad
Sample ID
Total mercury concentration µg/g
(mean ± SD), n = 12
Dry hair sample % RSD
23 SCL PK 3.32 ± 0.18 5.45
24 SCL PK 2.00 ± 0.08 4.04
25 SCL PK 3.86 ± 0.14 3.75
26 SCL PK 2.57 ± 0.13 5.04
27 SCL PK 20.2 ± 0.4 1.95
28 SCL PK 2.89 ± 0.17 6.13
29 SCL PK 2.36 ± 0.09 4.17
30 SCL PK 2.01 ± 0.12 6.26
31 SCL PK 1.69 ± 0.11 6.56
32 SCL PK 1.71 ± 0.06 4.03
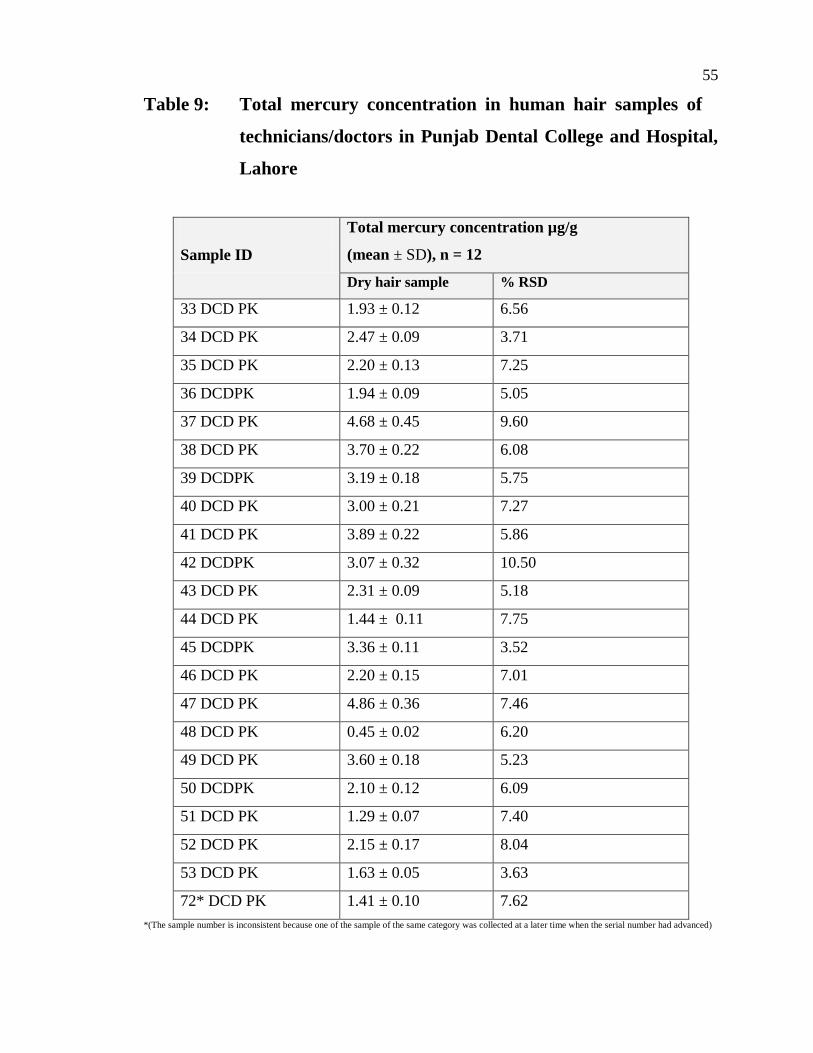
55
Table 9: Total mercury concentration in human hair samples of
technicians/doctors in Punjab Dental College and Hospital,
Lahore
Sample ID
Total mercury concentration µg/g
(mean ± SD), n = 12
Dry hair sample % RSD
33 DCD PK 1.93 ± 0.12 6.56
34 DCD PK 2.47 ± 0.09 3.71
35 DCD PK 2.20 ± 0.13 7.25
36 DCDPK 1.94 ± 0.09 5.05
37 DCD PK 4.68 ± 0.45 9.60
38 DCD PK 3.70 ± 0.22 6.08
39 DCDPK 3.19 ± 0.18 5.75
40 DCD PK 3.00 ± 0.21 7.27
41 DCD PK 3.89 ± 0.22 5.86
42 DCDPK 3.07 ± 0.32 10.50
43 DCD PK 2.31 ± 0.09 5.18
44 DCD PK 1.44 ± 0.11 7.75
45 DCDPK 3.36 ± 0.11 3.52
46 DCD PK 2.20 ± 0.15 7.01
47 DCD PK 4.86 ± 0.36 7.46
48 DCD PK 0.45 ± 0.02 6.20
49 DCD PK 3.60 ± 0.18 5.23
50 DCDPK 2.10 ± 0.12 6.09
51 DCD PK 1.29 ± 0.07 7.40
52 DCD PK 2.15 ± 0.17 8.04
53 DCD PK 1.63 ± 0.05 3.63
72* DCD PK 1.41 ± 0.10 7.62
*(The sample number is inconsistent because one of the sample of the same category was collected at a later time when the serial number had advanced)
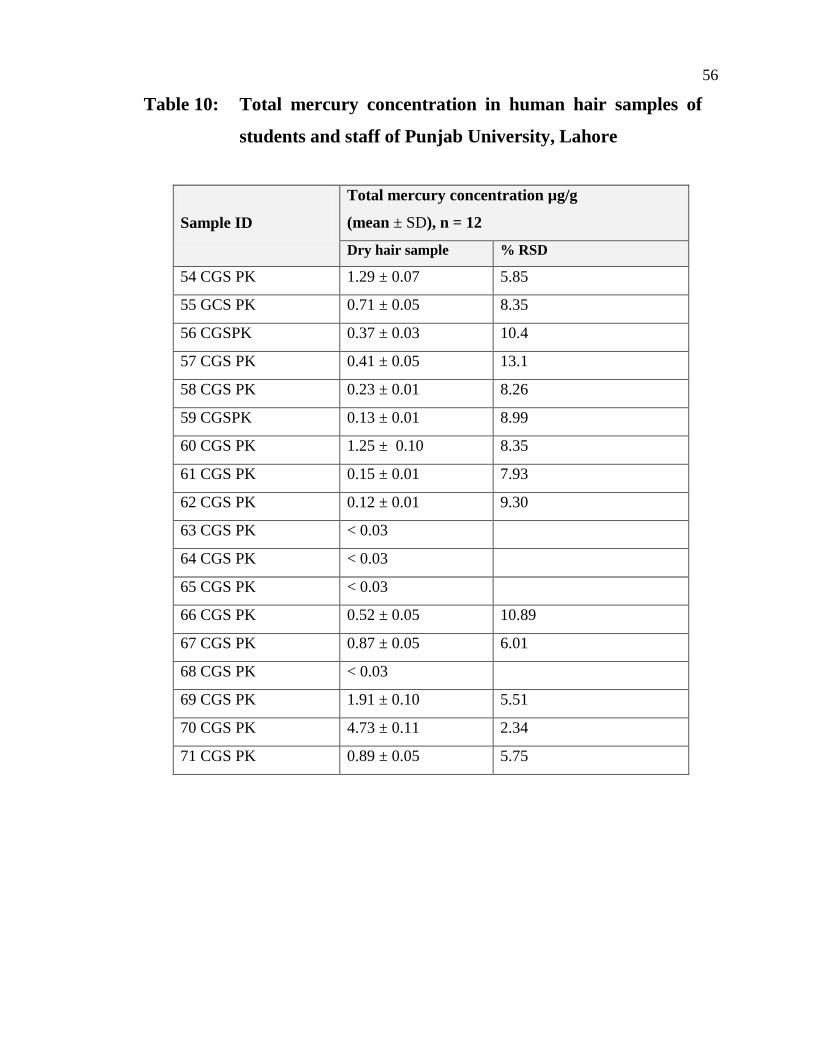
56
Table 10: Total mercury concentration in human hair samples of
students and staff of Punjab University, Lahore
Sample ID
Total mercury concentration µg/g
(mean ± SD), n = 12
Dry hair sample % RSD
54 CGS PK 1.29 ± 0.07 5.85
55 GCS PK 0.71 ± 0.05 8.35
56 CGSPK 0.37 ± 0.03 10.4
57 CGS PK 0.41 ± 0.05 13.1
58 CGS PK 0.23 ± 0.01 8.26
59 CGSPK 0.13 ± 0.01 8.99
60 CGS PK 1.25 ± 0.10 8.35
61 CGS PK 0.15 ± 0.01 7.93
62 CGS PK 0.12 ± 0.01 9.30
63 CGS PK < 0.03
64 CGS PK < 0.03
65 CGS PK < 0.03
66 CGS PK 0.52 ± 0.05 10.89
67 CGS PK 0.87 ± 0.05 6.01
68 CGS PK < 0.03
69 CGS PK 1.91 ± 0.10 5.51
70 CGS PK 4.73 ± 0.11 2.34
71 CGS PK 0.89 ± 0.05 5.75
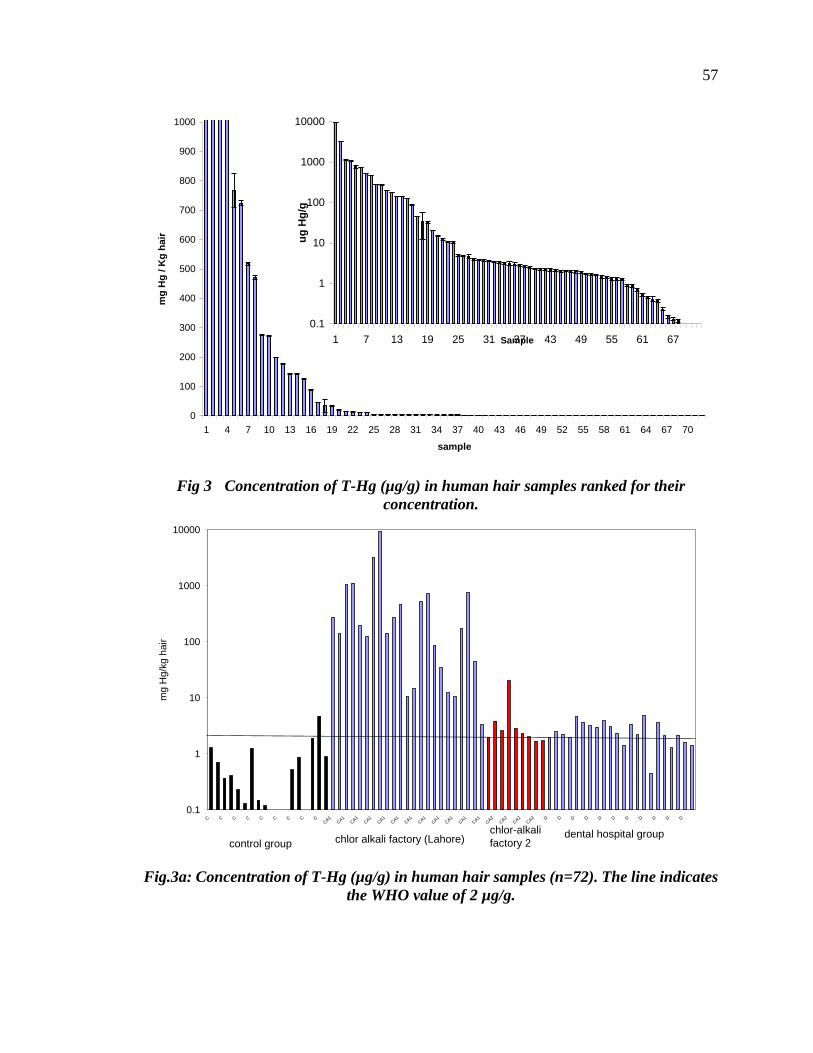
57
Fig 3 Concentration of T-Hg (µg/g) in human hair samples ranked for their
concentration.
Fig.3a: Concentration of T-Hg (µg/g) in human hair samples (n=72). The line indicates
the WHO value of 2 µg/g.
0
100
200
300
400
500
600
700
800
900
1000
1 4 7 10 13 16 19 22 25 28 31 34 37 40 43 46 49 52 55 58 61 64 67 70
sample
mg
Hg
/ K
g h
air
0.1
1
10
100
1000
10000
1 7 13 19 25 31 37 43 49 55 61 67Sample
ug
Hg
/g
0.1
1
10
100
1000
10000
C C C C C C C C CCA1
CA1
CA1
CA1
CA1
CA1
CA1
CA1
CA1
CA1
CA1
CA1
CA2
CA2
CA2
CA2 D D D D D D D D D D D
mg H
g/k
g h
air
control group chlor alkali factory (Lahore)chlor-alkali
factory 2dental hospital group
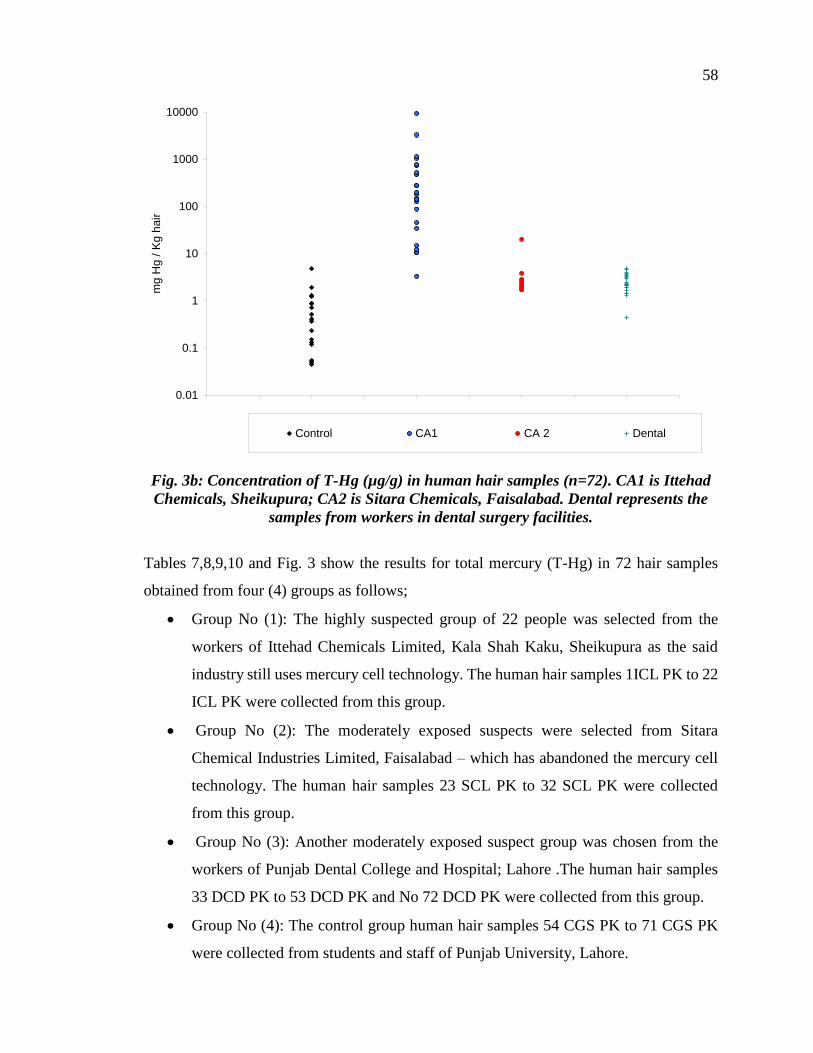
58
Fig. 3b: Concentration of T-Hg (µg/g) in human hair samples (n=72). CA1 is Ittehad
Chemicals, Sheikupura; CA2 is Sitara Chemicals, Faisalabad. Dental represents the
samples from workers in dental surgery facilities.
Tables 7,8,9,10 and Fig. 3 show the results for total mercury (T-Hg) in 72 hair samples
obtained from four (4) groups as follows;
Group No (1): The highly suspected group of 22 people was selected from the
workers of Ittehad Chemicals Limited, Kala Shah Kaku, Sheikupura as the said
industry still uses mercury cell technology. The human hair samples 1ICL PK to 22
ICL PK were collected from this group.
Group No (2): The moderately exposed suspects were selected from Sitara
Chemical Industries Limited, Faisalabad – which has abandoned the mercury cell
technology. The human hair samples 23 SCL PK to 32 SCL PK were collected
from this group.
Group No (3): Another moderately exposed suspect group was chosen from the
workers of Punjab Dental College and Hospital; Lahore .The human hair samples
33 DCD PK to 53 DCD PK and No 72 DCD PK were collected from this group.
Group No (4): The control group human hair samples 54 CGS PK to 71 CGS PK
were collected from students and staff of Punjab University, Lahore.
0.01
0.1
1
10
100
1000
10000
0 0.5 1 1.5 2 2.5 3 3.5 4 4.5
mg
Hg
/ K
g h
air
Control CA1 CA 2 Dental
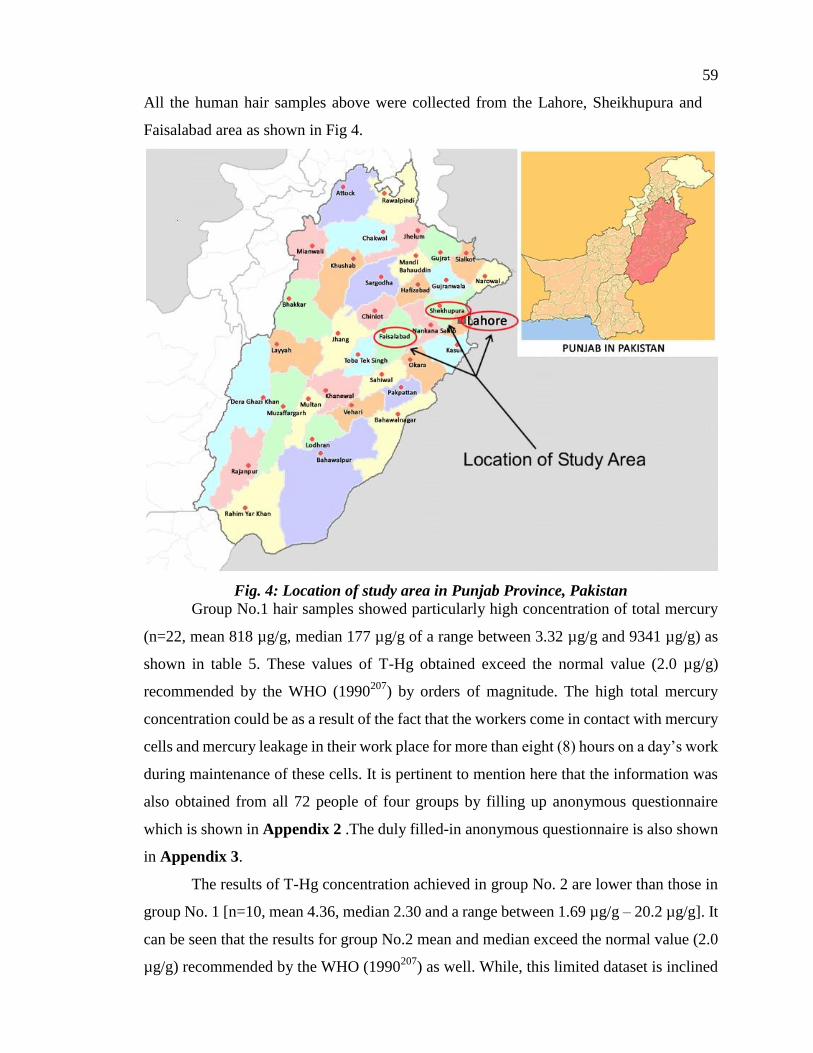
59
All the human hair samples above were collected from the Lahore, Sheikhupura and
Faisalabad area as shown in Fig 4.
Fig. 4: Location of study area in Punjab Province, Pakistan
Group No.1 hair samples showed particularly high concentration of total mercury
(n=22, mean 818 µg/g, median 177 µg/g of a range between 3.32 µg/g and 9341 µg/g) as
shown in table 5. These values of T-Hg obtained exceed the normal value (2.0 µg/g)
recommended by the WHO (1990207
) by orders of magnitude. The high total mercury
concentration could be as a result of the fact that the workers come in contact with mercury
cells and mercury leakage in their work place for more than eight (8) hours on a day’s work
during maintenance of these cells. It is pertinent to mention here that the information was
also obtained from all 72 people of four groups by filling up anonymous questionnaire
which is shown in Appendix 2 .The duly filled-in anonymous questionnaire is also shown
in Appendix 3.
The results of T-Hg concentration achieved in group No. 2 are lower than those in
group No. 1 [n=10, mean 4.36, median 2.30 and a range between 1.69 µg/g – 20.2 µg/g]. It
can be seen that the results for group No.2 mean and median exceed the normal value (2.0
µg/g) recommended by the WHO (1990207
) as well. While, this limited dataset is inclined
60
by the one large value, it should be noted that the lowest concentration is just lower the
2.0 µg/g and no value is below 1.0 µg/g.
For group No 3, the total mercury concentration obtained for the workers in the
dental hospital (n=22) showed a mean value of 2.59 and a median of 2.26 µg/g and a range
between 0.45 µg/g to 4.86 µg Hg per gram which shows that most of the hair samples in
this group exceeded the normal value (2.0 µg/g) recommended by the WHO (1990207
).
These results may be recognized to the exposure to the amalgam.
The total mercury (T-Hg) results for group No.4, the control group (n=18) are
between below detection limit (<0.03 µg/g) and 4.73 µg/g. The mean value is 0.76 µg/g
and median 0.39 µg/g, both are extensively lower (p<0.05) than those of the dental hospital
and the workers from the chlor-alkai factories. In addition, most of the hair samples in this
group show lower concentration of total mercury (T-Hg) than the normal value (2.0 µg/g)
recommended by the WHO (1990207
).
It can be seen that in human hair sample groups 1, 2 and 3, most of the hair samples
(T-Hg concentration) exceed the normal value (2.0 µg/g) recommended by the WHO
(1990207
). This can be related to prolonged exposure of workers to the mercury vapour.
Apparently, the longer is the duration of exposure, the higher is the value of total mercury
(T-Hg) found in their hair samples. For example, in group No.1, the workers come into
contact with mercury and mercury vapour at the work place (Ittehad Chemicals Limited
employing chlor-alkali process using mercury cell technology) thus resulting in high
concentration of T-Hg in their hair samples.
In group No.2, (the workers of the factories who have completely phased out
Mercury cell technology) the high concentration of T-Hg in hair samples could be due to
exposure to the contaminated areas. The Group No. 3 although, having been in close
vicinity to mercury usage, has even lower levels of mercury, owing to better occupational
practices and proper knowledge. However, in group No.4, lower concentration of total
mercury in hair samples were recorded as a result of limited exposure to mercury involving
students and staff at Punjab University, Lahore.
61
4.2.1. Comparison with other studies
In comparison of this study with other data obtained from similar studies as shown
in table 9, the average total mercury concentration in human hair samples for Pakistani
chlor-alkali factory workers are extremely high, especially from the one location. Several
hair samples had values above 1000 µg/g, which are the highest values ever reported. The
hair from workers of a different chlor- alkali factory site had much lower mercury values,
although still at elevated levels. Pakistani health workers had high levels of mercury
compared to the general public (2.62 ± 0.16 µg/g) and Pakistani general people (0.97 ±
0.04 µg/g.
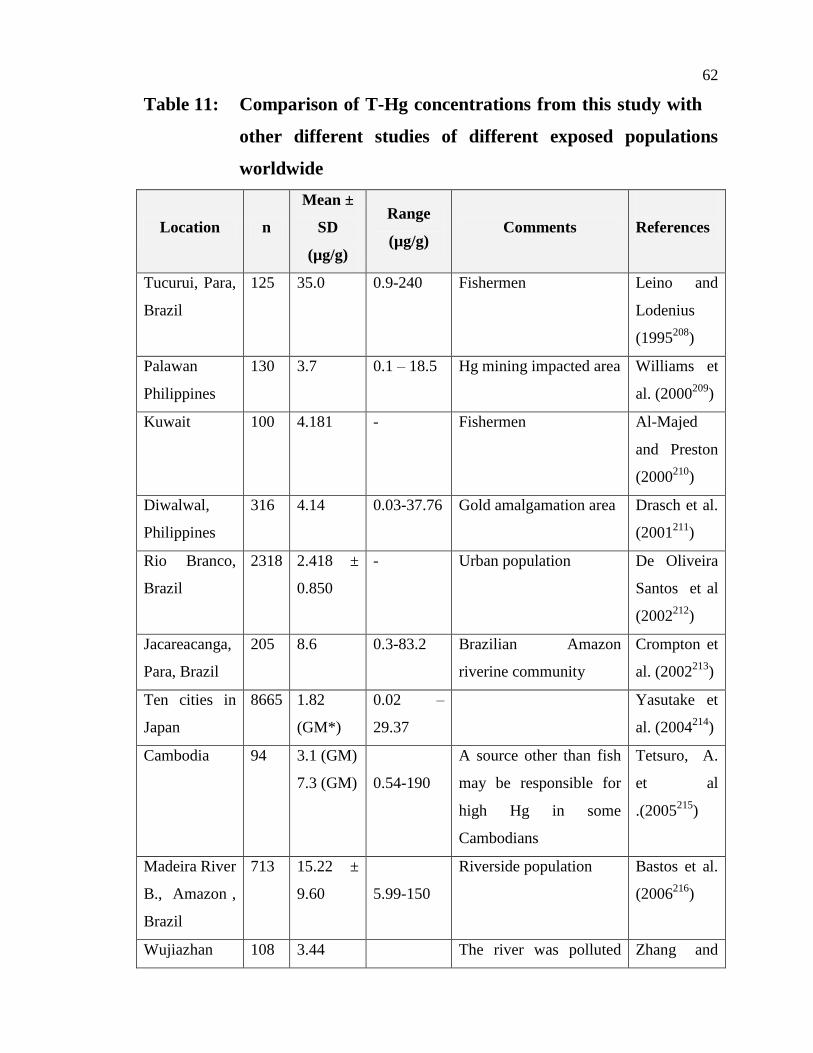
62
Table 11: Comparison of T-Hg concentrations from this study with
other different studies of different exposed populations
worldwide
Location n
Mean ±
SD
(µg/g)
Range
(µg/g) Comments
References
Tucurui, Para,
Brazil
125 35.0 0.9-240 Fishermen Leino and
Lodenius
(1995208
)
Palawan
Philippines
130 3.7 0.1 – 18.5 Hg mining impacted area Williams et
al. (2000209
)
Kuwait 100 4.181 - Fishermen Al-Majed
and Preston
(2000210
)
Diwalwal,
Philippines
316 4.14 0.03-37.76 Gold amalgamation area Drasch et al.
(2001211
)
Rio Branco,
Brazil
2318 2.418 ±
0.850
- Urban population De Oliveira
Santos et al
(2002212
)
Jacareacanga,
Para, Brazil
205 8.6 0.3-83.2 Brazilian Amazon
riverine community
Crompton et
al. (2002213
)
Ten cities in
Japan
8665 1.82
(GM*)
0.02 –
29.37
Yasutake et
al. (2004214
)
Cambodia 94 3.1 (GM)
7.3 (GM)
0.54-190
A source other than fish
may be responsible for
high Hg in some
Cambodians
Tetsuro, A.
et al
.(2005215
)
Madeira River
B., Amazon ,
Brazil
713 15.22 ±
9.60
5.99-150
Riverside population Bastos et al.
(2006216
)
Wujiazhan 108 3.44 The river was polluted Zhang and
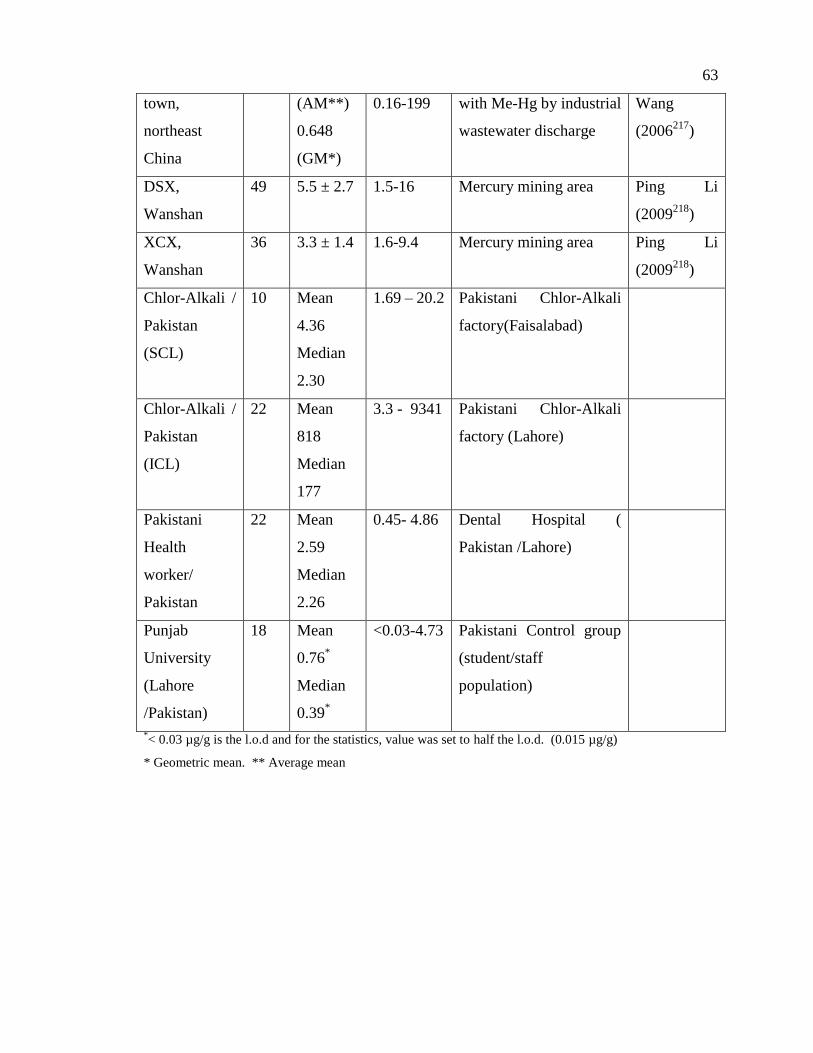
63
town,
northeast
China
(AM**)
0.648
(GM*)
0.16-199 with Me-Hg by industrial
wastewater discharge
Wang
(2006217
)
DSX,
Wanshan
49 5.5 ± 2.7 1.5-16 Mercury mining area Ping Li
(2009218
)
XCX,
Wanshan
36 3.3 ± 1.4 1.6-9.4 Mercury mining area Ping Li
(2009218
)
Chlor-Alkali /
Pakistan
(SCL)
10 Mean
4.36
Median
2.30
1.69 – 20.2 Pakistani Chlor-Alkali
factory(Faisalabad)
Chlor-Alkali /
Pakistan
(ICL)
22 Mean
818
Median
177
3.3 - 9341 Pakistani Chlor-Alkali
factory (Lahore)
Pakistani
Health
worker/
Pakistan
22 Mean
2.59
Median
2.26
0.45- 4.86 Dental Hospital (
Pakistan /Lahore)
Punjab
University
(Lahore
/Pakistan)
18 Mean
0.76*
Median
0.39*
<0.03-4.73 Pakistani Control group
(student/staff
population)
*< 0.03 µg/g is the l.o.d and for the statistics, value was set to half the l.o.d. (0.015 µg/g)
* Geometric mean. ** Average mean
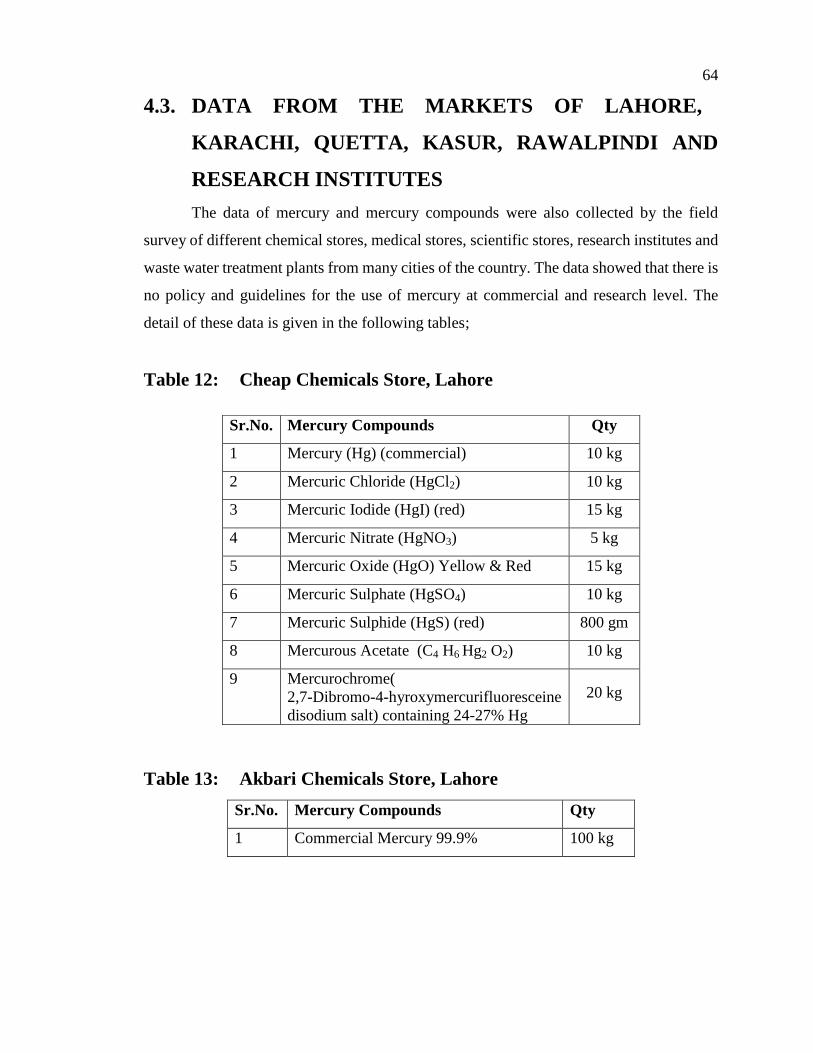
64
4.3. DATA FROM THE MARKETS OF LAHORE,
KARACHI, QUETTA, KASUR, RAWALPINDI AND
RESEARCH INSTITUTES
The data of mercury and mercury compounds were also collected by the field
survey of different chemical stores, medical stores, scientific stores, research institutes and
waste water treatment plants from many cities of the country. The data showed that there is
no policy and guidelines for the use of mercury at commercial and research level. The
detail of these data is given in the following tables;
Table 12: Cheap Chemicals Store, Lahore
Table 13: Akbari Chemicals Store, Lahore
Sr.No. Mercury Compounds Qty
1 Commercial Mercury 99.9% 100 kg
Sr.No. Mercury Compounds Qty
1 Mercury (Hg) (commercial) 10 kg
2 Mercuric Chloride (HgCl2) 10 kg
3 Mercuric Iodide (HgI) (red) 15 kg
4 Mercuric Nitrate (HgNO3) 5 kg
5 Mercuric Oxide (HgO) Yellow & Red 15 kg
6 Mercuric Sulphate (HgSO4) 10 kg
7 Mercuric Sulphide (HgS) (red) 800 gm
8 Mercurous Acetate (C4 H6 Hg2 O2) 10 kg
9 Mercurochrome(
2,7-Dibromo-4-hyroxymercurifluoresceine
disodium salt) containing 24-27% Hg
20 kg
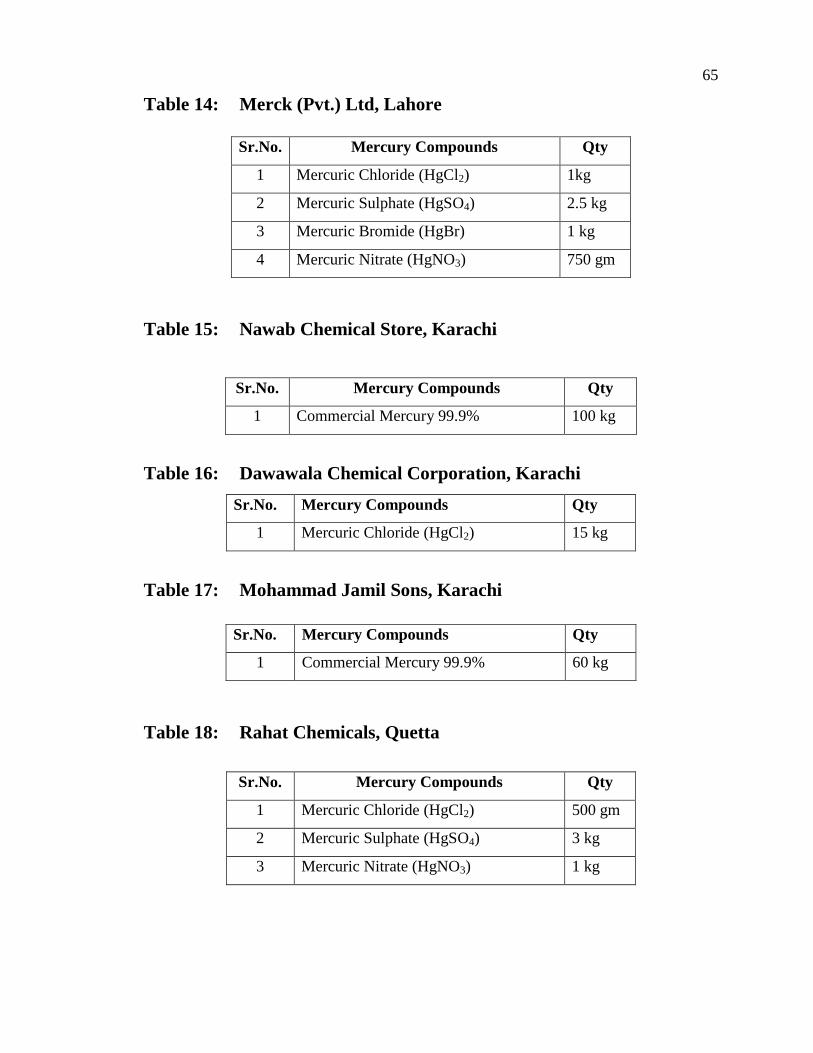
65
Table 14: Merck (Pvt.) Ltd, Lahore
Table 15: Nawab Chemical Store, Karachi
Sr.No. Mercury Compounds Qty
1 Commercial Mercury 99.9% 100 kg
Table 16: Dawawala Chemical Corporation, Karachi
Sr.No. Mercury Compounds Qty
1 Mercuric Chloride (HgCl2) 15 kg
Table 17: Mohammad Jamil Sons, Karachi
Table 18: Rahat Chemicals, Quetta
Sr.No. Mercury Compounds Qty
1 Mercuric Chloride (HgCl2) 500 gm
2 Mercuric Sulphate (HgSO4) 3 kg
3 Mercuric Nitrate (HgNO3) 1 kg
Sr.No. Mercury Compounds Qty
1 Mercuric Chloride (HgCl2) 1kg
2 Mercuric Sulphate (HgSO4) 2.5 kg
3 Mercuric Bromide (HgBr) 1 kg
4 Mercuric Nitrate (HgNO3) 750 gm
Sr.No. Mercury Compounds Qty
1 Commercial Mercury 99.9% 60 kg
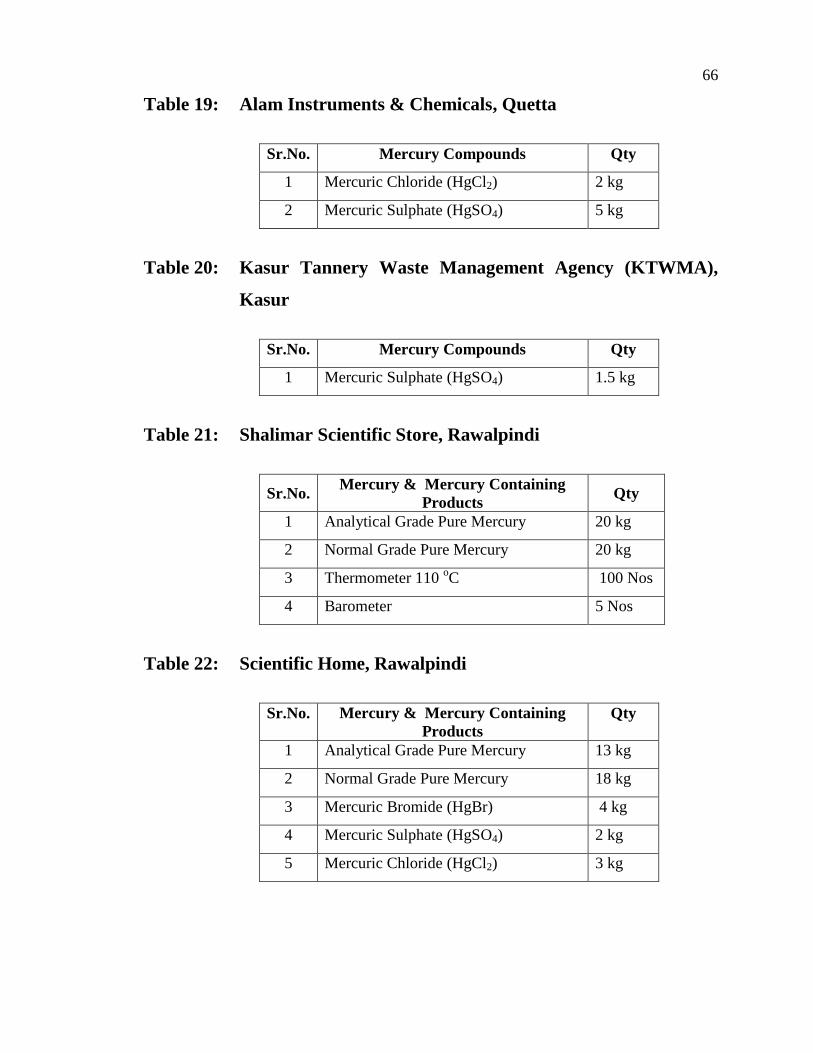
66
Table 19: Alam Instruments & Chemicals, Quetta
Sr.No. Mercury Compounds Qty
1 Mercuric Chloride (HgCl2) 2 kg
2 Mercuric Sulphate (HgSO4) 5 kg
Table 20: Kasur Tannery Waste Management Agency (KTWMA),
Kasur
Sr.No. Mercury Compounds Qty
1 Mercuric Sulphate (HgSO4) 1.5 kg
Table 21: Shalimar Scientific Store, Rawalpindi
Sr.No. Mercury & Mercury Containing
Products Qty
1 Analytical Grade Pure Mercury 20 kg
2 Normal Grade Pure Mercury 20 kg
3 Thermometer 110 oC 100 Nos
4 Barometer 5 Nos
Table 22: Scientific Home, Rawalpindi
Sr.No. Mercury & Mercury Containing
Products
Qty
1 Analytical Grade Pure Mercury 13 kg
2 Normal Grade Pure Mercury 18 kg
3 Mercuric Bromide (HgBr) 4 kg
4 Mercuric Sulphate (HgSO4) 2 kg
5 Mercuric Chloride (HgCl2) 3 kg
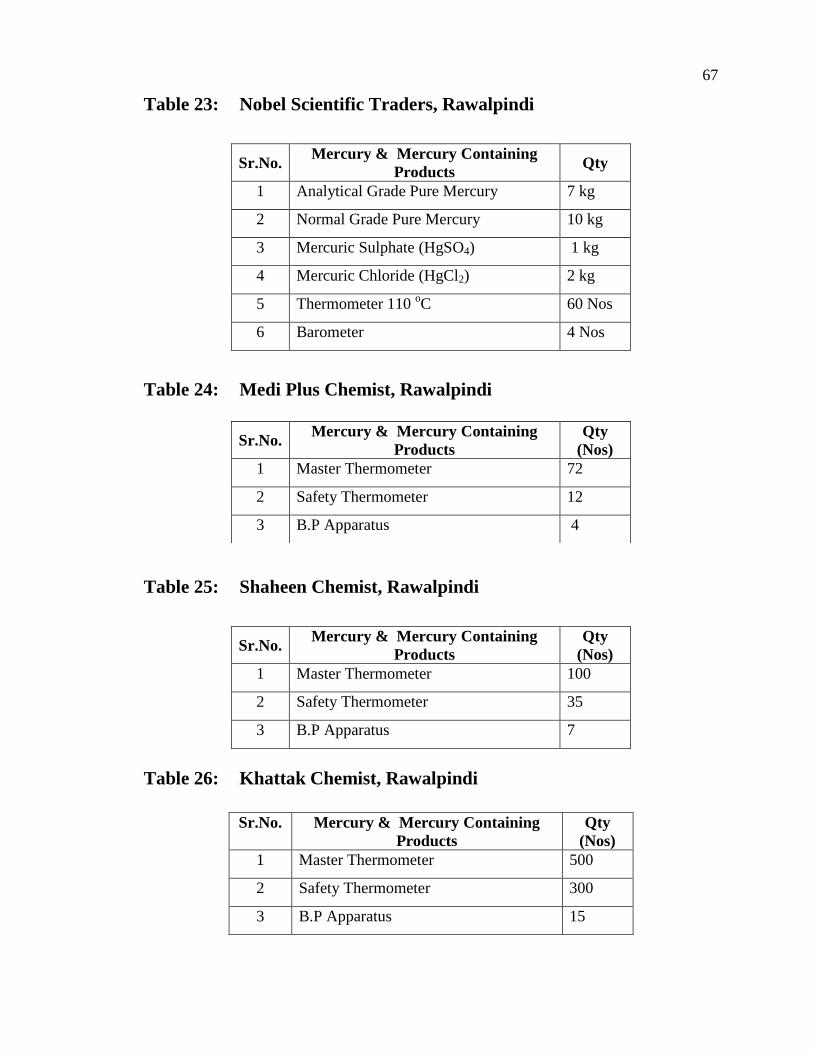
67
Table 23: Nobel Scientific Traders, Rawalpindi
Sr.No. Mercury & Mercury Containing
Products Qty
1 Analytical Grade Pure Mercury 7 kg
2 Normal Grade Pure Mercury 10 kg
3 Mercuric Sulphate (HgSO4) 1 kg
4 Mercuric Chloride (HgCl2) 2 kg
5 Thermometer 110 oC 60 Nos
6 Barometer 4 Nos
Table 24: Medi Plus Chemist, Rawalpindi
Table 25: Shaheen Chemist, Rawalpindi
Sr.No. Mercury & Mercury Containing
Products
Qty
(Nos)
1 Master Thermometer 100
2 Safety Thermometer 35
3 B.P Apparatus 7
Table 26: Khattak Chemist, Rawalpindi
Sr.No. Mercury & Mercury Containing
Products
Qty
(Nos)
1 Master Thermometer 72
2 Safety Thermometer 12
3 B.P Apparatus 4
Sr.No. Mercury & Mercury Containing
Products
Qty
(Nos)
1 Master Thermometer 500
2 Safety Thermometer 300
3 B.P Apparatus 15
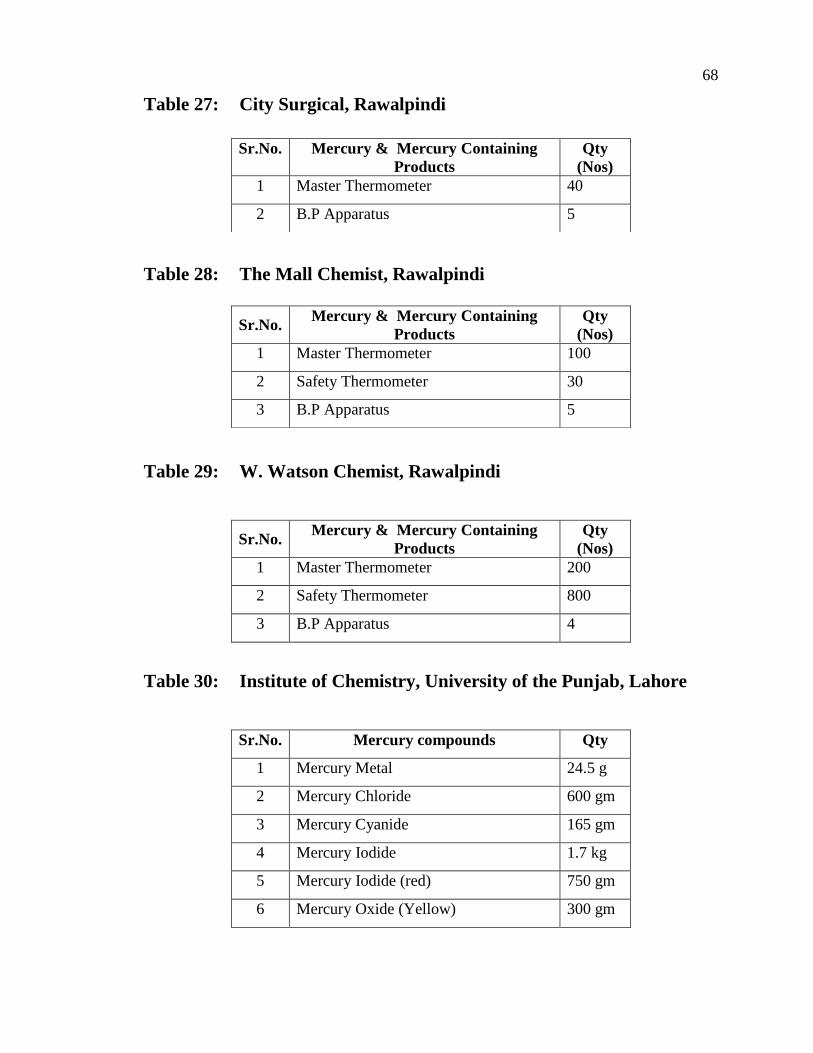
68
Table 27: City Surgical, Rawalpindi
Table 28: The Mall Chemist, Rawalpindi
Table 29: W. Watson Chemist, Rawalpindi
Sr.No. Mercury & Mercury Containing
Products
Qty
(Nos)
1 Master Thermometer 200
2 Safety Thermometer 800
3 B.P Apparatus 4
Table 30: Institute of Chemistry, University of the Punjab, Lahore
Sr.No. Mercury compounds Qty
1 Mercury Metal 24.5 g
2 Mercury Chloride 600 gm
3 Mercury Cyanide 165 gm
4 Mercury Iodide 1.7 kg
5 Mercury Iodide (red) 750 gm
6 Mercury Oxide (Yellow) 300 gm
Sr.No. Mercury & Mercury Containing
Products
Qty
(Nos)
1 Master Thermometer 40
2 B.P Apparatus 5
Sr.No. Mercury & Mercury Containing
Products
Qty
(Nos)
1 Master Thermometer 100
2 Safety Thermometer 30
3 B.P Apparatus 5
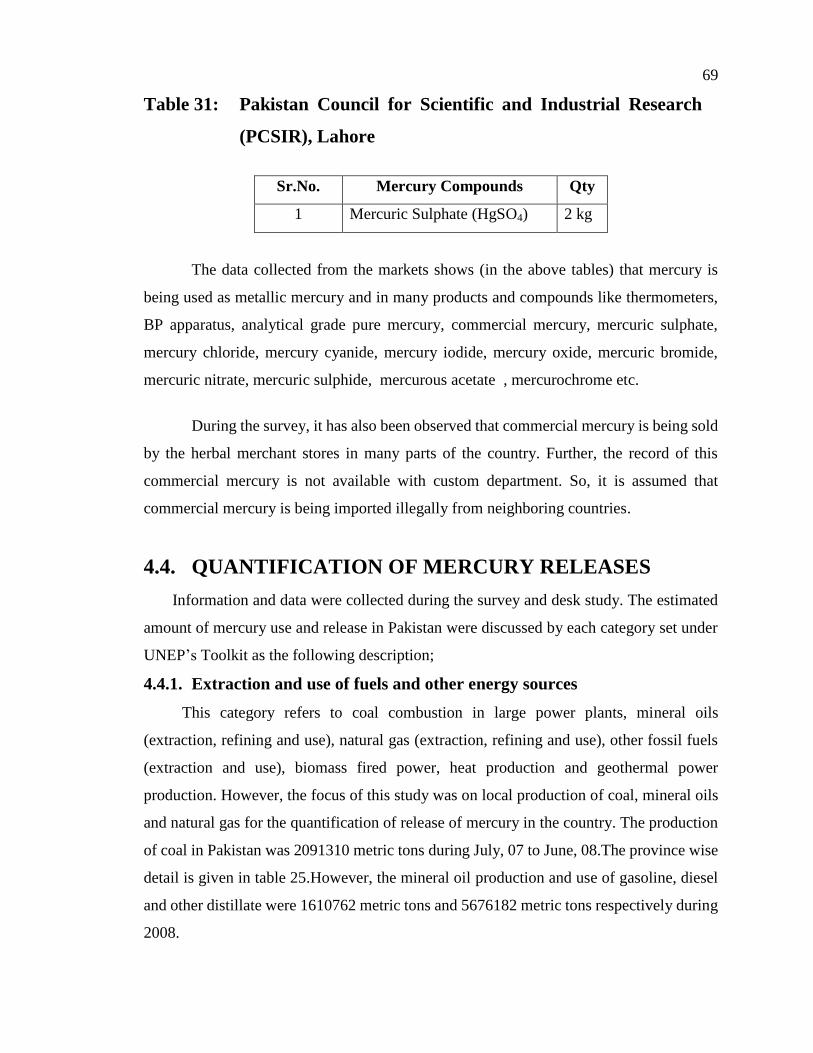
69
Table 31: Pakistan Council for Scientific and Industrial Research
(PCSIR), Lahore
Sr.No. Mercury Compounds Qty
1 Mercuric Sulphate (HgSO4) 2 kg
The data collected from the markets shows (in the above tables) that mercury is
being used as metallic mercury and in many products and compounds like thermometers,
BP apparatus, analytical grade pure mercury, commercial mercury, mercuric sulphate,
mercury chloride, mercury cyanide, mercury iodide, mercury oxide, mercuric bromide,
mercuric nitrate, mercuric sulphide, mercurous acetate , mercurochrome etc.
During the survey, it has also been observed that commercial mercury is being sold
by the herbal merchant stores in many parts of the country. Further, the record of this
commercial mercury is not available with custom department. So, it is assumed that
commercial mercury is being imported illegally from neighboring countries.
4.4. QUANTIFICATION OF MERCURY RELEASES
Information and data were collected during the survey and desk study. The estimated
amount of mercury use and release in Pakistan were discussed by each category set under
UNEP’s Toolkit as the following description;
4.4.1. Extraction and use of fuels and other energy sources
This category refers to coal combustion in large power plants, mineral oils
(extraction, refining and use), natural gas (extraction, refining and use), other fossil fuels
(extraction and use), biomass fired power, heat production and geothermal power
production. However, the focus of this study was on local production of coal, mineral oils
and natural gas for the quantification of release of mercury in the country. The production
of coal in Pakistan was 2091310 metric tons during July, 07 to June, 08.The province wise
detail is given in table 25.However, the mineral oil production and use of gasoline, diesel
and other distillate were 1610762 metric tons and 5676182 metric tons respectively during
2008.
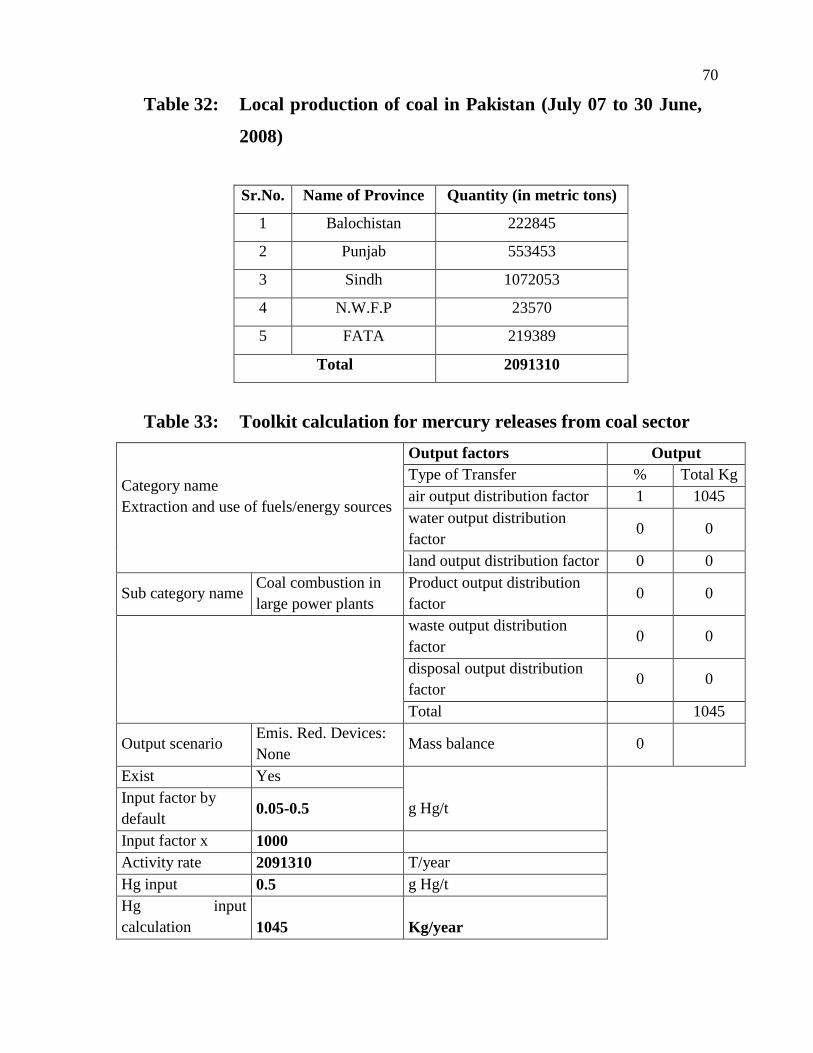
70
Table 32: Local production of coal in Pakistan (July 07 to 30 June,
2008)
Sr.No. Name of Province Quantity (in metric tons)
1 Balochistan 222845
2 Punjab 553453
3 Sindh 1072053
4 N.W.F.P 23570
5 FATA 219389
Total 2091310
Table 33: Toolkit calculation for mercury releases from coal sector
Category name
Extraction and use of fuels/energy sources
Output factors Output
Type of Transfer % Total Kg
air output distribution factor 1 1045
water output distribution
factor 0 0
land output distribution factor 0 0
Sub category name Coal combustion in
large power plants
Product output distribution
factor 0 0
waste output distribution
factor 0 0
disposal output distribution
factor 0 0
Total 1045
Output scenario Emis. Red. Devices:
None Mass balance 0
Exist Yes
Input factor by
default 0.05-0.5 g Hg/t
Input factor x 1000
Activity rate 2091310 T/year
Hg input 0.5 g Hg/t
Hg input
calculation 1045 Kg/year
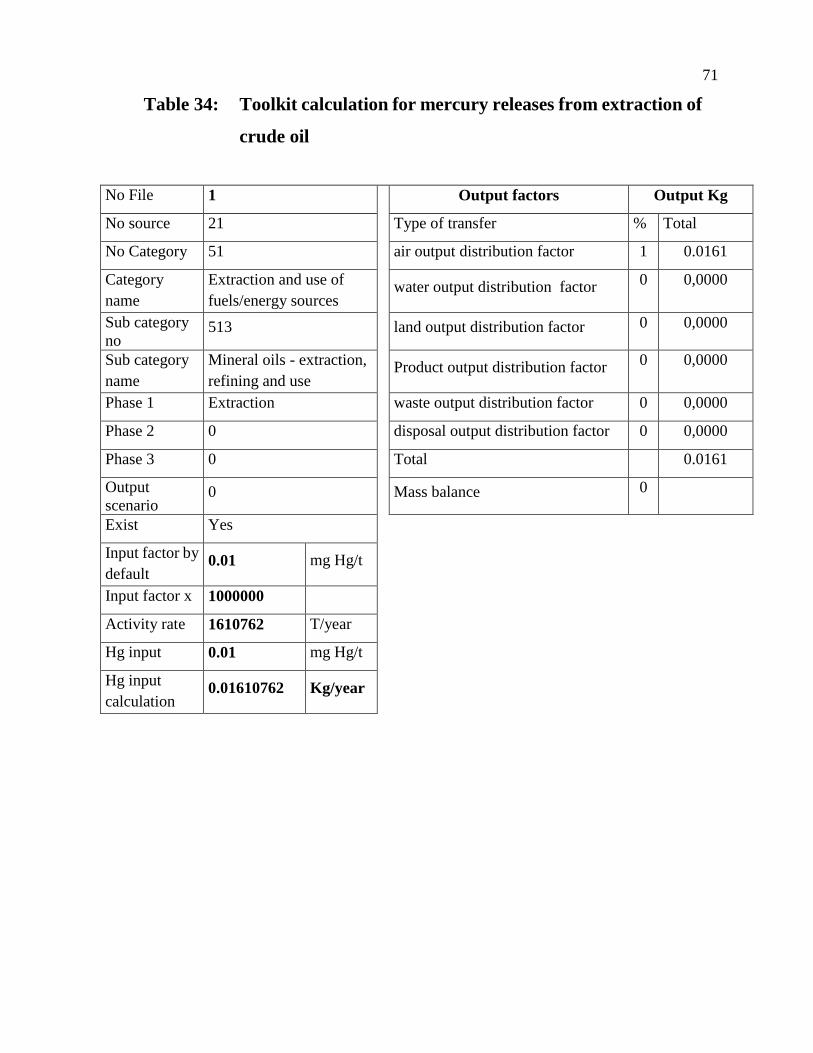
71
Table 34: Toolkit calculation for mercury releases from extraction of
crude oil
No File 1
Output factors Output Kg
No source 21 Type of transfer % Total
No Category 51 air output distribution factor 1 0.0161
Category
name
Extraction and use of
fuels/energy sources water output distribution factor
0 0,0000
Sub category
no 513 land output distribution factor 0 0,0000
Sub category
name
Mineral oils - extraction,
refining and use Product output distribution factor
0 0,0000
Phase 1 Extraction waste output distribution factor 0 0,0000
Phase 2 0 disposal output distribution factor 0 0,0000
Phase 3 0 Total 0.0161
Output
scenario 0 Mass balance 0
Exist Yes
Input factor by
default 0.01 mg Hg/t
Input factor x 1000000
Activity rate 1610762 T/year
Hg input 0.01 mg Hg/t
Hg input
calculation 0.01610762 Kg/year
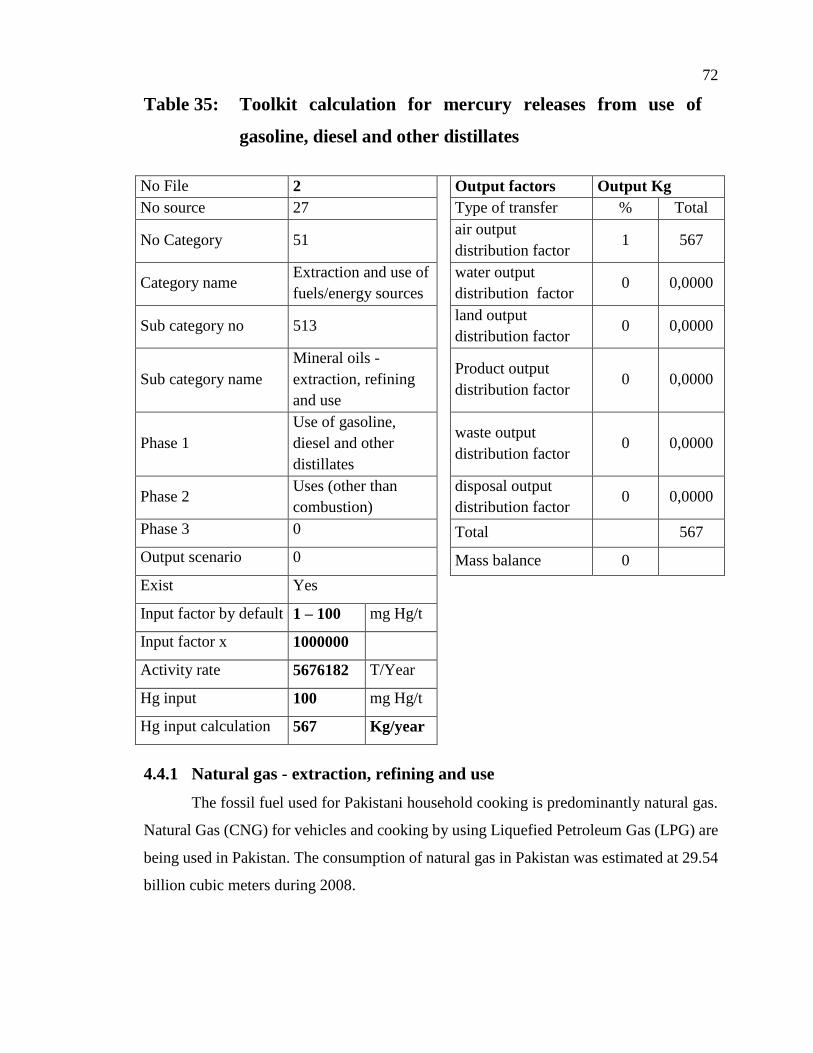
72
Table 35: Toolkit calculation for mercury releases from use of
gasoline, diesel and other distillates
No File 2
Output factors Output Kg
No source 27 Type of transfer % Total
No Category 51 air output
distribution factor 1 567
Category name Extraction and use of
fuels/energy sources
water output
distribution factor 0 0,0000
Sub category no 513 land output
distribution factor 0 0,0000
Sub category name
Mineral oils -
extraction, refining
and use
Product output
distribution factor 0 0,0000
Phase 1
Use of gasoline,
diesel and other
distillates
waste output
distribution factor 0 0,0000
Phase 2 Uses (other than
combustion)
disposal output
distribution factor 0 0,0000
Phase 3 0 Total 567
Output scenario 0 Mass balance 0
Exist Yes
Input factor by default 1 – 100 mg Hg/t
Input factor x 1000000
Activity rate 5676182 T/Year
Hg input 100 mg Hg/t
Hg input calculation 567 Kg/year
4.4.1 Natural gas - extraction, refining and use
The fossil fuel used for Pakistani household cooking is predominantly natural gas.
Natural Gas (CNG) for vehicles and cooking by using Liquefied Petroleum Gas (LPG) are
being used in Pakistan. The consumption of natural gas in Pakistan was estimated at 29.54
billion cubic meters during 2008.
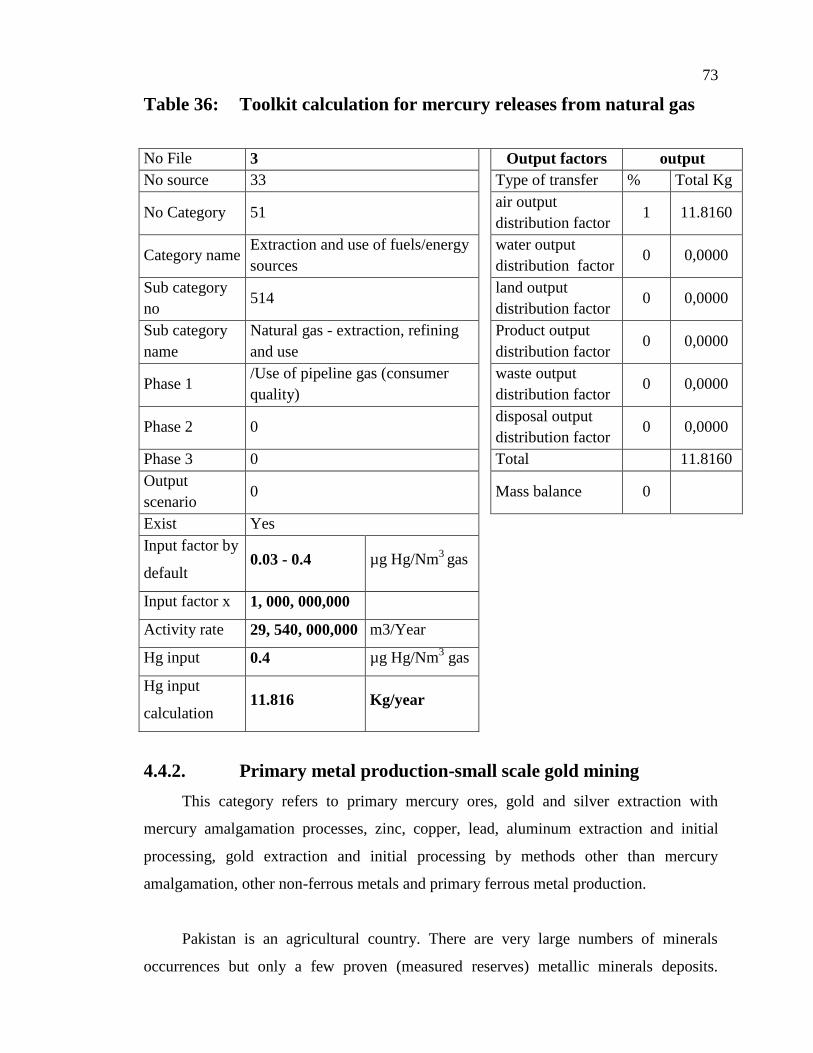
73
Table 36: Toolkit calculation for mercury releases from natural gas
4.4.2. Primary metal production-small scale gold mining
This category refers to primary mercury ores, gold and silver extraction with
mercury amalgamation processes, zinc, copper, lead, aluminum extraction and initial
processing, gold extraction and initial processing by methods other than mercury
amalgamation, other non-ferrous metals and primary ferrous metal production.
Pakistan is an agricultural country. There are very large numbers of minerals
occurrences but only a few proven (measured reserves) metallic minerals deposits.
No File 3
Output factors output
No source 33 Type of transfer % Total Kg
No Category 51 air output
distribution factor 1 11.8160
Category name Extraction and use of fuels/energy
sources
water output
distribution factor 0 0,0000
Sub category
no 514
land output
distribution factor 0 0,0000
Sub category
name
Natural gas - extraction, refining
and use
Product output
distribution factor 0 0,0000
Phase 1 /Use of pipeline gas (consumer
quality)
waste output
distribution factor 0 0,0000
Phase 2 0 disposal output
distribution factor 0 0,0000
Phase 3 0 Total 11.8160
Output
scenario 0 Mass balance 0
Exist Yes
Input factor by
default 0.03 - 0.4 µg Hg/Nm
3 gas
Input factor x 1, 000, 000,000
Activity rate 29, 540, 000,000 m3/Year
Hg input 0.4 µg Hg/Nm3 gas
Hg input
calculation 11.816 Kg/year
74
Chromite occurs in Khyber Pakhtoonkhawa and Baluchistan. Its production varies from
20,000 tons to 60,000 tons per year. So far, there is no primary mercury production in
Pakistan context .There are no production activities of other minerals and materials with
mercury impurities in Pakistan, except the production of lime and bricks. In this
perspective, some people use mercury amalgamation process for the extraction of placer
gold in some places along Indus River upstream of Tarbela Lake. There is no data available
for this sector.
4.4.3. Production of other minerals and materials with mercury
impurities
This category refers to production of cement, production of pulp and paper, and
production of lime and aggregates with light weight. All these products exist in Pakistan.
The cement production was estimated at 25 million tons during 2007-08.
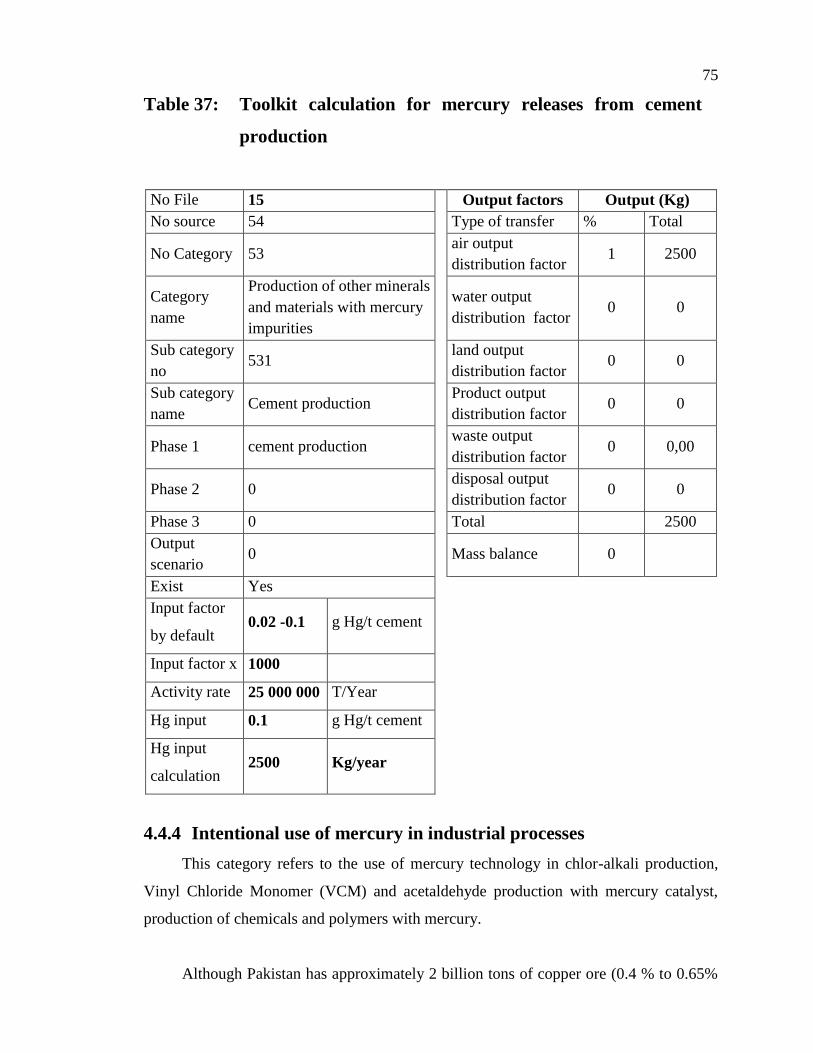
75
Table 37: Toolkit calculation for mercury releases from cement
production
No File 15
Output factors Output (Kg)
No source 54 Type of transfer % Total
No Category 53 air output
distribution factor 1 2500
Category
name
Production of other minerals
and materials with mercury
impurities
water output
distribution factor 0 0
Sub category
no 531
land output
distribution factor 0 0
Sub category
name Cement production
Product output
distribution factor 0 0
Phase 1 cement production waste output
distribution factor 0 0,00
Phase 2 0 disposal output
distribution factor 0 0
Phase 3 0 Total 2500
Output
scenario 0 Mass balance 0
Exist Yes
Input factor
by default 0.02 -0.1 g Hg/t cement
Input factor x 1000
Activity rate 25 000 000 T/Year
Hg input 0.1 g Hg/t cement
Hg input
calculation 2500 Kg/year
4.4.4 Intentional use of mercury in industrial processes
This category refers to the use of mercury technology in chlor-alkali production,
Vinyl Chloride Monomer (VCM) and acetaldehyde production with mercury catalyst,
production of chemicals and polymers with mercury.
Although Pakistan has approximately 2 billion tons of copper ore (0.4 % to 0.65%
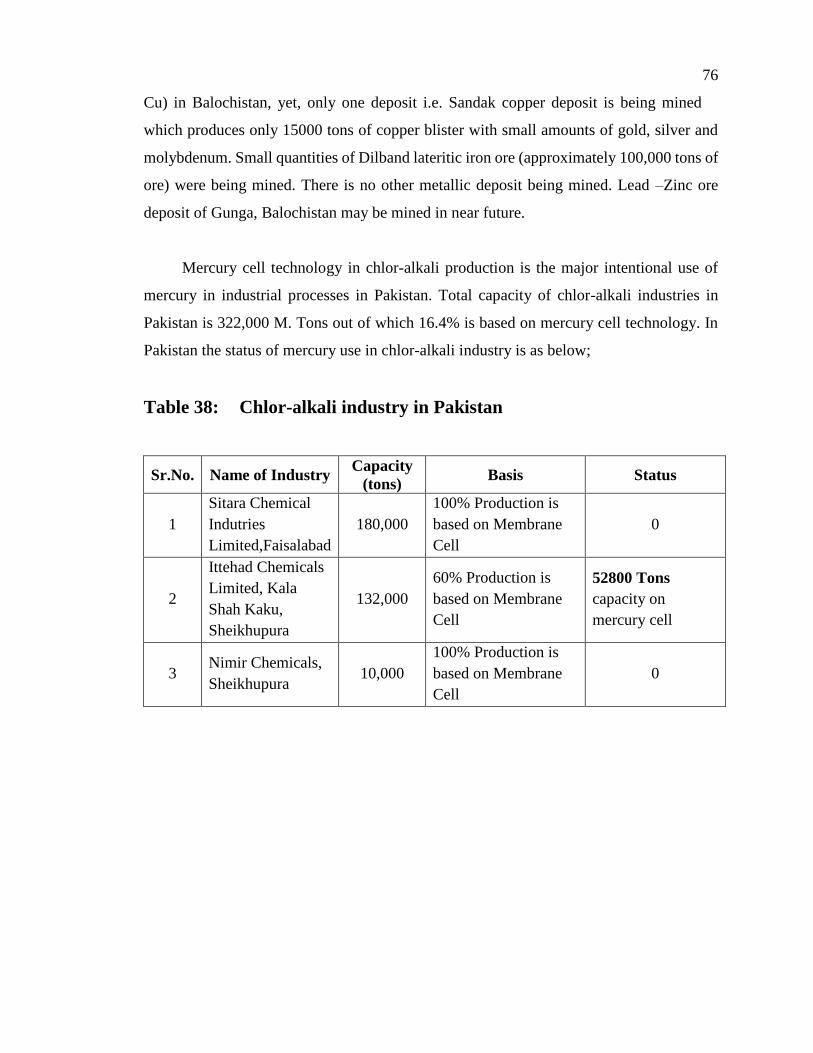
76
Cu) in Balochistan, yet, only one deposit i.e. Sandak copper deposit is being mined
which produces only 15000 tons of copper blister with small amounts of gold, silver and
molybdenum. Small quantities of Dilband lateritic iron ore (approximately 100,000 tons of
ore) were being mined. There is no other metallic deposit being mined. Lead –Zinc ore
deposit of Gunga, Balochistan may be mined in near future.
Mercury cell technology in chlor-alkali production is the major intentional use of
mercury in industrial processes in Pakistan. Total capacity of chlor-alkali industries in
Pakistan is 322,000 M. Tons out of which 16.4% is based on mercury cell technology. In
Pakistan the status of mercury use in chlor-alkali industry is as below;
Table 38: Chlor-alkali industry in Pakistan
Sr.No. Name of Industry Capacity
(tons) Basis Status
1
Sitara Chemical
Indutries
Limited,Faisalabad
180,000
100% Production is
based on Membrane
Cell
0
2
Ittehad Chemicals
Limited, Kala
Shah Kaku,
Sheikhupura
132,000
60% Production is
based on Membrane
Cell
52800 Tons
capacity on
mercury cell
3 Nimir Chemicals,
Sheikhupura 10,000
100% Production is
based on Membrane
Cell
0
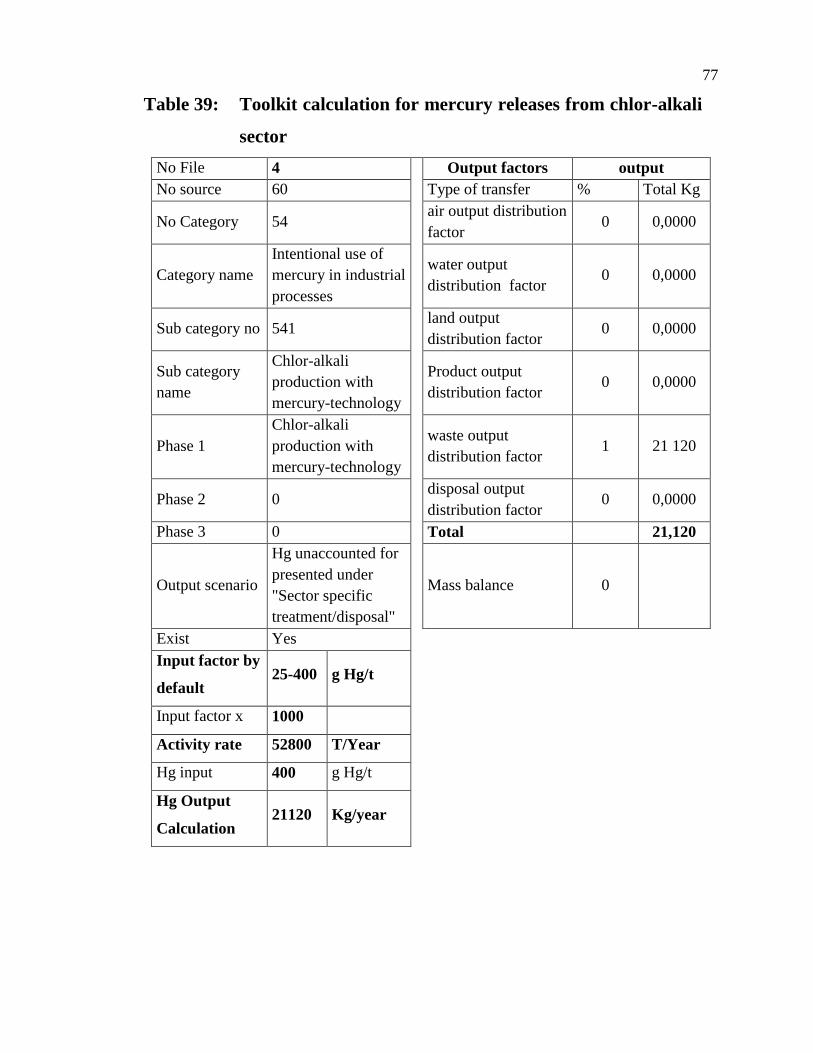
77
Table 39: Toolkit calculation for mercury releases from chlor-alkali
sector
No File 4
Output factors output
No source 60 Type of transfer % Total Kg
No Category 54 air output distribution
factor 0 0,0000
Category name
Intentional use of
mercury in industrial
processes
water output
distribution factor 0 0,0000
Sub category no 541 land output
distribution factor 0 0,0000
Sub category
name
Chlor-alkali
production with
mercury-technology
Product output
distribution factor 0 0,0000
Phase 1
Chlor-alkali
production with
mercury-technology
waste output
distribution factor 1 21 120
Phase 2 0 disposal output
distribution factor 0 0,0000
Phase 3 0 Total 21,120
Output scenario
Hg unaccounted for
presented under
"Sector specific
treatment/disposal"
Mass balance 0
Exist Yes
Input factor by
default 25-400 g Hg/t
Input factor x 1000
Activity rate 52800 T/Year
Hg input 400 g Hg/t
Hg Output
Calculation 21120 Kg/year
78
4.4.5 Consumer products with intentional use of mercury
The category refers to consumer products containing mercury including
thermometers with mercury, light sources with mercury, electrical switches and relays with
mercury, batteries with mercury, paints containing mercury, biocides and pesticides
containing mercury, cosmetics, pharmaceuticals for human and veterinary uses, and
related products with mercury.
So far, no inventory exists about the mercury being used in the above described
products except thermometers, light sources and batteries in Pakistan. Moreover, there is
no record of thermometers, light sources and batteries having been used and how many
thermometers, light sources and batteries have been distributed or disposed of within the
country. Based on history, it was understood that such mercury thermometers had been
used as medical thermometers, ambient air temperature thermometers in both industrial
equipment and chemical laboratories. Light sources had been used in compact fluorescent
lamps and batteries are being used to power electrical devices, i.e. radios, clocks, cameras
and toys throughout the country.
Besides information on thermometers, light sources and batteries containing
mercury, there is no information related to the quantity of other consumer products i.e.
electrical and electronic switches, paints, biocides and pesticides, cosmetics,
pharmaceuticals for human and veterinary purposes and related products imported into
Pakistan or having been disposed of neither on a yearly basis nor over a specific period of
time. So, the calculation of the releases of mercury from these types of products is not
available. However, the custom import data of thermometers, fluorescent tubes (double
end) and fluorescent lamps, alkaline, other than button cell shapes, mercury oxide (all
sizes) also called mercury-zinc cells were 310,365 Nos,5,613,181 Nos, 360,866 Nos,
1573 tons and 0.462 tons respectively during 2008.
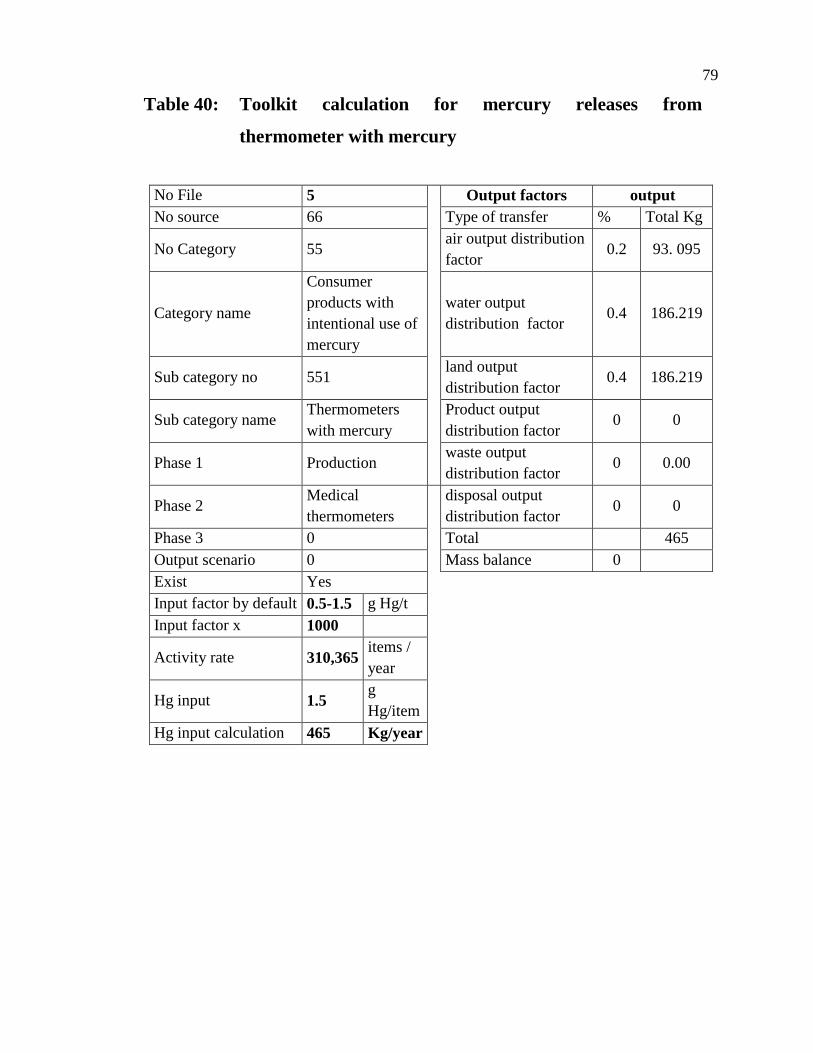
79
Table 40: Toolkit calculation for mercury releases from
thermometer with mercury
No File 5 Output factors output
No source 66 Type of transfer % Total Kg
No Category 55 air output distribution
factor 0.2 93. 095
Category name
Consumer
products with
intentional use of
mercury
water output
distribution factor 0.4 186.219
Sub category no 551 land output
distribution factor 0.4 186.219
Sub category name Thermometers
with mercury
Product output
distribution factor 0 0
Phase 1 Production waste output
distribution factor 0 0.00
Phase 2 Medical
thermometers
disposal output
distribution factor 0 0
Phase 3 0 Total 465
Output scenario 0 Mass balance 0
Exist Yes
Input factor by default 0.5-1.5 g Hg/t
Input factor x 1000
Activity rate 310,365 items /
year
Hg input 1.5 g
Hg/item
Hg input calculation 465 Kg/year
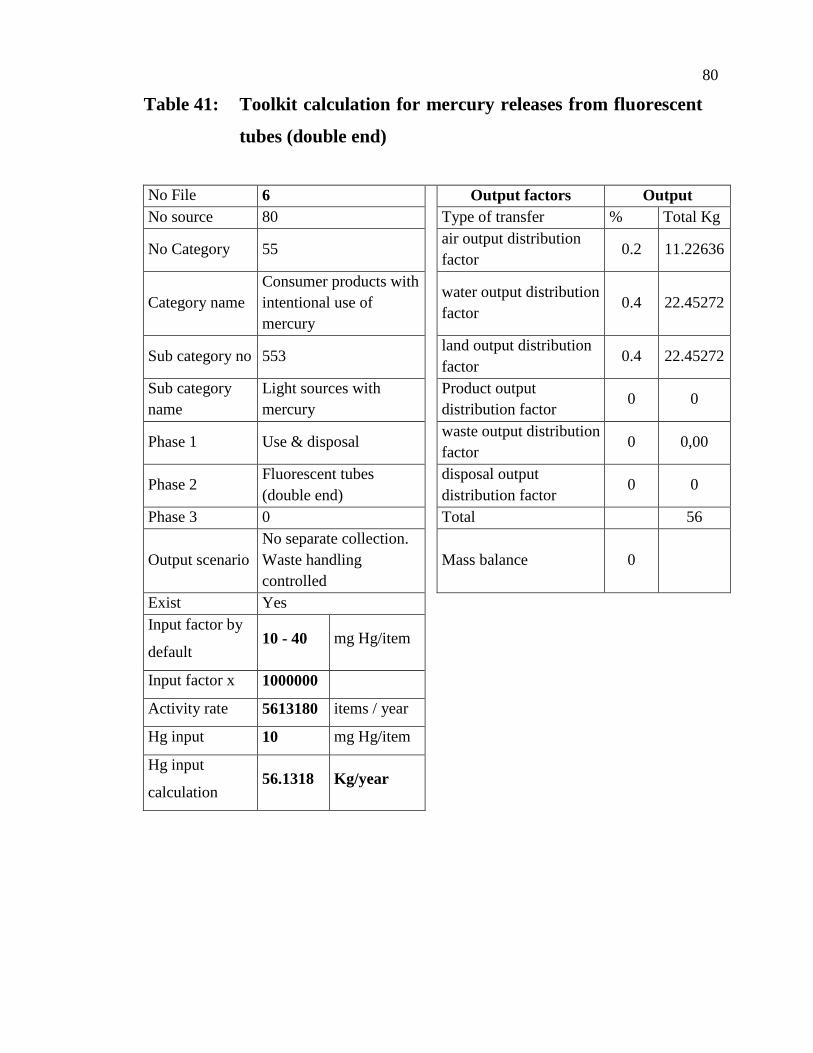
80
Table 41: Toolkit calculation for mercury releases from fluorescent
tubes (double end)
No File 6
Output factors Output
No source 80 Type of transfer % Total Kg
No Category 55 air output distribution
factor 0.2 11.22636
Category name
Consumer products with
intentional use of
mercury
water output distribution
factor 0.4 22.45272
Sub category no 553 land output distribution
factor 0.4 22.45272
Sub category
name
Light sources with
mercury
Product output
distribution factor 0 0
Phase 1 Use & disposal waste output distribution
factor 0 0,00
Phase 2 Fluorescent tubes
(double end)
disposal output
distribution factor 0 0
Phase 3 0 Total 56
Output scenario
No separate collection.
Waste handling
controlled
Mass balance 0
Exist Yes
Input factor by
default 10 - 40 mg Hg/item
Input factor x 1000000
Activity rate 5613180 items / year
Hg input 10 mg Hg/item
Hg input
calculation 56.1318 Kg/year
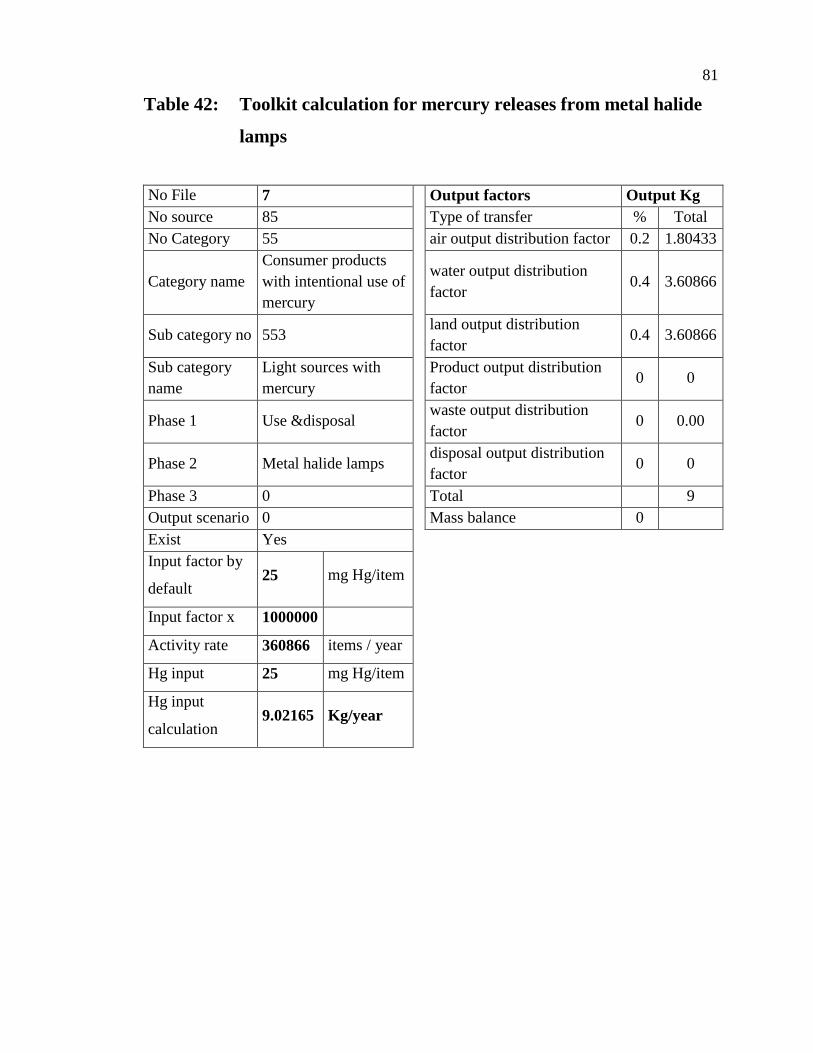
81
Table 42: Toolkit calculation for mercury releases from metal halide
lamps
No File 7
Output factors Output Kg
No source 85 Type of transfer % Total
No Category 55 air output distribution factor 0.2 1.80433
Category name
Consumer products
with intentional use of
mercury
water output distribution
factor 0.4 3.60866
Sub category no 553 land output distribution
factor 0.4 3.60866
Sub category
name
Light sources with
mercury
Product output distribution
factor 0 0
Phase 1 Use &disposal waste output distribution
factor 0 0.00
Phase 2 Metal halide lamps disposal output distribution
factor 0 0
Phase 3 0 Total 9
Output scenario 0 Mass balance 0
Exist Yes
Input factor by
default 25 mg Hg/item
Input factor x 1000000
Activity rate 360866 items / year
Hg input 25 mg Hg/item
Hg input
calculation 9.02165 Kg/year
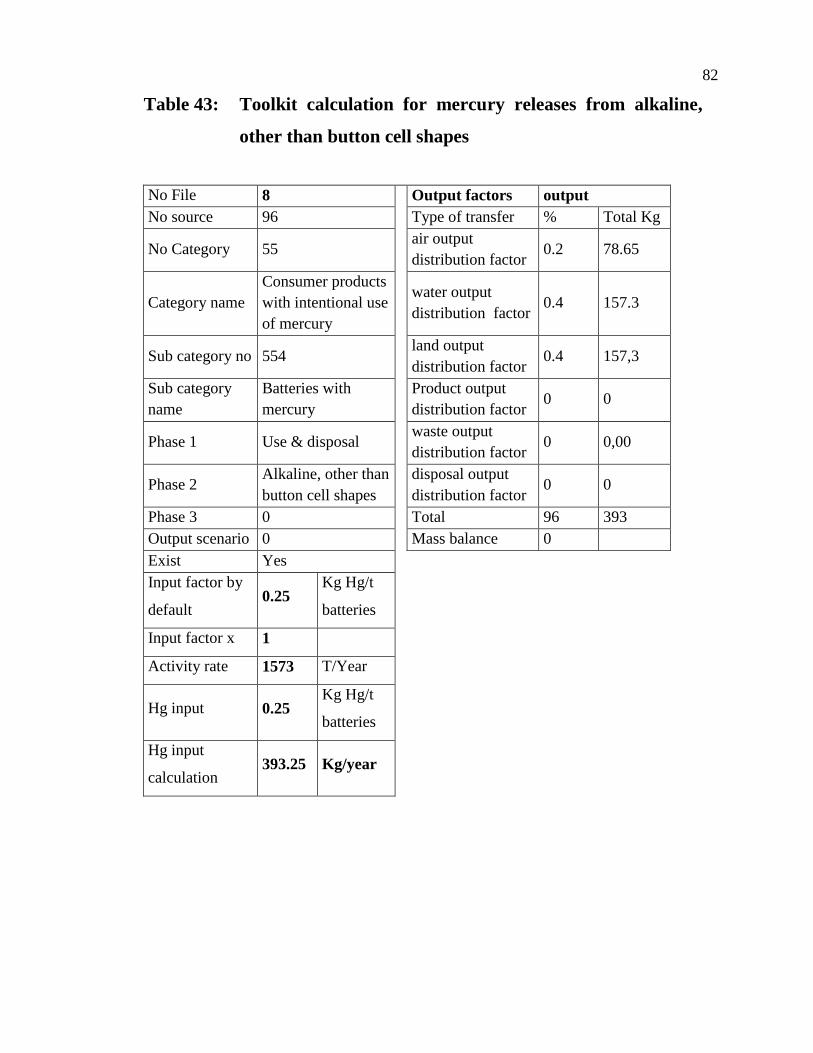
82
Table 43: Toolkit calculation for mercury releases from alkaline,
other than button cell shapes
No File 8
Output factors output
No source 96 Type of transfer % Total Kg
No Category 55 air output
distribution factor 0.2 78.65
Category name
Consumer products
with intentional use
of mercury
water output
distribution factor 0.4 157.3
Sub category no 554 land output
distribution factor 0.4 157,3
Sub category
name
Batteries with
mercury
Product output
distribution factor 0 0
Phase 1 Use & disposal waste output
distribution factor 0 0,00
Phase 2 Alkaline, other than
button cell shapes
disposal output
distribution factor 0 0
Phase 3 0 Total 96 393
Output scenario 0 Mass balance 0
Exist Yes
Input factor by
default 0.25
Kg Hg/t
batteries
Input factor x 1
Activity rate 1573 T/Year
Hg input 0.25 Kg Hg/t
batteries
Hg input
calculation 393.25 Kg/year
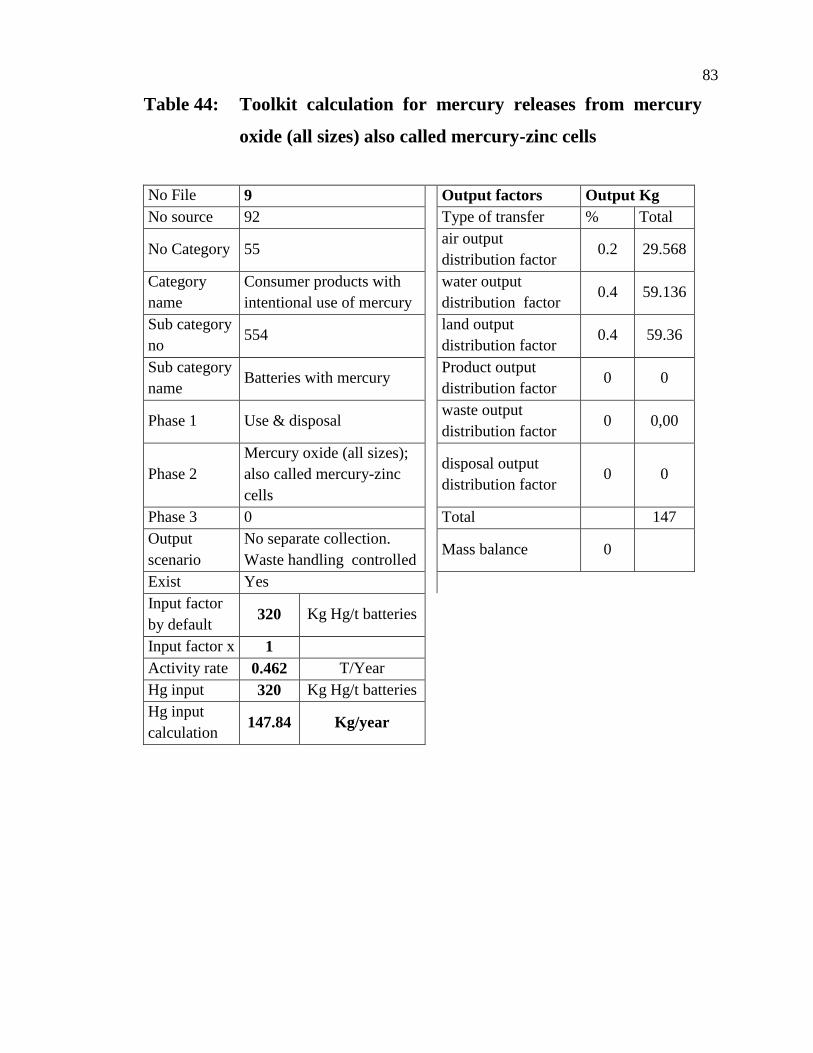
83
Table 44: Toolkit calculation for mercury releases from mercury
oxide (all sizes) also called mercury-zinc cells
No File 9
Output factors Output Kg
No source 92 Type of transfer % Total
No Category 55 air output
distribution factor 0.2 29.568
Category
name
Consumer products with
intentional use of mercury
water output
distribution factor 0.4 59.136
Sub category
no 554
land output
distribution factor 0.4 59.36
Sub category
name Batteries with mercury
Product output
distribution factor 0 0
Phase 1 Use & disposal waste output
distribution factor 0 0,00
Phase 2
Mercury oxide (all sizes);
also called mercury-zinc
cells
disposal output
distribution factor 0 0
Phase 3 0 Total 147
Output
scenario
No separate collection.
Waste handling controlled Mass balance 0
Exist Yes
Input factor
by default 320 Kg Hg/t batteries
Input factor x 1
Activity rate 0.462 T/Year
Hg input 320 Kg Hg/t batteries
Hg input
calculation 147.84 Kg/year
84
4.4.6 Other intentional products/process uses
This category is referring to various products including amalgam fillings,
manometers and gauges, laboratory chemicals and equipment, and others. In Pakistan
context, mercury metal use in religious rituals does not exist. Beside this, for mercury use
in manometers and gauges, laboratory chemicals and equipment, we have no information
and data, either on the origin and quantity imported, or where supplied. Nevertheless, it is
known that such products have been used in health care (manometers and gauges) and
laboratories. However, the custom import data of elemental mercury for dental amalgam
was 5779 Kg during 2008.
4.4.6.1 Source description
Mercury may be released to water, air and wastes during the utilization and disposal
of amalgam fillings mainly at the time of insertion of fillings and the teeth removal
containing fillings. The release of mercury may also be happen after the death of a person
with fillings, e.g. dental amalgams.
In Pakistan the year when the dental clinics using mercury amalgams started
operating remains unknown. Most of the dental clinics are operated by private sector and
only a few by public sector. Most dental clinics have from one to four chairs in operation
and other few dental clinics may have up to 10 chairs.
There are several types of tooth filling materials in use in Pakistan including
amalgam, composite, glass ionomer cement, poly carboxylate cement, and ceramic.
Pakistani people who go to dental clinics prefer to use composite for filling their tooth
rather than amalgam.
According to dentists report, it is known that amalgam is usually supplied in two
forms either (1) mercury as pure form with a powder mix of the other metals, which mixed
in the clinic after weighing; or (2) as small capsules possessing mercury metal and the
metal powder in the right proportions and only required to be mixed in the clinic, before
filling the cavity in the tooth.
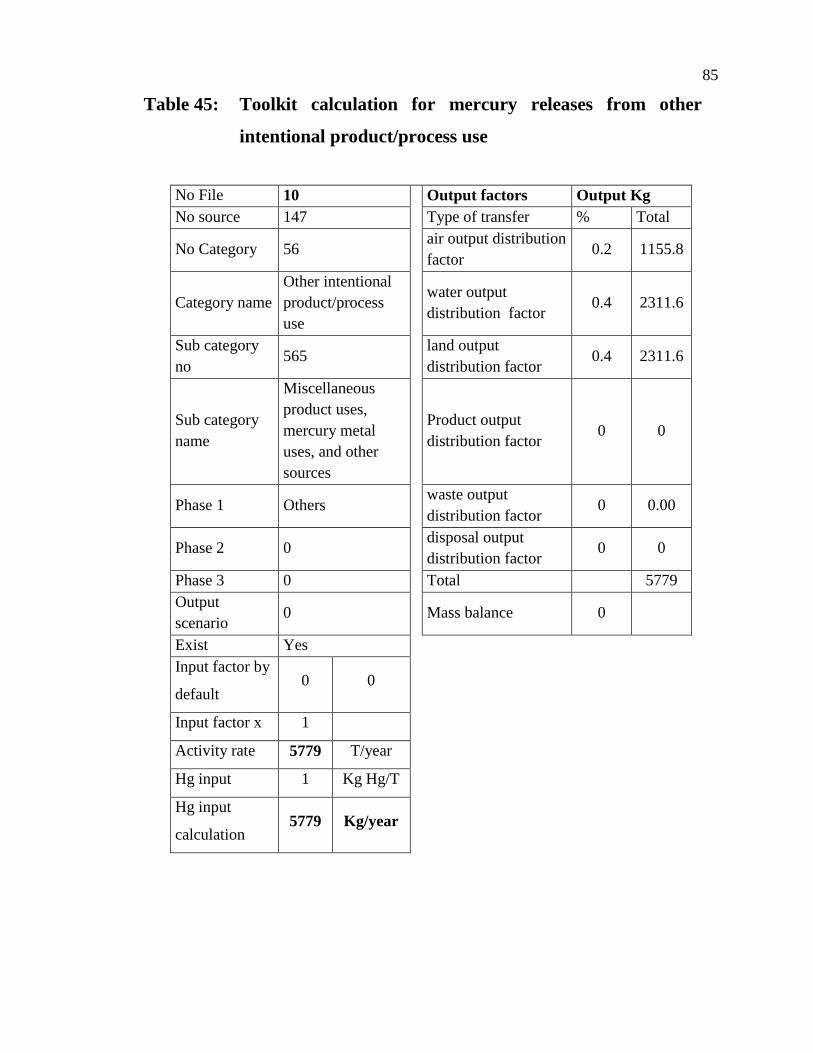
85
Table 45: Toolkit calculation for mercury releases from other
intentional product/process use
No File 10
Output factors Output Kg
No source 147 Type of transfer % Total
No Category 56 air output distribution
factor 0.2 1155.8
Category name
Other intentional
product/process
use
water output
distribution factor 0.4 2311.6
Sub category
no 565
land output
distribution factor 0.4 2311.6
Sub category
name
Miscellaneous
product uses,
mercury metal
uses, and other
sources
Product output
distribution factor 0 0
Phase 1 Others waste output
distribution factor 0 0.00
Phase 2 0 disposal output
distribution factor 0 0
Phase 3 0 Total 5779
Output
scenario 0 Mass balance 0
Exist Yes
Input factor by
default 0 0
Input factor x 1
Activity rate 5779 T/year
Hg input 1 Kg Hg/T
Hg input
calculation 5779 Kg/year
86
4.4.7 Production of recycled metals (secondary metal production)
This group indicates the mercury release from the production of recycled metals
regarded as secondary metal production. There are three types of sub-categories considered
in this sector including (1) production of recycled mercury, (2) production of recycled
ferrous metal (iron and steel) and (3) production of other recycled metals. In Pakistan, the
secondary metal production is carried out only for scraped iron, aluminum, copper and
lead.
4.4.8 Waste incineration
This category refers to any waste that is fed to incinerators regardless of installation
of air pollution control system. As indicated in the UNEP’s Toolkit, there are five types of
waste incineration sub-categories addressed including, incineration of municipal, wastes,
incineration of medical waste, incineration of hazardous waste, incineration of sewage
sludge and burning (informal incineration) of waste. In this regards and based on Pakistan
context, the waste incineration in Pakistan can be addressed only to one type i.e. medical
waste incineration. In Pakistan the total quantity of medical waste incinerated is 4118 tons
per year. The detail is given below;
About 1000 tons medical waste is incinerated per year in Karachi (Sindh EPA).
Total quantity of medical waste incinerated in Quetta city is 730 tons per year (EPA
Balochistan). Total quantity of incineration of medical waste per year in Peshawar city is
1314 tons per year (EPA, NWFP). Total quantity of medical waste incinerated per year in
Punjab (EPD, Punjab) is given below;
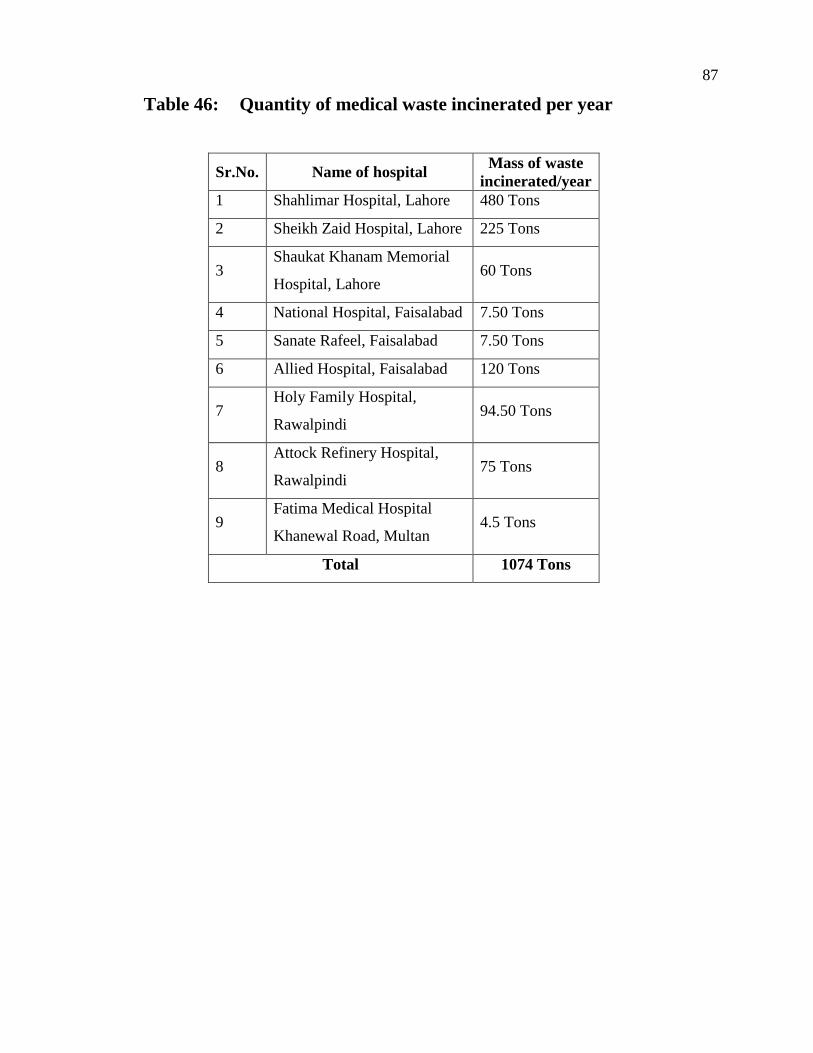
87
Table 46: Quantity of medical waste incinerated per year
Sr.No. Name of hospital Mass of waste
incinerated/year
1 Shahlimar Hospital, Lahore 480 Tons
2 Sheikh Zaid Hospital, Lahore 225 Tons
3 Shaukat Khanam Memorial
Hospital, Lahore 60 Tons
4 National Hospital, Faisalabad 7.50 Tons
5 Sanate Rafeel, Faisalabad 7.50 Tons
6 Allied Hospital, Faisalabad 120 Tons
7 Holy Family Hospital,
Rawalpindi 94.50 Tons
8 Attock Refinery Hospital,
Rawalpindi 75 Tons
9 Fatima Medical Hospital
Khanewal Road, Multan 4.5 Tons
Total 1074 Tons
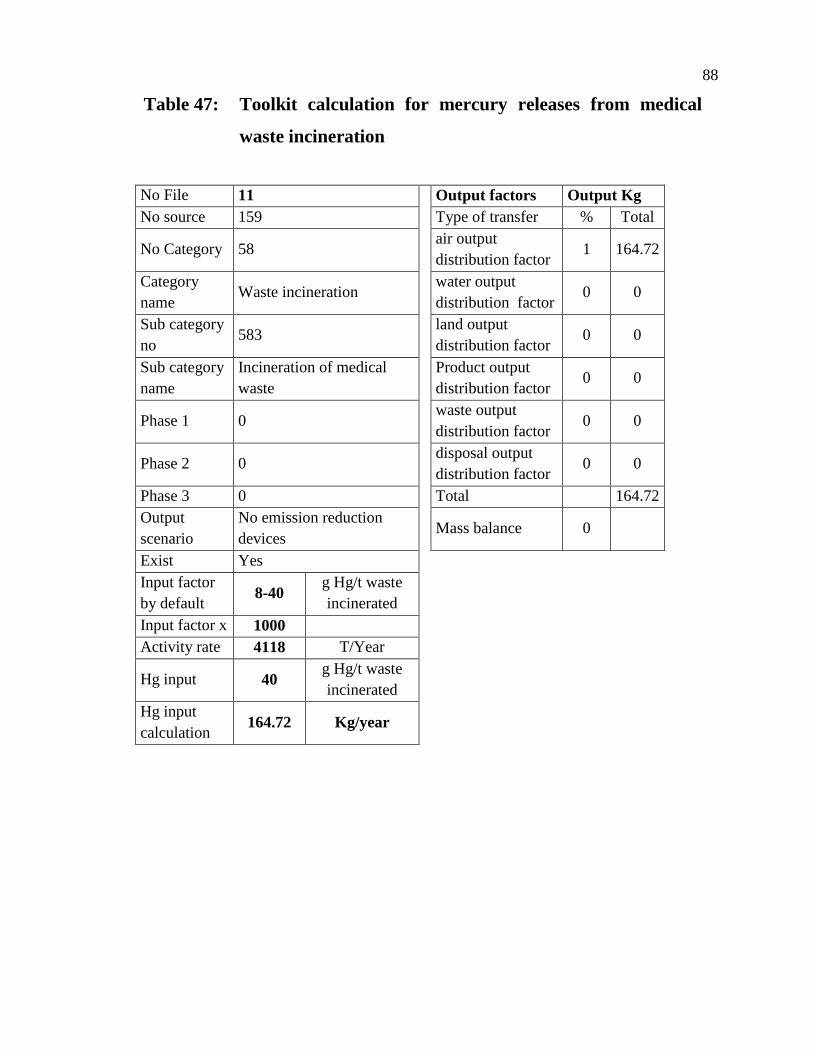
88
Table 47: Toolkit calculation for mercury releases from medical
waste incineration
No File 11
Output factors Output Kg
No source 159 Type of transfer % Total
No Category 58 air output
distribution factor 1 164.72
Category
name Waste incineration
water output
distribution factor 0 0
Sub category
no 583
land output
distribution factor 0 0
Sub category
name
Incineration of medical
waste
Product output
distribution factor 0 0
Phase 1 0 waste output
distribution factor 0 0
Phase 2 0 disposal output
distribution factor 0 0
Phase 3 0 Total 164.72
Output
scenario
No emission reduction
devices Mass balance 0
Exist Yes
Input factor
by default 8-40
g Hg/t waste
incinerated
Input factor x 1000
Activity rate 4118 T/Year
Hg input 40 g Hg/t waste
incinerated
Hg input
calculation 164.72 Kg/year
89
4.4.9 Waste deposition/land filling and waste water treatment
This category refers to any waste that is sent for disposal to landfills or backyards.
As indicated in the UNEP’s Toolkit, there are five types of waste deposition and waste
water treatment sub-categories addressed including, controlled landfills/deposit, diffuse
deposition under some control, informal local disposal of industrial production waste,
informal dumping of general waste, and waste water treatment. In this regards and based
on Pakistan context, the waste disposal in Pakistan can be discussed in three types: (1)
controlled landfills; (2) informal waste disposal and (3) waste water treatment .The detail
of these three types in Pakistan is given below;
4.4.9.1. Controlled landfills sites
There are two controlled landfills sites in Karachi. Each one has an area of about
500 acres. One site is located at Jam Chakro, Sirjani, North Karachi and the other site at
Gondal Pass, Hub River road, Karachi. There is one controlled landfill site of 14 acre at
Kasur Tannery Waste Management Agency (KTWMA), Kasur. Total quantity of wastes in
controlled land filling in the country was 1,900,000 tons per year.
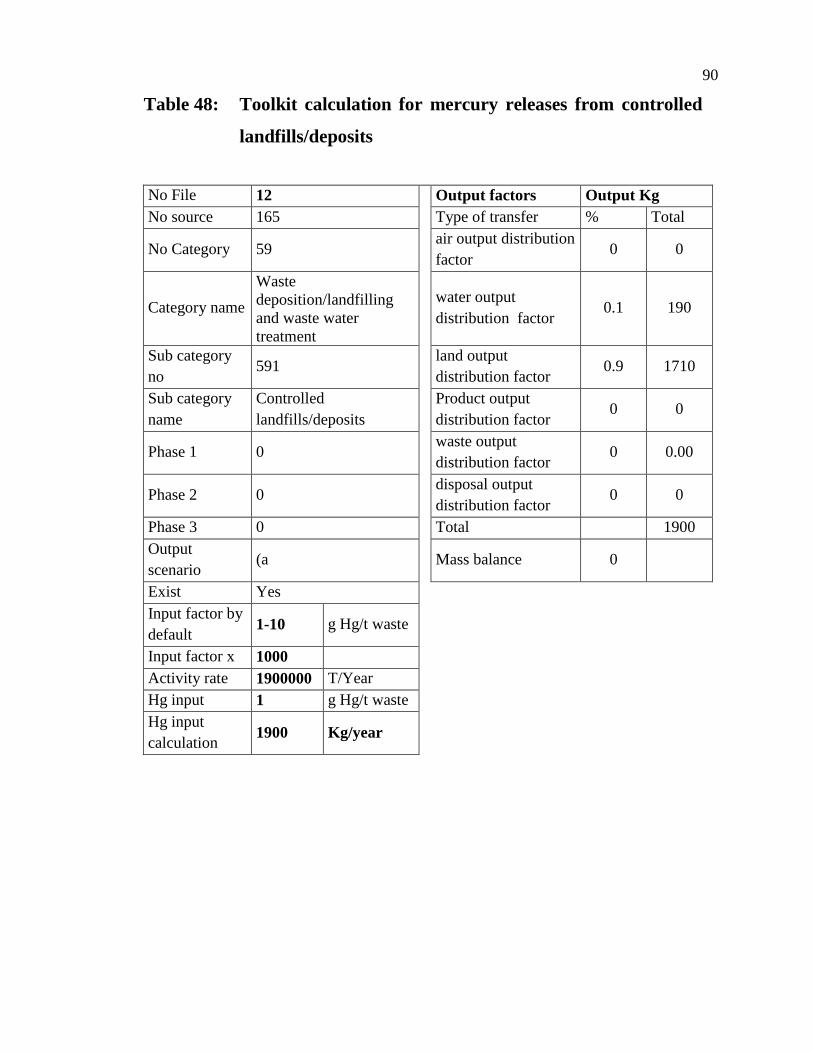
90
Table 48: Toolkit calculation for mercury releases from controlled
landfills/deposits
No File 12
Output factors Output Kg
No source 165 Type of transfer % Total
No Category 59 air output distribution
factor 0 0
Category name
Waste
deposition/landfilling
and waste water
treatment
water output
distribution factor 0.1 190
Sub category
no 591
land output
distribution factor 0.9 1710
Sub category
name
Controlled
landfills/deposits
Product output
distribution factor 0 0
Phase 1 0 waste output
distribution factor 0 0.00
Phase 2 0 disposal output
distribution factor 0 0
Phase 3 0 Total 1900
Output
scenario (a Mass balance 0
Exist Yes
Input factor by
default 1-10 g Hg/t waste
Input factor x 1000
Activity rate 1900000 T/Year
Hg input 1 g Hg/t waste
Hg input
calculation 1900 Kg/year
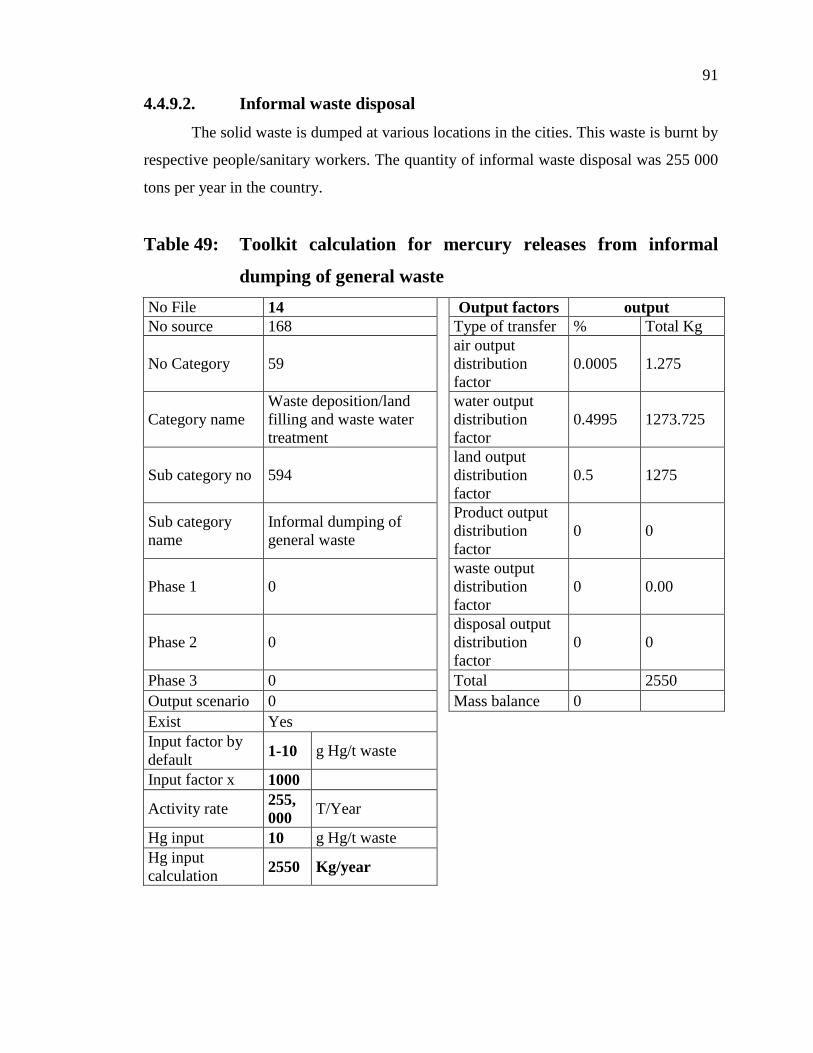
91
4.4.9.2. Informal waste disposal
The solid waste is dumped at various locations in the cities. This waste is burnt by
respective people/sanitary workers. The quantity of informal waste disposal was 255 000
tons per year in the country.
Table 49: Toolkit calculation for mercury releases from informal
dumping of general waste
No File 14
Output factors output
No source 168 Type of transfer % Total Kg
No Category 59
air output
distribution
factor
0.0005 1.275
Category name
Waste deposition/land
filling and waste water
treatment
water output
distribution
factor
0.4995 1273.725
Sub category no 594
land output
distribution
factor
0.5 1275
Sub category
name
Informal dumping of
general waste
Product output
distribution
factor
0 0
Phase 1 0
waste output
distribution
factor
0 0.00
Phase 2 0
disposal output
distribution
factor
0 0
Phase 3 0 Total 2550
Output scenario 0 Mass balance 0
Exist Yes
Input factor by
default 1-10 g Hg/t waste
Input factor x 1000
Activity rate 255,
000 T/Year
Hg input 10 g Hg/t waste
Hg input
calculation 2550 Kg/year
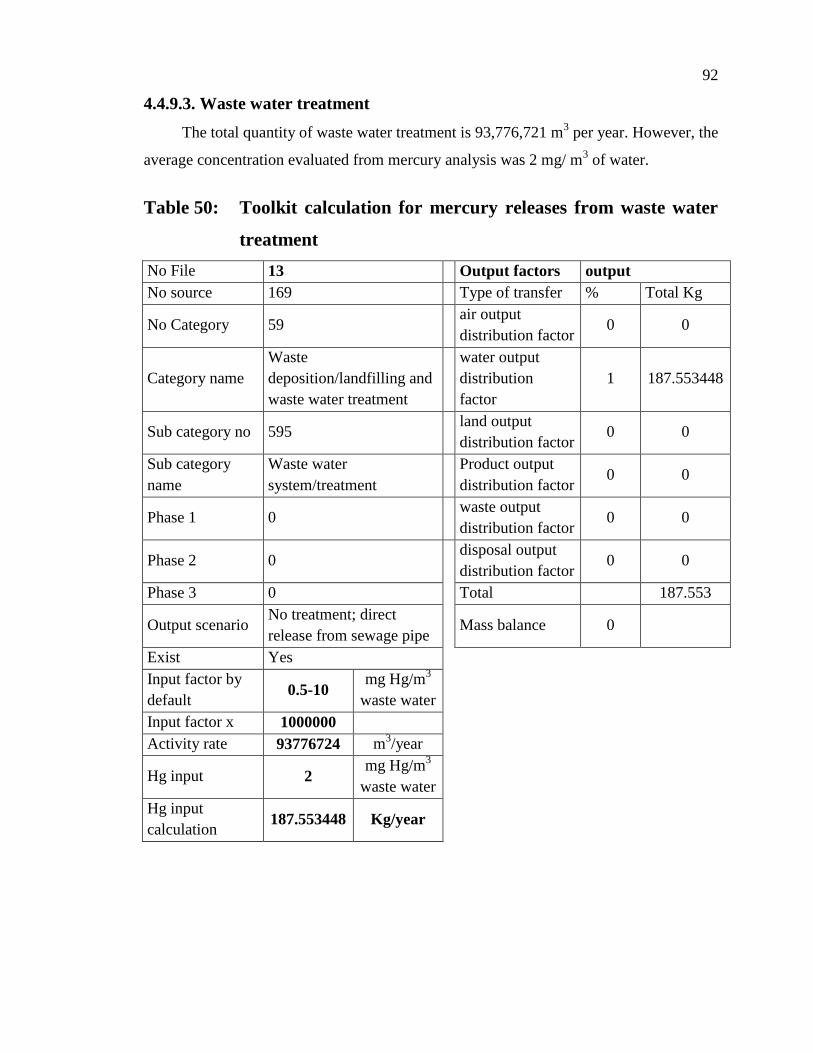
92
4.4.9.3. Waste water treatment
The total quantity of waste water treatment is 93,776,721 m3 per year. However, the
average concentration evaluated from mercury analysis was 2 mg/ m3 of water.
Table 50: Toolkit calculation for mercury releases from waste water
treatment
No File 13 Output factors output
No source 169 Type of transfer % Total Kg
No Category 59 air output
distribution factor 0 0
Category name
Waste
deposition/landfilling and
waste water treatment
water output
distribution
factor
1 187.553448
Sub category no 595 land output
distribution factor 0 0
Sub category
name
Waste water
system/treatment
Product output
distribution factor 0 0
Phase 1 0 waste output
distribution factor 0 0
Phase 2 0 disposal output
distribution factor 0 0
Phase 3 0 Total 187.553
Output scenario No treatment; direct
release from sewage pipe Mass balance 0
Exist Yes
Input factor by
default 0.5-10
mg Hg/m3
waste water
Input factor x 1000000
Activity rate 93776724 m3/year
Hg input 2 mg Hg/m
3
waste water
Hg input
calculation 187.553448 Kg/year
93
4.4.10 Crematoria and cemeteries
This category refers to crematoria and cemeteries. The practice of burning dead
bodies is not practiced in Pakistan.
4.4.11 Identification of potential hot-spots
The potential hot-spots of mercury release identified by the UNEP’s Toolkit refer
to post or abandoned sites of chemical production, pulp and paper manufacturing,
chlor-alkali production, etc. which are classified as follows:
Sites of closed/abandoned chlor-alkali production.
Other sites of production of former chemical where mercury compounds were
produced (pesticides, biocides, pigments etc.), or mercury/compounds as catalysts
were used (VCM/PVC etc.).
Sites of closed pulp and paper manufacturing (with internal chlor-alkali production
or former use of mercury-based slimicides).
Sites of closed production for manufacturing of switches, batteries, thermometers,
other products.
Deposits of tailings/residue from mercury mining.
Deposits of tailings/residue from other non-ferrous extraction of metal.
Deposits of tailings/residue from small and large scale mining of gold.
Dredging of sediments.
Sites of relevant accidents.
Sites of discarded district heating controls (and other fluid controls) where mercury
pressure valves are used.
In Pakistan, there are two abandoned chlor alkali plants with mercury cell
technology and can be considered as potential hot-spots of mercury release.
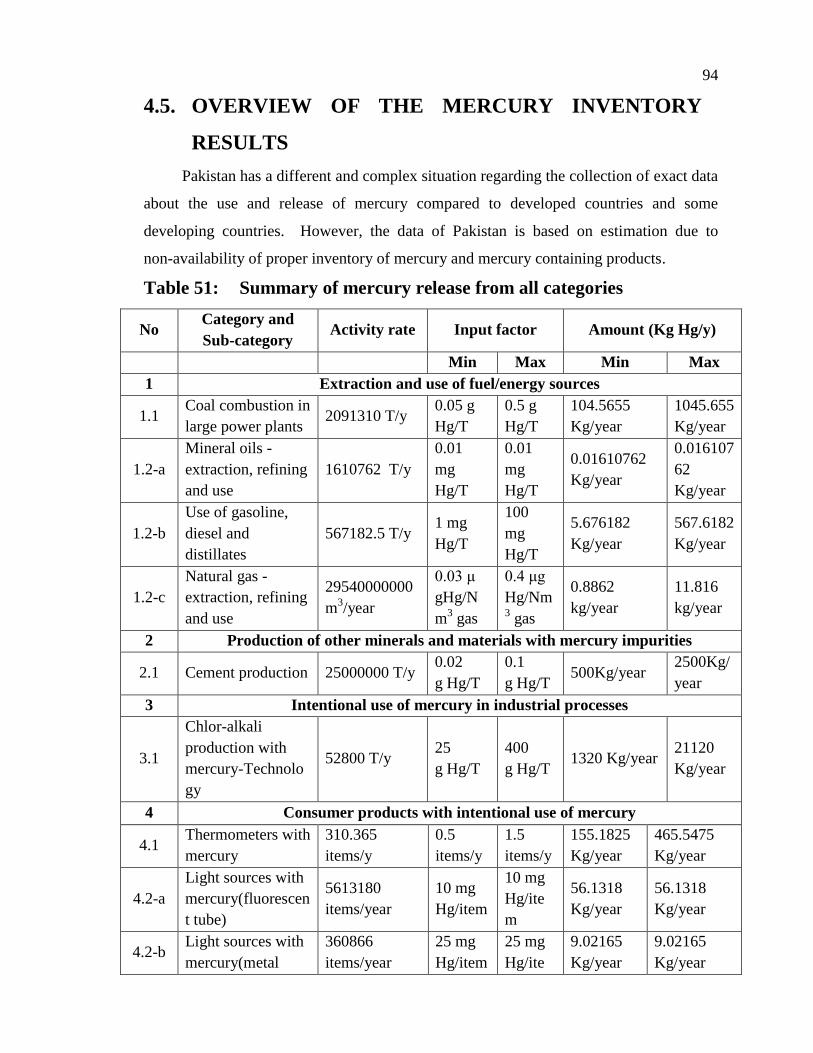
94
4.5. OVERVIEW OF THE MERCURY INVENTORY
RESULTS
Pakistan has a different and complex situation regarding the collection of exact data
about the use and release of mercury compared to developed countries and some
developing countries. However, the data of Pakistan is based on estimation due to
non-availability of proper inventory of mercury and mercury containing products.
Table 51: Summary of mercury release from all categories
No Category and
Sub-category Activity rate Input factor Amount (Kg Hg/y)
Min Max Min Max
1 Extraction and use of fuel/energy sources
1.1 Coal combustion in
large power plants 2091310 T/y
0.05 g
Hg/T
0.5 g
Hg/T
104.5655
Kg/year
1045.655
Kg/year
1.2-a
Mineral oils -
extraction, refining
and use
1610762 T/y
0.01
mg
Hg/T
0.01
mg
Hg/T
0.01610762
Kg/year
0.016107
62
Kg/year
1.2-b
Use of gasoline,
diesel and
distillates
567182.5 T/y 1 mg
Hg/T
100
mg
Hg/T
5.676182
Kg/year
567.6182
Kg/year
1.2-c
Natural gas -
extraction, refining
and use
29540000000
m3/year
0.03 μ
gHg/N
m3 gas
0.4 μg
Hg/Nm3 gas
0.8862
kg/year
11.816
kg/year
2 Production of other minerals and materials with mercury impurities
2.1 Cement production 25000000 T/y 0.02
g Hg/T
0.1
g Hg/T 500Kg/year
2500Kg/
year
3 Intentional use of mercury in industrial processes
3.1
Chlor-alkali
production with
mercury-Technolo
gy
52800 T/y 25
g Hg/T
400
g Hg/T 1320 Kg/year
21120
Kg/year
4 Consumer products with intentional use of mercury
4.1 Thermometers with
mercury
310.365
items/y
0.5
items/y
1.5
items/y
155.1825
Kg/year
465.5475
Kg/year
4.2-a
Light sources with
mercury(fluorescen
t tube)
5613180
items/year
10 mg
Hg/item
10 mg
Hg/ite
m
56.1318
Kg/year
56.1318
Kg/year
4.2-b Light sources with
mercury(metal
360866
items/year
25 mg
Hg/item
25 mg
Hg/ite
9.02165
Kg/year
9.02165
Kg/year
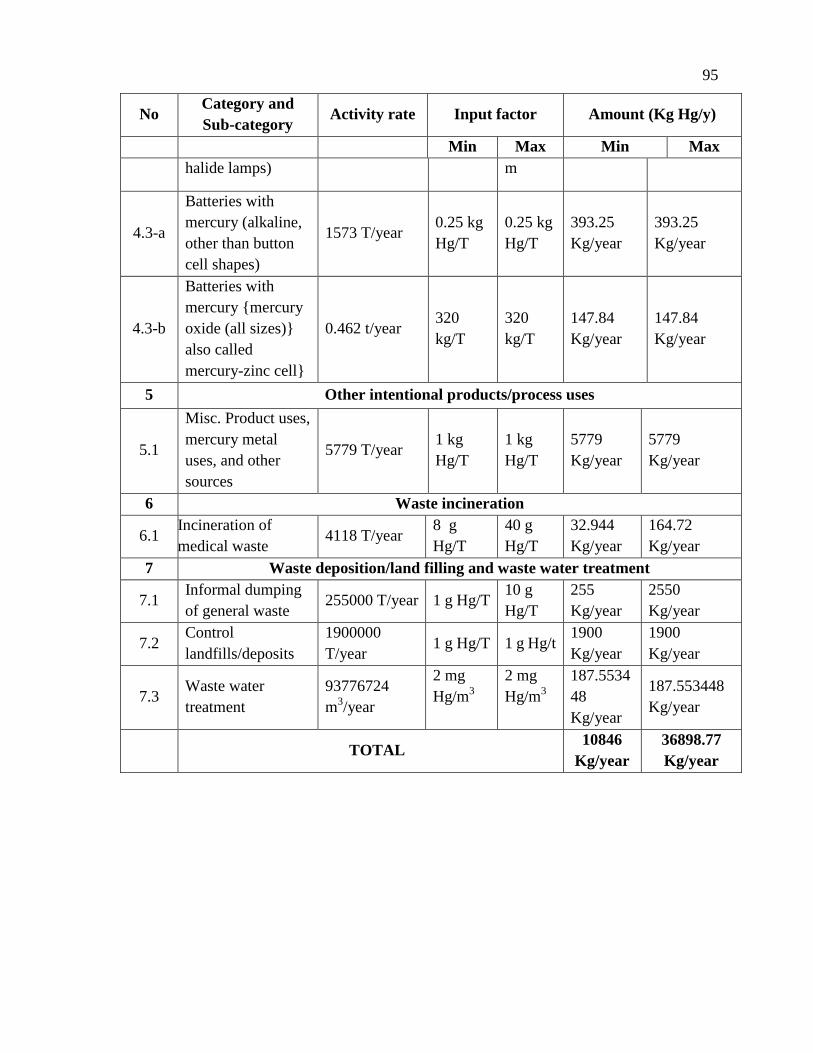
95
No Category and
Sub-category Activity rate Input factor Amount (Kg Hg/y)
Min Max Min Max
halide lamps) m
4.3-a
Batteries with
mercury (alkaline,
other than button
cell shapes)
1573 T/year 0.25 kg
Hg/T
0.25 kg
Hg/T
393.25
Kg/year
393.25
Kg/year
4.3-b
Batteries with
mercury {mercury
oxide (all sizes)}
also called
mercury-zinc cell}
0.462 t/year 320
kg/T
320
kg/T
147.84
Kg/year
147.84
Kg/year
5 Other intentional products/process uses
5.1
Misc. Product uses,
mercury metal
uses, and other
sources
5779 T/year 1 kg
Hg/T
1 kg
Hg/T
5779
Kg/year
5779
Kg/year
6 Waste incineration
6.1 Incineration of
medical waste 4118 T/year
8 g
Hg/T
40 g
Hg/T
32.944
Kg/year
164.72
Kg/year
7 Waste deposition/land filling and waste water treatment
7.1 Informal dumping
of general waste 255000 T/year 1 g Hg/T
10 g
Hg/T
255
Kg/year
2550
Kg/year
7.2 Control
landfills/deposits
1900000
T/year 1 g Hg/T 1 g Hg/t
1900
Kg/year
1900
Kg/year
7.3 Waste water
treatment
93776724
m3/year
2 mg
Hg/m3
2 mg
Hg/m3
187.5534
48
Kg/year
187.553448
Kg/year
TOTAL 10846
Kg/year
36898.77
Kg/year
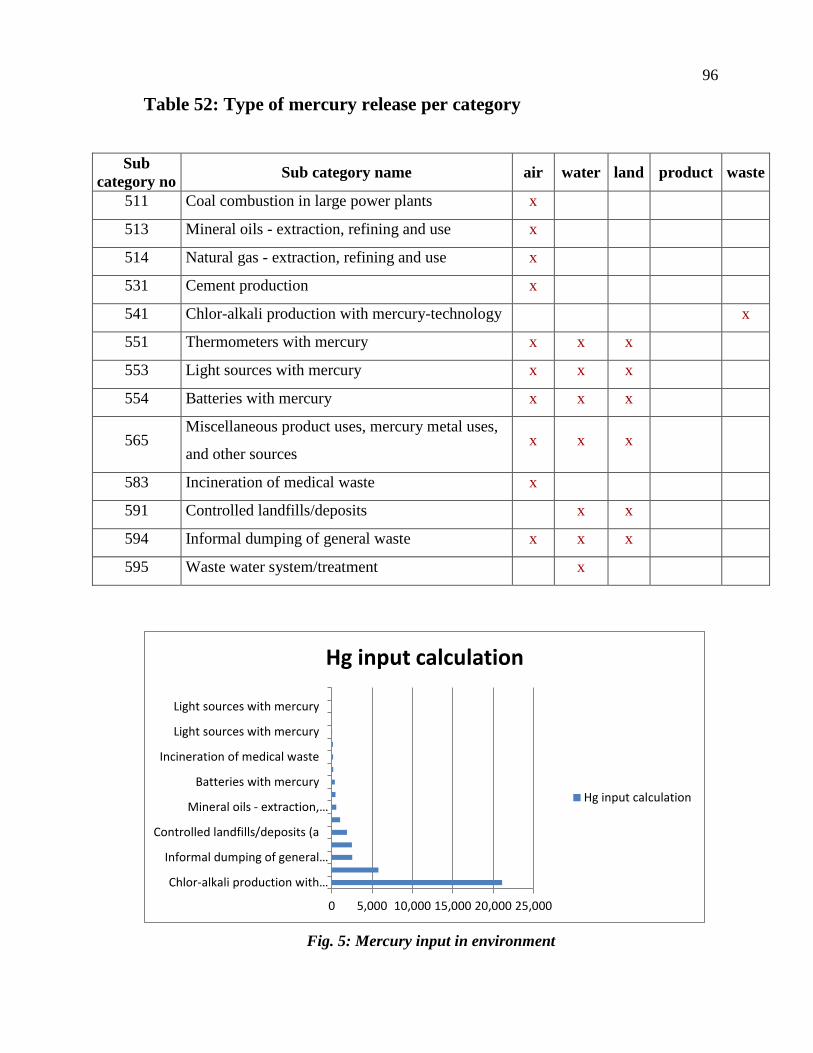
96
Table 52: Type of mercury release per category
Sub
category no Sub category name air water land product waste
511 Coal combustion in large power plants x
513 Mineral oils - extraction, refining and use x
514 Natural gas - extraction, refining and use x
531 Cement production x
541 Chlor-alkali production with mercury-technology x
551 Thermometers with mercury x x x
553 Light sources with mercury x x x
554 Batteries with mercury x x x
565 Miscellaneous product uses, mercury metal uses,
and other sources x x x
583 Incineration of medical waste x
591 Controlled landfills/deposits x x
594 Informal dumping of general waste x x x
595 Waste water system/treatment x
Fig. 5: Mercury input in environment
0 5,000 10,000 15,000 20,000 25,000
Chlor-alkali production with…
Informal dumping of general…
Controlled landfills/deposits (a
Mineral oils - extraction,…
Batteries with mercury
Incineration of medical waste
Light sources with mercury
Light sources with mercury
Hg input calculation
Hg input calculation
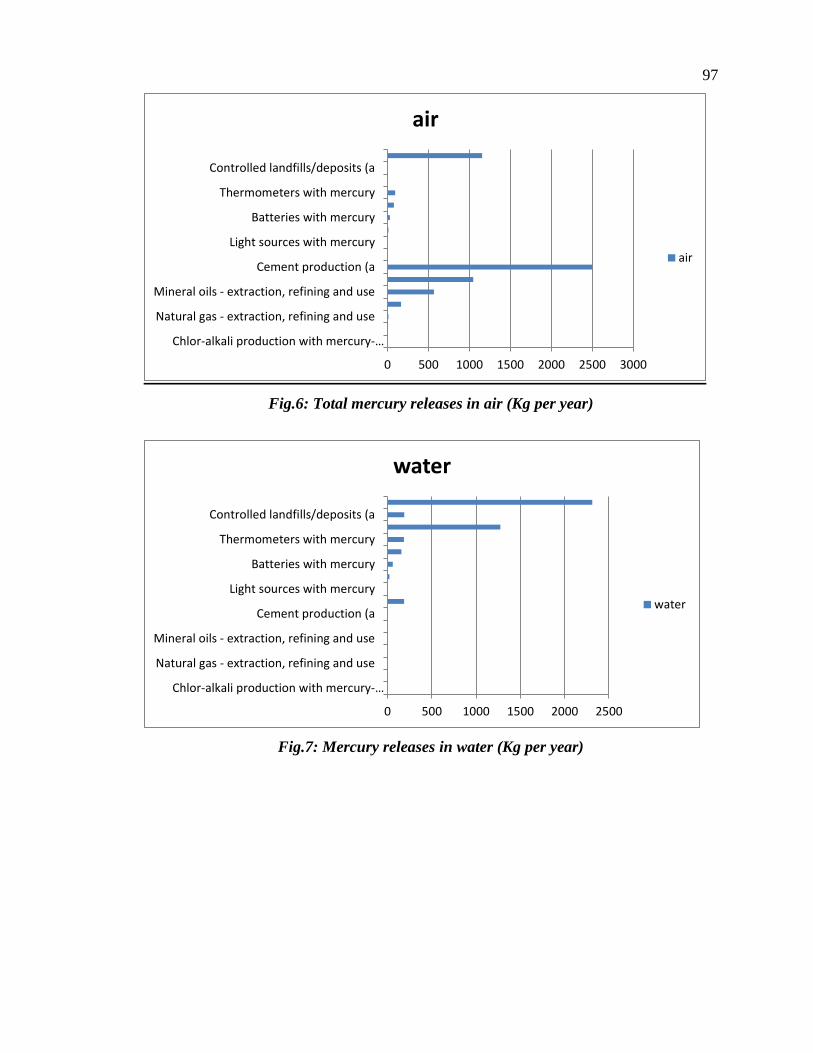
97
Fig.6: Total mercury releases in air (Kg per year)
Fig.7: Mercury releases in water (Kg per year)
0 500 1000 1500 2000 2500 3000
Chlor-alkali production with mercury-…
Natural gas - extraction, refining and use
Mineral oils - extraction, refining and use
Cement production (a
Light sources with mercury
Batteries with mercury
Thermometers with mercury
Controlled landfills/deposits (a
air
air
0 500 1000 1500 2000 2500
Chlor-alkali production with mercury-…
Natural gas - extraction, refining and use
Mineral oils - extraction, refining and use
Cement production (a
Light sources with mercury
Batteries with mercury
Thermometers with mercury
Controlled landfills/deposits (a
water
water
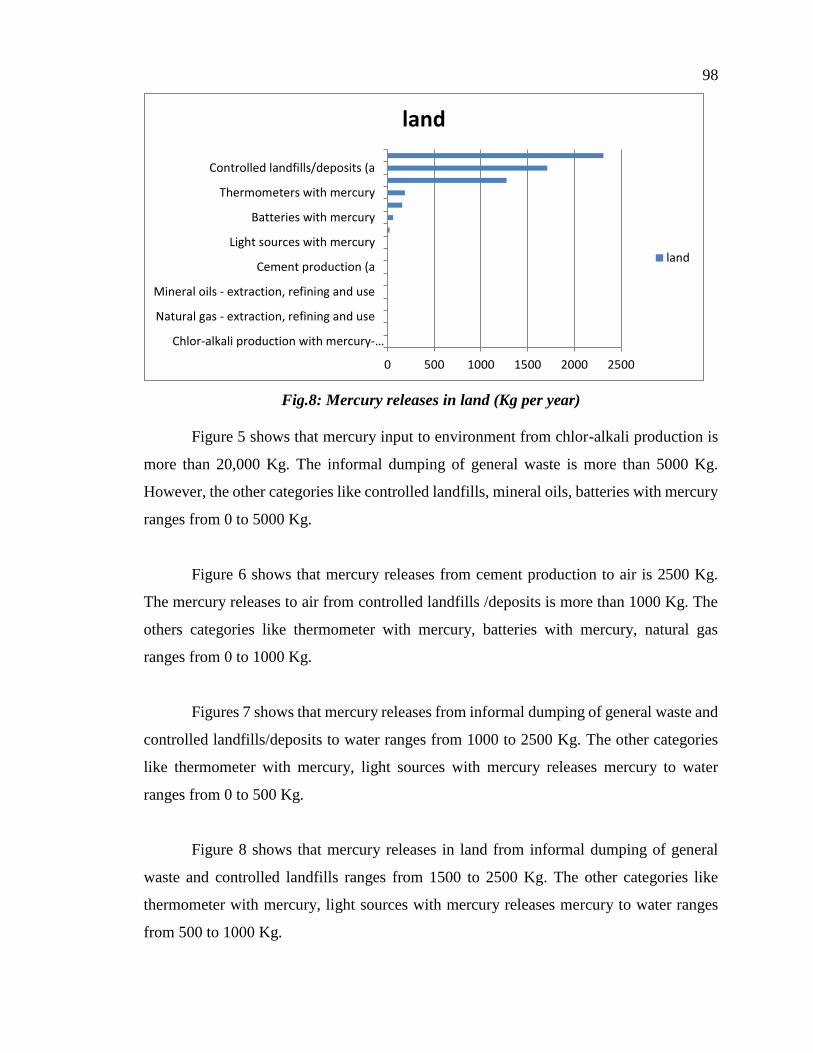
98
Fig.8: Mercury releases in land (Kg per year)
Figure 5 shows that mercury input to environment from chlor-alkali production is
more than 20,000 Kg. The informal dumping of general waste is more than 5000 Kg.
However, the other categories like controlled landfills, mineral oils, batteries with mercury
ranges from 0 to 5000 Kg.
Figure 6 shows that mercury releases from cement production to air is 2500 Kg.
The mercury releases to air from controlled landfills /deposits is more than 1000 Kg. The
others categories like thermometer with mercury, batteries with mercury, natural gas
ranges from 0 to 1000 Kg.
Figures 7 shows that mercury releases from informal dumping of general waste and
controlled landfills/deposits to water ranges from 1000 to 2500 Kg. The other categories
like thermometer with mercury, light sources with mercury releases mercury to water
ranges from 0 to 500 Kg.
Figure 8 shows that mercury releases in land from informal dumping of general
waste and controlled landfills ranges from 1500 to 2500 Kg. The other categories like
thermometer with mercury, light sources with mercury releases mercury to water ranges
from 500 to 1000 Kg.
0 500 1000 1500 2000 2500
Chlor-alkali production with mercury-…
Natural gas - extraction, refining and use
Mineral oils - extraction, refining and use
Cement production (a
Light sources with mercury
Batteries with mercury
Thermometers with mercury
Controlled landfills/deposits (a
land
land
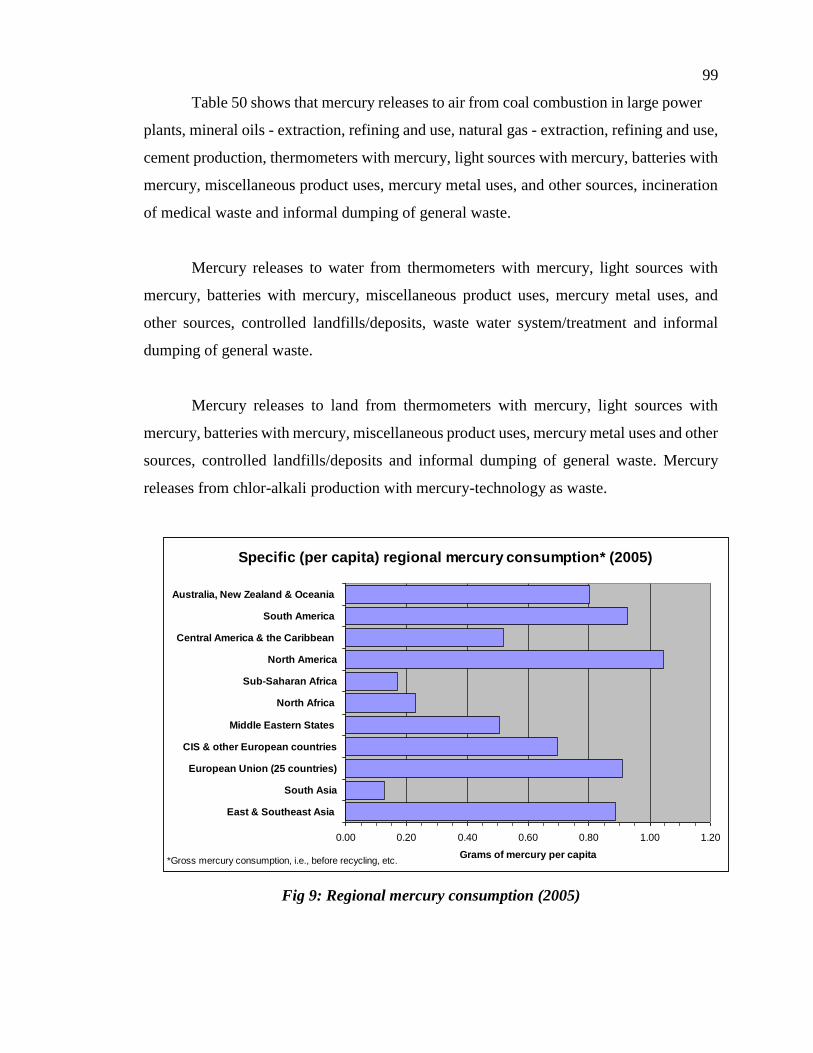
99
Table 50 shows that mercury releases to air from coal combustion in large power
plants, mineral oils - extraction, refining and use, natural gas - extraction, refining and use,
cement production, thermometers with mercury, light sources with mercury, batteries with
mercury, miscellaneous product uses, mercury metal uses, and other sources, incineration
of medical waste and informal dumping of general waste.
Mercury releases to water from thermometers with mercury, light sources with
mercury, batteries with mercury, miscellaneous product uses, mercury metal uses, and
other sources, controlled landfills/deposits, waste water system/treatment and informal
dumping of general waste.
Mercury releases to land from thermometers with mercury, light sources with
mercury, batteries with mercury, miscellaneous product uses, mercury metal uses and other
sources, controlled landfills/deposits and informal dumping of general waste. Mercury
releases from chlor-alkali production with mercury-technology as waste.
Fig 9: Regional mercury consumption (2005)
Specific (per capita) regional mercury consumption* (2005)
0.00 0.20 0.40 0.60 0.80 1.00 1.20
East & Southeast Asia
South Asia
European Union (25 countries)
CIS & other European countries
Middle Eastern States
North Africa
Sub-Saharan Africa
North America
Central America & the Caribbean
South America
Australia, New Zealand & Oceania
Grams of mercury per capita*Gross mercury consumption, i.e., before recycling, etc.
100
Comparison of Inventory results with world Hg consumption
Average per capita Hg use per year in South Asia: 0.12g
Population of Pakistan: 173000000 habitats
Estimated Hg use in Pakistan per year: 20,760 Kg
Average value between Min and Max inputs: 23870 kg
4.6. OVERALL CONCLUSION
It was observed that most of the waste water and solid samples collected from all
the four provinces of the country, show mercury contamination although the results are
lower than the NEQS limits but only marginally. It also reflects that all the sectors of
society and industry have exposure to mercury. This study was focused only on limited
industries as well as industrial and sewerage effluents and solid waste sites.
The maximum mercury concentration was found at the solid waste disposal sites in
all areas of provinces of Pakistan. These high results are due to the dumping of mercury
and its compounds in municipal and industrial waste without prior segregation. However,
this value of mercury is dangerous for humans as well as a disaster for aquatic life. The
proper disposal or removal of mercury from the solid waste could be reliable mitigation
measure for the toxicity of mercury.
It is for the first time in the history of Pakistan that a preliminary study on the
vulnerable issue of the use and release of mercury in the country has been carried out for its
use as a key document for nationally sound management of mercury release. To achieve
the goal of reporting in this area, the responsible stakeholders of concerned ministries, their
line agencies and local authorities conducted survey on mercury use and release sources in
all the four provinces of Pakistan.
While carrying out the survey at the concerned ministries, provincial departments,
local authorities etc. and various sites, many problems were faced regarding critical gaps in
making and keeping statistical records, such as lack of reliable data and information from
various generating/releasing sources. In this regard, most data/information was obtained by
101
estimations made by local line institutions and as a result, some difficulty in calculating
actual levels of the release of mercury into the environment. Despite these challenges, the
survey activities have sensitized the stakeholders on mercury issues and related harmful
effects to human health and the ecosystem. Nevertheless, a concerted effort was made in
obtaining and calculating the release of quantity of mercury into the environment and it is
concluded that the total quantity of mercury in Pakistan is:
Maximum emission and transfer: 36898 Kg per year
Minimum emission and transfer: 10842 Kg per year
This study is the first step which would prove a milestone towards conducting a
full-fledged survey covering all the sectors in due course of time. To develop such kind of
full inventory, it will be required to assemble all information data from many sectors/fields
which are specified in categories that are addressed in the Toolkit of UNEP, which reflects
Pakistan’s context.
This mercury inventory will assist the decision makers of the country in the sound
management of mercury leading to the provision of benefits for not only the existing
generation but also the future generations.
102
CHAPTER 5
CONCLUSIONS AND RECOMMENDATIONS
5.1. CONCLUSIONS
It was observed that most of the waste water and solid waste of municipal and
industrial waste samples collected from all the four provinces of the country, show
mercury contamination. Although, the results are lower than the NEQS limits but only
marginally. It also reflects that all the sectors of society and industry have exposure to
mercury. This study was focused only on limited industries as well as industrial, sewerage
effluents, municipal and industrial waste sites.
The maximum mercury concentration was found at the solid waste disposal sites in
all areas of provinces of Pakistan. These high results are due to the dumping of mercury
and its compounds in municipal and industrial waste without prior segregation. However,
this value of mercury is dangerous for humans as well as a disaster for aquatic life. The
proper disposal of mercury and removal of mercury bearing products from the solid waste
streams could be reliable mitigation measure for the toxicity of mercury.
In human hair samples of the group exposed to mercury, the value of mercury
exceeds normal values (2.0 µg/g) recommended by the WHO (1990).This can be related to
prolonged exposure of workers to the mercury vapour. Apparently, the longer is the
duration of exposure, the higher is the value of total mercury (T-Hg) found in their hair
samples. For example, the workers of chlor-alkali sector come into contact with mercury
and mercury vapour at the work place (Ittehad Chemicals Limited, Kala Shah Kaku
employing chlor-alkali process using mercury cell technology) thus resulting in high
concentration of T-Hg in their hair samples.
The workers of the chlor-alkali factory (Sittara Chemicals Industries Limited,
Faisalabad) who have completely phased out Mercury cell technology, the high
concentration of T-Hg in hair samples could be due to exposure to the contaminated areas.
High value of mercury could be due to exposure in earlier period when Sittara Chemicals
103
were using mercury cell. Although, the personnel in dental amalgam sector (Punjab
Dental College and Hospital, Lahore) have been exposed to mercury usage, yet mercury
level is within WHO limits, owing to better occupational practices and proper knowledge.
However, in the control group, lower concentration of total mercury in hair samples was
recorded as a result of limited exposure to mercury involving students and staff at Punjab
University, Lahore.
It is for the first time in the history of Pakistan that a preliminary study on the
vulnerable issue of the use and release of mercury in the country has been carried out for its
use as a key data for nationally sound management of mercury release. To achieve the goal
of reporting in this area, the responsible stakeholders of concerned ministries, their line
agencies and local authorities conducted survey on mercury use and release sources in all
the four provinces of Pakistan.
While carrying out the survey at the concerned ministries, provincial departments,
local authorities etc. and various sites, many problems were faced regarding critical gaps in
making and keeping statistical records, such as lack of reliable data and information from
various generating/releasing sources. In this regard, most data/information was obtained by
estimations made by local line institutions and as a result, some difficulty in calculating
actual levels of the release of mercury into the environment. Despite these challenges, the
survey activities have sensitized the stakeholders on mercury issues and related harmful
effects to human health and the ecosystem. Nevertheless, concerted efforts were made in
obtaining and calculating the release of the quantity of mercury into the environment and
concluded that the total quantity of mercury in Pakistan is;
Maximum emission and transfer: 36898 Kg per year
Minimum emission and transfer: 10842 Kg per year
This study is the first step which may prove a milestone towards conducting a
full-fledged survey covering all the sectors in due course of time. For such a full inventory,
it will be necessary to collect all information from various sectors/fields as specified in
categories and sub-categories addressing in the UNEP’s Toolkit, which reflects Pakistan’s
context.
104
This mercury inventory will assist the decision makers of the country for the
sound management of mercury leading to the provision of benefits for not only the existing
generation but also the future generations.
5.2. RECOMMENDATIONS
The overall aim of this study was to identify and quantify mercury releases in
Pakistan. On the basis of results and discussion of this study, it is possible to make some
recommendations for mercury waste management in Pakistan. This mercury waste
management will improve the quality of life of people and conserve aquatic resources by
reducing mercury releases to environment through ensuring provision for mercury
alternatives at all levels at an affordable cost and in an equitable, efficient and sustainable
manner. The main recommendations are;
1. Conduct more studies to identify and quantify mercury from all sources.
2. Coordinate with advanced research laboratories to study the health impacts of
mercury
3. Conduct a detailed study for the remediation of mercury exposed people.
4. Conduct a study for the determination of mercury during coal combustion.
5. Conduct a study on the environmental impacts of mercury products during final
disposal
6. Replace mercury products with mercury alternatives in future.
7. Conduct a study for most economical and environmental friendly mercury
alternatives.
8. Conduct a study for the recovery/recycling of mercury from mercury waste and
mercury products.
9. Conduct a study on the determination of methyl mercury in rivers and sea.
10. Conduct a study on the determination of methyl mercury in all types of fish.
11. Conduct a study on the health impacts of methyl mercury on human beings.
12. Ensure protection and safety of all people working/using mercury for different
purposes.
13. Encourage community participation and empowerment in planning, implementation,
monitoring and operation for safe disposal of mercury.
105
14. Promote cost effective and appropriate technological options for proper handling
of mercury.
15. Increase public awareness about mercury releases, their toxicity and proper disposal
through media and formal education.
16. Promote public-private partnership for enhancing access to Environmentally Sound
Management system for mercury disposal.
17. Application of Basel Convention technical guidelines on mercury use sectors like
chlor-alkali industry, health sector (especially dental amalgams) and light sources
sector.
18. Upgrade and revise the current legislation in the context of mercury pollution.
19. Encourage NGOs and individual researchers to identify mercury hazards and
entertain their suggestions.
20. Mercury containing devices must be kept out of the municipal waste stream during
the incineration and land filling.
21. Mercury containing batteries should be handled with care.
22. Waste reduction and proper waste management of products containing mercury
should be considered in households, business, industry and mercury spills.
23. In order to regulate mercury at consumer level, all purchasers of mercury containing
products should be registered and proper mercury/chemical regulation unit should be
established in all provincial EPA’s.
24. Replacement of mercury products with mercury alternatives must begin at the
production level in industrial processes and also for making of products for direct use
by consumers.
25. Disposal of dry mercury cells of all types having high concentration of mercury
should be high priority. In addition, pressure measuring devices, new and old (come
with scrap e.g. ship breaking) should be carefully managed.
26. Mercury poisoning should be included in environmental awareness campaigns. It
should be a part of pollution plus poisoning campaigns.
The recommendations for mercury waste management in chlor-alkali industry,
health and light products sectors at national level are given in Appendix-4.
106
CHAPTER 6
REFERENCES
1 UNEP (2002): Global Mercury Assessment, UNEP Chemicals, Geneva, Switzerland,
December 2002.
2 WHO/IPCS (1990): Methyl mercury. Environmental Health Criteria No 101, World
Health Organisation, International Programme on Chemical Safety (IPCS), Geneva,
Switzerland, 1990.
3 WHO/IPCS (1991): Inorganic mercury. Environmental Health Criteria No 118, World
Health Organisation, International Programme on Chemical Safety (IPCS), Geneva,
Switzerland, 1991.
4 Clarkson, T.W., Friberg, L., Hursh, J.B. and Nylander, M.. (1988): The prediction of
intake of mercury vapour from amalgams. In. Clarkson, T.W., Friberg, L., Nordberg, G.F.
and Sager, P.R., eds. Biological monitoring of toxic metals, New York, London, Plenum
Press,. pp. 247-264.
5 USA ATSDR (1999): Toxicological profile for mercury. Agency for Toxic Substances
and Disease Registry, Atlanta, USA.
6 Bank, M. S. (2012). Mercury in the Environment. Pattern and Process, University of
California Press.
7 "Mercury and the environment — Basic facts". Environment Canada, Federal
Government of Canada. 2004. http://www.ec.gc.ca/MERCURY/EN/bf.cfm.
Retrieved 2008-03-27
8 Mercury — Element of the ancients". Center for Environmental Health Sciences,
Dartmout College.
http://www.dartmouth.edu/~toxmetal/metals/stories/mercury.html. Retrieved
2008-03-27.
9 Pendergast, David M. (August 6, 1982), "Ancient maya mercury", Science 217:
533–535
10 "Lamanai". http://www.guidetobelize.info/en/maya/belize-mayan-lamanai-guide.shtml.
Retrieved June 17, 2011
11 Hesse R W (2007). Jewelrymaking through history. Greenwood Publishing Group.
p.120.ISBN0313335079.http://books.google.com/?id=DIWEi5Hg93gC&pg=PA120
107
12 Cox, R (1997). The Pillar of Celestial Fire. 1st World Publishing. p. 260.
ISBN 1887472304. http://books.google.com/?id=ykEN2zHvCpQC&pg=PA260.
13 Stillman, J. M. (2003). Story of Alchemy and Early Chemistry. Kessinger
Publishing. pp. 7–9. ISBN 9780766132306
14 Cox, R (1997). The Pillar of Celestial Fire. 1st World Publishing. p. 260.
ISBN 1887472304
15 Eisler, R. (2006). Mercury hazards to living organisms. CRC Press.
ISBN 9780849392122
16 Lew K (2008). Mercury. The Rosen Publishing Group. p. 10. ISBN 1404217800
17 Lee, J.D. (1999). Concise Inorganic Chemistry. Wiley-Blackwell.
ISBN 9780632052936
18 Cotton, F.A. and Wilkinson, G. 1988. Advanced Inorganic Chemistry, 5th edition.
Wiley-nterscience (John Wiley & Sons), New York, Toronto, Chichester, Brisbane,
Singapore
19 Nowak, M., and Singer, W. 2000. Mercury compounds. In Kirk-Othmer
Encyclopedia of Chemical Technology. John Wiley &d Sons, Inc
20 Wilhelm, S.M., Liang, L. and Kirchgessner. 2006. Identification and properties of
mercury species in crude oil. Energy Fuels 20: 180-186.
21 Jackson, T.A. 1998. Mercury in aquatic ecosystems. In: Metal Metabolism in
Aquatic Environments. Langston, W.J., and Bebianno, M.J., ed., Chapman & Hall,
London.
22 Skyllberg, U., Bloom, P.R., Quian, J., Lin, C.-M. and Bleam, W.F. 2006.
Complexation of mercury(II) in soil organic matter: EXAFS evidence for linear
two-coordination with reduced sulphur groups. Environ. Sci. Technol. 40:
4174-4180.
23 Greenwood, N.N. and Earnshaw, A. 1997. Chemistry of the elements. Second
edition.Elsevier Butterworth-Heinemann, Burlington, MA.
23 Nowak, M., and Singer, W. 2000. Mercury compounds. In Kirk-Othmer
Encyclopedia of Chemical Technology. John Wiley &d Sons, Inc.
24 Boudou, A., Delnomdedieu, M. and Georgescauld, D. 1991. Fundamental roles of
biological barriers in mercury accumulation and transfer in freshwater ecosystems.
Water Air Soil Pollut. 56: 807-821.
108
25 DeVito, S.C. 2005. Mercury. In: Kirk-Othmer Encyclopedia of Chemical
Technology. John Wiley &d Sons, Inc.
26 RPA (Risk and Policy Analysts Limited), 2002. Risk to health and the environment
related to the use of mercury products. Final report prepared for The European
Commission, DG Enterprise. Risk and Policy Analysts Limited.
27 United States Geological Survey(USGS),1990
28 Gobi International (1998): The Gobi report on mercury, CD ROM: version 2.2. As
cited by Sznopek and Goonan, 2000
29 Sznopek, J.L. and Goonan, T.G. (2000): The materials flow of mercury in the economies
of the United States and the world. USA Geological Survey Circular 1197, vers. 1.0, USA
Geological Survey, Nov. 2000, downloaded from http://greenwood.cr.usgs.gov/pub/
circulars/c1197/ in January 2001. Available from http://minerals.usgs.gov/minerals/pubs/
commodity/mercury/.
30 United States Geological Survey(USGS),1996
31 Lawrence, B. (2000): ―The Mercury Marketplace: Sources, Demand, Price, and the
Impacts of Environmental Regulation.‖ Presentation at USEPA’s Workshop on Mercury
in Products, Processes, Waste, and the Environment. Baltimore, Maryland (USA), March
22-23, 2000, As quoted by USA (comm-24-gov).
32 Lawrence, B. (2002): ―Global Markets for Mercury,‖ presented at the US EPA-sponsored
conference: Breaking the Mercury Cycle: Long-Term Management of Surplus Mercury &
Mercury-Bearing Waste. Boston, Massachusetts, USA, May 1-3, 2002.
33 EC (European Commission), 2005. Community Strategy Concerning Mercury. COM
(2005)20final,28.01.2005.eurlex.europa.eu/LexUriServ/site/en/com/2005/com2005
_0020en01.pdf
34 Schroeder, W.H. and Munthe, J. 1998. Atmospheric mercury – an overview. Atmos.
Environ.32: 809-822.
35 Lindqvist, O., Johansson, K., Aastrup, M., Andersson, A., Bringmark, L., Hovsenius,
G.,Håkansson, L., Iverfeldt, Å., Meili, M., and Timm, B. 1991. Mercury in the
Swedishenvironment – recent research on causes, consequences and corrective
actions. Water Air Soil Pollut., 55: 1-261.
109
36 Downs, S.G., Macloed, C.L. and Lester, J.N. 1998. Mercury in precipitation and
its relation to bioaccumulation in fish: a literature review. Water Air Soil Pollut.,
108: 149-187.
37 Glass, G.E. and Sorensen, J.A. 1999. Six-year trend (1990-1995) of wet deposition in
the upper Midwest, USA. Env. Sci. Technol. 33: 3303-3312.
38 Grigal, D.F. 2002. Inputs and outputs of mercury from terrestrial watersheds: a
review. Environ. Rev. 10: 1-39.
39 Niki, H., Maker, P.D., Savage, C.M., and Breitenbach, L.P. 1983. A long-path
Fourier transform study of the kinetics and mechanism for the OH-radical initiated
oxidation of dimethyl mercury. J. Physics Chem. 87: 4978-4981.
40 Lin, C.-J., and Pehkonen, S.O. 1999. The chemistry of atmospheric mercury: a
review. Atmos. Env. 33: 2067-2079.
41 Lamborg, C.H., Fitzgerald, W.F., O’Donnell, J., and Torgersen, T. 2002. A
non-steady-state compartmental model of global-scale mercury biogeochemistry
with interhemispheric atmospheric gradients. Geochim. Cosmochim. Acta 66:
1105-1118.
42 Hall, B. 1995. The gas phase oxidation of elemental mercury by ozone. Water Air
Soil Pollut. 80: 301-315.
43 Munthe, J., Xiao, Z.P., and Lindqvist, O. 1991. The aqueous reduction of divalent
mercury by sulfite. Water Air Soil Pollut. 56: 621-630.
44 Iverfeldt, Å., Munthe, J., Brosset, C. and Pacyna, J. 1995. Long-term changes in
concentration and deposition of atmospheric mercury over Scandinavia. Water Air
Soil Pollut 80: 227-233.
45 Slemr, F. and Schell, H.E. 1998. Trends in atmospheric mercury concentrations at the
summit of the Wank mountain, Southern Germany. Atmos. Env. 32: 845-853.
46 Kock, H.H., Bieber, E., Ebinghaus, R., Spain, T.G., and Thees, B. 2005. Comparison
of long-term trends and seasonal variations of atmospheric mercury concentrations at
the two European coastal monitoring stations Mace Head, Ireland, and Zingst,
Germany. Atmos. Environ. 39: 7549–7556.
47 Steffen, A., Schroeder, W., Macdonald, R., Poissant, L. and Konoplev, A. 2005.
Mercury in the Arctic atmosphere: An analysis of eight years of measurements of
110
GEM at Alert (Canada) and a comparison with observations at Amderma
(Russia) and Kuujjuarapik (Canada). Sci. Tot. Env. 342: 185-198.
48 Temme, C., Blanchard, P., Steffen, A., Banic, C., Beauchamp, S., Poissant, L.,
Tordon, R. and Wiens, B. 2007. Trend, seasonal and multivariate analysis study of
total gaseous mercury data from the Canadian atmospheric mercury measurement
network (CAMNet). Atmos. Env. 41: 5423–5441.
49 Wängberg, I. Munthe, J., Berg, T., Ebinghaus, R., Kock H.H., Temme, C., Bieber, E.,
Spain, T.G. and Stolk, A. 2007. Trends in air concentration and deposition of
mercury in the coastal environment of the North Sea Area. Atmos. Env. 41:
2612-2619.
50 Skyllberg, U., Bloom, P.R., Quian, J., Lin, C.-M. and Bleam, W.F. 2006.
Complexation of mercury(II) in soil organic matter: EXAFS evidence for linear
two-coordination with reduced sulphur groups. Environ. Sci. Technol. 40:
4174-4180.
51 Davis, A., Bloom, N.S. and Hee, S.S.Q. 1997. The environmental geochemistry and
bio accessibility of mercury in soils and sediments: a review. Risk Anal. 17: 557-569.
52 Grigal, 2003. Mercury sequestration in forests and peat lands: a review. J. Environ.
Qual. 32:393-405.
53 Hissler, C. and Probst, J.-L. 2006. Impact of mercury atmospheric deposition on
soils and streams in a mountainous catchment (Vosges, France) polluted by
chlor-alkali industrial activity: the important trapping role of organic matter. Sci. Tot.
Env. 361: 163-178.
54 Archer, F.C. and Hodgson, J.H. 1987. Total and extractable trace element contents of
soils in England and Wales. J. Soil Sci. 38: 421-431.
55 Kabata-Pendias, A. 2001. Mercury. In: Trace Elements in Soils and Plants. CRC
Press,London, pp. 157-168.
56 Schlüter, K. 2000. Review: evaporation of mercury from soils. An integration and
synthesis of current knowledge. Environ. Geol. 39: 249-271.
57 Tack, F.M.G., Vanhaesebroeck, T., Verloo, M.G., Rompaey, K.V. and Ranst, E.V.
2005.Mercury baseline levels in Flemish soils (Belgium). Environ. Poll. 134:
173-179.
111
58 Rodrigues, S., Pereira, M.E., Duarte, A.C., Ajmone-Marsan, F., Davidson, C.M.,
Grčman, H., Hossack, I., Hursthouse, A.S., Ljung, K., Martini, C., Otabbong, E.,
Reinoso, R., Ruiz- Cortés, E., Urquhart, G.J., and Vrščaj, B. 2006. Mercury in urban
soils: a comparison of local spatial variability in six European cities. Sci. Tot. Env.
368: 926-936.
59 Millhollen, A.G., Obrist, D. and Gustin, M.S. 2006. Mercury accumulation in grass
and forbs species as a function of atmospheric carbon dioxide concentrations and
mercury exposures in air and soil. Chemosphere, 65: 889-897.
60 Ericksen, J.A., Gustin, M.S., Schorran, D.E., Johnson, D.W., Lindberg, S.E. and
Coleman, J.S. 2003. Accumulation of atmospheric mercury in forest foliage. Atmos.
Environ. 37: 1613-1622.
61 Rea, A.W., Lindberg, S.E., and Keeler, G.J. 2001. Dry deposition and foliar leaching
of mercury and selected trace elements in deciduous forest through fall. Atmos. Env.
35: 3453-3462.
62 Ulrich, R., Raszyk, J. and Napravnik, A. 2001.Variations in contamination by
mercury, cadmium and lead on swine farms in the district of Hodonin in 1994 to
1999. VeterinarniMedicina 46:132-139.
63 Jackson, T.A. 1998. Mercury in aquatic ecosystems. In: Metal Metabolism in
AquaticEnvironments. Langston, W.J., and Bebianno, M.J., ed., Chapman & Hall,
London.
64 Gårdfeldt, K., Feng, X., Sommar, J., and Lindqvist, O. 2001. Total gaseous mercury
exchange between air and water at river and sea surfaces in Swedish coastal regions.
Atmos. Env.5: 3027-3038.
65 Anderson, M.E., Gårdfeldt, K., Wängberg, I., Sprovieri, F., Pirrone, N. and
Lindqvist, O.2007. Seasonal and daily variation of mercury evasion at coastal and off
shore sites from The Mediterranean Sea. Mar. Chem. 104: 214-226.
66 Leermarkers, M., Galletti, S., De Galan, S., Brion, N., and Baeyens, W. 2001.
Mercury in Southern North Sea and Scheldt Estuary. Mar. Chem. 75: 229-248.
67 Kotnik, J., Horvat, M., Tessier, E., Ogrinic, N., Monperrus, M., Amouroux, D.,
Fajon, V.,Gibicar, D., Zizek, S., Sprovieri, F., and Pirrone, N. 2007. Mercury
speciation in surface and deep waters of the Mediterranean Sea. Mar. Chem. 107:
13-30.
112
68 Horvat, M., Kotnik, J., Logar, M., Fajon, V., Zvonaric, T. and Pirrone, N. 2003.
Speciation of mercury in surface and deep-sea waters in the Meditaerranean Sea.
Atmos. Env. 37 (1): S93-S108.
69 Mason, R.P. and Sullivan, K.A. 1999. The distribution and speciation of mercury in
the South and Equatorial Atlantic. Deep-Sea Res II 46: 937-956..
70 Mason, R.P., Rolfhus, K.R. and Fitzgerald, W.F. 1998. Mercury in the North
Atlantic. Mar.Chem. 61: 37-53
71 Quevauviller, P., Donard, O.F.X., Wasserman, J.C., Martin, F.M., and Scneider, J.
1992.Occurrence of methylated tin and dimethyl mercury compounds in a mangrove
core fromSepetiba bay, Brazil. Appl. Organomet. Chem. 6: 221-228.
72 Baldi, F., Parati, F. and Filippelli, M. 1995. Dimethyl mercury and dimethyl
mercury-sulfide of microbial origin in the biogeochemical cycle of Hg. Water Air
Soil Pollut. 80: 805-815.
73 Weber, J.H., Evans, R., Jones, S.H. and Hines, M.E. 1998. Conversion of
mercury(II)intomercury(0), monomethylmercury cation, and dimethyl mercury in
saltmarsh sedimentslurries. Chemosphere 36: 1669-1687.
74 Stein, E.D., Cohen, Y. and Winer, A.M. 1996. Environmental distribution and
transformation of mercury compounds. Crit. Rev. Environ. Technol. 26: 1-43.
75 Dehn, L.-A., Follmann, E.H., Thomas, D.L., Sheffield, G.G., Rosa, C., Duffy, L.K.,
andO’Hara, T.M. 2006. Trophic relationship in an Arctic food web and implications
for tracemetal transfer. Sci. Tot. Env. 362: 103-123.
76 Gaskin, D.E., Stonefield, K.I., Suda, P. and Frank, R. 1979. Changes in mercury
levels inharbor porpoises (Phocena phocena) from the Bay of Fundy (Canada) and
adjacent waters during 1969-1977. Arch Environ. Contam. Toxicol. 8: 733-762.
77 Falconer, R.C., Davies, I.M. and Topping, G. 1983. Trace metals in the common
porpoisePhocena phocena. Mar. Environ. Res. 8: 119-127.
78 Chen, M.-H., Shih, C.-C., Chou, C.L. and Chou, L.-S. 2002. Mercury,
organic-mercury and selenium in small cetaceans in Taiwanese waters. Marine Pol.
Bul. 45(1-12): 237-245.
79 Endo, T., Haraguchi, K., Cipriano, F., Simmonds, M.P., Hotta, Y. and Sakata, M.
2004.Contamination by mercury and cadmium in the cetacean products from the
Japanesemarket. Chemosphere 54: 1653-1662.
113
80 Thompson, D.R. and Furness, R.W. 1989. The chemical form of mercury stored
in SouthAtlantic seabirds. Environ. Poll. 60: 305-317.
81 Wagemann. R, Trebacz, E., Boila, G. and Lockhart W.L. 1998. Methyl mercury and
totalmercury in tissues of arctic marine mammals. Sci. Tot. Env. 218: 19-31.
82 Wagemann, R., Trebacz, E., Boila, G. and Lockhart, W.L. 2000. Mercury species in
the liver of ringed seals. Sci. Tot. Env. 261: 21-32.
83 USGS (2012). Mineral Commodity Summary. United States Geological Service.
(Available from http://minerals.usgs.gov/minerals/pubs/commodity/mercury/mcs-
2012-mercu.pdf ).
84 UNEP (2006).Summary of supply, trade and demand information on mercury.
United Nations Environment Programme. UNEP´s Division of Technology, Industry
and Economics (DTIE) Chemical Branch. Geneva, Switzerland.
85 UNEP (2013). Global Mercury Assessment 2013 Sources, Emissions, Releases and
Environmental Transport. United Nations Environment Programme, report in draft.
86 Fitzgerald, W.F., Engstrom, D.R., Mason, R.P. and Nater, E.A. (1998): The case for
atmospheric mercury contamination in remote areas. Environmental Science and
Technology, Vol. 32, No. 1, 1998.
87 Jackson, T.A. (1997): Long-range atmospheric transport of mercury to ecosystems,
and the importance of anthropogenic emissions – a critical review and evaluation of
the published evidence, Environmental Review, 5, 99-120.
88 Lamborg, C. H., Fitzgerald, W. F., O’Donnell, J. and Torgersen, T. (2002): A
non-steady-state compartmental model of global-scale mercury biogeochemistry with
interhemispheric atmospheric gradients. Geochimica et Cosmochimica Acta 66 (7),
1105-1118.
89 Coolbaugh, M.F., Gustin, M.S. and Rytuba, J.J. (2002): Annual emissions on mercury
to the atmosphere from three natural source areas in Nevada and California,
Environmental Geology 42: 338-349.
90 Lindquist, O., Jernelöv, A., Johansson, K. and Rohde, H. (1984): Mercury in the
Swedish Environment. Global and local sources, report 1816, National Swedish
Environmental Protection Agency, Stockholm, 121 pp. As cited by von Rein and
Hylander (2000).
114
91 Bergan, T., Gallardo, L. and Rohde, H. (1999): Mercury in the global
troposphere - a three-dimensional model study. Atmospheric Environment 33 (1999),
pp. 1575-1585.
92 Mason, R.P., Fitzgerald, W.F. and Morel, M.M. (1994): The biogeochemical
cycling of elemental mercury: Anthropogenic influences. Geochimica. et
Cosmochimica. Acta, 58(15): 31-3198. As quoted by US EPA, 1997
93 Bergan, T. and Rohde, H. (2001): Oxidation of elemental mercury in the
atmosphere; constraints imposed by global scale modeling. Journal of Atmospheric
Chemistry 40, 191-212.
94 Lacerda, L.D. (1997a): Global mercury emissions from gold and silver mining. Water,
Air and Soil Pollution 97: pp 209-221, 1997, Kluwer Academic Publishers, The
Netherlands.
95 Pilgrim, W. (1998): Chapter VIII, Mercury in the Eastern Canadian Provinces - USA
Northeast States and Eastern Canadian Provinces Mercury Study Report. Northeast
States for Coordinated Air Use Management, Northeast Waste Management Officials’
Association, New England Interstate Water Pollution Control Commission and
Ecological Monitoring and Assessment Network of Canada. 1998.
96 Lindberg, S. E., Wallschlager, D., Prestbo, E. M., Bloom, N. S., Price, J. and Reinhart,
D. (2001): Methylated mercury species in municipal waste landfill gas sampled in
Florida, USA, Atmospheric Environment 35, 4011-4015.
97 Maag, J., Lassen, C. and Hansen, E. (1996): Massestrømsanalyse for kviksølv
(substance flow assessment for mercury). Miljøproject no. 344, 1996, Danish
Environmental Protection Agency, Copenhagen (in Danish with summary in English).
98 Groupe de travail de l’AGHTM (1999): Dechets mercuriel en France [Mercurial waste
in France]. TSM Techniques Science Methods 7-8/1999: 20-48. (In French, with
abstract in English).
99 Pirrone, N. (2001): Mercury Research in Europe: Towards the preparation of the New
EU Air Quality Directive. Atmospheric Environment 35, 2979-2986.
100 Bragg, L.J., Oman, J.K., Tewalt, S.J., Oman, C.L., Rega, N.H., Washington, P.M.
and Finkelmann, R.B. (1998): The US Geological Survey Coal Quality
(COALQUAL) Database - version 2.0. US Geological Survey Open-file report
97-134 (can be downloaded from http://energy.er.usgs.gov/products/openfile/
115
OFR97-134/). As cited by USGS in fact sheet "Mercury in U.S.coal- abundance
distribution and modes of occurrence", found October 2002 on
http://pubs.usgs.gov/fs/fs095-01/fs095-01.pdf
101 Pacyna, J.M. and Pacyna, E.G. (2000): Assessment of emissions/discharges of
mercury reaching the Arctic environment. The Norwegian Institute for Air
Research, NILU Report OR 7/2000, Kjeller, Norway.
102 US EPA (1997): Mercury study report to congress. US EPA, Dec. 1997.
Downloaded from http://www.epa.gov/airprogm/oar/mercury.html, January 2001.
103 Wilhelm, S.M. and Bigham, G.N. (2002): Concentration of mercury in crude oil
refined in the United States. 5th International Conference on Mercury as a Global
Pollutant, Minamata, Japan. Available
at:http://www.hgtech.com/Publications/minamata.htm .
104 Shah, K. R., Filby, R. H. and Haller, W. A. (1970): Determination of Trace
Elements in Petroleum by Neutron Activation Analysis, Journal of Radio analytical
Chemistry, 6:413.
105 Filby, R. H, and Shah, K. R. (1975): Neutron Activation Methods for Trace Metals
in Crude Oil, in The Role of Trace Metals in Petroleum, by T. F.Yen, Ann Arbor
Science Publishers, Ann Arbor, MI.
106 Bloom, N. S. (2000): Analysis and Stability of Mercury Speciation in Petroleum
Hydrocarbons, Fresenius’ J. Anal. Chem., 366(5):438. 65.
107 COWI (2002): ACAP and Danish EPA Reduction of Atmospheric mercury
emissions from Arctic countries – questionnaire on emissions and elated topics.
November 2002.
108 Friedli, H.R., Radke, L.F. and Lu, J.Y. (2001): Mercury in Smoke from Biomass
Fires. Geophysical Research Letter, 28:3223-3226. Available at:
http://www.mindfully.org/Air/Mercury-Smoke-Biomass.htm
109 NJ MTF (2002): New Jersey Mercury Task Force Report. Volume III. Sources of
Mercury in New Jersey. January 2002.Available at website:
http://www.state.nj.us/dep/dsr/Vol3-chapter1.pdf.
110 Skårup, S., Christensen, C.L., Maag, J. and Jensen, S.H. (2003): Substance Flow
Analysis for Mercury. Environmental project no. 808, The Danish EPA, 2003(in
116
Danish with summary in English). Available at www.mst.dk. Since 2004 also
available in English at same website.
111 Kindbom, K and Munthe, J. (1998): Hur påverkas kvicksilver i miljön av olika
energialternativ? [How is mercury in the environment influenced by different
energy alternatives]. IVL Svenska Miljöinstitutttet. (In Swedish)
112 Feng, X., Li, G. and Qiu, G. (2004): Mercury contamination from artisanal zinc
smelting using indigenous methods in Hezhang, Guizhou, PR China. In Mercury as
a Global Pollutant, part 1, RMZ - Materials and Geo environment - periodical for
mining, metallurgy and geology, Ljubliana, Slovenia, 2004.
113 Nriagu, J.O. and Pacyna, J.M. (1988): quantitative assessment of worldwide
contamination of air, water and soil by trace metals. Nature 333, pp- 134-139. As
cited by Feng et al. (2004).
114 Maag, J. (2004): Arctic mercury releases inventory. Appendix on Mercury releases
from Finland. COWI for the Arctic Council and the Danish Environment
Protection Agency, Copenhagen. Draft report of 2004.
115 US EPA (2003a): Mercury: Toxics Release Inventory Fact Sheet. United States
Environmental Protection Agency, Region 9.June 2003.
116 Jasinski, S.M. (1994): The materials flow of mercury in the United States. The
United States Department of the Interior, Bureau of Mines, Circular 9412.
Available from http://minerals.usgs.gov/minerals/pubs/commodity/mercury/.
117 Lassen, C. (Ed.), Treger, Y.A., Yanin, E.P., Revich, B.A., Shenfeld, B.E., Dutchak,
S.V., Ozorova, N.A., Laperdina, T.G. andKubasov, V.L. (2004): Assessment of
mercury releases from the Russian Federation. Ministry of Natural Resources of
the Russian Federation, Danish Environment Protection agency, Arctic Council.
Draft, 2004.
118 Berndt, M.E. (2003): Mercury and Mining in Minnesota. Minerals Coordinating
Committee. Final Report. Minnesota Department of Natural Resources, St. Paul,
Minnesota. Available at http://files.dnr.state.mn.us/lands_minerals/mercury
andmining.pdf .
119 Cembureau (1999): Best available techniques for the cement industry. European
Cement Association, Brussels. Available
117
at:http://www.cembureau.be/Documents/Publications/CEMBUREAU_BAT_
Reference_Document_2000-03.pdf
120 VDZ (2000): Umweltdaten der deutschen Zementindustrie. [Environmental data
for the German cement industry]. Vereindeutscher Zementwerke e. V., Düsseldorf.
(In German)
121 US EPA (1997a): Locating and estimating air emissions from sources of mercury
and mercury compounds. Report EPA-454/R-97-012, (NTIS PB98- 117054),
Office of Air Quality Planning and Standards, Research Triangle Park, NC.
Availableat: http://www.epa.gov/ttn/chief/le/index.html .
122 OSPAR (2002): Mercury emissions from crematoria and their control in the
OSPAR Convention Area. OSPAR Commission, Paris. Available
at:http://www.ospar.org/documents/dbase/publications/p00179_Mercury%20emis
sions%20from%20crematoria.pdf
123 Southworth et al. (2004): Fugitive Mercury Emissions from a Chlor-alkali Factory:
Sources and Fluxes to the Atmosphere. Atmospheric Environment 38: 597-611
124 Kinsey et al. (2004): Characterization of Fugitive Mercury Emissions from the Cell
Building at a US Chlor-alkali Plant. Atmospheric Environment 38: 623-631.
125 Qi, X., Lin, Y., Chen, J. and Ye, Y. (2000): An evaluation of mercury emissions
from the chlor-alkali industry in China. Journal of Environmental Sciences, Vol.
12, supplement, pp. 24-30, 2000.
126 Carpi, A. and Chen, Y.F. (2001): Gaseous Elemental Mercury as an Indoor
Pollutant. Environ. Sci. Technol. Vol 35:4170-4173.
127 Barr (2001): Substance Flow Analysis of Mercury in Products. Prepared for
Minnesota Pollution Control Agency. August15, 2001. Barr Engineering,
Minneapolis, MN.
128 Unilever (2003): Thermometer factory: Kodaikanal, India (update 7 April 2003).
Unilever PLC London. Available
at:http://www.unilever.com/environmentsociety/newsandspeeches/Thermometer_
factory_Kodaikanal_India.asp?ComponentID=5664&SourcePageID=165 .
129 US EPA (1992): Characterization of Products Containing Mercury in Municipal
Solid Waste in the United States, 1970 to2000. Office of Solid Waste, Washington,
DC. March 1992.
118
130 Hansen, C. L. and Hansen, E. (2003): Collection systems for batteries - existing
experiences from Denmark and abroad. Environmental project no. 777, 2003,
Danish Environmental Protection Agency (in Danish with summary in English).
Available atwww.mst.dk; publications.
131 Barr (2001): Substance Flow Analysis of Mercury in Products. Prepared for
Minnesota Pollution Control Agency. August15, 2001. Barr Engineering,
Minneapolis, MN.
132 Maag, J., Lassen, C. and Hansen, E. (1996): Massestrømsanalyse for kviksølv
(substance flow assessment for mercury). Miljøproject no. 344, 1996, Danish
Environmental Protection Agency, Copenhagen (in Danish with summary in
English). Available at www.mst.dk; publikationer.
133 Skare, I. and Engqvist, L. (1994): Human exposure to mercury and silver released
from dental amalgam restorations. Arch.Environ. Health 1994; 49:384-394.
134 Sörme, L. and Lagerkvist, R. (2002): Sources of heavy metals in urban wastewater
in Stockholm. The Science of the TotalEnvironment 298 (2002) 131.145
135 Sörme, L., Lindqvist, A. and Söderberg, H. (2003): Capacity to Influence Sources
of Heavy Metals to Wastewater Treatment Sludge. Environmental Management
Vol. 31, No. 3, pp. 421–428.
136 US EPA (2004): Mercury in medical waste. Available at: http://www.epa.gov/
reg5oair/glakes/fact1.htm
137 Environment Canada (2000): The status of mercury in Canada. Report #2. A
Background Report to the Commission for Environmental Cooperation North
American Task Force on Mercury. Environment Canada, Transboundary Air Issues
Branch.Available at: http://www.cec.org/files/PDF/POLLUTANTS/Hgcan-e3.pdf.
138 Lindberg S.E., Walschläger D., Prestbo E.M., Bloom N.S., Price J. and Reinhart D.
(2001): Methylated mercury species in municipal waste landfill gas sampled in
Florida, USA. Atmos. Environ. 35, 4011-4015.
139 Shunlin Tang, Xinbin Feng, Zhonggen Li, Shaofeng Wang and Lian Liang (2004):
A preliminary study on mercury speciation in municipal waste landfill gas from
Guizhou, China. In Mercury as a Global Pollutant, part 1, RMZ - Materials and
Geoenvironment- periodical for mining, metallurgy and geology, Ljubliana,
Slovenia, 2004.
119
140 Lindberg, S.E., (2004): Personal communication. Environmental Sciences
Division, Oak Ridge National Laboratory, Oak Ridge, TN, USA.
141 Reindl, J. (2003): Summary of References on Mercury Emissions from Crematoria
- DRAFT. Dane County Department of Public Works. Madison Wisconsin. August
12, 2003.
142 Hylander, L. D. and Meili, M. (2005): The rise and fall of mercury: converting a
resource to refuse after 500 years of mining and pollution. Crit. Rev. Environ. Sci.
Technol. 34:1-36.
143 Axenfeld, F., Munch, J. and Pacyna, J.M. (1991): Europaische
Test-Emissionsdatenbasis von Quecksilber-komponenten fur Modellrechnungen.
Umweltforschungsplan des Bundesministers fur Umwelt Naturschutz und
Reaktorsicherheit, Luftreinhaltung: 104 02 726, Friedrichshafen, Germany.
144 Mason, R.P. and Fitzgerald, W.F. (1996): Sources, sinks and biochemical cycling
of mercury in the ocean. In: Baeyens, W., Ebinghaus, R. and Valiliev, O. (eds.):
Global and regional mercury cycles: Sources, fluxes and mass balances. NATO
ASI Series, 2. Environment - Vol. 21. Kluwer Academic Publishers, Dordrecht,
The Netherlands.
145 Mason, R.P. and Fitzgerald, W.F. (1997): Biogeochemical cycling of mercury in
the marine environment. In: Sigel, A. and Sigel, H.: Metal ions in biological
systems. Marcel Dekker, Inc. 34, pp. 53-111.
146 Maxson, P.A. and Vonkeman, G.H. (1996): Mercury stock management in the
Netherlands. Background document prepared for workshop "Mercury: Ban it or
bridle it?" Held 21. November 1996, The Hague, Netherlands, Institute for
European Environmental Policy, Brussels, Belgium, 48 p.
147 Scoullos, M., Vonkeman, G., Thornton, I., Makuch, Z., Arsenikos, S.,
Constantianos, V., Docx, P., Karavoltsos, S., Mac-Donald, K., Mantzara, B.,
Maxson, P., Rautiu, R., Roniotes, S., Sakellari, A. and Zeri, C. (2000):
EUPHEMET - Towards an integrated EU policy for heavy metals. For the
European Commission DG12 - Research Directorate-General, Brussels.
148 Lindley (1997): An Economic and Environmental Analysis of the Chlor-Alkali
Production Process: Mercury Cells and Alternative Technologies, prepared for
European Commission - DG Enterprise, Brussels, 1997.
120
149 Harris, M. (2001): Phase-out Issues for Mercury Cell Technology in the
Chlor-Alkali Industry, Chapter 2 of Modern Chlor-Alkali Technology, Moorhouse,
J. (ed.), Blackwell Science, ISBN 0-632-05559-6.
150 UNEP (2012). A Practical Guide: Reducing Mercury Use in Artisanal and
Small-Scale Gold Mining. United Nations Environment Programme, Global
Mercury Partnership.
151 UNEP (2013). Global Mercury Assessment 2013 Sources, Emissions, Releases and
Environmental Transport. United Nations Environment Programme, report in draft
152 EU (2010). Opinion on Mercury in Certain Energy-saving Light Bulbs. European
Commission Scientific Committee on Health and Environmental Risks. (Available
http://ec.europa.eu/health/scientific_committees/environmental_risks/docs/scher_
o_124.pdf).
153 Munthe, J. and Kindbom, K. (1997): Mercury in products – a source of
transboundary pollutant transport. KEMI Report No. 10/97, The Swedish National
Chemicals Inspectorate.
154 Lawrence, B. (2000): ―The Mercury Marketplace: Sources, Demand, Price, and the
Impacts of Environmental Regulation.‖ Presentation at USEPA’s Workshop on
Mercury in Products, Processes, Waste, and the Environment. Baltimore, Maryland
(USA), March 22-23, 2000, As quoted by USA (comm-24-gov).
155 Sznopek, J.L. and Goonan, T.G. (2000): The materials flow of mercury in the
economies of the United States and the world. USA Geological Survey Circular
1197, vers. 1.0, USA Geological Survey, Nov. 2000, downloaded
fromhttp://greenwood.cr.usgs.gov/pub/circulars/c1197/ in January 2001. Available
fromhttp://minerals.usgs.gov/minerals/pubs/commodity/mercury/.
156 Barr, L. (2004): International Mercury Market Study and the Role and Impact of
US Environmental Policy. EPA Office of Solid Waste, November, 2004.
157 NESCAUM (1998): The Northeast States and Eastern Canadian Provinces
Mercury Study, February 1998. Available on internet at: http://www.cciw.ca/ca/
eman-temp/reports/publications/mercury/
158 Wankhade, K.K. (2003): Mercury in India. Toxic pathways. Toxics Link, New
Delhi. Available at:http://www.toxicslink.org/pub-view.php?pubnum=35
121
159 Agos, M., Etzel, R., Parrish, R., Paschal, D., Campagna, P., Cohen, D.,
Kilbourne, E. and Heese, J. (1990): Mercury exposure from interior latex paint,
New England Journal of Medicine, 323, 1096-1101.
160 Husar, J.D. and Husar, R. (2001): Trends of mercury flows in Florida. Progress
Report. Lantern Corporation.
At:http://capita.wustl.edu/Capita/CapitaReports/Mercury/MercFlorida011112.doc
161 Alphen, M. van (1998): Paint film components. National Environmental Health
Forum Monographs. General Series No. 2.National Environmental Health Forum,
South Australia. Available at:
http://enhealth.nphp.gov.au/council/pubs/pdf/paint.pdf
162 US EPA (2002): Control of Mercury Emissions from Coal-fired Electric Utility
Boilers, Interim Report Including errata Data 3-21-02. EPA-600/R-01-109,
National Risk Management Research Laboratory, Research Triangle Park, NC,
April 2002. Available at http://www.epa.gov/appcdwww/aptb/EPA-600
-R-01-109corrected.pdf.
163 OECD (1994): Mercury - Background and national experience with reducing risk.
Risk reduction monograph no. 4. OECD, Paris, 1994 (web-version from
http://www.oecd.org//ehs/risk.htm is dated 1995).
164 Mahe, A., Blanc, L., Halna, J.M., Keita, S., Sanogo, T. and Bobin, P. (1993): An
epidemiologic survey on the cosmetic use of bleaching agents by the women of
Bamako (Mali). Ann. Dermatol. Vernereol 120: 870-873. (In French)
165 Adebajo S.B. (2002): An epidemiological survey of the use of cosmetic skin
lightening cosmetics among traders in Lagos, Nigeria. West African Journal of
Medicine 21: 51-55.
166 Harada, M., Nakachi, S., Tasaka, K., Sakashita, S., Muta, K., Yanagida, K., Doi, R.
and Kizaki, T. (2001): Wide use of skin lightening soap may cause mercury
poisoning in Kenya. . Sci Total Environ: 26:183-187.
167 Glahder, C.M., Appel, P.W.U. and Asmund, G. (1999): Mercury in soap in
Tanzania. NERI Technical Report No. 306, 23pp.National Environmental
Research Institute, Denmark.
168 Danish EPA (2002): Punktkilder 2001. Orientering nr. 7, 2002 (Point Sources
2001, Review no. 7, 2002). Danish EPA, Copenhagen(in Danish).
122
169 Maxson, P. (2004): Mercury flows in Europe and the world: The impact of
decommissioned chlor-alkali plants. European Commission, Brussels. Available
at: europa.eu.int/comm/environment/ chemicals/mercury/pdf/report.pdf.
170 Hansen, E. (1985): Forbrug og forurening med kviksølv i Danmark [Consumption
of and pollution with mercury in Denmark].Danish Environmental protection
Agency, Copenhagen. (In Danish)
171 AGHTM (2000): Mercury waste in France. AGHTM - General Association of
Municipal Hygienists and technicians – Working Group Report. AGHTM, Paris.
Available at: http://www.apesa.asso.fr/mercure_AGHTM_english.pdf.
172 Reindl, J. (2003): Summary of References on Mercury Emissions from Crematoria
- DRAFT. Dane County Department of Public Works. Madison Wisconsin. August
12, 2003.
173 Dufault, D., LeBlanc, B., Schnoll, R., Cornett, C., Schweitzer, L., Wallinga, D.,
Hightower, J., Patrick, L., Lukiw, W. J. (2009). Mercury from chlor-alkali plants:
measured concentrations in food product sugar. Environmental Helath, 8:2.
174 Zhang, H., Feng, X., Larssen, T., Qiu, G., Vogt, R. D. (2010). In inland China, rice,
rather than fish, is the major pathway for methyl mercury exposure. Environmental
Health Perspective, 118: 9, 1183–1188.
175 Smith, R.G., Vorwald, A.J. and Patel, L.S. (1970): Effects of exposure to mercury in the
manufacture of chlorine. American Industrial Hygiene Association Journal 1970;
31:687-700.
176 Bidstrup, P., Bonnell, J. and Harvey, D.G. (1951): Chronic mercury poisoning in men
repairing direct current meters. Lancet 1951:856-861.
177 Langworth, S., Almkvist, O., Soderman, E. and Wikström, B.O. (1992): Effects of
occupational exposure to mercury vapor on the central nervous system. British
Journal of Industrial Medicine 1992; 49:545-555.
178 McKelvey, W., Oken, E. (2012). Mercury and Public Health: An Assessment of
Human Exposure. Mercury in the Environment: Pattern and Process by Michael
Bank, Chapter 13.
179 Jalili, H.A. and Abbasi, A.H. (1961): Poisoning by ethyl mercury toluene
sulphonanilide. British Journal of Industrial Medicine 1961; 18:303-308.
123
180 Salonen, J.T., Seppanen, K., Nyyssonen, K., Korpela, H., Kauhanen, J.,
Kantola, M., Tuomilehto, J., Esterbauer, H., Tatzber, F. and Salonen, R. (1995):
Intake of mercury from fish, lipid peroxidation, and the risk of myocardial
infarction and coronary, cardiovascular, and any death in eastern Finnish men.
Circulation 1995; 91:645-55.
181 Rissanen, T. Voutilainen, S., Nyyssönen, K., Lakka, TA. And Salonen, JT. (2000):
Fish-oilderived fatty acids, docosahexaenoic acid, and the risk of acute coronary
events. Circulation 2000; 102: 2677-2679
182 Boucher, O., Jacobson, S. W., Plusquellec, P., Dewailly, E., Ayotte, P.,
Forget-Dubois, N., Jacobson, J. L., Muckle, G. (2010). Prenatal methylmercury,
postnatal lead exposure, and evidence of attention deficit/hyperactivity disorder
among Inuit children in Arctic Québec. Environmental Health Perspectives, Vol.
120: 10, 1456–61.
183 Aronow, R., Cubbage, C., Wisner, R., Johnson, B., Hesse, J. and Bedford, J.
(1990): Mercury exposure from interior latex paint. Morbidity and Mortality
Weekly Report 39(8): 125-126.
184 Drasch, G., Wanghofer, E., Roider, G. and Strobach, S. (1996): Correlation of
mercury and selenium in the human kidney. Journal of Trace Elements in Medicine
and Biology 1996; 10:251-254.
185 Barregard, L., Sallsten, G. and Conradi, N. (1999): Tissue levels of mercury in a
deceased worker after occupational exposure. International Archives of
Occupationaland Environmental Health 1999b; 72:169-173.
186 Hac, E., Krzyzanowski, M. and Krechniak, J. (2000): Total mercury concentrations
in human renal cortex, liver, cerebellum and hair. Science of the Total Environment
2000; 248:37-43.
187 Falnoga, I., Tusek-Znidaric, M., Horvat, M. and Stegnar, P. (2000): Mercury,
Selenium, and Cadmium in Human Autopsy Samples form Idrija Residents and
Mercury Mine Workers. Environmental Research 2000; 84: 211-218.
188 Kazantzis, G., Schiller, K.F., Asscher, A.W. and Drew, R.G. (1962): Albuminuria
and the nephrotic syndrome following exposure to mercury and its compounds.
Quarterly Journal of Medicine 1962; 3: 403-419.
124
189 Borjesson, J., Barregård, L., Sällsten, G., Schütz, A., Jonson, R., Alpsten, M.
and Mattsson, S. (1995): In vivo XRF analysis of mercury: the relation between
concentrations in the kidney and the urine. Physics in Medicine and Biology 40:
413-426.
190 Lebel, J., Mergler, D., Branches, F., Lucotte, M., Amorim, M., Larribe, F. and
Dolbec, J. (1998): Neurotoxic effects of low-level methylmercury contamination in
the Amazonian Basin. Environmental Research 1998; 79:20-32.
191 Tamashiro, H., Arakaki, M., Futatsuka, M. and Lee, E.S. (1986): Methylmercury
exposure and mortality in southern Japan: A close look at causes of death. Journal
of Epidemiology and Community Health 1986;40:181-185.
192 USA ATSDR (1999): Toxicological profile for mercury. Agency for Toxic
Substances and Disease Registry, Atlanta, USA
193 Pelclova, D., Lukas, E., Urban, P., Preiss, J., Rysava, R., Lebenhart, P., Okrouhlik,
B., Fenclova, Z., Lebedova, J., Stejskalova, A. and Ridzon, P. (2002): Mercury
intoxication from skin ointment containing mercuric ammonium chloride.
International Archives of Occupational Environmental Health 2002, Jul; 75 Suppl
1:54-9.
194 Ernst, E. and Coon, J.T. (2001): Heavy metals in traditional Chinese medicines: A
systematic review. Clinical Pharmacology and Therapeutics 2001, Vol. 70;
Number 6: 497-504.
195 Koh, H.L. and Woo, S.O. (2000): Chinese proprietary medicine in Singapore:
Regulatory Control of Toxic Heavy Metals and Undeclared Drugs. Drug Safety:
An International Journal of Medical Toxicology and Drug Experience. 2000.
Volume 23: (5): pages 351-62.
196 Garvey, J.G., Hahn, G., Lee, R.V. and Harbison, R.D. (2001): Heavy metal hazards
of Asian traditional remedies. International Journal of Environmental Health
Research 2001, 11: 63-71.
197 Feng, Q., Suzuki, Y. and Hisashige, A. (1998): Hair mercury levels of residents in
China, Indonesia and Japan. Archives of Environmental Health, Vol. 53, No. 1,
January/February 1998.
125
198 Suzuki, T. (1991): Advances in mercury toxicology. Plenum Press, New York,
1991, pp. 459-483. As quoted by Feng et al. (1998).
199 Akagi, H. and Naganuma, A. (2000?): Methyl mercury accumulation in
Amazonian inhabitants associated with mercury pollution. Paper submitted by
Japan (as part sub6gov). (Publication status and year not mentioned – from the text
the year of creation appears to be 2000 or later).
200 Vasconcellos, M.B.A., Paletti, G., Catharino, M.G.M., Saiki, M., Fávaro, D.I.T.,
Baruzzi, R.G., Rodrigues, D.A., Byrne, A.R. and Forti, M.C. (1998?): Studies on
mercury exposure of some brazilian populational groups living in the amazonic
region by means of hair analysis. Paper submitted by Brazil (sub68govatt1).
(Publication status and year not mentioned – from the text the year of creation
appears to be 1998 or later).
201 Franchi, E., Loprieno, G., Ballardin, M., Petrozzi, L. and Migliore, L. (1994):
Cytogenetic monitoring of fishermen with environmental mercury exposure.
Mutation Research 1994; 320:23-29.
202 Von Rein, K. and Hylander, L. D. (2000): Experiences from phasing out the use of
mercury in Sweden. Regional Environmental Change 1: 126-134.
203 Louekari, K., Mukherjee, A.B. and Verta, M. (1994): Changes in human dietary
intake of mercury in polluted areas in Finland between 1967 and 1990. In: Watras,
C.J. and Huckabee, J.W.: Mercury pollution, Integration and Synthesis, pp.
705-711, CRC Press, Lewis Publishers, 1994.
204 UNEP Toolkit for identification and quantification of mercury releases – Pilot
draft, November 2005
205 Margaret, A. M., Charles, F. D., John, O., Michael, B. P., Edo, P., Reshan F.,
Ruben, M., Susan, E. S., Thomas, S., Robert L. J., and Kathryn, R. M. (2004) Hair
mercury levels in U. S. Children and woman of Childbearing Age: Reference
Range Data from NHANES 1999-2000. Environmental Health Perspectives 112
(11), 1165 – 1171.
206 Egeland, G. M., Rafael, P., Nicolas S. B., Rick K., Stephen, L. and John, P. M.
(2009) Hair methylmercury levels of mummies of the Aleutian Islands, Alaska.
Environmental Research 109, 281 – 286.
126
207 WHO Guidelines,1990
208 Leino, T., and Lodenius, M. (1995) Human hair mercury levels in Tucurui area,
State of Para, Brazil. The Science of the Total Environment, 175, 119–125
209 Williams, T. M., Apostol, A. N. Jr., and Miranda, C. R. (2000) Assessment by hair
analysis of mercury exposure among mining impacted communities of Mindanao
and Palawan,the Philippines. Environmental Geochemistry and Health, 22, 19–31.
210 Al-Majed, N. B., & Preston, M. R. (2000) Factors influencing the total mercury and
methyl mercury in the hair of the fishermen of Kuwait. Environmental Pollution,
109, 239–250.
211 Drasch, G., Bose-O’Reilly, S., Beinhoff, C., Roider, G., and Maydl, S. (2001). The
Mt. Diwata study on the Philippines 1999 - assessing mercury intoxication of the
population by small scale gold mining. The Science of the Total Environment, 267,
151–168.
212 De Oliveira Santos, E. C., de Jesus, I. M., Brabo, E. S., de M. Caˆmara, V.,
Lourerio, E. C. B., Mascarenhas, A. F., Faial, K. de F., da Silva, A. P., da Silva, R.
U., R. R. Luiz, R. R. and Higuchi, H.(2002) Exposure to mercury in the urban
population of Rio Branco City, State of Acre, Brazil. Bulletin of Environmental
Contamination and Toxicology, 69, 314–319.
213 Crompton, P., Ventura, A. M., de Souza, J. M., Santos, E., Strickland, G. T. and
Silbergeld, E. (2002) Assessment of mercury exposure and malaria in a Brazilian
Amazon Riverine Community. Environmental Research, 90, 69 –75.
214 Yasutake, A., Matsumoto, M., Yamaguchi, M., and Hachiya, N. (2004) Current
hair mercury levels in Japanese for estimation of methyl mercury exposure. Journal
of Health Science, 50 (2), 120–125.
215 Tetsuro, A., Takashi, K., Hisato, I., In M., Touch S. T., Annamalai S. and Shinsuke
T. (2005) Mercury contamination in human hair and fish from Cambodia: levels,
specific accumulation and risk assessment. Environmental Pollution 134, 79–86
216 Bastos, W. R., Gomes, J. P. O., Oliveira, R. C., Almeida, R., Nascimento, E. L.,
Bernardi, J. V. E., Luiz Drude de Lacerda, L. L., Ene Glo´ ria da Silveira, E. G. and
Wolfgang Christian Pfeiffer, W. C. P. (2006) Mercury in the environment and
127
riverside population in the Madeira River Basin, Amazon, Brazil. The Science
of the Total Environment, 368, 344–351
217 Zhang, L., & Wang, Q. C. (2006) Preliminary study on health risk from mercury
exposure to residents of Wujiazhan town on the Di’er Songhua river, Northeast
China. Environmental Geochemistry and Health, 28, 67–71.
218 Ping, L., Xinbin, F., Guangle Q., Lihai shang, G. L. (2009) Human hair mercury
levels in the Wanshan mercury mining area Guizhou province, China.
Environmental Geochemistry and Health 31, 683-691.