Embed Size (px)
Citation preview
A
pma1©
K
1
ohteibm
hpowptLieam
0d
Journal of Pharmaceutical and Biomedical Analysis 44 (2007) 1187–1191
Short communication
Determination of hydrochlorothiazide in human plasma by liquidchromatography/tandem mass spectrometry
Fei Liu a, Yu Xu a,∗, Shu Gao b, Jundong zhang b, Qingxiang Guo a,∗a Department of Chemistry, University of Science and Technology of China, Hefei 230026, China
b Hefei Con-source Medicine Technology Corporation, Hefei 230088, China
Received 2 March 2007; received in revised form 9 April 2007; accepted 13 April 2007Available online 24 April 2007
bstract
In this study, a fast and sensitive liquid chromatography/tandem mass spectrometry method for determination of hydrochlorothiazide in human
lasma was developed and validated. The analyte and irbesartan, used as the internal standard, were precipitated and extracted from plasma usingethanol. Analysis was performed on a Phenomenex Kromasil C8 column with water and methanol (27:73, v/v) as the mobile phase. Linearity wasssessed from 0.78 to 200 ng/mL in plasma. The analytical method proved to be applicable in a pharmacokinetic study after oral administration of2 mg hydrochlorothiazide tablets to 20 healthy volunteers.
aiei
2
2
fjwpffpM
2007 Elsevier B.V. All rights reserved.
eywords: Hydrochlorothiazide; Liquid chromatography; Mass spectrometry
. Introduction
Hydrochlorothiazide, 6-chloro-3,4-dihydro-2H-1,2,4-benz-thiadiazine-7-sulfonamide -1,1-dioxide, is a diuretic and anti-ypertensive agent that reduces plasma volume by increasinghe excretion of sodium, chloride and water and, to a lesserxtend, that of potassium ion as well [1–3]. It was often usedn combination with other antihypertensive drugs such as betalockers, angiotensin-converting enzyme (ACE) inhibitors, orore recently, angiotensin II receptor blockers (ARBs) [4–10].Numerous publications described the determination of
ydrochlorothiazide concentration in plasma or urine by high-erformance liquid chromatography (HPLC) with ultravioletr electrochemical detection [10–18]. However, most of themere time consuming or not sufficiently sensitive. The cou-ling of HPLC and mass spectrometry has provided a usefulechnique for drug bioanalysis. Takubo et al. [19] reported aC/MS/MS method for the determination of hydrochloroth-
azide in rat plasma over the range 4 ∼ 1000 ng/mL. Vonapartit al. [1] employed solid-phase extraction while Fang et al. [20]
nd Ramakrishna et al. [4] used liquid–liquid extraction whichade the operation more complex.∗ Corresponding authors Tel.: +86 551 360 0659; fax: +86 551 360 6689.E-mail addresses: [email protected] (Y. Xu), [email protected] (Q. Guo).
f
2
t
731-7085/$ – see front matter © 2007 Elsevier B.V. All rights reserved.oi:10.1016/j.jpba.2007.04.020
The purpose of present study is to develop a fast and sensitivenalytical method for the quantification of hydrochlorothiaziden human plasma. The proposed method used a relatively simplextraction procedure using methanol directly precipitate proteinn combination with LC/MS/MS detection.
. Experimental
.1. Chemicals
Hydrochlorothiazide was purchased from National Instituteor the Control of Pharmaceutical and Biological Products (Bei-ing, China). The internal standard (IS), irbesartan (99% purity),as supplied by Jiangsu Wangao Pharmaceutical Limited Com-any (Haimen, China). Methanol (HPLC-grade) was obtainedrom Merck (Darmstadt, Germany). Distilled water, preparedrom demineralized water, was used throughout the study. Blanklasma was provided by The First Affiliated Hospital of Anhuiedical University (Hefei, China), and it was pooled from 20
asted subjects.
.2. Instrumentation
The LC/MS/MS system was comprised of a TSQ Quan-um Ultra AM triple-quadrupole mass spectrometer (Thermo
1 nd Bi
FsawU
2
mU(mwditf(te4uomiwsTmtwf
2
prahc2
cms
2
s(afv1i
2
do
wbbs
tpcetisb
pabss
slfs
a1twaspafo
3
3
ot[(m2
188 F. Liu et al. / Journal of Pharmaceutical a
innigan, USA), coupled with an electrospray ionization (ESI)ource, a Finnigan Surveyor LC pump and a Finnigan Surveyorutosampler. Instrument control, data acquisition and processingere performed with Xcalibur 1.4 software (ThermoFinnigan,SA).
.3. LC/MS/MS conditions
Hydrochlorothiazide was analyzed by a Phenomenex Kro-asil C8 (250 mm × 4.6 mm i.d., 5 �m) column (Phenomenex,SA), which was protected by a SecurityGuard C18, 5 �m
4 mm × 3.0 mm i.d.) guard column (Phenomenex, USA). Theobile phase was a mixture of water and methanol (27:73, v/v),hich was pumped at a flow rate of 1.0 mL/min. A post-columnivert valve was used to direct HPLC eluate to a waste containern the first 2 min of the chromatographic run and afterwardso the ionization source. Mass spectrometric detection was per-ormed in negative ion mode, using selected reaction monitoringSRM). The signal of hydrochlorothiazide was optimized on theotal ion current in MS mode, producing the following param-ters: capillary temperature of 320 ◦C, electrospray voltage of.0 kV, sheath gas and auxiliary gas at the pressures (arbitrarynits) of 42 and 7, respectively. At the same time, the selectionf ions and the collision-induced dissociation (CID) was opti-ized. In MS/MS mode, the deprotonated precursor molecular
ons of hydrochlorothiazide (m/z 295.9) and the IS (m/z 426.9)ere chosen and fragmentized by argon with a collision gas pres-
ure of 0.9 mTorr at a collision energy of 25 eV in both cases.he product ion of [M − H]− ions were acquired in the SRMode at m/z 204.9 for hydrochlorothiazide and m/z 192.9 for IS,
hey were selected for quantification. The scan width for SRMas m/z 0.1, and scan time was 0.5 s. The peak width settings
or both Q1 and Q3 were 0.7 u.
.4. Preparation of standards and quality control samples
Stock solutions of hydrochlorothiazide and irbesartan wererepared in methanol at a concentration of 500 and 400 �g/mL,espectively. It was further diluted to spike the standardsnd Quality control (QC) samples. Calibration curves forydrochlorothiazide were prepared by spiking blank plasma atoncentrations of 0.78, 1.56, 3.12, 6.25, 12.5, 25, 50, 100 and00 ng/mL.
QC samples were prepared by spiking blank plasma at con-entrations of 1.56, 12.5 and 100 ng/mL, representing low,edium and high concentration QC samples, respectively. QC
amples were prepared independent of the standards.
.5. Sample extraction procedure
QC samples, calibration standards and unknown plasmaamples were all extracted as follows: 10 �L of IS solution40 ng/mL irbesartan in methanol) was spiked to a 100 �Lliquot of plasma sample. The sample mixture was vortex-mixed
or 30 s. Then 300 �L methanol was added to the mixture andortex-mixed for 2 min. After centrifugation at 13,400 × g for0 min to remove precipitate, 20 �L aliquot of supernatant wasnjected into the LC/MS/MS system for analysis.CKs
omedical Analysis 44 (2007) 1187–1191
.6. Assay validation
The validation was carried out according to the recommen-ations and definitions provided by the “Guidance for Industryn Bioanalytical Method Validation” (FDA, USA) [21].
For the calibration standards, peak area ratios (the analyte/IS)ere plotted against nominal plasma concentrations, and fittedy weighted (1/x2) least-squares linear regression. Plasma cali-ration curves were prepared and assayed in triplicate on threeeparate days.
Accuracy and precision were assessed in conjunction withhe linearity studies by determining QC samples using quintu-licate (n = 5) preparations of spiked plasma samples at threeoncentration levels on three separate days. The accuracy wasxpressed by (mean observed concentration − spiked concentra-ion)/(spiked concentration) × 100%, the precision was assessedn terms of the relative standard deviation (R.S.D.) of the mea-ured concentrations. The acceptable criterion was 15% oretter.
The recoveries of hydrochlorothiazide from the extractionrocedure were evaluated by a comparison of the mean peakreas of QC samples at three levels to that of samples preparedy spiking extracted drug-free plasma (spike-after-extraction)amples with the same amounts of hydrochlorothiazide at thetep immediately prior to chromatography.
Owing to the components of the sample matrix, signaluppression or enhancement may occur. Matrix effect was calcu-ated by comparing peak areas of hydrochlorothiazide obtainedrom the spike-after-extraction samples with those from puretandard solutions at the same concentrations.
Hydrochlorothiazide stability in plasma was assessed bynalyzing QC samples at concentrations of 1.56, 12.5 and00 ng/mL, respectively, in triplicate (n = 3), after exposureo different conditions of time and temperature. The resultsere compared with those for freshly prepared QC samples,
nd the percentage concentration deviation was calculated. Forhort-term stability, the plasma samples were kept at room tem-erature (20 ◦C) for 4 h and 12 h. The stability was also evaluatedfter storage of the plasma samples at −20 ◦C for 7days. Thereeze/thaw stability was obtained after three freeze/thaw cyclesn consecutive days.
. Results and discussion
.1. LC/MS/MS conditions
Hydrochlorothiazide has several polar groups; the presencef amido-group makes it very easy to produce good mass spec-rometric responses in negative ionization mode. The CID of theM − H]− ion of hydrochlorothiazide (m/z 295.9) and irbesartanm/z 426.9) produced an abundant product ion at m/z 204.9 and/z 192.9, respectively. The optimum collision energy was both5 eV.
To optimize the LC system, several columns were tried: C18,N, Phenyl and C8 columns. Of all the columns, Phenomenexromasil C8 column could yield suitable retention, the best peak
hape and signal-to-noise ratio leading to a lower detection limit.
nd Bi
Iccwm
Fhia
3
F. Liu et al. / Journal of Pharmaceutical a
n order to achieve maximum peak responses and symmetrical
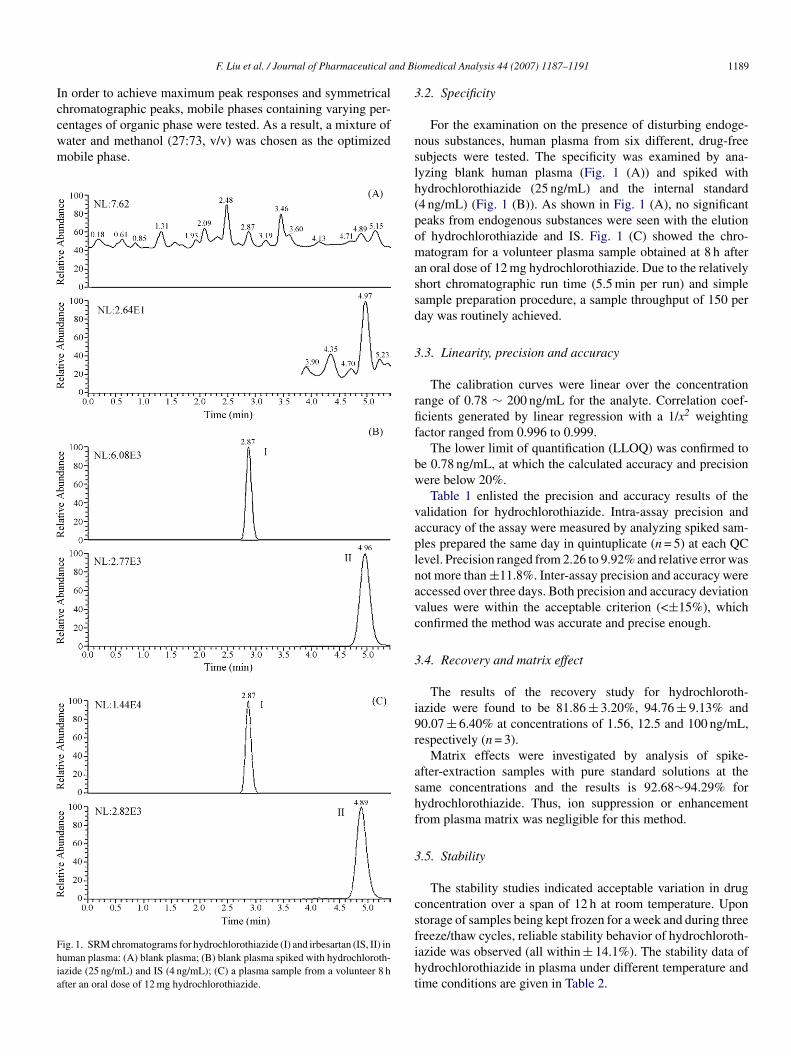
hromatographic peaks, mobile phases containing varying per-entages of organic phase were tested. As a result, a mixture ofater and methanol (27:73, v/v) was chosen as the optimizedobile phase.ig. 1. SRM chromatograms for hydrochlorothiazide (I) and irbesartan (IS, II) inuman plasma: (A) blank plasma; (B) blank plasma spiked with hydrochloroth-azide (25 ng/mL) and IS (4 ng/mL); (C) a plasma sample from a volunteer 8 hfter an oral dose of 12 mg hydrochlorothiazide.
nslh(pomassd
3
rfif
bw
vaplnavc
3
i9r
ashf
3
csfiht
omedical Analysis 44 (2007) 1187–1191 1189
.2. Specificity
For the examination on the presence of disturbing endoge-ous substances, human plasma from six different, drug-freeubjects were tested. The specificity was examined by ana-yzing blank human plasma (Fig. 1 (A)) and spiked withydrochlorothiazide (25 ng/mL) and the internal standard4 ng/mL) (Fig. 1 (B)). As shown in Fig. 1 (A), no significanteaks from endogenous substances were seen with the elutionf hydrochlorothiazide and IS. Fig. 1 (C) showed the chro-atogram for a volunteer plasma sample obtained at 8 h after
n oral dose of 12 mg hydrochlorothiazide. Due to the relativelyhort chromatographic run time (5.5 min per run) and simpleample preparation procedure, a sample throughput of 150 peray was routinely achieved.
.3. Linearity, precision and accuracy
The calibration curves were linear over the concentrationange of 0.78 ∼ 200 ng/mL for the analyte. Correlation coef-cients generated by linear regression with a 1/x2 weightingactor ranged from 0.996 to 0.999.
The lower limit of quantification (LLOQ) was confirmed toe 0.78 ng/mL, at which the calculated accuracy and precisionere below 20%.Table 1 enlisted the precision and accuracy results of the
alidation for hydrochlorothiazide. Intra-assay precision andccuracy of the assay were measured by analyzing spiked sam-les prepared the same day in quintuplicate (n = 5) at each QCevel. Precision ranged from 2.26 to 9.92% and relative error wasot more than ±11.8%. Inter-assay precision and accuracy wereccessed over three days. Both precision and accuracy deviationalues were within the acceptable criterion (<±15%), whichonfirmed the method was accurate and precise enough.
.4. Recovery and matrix effect
The results of the recovery study for hydrochloroth-azide were found to be 81.86 ± 3.20%, 94.76 ± 9.13% and0.07 ± 6.40% at concentrations of 1.56, 12.5 and 100 ng/mL,espectively (n = 3).
Matrix effects were investigated by analysis of spike-fter-extraction samples with pure standard solutions at theame concentrations and the results is 92.68∼94.29% forydrochlorothiazide. Thus, ion suppression or enhancementrom plasma matrix was negligible for this method.
.5. Stability
The stability studies indicated acceptable variation in drugoncentration over a span of 12 h at room temperature. Upon
torage of samples being kept frozen for a week and during threereeze/thaw cycles, reliable stability behavior of hydrochloroth-azide was observed (all within ± 14.1%). The stability data ofydrochlorothiazide in plasma under different temperature andime conditions are given in Table 2.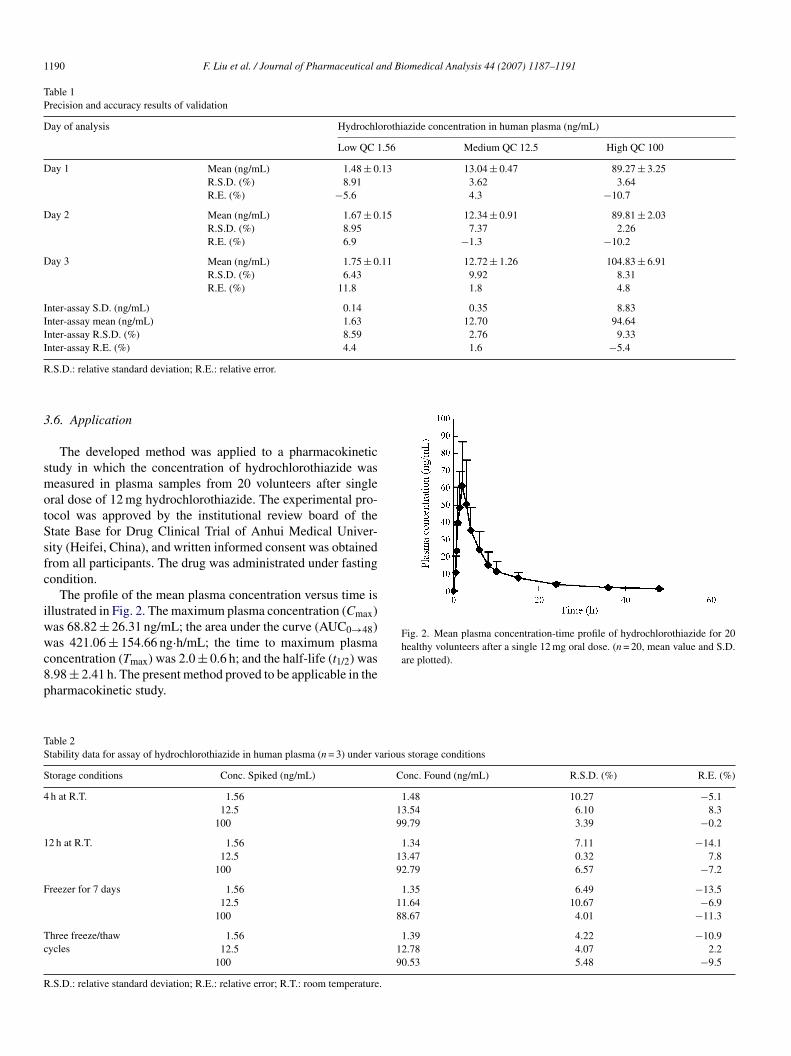
1190 F. Liu et al. / Journal of Pharmaceutical and Biomedical Analysis 44 (2007) 1187–1191
Table 1Precision and accuracy results of validation
Day of analysis Hydrochlorothiazide concentration in human plasma (ng/mL)
Low QC 1.56 Medium QC 12.5 High QC 100
Day 1 Mean (ng/mL) 1.48 ± 0.13 13.04 ± 0.47 89.27 ± 3.25R.S.D. (%) 8.91 3.62 3.64R.E. (%) −5.6 4.3 −10.7
Day 2 Mean (ng/mL) 1.67 ± 0.15 12.34 ± 0.91 89.81 ± 2.03R.S.D. (%) 8.95 7.37 2.26R.E. (%) 6.9 −1.3 −10.2
Day 3 Mean (ng/mL) 1.75 ± 0.11 12.72 ± 1.26 104.83 ± 6.91R.S.D. (%) 6.43 9.92 8.31R.E. (%) 11.8 1.8 4.8
Inter-assay S.D. (ng/mL) 0.14 0.35 8.83Inter-assay mean (ng/mL) 1.63 12.70 94.64Inter-assay R.S.D. (%) 8.59 2.76 9.33Inter-assay R.E. (%) 4.4 1.6 −5.4
R
3
smotSsfc
iwwc8p
Fig. 2. Mean plasma concentration-time profile of hydrochlorothiazide for 20healthy volunteers after a single 12 mg oral dose. (n = 20, mean value and S.D.
TS
S
4
1
F
Tc
R
.S.D.: relative standard deviation; R.E.: relative error.
.6. Application
The developed method was applied to a pharmacokinetictudy in which the concentration of hydrochlorothiazide waseasured in plasma samples from 20 volunteers after single
ral dose of 12 mg hydrochlorothiazide. The experimental pro-ocol was approved by the institutional review board of thetate Base for Drug Clinical Trial of Anhui Medical Univer-ity (Heifei, China), and written informed consent was obtainedrom all participants. The drug was administrated under fastingondition.
The profile of the mean plasma concentration versus time isllustrated in Fig. 2. The maximum plasma concentration (Cmax)as 68.82 ± 26.31 ng/mL; the area under the curve (AUC0→48)as 421.06 ± 154.66 ng·h/mL; the time to maximum plasma
oncentration (Tmax) was 2.0 ± 0.6 h; and the half-life (t1/2) was.98 ± 2.41 h. The present method proved to be applicable in theharmacokinetic study.
are plotted).
able 2tability data for assay of hydrochlorothiazide in human plasma (n = 3) under various storage conditions
torage conditions Conc. Spiked (ng/mL) Conc. Found (ng/mL) R.S.D. (%) R.E. (%)
h at R.T. 1.56 1.48 10.27 −5.112.5 13.54 6.10 8.3
100 99.79 3.39 −0.2
2 h at R.T. 1.56 1.34 7.11 −14.112.5 13.47 0.32 7.8
100 92.79 6.57 −7.2
reezer for 7 days 1.56 1.35 6.49 −13.512.5 11.64 10.67 −6.9
100 88.67 4.01 −11.3
hree freeze/thawycles
1.56 1.39 4.22 −10.912.5 12.78 4.07 2.2
100 90.53 5.48 −9.5
.S.D.: relative standard deviation; R.E.: relative error; R.T.: room temperature.
nd Bi
4
qsco
A
2f
R
[
[[
[
[[[
[
[
[
F. Liu et al. / Journal of Pharmaceutical a
. Conclusion
We have described a simple, rapid LC/MS/MS assay for theuantification of hydrochlorothiazide in human plasma, whichhowed acceptable precision and adequate sensitivity. Hence, itan be easily adopted for the high-throughput routine bioanalysisf hydrochlorothiazide.
cknowledgements
The authors gratefully acknowledge the NSFC (No.0332020) and University of Science and Technology of Chinaor financial support.
eferences
[1] A. Vonaparti, M. Kazanis, I. Panderi, J. Mass Spectrom. 41 (2006) 593–605.
[2] K.H. Rahn, Clin. Exp. Hypertens. A 5 (1983) 157–166.[3] R.B. Patel, U.R. Patel, M.C. Rogge, V.P. Shah, V.K. Prasad, A. Selen, P.G.
Welling, J. Pharm. Sci. 73 (1984) 359–361.[4] N.V.S. Ramakrishna, K.N. Vishwottam, S. Manoj, M. Koteshwara, S.
Wishu, D.P. Varma, Biomed. Chromatogr. 19 (2005) 751–760.[5] K. Wellington, D.M. Faulds, Drugs 62 (2002) 1983–2005.[6] M.J. Crespo, W.C. De Mello, Eur. J. Pharmacol. 420 (2001) 133–141.
[
[
omedical Analysis 44 (2007) 1187–1191 1191
[7] I.E. Chazova, L.G. Ratova, V.V. Dmitriev, V.E. Sinitsin, O.V. Stukalova,Kardiologiya 43 (2003) 60–65.
[8] B. Martina, T. Dieterle, M. Weinbacher, E. Battegay, Cardiology 92 (1999)110–114.
[9] S.J. Middlemost, R. Tager, J. Davis, P. Sareli, Am. J. Cardiol. 73 (1994)1092–1097.
10] T.M. Huang, Z. He, B. Yang, L.P. Shao, X.W. Zheng, G.L. Duan, J. Pharm.Biomed. Anal. 41 (2006) 644–648.
11] R.B. Miller, C. Amestoy, J. Pharm. Biomed. Anal. 10 (1992) 541–545.12] I. Niopas, A.C. Daftsios, J. Liq. Chromatogr. Relat. Technol. 25 (2002)
487–494.13] A. Medvedovici, C. Mircioiu, V. David, D.S. Miron, Eur. J. Drug Metabol.
Pharmacokinet. 25 (2000) 91–96.14] K. Richter, R. Oertel, W. Kirch, J. Chromatogr. A 729 (1996) 293–296.15] C.T. Azumaya, J. Chromatogr. Biomed. Appl. 532 (1990) 168–174.16] B.S. Kuo, A. Mandagere, D.R. Osborne, K.K. Hwang, Pharm. Res. 7 (1990)
1257–1261.17] D. Farthing, I. Fakhry, E.B.D. Ripley, D. Sica, J. Pharm. Biomed. Anal. 17
(1998) 1455–1459.18] D. Zendelovska, T. Stafilov, P. Milosevski, Biomed. Chromatogr. 18 (2004)
71–76.19] T. Takubo, H. Okada, M. Ishii, K. Hara, Y. Ishii, J. Chromatogr. B 806
(2004) 199–203.
20] W. Fang, W. Xie, J.Y.K. Hsieh, B.K. Matuszewski, J. Liq. Chromatogr.Relat. Technol. 28 (2005) 2681–2703.21] U.S. Department of Health and Human Services, Food and Drug Adminis-
tration, Guidance for Industry on Bioanalytical Method Validation, FederalRegister, 2001.