Embed Size (px)
Citation preview
American Journal of Applied Chemistry 2015; 3(3): 83-92 Published online April 23, 2015 (http://www.sciencepublishinggroup.com/j/ajac) doi: 10.11648/j.ajac.20150303.11 ISSN: 2330-8753 (Print); ISSN: 2330-8745 (Online)
Determination of Heavy Metals and Trace Element Levels in Honey Samples From Different Regions of Iraq and Compared with Other Kind
Saadiyah Ahmed Dhahir, Ameera Hassan Hemed
Department of chemistry, College of science for women, University of Baghdad, Baghdad, Iraq
Email address: [email protected](S. A. Dhahir), [email protected] (A. H. Hemed)
To cite this article: Saadiyah Ahmed Dhahir, Ameera Hassan Hemed. Determination of Heavy Metals and Trace Element Levels in Honey Samples From Different Regions of Iraq and Compared with Other Kind. American Journal of Applied Chemistry. Vol. 3, No. 3, 2015, pp. 83-92. doi: 10.11648/j.ajac.20150303.11
Abstract: The aim of study quantitative analysis of toxic heavy metals Cd, Pb, Ni , AS, V and trace element Fe, Mg, Se ,Cu, Mn, K, Na, Cain different kinds of Iraqi honey of bee and compare with other types. elements were determined by FAAS and GFAAS method. Because of the nutritional value and high medical honey for humans so it was necessary to appoint metals of great importance. High concentration of essential metals and Heavy metals can be toxic both to man and animals. The results indicated that the Seand K elements recorded at high concentrations (0.0384-712.8)mg/kg respectively while the Cu element recorded the low concentration(0.1) mg/kg in all kind of honey samples. The contents of heavy and trace metals in honey samples were found to be between (0.100-0.730)mg/kg for Pd,( 0.108-0. 8200)mg/kg for Cd, (0.210-0.894)mg/kg for Ni,(0.117-0.440) mg/kg for Fe,(0.0024-0.0348) mg/kg for Se, (0.260-0.721)mg/kg for Mg ,Cu<0.1, (140.8-240.8) mg/kg for Ca,(51.0-120.8) mg/kg for Na,(93.80-712.8) mg/kg for K,(0.0116-0.0708) mg/kg for Mn,(0.0091-0.086) mg/kg for V, for As (0.0104-0.035) mg/kg.
Keywords: Determination, Honey, Heavy Metals, Trace Element, Iraq
1. Introduction
Honey is a natural substance produced by bees and is a nutritious food of economic Importance worldwide. Honey is a sweet and viscous fluid created by honeybees from the nectar of flowers. It is important to note that honey created by insects other than honeybees has very different properties .Interestingly, honey has been cited in the Quran, a Holy book for Muslims (Section 16 surat 68-69), in reference to its medicinal properties (1,2)
The oldest known written document is a 4000 year old Sumerian clay tablet that records remedies for different illnesses by using natural product (4). Beekeeping for the purpose of obtaining honey is an ancient art, at least as early as the Egyptians (2000 – 5000 years ago) who used honey in medicine, in embalming, and for food (3).
Honey is at most composed of a complex mixture of carbohydrates and other minor substances, such as organic acids, amino acids, proteins, minerals, and vitamins. In roughly all honey types, fructose predominates glucose being
the second main sugar (4). Honey can be characterized according to its geographical
source. Many scientists reported territorial difference in the physicochemical properties of the honey samples, such as the enzymes activities, ash contents, hydroxymethylfurfural (HMF), pH and electrical conductivity , The quality of honey is judged by the vegetable or floral origin and chemical composition, and price of honey is based on its quality and, hence, its floral (5).
Honey is defending as a biological indicator of environmental quality and floral biodiversity. It is intrinsically connected to the territory in which it is produced and it is closely tied to the flora visited from the bees for its production. Pollen grains from the flowers visited by bees collecting nectar occur naturally in honey, as well as trace elements that the plants receive from the ground, water and air (6 - 8).
The mineral content in honey is dependent on the natural absorption of minerals by plants from the soil and the environment Usually, the mineral content of honey contributes to the color of the honey, which may vary from
84 Saadiyah Ahmed Dhahir and Ameera Hassan Hemed: Determination of Heavy Metals and Trace Element Levels in Honey Samples from Different Regions of Iraq and Compared with Other Kind
light to dark, In fact, mineral concentration in honey was found to be correlated with geographic and floral origins, geochemical soil composition and local pollution (9, 10)
Honey has a rather low mineral content (typically 0.1–0.2% in floral honey and 1% or higher inmellatehoney) that varies widely depending on the particular botanical origin, pedoclimatic conditions and extraction technique. The dominant element in honey is potassium, followed by chlorine, sulphur, sodium, phosphorus, magnesium, silicon, iron and copper(11).
The major mineral elements present in honey are K, P, Mg, Al, Ca, Na, Fe, Mn, Cu, Zn, Cl,S and Si. some elements such as Pb, Cr, I, Mo, Co, Hg, Sb, Ni, Cd etc. may also occur naturally or because of contamination by environmental sources(12).
Trace elements play an important and vital role in metabolism, health and disease. Their presence in human food is very important, but if they exceed their safety levels, they well be toxic(13).
From the nutritional point of view chromium, manganese and selenium are important, especially for 1 to 15 years old children. The elements sulphur, boron, cobalt, fluoride, iodide, molybdenum and silicon can be important in human nutrition too (14)
This small quantities of toxic heavy metals in honey bee comes on for most of the bees or food contamination area in which they live, where contaminated bees that fly long distances also for tools that are used in the process of storage may be contaminated the concentration of microelements can cause toxic danger, including heavy metals in nutritional products. Heavy metals are dangerous through: in the first place, in the processing of food the metals doesn’t decompose, on the contrary their concentration referred to the mass unit increases. Secondly, the metals posses the feature to accumulate in the human organism, in this way they are slowing or even blocking the intracellular biochemical processes. Thirdly, the majority of the metals possess cancerigen and mutagen proprieties. Once they are assimilated is very difficult to remove them from the human organism (15 - 18)
2. Materials and Methods
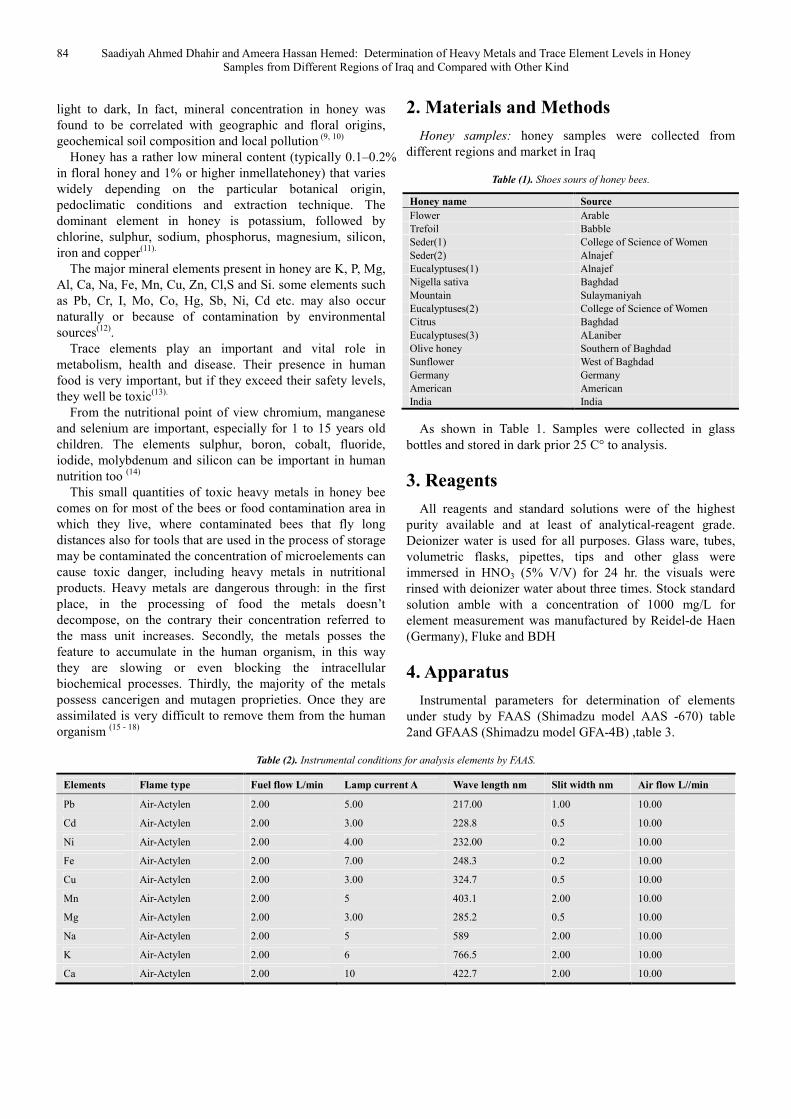
Honey samples: honey samples were collected from different regions and market in Iraq
Table (1). Shoes sours of honey bees.
Honey name Source
Flower Arable Trefoil Babble Seder(1) College of Science of Women Seder(2) Alnajef Eucalyptuses(1) Alnajef Nigella sativa Baghdad Mountain Sulaymaniyah Eucalyptuses(2) College of Science of Women Citrus Baghdad Eucalyptuses(3) ALaniber Olive honey Southern of Baghdad Sunflower West of Baghdad Germany Germany American American India India
As shown in Table 1. Samples were collected in glass bottles and stored in dark prior 25 C° to analysis.
3. Reagents
All reagents and standard solutions were of the highest purity available and at least of analytical-reagent grade. Deionizer water is used for all purposes. Glass ware, tubes, volumetric flasks, pipettes, tips and other glass were immersed in HNO3 (5% V/V) for 24 hr. the visuals were rinsed with deionizer water about three times. Stock standard solution amble with a concentration of 1000 mg/L for element measurement was manufactured by Reidel-de Haen (Germany), Fluke and BDH
4. Apparatus
Instrumental parameters for determination of elements under study by FAАS (Shimadzu model AAS -670) table 2and GFAAS (Shimadzu model GFA-4B) ,table 3.
Table (2). Instrumental conditions for analysis elements by FAAS.
Elements Flame type Fuel flow L/min Lamp current A Wave length nm Slit width nm Air flow L//min
Pb Air-Actylen 2.00 5.00 217.00 1.00 10.00
Cd Air-Actylen 2.00 3.00 228.8 0.5 10.00
Ni Air-Actylen 2.00 4.00 232.00 0.2 10.00
Fe Air-Actylen 2.00 7.00 248.3 0.2 10.00
Cu Air-Actylen 2.00 3.00 324.7 0.5 10.00
Mn Air-Actylen 2.00 5 403.1 2.00 10.00
Mg Air-Actylen 2.00 3.00 285.2 0.5 10.00
Na Air-Actylen 2.00 5 589 2.00 10.00
K Air-Actylen 2.00 6 766.5 2.00 10.00
Ca Air-Actylen 2.00 10 422.7 2.00 10.00
American Journal of Applied Chemistry 2015; 3(3): 83-92 85
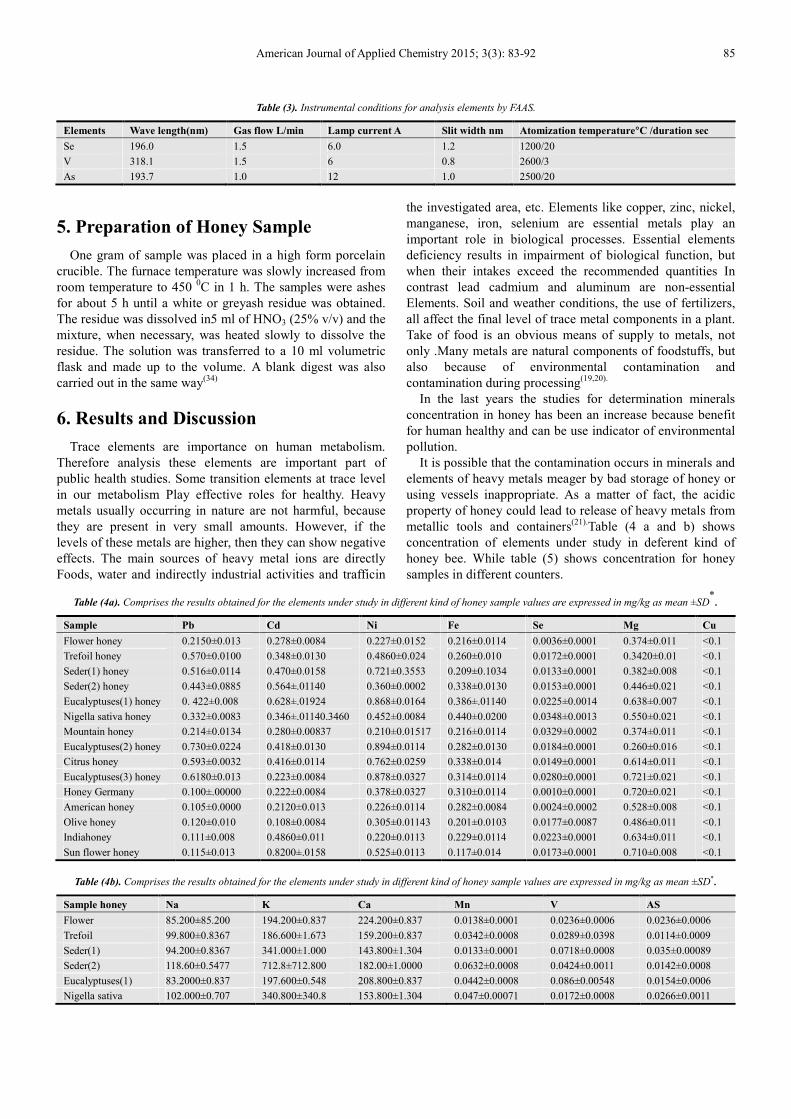
Table (3). Instrumental conditions for analysis elements by FAAS.
Elements Wave length(nm) Gas flow L/min Lamp current A Slit width nm Atomization temperature°C /duration sec
Se 196.0 1.5 6.0 1.2 1200/20
V 318.1 1.5 6 0.8 2600/3
As 193.7 1.0 12 1.0 2500/20
5. Preparation of Honey Sample
One gram of sample was placed in a high form porcelain crucible. The furnace temperature was slowly increased from room temperature to 450 0C in 1 h. The samples were ashes for about 5 h until a white or greyash residue was obtained. The residue was dissolved in5 ml of HNO3 (25% v/v) and the mixture, when necessary, was heated slowly to dissolve the residue. The solution was transferred to a 10 ml volumetric flask and made up to the volume. A blank digest was also carried out in the same way(34)
6. Results and Discussion
Trace elements are importance on human metabolism. Therefore analysis these elements are important part of public health studies. Some transition elements at trace level in our metabolism Play effective roles for healthy. Heavy metals usually occurring in nature are not harmful, because they are present in very small amounts. However, if the levels of these metals are higher, then they can show negative effects. The main sources of heavy metal ions are directly Foods, water and indirectly industrial activities and trafficin
the investigated area, etc. Elements like copper, zinc, nickel, manganese, iron, selenium are essential metals play an important role in biological processes. Essential elements deficiency results in impairment of biological function, but when their intakes exceed the recommended quantities In contrast lead cadmium and aluminum are non-essential Elements. Soil and weather conditions, the use of fertilizers, all affect the final level of trace metal components in a plant. Take of food is an obvious means of supply to metals, not only .Many metals are natural components of foodstuffs, but also because of environmental contamination and contamination during processing(19,20).
In the last years the studies for determination minerals concentration in honey has been an increase because benefit for human healthy and can be use indicator of environmental pollution.
It is possible that the contamination occurs in minerals and elements of heavy metals meager by bad storage of honey or using vessels inappropriate. As a matter of fact, the acidic property of honey could lead to release of heavy metals from metallic tools and containers(21).Table (4 a and b) shows concentration of elements under study in deferent kind of honey bee. While table (5) shows concentration for honey samples in different counters.
Table (4a). Comprises the results obtained for the elements under study in different kind of honey sample values are expressed in mg/kg as mean ±SD*.
Sample Pb Cd Ni Fe Se Mg Cu
Flower honey 0.2150±0.013 0.278±0.0084 0.227±0.0152 0.216±0.0114 0.0036±0.0001 0.374±0.011 <0.1
Trefoil honey 0.570±0.0100 0.348±0.0130 0.4860±0.024 0.260±0.010 0.0172±0.0001 0.3420±0.01 <0.1
Seder(1) honey 0.516±0.0114 0.470±0.0158 0.721±0.3553 0.209±0.1034 0.0133±0.0001 0.382±0.008 <0.1
Seder(2) honey 0.443±0.0885 0.564±.01140 0.360±0.0002 0.338±0.0130 0.0153±0.0001 0.446±0.021 <0.1
Eucalyptuses(1) honey 0. 422±0.008 0.628±.01924 0.868±0.0164 0.386±.01140 0.0225±0.0014 0.638±0.007 <0.1
Nigella sativa honey 0.332±0.0083 0.346±.01140.3460 0.452±0.0084 0.440±0.0200 0.0348±0.0013 0.550±0.021 <0.1
Mountain honey 0.214±0.0134 0.280±0.00837 0.210±0.01517 0.216±0.0114 0.0329±0.0002 0.374±0.011 <0.1
Eucalyptuses(2) honey 0.730±0.0224 0.418±0.0130 0.894±0.0114 0.282±0.0130 0.0184±0.0001 0.260±0.016 <0.1
Citrus honey 0.593±0.0032 0.416±0.0114 0.762±0.0259 0.338±0.014 0.0149±0.0001 0.614±0.011 <0.1
Eucalyptuses(3) honey 0.6180±0.013 0.223±0.0084 0.878±0.0327 0.314±0.0114 0.0280±0.0001 0.721±0.021 <0.1
Honey Germany 0.100±.00000 0.222±0.0084 0.378±0.0327 0.310±0.0114 0.0010±0.0001 0.720±0.021 <0.1
American honey 0.105±0.0000 0.2120±0.013 0.226±0.0114 0.282±0.0084 0.0024±0.0002 0.528±0.008 <0.1
Olive honey 0.120±0.010 0.108±0.0084 0.305±0.01143 0.201±0.0103 0.0177±0.0087 0.486±0.011 <0.1
Indiahoney 0.111±0.008 0.4860±0.011 0.220±0.0113 0.229±0.0114 0.0223±0.0001 0.634±0.011 <0.1
Sun flower honey 0.115±0.013 0.8200±.0158 0.525±0.0113 0.117±0.014 0.0173±0.0001 0.710±0.008 <0.1
Table (4b). Comprises the results obtained for the elements under study in different kind of honey sample values are expressed in mg/kg as mean ±SD*.
Sample honey Na K Ca Mn V AS
Flower 85.200±85.200 194.200±0.837 224.200±0.837 0.0138±0.0001 0.0236±0.0006 0.0236±0.0006
Trefoil 99.800±0.8367 186.600±1.673 159.200±0.837 0.0342±0.0008 0.0289±0.0398 0.0114±0.0009
Seder(1) 94.200±0.8367 341.000±1.000 143.800±1.304 0.0133±0.0001 0.0718±0.0008 0.035±0.00089
Seder(2) 118.60±0.5477 712.8±712.800 182.00±1.0000 0.0632±0.0008 0.0424±0.0011 0.0142±0.0008
Eucalyptuses(1) 83.2000±0.837 197.600±0.548 208.800±0.837 0.0442±0.0008 0.086±0.00548 0.0154±0.0006
Nigella sativa 102.000±0.707 340.800±340.8 153.800±1.304 0.047±0.00071 0.0172±0.0008 0.0266±0.0011
86 Saadiyah Ahmed Dhahir and Ameera Hassan Hemed: Determination of Heavy Metals and Trace Element Levels in Honey Samples from Different Regions of Iraq and Compared with Other Kind
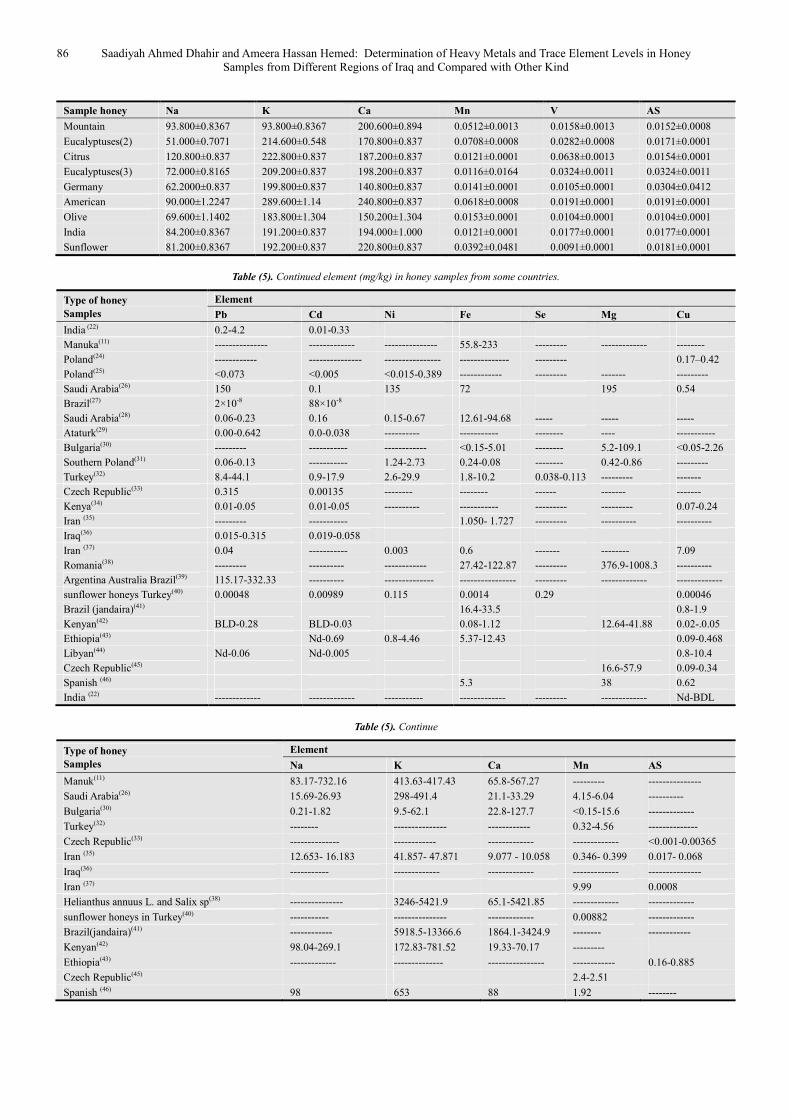
Sample honey Na K Ca Mn V AS
Mountain 93.800±0.8367 93.800±0.8367 200.600±0.894 0.0512±0.0013 0.0158±0.0013 0.0152±0.0008
Eucalyptuses(2) 51.000±0.7071 214.600±0.548 170.800±0.837 0.0708±0.0008 0.0282±0.0008 0.0171±0.0001
Citrus 120.800±0.837 222.800±0.837 187.200±0.837 0.0121±0.0001 0.0638±0.0013 0.0154±0.0001
Eucalyptuses(3) 72.000±0.8165 209.200±0.837 198.200±0.837 0.0116±0.0164 0.0324±0.0011 0.0324±0.0011
Germany 62.2000±0.837 199.800±0.837 140.800±0.837 0.0141±0.0001 0.0105±0.0001 0.0304±0.0412
American 90.000±1.2247 289.600±1.14 240.800±0.837 0.0618±0.0008 0.0191±0.0001 0.0191±0.0001
Olive 69.600±1.1402 183.800±1.304 150.200±1.304 0.0153±0.0001 0.0104±0.0001 0.0104±0.0001
India 84.200±0.8367 191.200±0.837 194.000±1.000 0.0121±0.0001 0.0177±0.0001 0.0177±0.0001
Sunflower 81.200±0.8367 192.200±0.837 220.800±0.837 0.0392±0.0481 0.0091±0.0001 0.0181±0.0001
Table (5). Continued element (mg/kg) in honey samples from some countries.
Type of honey
Samples
Element
Pb Cd Ni Fe Se Mg Cu
India (22) 0.2-4.2 0.01-0.33
Manuka(11) --------------- ------------- --------------- 55.8-233 --------- ------------- --------
Poland(24) ------------ --------------- ---------------- -------------- --------- 0.17–0.42
Poland(25) <0.073 <0.005 <0.015-0.389 ------------ --------- ------- ---------
Saudi Arabia(26) 150 0.1 135 72 195 0.54
Brazil(27) 2×10⁻⁸ 88×10-8
Saudi Arabia(28) 0.06-0.23 0.16 0.15-0.67 12.61-94.68 ----- ----- -----
Ataturk(29) 0.00-0.642 0.0-0.038 ---------- ----------- -------- ---- -----------
Bulgaria(30) --------- ----------- ------------ <0.15-5.01 -------- 5.2-109.1 <0.05-2.26
Southern Poland(31) 0.06-0.13 ----------- 1.24-2.73 0.24-0.08 -------- 0.42-0.86 ---------
Turkey(32) 8.4-44.1 0.9-17.9 2.6-29.9 1.8-10.2 0.038-0.113 --------- -------
Czech Republic(33) 0.315 0.00135 -------- -------- ------ ------- -------
Kenya(34) 0.01-0.05 0.01-0.05 ---------- ----------- --------- --------- 0.07-0.24
Iran (35) --------- ----------- 1.050- 1.727 --------- ---------- ----------
Iraq(36) 0.015-0.315 0.019-0.058
Iran (37) 0.04 ----------- 0.003 0.6 ------- -------- 7.09
Romania(38) --------- ---------- ------------ 27.42-122.87 --------- 376.9-1008.3 ----------
Argentina Australia Brazil(39) 115.17-332.33 ---------- -------------- ---------------- --------- ------------- -------------
sunflower honeys Turkey(40) 0.00048 0.00989 0.115 0.0014 0.29 0.00046
Brazil (jandaira)(41) 16.4-33.5 0.8-1.9
Kenyan(42) BLD-0.28 BLD-0.03 0.08-1.12 12.64-41.88 0.02-.0.05
Ethiopia(43) Nd-0.69 0.8-4.46 5.37-12.43 0.09-0.468
Libyan(44) Nd-0.06 Nd-0.005 0.8-10.4
Czech Republic(45) 16.6-57.9 0.09-0.34
Spanish (46) 5.3 38 0.62
India (22) ------------- ------------- ----------- ------------- --------- ------------- Nd-BDL
Table (5). Continue
Type of honey
Samples
Element
Na K Ca Mn AS
Manuk(11) 83.17-732.16 413.63-417.43 65.8-567.27 --------- ---------------
Saudi Arabia(26) 15.69-26.93 298-491.4 21.1-33.29 4.15-6.04 ----------
Bulgaria(30) 0.21-1.82 9.5-62.1 22.8-127.7 <0.15-15.6 -------------
Turkey(32) -------- --------------- ------------ 0.32-4.56 --------------
Czech Republic(33) -------------- ------------ ------------- ------------- <0.001-0.00365
Iran (35) 12.653- 16.183 41.857- 47.871 9.077 - 10.058 0.346- 0.399 0.017- 0.068
Iraq(36) ----------- ------------- ------------- ------------- ---------------
Iran (37) 9.99 0.0008
Helianthus annuus L. and Salix sp(38) --------------- 3246-5421.9 65.1-5421.85 ------------- -------------
sunflower honeys in Turkey(40) ----------- --------------- ------------- 0.00882 -------------
Brazil(jandaira)(41) ------------ 5918.5-13366.6 1864.1-3424.9 -------- ------------
Kenyan(42) 98.04-269.1 172.83-781.52 19.33-70.17 ---------
Ethiopia(43) ------------- -------------- ---------------- ------------ 0.16-0.885
Czech Republic(45) 2.4-2.51
Spanish (46) 98 653 88 1.92 --------
American Journal of Applied Chemistry 2015; 3(3): 83-92 87
Lead and cadmium are known as toxic elements. Both
metals cause adverse health effects in humans, and their widespread presence in the human environment comes from anthropogenic activities (47). Lead and cadmium are industrial pollutants which have strong negative effect on human and animal health. These metals are accumulated in the organism, mainly in the liver and Kidneys. The exposure to toxic elements could be mineralized by regular control of food and feed and setting maximum levels for heavy metals in these products (48).
Lead is one of the most ubiquitous elements in the environment and is recognized as a major health risk to humans and animals. Lead is a serious cumulative body poison which enters our body system through air, water, and food. And acts as an enzyme inhibitor. Acute lead poisoning in humans causes severe damage in the kidneys, liver, brain, reproductive system and central nervous system, and even causes death. Mild lead poisoning causes anemia, headache and sore muscles and the victim may feel fatigued and irritable. Chronic exposure to lead causes nephritis, scaring and the shrinking of kidney tissues .It is emitted into the biosphere in considerable amounts, owing to its increased industrial use and its application as a fuel additive (49).
Cadmium belongs to those trace heavy metals that are of major interest in environmental protection due to its cumulative toxicity. Its natural occurrence in the environment is due to volcanic emissions. The main contamination sources of this element are anthropogenic: industry wastewaters, mining operations, waste incineration as well as the combustion of some coals and oils. Sludge-based fertilizers and phosphate fertilizers are important sources of cadmium in agricultural soils (50).Cadmium can also accumulate in kidney where it damages filtering and causes excretion of essential proteins sugar from the body, headache, chest pen, The weakness of the muscles ,pulmonary edema and death(51,52)
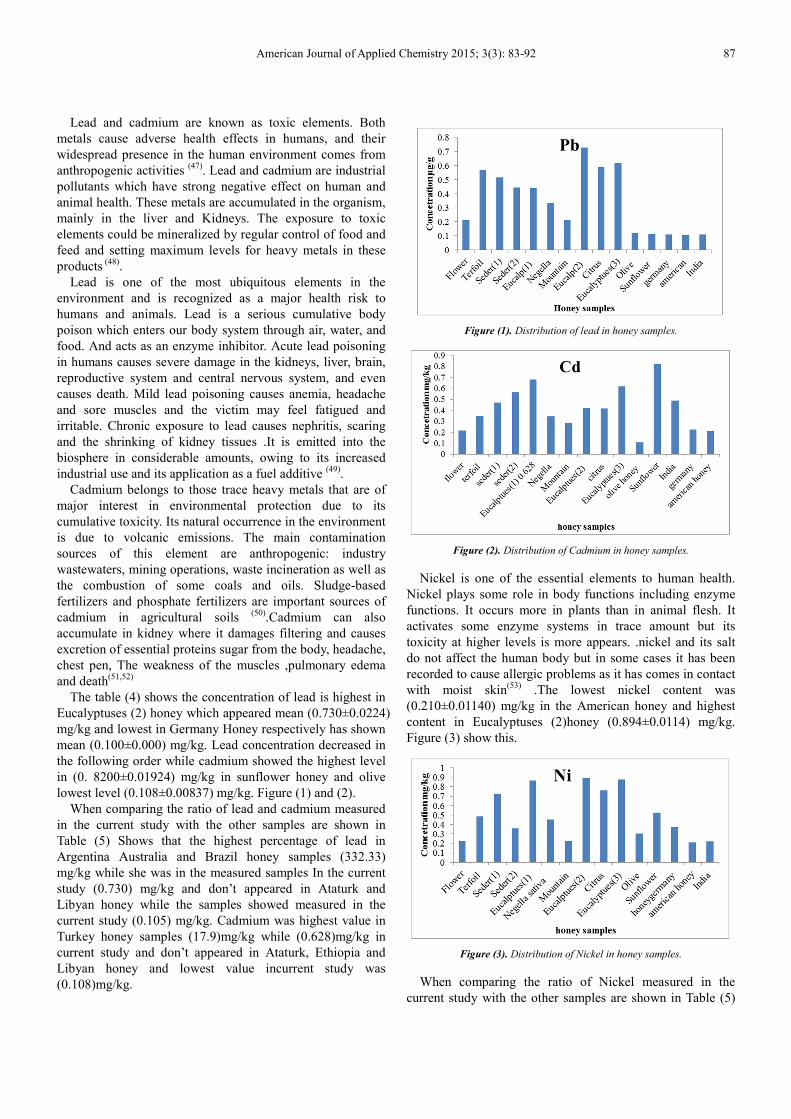
The table (4) shows the concentration of lead is highest in Eucalyptuses (2) honey which appeared mean (0.730±0.0224) mg/kg and lowest in Germany Honey respectively has shown mean (0.100±0.000) mg/kg. Lead concentration decreased in the following order while cadmium showed the highest level in (0. 8200±0.01924) mg/kg in sunflower honey and olive lowest level (0.108±0.00837) mg/kg. Figure (1) and (2).
When comparing the ratio of lead and cadmium measured in the current study with the other samples are shown in Table (5) Shows that the highest percentage of lead in Argentina Australia and Brazil honey samples (332.33) mg/kg while she was in the measured samples In the current study (0.730) mg/kg and don’t appeared in Ataturk and Libyan honey while the samples showed measured in the current study (0.105) mg/kg. Cadmium was highest value in Turkey honey samples (17.9)mg/kg while (0.628)mg/kg in current study and don’t appeared in Ataturk, Ethiopia and Libyan honey and lowest value incurrent study was (0.108)mg/kg.
Figure (1). Distribution of lead in honey samples.
Figure (2). Distribution of Cadmium in honey samples.
Nickel is one of the essential elements to human health. Nickel plays some role in body functions including enzyme functions. It occurs more in plants than in animal flesh. It activates some enzyme systems in trace amount but its toxicity at higher levels is more appears. .nickel and its salt do not affect the human body but in some cases it has been recorded to cause allergic problems as it has comes in contact with moist skin(53) .The lowest nickel content was (0.210±0.01140) mg/kg in the American honey and highest content in Eucalyptuses (2)honey (0.894±0.0114) mg/kg. Figure (3) show this.
Figure (3). Distribution of Nickel in honey samples.
When comparing the ratio of Nickel measured in the current study with the other samples are shown in Table (5)
88 Saadiyah Ahmed Dhahir and Ameera Hassan Hemed: Determination of Heavy Metals and Trace Element Levels in Honey Samples from Different Regions of Iraq and Compared with Other Kind
Shows that the highest percentage of Nickel in Turkey honey samples (29.9) mg/kg while she was in the measured samples in the current study (0.878) mg/kg and the lowest appeared in the Iran honey (0.003) mg/kg while the samples incurrent study showed measured in the current study (0.210) mg/kg.
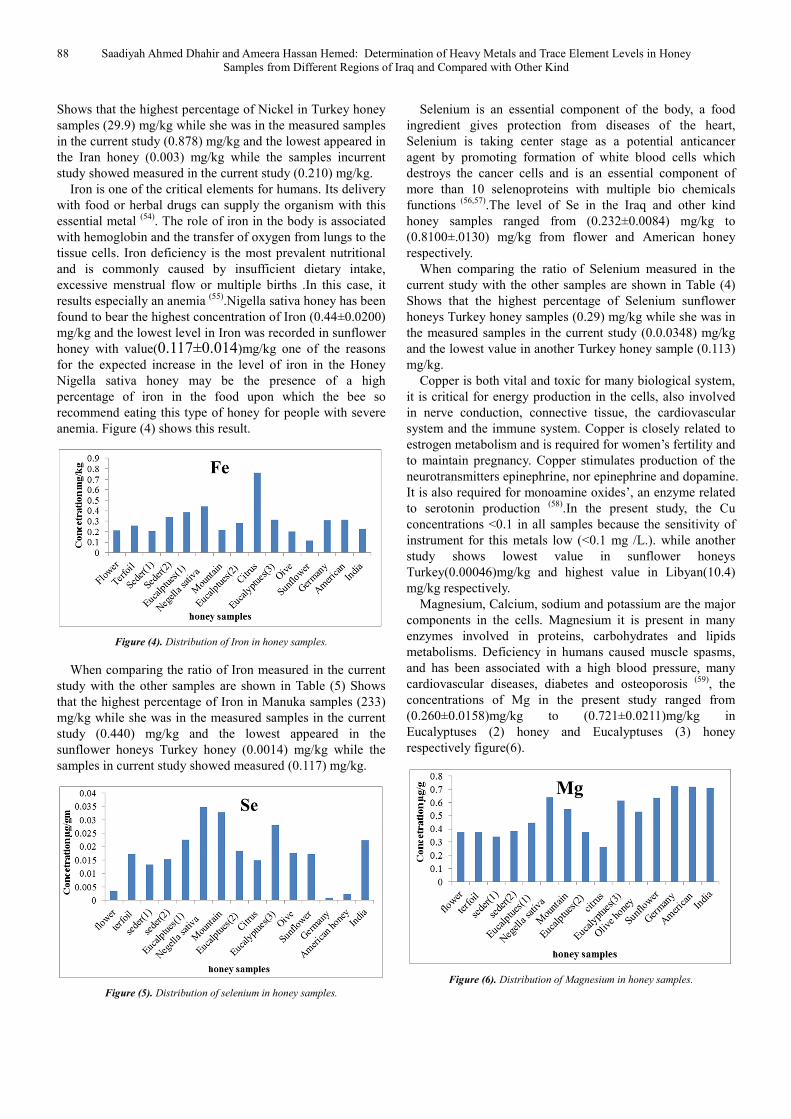
Iron is one of the critical elements for humans. Its delivery with food or herbal drugs can supply the organism with this essential metal (54). The role of iron in the body is associated with hemoglobin and the transfer of oxygen from lungs to the tissue cells. Iron deficiency is the most prevalent nutritional and is commonly caused by insufficient dietary intake, excessive menstrual flow or multiple births .In this case, it results especially an anemia (55).Nigella sativa honey has been found to bear the highest concentration of Iron (0.44±0.0200) mg/kg and the lowest level in Iron was recorded in sunflower honey with value(0.117±0.014)mg/kg one of the reasons for the expected increase in the level of iron in the Honey Nigella sativa honey may be the presence of a high percentage of iron in the food upon which the bee so recommend eating this type of honey for people with severe anemia. Figure (4) shows this result.
Figure (4). Distribution of Iron in honey samples.
When comparing the ratio of Iron measured in the current study with the other samples are shown in Table (5) Shows that the highest percentage of Iron in Manuka samples (233) mg/kg while she was in the measured samples in the current study (0.440) mg/kg and the lowest appeared in the sunflower honeys Turkey honey (0.0014) mg/kg while the samples in current study showed measured (0.117) mg/kg.
Figure (5). Distribution of selenium in honey samples.
Selenium is an essential component of the body, a food ingredient gives protection from diseases of the heart, Selenium is taking center stage as a potential anticancer agent by promoting formation of white blood cells which destroys the cancer cells and is an essential component of more than 10 selenoproteins with multiple bio chemicals functions (56,57).The level of Se in the Iraq and other kind honey samples ranged from (0.232±0.0084) mg/kg to (0.8100±.0130) mg/kg from flower and American honey respectively.
When comparing the ratio of Selenium measured in the current study with the other samples are shown in Table (4) Shows that the highest percentage of Selenium sunflower honeys Turkey honey samples (0.29) mg/kg while she was in the measured samples in the current study (0.0.0348) mg/kg and the lowest value in another Turkey honey sample (0.113) mg/kg.
Copper is both vital and toxic for many biological system, it is critical for energy production in the cells, also involved in nerve conduction, connective tissue, the cardiovascular system and the immune system. Copper is closely related to estrogen metabolism and is required for women’s fertility and to maintain pregnancy. Copper stimulates production of the neurotransmitters epinephrine, nor epinephrine and dopamine. It is also required for monoamine oxides’, an enzyme related to serotonin production (58).In the present study, the Cu concentrations <0.1 in all samples because the sensitivity of instrument for this metals low (<0.1 mg /L.). while another study shows lowest value in sunflower honeys Turkey(0.00046)mg/kg and highest value in Libyan(10.4) mg/kg respectively.
Magnesium, Calcium, sodium and potassium are the major components in the cells. Magnesium it is present in many enzymes involved in proteins, carbohydrates and lipids metabolisms. Deficiency in humans caused muscle spasms, and has been associated with a high blood pressure, many cardiovascular diseases, diabetes and osteoporosis (59), the concentrations of Mg in the present study ranged from (0.260±0.0158)mg/kg to (0.721±0.0211)mg/kg in Eucalyptuses (2) honey and Eucalyptuses (3) honey respectively figure(6).
Figure (6). Distribution of Magnesium in honey samples.
American Journal of Applied Chemistry 2015; 3(3): 83-92 89
When comparing the ratio of Magnesium measured in the current study with the other samples are shown in Table (5) Shows that the highest percentage of Magnesiumin Romania honey samples (1008.3)mg/kg while she was in the measured samples in the current study (0.71) mg/kg and the lowest appeared in the southern Poland honey (0. 42) mg/kg while the samples incurrent study showed measured in the current study (0.26) mg/kg.
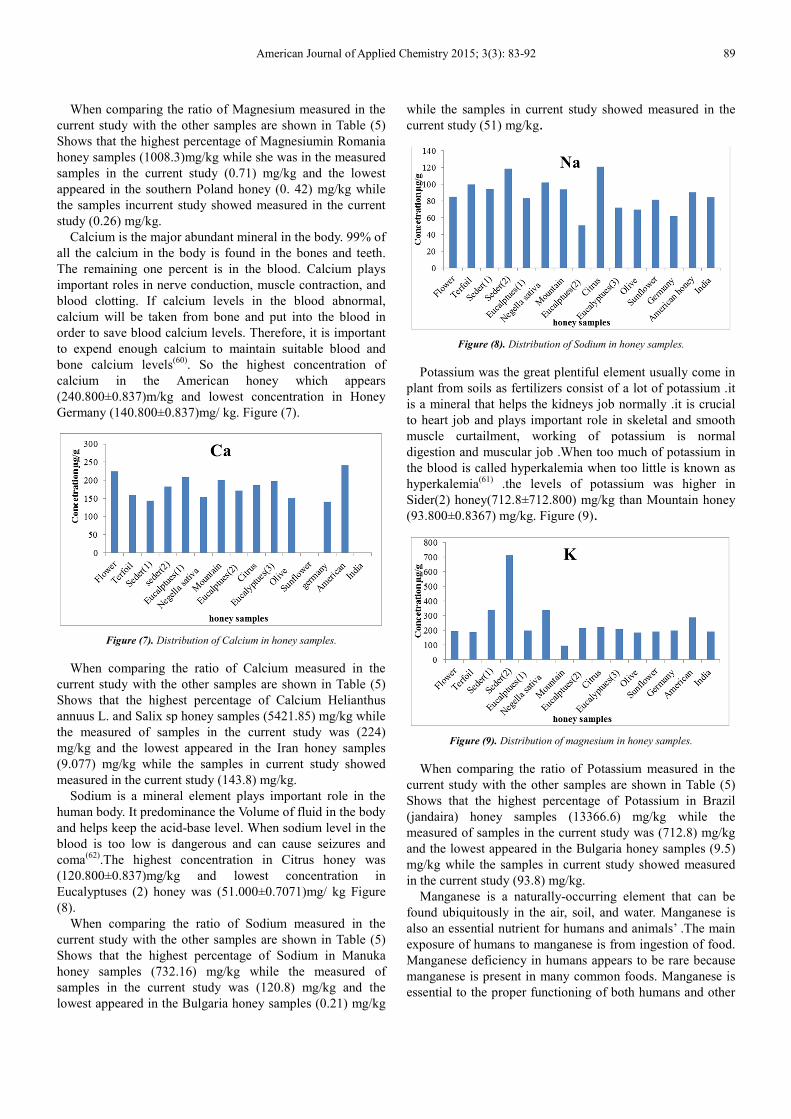
Calcium is the major abundant mineral in the body. 99% of all the calcium in the body is found in the bones and teeth. The remaining one percent is in the blood. Calcium plays important roles in nerve conduction, muscle contraction, and blood clotting. If calcium levels in the blood abnormal, calcium will be taken from bone and put into the blood in order to save blood calcium levels. Therefore, it is important to expend enough calcium to maintain suitable blood and bone calcium levels(60). So the highest concentration of calcium in the American honey which appears (240.800±0.837)m/kg and lowest concentration in Honey Germany (140.800±0.837)mg/ kg. Figure (7).
Figure (7). Distribution of Calcium in honey samples.
When comparing the ratio of Calcium measured in the current study with the other samples are shown in Table (5) Shows that the highest percentage of Calcium Helianthus annuus L. and Salix sp honey samples (5421.85) mg/kg while the measured of samples in the current study was (224) mg/kg and the lowest appeared in the Iran honey samples (9.077) mg/kg while the samples in current study showed measured in the current study (143.8) mg/kg.
Sodium is a mineral element plays important role in the human body. It predominance the Volume of fluid in the body and helps keep the acid-base level. When sodium level in the blood is too low is dangerous and can cause seizures and coma(62).The highest concentration in Citrus honey was (120.800±0.837)mg/kg and lowest concentration in Eucalyptuses (2) honey was (51.000±0.7071)mg/ kg Figure (8).
When comparing the ratio of Sodium measured in the current study with the other samples are shown in Table (5) Shows that the highest percentage of Sodium in Manuka honey samples (732.16) mg/kg while the measured of samples in the current study was (120.8) mg/kg and the lowest appeared in the Bulgaria honey samples (0.21) mg/kg
while the samples in current study showed measured in the current study (51) mg/kg.
Figure (8). Distribution of Sodium in honey samples.
Potassium was the great plentiful element usually come in plant from soils as fertilizers consist of a lot of potassium .it is a mineral that helps the kidneys job normally .it is crucial to heart job and plays important role in skeletal and smooth muscle curtailment, working of potassium is normal digestion and muscular job .When too much of potassium in the blood is called hyperkalemia when too little is known as hyperkalemia(61) .the levels of potassium was higher in Sider(2) honey(712.8±712.800) mg/kg than Mountain honey (93.800±0.8367) mg/kg. Figure (9).
Figure (9). Distribution of magnesium in honey samples.
When comparing the ratio of Potassium measured in the current study with the other samples are shown in Table (5) Shows that the highest percentage of Potassium in Brazil (jandaira) honey samples (13366.6) mg/kg while the measured of samples in the current study was (712.8) mg/kg and the lowest appeared in the Bulgaria honey samples (9.5) mg/kg while the samples in current study showed measured in the current study (93.8) mg/kg.
Manganese is a naturally-occurring element that can be found ubiquitously in the air, soil, and water. Manganese is also an essential nutrient for humans and animals’ .The main exposure of humans to manganese is from ingestion of food. Manganese deficiency in humans appears to be rare because manganese is present in many common foods. Manganese is essential to the proper functioning of both humans and other
90 Saadiyah Ahmed Dhahir and Ameera Hassan Hemed: Determination of Heavy Metals and Trace Element Levels in Honey Samples from Different Regions of Iraq and Compared with Other Kind
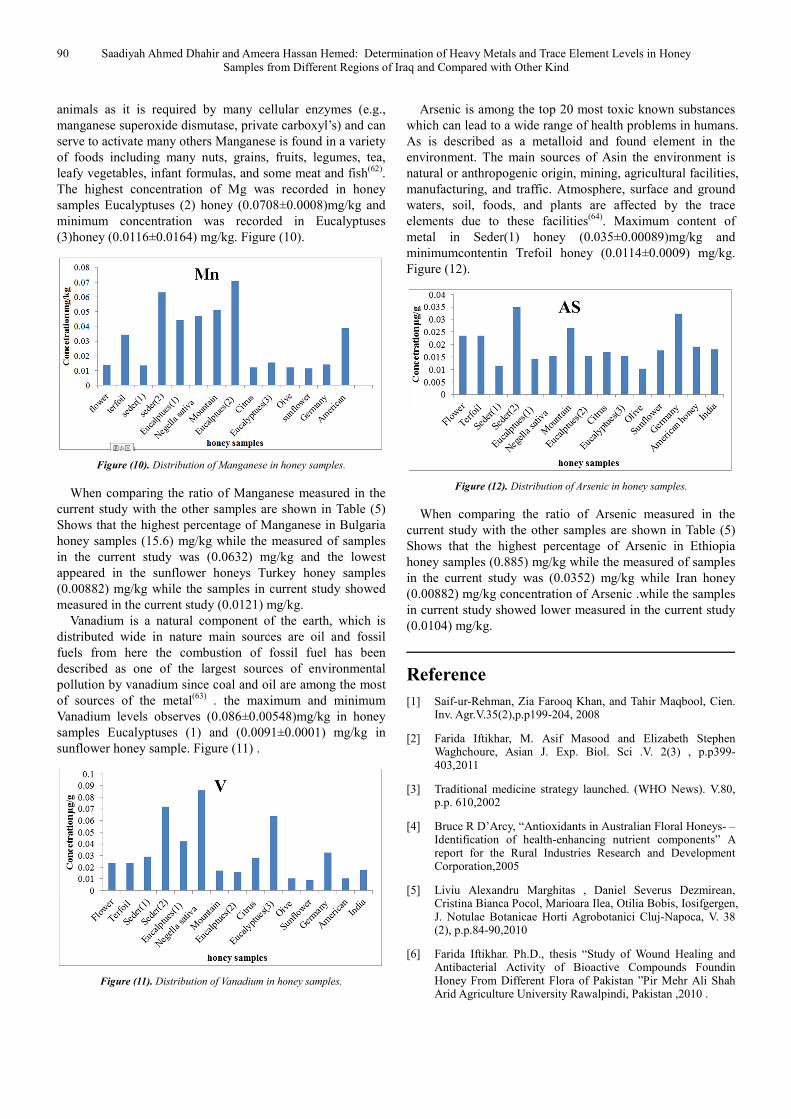
animals as it is required by many cellular enzymes (e.g., manganese superoxide dismutase, private carboxyl’s) and can serve to activate many others Manganese is found in a variety of foods including many nuts, grains, fruits, legumes, tea, leafy vegetables, infant formulas, and some meat and fish(62). The highest concentration of Mg was recorded in honey samples Eucalyptuses (2) honey (0.0708±0.0008)mg/kg and minimum concentration was recorded in Eucalyptuses (3)honey (0.0116±0.0164) mg/kg. Figure (10).
Figure (10). Distribution of Manganese in honey samples.
When comparing the ratio of Manganese measured in the current study with the other samples are shown in Table (5) Shows that the highest percentage of Manganese in Bulgaria honey samples (15.6) mg/kg while the measured of samples in the current study was (0.0632) mg/kg and the lowest appeared in the sunflower honeys Turkey honey samples (0.00882) mg/kg while the samples in current study showed measured in the current study (0.0121) mg/kg.
Vanadium is a natural component of the earth, which is distributed wide in nature main sources are oil and fossil fuels from here the combustion of fossil fuel has been described as one of the largest sources of environmental pollution by vanadium since coal and oil are among the most of sources of the metal(63) . the maximum and minimum Vanadium levels observes (0.086±0.00548)mg/kg in honey samples Eucalyptuses (1) and (0.0091±0.0001) mg/kg in sunflower honey sample. Figure (11) .
Figure (11). Distribution of Vanadium in honey samples.
Arsenic is among the top 20 most toxic known substances which can lead to a wide range of health problems in humans. As is described as a metalloid and found element in the environment. The main sources of Asin the environment is natural or anthropogenic origin, mining, agricultural facilities, manufacturing, and traffic. Atmosphere, surface and ground waters, soil, foods, and plants are affected by the trace elements due to these facilities(64). Maximum content of metal in Seder(1) honey (0.035±0.00089)mg/kg and minimumcontentin Trefoil honey (0.0114±0.0009) mg/kg. Figure (12).
Figure (12). Distribution of Arsenic in honey samples.
When comparing the ratio of Arsenic measured in the current study with the other samples are shown in Table (5) Shows that the highest percentage of Arsenic in Ethiopia honey samples (0.885) mg/kg while the measured of samples in the current study was (0.0352) mg/kg while Iran honey (0.00882) mg/kg concentration of Arsenic .while the samples in current study showed lower measured in the current study (0.0104) mg/kg.
Reference
[1] Saif-ur-Rehman, Zia Farooq Khan, and Tahir Maqbool, Cien. Inv. Agr.V.35(2),p.p199-204, 2008
[2] Farida Iftikhar, M. Asif Masood and Elizabeth Stephen Waghchoure, Asian J. Exp. Biol. Sci .V. 2(3) , p.p399-403,2011
[3] Traditional medicine strategy launched. (WHO News). V.80, p.p. 610,2002
[4] Bruce R D’Arcy, “Antioxidants in Australian Floral Honeys- –Identification of health-enhancing nutrient components” A report for the Rural Industries Research and Development Corporation,2005
[5] Liviu Alexandru Marghitas , Daniel Severus Dezmirean, Cristina Bianca Pocol, Marioara Ilea, Otilia Bobis, Iosifgergen, J. Notulae Botanicae Horti Agrobotanici Cluj-Napoca, V. 38 (2), p.p.84-90,2010
[6] Farida Iftikhar. Ph.D., thesis “Study of Wound Healing and Antibacterial Activity of Bioactive Compounds Foundin Honey From Different Flora of Pakistan ”Pir Mehr Ali Shah Arid Agriculture University Rawalpindi, Pakistan ,2010 .
American Journal of Applied Chemistry 2015; 3(3): 83-92 91
[7] Amina Chakir, Abderrahmane Romane, Nicoletta Barbagianni, Donatella Bartoli, Paola Ferrazzi, Australian Journal of Basic and Applied Sciences, V. 5(4), p.p..223-231, 2011
[8] M.D. Ioannidou, G.A. Zachariadis, A.N. Anthemidis, J.A. Stratis, Talanta, V. 65,p.p.92–97,2005
[9] John H. Duffus, Pure Appl. Chem., V. 74, p.p. 793–807, 2002.
[10] A. Mbiri, A. Onditi, N. Oyaro and E. Murago,JAGST ,V. 13(1) ,p.p.108-15,2011
[11] Mohammed Moniruzzaman, Muhammed Alamgir Zaman Chowdhury, Mohammad Abdur Rahman, Siti Amrah Sulaiman, and Siew Hua Gan, BioMed Research International, V.1,p.p.1-10,2014
[12] O.M. Herna´ndez, J.M.G. Fraga, A.I. Jime´nez, F. Jime´nez, J.J. Arias, Food Chemistry,V.93,p.p. 449–458, 2005
[13] David L. Watts, Ph.D., F.A.C.E.P, Journal of Orthomolecular Medicine, V. 5 (3), p.p. 159-160, 1990
[14] Stefan Bogdanov, Tomislav Jurendic, Robert Sieber, Peter Gallmann, Stefan Bogdanov, Tomislav Jurendic, Robert Sieber, Peter Gallmann, American Journal of the College of Nutrition, V. 27, p.p. 677-689,2008
[15] Jivan A, PatruIca Silvia, Popescu G H. Lucrări Stiin Ńifice Zootehnie Si Biotehnologii, V. 41, p.p 203-208, 2008
[16] Stefan Bogdanov, Apidologie, V.37, p.p.1–18, 2006
[17] Erina Asmaw Anibt Abu Bakar, B S.C, thesis “Determination of Heavy Metals (Cadmium, Chromium, Copper, Lead and Nickel) In Slimmng Teaa By Using Atomic Absorption Spectroscopy” , Universiti Teknologi MARA, 2008
[18] Klaus-J. Appenroth,. Sherameti and A. Varma (eds.), Soil Heavy Metals, Soil Biology, V. 19, p.p.19-29, 2010
[19] Mustafa Tuzen a, Mustafa Soylak, J.F ood Chemistry, V.102, p.p.1089–1095, 2007
[20] Zahrah Al- Engineering and Technology, V. 3(2), p.p.8977-8989, 2014
[21] B.L. Batista, L.R.S. da Silva, B.A. Rocha, J.L. Rodrigues, A.A. Berretta-Silva, T.O. Bonates, V. S. D. Gomes, R.M. Barbosa, F. Barbosa, Food Research International, V. 49, p.p. 205-215, 2012
[22] Chandrama Singh, Shubharani, R and Sivaram, V, World Journal of Pharmacy and Pharmaceutical Sciences, V 3(8), p.p.509-515., 2014
[23] Mohammed Moniruzzaman, Muhammed Alamgir Zaman Chowdhury, Mohammad Abdur Rahman, Siti Amrah Sulaiman and Siew Hua Gan,V. 2014, Article ID 359890, p. 10
[24] Pawel Pohl, Helena Stecka, Piotr Jamroz, J.Arch Environ Contam Toxicol V.66, p.p.287–294, 2014
[25] Helena Stecka , Dominika Jedryczko , Maja Welna and Pawel Pohl, Environ Monit Assess V.186, p.p.6145–6155,2014
[26] Afzal Shah1,Farzana Sikandar1, Imdad Ullah, Afzal Shah3, Salah Ud-Din Khan, Usman Ali Rana, Thomas McCoy, Journal of Food and Nutrition Research, V. 2(. 9),p.p.532-538,2014
[27] Camila Kulek de Andrade, Vanessa Egea dos Anjos, Maria Lurdes Felsner, Yohandra Reyes Torres, Sueli Percio Quinaia, J. Food Chemistry , V.146 ,p.p.166–173, 2014
[28] Abdulaziz S. Alqarni, Ayman A. Owayss, Awad A. Mahmoud, Mohammed A. Hannan, Journal of Saudi Chemical Society V. 18,p.p 618–625, 2014
[29] Fusun Temamogulları, Selma Yazar, Ruhtan Başkaya, Eurasian Journal of Veterinary Sciences, V.28, p.p.38-40, 2012
[30] K. Nikolova, G. Gentscheva, E. Ivanova, J. Bulgarian Chemical Communications, Vo 45(2), p.p.244 – 249, 2013
[31] Formicki, Grzegorz, Greń, Agnieszka, Stawarz, Robert, Zyśk, Bartłomiej, Gał, Anna, journal of Environmental Studies, V. 22, p.p.99-106,2013
[32] M. Tuzen , S. Silici b, D. Mendil , M. Soylak c,Food Chemistry , V.103 ,.p.p.325–330, 2007
[33] Petra Batelkova, Ivana Borkovcova, Olga Celechovska, Lenka Vorlova, Acta Vet. Brno, V.81,p.p.169–174, 2012
[34] Irane Nyangoge Orina, thesis.”Quaity And Saffty Characteristis OF Honey Produced In Different Regions OF Kenya”, Jomokenyatta University OF Agriculture and Technology, 2012
[35] Amin Sadeghi, Ali-Akbar Mozafari, Reza Bahmani, Kamran Shokri, Journal of Apicultural Science, V. 56 ( 2),p.p.84-88, 2012
[36] K.W. Shahir E.J. Taher, the Iraqi Journal of Agricultural Sciences, V.43 (5), P. 63-68, 2012
[37] Shahram Saghaei Husamettin Ekici , Mevlut Demirbas ,Ender Yarsan , Yas Tumer, Kafkas Univ Vet FakDergV.18 (2), p.p.281-284, 2012
[38] O. G. Stanciu, L. A. Marghitas,D. Dezmirean, M. G. Campos, Romanian Biotechnological Letters, V. 16( 4), p.p. 6291-6296, 2011
[39] Carero Pablo, Rondon Carlos, Saavedra Agni R, Vit Patricia, Vit P and Roubik DW, eds.,V.1,p.p.1-5,2012
[40] Demirhan Citak, Sibel Silici, Mustafa Tuzen, Mustafa Soylak, International Journal of Food Science & Technology,V.61, p.p.126, 2013
[41] Girliane Regina da Silva et.al, Food and Nutrition Sciences, V.5, P.1015-1021,2014
[42] A. Mbiri, A. Onditi, N. Oyaro and E. Murago, Jagst V. 13(1) , p.p.107-115,2011
[43] Weldegebriel Yohannes, MS. C, thesis.” Determination of Selected Trace Metals and Physicochemical Parameters of Commercially available Honey in Ethiopia”, Department of chemistry Faculty of Science, 2009.
[44] Mohamed H. S. Ahmid, Saleh Elwerfali, Ali Agha1, Mohamed Elagori1, Nagwa H. S. Ahmida, Food and Nutrition Sciences, V. 4,P.33-40,2013
[45] J. Lachman, , D. Kolihová, D. Miholová,J. Košata, D. Titěra, K. Kult,Food chemistry ,V. 101, P. 973–979,2007
[46] J. L. Rodrfguez-Otero, P Paseird, J Simal, L Terradillos, Journal of Apicultural Research, V. 31 (2), p.p 65-69 , 2010
92 Saadiyah Ahmed Dhahir and Ameera Hassan Hemed: Determination of Heavy Metals and Trace Element Levels in Honey Samples from Different Regions of Iraq and Compared with Other Kind
[47] Niloofar Khoshbakht Fahim, Hamed Reza Beheshti, Somayeh Sadat Fakoor Janati and Javad Feizy, International Journal of Industrial Chemistry,V. 4(10) , p.p.1-3,2013
[48] Jozef Szkoda and Jan Żmudzki, Bull Vet Inst Pulawy, V. 49,p.p. 89-92, 2005
[49] Saeid Nazari, American Journal of Analytical Chemistry, V. 2,p.p. 757-767, 2011
[50] Krystyna Pyrzynska, Critical Reviews in Analytical Chemistry, V. 37, p.p.39–49, 2007
[51] Akinola, M.O., Njoku, K.L. and Ekeifo, B.E., Advances in Environmental Biology,V. 2(1)p.p. 25-30, 2008
[52] AL. Kaisie, B.I, AL_Mussawi, M.T, Maccawei, T.m, UmSalama Science Journal,V.3(4),p.p.702-705,2006
[53] O. P. Sobukola, O. M. Adeniran, A. A. Odedairo and O. E. Kajihausa, African Journal of Food Science, V. 4(2), pp. 389 - 393, 2010.
[54] Paweł Konieczyński, Marek Wesołowski, Piotr Rafalski, herbapolonica, V.53(4),p.p.28-33, 2007
[55] Intidhar D. Sulaiman Rafea K. Al Kubaisy Jasm D. Salman, Ibn Al-Haitham Jour. for Pure & Appl. Sci., V. 26 (1),p.p 234-240, 2013
[56] Waleed A. Mahmoud, Fadhil M. Abid ,Zehraa. A. Jabeer ,J. Baghdad for Sci,V.9(4), p.p,663-667,2012
[57] F .Cuparigova, T. Stafilov, Chemical Sciences Journal, V.46, p.p. 1-8,2011
[58] Ahmed Hassan, Mahmoud A.A. Ghandour, Azza M.M. Ali and Hazim. A. Mahran, American Journal of Applied Sciences ,V.7 (3),p.p. 315-322, 2010
[59] Ducu Sandu Ştef, Iosif Gergen, Lavinia Ştef, Monica Harmanescu, Cecilia Pop, Marioara Druga, Gabriel Bujanca1, Mirela Popa, Animal Science and Biotechnologies, V.43 (1),p.p 122-126, 2010
[60] Linda Houtkooper, Vanessa A. Farrell, the University of Arizona Cooperative Extension, College of Agriculture and Life Sciences.,p.p.1-4,2011
[61] Mahwash Zahra Kirmani, Sheikh Mohiuddin, Farah Naz, Iftikhar Imam Naqvi , Erum Zahir, Journal of Basic & Applied Sciences, V.7(2),p.p. 89–95 , 2011
[62] Drinking Water Health Advisory for Manganese, U.S. Environmental Protection Agency Office of Water (4304T) Health and Ecological Criteria Division Washington, DC 20460,2004
[63] Awofolu, O.R., AJST, V. 5(1),p.p.15-21 ,2004
[64] Guţu Claudia Maria, Bălălău D, Ilie Mihaela, Purdel Carmen Nicoleta, Gubandru Miriana, Acta Medica MarisiensisV.59(5), p.p.246-249, 2013.