Embed Size (px)
Citation preview

Determination of
Geographical Territories
by
Michael J. Miller
EPIC Consulting, LLC
2004 CAS Ratemaking Seminar
2
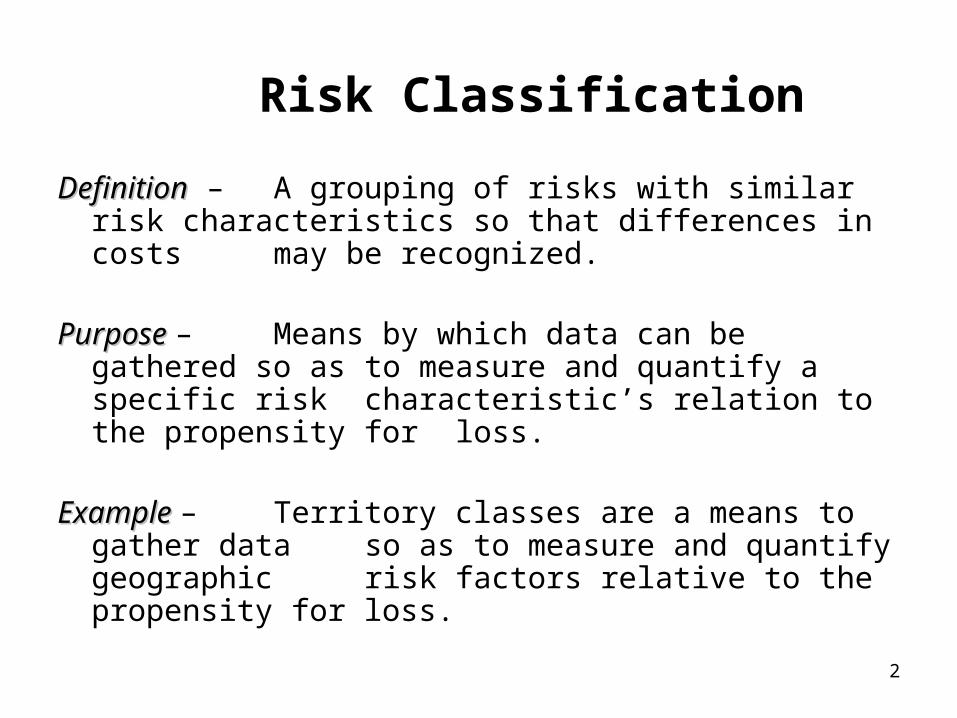
Risk Classification
DefinitionDefinition – A grouping of risks with similar risk characteristics so that differences in costs may be recognized.
PurposePurpose –Means by which data can be gathered so as to measure and quantify a specific risk characteristic’s relation to the propensity for
loss.
Example Example – Territory classes are a means to gather data so as to measure and quantify geographic risk factors relative to the propensity for loss.

3
Homogeneity
Definition Definition – A risk classification is homogeneous if all risks in the class have the same or similar degree of risk with respect to the specific risk factor being measured.
PurposePurpose –Homogeneity of the class increases the credibility of the loss data generated by the class.
ExampleExample – A territory is considered homogeneous if all risks in the territory represent the same, or approximately the same, geographical risk.

4
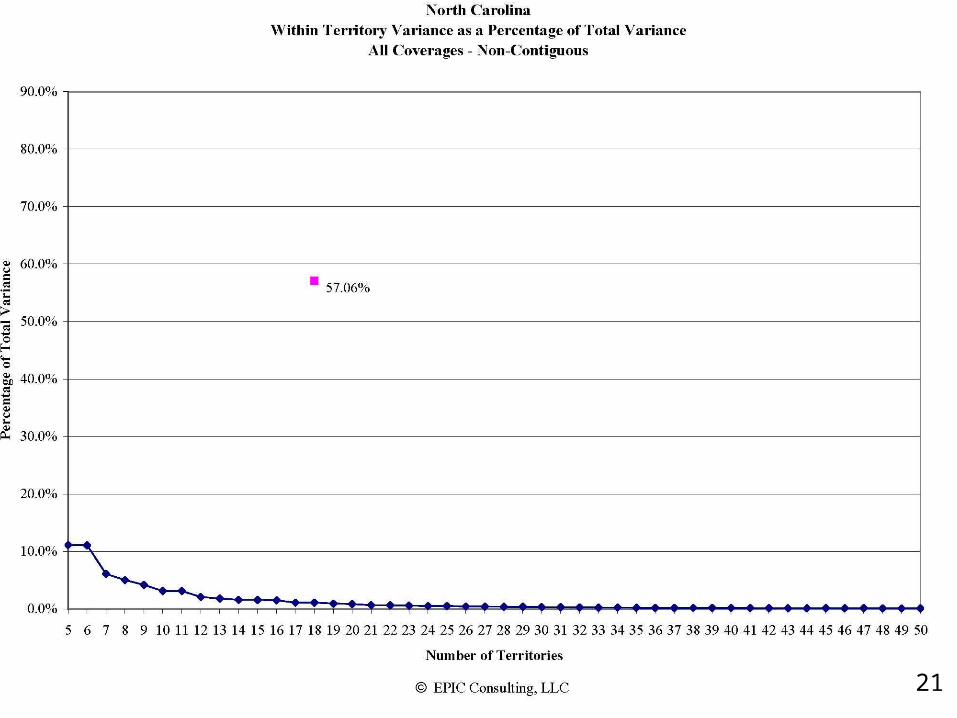
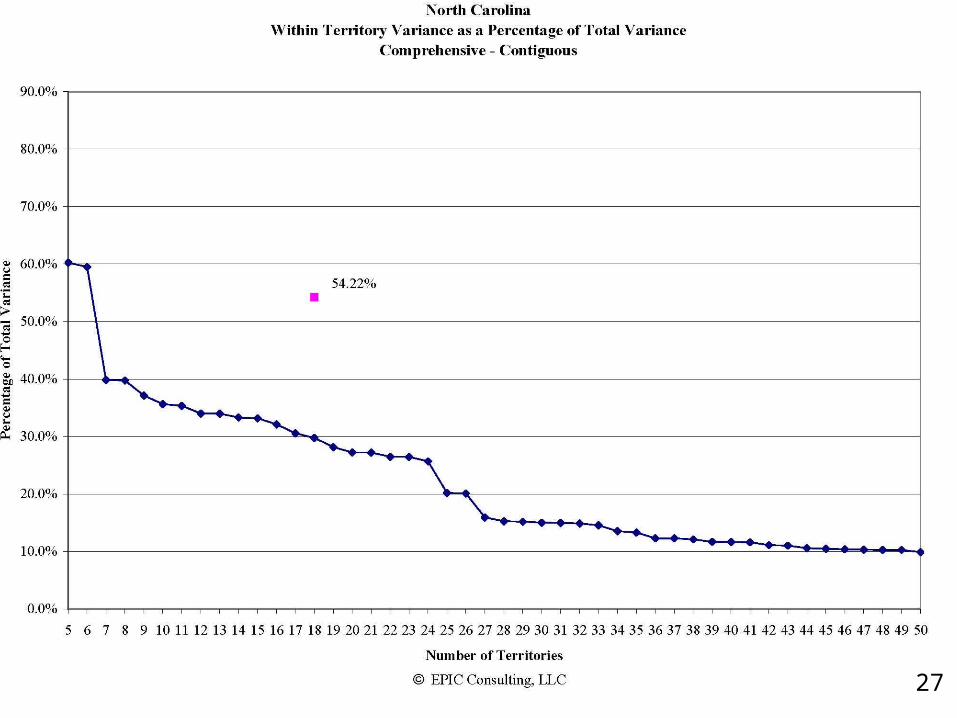
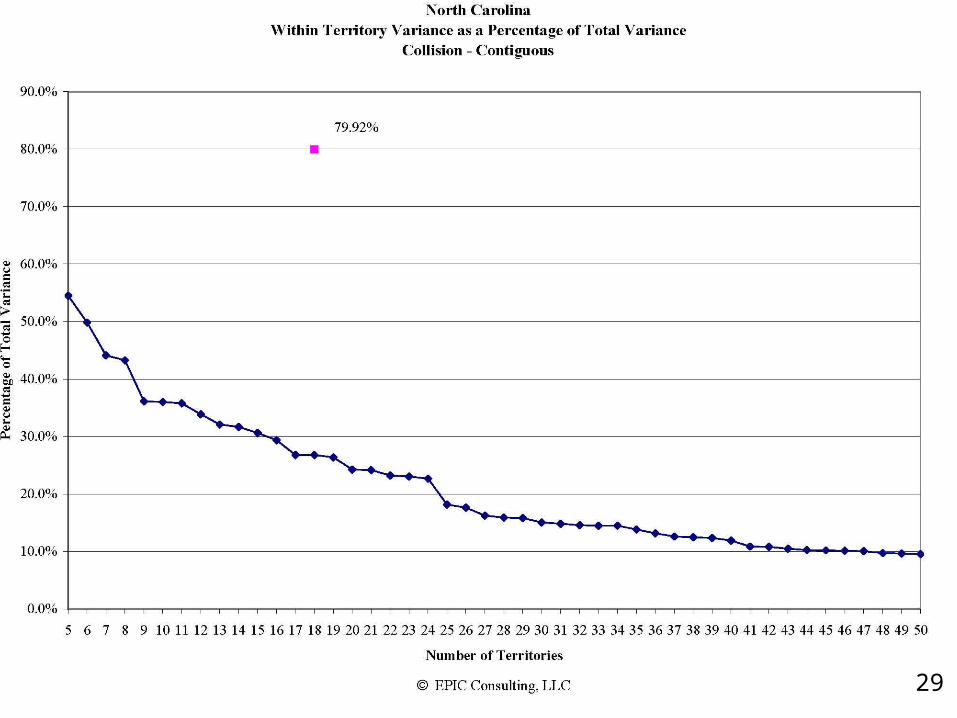
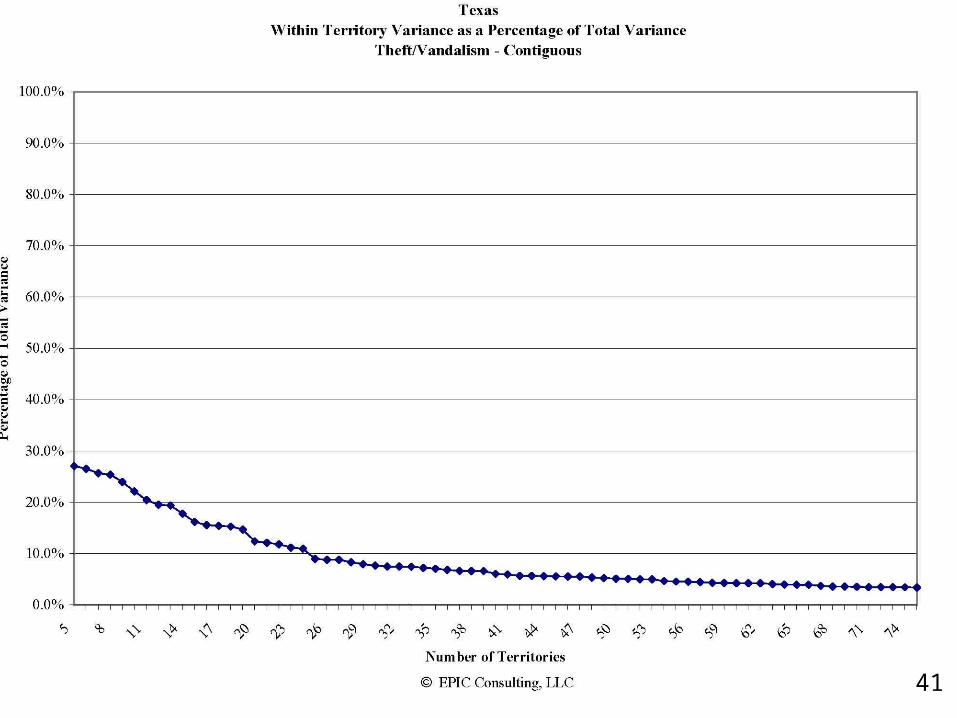
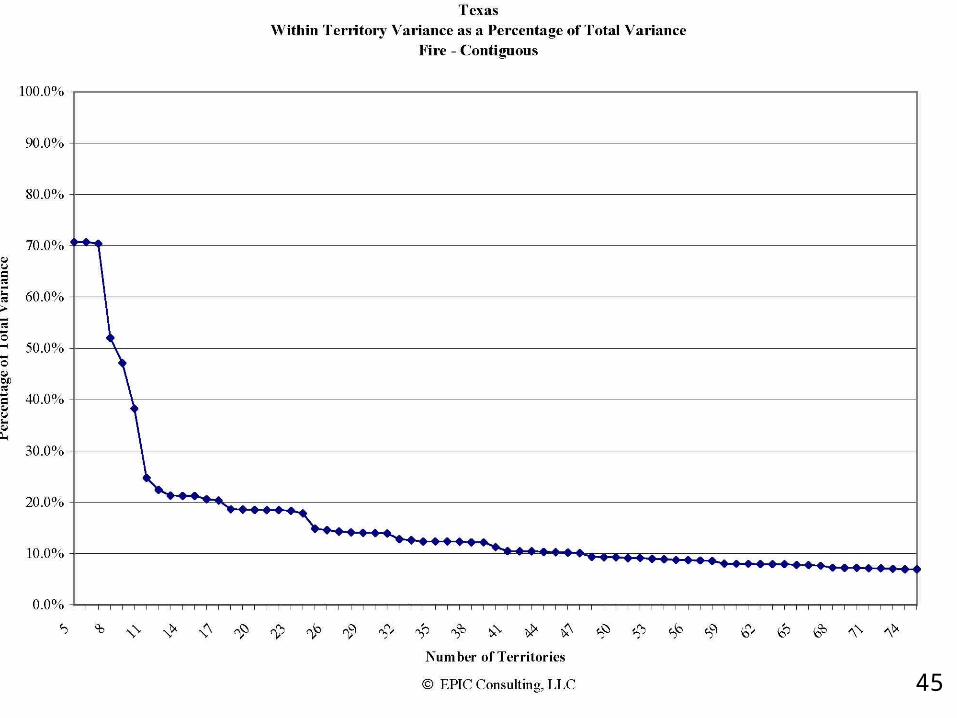
Statistical Test of Homogeneity
Within VarianceWithin Variance: Based on the squared difference between each zip code pure premium in the cluster and the average pure premium for the specific cluster being tested
Between VarianceBetween Variance: Based on the squared difference between each cluster’s pure premium and the statewide average pure premium
Total VarianceTotal Variance = Within Variance + Between Variance
Within Variance PercentageWithin Variance Percentage = Within Variance divided by Total Variance
GoalsGoals: Low Percentage of Total Variance Within
High Percentage of Total Variance Between

55

6
66

7
Basis to Group Areas
County• Largely stable over time• Broad area
ZIP Code• Narrowly defined may be beneficial to define territories• Useful for online rating• Main disadvantage is need to deal with change over time
Geo Coding• Finest detail• Static over time• No predefined grouping

8
Loss IndiceNormalized Pure Premium
Normalized Zip Code Pure Premium
EQUALS
State Ave. Prem. Zip Ave. Prem.
State Ave. Base ÷ Zip Base

9
Loss Indice Econometric Model
• Population Density
• Vehicle Density
• Accidents per Vehicle
• Injuries per Accident
• Thefts per Vehicle

10
Credibility
• 3000 Claims
• Complement– Neighborhood Pure Premium– Within Two Miles– One Mile Extension

11
Additional Credibility Considerations
Distance formulas• Discrete • Continuous
Choice of complements• Use of distance based criteria• Data grouped based on population density groups• Combination of both distance based and population density• Entire state

12
Sigmoid CurveCharacteristics
• S-shaped curve
• Flexible: can be fairly linear or approach step function
• Y = 1 / (1 + e-a(b-x-c))
0.0%
20.0%
40.0%
60.0%
80.0%
100.0%
0 4 8 12 16 20 24 28 32 36 40 44 48 52 56 60
a=0.25 b=30 c=20 a=0.25 b=30 c=15
a=0.50 b=30 c=15 a=0.15 b=60 c=30

13
Clustering
• Contiguous v. Non-Contiguous
• Absolute Dollar Difference
• Absolute Percentage Difference

14
Other Clustering Ideas
• Group areas using contiguous constraints to broadly define a territory
• Group areas within a territory without contiguity constraints to refine territorial rating
• Consider treatment of catastrophe data
• Use of loss ratio data with premium at a common level to reflect only differences due to territory

15
15

16
16

1717

1818

1919
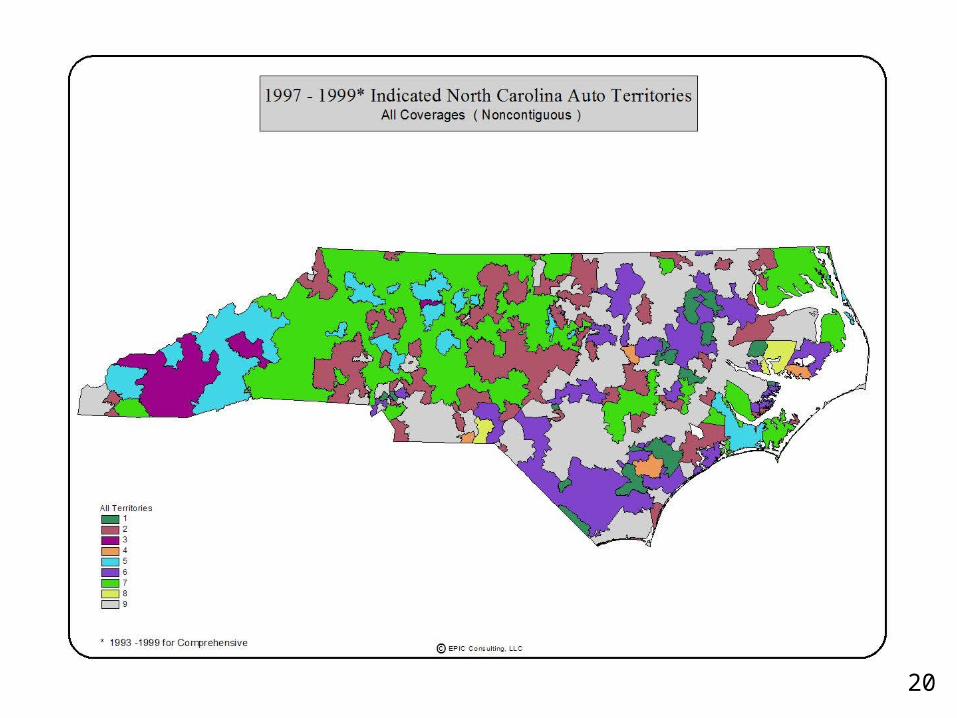
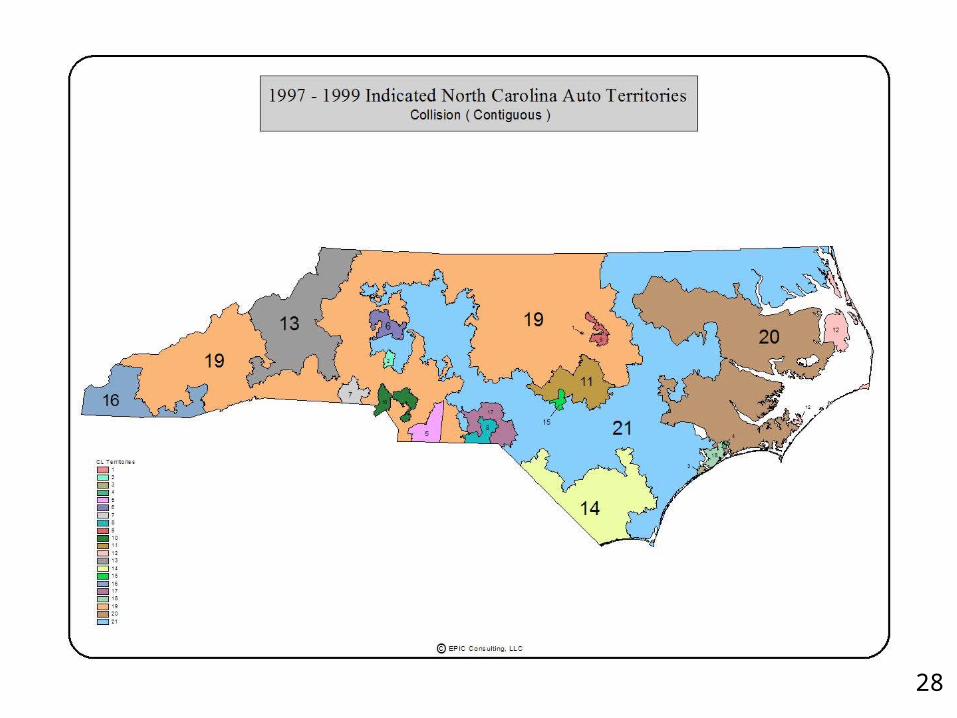
2020
2121

2222

2323

2424

2525

2626
2727
2828
2929

30

31

3232

33

3434

35
Stability
Predictive stability
• Choice of perils included in data
• Number of years of data
Rating stability
• Limit movement between zones
• Use of capping
• Use of confidence intervals to help analyze changes
36
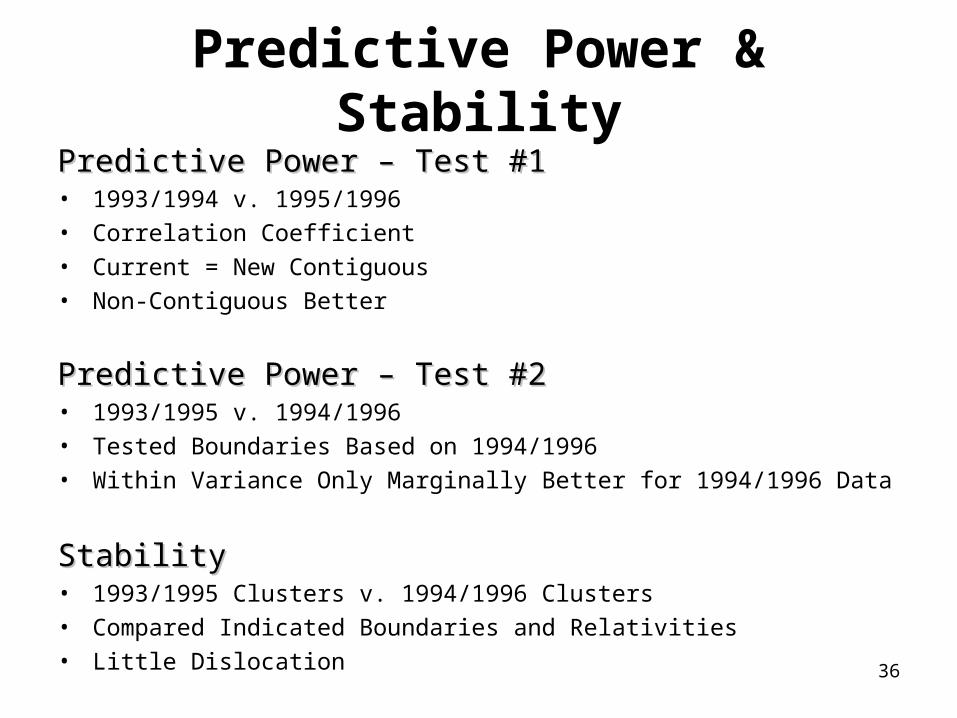
Predictive Power & Stability
Predictive Power – Test #1Predictive Power – Test #1• 1993/1994 v. 1995/1996
• Correlation Coefficient
• Current = New Contiguous
• Non-Contiguous Better
Predictive Power – Test #2Predictive Power – Test #2
• 1993/1995 v. 1994/1996
• Tested Boundaries Based on 1994/1996
• Within Variance Only Marginally Better for 1994/1996 Data
StabilityStability• 1993/1995 Clusters v. 1994/1996 Clusters
• Compared Indicated Boundaries and Relativities
• Little Dislocation

37

38

3939

40
4141

42

4343

44
4545

46

4747