Embed Size (px)
Citation preview

DEVELOPMENT OF A RAPID METHOD FOR THE
DETERMINATION OF FIBER CONTENT IN
POLYESTER/COTTON BLENDS
by
Ellen Louise Sours, B.S. in H.E.
A THESIS
IN
CLOTHING AND TEXTILES
Submitted to the Graduate Faculty of Texas Tech University in Partial Fulfillment of the Requirements for
the Degree of
MASTER OF SCIENCE
IN
HOME ECONOMICS
Approved
Accepted
August 1983

ACKNOWLEDGMENTS
The author wishes to thank Dr. Samina Khan for serving
as chairperson of the thesis committee, and for her contin
uing support throughout this project. I would like to thank
Dr. Patricia Horridge for her constructive criticism and
attention to detail. Dr. Christopher Lupton of the Textile
Research Center gave generously of his time, energy and
experience. Without him this project would never have been
undertaken. I would also like to give my special thanks to
Bob Wyatt of the Textile Research Center for his gifts of
time, space, supplies, statistical counselling and humor. *
Finally, niy sincere thanks to the entire staff of the
Textile Research Center for their kindness and helpfulness
throughout my stay there.
11
TABLE OF CONTENTS
ACKNOWLEDGMENTS ii
ABSTRACT v
LIST OF TABLES vi
LIST OF FIGURES viii
CHAPTER
I. INTRODUCTION 1
Statement of the Problem. 3
Objectives of the Study 3
Hypotheses 4
Scope and Limitations 4
Definitions of Terms 5
II. REVIEW OF THE LITERATURE 9
Analysis of Blend Compositions . . . . 9
Fiber Properties 11
Disperse Dyes 12
Thermosol Method 13
Colorimetric Measurement 15
III. PROCEDURE 22
Pilot Study 22
Major Study 23
IV. ANALYSIS OF DATA 41
Fiber Blend Analyses-Dissolution Test Results 41
Fiber Blend Analyses-Color imetric Measurement 45
1 1 1

V. SUMMARY, CONCLUSIONS AND RECOMMENDATIONS . . . . 64
Summary 64
Conclusions Related to Objectives 65
Conclusions Related to Hypotheses 68
Recommendations for Further Research . . . 69
LIST OF REFERENCES 71
APPENDICES
A. STATISTICAL ANALYSIS EXPLANATION 74
B. FIBER CONTENT-COLORIMETRIC MEASUREMENT . . . . 79
IV

ABSTRACT
Methods were developed to accurately and quickly
determine the polyester fiber proportions present in poly
ester/cotton blends. The results of the developed techniques
were compared to those obtained using the American Association
of Textile Chemists and Colorists (AATCC) Test Method 20A,
a sulfuric acid dissolution technique. Six fabric blend
levels and eleven fiber blend levels were used to develop
the methodology. The samples were dyed using sublimation
techniques and disperse dyes. Reflectance data were utilized
in developing simple linear regression equations to predict
polyester content. In some cases, the polyester contents
of blends as determined by the newly developed methods
showed no significant differences (a< .05) when compared
with the polyester contents of the same samples as determined
by the AATCC Test Method. Blend levels predicted by the
sublimation techniques had standard errors of the mean that
fell within the accepted + 3% range as required by the
Federal Trade Commission for truth in labeling. The
developed methods provide rapid and easily executed tests
for determining polyester fiber blend proportions in poly
ester/cotton blends.
v

LIST OF TABLES
Table Page
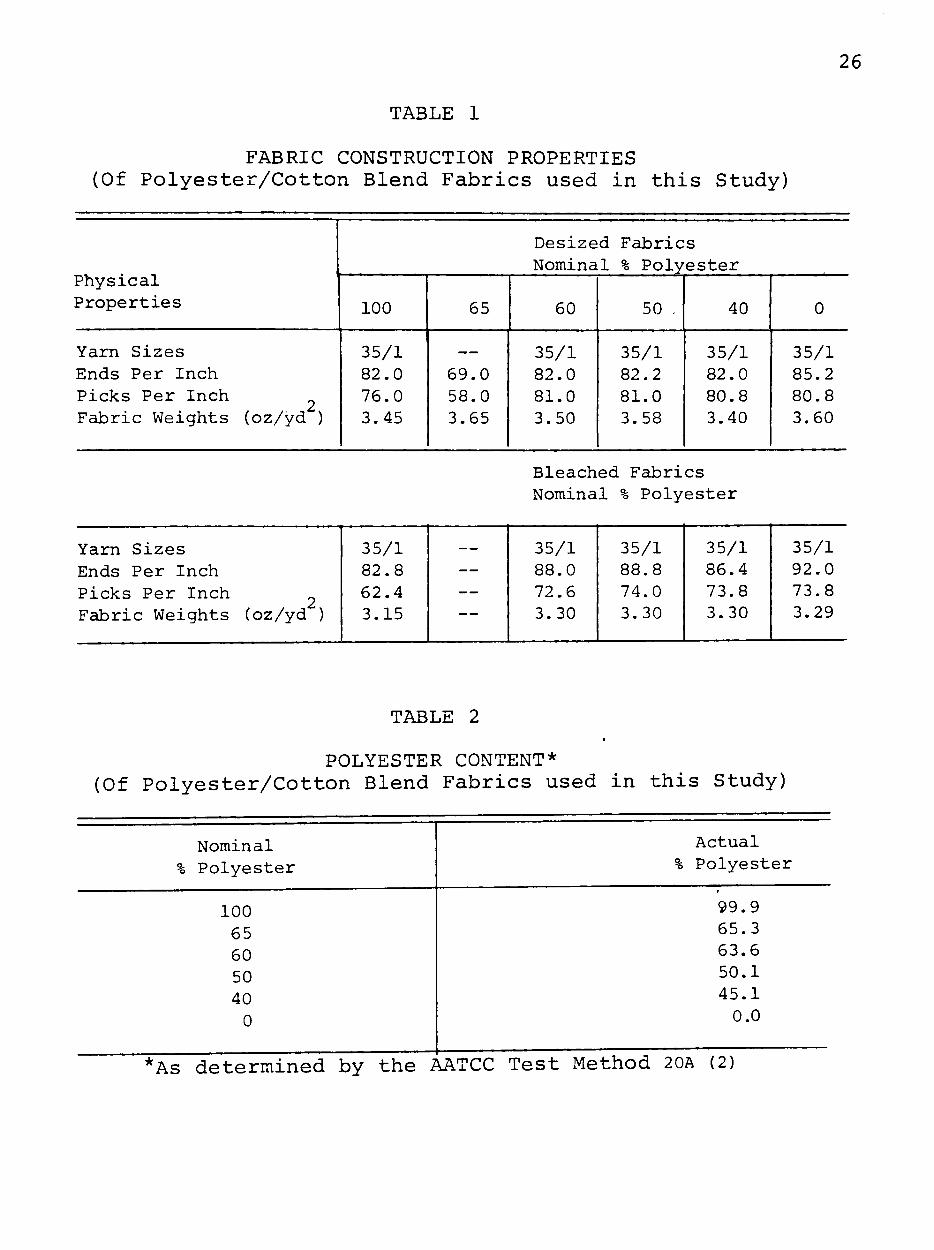
1. FABRIC CONSTRUCTION PROPERTIES (Of Polyester/Cotton Blend Fabrics used in this Study) 26
2. POLYESTER CONTENT (Of Polyester/Cotton Blend Fabrics
used in this Study) 26
3. COTTON FIBER PROPERTIES 27
4. POLYESTER FIBER PROPERTIES 27
5. SCOURING AND BLEACHING OF POLYESTER/ COTTON BLEND FABRICS 31
6. FIBER ANALYSIS (AATCC Test Method 20A) 43
7. FIBER ANALYSIS (Tetrachloroethane Method) 4 6
8. SIMPLE LINEAR REGRESSION EQUATIONS (y = ax + b> (y = Polyester Content, x = A E ) . . . 47
9. SIMPLE LINEAR REGRESSION EQUATIONS (y = ax + b) (y = Polyester Content, x = K/S) . . 48
10. CONFIDENCE LIMITS OF SUBLIMATION TECHNIQUES FOR DETERMINING POLYESTER CONTENT IN POLYESTER/COTTON BLENDS BY AE . . . . 51
11. CONFIDENCE LIMITS OF SUBLIMATION TECHNIQUES FOR DETERMINING POLYESTER CONTENT IN POLYESTER/COTTON BLENDS BY K/S . . . . 53
12. COEFFICIENTS OF VARIATION (Comparison of AE, K/S, AATCC and Tetrachloroethane Determination of Polyester Techniques) 56
13. ANALYSIS OF AATCC TEST METHOD AND SUBLIMATION TECHNIQUES (t-Test for Statistical Significance) 58
14. COMPARISON OF DESIZED, AND SCOURED AND BLEACHED FABRIC (t-Test for Statistical Significance) . 61
vi

Table Page
15. PREDICTED POLYESTER CONTENT OF "UNKNOWN" FIBER BLEND (Simple Linear Regression Analysis) 62
16. COMPARISON OF "UNKNOWN" TO KNOWN POLYESTER CONTENT (t-Test for Statistical Significance) . 63
17. FIBER CONTENT-COLORIMETRIC MEASUREMENT (Technique 1-Disperse Blue (2% w/w), Benz/Desized Fabric) 80
18. FIBER CONTENT-COLORIMETRIC MEASUREMENT (Technique 2-Disperse Blue (1% w/w), Benz/Desized Fabric) 82
• 19. FIBER CONTENT-COLORIMETRIC MEASUREMENT (Technique 3-Disperse Blue (3% w/w), Benz/Desized Fabric) 83
20. FIBER CONTENT-COLORIMETRIC MEASUREMENT (Technique 4-Disperse Red (2% w/w), Benz/Desized Fabric) 84
21. FIBER CONTENT-COLORIMETRIC MEASUREMENT (Technique 5-Disperse Blue (2% w/w), Benz/Fiber) 85
22. FIBER CONTENT-COLORIMETRIC MEASUREMENT (Technique 6-Disperse Blue (2% w/w), Benz/Bleached Fabric) 87
23. FIBER CONTENT-COLORIMETRIC MEASUREMENT (Technique 7-Disperse Blue (2% w/w), Iron/Desized Fabric) 88
24. FIBER CONTENT-COLORIMETRIC MEASUREMENT (Technique 8-Disperse Blue (2% w/w), Iron/Fiber) 89
25. FIBER CONTENT-COLORIMETRIC MEASUREMENT ("Unknown" Fiber Blends) 90
vii

LIST OF FIGURES
Figure Page
1. EXPERIMENTAL DESIGN 25
2a. THE BENZ UNIT 34
2b. SC?:SMATIC DRAV:iNG OF BENZ UNIT 34
3. METHODS OF FIBER CONTENT DETERMINATION 42
Vlll

CHAPTER I
INTRODUCTION
Fabrics made from blends of polyester and cotton have
largely replaced fabrics composed of 100% polyester, nylon
or cotton fibers. Polyester and cotton blends are used in
shirts, rainwear, leisurewear, workwear, sheets and home
furnishing textiles. Factors that contribute to the popu
larity of this fiber blend compared to 100% cotton are in
creased abrasion resistance, better wrinkle resistance,
higher tear resistance, better shrinkage control and ease
of maintenance (13:30).
In order for the consumer to be able to make intelligent
decisions about the purchase and care of a textile product,
which may be a fiber blend, labeling of most textile products
is required by the Textile Fiber Products Identification Act
(TFPIA) initiated in 1960. Some of the information that
must accompany a textile product, as stipulated by the TFPIA,
includes the generic name of the fiber or fibers present in
the fabric and the proportion of fiber content by weight.
The Federal Trade Commission (FTC) requires that actual
blend percentages be accurate to within 3% of the composi
tion stated on the label (21:44). This fiber blend pro
portion information is required in industry by the economist
and technologist, in education by those involved in research,
by practitioners, and by the concerned consumer (27). To
1

date, the accepted method for quantitatively determining
the composition of fiber content in polyester/cotton blends
is the test procedure outlined by the American Association
of Textile Chemists and Colorists (AATCC) Test Method 20A,
1981-1982, 10.4 (2:46-51). This gravimetric testing pro
cedure is a lengthy operation involving the use of a strong
acid and requiring five to six hours to perform. A study
of related literature has indicated that all existing
methods for this procedure involve the use of solvents that
are corrosive (70% sulfuric acid), expensive (heraxfluoroiso-
propanol) and/or toxic (tetrachloroethane).
A proposed alternative to the dissolution/gravimetric
analysis of blend compositions involves dyeing and subsequent
colorimetric evaluation of the fabric. The Thermosol method
is well suited to dyeing the polyester portion of polyester/
cotton blends. This method is dependent upon the ability of
disperse dye molecules to sublime into the polyester fiber
under the influence of dry heat. It is a rapid, simple dye
ing procedure that can be simulated in a laboratory situation
with a minimal amount of equipment. In an applied commercial
situation, the specialized color measuring equipment would
normally be available since most manufacturers today own or
have access to some type of colorimeter.

statement of the Problem
The study was conducted to determine if an accurate,
nongravimetric method for determining the polyester fiber
composition in polyester/cotton blends was feasible. The
study was designed to be applicable in the research, testing
and industrial (e.g., quality control) environments uti
lizing equipment and materials normally found in those situ
ations. The process was designed with speed, ease of
execution, and accuracy of the procedure as important
considerations.
Objectives of the Study
The specific objectives of the study were as follows:
1. To develop a rapid and accurate method for the de
termination of polyester fiber blend levels in polyester/
cotton blends, and to determine if this predicted polyester
content is within the range of accuracy as stipulated by
the FTC.
2. To standardize a rapid Thermosol dyeing method
using as the source of heat both a Benz laboratory curing
and drying apparatus and a household type iron.
3. To determine if disperse dyes having medium to high
energies could be used interchangeably in the procedure.
4. To develop simple linear regression equations re
lating color to fiber content from data collected from.

intimately blended, dyed polyester and cotton fabrics and
fibers.
5. To determine the polyester content of polyester/
cotton fiber blends of unknown composition using a Thermosol
method, and to compare the results to those determined by
gravimetric measurement.
6. To compare the accuracy of the AATCC Test Method
20A to the accuracy of the tetrachloroethane test method for
the determination of polyester content in blends.
Hypotheses
The following hypotheses were tested:
1. There are significant differences between the
Thermosol techniques and the AATCC Test Method 20A in de
termining the polyester content in desized polyester/cotton
blend fabrics.
2. There are significant differences between the
polyester content in desized polyester/cotton blend fabrics
compared to the polyester content in scoured and bleached
polyester/cotton blend fabrics as determined by the Thermosol
techniques.
Scope and Limitations
The results of this study will be applicable only in
those instances where the test methods are exactly dupli
cated. The findings of this study will not be directly

transferable to other fiber types, fabric constructions or
dyeing procedures. The study will establish a methodology
for the analysis of undyed, polyester/cotton blends and
provide suggestions for future research.
Definition of Terms
The following specialized terminology has been used.
1. Absorption: attraction and holding of molecules,
gases or liquids within a fiber, filament, yarn or material
(25:2) .
2. Adsorption: adhesion of gases or liquids to the
surface of a substrate (25:6).
3. Agglomerate: a loose assembly of primary dye par
ticles or aggregates in contact with one another at their
corners and edges only (24:36).
4. Aggregate: an assembly of primary dye particles
the surfaces of which are close together.
5. Blends: two or more different fibers combined in
the same yarn or fabric, in this instance polyester and
cotton. Blended fabrics are those made of yarns in which
two or more fibers are mixed before the yarn is spun. Com
bination fabrics contain yarn which are composed of differ
ent fibers.
6. Colorants: dyes and pigments applied to a fabric
to alter the light absorption quality (color) of the fabric
or fiber.

7. Colorimeter: instrument which is capable of deter
mining the proportions of the primary additive lights which
are necessary to match the color reflected or transmitted
by the sample under investigation (34:668).
* ^•^CIELAB* ^ num.ber derived by calculation to indi
cate the total color difference between a standard and a
sample.
9. Desize: to remove the sizing material (e.g., starch
or polyvinyl alcohol) which is often applied to the warp
yarns prior to weaving.
10. Disperse Dyes: class of dyes that are substantially
water insoluble and are used to dye synthetic and man-made
(hydrophobic) fibers.
11. Dye Exhaustion: during wet processing, the ratio
at any time between the amount of dye taken^ up by the sub
strate and the amount originally available (7:54).
12. Gravimetric: pertaining to measurement by weight.
13. K/S: a ratio (value) developed for color computa
tion based on the relationship of reflectivity and colorant
concentration; it is proportional to the concentration of
dye in the fiber.
14. Simple Linear Regression Equation: a mathematical
equation for predicting the value of a dependent variable
when given the value of an independent variable using the
linear least squares model.

15. Luminosity: quantity of light reflected or emitted
per unit area of the surface (34:657). Luminosity may also
be thought of in terms of the Munsell definition of value.
16. Migration: the movement of a dye from one area of
a dyed material to another area, this may also include move
ment of dye from a dyed to an undyed area, or movement of
dye from the fabric to the dye solution and back into the
fabric.
17. Primary particles: dye particles that can be indi
vidually observed under a microscope. They are the build
ing blocks for aggregates and agglomerates (24:36).
18. Reduction clear: a process used to remove dye from
stained fibers, usually involving sodium hydroxide, sodium
hydrosulfite, and a set temperature and time at which the
fabric or fibers are exposed to the clearing (reducing)
solution.
19. Scour: to remove oils, fats, waxes, soluble im
purities, and any particulate or solid dirt adhering to the
fibers. The process consists essentially of treatment with
a detergent with, or without, the addition of an alkalai
(35:78).
20. Solvent: liquid substance that is capable of dis
solving or dispersing one or more other substances.
21. Spectral reflectance curve: graphic representation
of the light reflected from a surface under a specific light
ing condition.

8
22. Sublimation; the ability of a solid to pass
directly from the solid to gaseous state, or vice versa,
without an intervening liquid state.

CHAPTER II
REVIEW OF THE LITERATURE
The review of literature revealed that the proposed
study is a relatively original project and that work in this
area has not been conducted by other researchers. However,
literature pertinent to the determination of fiber content
in polyester/cotton blends was reviewed. The survey of
related literature is presented as follows: (1) Analysis of
Blend Compositions, (2) Fiber Properties, (3) Disperse Dyes,
(4) Thermosol Method, and (5) Colorimetric Measurement.
Analysis of Blend Compositions
The established method for determining polyester/cotton
fiber blend proportions is the procedure outlined in the
AATCC Test Method 20A (2). This gravimetric procedure in
volves weighing a bone dry sample, dissolving the cellulose
contained in the sample with 70% sulfuric acid and determin
ing the weight of the bone dry polyester residue. Thus, cal
culation of the quantities of polyester and cotton is possible
Other methods for determining fiber content in blends of
polyester/cotton fabrics have been reported in the literature.
These methods, like the AATCC test procedure, involve disolu-
tion or hydrolysis of one of the fiber components. King
et al., (21) have advocated the use of hot monoethanolamine
rather than 70% sulfuric acid or hot 5.25% sodium

10
hypochlorite. The advantage stated for monoethanolamine is
that this solvent is less corrosive than either sulfuric
acid or sodium hypochlorite. King and Stanonis (20) have
also reported that tetrachloroethane may be used to dissolve
the polyester component from the blend, thereby determining
the blend configurations. This method involves pretreatment
of the fabric with sodium bicarbonate or sodium acetate.
This pretreatment helps to prevent damage to the cellulose
by the hydrogen chloride which is generated in situ through
reaction of the tetrachloroethane with the moisture which is
present in the cotton.
In later work (19) these same authors demonstrated that
hexafluoroisopropanol dissolves the polyester out of the blend
with a reduced amount of damage to the cotton portion of the
fabric. With this method, as with the tetrachloroethane,
treatment with sodium bicarbonate or sodium acetate is
recommended.
Rueckert (30) has reported the use of trichloroacetic
acid to dissolve polyester in blends with cotton, wool or
flax. Preliminary testing has shown that the solvent appears
to have no detrimental effect on rayon, acrylic, polyethylene
or polypropylene. This method may not be used in blends con
taining nylon or polyvinyl chloride.
A variation of the dissolution methods has been reported
by Wasserman et al. (36). This microtechnique involves the

11
use of a very high solvent to fiber ratio resulting in rapid
dissolution, filtering and drying. Clark et al., (8) have
adapted this microtechnique to the analysis of multicompo-
nent fiber mixtures in blends. They reported savings in
time and solvents. They found significant discrepancies be
tween the micro and macroanalytical techniques in 15% of
their test samples.
In conclusion, the established methods for determining
fiber blend levels invariably involves the dissolution of one
of the fiber components and subsequent gravimetric determina
tion of the remaining fiber.. These procedures often involve
toxic chemicals and lengthy time periods (approximately five
hours) in which to be performed.
Fiber Properties
Cotton
Cotton is a cellulosic fiber containing linear polymers
which are built by combining several thousand anhydroglucose
units. Cellulose is a carbohydrate having the following
chemical composition (18:24):
r
OH
H I C
OH I C
OH H H I
c — 0 I CHjOH
H 1 ^
1 \ (
1
CHjOH 1 c —
' \ OH \ 1
c — 1 H
- 0
\ C
-c 1 OH
repeating unit 2 glucose units
n H 1 1 c -
/ OH
c -1 1
CHj
OH 1 1
- C H
— 0
OH
0
CHjOH I c — 0
•I \ OH H / I I / c — c I I H OH
OH
l_ _l

12
Polyester
Polyester is a polymeric ester. It is produced when an
acid (e.g., terephthalic acid) reacts with an alcohol (e.g.,
ethylene glycol). The following equation illustrates the
chemistry involved in the formation of du Font's Dacron
(28:435) .
nHOOC-^^COOH + nHO(CH2)20H >
H0[-0C-^^-C0.0(CH2) 20-]j^H+ (2n-l)H^0
Disperse Dyes
Early in the development of man-made fibers, it was
realized that new dyes, equipment and procedures v/ould have
to be developed to successfully dye the new fibers. Some
man-made and most of the synthetic fibers were shown to be
hydrophobic (11:273), with closely packed molecular chains
(14:18). These two factors led to difficulties when dyeing
was attempted with conventional water-soluble dyes. It was
found that the disperse dyes, developed in 192 3 for the dye
ing of cellulose acetate, could be successfully applied to
polyester fibers. Disperse dyes were first known as acetate
dyes, then dispersed acetate dyes, dispersion dyes and dis-
persol dyes. The presently accepted name, disperse dyes was
introduced in 1951, and accepted by the Society of Dyers and
Colourists in 1953 (32:2479). The definition of disperse
dyes according to the Society of Dyers and Colourists (32:

13
2479) is "Substantially water insoluble dyes having sub-
stantivity for one or more hydrophobic fibers, for example,
cellulose acetate and usually applied from fine aqueous
dispersion."
Cotton is a relatively porous fiber. It is normally
dyed with large, water soluble dyes which have a direct
affinity for the hydrophilic fiber. Polyester, on the other
hand, is a hydrophobic fiber usually having no reactive
groups. It is best dyed with essentially water insoluble,
disperse dyes which are molecularly relatively small in rela
tion to other dye classes. Because of the physical and chem
ical structure of cotton fibers, the molecularly small
disperse dyes can easily enter as well as leave the fiber.
It is for this reason that cotton is only stained by disperse
dyes.
Thermosol Method
Research conducted by scientists of the du Pont de
Nemours Company, found that dry heat alone would sublime a
film of disperse dye into most synthetic fibers. Joseph
Gibson (13:19) conducted research during the late 1940's
that led to the development of the Thermosol method. In
principle, the Thermosol method is very simple; it can be a
continuous dyeing procedure that involves padding the fabric
with a dye dispersion, then drying at 100°C to reduce migra
tion of the dye and finally, subliming the dye film into the

14
fibers at temperatures of 175-225°C for 5-90 seconds.
According to Gorondy (14:19) the Thermosol method is the
only practical, continuous dyeing process for the dyeing
of polyester fibers.
The ability of a dye to sublime, or pass directly from
the solid to gaseous state, is dependent upon the size of
the dye aggregates. The fewer the number of dye molecules
that are grouped together, the smaller the aggregate and the
more readily the dye will sublime. Commercially available
disperse dyes are finely ground powders that are capable of
being suspended in a state of dispersion. Because they are
so finely ground the dispersion has few coarse particles and
many fine, minute dye particles. This physical structure of
the dye dispersion allows disperse dyes to volatilize easily
and so suits them for the Thermosol process.
Balchin (3:13) has postulated that the heat of the
Thermosol method opens the polymer structure and makes the
fiber more permeable to the dye, which diffuses from the
surface into the interior of the fiber. Dye fixation is
dependent upon the molecular size, shape, solubility and
volatility of the dye in the fiber.
The Thermosol method is well suited for dyeing the
polyester portion of polyester/cotton blends. When the
fabric is padded with the dye dispersion, dyestuff is de
posited upon both fibers. Brent et al. (6:606) showed that

15
during the Thermosol phase of the dyeing procedure, some of
the dye deposited on the cotton portion of the blend trans
fers to the polyester portions of the blend. They concluded
that this movement of dye from one fiber to the other
occurred by vapor transfer rather than contact migration.
Most dye stain remaining on the cotton fibers may be removed
by a reduction/clear treatment.
Commercially, the growth of the Thermosol method
parallels that of polyester/cotton blends. By the late
1970's there were approximately one billion pounds of fiber,
mostly in polyester/cotton blends, annually being dyed by
the Thermosol process in the United States (13:22).
Colorimetric Measurement
Color Perception
The perception of color is dependent upon three separate
factors; an observer, an object, and light. The human per
ception of color is both a physical and psychological re
sponse. The eyes are the receptor, an object is the stimulus
and a lighting source is the illuminant.
Light rays are a part of the spectrum of electromagnetic
energy. Light rays are measured by the distance from wave
crest to wave crest using nanometers (one nm is equal to one-
billionth of a meter). Visible light rays compose a narrow
part of the total energy spectrum falling between 380 to

16
720 nm. The following colors are associated with the indi
cated wavelength ranges:
Blue, Violet 380-480 nm Green 480-560 nm Yellow 560-590 nm Orange 590-630 nm
Red 630-720 nm
Color is perceived when light from the visible spectrum
strikes the eye directly, or when an object reflects part of
the light spectrum back into the line of vision (9:173).
The receptors in the eye which are responsible for color
vision are the cones. When a stimulus hits the eye, it
excites the three types of cones present on the retina (in
terior lining of the eye) differently. These three types of
cones have different sensitivity to red, blue, and green.
The different responses by the cones to the color stimulus
are transmitted to the brain where they are mixed and color
is perceived (23:24).
Without light or a source of illumination, color cannot
be seen. White light, such as sunlight, incandescent light,
and fluorescent light, contains the whole spectrum of visible
light. Sir Isaac Newton demonstrated this in 1730 when he
separated white light into color bands by causing it to pass
through a prism.
Color Systems
For color to be discussed, reproduced and documented,
a need was recognized for an orderly arrangement of colors.

17
In the early part of this century. Professor Wilhelm Ostwald
devised a triangle based on a color wheel of six colors.
This system defines colors by their color content, white and
black content in terms of idealized spectrophotometric curves
(5:30). In the 1920's, Munsell expanded the Ostwald system
by accommodating brighter colors than had previously been
possible (23).
The Munsell system defines color using three descrip
tive terms; hue, value and chroma. Hue is the color family,
for instance, red, blue or green. Value is a description
of the amount of white or black a color contains, and chroma
is used to describe the saturation or purity of a color.
The Commission Internationale de I'Eclairage (CIE,
International Commission on Illumination) developed a color
system to be used in color measurement. Where the Ostwald
and Munsell color systems are based on physical samples,
(i.e., paint chips), the CIE system is based on mixing
colored lights.
The mixture of colored lights is known as additive
color mixture. With the addition of three primary colors;
red, blue, and green, secondary colors are achieved and
finally white is produced.
To report color data in the CIE system, the CIE X, Y,
and Z tristimulus values are used to determine chromaticity
coordinates x, y, and z. The CIE X, Y, and Z tristimulus

18
values are imaginary red, green and blue primary lights
chosen for color description. The use of these imaginary
primary lights circumvents the problem of negative numbers
that would occur if actual primary lights were used (5:38).
Only two of the chromaticity coordinates (x, y, or z)
are needed to plot a planar point on a chromaticity diagram
(since x + y + z = 1) which is capable of yielding dominant
wavelength and percent purity. The tristimulus value Y is
used to indicate luminosity, or the lightness of a color
(5:38), in addition to the quantity of green.
Colorimetry
A very broad definition of colorimetry (9:185) is "the
scientific measurement of color usually based on reflected
light." Colorimeters usually determine the proportions of
the primary additive lights which are necessary to match the
color reflected or transmitted by the sample under investiga
tion (35:668). In its simplest form, a colorimeter may con
sist of a viewing tube with half the viewing field being
illuminated by light reflected from the test specimen; the
other half being directly illuminated by a beam of standard
light. The beam of standard light is altered by the inser
tion of primary colored glass filters, until a color match
is obtained. With the use of calibrated controls and trans
formation equations, the CIE X, Y, and Z tristimulus values
may be determined (34:668).

19
Sample Preparation
Colorimeters are extremely sensitive to the way in
which a sample is displayed to the viewing eye. There are
many factors related to the sample, or sample preparation
which may influence the colorimetric reading.
Saltzman (33:130) has stated "We have instruments that
are far better than the samples we prepare for measurement."
Problems which cause inaccurate readings and which are asso
ciated with sample preparation include soiled samples giving
inaccurate readings, unlevel dyeings in the samples, im
proper mounting of the sample (allowing background to show
e.g., translucent samples and samples that are not flat in
the holder) and improper conditioning of the sample. Sur
face gloss, polarization and/or fluorescence also interfer
with correct measurement. According to Hoban (15:17) the
surface of the textile sample may cause problems when trying
to obtain an accurate reading. Highly textured fabrics such
as corduroy, twills, wide wale knits and sculptured carpets
will yield different measurements depending upon the sample
orientation in the instrument. If the pile of a fabric is
especially long as in some carpet samples, velours, and
velvets, then mounting the sample behind glass to keep the
pile from extending too far into the instrument may be neces
sary. If glass is used, then a correction factor must be

20
included into the color matching formula to account for the
effect of the glass on the readings. Suchecki (33:130) has
drawn attention to the fact that any change in the substrate
to which a dye is applied will affect the colorimetric read
ing. Any difference in the fiber content, denier or fiber
shape, fabric construction, or addition of finishing agents
can cause variations in dye acceptance.
Color Difference
A single number has long been sought which could give
accurate, repeatable and consistent information on the am.ount
or quantity of color difference between a sample and standard,
There are many calculations available to determine color dif
ference or AE. Unfortunately, the results of many of these
calculations are not the same, nor do they correspond with
subjectively assessed color differences. Two of the histor
ically more important color difference calculations were due
to Nickerson in 1936 (29) and Balinkin in 1941 (4) who devel
oped formulas based upon the Munsell Color System. The
National Bureau of Standards (NBS) developed a color differ
ence formula based on the uniform chromaticity scale of
Hunter (16). The American Society of Testing and Materials
(ASTM) has used the 194 2 Adams formula (1). The MacAdam
color space (27) was used as a basis for the revisions by
Davidson in 1956 (10), and Simon in 1958 (31). The most
recent recommendations for a color difference equation by

21
the American Association of Textile Chemists and Colorists
is the CIE 1976 L* a* b* formula (2:122-123).
Kubelka-Munk Analysis
The Kubelka-Munk equation for color computation is
based upon the relationship of reflectivity and colorant
concentration,
K/S [dye],^j^^^_
The Kubelka-Munk equation is:
K/S = (1-R) /2R
where:
K = sum of dyestuff and fiber absorption
S = scattering or changes in the direction of light rays
R = reflectance or light scattered back from opaque material
For dyeing of textiles, it is assumed that all scatter
ing occurs by the substrate, not by the colorant. The
Kubelka-Munk theory makes the following assumption: there
is diffuse illumination and viewing without polarization of
light; there is a plane, parallel surface with no light loss
at the edges; there is no allowance for the presence of
large particles, agglomeration or orientation of the par
ticles in the layer; there is optical contact with the next
layer; and finally, the scattering particles are large in
comparison to the wavelength, but small compared to the
fabric thickness (22:14-15).

CHAPTER III
PROCEDURE
The purpose of this study was to develop a rapid and
accurate methodology for determining polyester fiber content
in polyester/cotton blends. it was hypothesized that there
would be a significant difference between the Thermosol
techniques and the AATCC Test Method 20A for determining
polyester content, and that significant differences would be
found between the polyester contents of desized, and scoured
and bleached fabrics as determined by the Thermosol tech
niques. This chapter outlines the methodology developed for
this study. It also includes detailed descriptions of the
experimental design.
Pilot Study
A pilot study was conducted before initiation of the
actual research. The objectives of the pilot study were as
follows:
1.- To determine if there was a color difference between
varying polyester and cotton fabric blend levels when these
fabrics were dyed with the Thermosol method using disperse
dyes.
2. To develop a methodology for the dyeing and reduc
tion/clear procedures to be used in the study.
3. To determine if the research project would be fea
sible in terms of available time and equipment. 22

23
During the pilot study, it was found that there was
indeed a color difference between polyester/cotton blend
fabrics of various fiber blends which had been dyed using
the same disperse dye at the 2% w/w depth of shade. It
was determined during the pilot study that all fabrics
required a reduction/clear stripping before colorimetric
measurement of the samples in order to insure consistent
data acquisition. Familiarity with the equipment and
methods was also gained by the author during the pilot study.
Because the pilot study was successful in terms of the objec
tives mentioned above, it was recommended that the study
proceed.
Major Study
Experimental Design
After the pilot study was complete, the overall exper
imental design of the main study was outlined. It was recom
mended that the actual fiber contents of the fabric samples
be determined by AATCC Test Method 20A. The sublimation
techniques on both fabrics and fibers would be tested using
two heat sources: a Benz Laboratory Drying and Curing Appa
ratus and a regular household iron. It was also decided that
both bleached and desized fabrics be used to determine
if the polyester content could be determined with acceptable
accuracy using fabric in either state. Finally, it was
determined that the testing should be conducted using

24
at least two different disperse dyes (see Figure 1 for spe
cifics of the experimental design).
Selection of Fabric Samples
Five of the six fabrics used were produced specifically
for this project by the Textile Research Center (TRC), Texas
Tech University. The sixth fabric was donated by the Postex
Plant of Burlington Domestics (Division of Burlington Indus
tries, Inc.) Post, Texas. The fabrics were available orig
inally as greige goods and were all plain weave construction
being composed of polyester and cotton. The fabric blend
donated by Burlington had no specific fiber type or construc
tion information supplied with the sample (see Tables 1, 2,
3, and 4 for specific fiber and fabric properties).
Determination > Proportions in using Dissolut
of Bl ion
Fiber ends Analyses
To determine actual blend level compositions, all de-
sized fabric blend samples were analyzed using the AATCC
Test Method 20A (2:46-51) as well as a polyester dissolution
method (21).
Procedure for AATCC Test Method 20A. A bone dry sample
(1.0 g) was accurately weighed to the nearest 0.005 g. It
was transferred to a beaker (250 ml) and 70% sulfuric acid
(100 ml) was added. The sample was agitated for 32 minutes
then filtered through a fritted-glass crucible which had

25
fH>
c 0
•H <U V 3 (0 O*
•H C CO C rH £ - -0 ^ U M 3 (I) M w EH
c o •u •u o CJ • \ u 0) •u 10 V > 1 H 0 &
OQ
z s —
U M •H -M U (0 3 >, vw "O ^ i H ••-1 (0 3 U C M < i2
JZ~J c o
• H •P U) 3 -H
rH (0
o >. ~ m 10 "-'
•3 5
<u
•H
O
N C
CQ
C 0
•H • l - i
IC Ei
•i-H i H
^ cn
0) 3
cr •H —. cm J : - -u (1) El
• • / : —
0 u o
•H 01 J : -H u 0) 0) 10 C > i M (0 iH 4J J3 10 0) -u c
£ 1 «) i <
> >
N C
CQ
C 0
•H 0) +J 3 10 cr e -H •; 5 3 0) W EH
I
c 0
•H 0) -U 3 10 cr e -H
C rH 5 r-' o ^ o -^ M 3 Q) W m EH
J
c 0
•H •p 10
CO
VO
3 0)
0) N
•H 0) 0) Q
(I) M 3 0 u (0
V
u Id 0)
rH OQ
•• m •rt 01 > i
f-H lO
5 i H 10 U
•H •P 01
•H •P
(0 4J CO
c 0 •H •p <0
ev
i
a '0 u (0 -0 c lO •p CO
c 0
• ^ ^
01 VI (U u 01 (U ct:
ear
c -H J
(U
>-* O i
g •H
01 • H 0) > l
i-H (0
5
t
0 •1-• f -
F •r-
d c c « T
• « •
C c
c
7 c 0
•H 4J (0
•H u (0
> MH 0
4J
c (1)
: - H
o •H ( MH 1 UH
: (u ) 0 > CJ
•P 0) 0) H 1
•P
2 O H W w Q
< E-" Z
S H
cu X w I
D O M fa
26
TABLE 1
FABRIC CONSTRUCTION PROPERTIES (Of P o l y e s t e r / C o t t o n B l e n d F a b r i c s u s e d i n t h i s S t u d y )
Physical Properties
Yarn Sizes Ends Per Inch Picks Per Inch Fabric Weights (oz/yd )
Desized Fabrics Nominal % Polyester
100
35/1 82.0 76.0 3.45
65
69.0 58.0 3.65
60
35/1 82.0 81.0 3.50
50 .
35/1 82.2 81.0 3.58
40
35/1 82.0 80.8 3.40
0
35/1 85.2 80.8 3.60
Bleached Fabr ics Nominal % Po lyes t e r
Yarn Sizes Ends Per Inch Picks Per Inch Fabric Weights
2 (oz/yd )
35/1 82.8 62.4 3.15
—
—
—
——
35/1 88.0 72.6 3.30
35/1 88.8 74.0 3.30
35/1 86.4 73.8 3.30
35/1 92.0 73.8 3.29
TABLE 2
POLYESTER CONTENT* (Of P o l y e s t e r / C o t t o n B l e n d F a b r i c s u s e d i n t h i s S t u d y )
Nominal Po lye s t e r
100 65 60 50 40 0
Actual % Polyester
99.9 65.3 63.6 50.1 45.1 0.0
*As determined by the AATCC Test Method 20A (2)

27
TABLE 3
COTTON FIBER PROPERTIES
Type Acala S tap le Length (inches) 1 . 16 Uniformity Ratio 46 Short F ibe r s ( < l / 2 " ; %) 2.90 S t reng th (0 Gauge P r e s s l e y ; m ps i ) 98.13 Elongat ion (%) 4.83 Non- l i n t Content (%) 6.7
TABLE 4
POLYESTER FIBER PROPERTIES
Type Hoechst 421 S tap le Length ( inches) 1.5 Weight/Unit Length (denier) 1.5

28
been oven-dried, desiccator cooled and tared to the nearest
0.005 g. Suction was applied and 3 aliquots (10 ml each) of
70% sulfuric acid were passed through the sample. The
crucible was washed with sulfuric acid (50 ml, water:acid =
1:19), then with distilled water until the filtrate was
neutral to litmus. The suction was disconnected and ammonium
hydroxide (25 ml, water:acid = 8:92) was added to the cruci
ble, and allowed to soak for 10 minutes. The suction was
again applied to the residue which was then rinsed with dis
tilled water (150 md). The crucible and oven-dried (105°C
for 2 hr) residue were cooled in a desiccator for 30 minutes
and the weight of the dry residue was recorded to the near
est 0.005 g. The polyester percentage was then calculated
as follows:
Percent Polyester = Final Dry Weight ^
•^ Initial Dry Weight
Tetracholorethane Dissolution Analysis. A bone dry
fabric sample (1.0 g) was accurately weighed to the nearest
0.005 g. The sample was soaked in a solution of sodium bi
carbonate (8%), pressed between filter paper and oven-dried
(30 minutes at 105°C). The sample was then immersed in
tetrachloroethane (20 ml) and heated from room temperature
to the reflux temperature (150°C) of the solvent. The mix
ture was rapidly cooled to room temperature in an ice bath.
The fabric sample was transferred to fresh tetrachloroethane
(20 ml) and the heating/cooling process repeated twice. The

29
remaining cotton was rinsed 3 times with ethyl alcohol, then
with distilled water. The sample was oven-dried (2 hr at
105°C) cooled in a desiccator for 30 minutes and the weight
was recorded to the nearest 0.005 g. The cotton percentage
was then calculated as follows:
Percent Cotton = Final Dry Weight Initial Dry Weight
Fabric Preparation
The following steps were taken in preparing the samples
for testing:
1. Removal of Sizing. The warp yarns of the TRC fabric
samples had been sized with polyvinyl alcohol. To remove
this sizing, the following procedure was followed on a lab
oratory, small scale basis. Fabric samples (1 yd each) were
wetted out in a paddle machine (9 0 1 capacity). The water
temperature was raised to 96°C and the surfactant, Strodex
Super V-8 (Dexter Chemical Corporation; 10 g for each yard
of fabric) was added. The water temperature was maintained
for 1 hour during which time the fabric was continuously
agitated. The fabric was then rinsed thoroughly, extracted,
and tumble-dried.
The warp yarns of the Postex Plant fabric sample had
been sized with starch. The sample was desized with an
enzyme-containing mixture as follows: the fabric (262 g)
was wetted out in a paddle machine (90 1 capacity). The

30
water temperature was raised to 75°C and stabilized at this
temperature. Rapidase XC (GB Fermentation Industries, 25.5%
owf), sodium chloride (17% owf), and Triton XlOO (Rohm and
Haas, 1.7% owf) were added. The fabric was agitated con
stantly for 30 minutes, rinsed, extracted and tumble-dried.
2. Desizing, Scouring and Bleaching. In a separate
procedure, fabrics from the TRC were desized, scoured and
bleached (with the exception of the 100% polyester sample
which was desized only) on a full scale industrial basis.
The procedure for the desizing of the fabrics was as follows:
The fabrics (complete with end cloths) were loaded into a
jig. The jig was partially filled with water (300 1), and
hydrogen peroxide (1.5% owf, 35%) acetic acid (0.5% owf),
and Triton XlOO (0.1% owf) were added. The liquor tempera
ture was raised to 96°C and maintained for 1 hour. The
fabric was then rinsed twice with cold water. For scouring,
the jig was again filled with cold water to yield a liquor:
goods ratio of 10:1 and then caustic soda (see Table 5 for
specifics) was added. The liquor temperature was raised to
96°C and maintained for 30 minutes. The fabrics were rinsed
with cold and then boiling water. For bleaching, the jig
was again filled to produce a liquor:goods ratio of 10:1 and
hydrogen peroxide, sodium silicate, sodium carbonate and
sodium hydroxide were added. The liquor temperature was
raised to 96°C and maintained for 30 minutes. After draining

31
IT)
w
CQ < E-t
W U H
CQ <
Q 2; w 1 ^ CQ
o E-t EH O U \
w E w w
o
O
O :2 H
u <
H
CQ
Q
§ O !S H Cci D O U W
IW :? 0
dP
M-l 15 0
<*P
£ p
•H T) 0 W
e p -H 'O 0
CO
(U 73 •H X 0 5-1 13 > i K
<U -P fO
c 0 Xi u to u
in in in in
U-4
• o 13
• H
o
0) ^
-p \(i)
u •H (*P r H CN • H "sT
O
CM
in O
ro
O
ui en
C CD 0) T! tr> -H -N O X 0^ 5-1 o in
dP T3 5 ro >i CD ^ tli HI
O o in
in CN in o
o
o 4-4 - H
^ • ^ ' ^
O W fO
o\o fd o O c/5
o
ro
in
ro
O O
o •H U
x: -H IT" 0) —'
o o rH 00
O CN i H
CN O
u (U
iH +J 4-) (d CO C C 0) cu ^
•H >i +J dP e ^ C --' 0 0 0 2 CU U
o o in o

32
the spent bleach liquor, the fabrics were rinsed twice with
cold water, then again with boiling water, neutralized with
acetic acid (50 ml), and finally rinsed with cold water
prior to drying at 110°C.
3. Fabric Sample Size. The prepared fabric samples
were cut into samples (3.5 + 0.1 g), and numbered for iden
tification with an indelible marker.
Fiber Preparation
Samples (5.0 + 0.1 g each) were prepared for testing
in the following manner:
1. Gravimetric Measurement. Mixtures of polyester and
cotton fibers were weighed out into samples (5.0 g each).
Each sample was representative of a polyester/cotton blend
proportion (90/10, 80/20, 70/30, 60/40, 50/50, 40/60, 30/70,
20/80, 10/90).
2. Blending. The samples were hand blended to dis
tribute the fibers.
3. Package Preparation. Each sample was stitched into
a gauze package (Johnson and Johnson Gauze Sponge 4 X 4 - 16
ply, U.S.P. Type VII gauze) and marked for identification
with an indelible marker on a one-inch square of muslin sewn
into the end of the gauze package.
Preparation of Dye Dispersion
The disperse dyes chosen for this study were: Color
Index (CI) Disperse Blue 73, an anthraquinone, medium energy

33
dye and CI Disperse Red 122, an azo, medium to high energy
disperse dye. They were dispersed in the following manner.
The disperse dye powder was weighed accurately (20 +
.005 g) and then pasted with distilled water. To this paste
were added Superclear N 100, an antimigrant (Diamond Sham
rock Industries, 20 g), Strodex Super V-8 (10 ml of a 10%
solution), and enough water to produce a total weight of
one kilogram. This mixture was then converted into a disper
sion by blending it for 3 minutes using a Thermolyn Magnetic
Stirrer (Model #SP-A1025B). In this way a 2% weight per
weight (w/w) dispersion was produced. Dispersions containing
1% and 3% w/w of dye were produced in a similar manner.
Thermosol Method
Benz Procedure
The Benz Laboratory Drying, Curing and Setting Apparatus
(Benz) Unit (see Figures 2a and 2b) was used to develop a
standard method of Thermosoling. Six Thermosol techniques
were identified and tested using the Benz. Throughout the
study they will be referred to as follows:
Technique 1- Disperse Blue (2% w/w), Benz/Desized Fabric Technique 2- Disperse Blue (1% w/w), Benz/Desized Fabric Technique 3- Disperse Blue (3% w/w), Benz/Desized Fabric Technique 4- Disperse Red (2% w/w), Benz/Desized Fabric Technique 5- Disperse Blue (2% w/w), Benz/Fiber Technique 6- Disperse Blue (2% w/w), Benz/Bleached Fabric

34
FIGURE 2a
THE BENZ UNIT
Dye Pad 90-100% p . u .
Dry o
90 C Thermosol
200°C
FIGURE 2b
SCHEMATIC DRAWING OF BENZ UNIT

35
The following steps were used to dye each fabric sample for
the sublimation techniques listed on page 33.
1. The oven temperature thermostat was set for drying
(90°C).
2. The pad roller air pressure was set (8 psi) to pro
duce a wet pickup of dye dispersion in the range of 90 to
100%.
3. The fabric samples were dipped into the dye dis
persion, passed through the pad rollers and then weighed to
determine the percent wet pickup.
4. The padded fabrics were placed on the Benz frame
and held taut between the parallel rows of metal pins.
5. The impregnated fabric samples were dried at 90°C
for 2 minutes using a speed of 1.6 yards per minute.
6. The Benz heating unit was then equilibrated at 200°C
7. Dyeing was achieved by passing the dry fabrics
through the Benz Unit at 2 00°C for 2 minutes.
8. The samples were removed from the frame and sub
jected to a reduction/clear stripping process.
For dyeing fiber samples in the Benz, steps 1 through
8 were followed as for the fabric samples. The exception to
this was that in step number 5, the speed of passage was
reduced (5 minutes, 0.8 yards per minute) to insure that the
mass of fibers dried thoroughly.

36
Reduction/Clear. A solution of sodium hydrosulfite and
sodium hydroxide (1% w/w with respect to each) was prepared
in the following manner: sodium hydrosulfite and sodium
hydroxide (1 + 0.005 g each) were weighed out and dissolved
in distilled water (998 g). The solution was used immedi
ately before the sodium hydrosulfite had a chance to
decompose.
Fabric Samples. The dyed fabric samples were placed
into the reduction/clear solution (200 g, liquor:goods =
57:1) , and the temperature of the solution was raised to 85°C
and maintained for la minutes. The fabric samples were
stirred during the entire process. The samples were then
rinsed and air dried.
Fiber Samples. The fiber samples were subjected to the
reduction/clear treatment in the same manner as the fabric
samples, with the exception that the fibers were removed
from their gauze packages before stripping and the quantity
of stripping solution was increased to 2 85 g in order to keep
a constant liquor:goods ratio (57:1).
Machine Blending. To obtain the best possible blend,
the stripped fiber samples were processed through a Spinlab
33 8 Fiber Opener/Blender. The fibers were passed through
the blender 5 times, each time the sample was rotated through
45 degrees (with respect to the previous passage) and on the
final pass through the blender, the sample was turned top

37
to bottom. The fibers were then considered to be prepared
for colorimetric measurement.
Iron Procedure
Two iron sublimation techniques were identified and
tested. They will be referred to throughout the study by
their respective technique number. They are as follows:
Technique 7- Disperse Blue (2% w/w), Iron/Desized Fabric Technique 8- Disperse Blue (2% w/w), Iron/Fiber
These iron sublimation techniques used a household iron (Gen
eral Electric Self Clean II, 1100 watts) to sublime the dye
into the fibers. The iron was equilibrated to heat the
sample, sandwiched between aluminum foil, to a range of 199-
204°C as verified by heat sensitive paper. The following
procedure was followed:
Fabric Samples. The desized fabric samples were handled
in the following manner.
1. The samples were padded through the dye dispersion
in the same manner as were the samples dyed with the Benz
method.
2. The padded samples were dried in the following man
ner; they were pinned to one rack of a Stabil-Therm Constant
Temperature Cabinet (Model #DV-500C-2) with wooden, spring-
type clothes pins and positioned in the middle of the oven.
They were dried for 30 minutes at 90°C and removed from the
oven.

38
3. The iron was set at the "cotton" setting on the
heat indicator dial and adjusted so that it would supply dry
heat only, no steam.
4. The fabric sample was placed between two layers of
aluminum foil.
5. The heated iron was placed on the aluminum foil
encased sample for 20 seconds. Constant pressure was sup
plied by the actual weight of the iron (1 lb, 4 oz) plus the
weight of a lead collar that was fitted to the iron (7 lb,
12 oz).
6. After 20 seconds, the sample was removed from be
tween the layers of foil and subjected to the same reduction/
clear treatment as described for the Benz method samples.
Fiber Samples. The fiber samples were handled in the
following manner.
1. The samples were padded with dye dispersion in the
same manner as were the Benz method samples.
2. The padded fiber samples were dried in the same
manner as the fabric samples.
3. The iron was set at the "cotton" setting and
adjusted so that it would supply steam.
4. The fiber samples were blended in the same manner
as the Benz fiber samples. The blended samples were weighed
out (1 + 0.1 g) and spread into a thin mat on aluminum foil.

39
5. The heated iron was placed directly onto the fiber
sample for 20 seconds with the same pressure as was used on
the fabric samples. After 20 seconds, the sample was turned
over and the heating process repeated.
6. The fiber samples were subjected to the same reduc
tion/clear treatment (liquor:goods ratio = 57:1) as the
fabric samples.
Colorimetric Measurement
All colorimetric measurements were performed on a
Macbeth 1500 Color Measurement System. The following steps
were followed in making each measurement:
1. The instrument was calibrated with a standard white
tile using CIE illuminant C and a 2° viewing angle.
2. The samples were exposed to the viewing eye of the
instrument in accordance with the manufacturer's recommenda
tions.
3. Reflectance measurements were made three times on
each sample. Subsequently, the average of these three read
ings was recorded.
4. Data recorded for each sample included L* a* b*,
AE wavelength of minimum reflection, and the reflectance at
this wavelength.

40
AE was determined using the following CIE 19 76 L*
a* b* formula:
^^CIELAB = t(^L*)2 + (Aa*)2 + (Ab*)-]^/^
where
L* = 24 (lOOy/y )^^^ - 16
a* = 500 [(X/X )-^/^ - (Y/Y )-^^^]
h* = 200 [(Y/Y )-^/^ - (Z/Z )-'-/]
When X , Y , Z , are the tristimulus values of the o o o
nominally white standard, Y becomes equal to 100.
5. The Kubelka-Munk K/S values were then calculated
for each sample using the following equation:
K/S = (1 - R)^/2R

CHAPTER IV
ANALYSIS OF DATA
The primary objective of the study was to develop a
rapid method for the determination of polyester fiber blend
levels in polyester and cotton blends. The study consisted
of developing a methodology for the procedure using a Benz
Unit, then applying the same methodology using a household
iron.
The results of the Thermosol method were compared to
those results determined by the AATCC Test Method 20A.
Eight sublimation techniques were developed and subsequently
tested on polyester and cotton blends. Figure 3 is a graphic
overview of all the fiber determination techniques used in
this study.
Fiber Blend Analyses-Dissolution Test Results
AATCC Test Method 20A
The average polyester contents of a polyester, a cotton,
and four polyester/cotton blend fabrics as determined by the
AATCC Test Method 20A are summarized in Table 6. The data
reported are the means of twelve determinations for each
blend level group. The standard deviations indicate that
the accuracy of the test decreases as the polyester content
of the fabrics decreases.
41

4 2
^
Polyester /Cotton Blend SZ
Desized FaUaric
Sulfuric Acid Analysis
Tetrachloroethane Analysis
1 Desized Fedbric
Disperse Blue 2% w/w (5)
Benz Sublimation Technique
Disperse Blue ?.% w/w (8)
< 1 -Iron Sublimation Technique
Fiber Samples
r^
Fabric Samples
Benz Sublimation Technique
Bleached FeUaric .
Disperse Blue
Desized Fedsric T£>
Disperse Blue
Iron Sublijnation Technique
--0>
Disperse Red 2% w/w (4)
Disperse Blue 2% w/w (7)
r> 2%. w/w ( 6 , 1 )
1% w/w
(2)
3% w/w
(3)
FIGURE 3
METHODS OF FIBER CONTENT DETERMINATION

43
TABLE 6
FIBER ANALYSIS (AATCC T e s t Me thod 20A)
Sample Number
P o l y e s t e r Conten t (%)
Nominal
100
65
60
50
Polyester Content (%) Actual
99.9
66.6 65.6 66.1 66.2 65.5 64.8 64.8 64.8 65.2 65.0 64.8 64.5
65. 64. 64. 64. 63. 63. 63. 63. 62. 63. 63. 63.
51. 52 50 50 50 49 49 49 49 49 49 50
1 6 5 3 0 1 3 2 9 2 1 4
.0
.2
.1
.6
.4
.4
.6
.4
.4
.2
.5
.0
Actual Mean
Actual Standard Deviation
65.3 0.67
63.6 0.75
50.1 0.87

44
TABLE 6 — C o n t i n u e d
Sample Number
5
6
Polyester Content (%) Nominal
40
0
Polyester Content (%) Actual
49.0 46.7 46.7 45.9 44.1 43.9 44.1 44.2 44.1 44.1 44.6 44.0
0 .0
Actual Mean
45.1
Actual Standard Deviation
1.51

45
Tetrachloroethane Method
The average polyester contents of a polyester, a cotton,
and four polyester/cotton blend fabrics as determined by the
tetrachloroethane dissolution method are summarized in Table
7. The data reported are the means of three determinations
on fabric samples for each blend level. Comparison of the
standard deviations indicates that the tetrachloroethane pro
cedure is a more accurate test method than the sulfuric
acid dissolution technique for determining polyester content
in polyester/cotton blends. All standard deviations for the
tetrachloroethane test are lower than those standard devia
tions derived from the currently accepted AATCC Test Method,
despite the fact that fewer samples were tested using the
organic solvent technique.
Fiber Blend Analyses-Colorimetric Measurement
The data for all colorimetric measurements performed on
both cotton and polyester fabrics and polyester and cotton
fiber blend samples are shown in Tables 17 through 24 (Appen
dix B) . The data presented in these tables includes the
nominal and actual polyester contents, AE and K/S data as
well as the standard deviations for both AE and K/S.
From the raw data, simple linear regression equations
were generated to allow prediction of polyester content.
This latter information is presented in Tables 8 and 9.

TABLE 7
FIBER ANALYSIS (Tetrachloroethane Method)
46
Sample Number
1
2
3
4
5
6
Polyester Content (%) Nominal
100
65
60
50
40
0
Polyester Content (%) Actual
DC* DC DC
65.3 65.5 65.4
62.7 62.7 62.8
48.8 48.5 48.8
43.6 43.6 43.9
0.0 0.0 0.0
Actual Mean
65.5
62.7
48.7
43.7
Actual Standard Deviation
0.10
0.05
0.19
0.13
DC- Dissolved Completely.

TABLE 3
47
SIMPLE LINEAR REGRESSION EQUATIONS (y = ax + b)
(y = P o l y e s t e r C o n t e n t , x = AE)
Technique
1
2
3
4
5
6
7
8
9*
Regression Equation
Slope (a)
2.0904
2.2674
2.3132
2.6614
2.8971
2.5683
2.0221
2.3678
0.9843
Intercept (b)
-54.2268
-54.3757
-68.9171
-84.8770
-94.1716
-75.3981
-49.6458
-69.0264
0.8793
Coefficient of Determination (r^)
0.9744
0.9598
0.9707
0.9481
0.9990
0.9966
0.9405
0.9199
0.9876
standard Error y on x
1.9418
2.5489
2.0757
2.7621
0.9187
0.7913
2.9587
3.8292
0.9824
Technicjue Technique Technique Technique Technique Technique Technique Technicjue Technicjue
1-Disperse Blue 2-Disperse Blue 3-Disperse Blue 4-Disperse Red 5-Disperse Blue 6-Disperse Blue 7-Disperse Blue 8-Disperse Blue 9-AATCC Test Method 20A/Desized Fabr ic
(2% (1% (3% (2% (2% (2% (2% (2%
w/w) , w/w) , w/w) , w/w) , w/w) , w/w) , w/w) , w/w) ,
Benz/Desized Fabric Benz/Desized Fabric Benz/Desized Fabric Benz/Desized Fabric Benz/Fiber Benz/Bleached Fabric Iron/Desized Fabric Iron/Fiber
*y = i n d i v i d u a l measurement of blend l e v e l X = a c t u a l mean of blend l e v e l measurements

48
TABLE 9
SIMPLE LINEAR REGRESSION EQUATIONS (y = ax + b)
(y = Polyester Content, x = K/S)
Technique
1
2
3
4
5
6
7
8
9*
Regression Equation
Slope (a)
10.7385
13.1407
10.6516
16.0207
13.5695
14.7866
19.4711
12.4579
0.9843
Intercept (b)
23.1384
21.0225
21.9046
16.1786
7.2770
16.1088
24.5346
15.4252
0.8793
Coefficient of Determination (r^)
0.9688
0.9538
0.9775
0.9151
0.9433
0.9912
0.9209
0.9553
0.9876
standard Error y on x
2.1558
1.9442
1.8212
2.6349
6.2631
0.7841
2.5185
2.8629
0.9824
Technique 1-Technique 2-Technique 3-Technique 4-Technique 5-Technique 6-Technique 7-Technique 8-Technique 9-
Disperse Disperse Disperse Disperse Disperse Disperse Disperse Disperse
Blue Blue Blue Red Blue Blue Blue Blue
(2% (1% (3% (2% (2% (2% (2% (2%
w/w) w/w) w/w) w/w) w/w) w/w) w/w) w/w)
Benz/Desized Fabric Benz/Desized Fabric Benz/Desized Fabric Benz/Desized Fabric Benz/Fiber Benz/Bleached Fabric Iron/Desized Fabric Iron/Fiber
AATCC Test Method 20A/Desized Fabric
*y = individual measurement of blend level X = actual mean of blend level measurements

49
Simple Linear Regression Analysis-AE Data
The best fit of the equation y = ax + b in Table 8 is
Technique 5. The next best fit for the equation y = ax + b
is Technique 6. Both of the above coefficients of determi-
, 2, 2
nation (r ) are greater than the r value determined for the
AATCC Test Method. The remaining coefficients of determina
tion for the equations which predict polyester content using 2 2
AE reflectance data range from r =-.92tor =0.97. 2
These high values of r indicate that between 92% and 97% of
the variation in predicted polyester content can be explained
in terms of reflectance. The remaining variation could be
due to experimental error.
Simple Linear Regression Analysis-K/S Data
In Table 9 the best fit of the equation y = ax + b is
seen to be sublimation Technique 6. This method also showed
the least standard error of any of the blend determination
techniques, even that of the AATCC Test Method. The second
best fit of the equation y = ax + b is the coefficient of
determination for sublimation of Technique 3. The remaining
coefficients of determination of the equations for predicting 2
polyester content with K/S reflectance data range from r =
2 0.92 - 0.96. Again, these high values of r indicate
that between 92% to 96% of the variation in predicted poly
ester content can be explained in terms of K/S data. It is

50
possible that the remaining variation could be caused by
experimental technique.
Confidence Limits for Predicting Polyester Content
The simple linear regression equations shown in Tables
8 and 9 were applied to predict polyester content using both
AE and K/S data. The results of these predictions are shown
in Tables 10 and 11. These tables present the averages of
the predicted polyester content at each blend level for each
sublimation technique. Standard deviations, confidence
limits for the predicted means as well as standard errors of
the means are also shown in Tables 10 and 11.
Table 10 shows that the standard errors of the means
fall with the + limits prescribed by the Federal Trade Com
mission for acceptable error in labeling, with the exception
of Technique 5. Table 11 illustrates that when K/S data
are used to predict polyester content, all standard errors
of the mean fall within the +_ 3% limits prescribed by the
FTC.
Coefficients of Variation
Coefficients of variation (CV) were calculated for all
blend determination techniques. The CV is a percent of the
sample average, it allows for any discrepancies between
sample sizes for each method. The CV's allow a direct

51
TABLE 10
CONFIDENCE LIMITS OF SUBLir4ATI0N TECHNIQUES FOR DETERiMINING POLYESTER CONTENT IN
POLYESTER/COTTON BLENDS BY AE
Sample Number
1
2
3
4
5
N*
12 12 12 12
12 12 12 12
12 1] 12 12
12 12 12 12
__
^_
_...
_ ^
.«._
- v ^
^ ^
—
Polyester Content
%
AATCC
65.1 63.6 50.1 45.1
65.1 63.6 50.1 45.1
65.1 63.6 50.1 45.1
65.1 63.6 50.1 45.1
90.0 80.0 70.0 60.0 50.0 40.0 30.0 20.0 10.0
N*
6 6 6 6
6 6 6 6
6 6 6 6
6 6 6 6
6 6 6 6 6 6 6 6 6
a of Predicted Polyester Content (%) by AE
0.52 0.64 1.29 0.89
1.02 0.53 0.89 1.95
0.54 0.98 0.51 0.58
1.60 1.74 0.57 0.84
1.32 1.05 3.49 2.79 4.51 2.68 1.40 1.23 2.74
95% Confidence Level Polyester Content by AE
Limits for predicted mean
66.3 ± 0.55 61.7 ± 0.67 51.9 ± 1.35 44.5 ± 0.93
66.2 ± 1.07 61.1 ± 0.56 52.1 ± 0.93 44.5 ± 2.04
65.6 ± 0.57 61.9 ± 1.03 52.2 ± 0.54 44.0 ± 0.61
65.1 ± 1.68 62.0 ± 1.83 53.3 ± 0.66 43.6 ± 0.88
88.8 ± 1.39 79.8 ± 1.10 70.4 ± 3.66 60.3 ± 2.92 50.3 ± 4.73 41.5 ± 2.81 28.7 ± 1.47 20.3 ± 1.29 8.90 ± 2.87
standard error of mean
0.21 0.26 0.51 0.36
0.42 0.22 0.36 0.80
0.22 0.40 0.21 0.24
0.65 0.71 0.23 0.34
0.54 0.43 1.42 1.14 1.84 1.09 0.57 0.50 1.19

52
TABLE 1 0 — C o n t i n u e d
Sample Niimber
6
7
8
N*
12 12 12
12 12 12 12
_
—
—
Polyester Content
%
AATCC
63.6 50.1 45.1
65.1 63.6 50.1 45.1
60.0 50.0 40.0
N*
6 6 6
6 6 6 6
6 6 6
aof Predicted Polyester Content (%) by AE
0.92 0.11 1.11
0.88 1.13 0.69 2.68
1.26 1.42 1.93
95% Confidence Level Polyester Content by AE
Limits for predicted mean
63.4 ± 0.96 50.7 ± 0.12 44.7 ± 1.16
65.4 ± 0.92 60.4 ± 1.19 53.4 ± 0.72 43.7 ± 2.81
62.0 ± 1.32 53.2 ± 1.49 43.6 ± 2.03
Standard error of mean
0.37 0.05 0.45
0.36 0.46 0.28 1.09
0.51 0.58 0.79
*N = number of samples
Technique Technique Technique Technique Technique Technique Technique Technicjue
1-Disperse 2-Disperse 3-Disperse 4-Disperse 5-Disperse 6-Disperse 7-Disperse 8-Disperse
Blue Blue Blue Red Blue Blue Blue Blue
(2% (1% (3% (2% (2% (2% (2% (2%
w/w) , w/w) , w/w) , w/w) , w/w) , w/w) , w/w) , w/w) ,
Benz/Desized Benz/Desized Benz/Desized Benz/Desized Benz/Fiber
Fabric Fabric Fabric Fabric
Benz/Bleached Fabric Iron/Desized Iron/Fiber
Fabric
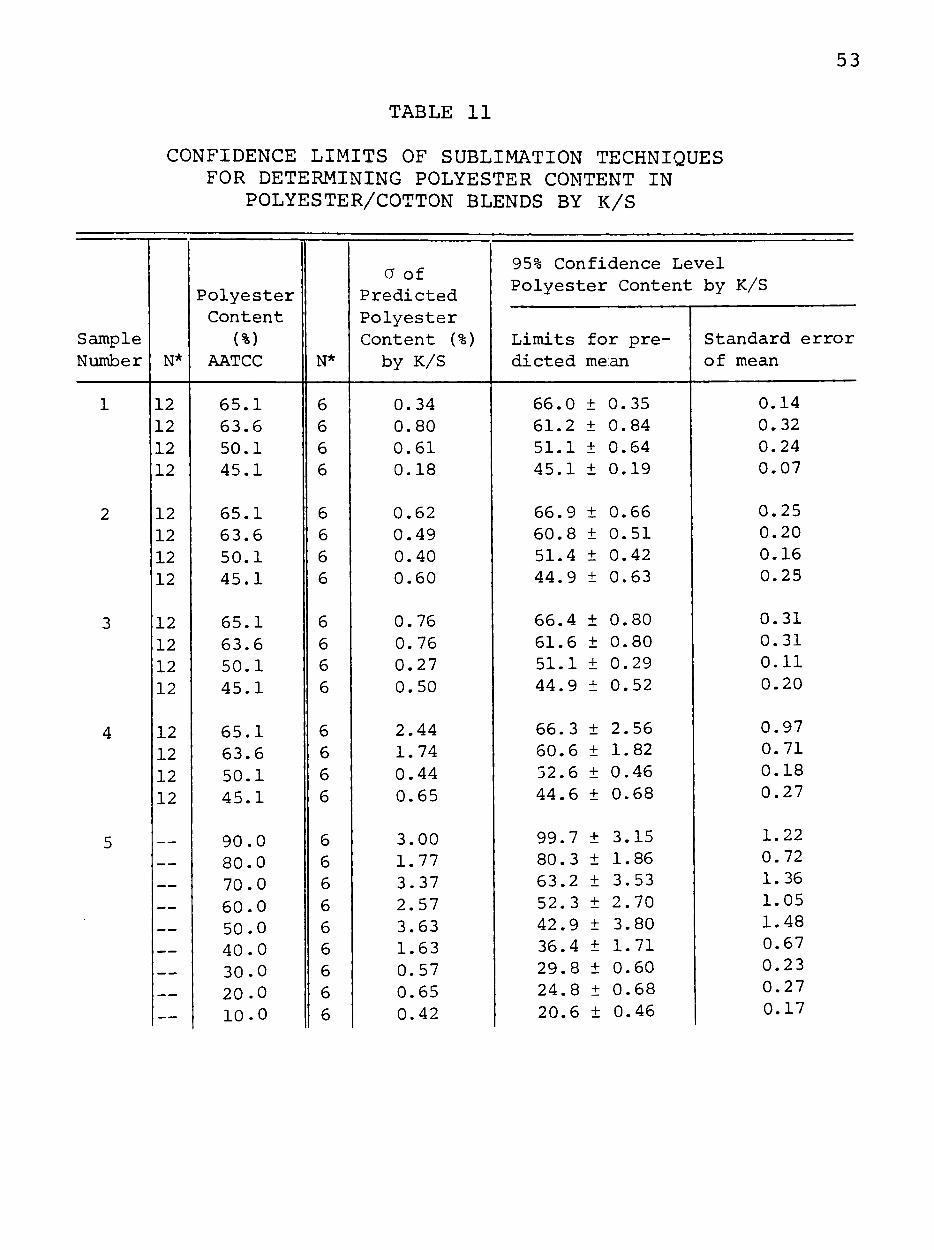
TABLE 11
CONFIDENCE LIMITS OF SUBLIMATION TECHNIQUES FOR DETERMINING POLYESTER CONTENT IN
POLYESTER/COTTON BLENDS BY K/S
53
Sample Number
1
2
3
4
5
N*
12 12 12 12
12 12 12 12
12 12 12 12
12 12 12 12
___
_.-
^^
_ ^
^^
_ _>
^ ^
—
Polyester Content
(%)
AATCC
65.1 63.6 50.1 45.1
65.1 63.6 50.1 45.1
65.1 63.6 50.1 45.1
65.1 63.6 50.1 45.1
90.0 80.0 70.0 60.0 50.0 40.0 30.0 20.0 10.0
N*
6 6 6 6
6 6 6 6
6 6 6 6
6 6 6 6
6 6 6 6 6 6 6 6 6
a of Predicted Polyester Content (%) by K/S
0.34 0.80 0.61 0.18
0.62 0.49 0.40 0.60
0.76 0.76 0.27 0.50
2.44 1.74 0.44 0.65
3.00 1.77 3.37 2.57 3.63 1.63 0.57 0.65 0.42
95% Confidence Level Polyester Content
Limits for predicted me:an
66.0 ± 0.35 61.2 ± 0.84 51.1 ± 0.64 45.1 ± 0.19
66.9 ± 0.66 60.8 ± 0.51 51.4 ± 0.42 44.9 ± 0.63
66.4 ± 0.80 61.6 ± 0.80 51.1 ± 0.29 44.9 ± 0.52
66.3 ± 2.56 60.6 ± 1.82 52.6 ± 0.46 44.6 ± 0.68
99.7 ± 3.15 80.3 ± 1.86 63.2 ± 3.53 52.3 ± 2.70 42.9 ± 3.80 36.4 ± 1.71 29.8 ± 0.60 24.8 ± 0.68 20.6 ± 0.46
by K/S
Standard error of mean
0.14 0.32 0.24 0.07
0.25 0.20 0.16 0.25
0.31 0.31 0.11 0.20
0.97 0.71 0.18 0.27
1.22 0.72 1.36 1.05 1.48 0.67 0.23 0.27 0.17

54
TABLE 1 1 — C o n t i n u e d
Sample Number
6
7
8
N*
12 12 12
12 12 12 12
_ _
—
Polyester Content
(%)
AATCC
63.6 50.1 45.1
65.1 63.6 50.1 45.1
60-0 50.0 40.0
N*
6 6 6
6 6 6 6
6 6 6
a of Predicted Polyester Content (%) by K/S
1.00 0.21 0.79
1.49 1.62 0.79 1.56
1.74 1.15 1.41
95% Confidence Level Polyester Content
Limits for predicted mean
63.5 ± 1.31 50.2 ± 0.22 45.1 ± 0.83
72.1 ± 1.56 61.1 ± 1.71 47.8 ± 0.83 44.9 ± 1.64
60.2 ± 1.83 49.5 ± 1.21 40.3 ± 1.48
by K/S
Standard error of mean
0.21 0.09 0.32
0.61 0.66 0.32 0.64
0.71 0.50 0.58
N = number of samples
Technique Technique Technicjue Technique Technique Technique Technique Technicjue
1-Disperse 2-Disperse 3-Disperse 4-Disperse 5-Disperse 6-Disperse 7-Disperse 8-Disperse
Blue Blue Blue Red Blue Blue Blue Blue
(2% (1% (3% (2% (2% (2% (2% (2%
w/w) , w/w) , w/w) , w/w) , w/w) , w/w) , w/w) , w/w) ,
Benz/Desized Fabric Benz/Desized Fabric Benz/Desized Fabric Benz/Desized Fabric Benz/Fiber Benz/Bleached Fabric Iron/Desized Fabric Iron/Fiber

55
comparison to be made between the methods in terms of dis
persion from the mean. Table 12 shows the results of these
comparisons.
Of all the methods used to determine polyester content,
the tetrachloroethane analysis was found to have the lowest
CV's for all the polyester blend fabrics. For the fiber
analysis, the CV's generated from the AE data were consis
tently lower than those generated by the K/S values.
Determination of Significance
To determine if there were significant differences be
tween the variables proposed in the following hypotheses,
the t-test for statistical significance was conducted at the
a£.05 level or beyond. The results of these tests are com
piled and presented in Table 13.
Hypothesis 1. There are significant differences between the Thermosol techniques and the AATCC Test Method 20A in determining the polyester content in desized polyester/cotton blend fabrics.
The first hypothesis was partially accepted. Table 13
shows that there were mixed significance levels within each
Thermosol technique. Overall, the AE data showed greater
nonsignificance than the K/S data. Techniques 1-4 showed
mixed significance for both AE and K/S data when the pre
dicted polyester content was compared to the polyester con
tent as determined by the AATCC Test Method. Technique 5
showed no significant difference at thea<_. 05 level between

56
TABLE 12
COEFFICIENTS OF VARIATION (Comparison of AE, K/S, AATCC andTetrachloroethane
Determination of Polyester Techniques)
Sample Number
1
2
3
4
5
Polyester Content
(%)
Nominal
65 60 50 40
65 60 50 40
65 60 50 40
65 60 50 40
90 80 70 60 50 40 30 20 10
Coefficient of Variation
AE
0.35 0.54 0.99 0.91
0.68 0.44 0.80 1.89
0.40 0.76 0.42 0.43
1.06 1.18 0.42 0.68
0.72 0.63 2.10 1.62 3.13 1.97 1.14 1.06 2.63
Coefficient of Variation
K/S
0.73 2.26 1.92 0.49
1.43 1.32 1.29 2.20
1.87 2.09 0.71 1.78
5.11 3.97
12.55 2.24
3.37 2.42 6.31 6.02 10.65 8.08 2.41 5.42 5.10
Coefficient of Variation AATCC
1.03 1.17 1.73 3.34
1.03 1.17 1.73 3.34
1.03 1.17 1.73 3.34
1.03 1.17 1.73 3.34
—
—— —
——— —
1
Coefficient of Variation Tetrachlor
oethane
0.15 0.08 0.03 0.30
0.15 0.08 0.03 0.30
0.15 0.08 0.03 0.03
0.15 0.08 0.03 0.30
" * ^ • " • "
^ ^—^
^ •-—^
^
^

57
TABLE 12—Continued
Sample Number
6
7
8
Polyester Content
(%)
Nominal
60 50 40
65 60 50 40
60 50 40
Coefficient of Variation
AE
0.68 0.14 0.92
0.79 2.68 0.67 2.86
0.97 1.16 1.72
Coefficient of Variation
K/S
2.50 0.43 A.> • ^ _/
2.24 2.94 1.51 6.73
3.44 3.03 4.82
Cc-efficient of Variation AATCC
1.17 1.73 3.34
1.03 1.17 1.73 3.34
Coefficient Variation Tetrachlor-
eothane
0.08 0.03 0.30
0.15 0.08 0.03 0.30
Technique Technique Technique Technique Technique Technique Technique Technique
1-Disperse 2-Disperse 3-Disperse 4-Disperse 5-Disperse 6-Disperse 7-Disperse 8-Disperse
Blue Blue Blue Red Blue Blue Blue Blue
(2% (1% (3% (2% (2% (2% (2% (2%
w/w) , w/w) , w/w) , w/w) , w/w) , w/w) , w/w) , w/w) ,
Benz/Desized Fabric Benz/Desized Fabric Benz/Desized Fabric Benz/Desized Fabric Benz/Fiber Benz/Bleached Fabric Iron/Desized Fabric Iron/Fiber

58
TABLE 13
ANALYSIS OF AATCC TEST METHOD AND SUBLIMATION TECHNIQUES
(t-Test for Statistical Significance)
Technique
1
2
3
4
5
6 v.
Nominal Polyester Content (%)
65 60 50 40
65 60 50 40
65 60 50 40
65 60 50 40
90 80 70 60 50 40 30 20 10
60 50 40
df
16 16 16 16
16 16 16 16
16 16 16 16
16 16 16 16
5
5 5 5 5 5 5 5
16 16 16
t AE
-2.93 5.53
-3.75 0.87
-2.17 7.36
-4.58 0.72
0.92 3.92
-5.56 1.66
0.43 2.90 -8.46 2.18
2.13 0.43 -0.33 -7.30 -0.14 -1.34 0.52
-0.62 -0.97
0.64 -1.79 0.56
t K/S
5.56 6.12 -2.55 0
-4.87 8.38
-3.65 0.16
-3.02 5.32
-2.84 0.34
-1.22 5.16
-6.47 0.69
-7.61 -0.43 4.54 4.54 4.60 5.18 -1.12 -17.23 -38.90
0.30 -0.45 0.09
Level of S
AE
S* S S NS**
NS S S NS
NS S S NS
NS S S NS
NS NS NS NS NS NS NS NS NS
NS NS NS
ignificance
K/S
S S S NS
S S S NS
S S S NS
NS
S S NS
S NS S S S s NS S S
NS
NS NS

TABLE 13—Continued
59
Technique
7
8
Nominal Polyester Content (%)
65 60 50 40
60 50 40
df
16 16 16 16
5 5 5
t AE
-8.06 -0.27
-3.81 -5.53 -4.53
t K/S
-3.03 8.40
-5.77 0.29
-0.31 0.96
-0.49
Level of Significance
AE
NS s s NS
S S S
K/S
S S s NS
NS NS NS
* *
Significant at the a<_ .05 level.
Nonsignificant at the a< .05 level.
Technique Technique Technique Technique Technique Technique Technicjue Technique
1-Disperse 2-Disperse 3-Disperse 4-Disperse 5-Disperse 6-Disperse 7-Disperse 8-Disperse
Blue Blue Blue Red Blue Blue Blue Blue
(2% (1% (3% (2% (2% (2% (2% (2%
w/w) , w/w) , w/w) , w/w) , w/w) , w/w) , w/w) , w/w) ,
Benz/Desized Fabric Benz/Desized Fabric Benz/Desized Fabric Benz/Desized Fabric Benz/Fiber Benz/Bleached Fabric Iron/Desized Fabric Iron/Fiber

60
the known polyester content as determined by gravimetric
measurement and AE reflectance data. There was partial sig
nificance between the predicted and known polyester content
when K/S data were analyzed for this technique. Technique
6 showed no significant difference at the a<_.05 level from
predicted polyester content with either AE or K/S reflec
tance data. Technique 7 was found to have mixed signifi
cance levels for both AE and K/S reflectance data.
Technique 8 indicates a significant difference between pre
dicted and known polyester content as determined with the
AE data. There was no significant difference between the
predicted polyester content and the known polyester content
as determined with the K/S data at a<_. 05 level.
Hypothesis 2. There are significant differences between the polyester content in desized polyester/ cotton blend fabrics compared to the polyester content in scoured and bleached polyester/cotton blend fabrics as determined by the Thermosol techniques.
The data were analyzed in terms of Hypothesis 2, which
was then partially accepted. Table 14 shows the results of
a comparison for significance at the a<_.05 level between
desized (Technique 1) and bleached fabrics (Technique 6) .
The differences in predicted polyester contents of the
desized, and scoured and bleached samples using AE reflec
tance data were found to be nonsignificant in all three
levels. The differences in predicted polyester contents of
the desized, and scoured and bleached samples using K/S

51
reflectance data were found to be nonsignificant in 2 of
the 3 blend levels.
TABLE 14
COMPARISON OF DESIZED, AND SCOURED '. AND BLEACHED FABRIC
(t-Test for Statistical Significance)
Nominal Polyester Content
60 50 40
df
5 5 5
t AE
-0.60 2.32
-0.40
t K/S
-4.22 1.73 0.20
Level of S: AE
NS* NS NS
Lgnificance K/S
s** NS NS
* *
'Nonsignificant at the a^.05 level.
Significant at the af_.05 level.
Analysis of Unknown Fiber Blends
As an ultimate test of the validity of one of the sub
limation analysis techniques for predicting polyester con
tent, three samples of polyester/cotton fibers of unknown
blend levels were subjected to Technique 8. Technique 8
was identified because it was the technique most likely to
be utilized in a small laboratory situation since it
required only a household type iron as the source of heat.
The raw data for this technique are illustrated in Table 25
(Appendix B). Simple linear regression equations generated
from Technique 8 were used to predict polyester content of

62
these known blend levels. The results of these analyses
are shown in Table 15.
TABLE 15
PREDICTED POLYESTER CONTENT OF "UNKNOWN" FIBER BLEND
(Simple Linear Regression Analysis)
Predicted Polyester Content (%) AE equation
50.4 75.1 11.8
Predicted Polyester Content (%) K/S equation
51.9 86.9 16.3
standard Deviation AE
3.60 2.90 2.81
K/S
4.24 5.70 0.03
The t-test for statistical significance was used to
determine if there was a significant difference between the
known polyester content as determined by gravimetric mea
surement and polyester content as determined by the subli
mation Technique 8. Only in one instance did the technique
show statistically significant differences at the a<_.05
level or beyond, this significant relationship occurred .
when the polyester content, as predicted from AE data and
the known polyester content of this blend were compared.
Table 16 summarizes the t-test for statistical significance
for this technique.

TABLE 16
COMPARISON OF "UNKNOWN* TO KNOWN POLYESTER CONTENT
(t-Test for Statistical Significance)
63
Known Polyester Content (%)
52.8 85.0 15.0
df
2 2 2
t AE
1.17 5.94 1.98
t K/S
0.51 -0.51 -0.92
Level of Si AE
NS* S** NS
gnificance K/S
NS NS NS
*Nonsignificant at the a<.05 level. * * Significant at the ci<_.05 level.

CHAPTER V
SUMMARY, CONCLUSIONS AND REC0Mr>4ENDATI0NS
The purposes of this chapter are to summarize the
study and draw conclusions which are based on the analyses
of data collected in the study. Recommendations will also
be made for further research into the Thermosol technique
for the determination of polyester content in polyester
blends.
Summary
A methodology was developed for the prediction of
polyester content in polyester/cotton blends dyed with dis
perse dyes using a procedure involving sublimation. Reflec
tance data were used in the prediction equation.
A total of six fabrics of different blend levels were
tested in both the desized, and scoured and bleached states.
Eleven fiber blend levels were also tested. A total of
eight different sublimation techniques were developed and
identified. The polyester contents of the fabric blends
were determined by the AATCC Test Method 20A and the results
were considered to represent the absolute polyester contents.
The actual polyester content of the fiber blends was pre
determined by gravimetric measurement.
All dissolution and reflectance raw data were presented
Standard deviations were determined for the predicted
64

65
polyester content as determined by simple linear regression
equations using a known variable, either AE or K/S, both of
which were derived from reflectance readings as measured by
a colorimeter. Coefficients of variation, confidence limits
for predicted means and standard errors of the means were
also determined. Ultimately, t-tests for statistical sig
nificance were used to analyze the two hypotheses developed
at the beginning of the study.
Conclusions Related to Objectives
The following findings and conclusions were related to
preliminary analyses of the raw data using standard devia
tions, coefficients of variation, standard errors of the
predicted means and coefficients of determination (r ) of
simple linear regression equations. «
1. The first objective was to develop a methodology
for a rapid and accurate procedure to determine polyester
content in polyester/cotton blends that fell within the j 3%
range allowed by the FTC for truth in labeling. From the
standard errors of the predicted means for polyester con
tents using both AE and K/S reflectance data, it was indi
cated that individual measurements of the sample fell within
+_ 3% of the mean required for stating blend content in
labeling. This indicated that for the sublimation tech
niques, individual measurements were accurate within the

66
limits prescribed by law (at the 95% confidence level).
The variation between the predicted means using Technique
5, and the actual means of the fiber blends show that
caution should be taken before applying this particular
technique to the determination of polyester content.
2. The second objective was to standardize rapid
Thermosol techniques using a Benz Unit and a household type
iron as the heat sources. The eight sublimation techniques
developed for this study were standardized in terms of pro
cedure. It was found that all techniques could be performed
within a 60 minute period.
3. The third objective was to determine if medium or
medium to high energy dyes could be used in the Thermosol
process. It was found that polyester content was accurately
predicted by the sublimation techniques using either energy
dye.
4. The fourth objective was to develop simple linear
regression equations that would accurately predict polyester
content from reflectance data. In three cases, the coeffi-
2 cients or determination (r ) of the simple linear regression
equations which were used to predict the polyester content 2
utilizing reflectance measurements were greater than the r
value of the simple linear regression equation used to pre
dict the polyester content of desized fabrics based on the
AATCC Test Method. In other words, the three sublimation

67
techniques involved are more accurate methods of predicting
polyester content than the AATCC Test Method (when their r^
values and standard errors are compared). Although the
remaining sublimation techniques resulted in simple linear
regression equations having r^ values less than that of the
equation derived from the AATCC Test Method, the savings in
time and chemicals involved in the sublimation techniques
could well offset the slight reduction in accuracy of these
methods.
5. The fifth objective was to determine the polyester
content of three "unknown" fiber blends using a Thermosol
technique. When the polyester contents of "unknown" fiber
blend level samples were determined using Technique 8,
only one of the fiber blends showed a polyester content sig
nificantly different from the known polyester content for
that sample. This occurred only when AE reflectance data
were used in the simple linear regression equation.
6. The sixth objective was to compare the accuracy of
the AATCC Test Method 20A and the accuracy of the tetra
chloroethane test method for determining polyester content.
The results obtained using AATCC Test Method 20A had a pro
gressively larger standard deviation as the polyester
content of the sample decreased. This indicates that the
accuracy of the test method decreases as the polyester con
tent decreases. The tetrachloroethane dissolution analysis

68
was shown to have smaller coefficients of determination in
all of the four fabric blend levels than AATCC Test Method
20A. This indicates that the organic solvent technique
produces results that are more accurate and reliable than
the results of AATCC Test Method 20A. With only one ex
ception, all CV's for a reflectance measurement (either AE
or K/S) were lower than the CV's for the AATCC dissolution
analysis technique.
Conclusions Related to the Hypotheses
Tests of significance at the a<_.05 level resulted in
the following conclusions. The observations are discussed
in the order of the hypotheses.
1. The first hypothesis relating the prediction of
polyester content to reflectance data was the basis for the
following conclusions. The statistical significance levels
between the known polyester contents and the predicted poly
ester contents at the a; .05 level varied for each sublima
tion technique depending upon which set of reflectance data
was utilized, AE or K/S. The exception to this was Tech
nique 6. This technique was found to be the most accurate
for predicting polyester content in fabric blends. Accord-2
ing to the r values and standard errors as determined by
the simple linear regression equations. Technique 8 was
found to be the best method for predicting polyester con
tent in fiber blends.

69
2. The second hypothesis related polyester content
and the condition of the fabric (desized only or scoured
and bleached) when a Thermosol technique was used to predict
polyester content. The fabric state was found to be a fac
tor in only one blend level using K/S data. The fabric
state was not a significant factor for any blend level when
AE reflectance data were employed to predict the polyester
content.
Recommendations for Further Research
Recommendations for further research include the
following:
1. A method be developed for the determination of
polyester content in polyester/cotton blends using disperse
dyes other than those used in this study.
2. A method be developed for the determination of
polyester content in polyester/cotton blends using fabric
constructions (e.g., knits, nonwovens, laces) other than
that used in this study.
3. A method be developed for the determination of
polyester content in polyester/cotton blends using heat
sources other than those used in this study (e.g., Thermosol
oven, microwave oven, mangle iron).
4. A method be developed for the determination of
polyester content in polyester/cotton blends containing
polyester types other than that used in this study.

70
5. A method be developed for the determination of
fiber content in other blends using the methodology devel-
oped in this study.

LIST OF REFERENCES
1. Adams, Elliot Q. "X-Z Planes in the 1931 I.C.I. (CIE) System of Colorimetry." Journal of the Optical Society of America 32 (March 1942):168-173.
2. American Association of Textile Chemists and Colorists. Technical Manual of the American Association of Textile Chemists and Colorists 57 (1981-82):46-51, 120-125. •
3. Balchin, T. J. "Dyeing Polyester/Cotton Blend Fabrics in Continuous Application." Crompton and Knowles Corporation, Charlotte, North Carolina, July 28, 1977 (Mimeographed).
4. Balinkin, Isay A. "Measurement and Designation of Small Color Differences." Bulletin of the American Ceramic Society 20 (Novem.ber 1941) : 392-402.
5. Billmeyer, Fred W. and Saltzman, Max. Principles of Color Technology. New York: John Wiley and Sons, 1966, pp. 30,38.
6. Brent, C. J., Flynn, T. D., and Sumner, H. H. "A New insight into the Thermofix Dyeing of Polyester-Cellulose Blends. I-Investigation of the Mechanism of Transfer of Disperse Dyes." Journal of the Society of Dyers and Colourists 85 (December 1969): 606.
7. Celanese Corporation. Man-Made Fiber Dictionary. Celanese Corporation, 1965,, p. 54.
8. Clark, F. R. S., Lambert, P., and Mercier, J. C. "Rapid Quantitative Microanalysis of Multicomponent Fiber Mixtures in Fabrics." Textile Research Journal, (August 1978) :442-446.-
9. Cohen, Allen C. Beyond Basic Textiles. New York: Fairchild Press, 1982, pp. 173, 185.
10. Davidson, Hugh R. and Hanlon, J. J. "Use of Charts for Rapid Calculation of Color Difference." Journal of the Optical Society of America 45 (August 1955): 617-620.
11. Derbyshire, Alan N. "The Development of Dyes and Methods for Dyeing Polyester." Journal of the Society of Dyers and Colourists 90 (August 1974) :273.
71

72
12. Ford, J. E. "Polyester/Cotton." Textiles 9 (February 1980):30-35.
13. Gibson, Joseph W. Jr. "The Thermosol Story." Textile Chemist and Colorist 10 (November 1979) :18 ^ 22"
14. Gorondy, Emery J. "Vapor Fixation of Disperse Dyes in Polyester." Textile Chemist and Colorist 10 (June 1978) :19": "
15. Hoban, Robert F. "Problems Associated with Color Measurements, Reflectance, and Transmittance." Textile Chemist and Colorist 13 (May 1981):16-18.
16. Hunter, Richard S. "Measurement of the Appearance of Paint Finishes." Official Digest 35* (1963):350-366.
17. . "Photoelectric Tristimulus with Three Filters." Journal of the Optical Society of America 32 (September 1942) :509-538.
18. Joseph, Marjorie L. Essentials of Textiles. New York: Holt, Rinehart and Winston, 1977p p. 24.
19. King, Walter D. and Stanonis, D. "Analysis of Cotton/ Polyester Blends with Hexafluoroisopropanol Solvent." Textile Chemist and Colorist 8 (December 1976) :44.
20. . "Determining Polyester in Cotton/Polyester Blends with Tetrachloroethane Solvent." Textile Chemist and Colorist 8 (August 1976) :16-17.
21. King, Walter D., Stanonis, D., and Reid, David. "Determining Polyester in Cotton/Polyester Blends with Monoethanolamine Solvent." Textile Chemist and Colorist 7 (December 1975):28-29.
22. Kuehni, Rolf. Computer Colorant Formulation. Lexington Lexington Books, 1975, pp. 14-15.
23. Kiipper, Harald. Color: Origin, Systems, Uses. New York: Van Nostrand Rienhold Co., 1972, p. 103.
24. Leube, Herbert. "Quality Dyes; Quality Dyeing." Textile Chemist and Colorist 10 (February 1978):36.
25. Linton, George E. The Modern Textile and Apparel Dictionary. Ann Arbor: Braun-Brumfield, Inc., 1973, pp. 2,6.

73
26 Lupton, Christopher, J. Textile Research Center, Lubbock, Texas. Interview, 7 February 1983.
27. MacAdam, David L. "Visual Sensitivities to Color Differences in Daylight." Journal of the Optical Society of America 32 (May 1942) :247-274.
28. Moncrieff, R. w. Man-Made Fibers. 6th ed. New York: John Wiley and Sons, 1975, p. 435.
29. Nickerson, Dorothy. "The Specification of Color Tolerances." Textile Research Journal 6 (19 36): 505-514.
30. Rueckert, Irma. "Determining Polyester in Blends by Using Trichloroacetic Acid." Textile Chemist and Colorist 10 (August 1978) :23-25T
31. Simon, F. T. and Gordon, W. F. "Rapid Graphical Computation of Small Color Differences." American Dyestuff Reporter 47 (February 1958):105-112.
32. Society of Dyers and Colourists. Colour Index. 3rd ed London: Lund Humphries, 19 71, p. 2479.
33. Suchecki, Stanley M. "The State of the Art in Color Science." Textile Industries 8 (August 1979): 130-137.
34. Trotman, E. R. Dyeing and Chemical Technology of Textile Fibers. 5th ed. London: Charles Griffin and Co. Ltd.,1975, pp. 668, 657.
35. . Textile Scouring and Bleaching. London: Charles Griffin and Co. Ltd., 1968, p. 78.
36. Wasserman, Tamar and Basch, Avrham. "Rapid Microanalysis of Fiber and Fabric Blends." Textile Chemist and Colorist 9 (May 1976):30-31.

APPENDIX A
STATISTICAL ANALYSIS EXPLANATION

APPENDIX A: STATISTICAL ANALYSIS EXPLANATION
Standard Deviation
The standard deviation is a measure of variability, it
takes into account the variability of all observations in
a distribution.
The equation used to determine standard deviation in
this study is as follows:
s =/Zx^ - (Ex)
n-1
where:
n = number of observations
Zx = sum of raw scores squared 2
(Zx ) = sum of raw scores, quantity squared
s = standard deviation
Coefficient of Variation (CV) Coefficient of Variation is a measure of dispersion ex
pressed as a percent of the mean. This allows standard
deviations to be compared in respect to their representative
ness without the number of samples interferring in the
comparison.
The equation used to determine CV's in this study is as
follows:
CV = 100 X - ^ X
75

76
where:
s = standard deviation
X = mean
Limits for the Predicted Mean
Limits for the predicted mean are estimates that state
an interval into which the predicted means will fall.
The equation used to determine the limits for the pre
dicted mean at the 95% confidence level is as follows:.
- _ 2.571 X = X s
where:
X = predicted mean
n = sample size
s = standard deviation
Standard Error of the Mean
Standard error of the mean estimates the limits in which
the mean of the next group of samples would be expected to fall
The equation used to determine the standard error of the
mean is as follows:
s SE- = ^n
where:
SE- = standard error of the mean X
s = standard deviation
n = samole number

77
Simple Linear Regression Analysis
Simple linear regression analysis yields a mathematical
equation for predicting the value of a dependent variable
when given the value of an independent variable using the
least squares model.
The equation used for this analysis is as follows:
y = ax + b
where :
^ ^ Zxy - n ExEy
Zx^ - i - (EX) 2
b = 4- Zy - :^ EX
2 = ^^^y — H ~ (^^^y]^
2 1 2 7 ^ 7
[Zx^ - - ^ (Zx)^][Zy^ - (Zy)^]
2 2 For the Oj r <1, the fit is exact if r = 1
t-Test fo.r Statistical Significance
The purpose of the t-test is to determine the signifi
cance between two means and determine if the difference is
greater than that which chance would allow. The following
equations was used in this study.
t = X^ - X2
2 ^ 2 =1 + =2
n^ "2
78
where:
degrees of freedom (df) = n -1
^1' ^2 ^ niean of each group 2 2 _
s^ , s^ - variance of each group ^1' ^2 ^ sample size of each group
APPENDIX B
FIBER CONTENT-COLORIMETRIC MEASUREMENT
Tables 17 through 25

TABLE 17
FIBER CONTENT-COLORIMETRIC MEASUREMENT ( T e c h n i q u e l - D i s p e r s e B l u e (2% w / w ) , B e n z / D e s i z e d F a b r i c )
Sample #
1
2
3
4
5
PET Content
Nominal (%)
100
65
60
50
40
Actual (%)
99.9
65.3
63.6
50.1
45.1
AE
75.11 74.18 72.70 73.32 74.09 73.66
57.69 57.81 57.59 57.44 57.29 57.38
55.52 55.07 55.02 55.34 55.83 55.51
51.06 50.89 51.10 50.43 50.01 50.00
47.62 47.45 47.08 47.35 46.41 47.17
Mean AE
73.84
57.53
55.38
50.58
47.18
a AE
0.34
0.20
0.30
0.50
0.43
K/S at X min = 640nm
15.30 14.31 13.51 13.99 14.54 14.59
4.05 4.13 4.05 4.10 4.06 4.06
3.54 3.47 3.45 3.57 3.67 3.56
2.66 2.63 2.64 2.60 2.49 2.60
2.06 2.05 2.02 2.07 2.02 2.05
Mean K/S
14.37
4.07
3.54
2.60
2.04
a K/S
0.60
0.03
0.08
0.05
|o.02
80

81
TABLE 1 7 — C o n t i n u e d
Sample #
6
PET C o n t e n t
N o m i n a l (%)
0
A c t u a l (%)
0
AE
2 5 . 8 8 2 6 . 5 9 2 5 . 3 7 2 7 . 0 8 2 5 . 1 8 2 5 . 2 7
Mean AE
2 5 . 8 9
a AE
0 . 7 8
K/S a t X min = 640nm
0 . 3 4 0 . 3 6 0 . 3 4 0 . 3 9 0 . 3 2 0 . 3 2
Mean K/S
0 . 3 4
a K/S
0 . 0 3

82
TABLE 18
FIBER CONTENT-COLORIMETRIC MEASUREMENT (Technique 2-Disperse Blue (1% w/w), Benz/Desized Fabric)
Sample #
1
2
3
4
5
6
PET C o n t e n t
N o m i n a l 1
(%)
100
65
60
50
40
0
\ c t u a l (%)
9 9 . 9
6 5 . 3
6 3 . 6
5 0 . 1
4 5 . 1
0
AE
6 8 . 2 4 6 4 . 9 3 6 7 . 1 6 6 5 . 8 0 6 7 . 2 4 6 7 . 2 7
5 4 . 7 6 5 4 . 8 8 5 4 . 3 8 5 4 . 2 0 5 4 . 2 9 5 4 . 9 4
5 2 . 6 0 5 2 . 4 1 5 1 . 9 7 5 2 . 1 2 5 2 . 2 7 5 2 . 0 9
4 8 . 0 8 4 8 . 3 6 4 8 . 9 2 4 8 . 0 4 4 8 . 3 5 4 7 . 7 7
4 5 . 7 9 4 3 . 3 6 4 4 . 8 4 4 5 . 6 1 4 4 . 8 7 4 5 . 0 2
2 8 . 7 7 2 7 . 0 2 3 0 . 5 3 2 7 . 6 9 2 9 . 2 1 2 7 . 2 1
Mean AE
6 6 . 7 7
5 4 . 5 7
5 2 . 2 4
4 8 . 2 5
4 4 . 9 1
2 8 . 4 0
a AE
1.19
0 . 3 7
0 . 2 3
0 . 3 9
0 . 8 5
1 .36
K/S a t X min = 640nm
1 0 . 1 6 7 . 9 2 9 . 2 3 8 . 5 0 9 . 7 8 9 . 5 5
3 . 5 3 3 . 5 0 3 . 5 7 3 . 4 1 3 . 4 9 3 .55
3 . 0 7 3 . 0 1 3 . 0 3 3 . 0 3 3 . 0 5 2 . 9 6
2 . 3 2 2 . 3 5 2 . 3 5 2 . 2 7 2 . 3 2 2 . 3 1
1 .89 1 .81 1.77 1 .85 1 .77
1.82
0 . 5 0 0 . 4 9 0 . 6 1 0 . 5 2 0 . 5 7 0 . 5 0
Mean K/S
9 . 1 9
3 . 4 9
a K/S
0 . 8 3
0 . 0 5
3 .02
2 . 3 2
1.82
0 . 5 3
0 . 0 4
0 . 0 3
0 . 0 4
,0 .58

83 TABLE 19
FIBER CONTENT-COLORIMETRIC MEASUREMENT (Technique 3-Disperse Blue (3% w/w), Benz/Desized Fabric)
Sample #
1
2
3
4
5
6
PET Content
Nominal (%)
100
65
60
50
40
0
Actual (%)
99.9
65.3
63.6
50.1
45.1
0
AE 76.17 77.54 76.20 76.14 76.08 76.46
58.29 58.16 58.55 57.99 58.09 57.90
57.19 56.97 56.28 56.58 56.24 56.18
52.58 52.43 52.43 52.10 52.12 52.61
40.95 48.50 48.78 48.69 48.79 49.20
39.04 35.21 34.86 35.60 36.05 36.40
Mean AE
76.43
58.16
56.59
52.38
48.83
36.19
a AE
0.56
0.23
0.43
0.22
0.21
1.50
K/S at X min = 640nm
17.26 18.47 17.20 17.13 17.06 17.33
4.34 4.26 4.34 4.21 4.31 4.16
3.88 3.91 3.86 3.77 3.76 3.73
2.86 2.85 2.81 2.79 2.83 2.85
2.30 2.21 2.28 2.23 2.20 2.26
0.81 0.66 0.69 0.69 0.77 0.65
Mean K/S
17.41
4.27
3.82
2.83
2.25
0.71
a K/S
0.53
0.08
0.08
0.02
0.04
0.07

84 TABLE 20
FIBER CONTENT-COLORIMETRIC MEASUREMENT ( T e c h n i q u e 4 - D i s p e r s e Red (2% w / w ) , B e n z / D e s i z e d F a b r i c )
Sample #
1
2
3
4
5
6
PET Content Nominal
(%)
100
65
60
50
40
0
Actual (%)
99.9
65.3
63.6
50.1
45.1
0
AE 76.54 76.58 75.29 76.27 76.15 77.54
56.42 56.71 55.43 56.23 57.20 56.06
55.91 55.60 55.37 55.40 54-20 54.56
51.83 52.17 51.80 52.17 52.04 51.59
48.12 48.09 48.01 48.55 48.03 48.81
31.63 28.94 27.90 32.01 31.52 30.90
Mean AE
76.39
56.34
55.17
51.92
48.27
30.48
0
AE
0.73
0.60
0.65
0.22
0.33
1.66
K/S at X min = 640nm
13.72 13.68 12.61 13.81 13.22 15.30
3.13 3.40 3.00 2.99 3.22 3.02
2.89 2.87 2.77 2.83 2.61 2.65
2.26 2.30 2.25 2.30 2.29 2.23
1.76 1.77 1.75 1.82 1.75 1.84
0.63 0.51 0.48 0.65 0.63 0.59
Mean K/S
13.72
3.13
2.77
2.39
1.78
0.58
a K/S
0.90
0.16
0.11
0.30
0.04
0.07

85 TABLE 2 1
F I B E R CONTENT-COLORIMETRIC MEASUREMENT ( T e c h n i q u e 5 - D i s p e r s e B l u e (2% w / w ) , B e n z / F i b e r )
P E T C o n t e n t Sample
#
N o m i n a l ( % )
A c t u a l ( % ) A E
Mean AE
a AE
K/S a t X min = 640nm
Mean K/S
a K/S
100 9 9 . 9
90 90
80 80
70
60
70
60
50 50
6 7 . 7 0 6 6 . 9 3 6 8 . 2 5 6 7 . 5 5 6 8 . 3 3 6 7 . 2 1
6 3 . 9 9 6 3 . 1 2 6 3 . 5 5 6 3 . 2 9 6 4 . 2 3 6 3 . 1 8
6 0 . 4 4 5 9 . 9 0 6 0 . 7 8 6 0 . 1 1 6 0 . 5 7 6 0 . 8 1
5 5 . 3 4 5 6 . 3 8 5 7 . 7 1 5 8 . 8 6 5 7 . 1 3 5 7 . 6 4
5 4 . 8 2 5 3 . 8 6 5 3 . 0 0 5 2 . 3 9 5 3 . 9 0 5 4 . 2 2
5 0 . 3 6 4 9 . 8 3 5 3 . 0 6 4 9 . 0 7 4 8 . 5 7 5 0 . 1 0
6 7 . 6 6 0 . 5 6
6 3 . 5 6 0 . 4 6
6 0 . 4 3
5 7 . 1 8
0 .38 .
1.20
5 3 . 7 0 0 . 8 7
5 0 . 1 6 1 .57
9 . 4 6 8 .89 9 . 8 0 9 . 2 1 9 . 8 0 9 . 0 7
7 .02 6 . 6 0 6 . 8 1 6 . 6 8 7 . 1 6 6 . 6 1
5 . 3 8 5 . 1 8 5 . 5 0 5 . 2 7 5 . 4 0 5 . 5 5
3 . 6 8 3 . 9 8 4 . 3 7 4 . 1 4 4 . 2 0 4 . 3 7
3 . 5 9 3 . 2 8 3 .14 3 . 0 8 3 .34 3 . 4 9
2 . 6 6 2 . 5 4 3 .14 2 . 4 1 2 . 3 5 2 . 6 6
9 . 3 7 0 . 3 8
6.81 0 .23
5 . 3 8 0 . 1 3
4 . 1 2 0 . 2 6
3.32 0 . 2 0
2 . 6 3 0 . 2 8

86
TABLE 2 1 — C o n t i n u e d
Sample #
7
8
9
10
11
PET C o n t e n t
N o m i n a l ( % )
40
30
20
10
0
A c t u a ] ( % )
40
30
20
10
0
L
AE
4 7 . 3 6 4 7 . 2 9 4 7 . 4 5 4 8 . 2 8 4 5 . 4 7 4 6 . 8 8
4 3 . 4 6 4 2 . 0 8 4 2 . 9 5 4 3 . 1 9 4 3 . 1 8 4 3 . 2 4
3 9 . 8 5 3 9 . 3 1 3 9 . 3 9 4 0 . 4 8 3 9 . 9 2 3 9 . 6 1
3 5 . 9 3 3 5 . 9 8 3 5 . 7 2 3 7 . 0 1 3 5 . 7 1 3 4 . 0 9
3 0 . 4 9 2 9 . 9 3 2 8 . 5 6 3 1 . 7 9 3 1 . 7 2 2 7 . 1 0
Mean AE
4 7 . 1 2
4 3 . 0 2
3 9 . 7 6
3 5 . 7 4
2 9 . 7 6
O
AE
0 . 9 3
0 . 4 9
0 . 4 2
0 . 9 4
1 .67
K/S a t X min = 640nm
2 . 1 8 2 . 1 5 2 . 1 4 2 . 2 9 1 . 9 1 2 . 1 9
1.64 1 .63 1.62 1 .67 1.67 1.74
1.29 1.22 1.26 1 .38 1.30 1 .31
1.00 1 .00
. 9 5 1 .03 1 .00 0 . 8 9
0 . 6 7 0 . 6 0 0 . 5 4 0 . 7 6 0 . 6 3 0 . 5 0
Mean K/S
2 . 6 3
1 .66
1.29
0 . 9 8
0 . 5 9
a K/S
0 . 1 3
0 . 0 4
0 . 0 7
0 . 0 5
0 . 0 9
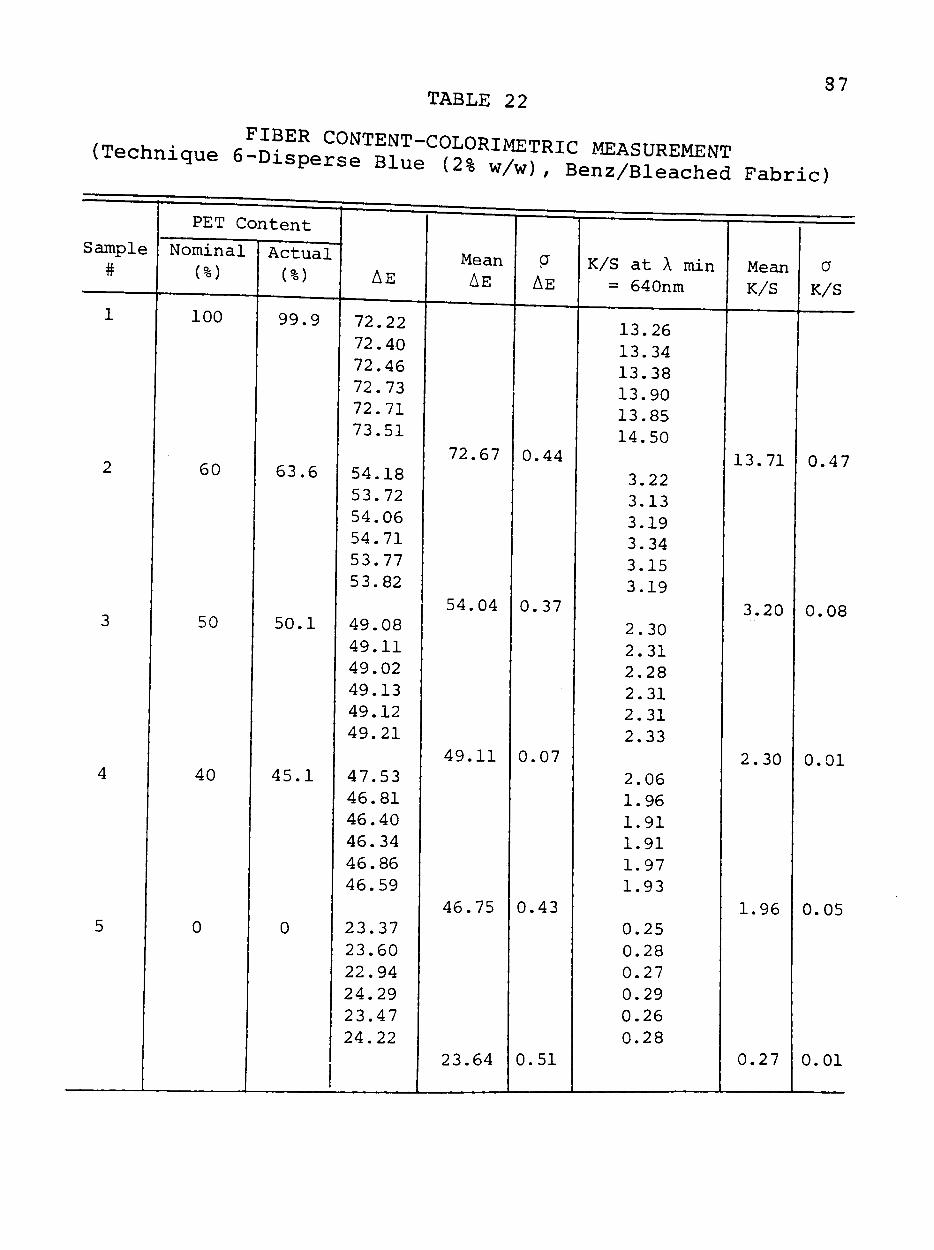
TABLE 22 87
<T.c.„.,„. . !S-=n;-?S»ir«-»-™= /w), Benz/Bleached Fabric)
Sample #
1
2
3
4
5
PET Content
Nominal (%)
100
60
50
40
0
Actual (%)
99.9
63.6
50.1
45.1
0
AE
72.22 72.40 72.46 72.73 72.71 73.51
54.18 53.72 54.06 54.71 53.77 53.82
49.08 49.11 49.02 49.13 49.12 49.21
47.53 46.81 46.40 46.34 46.86 46.59
23.37 23.60 22.94 24.29 23.47 24.22
Mean AE
72.67
54.04
49.11
46.75
23.64
g
AE
0.44
0.37
0.07
0.43
0.51
K/S at X min = 640nm
13.26 13.34 13.38 13.90 13.85 14.50
3.22 3.13 3.19 3.34 3.15 3.19
2.30 2.31 2.28 2.31 2.31 2.33
2.06 1.96 1.91 1.91 1.97 1.93
0.25 0.28 0.27 0.29 0.26 0.28
Mean K/S
13.71
3.20
2.30
1.96
0.27
0 K/S
0.47
0.08
0.01
0.05
0.01

88 TABLE 23
FIBER CONTENT-COLORIMETRIC MEASUREMENT (Technique 7-Disperse Blue (2% w/w), Iron/Desized Fabric)
Sample #
1
2
3
4
5
6
PET Content
Nominal (%)
100
65
60
50
40
0
Actual (%)
99.9
65.3
63.6
50.1
45.1
0
AE
69.76 70.77 70.48 70.75 70.57 70.12
56.17 56.64 57.13 57.15 57.42 56.83
54.38 55.30 53.89 54.74 54.36 53.95
50.66 51.16 51.24 50.58 51.36 50.70
47.41 46.79 45.77 47.43 44.01 45.49
34.16 36.03 33.45 32.59 37.36 35.20
Mean AE
70.41
56.89
54.94
50.95
46.15
34.80
a AE
0.39
0.45
1.47
0.34
1.32
1.75
K/S at X min = 640nm
11.28 12.00 12.00 11.94 12.07 11.46
3.88 3.95 4.05 4.06 4.13 4.04
3.37 3.56 3.29 3.45 3.39 3.32
2.61 2.61 2.70 2.63 2.71 2.60
2.10 2.00 1.88 2.09 1.72 1.86
0.70 0.69 0.59 0.54 0.64 0.60
Mean K/S
11.46
4.02
3.40
2.65
2.08
1 0.63
a K/S
0.34
0.09
0.10
0.04
0.14
0.07

89 TABLE 24
FIBER CONTENT-COLORIMETRIC MEASUREMENT (Technique 8-Disperse Blue (2% w/w), Iron/Fiber)
Sample #
1
2
3
4
5
PET Content
Nominal (%)
100
60
50
40
0
Actual (%)
100
60
50
40
0
1
AE
64.58 64.13 66.27 64.39 64.24 65.85
55.30 55.39 55.14 56.27 54.62 55.23
50.96 51.91 52.42 51.07 51.34 52.13
46.48 47.07 47.27 48.69 48.31 47.63
28.16 28.47 28.22 27.20 31.82 30.77
Mean AE
64.91
55.32
51.63
47.57
29.11
a AE
0.91
0.54
0.60
0.82
1.79
K/S at X min = 640nm
7.58 7.02 8.48 7.46 7.39 8.40
3.81 3.79 3.69 4.03 3.63 3.74
2.89 2.99 3.11 2.89 2.93 3.05
2.15 2.23 2.20 2.44 2.38 2.29
0.57 0.60 0.61 0.57 0.78 0.70
Mean K/S
7.73
3.78
2.97
2.28
0.64
a K/S
0.57
0.13
0.09
0.11
0.70

TABLE 25
FIBER CONTENT-COLORIMETRIC MEASUREMENT ("Unknown" Fiber Blends)
90
Sample #
1
2
3 *
Polyester Content (%) Actual Gravimetric
52.8
85.0
15.0
.
AE
52.14 49.09 50.02
61.75 61.39 59.49
33.42 32.88 32.97
Mean AE
50.42
60.88
33.09
a AE
1.40
1.08
0.29
K/S at X min. = 640 nm
3.12 2.53 2.68
6.04 5.96 5.74
0.89 0.89 0.86
•
Mean K/S
2.78
5.74
0.88
a K/S
0.27
0.41
0.02
•Subjected to stripping procedure twice