Embed Size (px)
Citation preview

Proceedings
Shotcrete for Underground Support XI
Engineering Conferences International Year 2009
DETERMINATION OF ENERGY
ABSORPTION CAPABILITIES OF
LARGE SCALE SHOTCRETE
PANELS
Ellen C. Morton∗ Ernesto Villaescusa†
Alan G. Thompson‡
∗Western Australian School of Mines, [email protected]†Western Australian School of Mines, [email protected]‡Western Australian School of Mines, [email protected]
This paper is posted at ECI Digital Archives.
http://dc.engconfintl.org/shotcrete/7

DETERMINATION OF ENERGY ABSORPTION CAPABILITIES OF LARGE SCALE SHOTCRETE PANELS
Ellen C Morton, former Masters Student Ernesto Villaescusa, Industry Chair in Mining Rock Mechanics
Alan G Thompson, Principal Research Fellow CRCMining / Western Australian School of Mines
Locked Bag 30, Kalgoorlie, WA Australia T: +61 8 9088 6155; F: +61 8 9088 6151; E: [email protected]
ABSTRACT
The Western Australian School of Mines (WASM) has developed a facility for the static testing of full scale ground support elements. The test facility consists of several stiff steel frames used to support the sample and a screw feed jack is used to load the sample. A large scale punch test method has been developed to evaluate various shotcrete mix designs at different curing times. The shotcrete is sprayed on to a sandstone substrate containing an isolated disc that is centrally located. The test sample is placed on to the sample frame and restrained on all sides. The disc is displaced at a constant rate by the screw feed jack which in turn loads the sample. Instruments measure the displacement and the load being applied to the sample through the loading disc. The test method has been used to compare the force – displacement properties of different mix designs and reinforcing materials including plastic fibres, steel fibres and mesh. The force – displacement properties have been used to determine the energy absorbing capability of fibrecrete systems.
INTRODUCTION
In recent years, there have been significant technological advances associated with shotcrete materials and their placement. These advances include improved mix design (e.g. the use of silica fume to improve cohesiveness), chemical admixtures (e.g. the development of alkali free accelerators), the development of steel and plastic fibres for internal reinforcement, and advances in the equipment used for placement.
A large amount of shotcrete research has been undertaken by both the civil construction and the mining industries. The research areas include:
• The force – displacement properties of shotcrete with and without reinforcing. • The adhesive strength between shotcrete and rock surfaces. • The failure mechanisms of shotcrete. • Chemical additives and admixtures.
Standard protocols for shotcrete testing have been developed primarily in Europe (e.g. DIN, EN and EFNARC) and the United States (ASTM). These standards have been adopted throughout the rest of the world. Most of the standard protocols do not apply to mining situations. The most common standard test methods used in the mining industry are the UCS test, the beam third point loading test (EFNARC beam test), the EFNARC square plate test and the Round Determinate Panel (RDP) test. These tests are mainly associated with contract administration and conformation with specifications for strength and toughness. Different types of tests are required to evaluate the interaction between rock surfaces and shotcrete layers.

THEORY OF SHOTCRETE SUPPORT
Studies by Holmgren (1, 2) and Fernandez-Delgado et al. (3) showed that adhesion loss and flexure are the primary modes of shotcrete failure. A further review conducted by Barrett and McCreath (4) identified that shotcrete capacity in blocky ground, under static conditions, is governed by six mechanisms: namely, adhesion loss, direct shear, flexural failure, punching shear, compressive and tensile failure. Adhesion loss occurs where the bond between the shotcrete and the rock is broken, often due to poor surface preparation prior to spraying or due to shrinkage of the shotcrete during curing.
Flexural failure is bending failure of the shotcrete and can only occur after the adhesion is broken. For flexural failure to occur, the shear strength of the material must be higher than the flexural strength. Figure 1 shows an updated version of the failure mechanisms defined by Barrett and McCreath (4). These failure mechanisms are generally not well understood and further research is required to understand the complexities of the rock / shotcrete interaction.
Adhesion Loss Flexural Failure
Direct Shear Failure Punching Shear Failure
Compressive Failure Tensile Failure
Adhesion Loss Flexural Failure
Direct Shear Failure Punching Shear Failure
Compressive Failure Tensile Failure
Figure 1: Updated shotcrete failure mechanisms (modified from Barrett and McCreath, 4).

SHOTCRETE PROPERTIES
There are many mechanical properties that can be associated with shotcrete. The basic properties that can be measured from tests in the laboratory are:
• Compressive strength • Tensile strength • Shear strength • Flexural strength and toughness • Adhesion with rock strength
PREVIOUS SHOTCRETE TESTING
Shotcrete has been very well researched over the decades. Full conferences and magazines have been dedicated to the topic. This thesis has concentrated on the determination of shotcrete mechanical properties through testing, relevant to mining applications. Over 100 papers have been collated within this scope. Many of these papers apply the same test methods. The most common of the test methods are:
• Unconfined compressive strength (UCS) test (e.g. 5) • Third point beam tests (6, 7, 8) • EFNARC plate test (9) • Round Determinate panel (RDP) test (10).
These methods are governed by standards from various countries such as the United States (ASTM), Europe (DIN, ISO). Some Australian standards exist for shotcrete although the primary references are often the ASTM standards. There are three principal areas that apply specifically to mining applications. These are:
• Early strength. • Quality assurance and control (QA/QC). • Large scale testing.
LARGE-SCALE TESTING
There is a small number of papers dedicated to the large scale testing of shotcrete. These include Fernandez Delgado et al. (3), Holmgren (1, 2), Little (11), Kirsten and Labrum (12), Kirsten (13, 14), Tannant and Kaiser (15) and Kaiser and Tannant (16). Some of the key findings form these tests are presented in the following section.
Fernandez-Delgado et al.
Fernandez Delgado et al. (3) tested large scale shotcrete panels using realistic loading conditions. They attempted to replicate the following variables experienced in the underground mining environment:
• Geometrical configuration (planar, arched and irregular surfaces) • Bond strength (between the shotcrete and the simulated rock surface) • Boundary conditions • Thickness of the layer • Strength of the shotcrete

The results without confinement showed that “for good bond layers, the layer capacity can be represented as a function of the thickness, up to a thickness of about (50mm), above which the capacity was independent of thickness”.
Tests exhibited one of 3 failure modes; namely, diagonal shear failure, adhesive failure or bending failure. Both diagonal tensile failure and adhesion loss occurred where the sample was not externally restrained. Diagonal shear failure was characterised by rapid failure with no residual strength. They found that “layers thinner than (50mm), regardless of the strength of the shotcrete, always failed by diagonal tension through the shotcrete material”. They found that “layers thicker than (50mm) regardless of the shotcrete strength, always failed by separation from the fixed wall”.
Bending failure only occurred in the restrained tests. The sample initially exhibited adhesion loss but in this case full separation was not achieved due the restraining forces provided by the end plates. Once the separation had reached the plates the sample began to act as a beam with some residual load carrying capacity until bending failure took place.
The application of the restraints to prevent catastrophic adhesion failure changed the behaviour of the sample and resulted in three new failure modes. These were:
1. “A shear failure through the shotcrete material in the neighbourhood of the fixed wall – moveable wall contact.
2. Layer separation along the fixed wall contact followed by moment thrust failure in the inclined portion of layer in contact with the fixed wall.
3. Layer separation along the fixed wall contact as well as along the moveable block contact followed by a tension failure along the apex of the triangular moveable block”.
Fernandez Delgado et al. (3) also evaluated the effect of reinforcing on the behaviour of the shotcrete. They found that “the presence of steel fiber reinforcing did not affect the value of the residual capacity. But it significantly increased the ductility of the layer which exhibited an undiminished residual capacity for moveable block displacements 3 times larger than those at which complete collapse of unreinforced planar shotcrete layers took place.
The presence of a (250mm) square mesh with (1mm) diameter wires placed close to the outside surface of the layer…not only increased the residual strength but also the ductility of the layers. The residual capacity increased from 15% to 95% of the peak load”.
Holmgren
Holmgren (1, 2) undertook large-scale testing using the same principles as Fernandez Delgado et al (3). Adhesion failure was the primary mode of failure. “The failure mode was not affected by the layer thickness” (Holmgren, 1), although this may have been a function of the test arrangement.
Holmgren (2) used yield line theory and a series of equations in an attempt to develop design guidelines for shotcrete. This method has not been universally adopted by industry.
Kirsten and others
Kirsten and Labrum (12) compared the performance of different shotcrete reinforcing systems such as fibres and mesh. The test facility consisted of a 1.6m square panel supported on a steel frame and restrained by bolts located on a 1m square pattern. Bearing plates, attached to the bolts, were used to simulate realistic restraint conditions.
Samples were either uniformly loaded using a hydraulically pressurised bag or point loaded at the centre of the sample using a hand operated hydraulic jack. The pressurised bag “ensured that the energy in the loading system was limited, and that deflection of the panels could be tracked in a controlled manner beyond peak load”.
The results showed that mesh reinforced shotcrete was much more effective in sustaining large deformations. Further assessment of the results found that “the superiority of the mesh over the fibre reinforcement was ascribed to the low content and relatively limited length of the fibre used. The mesh reinforcement was located in the middle of the test panels and, as such, was more efficient than the fibre reinforcement of which only a small fraction of total content was available in the tension sides of the panels tested” (Kirsten, 13).
Kirsten (13) undertook a second series of testing comprising of a total of 24 panels. The panels were prepared in the same way as the previous test series using the same mix design.
Both series of testing found little difference in the behaviour of the material between uniform loading conditions (using the hydraulically pressurised bag) and point loading conditions. The second series of testing found that the fibre type had very little effect on the behaviour of the samples, despite the steel fibre being applied at higher dosages than the plastic fibres. In essence the second series of testing reaffirmed the results of the first series of testing.
Tannant and Kaiser
Tannant and Kaiser (15) used a test facility to evaluate the force – displacement capacity of shotcrete reinforced with weld mesh. The shotcrete layers were “approximately 60 to 70mm thick and were reinforced with one sheet of #6 gauge mesh”. The samples were held in position using bolts located in a diamond configuration. A plate was pulled upwards through the sample using an overhead winching system.
“The peak load in the shotcrete occurred at displacements in the range of 50 – 100mm. At this stage in the pull tests the shotcrete was extensively fractured but no wires in the mesh reinforcement had failed. Only after displacements of 100 to 150mm did the shotcrete start to become extensively damaged and wires began to fail” (Tannant and Kaiser, 15). Tannant and Kaiser conclude that shotcrete behaves stiffer than mesh during the initial stages of deformation and that mesh reinforced shotcrete can deform up to 150 – 200mm.

Other test methods
Large scale testing has also been undertaken by Little (11), Ding and Kusterle (17) and Dufour et al (18), Cengiz and Turanli (19) to name but a few. Dufour et al. (18) used a large-scale pull plate test method to evaluate the early strength of shotcrete in-situ. The method is similar to that used by Pakalnis and Ames (20) to evaluate mesh. Van Sint Jan and Cavieres (21) tested shotcrete using the same method applied to mesh by Ortlepp and others (e.g. 22) to test shotcrete. The sample was restrained using bolts positioned in a square pattern. Eight tests were conducted using this method with the aim of evaluating the performance of synthetic fibres compared with the performance of mesh reinforcing.
SHOTCRETE TEST METHODOLOGY
The aim of the shotcrete testing was to determine the force – displacement properties of shotcrete and to enable the comparison of shotcrete test results with results from a complementary mesh testing program (Morton et al., 23). The test method was expected to satisfy a number of criteria; namely;
• The test had to be suitable for all sprayed layers (e.g. shotcrete and membranes).
• The sample had to be of suitable size to enable realistic spraying techniques. • The test had to evaluate realistic shotcrete failure mechanisms such as
shear strength, flexural strength and adhesion. • The results had to enable comparison of variations in mix design, reinforcing,
thickness and curing times.
A large – scale punch test method similar to that used by both Holmgren (1976) and Fernandez Delgado et al. (1976) was selected.
Test facility
The Western Australian School of Mines (WASM) Static Test Facility was designed and built by the WASM Rock Mechanics Department in 2004 to complement the WASM Dynamic Test Facility built in 2002 (Player et al., 24 and Thompson et al., 25). Commissioning of the static facility took place in early 2005 with formal testing beginning in April 2005. The facility is capable of testing both mesh and shotcrete panels.
The static test facility consists of a load bearing upper steel beam with a mechanical screw feed jack mounted on top. The mechanical jack drives a loading shaft that passes through the beam. A 50 tonne capacity load cell is mounted between the shaft and a spherical ended cylinder. A 300mm square, 35mm thick hardened steel plate with a spherical seat, is used to load the sample.
Complete details of the instrumentation and data monitoring and recording system are given by Morton et al. (26).
Substrate preparation
The large scale punch test method involves applying a liner to a thin substrate which has a centrally located loading disc cut into and then separated from the

surrounding substrate. After a specified curing period, the sample is placed on the test frame and testing is undertaken.
Several substrate materials were considered; these included foam, glass, concrete and rock. A stiff material was required to ensure it didn’t get damaged during the spraying process or that the material did not flex under the weight of the shotcrete.
Concrete was considered as it is relatively inexpensive and the disc could easily be moulded into the centre. After further consideration, it was decided that concrete could not provide a repeatable consistent surface that represented the roughness of a rock surface. Furthermore, the curing concrete would potentially affect the curing of the sprayed product and thus bias the results.
Natural rock was selected as the most appropriate material. The surface of the rock had to have a rough texture and be readily available. Sandstone was selected, after discussions with various quarries. A sandstone slab prepared for spraying is illustrated in (Figure 2).
A 500mm diamond drill was used to cut the central loading disc from the slab. The drilling process left an 8mm gap between the main slab and the centre disc. This gap was filled with polystyrofoam gap filler.
Sample preparation
The samples were taken to site and sprayed. The samples were placed in an upright position to replicate an excavation wall. Formwork around the outside of the sample was used as a depth guide for the sprayers. The sample was sprayed by an experienced operator.
Figure 2: Upright substrate ready for spraying.
If the spraying process resulted in a highly irregular profile on the face of the sample, a screed was used to smooth the edges (up to 100mm maximum distance from the edge) in order to improve the seating of the sample on the test frame. The internal area of 1.3m x 1.3m was left undisturbed, to ensure that the sample remained consistent with the final sprayed product.

Curing
Curing is critical to the development of strength of shotcrete particularly in the hours immediately after spraying. Once the samples had been sprayed they were wrapped in plastic and transported back to the laboratory where they were placed in a temperature and humidity controlled environment for curing. The time period between spraying and storage varied between 2 and 12 hours as a result of transporting samples from site back to the laboratory. This is likely to have an effect on the sprayed product but could not be avoided. The samples were specifically not water cured as this may have increased the hydration of the cement and result in a strength increase that would not normally be associated with mining applications.
Test methodology
The test machine and a sample prepared for testing are shown in Figure 3.
Figure 3: Shotcrete test setup showing loading system and instrumentation.
Materials
Testing has been conducted on behalf of three different sites. All three sites used a mix design containing a cement content of approximately 15%. The mix designs for Sites 1 and 2 were similar: that is, similar water cement ratios were used and both sites applied 6 kilograms of polypropylene fibres per cubic metre; however, slightly different chemical admixtures and aggregates were used by the two sites.
The third site used a significantly different mix design. The sand and gravel ratios varied from the other two sites along with the chemical admixtures. This site applied 30kg of steel fibre per cubic metre.
Motor and Gearbox
Load Reaction
Beam
Support Beam
Clamping Frame
LVDT
Instrument Panel
Clamp
Shotcrete Layer
Load Cell
Disk
Digital Load
LVDT

The standard mix design from Site 3 was used to prepare a mesh reinforced sample. This test was conducted to the enable the comparison of the force – displacement properties of standard fibre reinforced shotcrete with mesh reinforced shotcrete. To ensure consistency the same mix was used to spray three samples; consequently the mesh reinforced shotcrete was also reinforced with steel fibres. This replicated the current site practice of spraying over mesh in areas of rehabilitation.
RESULTS
A total of 15 tests were conducted on shotcrete samples obtained from 3 mine sites. The samples comprised of a variety of mix designs, fibre types, curing times and thicknesses. Individual report sheets were created for each test.
Site 1 and 2 - polypropylene fibres
The mix designs for sites 1 and 2 were very similar; consequently, these sites have been analysed together.
A total of 8 tests were conducted on samples from Sites 1 and 2. The force – displacement responses for Sites 1 and 2 are shown in Figure 4a and Figure 4b, respectively. A summary of the results is provided in Table 1. Figure 5 shows a comparison of results from samples with the same thickness and the same curing time from the two sites.
As with the mesh test results, the shotcrete force – displacement results can be divided into a number of phases (Figure 6); namely, the pre-rupture phase, the post rupture phase and the sandstone rupture phase.
0
20
40
60
80
100
0 20 40 60 80Displacement at loading point (mm)
Forc
e (k
N)
35mm 5 days40mm 4 hrs60mm 7 days140mm 14 days160mm 24 hrs
x
x
x
x
x
x
x
x
x
xx
x
x
x
o
oooo
oo +
+
++++
+
+++
0
20
40
60
80
100
0 20 40 60 80Displacement at loading point (mm)
Forc
e (k
N)
35mm 5 days40mm 4 hrs60mm 7 days140mm 14 days160mm 24 hrs
x
x
x
x
x
x
x
x
x
xx
x
x
x
o
oooo
oo +
+
++++
+
+++
x
0
10
20
30
40
50
60
70
0 20 40 60 80Displacement at loading point (mm)
Forc
e (k
N)
60mm 7 days70mm 7days85mm 7days
xx
xx x
x
x
x x
o
o
o
o
oo
o
o
o
oo
x
0
10
20
30
40
50
60
70
0 20 40 60 80Displacement at loading point (mm)
Forc
e (k
N)
60mm 7 days70mm 7days85mm 7days
xx
xx x
x
x
x x
o
o
o
o
oo
o
o
o
oo
Figure 4: (a) Site 1 force – displacement results. (b) Site 2 force – displacement results.

Table 1: Summary of test results for Sites 1 and 2.
Site Test number
Average thickness
(mm)
Age Rupture force (kN)
Rupture displacement
(mm) 1 001 140 14 days 91.19 5 1 003 160 24 hours 84.30 5 2 004 70 7 days 16.12 4 2 005 60 7 days 21.92 4 2 007 85 7 days 40.89 4 1 008 40 4 hours 13.20 8 1 009 35 5 days 6.52 4 1 010 60 7 days 25.11 5
0
5
10
15
20
25
30
0 10 20 30 40 50 60Displacement at loading point (mm)
Forc
e (k
N)
Site 1 60mm 7 days
Site 2 60mm 7 daysx
x
x
x
xx
x
x
x
x
xx
x
x
x
x
o
o
oo
o
o
oo o
oo
o
o
0
5
10
15
20
25
30
0 10 20 30 40 50 60Displacement at loading point (mm)
Forc
e (k
N)
Site 1 60mm 7 days
Site 2 60mm 7 daysx
x
x
x
xx
x
x
x
x
xx
x
x
x
x
o
o
oo
o
o
oo o
oo
o
o
Figure 5: Comparison of Site 1 and Site 2 test results using the same thickness and curing time.
The pre-rupture phase is characterised by a rapid load increase at the start of the test. A small step occurred at the start of each test, which is believed to be a function of the test setup. The load increased rapidly up until rupture. This increase can be approximated by a straight line. The rupture point is also known as the first peak force. First peak force is defined by ASTM C 1609 07 as “the load value at the first point on the load-deflection curve where the slope is zero”. For consistency and clarity, rupture force and rupture displacement will be used instead of first peak force.
Rupture generally occurred between 2 and 3mm of central displacement. Rupture is believed to correspond to the breaking of the matrix of the shotcrete; cracking sounds could be heard but visible cracks were not discernable on the face of the sample. The rupture force may or may not correlate to the peak force which is defined as the maximum force recorded during the test.
The post rupture behaviour was difficult to characterise as each test behaved differently. The post peak behaviour was dependent upon the failure mode, the shotcrete thickness and the type of reinforcing.

Displacement at loading point (mm)
Forc
e (k
N)
Pre rupture
Initial stiff reaction
followed by rupture
Post rupture
Highly erratic and difficult to typify
Sandstone rupture
Highly erratic and difficult to typify. Does not occur if adhesion loss is the only
failure mode
Figure 6: Shotcrete test phases
The failure mode for all tests was a combination of flexural failure and adhesion loss. With the exception of Test ST001, adhesion loss occurred some time after initial cracking. ST001 exhibited adhesion loss as the primary failure mode, followed by flexural cracking of the layer after adhesion loss had started.
The Linear Voltage Differential Transducer (LVDT) measurements provided information regarding the deformation of the substrate. Significant deflection of the sandstone substrate occurred in all tests except ST001. Generally the sandstone substrate began to crack after 4 to 6mm of deflection of the substrate at the position of the LVDTs. This equated to approximately 10mm to 15mm of central displacement. Figure 7 provides an example of the LVDT results with the corresponding phases indicated. The cracking of the sandstone occurred after rupture and therefore only influenced the post peak results of the sample.
The LVDTs stopped displacing towards the end of the test. This suggests that there was no longer any downward force acting on the sandstone substrate. This is possibly related to adhesion loss or a reduction in the force capacity of the sample indicating failure. The LVDT results from Test ST001 indicated that the substrate only deformed 2mm and then returned back to zero (Figure 8). The slow rebound suggests that the forces acting to deflect the substrate were reducing as time progressed, indicating adhesion loss.
At the termination of the tests, most samples had cracks between 15 and 20mm wide across the face of the sample. The cracks were randomly oriented but were wider in the centre of the sample. The crack patterns were included in the individual test report sheets. Two different fibre failure modes were observed within the cracks of the sample. Some fibres appear not to have been loaded indicating that they had not bonded

effectively with the shotcrete matrix. Some fibres within the larger cracks were frayed indicating tensile failure of the fibres (Figure 9). Often these two failure modes were observed side by side. This suggests that the fibres that showed no signs of stress may have been oriented parallel to the cracks or had an ineffective embedment length.
Figure 7: An example indicating how the LVDT results can be used to determine the behaviour of the substrate.
0
10
20
30
40
50
60
70
80
90
100
0 10 20 30 40 50 60Displacement at loading point (mm)
Forc
e (k
N)
0
2
4
6
8
10
12
14
16
18
20
LVD
T D
ispl
acem
ent c
hang
e (m
m)
Adhesion loss completeRupture
Adhesion loss
begins
Force – displacement response
LVDT response
Figure 8: The LVDT results from ST001 indicated where adhesion loss began.
0
10
20
30
40
50
60
70
0 20 40 60Displacement at loading point (mm)
Forc
e (k
N)
0
5
10
15
20
25
30
35
LVD
T D
ispl
acem
ent c
hang
e (m
m)
Sandstone is no longer
under loadRupture
Sandstone begins to
crack
Force – displacement response LVDT
responses
0
10
20
30
40
50
60
70
0 20 40 60Displacement at loading point (mm)
Forc
e (k
N)
0
5
10
15
20
25
30
35
LVD
T D
ispl
acem
ent c
hang
e (m
m)
0
10
20
30
40
50
60
70
0 20 40 60Displacement at loading point (mm)
Forc
e (k
N)
0
5
10
15
20
25
30
35
LVD
T D
ispl
acem
ent c
hang
e (m
m)
Sandstone is no longer
under loadRupture
Sandstone begins to
crack
Force – displacement response LVDT
responses

Fibres frayed and broken close to
shotcrete
No fraying of fibre
Figure 9: Poly fibres with two different failure modes.
Energy absorption (toughness) was determined by calculating the area under the force – displacement curve. The total displacement was not consistent across all the tests; consequently, total energy cannot be used as a comparative measure. Determining energy at an arbitrary displacement is also not indicative of the energy capacity of shotcrete. In order to effectively assess the energy absorption capabilities of shotcrete, the cumulative energy absorption variation with central displacement should be considered. Figure 10a and Figure 10b, respectively, provide the cumulative energy absorption for samples from each site.
0.0
0.5
1.0
1.5
2.0
2.5
3.0
0 20 40 60 80Displacement at loading point (mm)
Ene
rgy
(kJ)
35mm 5 days40mm 4 hrs60mm 7 days140mm 14 days160mm 24 hrs
x
x
x
xx
x
o
o
ooo
+
+
+
+
+
+
+
0.0
0.5
1.0
1.5
2.0
2.5
3.0
0 20 40 60 80Displacement at loading point (mm)
Ene
rgy
(kJ)
35mm 5 days40mm 4 hrs60mm 7 days140mm 14 days160mm 24 hrs
x
x
x
xx
x
o
o
ooo
+
+
+
+
+
+
+
0.0
0.5
1.0
1.5
2.0
2.5
3.0
3.5
0 20 40 60 80Displacement at loading point (mm)
Ener
gy (k
J)
60mm 7 days70mm 7days85mm 7days
x
x
x
x
x
o
o
o
o
oo
o0.0
0.5
1.0
1.5
2.0
2.5
3.0
3.5
0 20 40 60 80Displacement at loading point (mm)
Ener
gy (k
J)
60mm 7 days70mm 7days85mm 7days
x
x
x
x
x
o
o
o
o
oo
o
Figure 10: (a) Site 1 cumulative energy results. (b) Site 2 cumulative energy results.
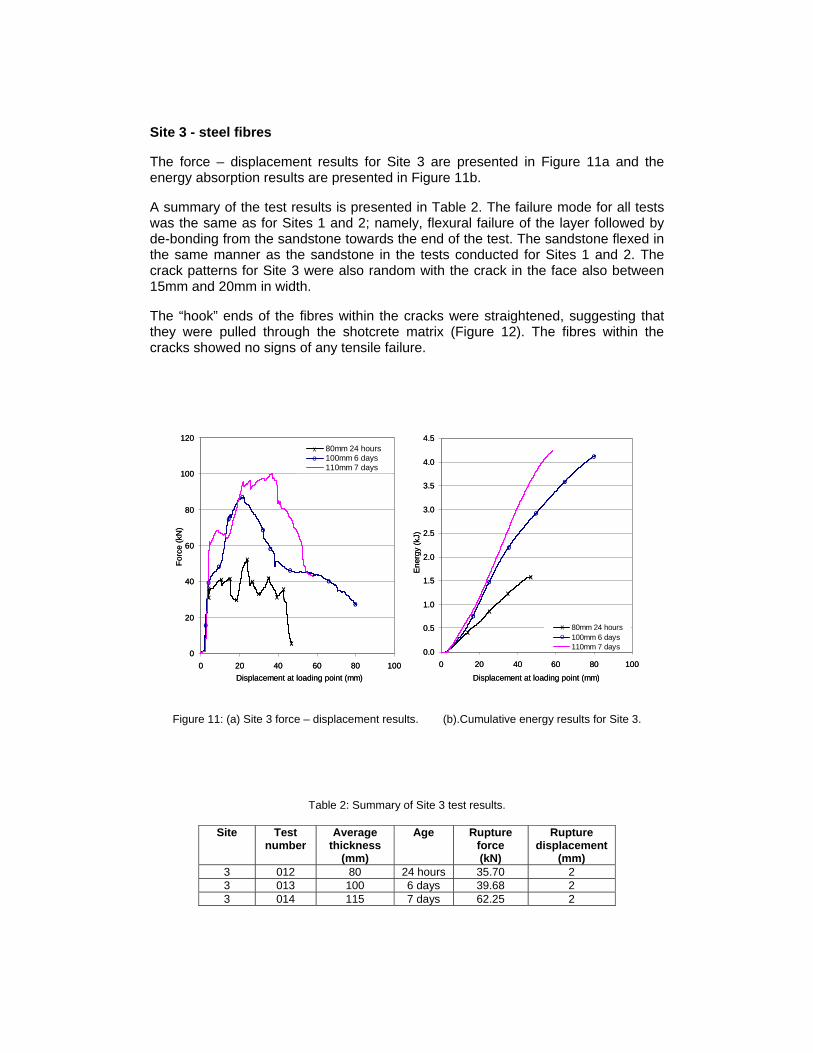
Site 3 - steel fibres
The force – displacement results for Site 3 are presented in Figure 11a and the energy absorption results are presented in Figure 11b.
A summary of the test results is presented in Table 2. The failure mode for all tests was the same as for Sites 1 and 2; namely, flexural failure of the layer followed by de-bonding from the sandstone towards the end of the test. The sandstone flexed in the same manner as the sandstone in the tests conducted for Sites 1 and 2. The crack patterns for Site 3 were also random with the crack in the face also between 15mm and 20mm in width.
The “hook” ends of the fibres within the cracks were straightened, suggesting that they were pulled through the shotcrete matrix (Figure 12). The fibres within the cracks showed no signs of any tensile failure.
0
20
40
60
80
100
120
0 20 40 60 80 100Displacement at loading point (mm)
Forc
e (k
N)
80mm 24 hours100mm 6 days110mm 7 days
xo
o
o
o
o
o
o
x
x
x
x
xx
xx
x
x x
xo
o
o
o
0
20
40
60
80
100
120
0 20 40 60 80 100Displacement at loading point (mm)
Forc
e (k
N)
80mm 24 hours100mm 6 days110mm 7 days
xo
o
o
o
o
o
o
x
x
x
x
xx
xx
x
x x
xo
o
o
o
0.0
0.5
1.0
1.5
2.0
2.5
3.0
3.5
4.0
4.5
0 20 40 60 80 100
Displacement at loading point (mm)
Ene
rgy
(kJ)
80mm 24 hours100mm 6 days110mm 7 days
xo
x
x
x
x
o
o
o
o
o
o
0.0
0.5
1.0
1.5
2.0
2.5
3.0
3.5
4.0
4.5
0 20 40 60 80 100
Displacement at loading point (mm)
Ene
rgy
(kJ)
80mm 24 hours100mm 6 days110mm 7 days
xo
x
x
x
x
o
o
o
o
o
o
Figure 11: (a) Site 3 force – displacement results. (b).Cumulative energy results for Site 3.
Table 2: Summary of Site 3 test results.
Site Test number
Average thickness
(mm)
Age Rupture force (kN)
Rupture displacement
(mm) 3 012 80 24 hours 35.70 2 3 013 100 6 days 39.68 2 3 014 115 7 days 62.25 2

Figure 12: Steel fibres showed no signs of tensile yield.
Site 3 - mesh reinforcing
Only one test was conducted using mesh reinforcing within a fibre reinforced shotcrete panel. Standard weld mesh (100mm square grid using 5.6mm diameter wires) was used as reinforcing. The results are shown with the other results from Site 3 in Figure 13a.
The mesh reinforced sample exhibited much higher forces both at rupture and in the post rupture phase. The displacement of the sample was also much greater. Accordingly, the energy absorption capacity is also much greater ( Figure 13b). The primary failure mode was adhesion loss combined with flexural failure of the sample. The test was stopped due to excessive rotation of the loading plate. Only a small portion of the mesh could be seen at the base of the fracture (Figure 14); consequently, the displacement capacity of the sample was potentially much greater than the results indicated.
0
20
40
60
80
100
120
140
0.0 50.0 100.0 150.0Displacement at loading point (mm)
Forc
e (k
N)
Mesh reinforced 105mm 7 daysFibre reinforced 80mm 24 hoursFibre reinforced 100mm 6 daysFibre reinforced 110mm 7 days
xo
x
o
oo
o
o
ooo
x
xx
x xx
xx
x
0
20
40
60
80
100
120
140
0.0 50.0 100.0 150.0Displacement at loading point (mm)
Forc
e (k
N)
Mesh reinforced 105mm 7 daysFibre reinforced 80mm 24 hoursFibre reinforced 100mm 6 daysFibre reinforced 110mm 7 days
xo
x
o
oo
o
o
ooo
x
xx
x xx
xx
x
0
2
4
6
8
10
12
14
0.0 50.0 100.0 150.0Displacement at loading point (mm)
Ene
rgy
(kJ)
Mesh reinforced 105mm 7 days
Fibre reinforced 80mm 24 hours
Fibre reinforced 100mm 6 days
Fibre reinforced 110mm 7 days
x
o
o
x
x
x
x
x
x
oo
0
2
4
6
8
10
12
14
0.0 50.0 100.0 150.0Displacement at loading point (mm)
Ene
rgy
(kJ)
Mesh reinforced 105mm 7 days
Fibre reinforced 80mm 24 hours
Fibre reinforced 100mm 6 days
Fibre reinforced 110mm 7 days
x
o
o
x
x
x
x
x
x
oo
Figure 13: Mesh and fibre reinforced shotcrete force – displacement and energy results.

Figure 14: Mesh reinforcing within the cracked shotcrete sample.
Comparison of results
Each test had four main variables: • Mix design. • Reinforcing. • Thickness. • Curing time.
In addition to these variables, the air pressure, the spraying machines, and the spraying technique all have the potential to affect the results.
Despite the variables, it is clear that fibre reinforced shotcrete has a displacement capacity of less than 80mm regardless of the fibre type. The force and displacement capacities of shotcrete can be enhanced by the use of mesh reinforcing. Further work is required in testing and analysing different mesh reinforcing products to enable the development of improved design parameters.
The post peak results were highly variable; consequently, analysis can only be undertaken on the rupture results. Figure 15a shows the rupture force – displacement results for all sites. The chart does not appear to indicate a relationship between the three sites; although it appears that curing may have an effect on the behaviour of the samples. All samples, except ST008, were cured for longer than 24 hours. ST008 was cured for 4 hours prior to testing. The behaviour of ST008 was less stiff than the behaviour of the other samples; consequently, the rupture displacement was much greater.

0
20
40
60
80
100
0 2 4 6 8 10Rupture displacement at loading point (mm)
Rup
ture
forc
e (k
N)
Site 1
Site 2
Site 3
Tested at 4 hours. All other tests >24 h
0
20
40
60
80
100
0 50 100 150 200Thickness (mm)
Rup
ture
For
ce (k
N)
Site 1
Site 2
Site 3
Tested at 4 hours. All other tests >24 hours
y = 0.0022x2 + 0.25x
Figure 15: (a) Rupture force – displacement. (b) Rupture force – thickness results for all sites.
As there was no discernable relationship in the rupture force – displacement results, the rupture forces were analysed with respect to thickness. The results (Figure 15b) indicate a clear relationship between the thickness and the force capacity of the fibre reinforced shotcrete. The relationship is approximately quadratic. The mesh reinforced shotcrete conforms to this relationship. The test had a much higher force capacity than the fibre reinforced shotcrete indicating that mesh is a much better reinforcing material than fibres (at the applied dosages).
The rupture force / thickness relationship is likely to be related to the cement content of the samples. All samples contained approximately 15% cement. It is unlikely that samples containing different cement contents will conform to this relationship. However, it is evident that the overall mix design, curing time and fibre material has a limited effect on the rupture force capacity of relatively thin layers.
The energy absorption results were highly dependent on the length of the test. Due to the brittle nature of shotcrete, the energy required to rupture the shotcrete is less than 0.2kJ (Figure 16). The overall energy absorption results were dependent on the behaviour of the sample and the length of the test. In particular, the thinner layers tended to have a lower residual force capacity but those forces were maintained over for longer periods. The thicker layers typically had higher force capacities but these forces were not maintained over long displacements. Measuring the toughness at 10mm, 20mm or 40mm is not representative of the behaviour of the material.

y = 0.0000051x2 + 0.0000909x
0.00
0.02
0.04
0.06
0.08
0.10
0.12
0.14
0.16
0.18
0.20
0 50 100 150 200Thickness (mm)
Rup
ture
ene
rgy
(kJ)
Site 1
Site 2
Site 3
Tested at 4 hours. All other tests >24 hours
Figure 16: Rupture energy / thickness relationship.
DISCUSSION
The punch test methodology developed as part of this research program has the flexibility to enable the comparison of each variable listed previously, particularly when only one variable is modified each time. The limited quantity of tests conducted to date and the variability in each test meant detailed conclusions could not be generated from the test results. However, it is clear that rupture force is dependent upon the cement content and the thickness of the shotcrete. The role of the cement content in the formation of this relationship is still to be investigated.
The failure modes generated by this test configuration indicate that the primary mode of failure for shotcrete layers greater than 50mm is a combination of flexural failure and adhesion loss. In reality, it is difficult to determine the true level of adhesion to the rock surface. Many rock types are not conducive to good adhesion. This is further exacerbated by the presence of water, blasting residue and dust on the rock surface. In situ monitoring is required to determine the level of adhesion in an underground mining environment.
Recently, industry has placed a great emphasis on the measurement of toughness as a quality assurance measure and a design tool. The toughness results were highly dependent on the length of the test. Due to the brittle nature of shotcrete, the energy required to fracture the shotcrete is less than 1kJ. The overall toughness results were dependent on the behaviour of the sample and the length of the test. In particular the thinner layers tended to have a lower residual force capacity than the thicker layers, but those forces were maintained over a much greater displacement; consequently, measuring the toughness at 10mm, 20mm or 40mm is not representative of the behaviour of the material.

It is clear from these results that further evaluation of shotcrete is required. It is recommended that further investigations be conducted in the following areas:
• Investigation of the relationship between cement content, thickness and force capacity that will aid in the development of improved design tools for shotcrete.
• In situ monitoring to determine the level of adhesion that is achieved in an excavation.
• In situ monitoring to determine the actual forces that act on shotcrete,, particularly during the first 24 hours of curing.
• Laboratory investigations into the development of the shotcrete strength over the first 24 hours.
• Investigation into various types of mesh reinforcing to enable the better design of shotcrete support systems.
• Field investigations to determine the realistic failure mechanisms of shotcrete.
ACKNOWLEDGEMENTS
The direct assistance of Barminco site personnel and the financial support and encouragement provided by the Australian mining industry for research at the Western Australian School of Mines are gratefully acknowledged
REFERENCES
1. Holmgren, J 1976. Thin shotcrete layers subject to punch loads. Shotcrete for ground support. Proc. of the engineering foundation conference. 443-459. ACI.
2. Holmgren, J 2001. Shotcrete linings in hard rock. Underground mining methods. Engineering fundamentals and international case studies. Hustrulid, W and Bullock, R (ed). 569-577. Colorado Society for Mining, Metallurgy and Exploration.
3. Fernandez-Delgado, G, Mahar, J and Parker, H 1976. Structural behaviour of thin shotcrete liners obtained from large scale tests. Shotcrete for ground support. Proc. of the engineering foundation conference. Oct 4-8. 399-442. ACI.
4. Barrett, S and McCreath, D 1995. Shotcrete support design in blocky ground: Towards a deterministic approach. Tunnelling and Underground Space Technology, Vol.10, No.1, 79-89. Great Britain Elsevier Science.
5. ASTM C 39 2005. ASTM C 39/C 39M - 06. Standard test method for compressive strength of cylindrical concrete specimens. ASTM International.
6. ASTM C 78 2008. ASTM C 78 - 08. Standard test method for flexural strength of concrete (using simple beam with third point loading). ASTM International.
7. ASTM C 1018 1994. ASTM C 1018 – 94b. Standard test method for flexural toughness and first crack strength of fibre reinforced concrete (using beam with third point loading). ASTM International.
8. ASTM C 1609 2006. ASTM C 1609/C 1609M - 06. Standard test method for flexural performance of fibre reinforced concrete (using beam with third point loading). ASTM International.
9. EFNARC 1996. European specification for sprayed concrete. 10. ASTM C 1550 2005. ASTM C 1550 - 05. Standard test method for flexural
toughness of fibre reinforced concrete (using centrally loaded round panel). ASTM International.
11. Little, T 1985. An evaluation of steel fibre reinforced shotcrete for underground support. Can. Geotech. J., Vol.22, No.4, 501-507. Ottawa, Canada National Research Publisher.

12. Kirsten, H A D and Labrum, P R 1990. The equivalence of fibre and mesh reinforcement in the shotcrete used in tunnel support systems. J. S. Afr. Inst. Min. Metall., Vol.90, No.7, Jul. 153-171.
13. Kirsten, H 1992. Comparative efficiency and ultimate strength of mesh and fibre - reinforced shotcrete as determined from full scale bending tests. J. S. Afr. Inst. Min. Metall., Vol.92, No.11/12, Nov / Dec. 303-323.
14. Kirsten, H 1993. Equivalence of mesh and fibre reinforced shotcrete at large deflections. Can. Geotech. J., Vol.30, 418-440. Ottawa, Canada National Research Council.
15. Tannant, D and Kaiser, PK 1997. Evaluation of shotcrete and mesh behaviour under large imposed deformations. International symposium on rock support - Applied solutions for underground structures. Lillehammer Norway. Broch, E Myrvang, A Stjern, G (ed). June 22-25. 782-792.
16. Kaiser, PK and Tannant, D 2001. The role of shotcrete in hard rock mines. Underground mining methods. Engineering fundamentals and international case studies. Hustrulid, W and Bullock, R (eds.). 579-592. Colorado Society for Mining, Metallurgy and Exploration.
17. Ding, Y and Kusterle, W 1999. Comparative study of steel fibre-reinforced concrete and steel mesh - reinforced concrete at early ages in test panels. Cement and concrete research. Vol.29, July. 1827-1834. Elsevier Science.
18. Dufour, J, Denis, J, O’Donnell, P and Ballou, M 2003. Determination of early age ductility of steel fibre reinforced shotcrete lining system at INCO’s Stobie mine. Shotcrete. Vol.5, No.2, Spring. American Shotcrete Association.
19. Cengiz, O and Turanli, L 2004. Comparative evaluation of steel mesh, steel fibre and high performance polypropylene fibre reinforced shotcrete in panel tests. Cement and concrete research. Vol.34, Jan. 1357-1364. Elsevier.
20. Pakalnis, V and Ames, D 1983. Load tests on mine screening. Underground support systems. Udd, J (ed). 79-83. Montreal:CIMM.
21. Van Sint Jan, M and Cavieres, P 2004. Large scale static laboratory test of different support systems. Ground support in mining and underground construction. Villaescusa and Potvin (eds.). 571-577. London Taylor and Francis.
22. Ortlepp, W and Stacey, T 1997. Testing of tunnel support: Dynamic load testing of rock support containment systems (e.g. wire mesh). GAP report 221. South Africa:SIMRAC.
23. Morton, E, Thompson, A, Villaescusa, E & Roth, A 2007. Testing and analysis of steel wire mesh for mining applications of rock surface support. 11th ISRM Congress on Rock Mechanics V2, 1061-1064, Lisbon, July, London:Taylor and Francis.
24. Player, J, Thompson, A and Villaescusa, E 2004. Dynamic testing of rock reinforcement using the momentum transfer concept. Ground Support in Mining and Underground Construction, 327-340, Leiden:Balkema.
25. Thompson, A., Player, J and Villaescusa E. 2004. Simulation and analysis of dynamically loaded reinforcement systems. Ground Support in Mining and Underground Construction, 341-358, Leiden:Balkema.
26. Morton, E, Thompson, A and Villaescusa, E 2008. Static testing of shotcrete and membranes for mining applications. 6th International Conference on Ground Support, Cape Town, 195-212, Johannesburg:SAIMM.